Real exchange rate and employment in China
30
Real exchange rate and manufacturing employment in China Ping HUA * CERDI, CNRS-Université d’Auvergne Abstract The impacts of the real exchange rate on employment and its channels are investigated. A real appreciation, 1) by decreasing the cost of imported inputs and increasing real wages expressed in tradable goods (technological channel), 2) by decreasing exports (export volume channel), 3) by exerting pressure on efficiency improvement (efficiency channel), exerts a negative effect on employment. Using the panel data of the 29 Chinese provinces for the period 1993- 2002, the econometric results confirm the negative effects of the real appreciation of the Renminbi on manufacturing employment. The three channels are statistically significant, the technological channel being the most important. Keywords: Real exchange rate, employment, China JEL classification: F16, J23 * CERDI-CNRS, Université d’Auvergne, 65, boulevard François Mitterrand, 63000 Clermont-Ferrand, France. Tel: 00 33 1 39 14 81 25; Fax: 00 33 4 73 43 12 28, Email: [email protected] . 1
Transcript of Real exchange rate and employment in China
Real exchange rate and manufacturing employment in China
Ping HUA*
CERDI, CNRS-Université d’Auvergne
Abstract
The impacts of the real exchange rate on employment and its channels are investigated. A real
appreciation, 1) by decreasing the cost of imported inputs and increasing real wages expressed
in tradable goods (technological channel), 2) by decreasing exports (export volume channel),
3) by exerting pressure on efficiency improvement (efficiency channel), exerts a negative
effect on employment. Using the panel data of the 29 Chinese provinces for the period 1993-
2002, the econometric results confirm the negative effects of the real appreciation of the
Renminbi on manufacturing employment. The three channels are statistically significant, the
technological channel being the most important.
Keywords: Real exchange rate, employment, China
JEL classification: F16, J23
*CERDI-CNRS, Université d’Auvergne, 65, boulevard François Mitterrand, 63000 Clermont-Ferrand,France. Tel: 00 33 1 39 14 81 25; Fax: 00 33 4 73 43 12 28, Email: [email protected].
1

1. Introduction
We know that China’s exchange rate policy matters. Currently, China is under
considerable pressure from industrialized countries in favor of re-evaluation and a more
flexible exchange rate regime of the Renminbi1. The stable parity around 8.27 yuans/US$
since 1998 is considered as a price advantage for Chinese products on the markets of
developed countries. China’s exchange rate policy is held to be responsible for the increasing
trade deficit in these countries towards China and for the unemployment in their
manufacturing sectors (Holtz-Eakin, 2003; Goldstein, 2004). The recent appreciation of the
Renminbi against the US dollar (2.1%) and the change in China’s exchange rate regime in
July 2005 have received a warm welcome in these countries.
However, one effect which was perhaps not expected is that, since the 1990s, China
has lost more manufacturing jobs than the United States and other major countries. From 1995
to 2002, China lost 15 million manufacturing jobs, compared with 2 million in the U.S. (Xu,
Spiegelman, McGuckin, Liu and Jiang, 2004). Moreover, it lost manufacturing jobs in those
industries where the U.S. and other major countries have also seen jobs disappear, such as
textiles. The U.S. lost 202,000 textile jobs between 1995 and 2002, but China lost far more
jobs in this sector (1.8 million). All told, 26 of China’s 38 major industries registered job
losses between 1995 and 2002.
Where it differs from developed countries is that China is gaining jobs in service
industries which created 42 million during the same period. This means that the share of
employment in the tertiary sector relative to total employment increased from 25% in 1995 to
29% in 2002, while that of manufacturing employment decreased from 14% to 11%.
However, these job creations in services are not sufficient to resolve the unemployment
problem which has become so serious that the development of labor-intensive manufacturing
industries has regained prominence on the Chinese government’s agenda, whereas they were
1 The name of the Chinese currency is the Renminbi and its unit is the yuan.
2

previously discouraged in favor of capital- and technology-intensive industries (China Daily,
2003). While the number of registered unemployed persons in urban areas increased from 3.5
million in 1991 to 8 million in 2003 (with an unemployment rate of 3.6% and 4.3%
respectively), the real unemployment situation is more serious. Using data from a unique
survey conducted in five large Chinese cities, Giles, Park and Zhang (2005) find that
unemployment rate was 14% for urban permanent residents in 2002. They estimated, for
China as whole, that the urban permanent unemployment rate increased from 6.1% to 11.1%
from January 1996 to September 2002.
This loss of Chinese manufacturing jobs coincided with a period of real appreciation
of the Renminbi2 which increased at an average rate of 4.1 % per year from 1993 to 2002. As
Chinese manufacturing goods are sensitive to the real exchange rate (Guillaumont Jeanneney
and Hua, 1996; Hua, 1996), manufacturing exports increased at a lower annual average rate
(13%) during this period of real appreciation than during the previous period from 1981 to
1993 (19%) when the real exchange rate of the Renminbi depreciated at an annual average
rate of 7.8%. These decreasing manufacturing exports resulting from the real appreciation
exert a negative effect on manufacturing employment. The level of employment in the
Chinese manufacturing sector decreased at an annual average rate of -2.3 %, from 93 million
in 1993 to 83 million in 2002. China lost 10 million manufacturing jobs during the period of
real appreciation. Inversely, during the previous period, the increased manufacturing activities
stimulated by the real depreciation of the Renminbi allowed firms to employ more workers.
The employment level in the Chinese manufacturing sector increased at an average of 3.9%
per year on average, from 53 million in 1978 to 93 million (figure 1). China created 40 million
manufacturing jobs during the period of real depreciation.
2 The real effective exchange rate is calculated as the nominal effective exchange rate multiplied by the ratio ofconsumer prices between China and its foreign partners. During the period of double exchange rates, a weightedofficial and swap exchange rate is calculated instead of the official rate (Guillaumont Jeanneney and Hua, 2001).An increase means an appreciation. For details of China’s exchange rate policy, see 3.2.1.
3

This negative relationship between real appreciation and manufacturing employment is
also evident at provincial levels. All the Chinese provinces experienced a real appreciation3
during the period 1993-2002, ranging from an annual average rate of 1.6 % in Yunnan to 5.9
% in Beijing municipality (figure 2). At the same time, most of the Chinese provinces (all but
five) saw the number of jobs in the manufacturing sector fall. The level of manufacturing
employment decreased at an annual average rate from –9.4% in Jilin province to –0.02% for
Shangdong province. Among the five provinces, the level of manufacturing employment in
Fujian, Guangdong and Zhejiang provinces increased at an annual average rate of 2.9 %, 1.4%
and 1% respectively, despite an annual average real appreciation of 4%, 3,2% and 4,4%
respectively. This indicates that the real exchange rate is one of the determinants of
manufacturing employment.
Despite this observed negative relationship between the real appreciation of the
Renminbi and manufacturing employment, there are no studies, to our knowledge, which
analyze the effect of real exchange rate on Chinese manufacturing employment. This is not
very surprising. In fact, the literature which analyzes the employment response to real
exchange rate movements for developing countries is just emerging. Using panel data for
Hungarian exporting firms from 1992-1996, Koren (2001) found significant industry-specific
impacts of the real exchange rate on employment. Frenkel (2004) also shows a significant
influence of the real exchange rate on employment in Argentina, Brazil, Chile and Mexico.
Filiztekin (2004) finds significant effects of exchange rate fluctuations on Turkish
manufacturing employment using panel data of manufacturing industries over the period
1981-1999.
Even for developed countries, the analysis of the effects of the real exchange rate on
employment only began in the late of 1980s following the strong fluctuation of the U.S.
3 The real effective exchange rate differs from one province to another because the provinces has a different swaprate in 1993 (Khor, 1993), as well as different rates of inflation and different foreign trading partners(Guillaumont Jeanneney and Hua, 2002).
4

dollar. Most of them focus on manufacturing employment, because almost every
industrialized country has experienced a declining share of manufacturing employment in the
last half century (Fisher, 2004). Using industry-level data from 1970 to 1986, Branson and
Love (1986, 1987) find a significant effect of the real exchange rate on U. S. manufacturing
employment. In contrast to their results, Campa and Goldberg (2001) find a very weak
relationship between employment and the exchange rate in U.S. manufacturing industries for
the period 1972-1995. Burgess and Knetter (1988) found that the elasticity of employment
relative to exchange rates differs considerably between industries and countries in the G-7
group. Revenga (1992) finds that the appreciation of the dollar caused a fall in the level of
employment, especially in industries facing stronger competition from imports. Dekle (1998)
shows a significant impact of the real exchange rate changes on Japanese manufacturing
employment. Using French firm-level data, Gourinchas (1999) finds that exchange rate
appreciations reduce employment growth.
The objective of this paper is to measure the impact of China’s real exchange rate on
its manufacturing employment. We firstly develop an extended labor demand function in
which the effects of the real exchange rate on employment are analyzed. These effects are then
estimated in section 3, using panel data for the 29 Chinese provinces over the period 1993-
2002. We estimate the level of manufacturing employment as a function of the real exchange
rate, of the variables representing the channels through which the real exchange rate affects
employment and of industrial production. The chosen period is limited here by the available
data on provincial manufacturing employment. We begin our provincial statistical analysis in
1993 and end it in 2002, because the China Statistical Yearbook published the manufacturing
employment for provinces for this period only.
2. Theoretical analysis of employment effect of the real exchange rate of the Renminbi4
4 The analysis in this paper is limited to employment in the tradables sector. However, the effect of the realexchange rate on employment is not restricted to the tradables sector, but also in the non-tradables sector. Non-tradable activities are not exposed to international competition, but relative prices also affect the relative use oflabor. If capital goods used in the non-tradables sector have a significant import component, the competition
5

The Chinese economy has gradually opened up to international trade and foreign direct
investments since 1979. China has now become the third most important exporting country in
the world and the second largest beneficiary of foreign direct investments. China’s exchange
rate policies have played an important role in this commercial and financial openness (Hua,
2002). It is therefore important to quantify to what extent the Chinese labor force is exposed
to these external market conditions. Our analysis begins with a base labor demand function
which is extended by taking into account the effects of the real exchange rate on labor
demand.
2.1. Labor demand function
Following Greenaway, Hine and Wright (1999), Milner and Wright (1998) and Fu and
Balasubramanyam (2005) who developed a model analyzing the employment effect of trade,
we begin our analysis by writing a Cobb-Douglas production function:
βαγititit NKAQ = (1)
where i and t denote provinces and time respectively. Q is real output, K is capital
stock, N is labor input used. α and β represent the factor share coefficients and γ allows for
efficiency growth in the use of labor in the production process.
Assuming that economic agents are profit-maximizing, the marginal product of labor
equals the wage (w) and the marginal product of capital equals its user cost (c). This gives:
1−= βαγ β ititit NKAw (2)
βαγα ititit NKAc 1−= (3)
Solving this system simultaneously to eliminate capital from the express for output
allows us to obtain the following equation:
βα
γ
βα
itit
ititit NcwNAQ
= * (4)
forces in local markets will drive firms to reduce their relative use of labor in the case of real appreciation, and toincrease it in a context of real depreciation. This will be analyzed in a future paper.
6
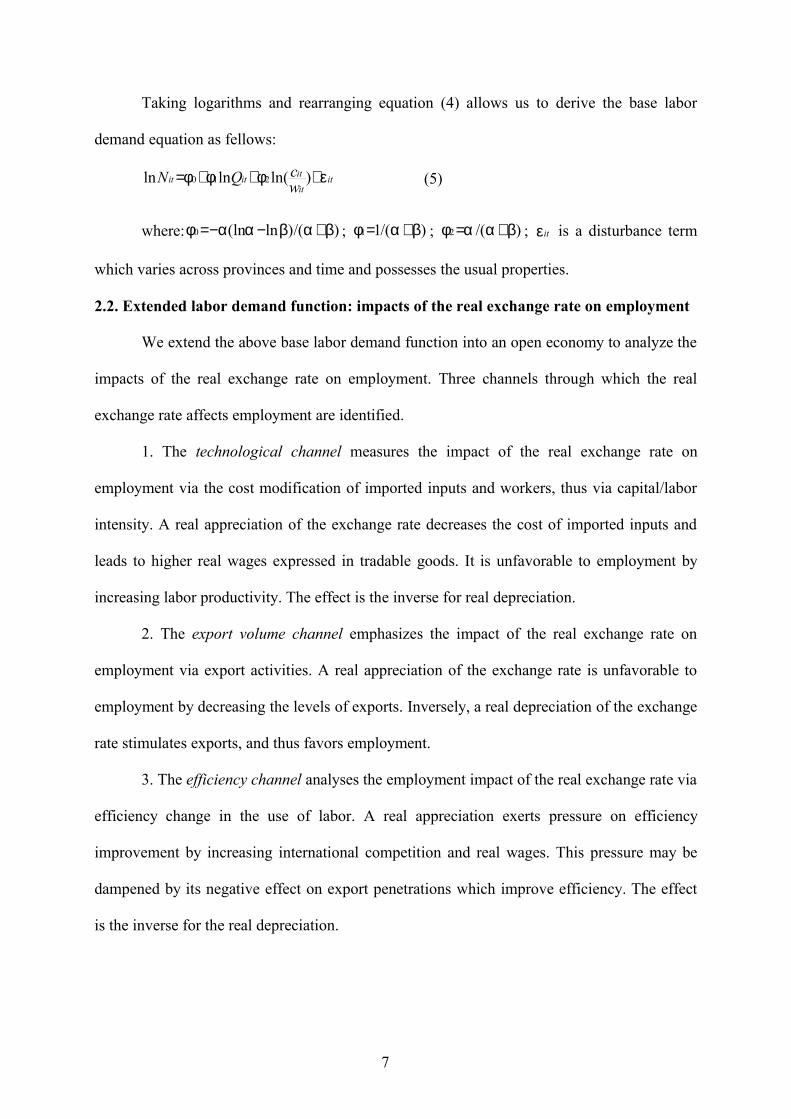
Taking logarithms and rearranging equation (4) allows us to derive the base labor
demand equation as fellows:
itit
ititit wcQN εφφφ +++= )ln(lnln 210 (5)
where: )/()ln(ln0 βαβααφ +−−= ; )/(11 βαφ += ; )/(2 βααφ += ; itε is a disturbance term
which varies across provinces and time and possesses the usual properties.
2.2. Extended labor demand function: impacts of the real exchange rate on employment
We extend the above base labor demand function into an open economy to analyze the
impacts of the real exchange rate on employment. Three channels through which the real
exchange rate affects employment are identified.
1. The technological channel measures the impact of the real exchange rate on
employment via the cost modification of imported inputs and workers, thus via capital/labor
intensity. A real appreciation of the exchange rate decreases the cost of imported inputs and
leads to higher real wages expressed in tradable goods. It is unfavorable to employment by
increasing labor productivity. The effect is the inverse for real depreciation.
2. The export volume channel emphasizes the impact of the real exchange rate on
employment via export activities. A real appreciation of the exchange rate is unfavorable to
employment by decreasing the levels of exports. Inversely, a real depreciation of the exchange
rate stimulates exports, and thus favors employment.
3. The efficiency channel analyses the employment impact of the real exchange rate via
efficiency change in the use of labor. A real appreciation exerts pressure on efficiency
improvement by increasing international competition and real wages. This pressure may be
dampened by its negative effect on export penetrations which improve efficiency. The effect
is the inverse for the real depreciation.
7

While the first and second channels have to a certain extent been explained in Frenkel5
(2004) and Koren6 (2001), the third channel remains unexplored.
2.2.1. The technological channel
From equation 5, we can see that the effect of the real exchange rate on employment
depends on the cost of imported inputs and workers as this determines the imported
inputs/labor relative price. It is thus an important factor of the capital/labor goods relative
price in the countries where imported components represent a significant part of capital goods.
A real appreciation decreases the cost of imported inputs which has a positive effect on
capital/labor intensity and thus a negative effect on employment. Inversely, a real depreciation
reduces capital/labor intensity by favoring labor-intensive activities.
On the other hand, the real exchange rate determines the value of wages measured in
international currency which is the most relevant labor cost in internationally tradable
activities. A real appreciation means an increase in the real labor remuneration expressed in
tradable goods, which again has a positive effect on capital/labor intensity and a negative
effect on employment. This effect depends on the substitution possibilities between capital
and labor, which are quite considerable in China (Zhang, 2004).
To measure the effect of capital/labor intensity on employment, the ratio between the
capital user cost and wages in the previous equation (5) is replaced by capital/labor intensity
as follows:
itititit KLQN εφφφ +++= lnlnln 210 (6)
where KL denotes capital intensity.
The Chinese reforms launched at the end of 1978 were implemented with a view to
achieving the objective of “industrialization of the Chinese economy.” Investments were
geared towards the adoption of modern, labor-saving technologies (Fu and Balasubramanyam,5 Frenkel (2004) distinguishes the macroeconomic channel, the development channel and the labor intensitychannel.6 Koren (2001) distinguishes two channels through which the exchange rate affects labor demand: one is throughthe positive effect of a real depreciation on exports, the other is through production costs.
8

2005). They were encouraged by China’s exchange rate policies. Since then, those imports
corresponding to the objective of industrialization were financed at the official rate during the
period of real depreciation from 1980 to 1993, while others were financed at the higher swap
rate. The real appreciation after the unification of exchange rates in 1994 reduced the cost of
imports. Imports of machinery and transport equipment rose from 5 billion US dollars in 1980
to 193 billion in 2003, representing 39% and 57% of the imports of manufactured goods
respectively.
As a result, increased investment in fixed assets did not stimulate many job
opportunities. During the period of real appreciation of the Chinese currency from 1993 to
2002, capital/labor intensity increased at an annual average rate of 12%, while manufacturing
employment decreased at an annual average rate of -3.8%. During the period of real
depreciation, capital/labor intensity increased at lower annual average rate (6.4%) and
manufacturing employment increased at an annual average rate of 2.9%. At the level of the
Chinese provinces, the annual average growth rate of capital intensity varied from 6.5% in
Heilongjiang to 16.7% in Tianjin for the period 1993-1992, while the corresponding annual
average growth rates of manufacturing employment varied from -7.7% to -6.8%.
2.2.2. The export volume channel
The traditional argument involves the diminishing competitiveness of domestic firms
on the world markets resulting from an appreciation of the real exchange rate, and inversely
the improved competitiveness resulting from a real depreciation. In fact, real appreciation
decreases exports due to an increase in the relative prices of non-tradable goods and
consequently weaker demand on domestic activities and lower levels of output and
employment. Inversely, a real depreciation of the real exchange rate favors the activities of
tradable goods that may not been profitable before. It induces a shift of production factors into
the export sector (Feder, 1983). This shift is particularly important for China’s labor-intensive
export sector of manufactured goods which corresponds to the comparative advantage of
9

China (Yue and Hua, 2002). The share of manufacturing goods in the total rose from 50% in
1980 to 92% in 2003.
In fact, since the beginning of China’s transition towards a market economy, exports
(in current dollars) have increased rapidly. However, the annual export growth fell slightly
during the 1990s. It dropped from an average of 15% during the period 1980-1993, when the
real exchange rate depreciated, to 12.8% during the period 1993-2003 when, on the contrary,
the real exchange rate appreciated. The decreasing export activities resulting from the real
appreciation exerts a pressure on manufacturing employment.
To capture the effects of export activities on job opportunities, we follow here Fu and
Balasubramanyam (2005) by allowing exports to affect employment. As real output (Q) is
equal to the sum of net real domestic output (DQ) and real exports (X), the above labor
demand equation (6) can be written as:
ititititit KLXDQN εφφφφ ++++= lnlnlnln 212110 (7)
The labor demand elasticities of exports and domestic production may differ because
of their different industry structures and the highly FDI-funded nature of the export sector.
The inflow of foreign direct investments has created job opportunities via export
activities. In China, as in other developing countries, foreign investments are concentrated in
the sector of tradable goods, mainly in industry. Most of them focus primarily on labor-
intensive, processing or assembly production activities such as clothing, textiles, footwear,
toys and processing and assembly of electronic consumer goods. The inflows of foreign direct
investments have reinforced the labor-intensive exports of manufactures to such an extent that
exports of these goods represent 60% of the total manufacturing exports in 2003. The
establishment of foreign firms or joint ventures has created new jobs within these firms. In
2003, foreign-funded firms employed almost 9 million people in China.
10

In order to capture the effect of FDI on employment, we extend the model of Fu and
Balasubramanyam (2005) to divide real exports into those from foreign-funded firms and
domestic real exports. We introduce the FDI stocks to capture its effects on exports of
foreign-funded firms. The previous equation (7) is written as:
itititititit KLFDISDXDQN εφφφφφ +++++= lnlnlnlnln 2122121110 (8)
where DX denotes exports by Chinese firms, FDIS denotes the real stocks of foreign
direct investments. The labor demand elasticities of domestic exports may be different from
those of exports from foreign-funded firms because domestic exports are more ordinary
products, while the exports realized by foreign-funded firms are processing and assembly
goods.
2.2.3. The efficiency channel
The real exchange rate influences efficiency in the use of labor in two ways. The first
is through openness (Greenaway, Hine and Wright, 1999; Fu and Balasubramanyam, 2005). In
fact, the export sector is generally considered more efficient than non-export sector; and its
efficiency in the use of labor is probably higher than in the heavy industry, the agricultural or
the service sectors.
This argument is based on a dualistic view of the economy according to which the
marginal productivity of labor is unequal in different sectors. This assumption seems to be
relevant here, as the Chinese workers cannot freely choose their place of work. The relative
advantage in terms of efficiency of labor use in the manufacturing sector in China may have
been progressively increased by the learning-by-doing effect and by economies of scale due to
market expansion. This advantage was probably still present several years after the beginning
of the transition of China towards a market economy, thus in the 1990’s. Moreover, the export
sector provides external economies to the whole manufacturing economy through improved
management and labor training. This export-induced efficiency improvement in the use of
11

labor reduces job opportunities. Using the data for the 28 manufacturing sectors in the 29
provinces, Sun and Doucouliagos (1999) effectively show that the openness of the Chinese
provinces towards the outside was a factor of efficiency for industry.
Second, the real exchange rate also has a direct influence on efficiency in the use of
labor. A real appreciation increases real labor remuneration expressed in tradable goods which
improve workers’ efficiency, particularly in a country where the wages of unskilled workers
are still very low. Leibenstein (1957) stressed that in developing countries too weak a
remuneration of labor might spoil workers’ health and their working capacity and showed that
the motivation of workers acts on efficiency, in what he called the “X-efficiency”
(Leibenstein, 1966). This hypothesis seems pertinent in the case of China where, in 2001,
46.7% of the population lived with less than two dollars per day and 16.6% with less a dollar7.
However, skilled workers are also concerned by the increase of remunerations induced by a
real appreciation of the exchange rate. We may suppose that the latter slows down the
emigration of this type of worker (Harris, 2001). In fact, China has suffered a significant brain
drain. We have observed the return of some Chinese workers since 1990s thanks to the
improved remuneration of skilled labor8. This growth in efficiency induced by a real
appreciation of the exchange rate allows firms to maintain the same production level with
lower employment, or to increase production without increasing employment. It therefore
exerts a negative effect on employment.
Furthermore, a real appreciation exerts a positive effect on the efficiency of industrial
firms because it heightens foreign competition (Caves and Krepps, 1993). In the case of real
appreciation, firms may be compelled to close their less efficient factories and improve their
efficiency (Krugman, 1989; Guillaumont and Guillaumont Jeanneney, 1992). Consequently,
real appreciation may raise labor productivity and reduce employment. 7 More precisely 2.15 and 1.08 dollars by measuring the expenditure using 1993 international prices, cf. WorldBank, World Development Indicators, 2004.8 An appreciation may increase the return to skilled labour in a Stolper-Samuelson effect if the tradables sector ishuman-capital intensive relative to the non-tradables sector (Harris, 2001, p.13)
12

More precisely, managers benefit from only a part of the profit induced by better
management or a stronger effort since a part of the profit goes to the company owners. In the
case of monopoly, managers do not choose the exertion that maximizes profit, for such
reasons as a preference for leisure over work involved in seeking out all profitable
opportunities and the power and satisfaction they gain from an excess number of employees
(Baldwin, 1995). As Marshall said, the best profit of a monopoly is a quiet life.
Then, in a situation of oligopoly, given some rent-threatening disturbance such as
increased international competition (due to new foreign competitors and, in the case of China,
due to competitors localized in the other provinces), the managers will choose a higher level
of effort by eliminating excess labor or possibly by introducing labor-saving techniques that
were not fully exploited prior to the competitive disturbance. They do so not only because this
behavior may increase the profit in the short run, but also because the reduction in costs
dissuades competitors from producing and thus avoids a fall in the price. Fewer firms mean
lower employment. Due to this strategic yield, there exists an additional benefit induced by
the effort which may push the management effort closer to its optimum. This improved
efficiency means that employment can be kept to a minimum. Guillaumont Jeanneney and
Hua (2005) provide evidence of this positive efficiency effect resulting from the real
appreciation of the Chinese currency.
To capture the effect of the real exchange rate on efficiency change, we extend the
model of Greenaway, Hine and Wright (1999) and Fu and Balasubramanyam (2005) by
allowing exports and the real exchange rate to affect efficiency in labor use. Therefore, we
may hypothesize that the parameter A varies over time and with the above factors, such that:
210 δδδ ERXYeA iTit = (9)
where T is the time trend, XY is export penetration indices measured by the domestic
export-output ratio and ER the real exchange rate of the Renminbi (an increase means an
13

appreciation). We expect for the negative signs of the estimated coefficients of export ratio
and the real exchange rate which represent their efficiency effects in the use of labor, such that
01>δ 02>δ .
2.2.4. Extended labor demand function
The previous labor demand equation (7) can therefore be written as follows, once the
export ratio and the real exchange rate are modeled in:
ititititititiit ERXYKLXDQTN εδδφφφδφ +++++++= lnlnlnlnlnln 212121100 (10)
If the exports ratio is broken down into a domestic and foreign export ratio, the
precedent equation (8) is written as:
ititititititititiit ERFXYDXYKLFDISDXDQTN εδδδφφφφδφ +++++++++= lnlnlnlnlnlnlnln 212112122211100 (11)
Equations 10 and 11 allow us to identify the three channels through which the real
exchange rate affects employment: the technological channel, the export volume channel and
the efficiency channel. A part of the detrimental employment effects of real appreciation
results from the decreasing cost of imported capital and the export volumes, as well as from
higher real wages. Moreover, a real appreciation encourages improved efficiency in labor use
in the face of heightened international competition. These detrimental effects may be
dampened by the negative effect of real appreciation on export penetration, source of
improved efficiency.
3. Econometric estimation of the model
Equations 7, 8, 10 and 11 presented in section 2 are estimated using panel data for the
twenty-nine Chinese provinces for the period 1993-2002. Equation 6 is basic labor demand
equation which is determined by industrial production and capital/labor intensity. It allows us
to capture the technological effect on employment. Then, in equation 7, industrial production
14

is broken down into domestic production and exports allowing us to capture the export
volume effect on employment. In equation 8, exports are further broken down into those from
domestic firms and those from foreign-funded firms in order to analyze their different effects
on employment. Finally, in equation 10, we introduced export penetration indices and the real
exchange rate to capture their efficiency effect on employment. The export ratio is then
broken down into the domestic export ratio and the foreign export ratio in equation 11.
3.1. Estimation method
As capital/labor intensity, real exports and export penetration are introduced into
equation 10, the coefficient of the real exchange rate measures its direct effect which is not
transmitted by intermediate variables, only by its direct impact on efficiency. The exchange
rate elasticity of labor demand is expected to be negative where an increase means a real
appreciation of the Chinese currency.
At the same time, the employment effect of the real exchange rate is also transmitted
through capital/labor intensity, real exports and export ratio. Thus, in order to estimate the
total effect of the real exchange rate on employment, we process our estimation in two steps.
First, capital intensity, real exports and export ratio respectively are regressed on real
exchange rate. We then calculated the residuals of these estimations which represent the
shares of these variables not explained by the real exchange rate. We replace these variables
by their residuals in equation 10. Thus, the coefficient of the real exchange rate now measures
its total effect on labor demand. The only consequence of this substitution of the residuals for
the variables themselves is the modification of the coefficient associated with the real
exchange rate which henceforth captures the total effects of the real exchange rate on
employment.
3.2. Data and source
All data come from the China Statistical Yearbook, unless otherwise indicated. All
indices are based in 1995, i.e. 1995=100.
15

3.2.1. China’s exchange rate policy and calculating the real effective exchange rate
indices
The exchange rate policy pursued by China since the beginning of the economic
liberalization in 1979 has been quite complex, as, from 1981 to 1993, it involved a double
exchange rate regime, whose nature has, moreover, changed over time. Since 1979, planned
imports have been supported by priority exchange allowances, while non-planned imports
have been financed either by foreign capital or through a system of foreign exchange
retention. The latter, which has been progressively expanded since 1981, allows firms to use a
part of the foreign exchange earnings derived from exports to finance their own imports or to
sell them at an administrated rate, which was higher than the commercial rate applied to
planned imports. Previously foreign exchange earnings had to be entirely presented to the
central government. In 1985, the commercial rate was replaced by an official rate previously
used for non-commercial operations, and in late 1986, the administrated rate became a swap
market rate.
Until their unification in January 1994, the differential between the two rates applied
to commercial operations fluctuated between 10% and 70%. Both rates depreciated
considerably. In contrast, the unified exchange rate, now subject to a controlled floating
regime, only slightly depreciated (compared to the dollar) in 1994, and then slightly
appreciated in 1995 and 1996. This rate has remained stable at around 8.28 Renminbi/US
dollar since 1997. In July 2005, the Renminbi was depreciated by 2.1% against the US dollar
and, moreover, the peg of the Renminbi changed from the US dollar to a basket of major
currencies. These various changes explain the highly contrasted evolution of China’s real
exchange rate over time.
The size of the variation in the real value of the Renminbi can be inferred from the
evolution of real exchange rate indices of the Renminbi relative to the currencies of China’s
main trading partners. Weights are modified each year (Paasche index) to allow for the rapid
16

change in the geographical structure of Chinese foreign trade over the period. The real
effective exchange rate indices of the Chinese provinces are calculated, on the base 1995
=100, as the nominal effective exchange rate indices multiplied by the ratios between the
consumer price index of each province and the average of consumer price indices of its fifteen
most important trading partners9 (defined according to the geographical origin of the imports
of each province in 199810). An increase in the real effective exchange rate corresponds to an
appreciation of the Renminbi. For 1993, an export-weighted average of the official and swap
rates of the Renminbi is used to calculate the real effective exchange rate indices, because the
swap rate is different for each province (Khor, 1993). Even though the Chinese provinces
have the same nominal exchange rate against dollar for the rest of the estimation period, their
real effective exchange rates have evolved differently due to disparities in their inflation rates
and the diversity of their foreign trade partners (see figure 2 in the introduction, Guillaumont
Jeanneney and Hua, 2001, 2002).
3.2.2. Other variables
Manufacturing employment (N) refers to the people who are engaged in social
working and receive remuneration or earn business income in the manufacturing sector. Real
industrial GDP (Q) is calculated as the nominal industrial GDP divided by its deflator. Real
exports (X) are equal to nominal exports divided by the GDP deflator. Exports are established
by the General Administration of Customs of the People’s Republic of China and classified
(according to international practice) by production origins. Real domestic industrial GDP
(DQ) is equal to real industrial production net of real exports. Real domestic exports are equal
to nominal domestic exports deflated by the GDP deflator. Real FDI is equal to nominal FDI
deflated by price indices of investment in fixed assets. The real stock of foreign direct
9 Unfortunately, we have to eliminate several countries form the ex-Soviet Union for which we do not have theexchange rate data. The consumer price indices of foreign partners are obtained from IMF, InternationalFinancial Statistics. The price indices of each province are taken from the China Statistical Yearbook. 10The import origins for the different provinces are not officially published. We bought the data for this year fromChina’s Customs General Administration.
17

investments (FDIS) is equal to the sum of all previous years’ foreign direct investments in
constant prices, net of depreciations (depreciation rate is assumed to be 5%). The export ratios
of each province are equal to exports relative to its GDP. Domestic and foreign export ratios
(DXY and FXY) are equal to exports realized respectively by domestic firms and foreign-
funded firms relative to GDP. Capital/labor intensity (KL) is the ratio of capital in constant
prices to employment.
There are no data on capital stock in China, as in many countries. The National
Bureau of Statistics of China published two series on investments: 1. gross fixed capital
formation for the period from 1952 to 1995 in Zhongguo Guorei ShengShang Zongzhi
Hesuan Lishi Ziliao; 2. investments in fixed assets in the China Statistical Yearbook. While
the price indices of gross fixed capital formation are available for the period from 1952 to
1995, the price indices of investments in fixed assets have only been available since 1992. We
first estimate the initial capital stock in 1993 using the inventory permanent method, such
that: t1tt IRKR)1(KR +α−= − , where KR, IR and α represent capital stock in real terms, investment
in constant prices and its annual depreciation rate respectively. By assuming an annual
depreciation rate α = 5% as in other studies (Wu, 1999; Lin and Liu, 2003; Zheng and Hu;
2004), the above formulation requires that we are aware of the investments during the
preceding twenty years and leads us to consider that in 1973 capital stock is equal to its
investment. The capital stock in 1993 (KR93) is therefore equal to the sum of the past twenty
years’ investments in constant prices, net of depreciations, such that:
93
19
0207393 95.0* IRIRKR
nnn +=∑
=−+
where KR73=IR73. The data on gross fixed capital formation
(GFCF) and its prices are used to estimate the capital stock in 1993.
Once the initial capital stock in 1993 has been estimated, and as the capital
depreciation data for each province are available, the capital stock estimation for the period
18
1994-2002 is calculated, such that: tttt DRIRKRKR −+= −1 , where DR represents real
depreciations calculated as nominal depreciations deflated by price indices of investment in
fixed assets. In this way, the depreciation rates of capital stock are different for each province
and for each year during the period of our estimation11.
3.3. Econometric tests
We proceed with the panel estimation with all the variables expressed in logarithms.
The Im-Pesaran-Shin stationnarity test of allows us to reject the unit root hypothesis for all
variables in our estimation.
The results of the Breusch and Pagan LM test and Hausman specific test indicate that
we cannot reject the hypothesis of one model with fixed effects (see table 3). The results of
the DWH test do not allow us to reject the endogeneity of the production, the capital intensity
export ratio, the ratio of foreign direct investments or the real exchange rate. The instruments
used in DWH test consist of the variables themselves, with a lag of one year, and the gaps
between the per capita product of each province and that of its respective foreign trading
partners and of China as a whole are used as the instruments of real exchange rate as in
Guillaumont Jeanneney and Hua (2003). The results of the Pagan/Hall heteroskedasticiy test,
which is the most pertinent in estimation with instrumental variables, allow us to prefer a
Generalized Moments Model with instrumental variables to a model with fixed effects (Baum,
Schaffer and Stillman, 2003). The results of the Arellano-Bond test for AR(2) reject the
existence of autocorrelation. Finally, the pertinence and the validity of the instruments are
tested using the Sargan over-identification test. The results do not allow us to reject the
hypothesis that the instruments are independent of error terms.
3.4. Econometric results
11 Wu (1999) and Lin and Liu (2003) assumed a fixed annual depreciation rate for each province and for eachyear. Zheng and Hu (2004) first calculated capital stock for China as whole and then assumed that the ratio ofeach province’s capital stock relative to the national level is the same as the ratio of each province’s GDP relativeto national GDP.
19

Column 1 in table 1 reports the estimated results for the base labor demand
specification equation 6; columns 2 and 3 the results of extended equations 7 and 8 including
export volume as a part of output; and columns 4, 5 and 6 the results of equations 10 and 11
where export penetration indices and the real exchange rate are added. All the estimated
coefficients have the expected signs and are statistically significant at the level of 1%. The
signs and significance of capital/labor intensity and output variables are consistent in the base
and extended specification equations. This indicates the robustness of the specification.
Evidently, industrial activities create manufacturing employment. A 10% domestic
industrial growth leads an increase of 7.4% in manufacturing employment (column 4). Capital
intensity does not favor manufacturing employment. A 10% increase in capital intensity leads
to 5% reduction in manufacturing employment.
The estimated coefficient of the export volume variable is positive and significant at a
1 % level. A 10% increase in export volume increases employment by 12.8% (column 4).
More precisely, the increase in domestic export volume creates more job opportunities than an
increase in foreign export volume, because their coefficients are estimated at 1.2 and 0.67
respectively. The estimated coefficient of the export-penetration variable is negative and
significant at the 1% level. This fact suggests that export orientation really does induce
increased efficiency in the use of labor when labor is drawn from the non-export sector to the
export sector, as in Greenaway, Hine and Wright (1999) and Guillaumont Jeanneney and Hua
(2005). This result is contrary to that found by Fu and Balasubramanyam (2005). More
precisely, the efficiency improvement in domestic export firms causes the loss of more job
opportunities than in foreign-funded firms, because their coefficients are estimated at -0.67
and -0.18 (columns 6) respectively.
Indeed, the real appreciation of the Renminbi improves the efficiency in the use of
labor and is thus unfavorable to manufacturing employment. The estimated manufacturing
employment elasticity of the real exchange rate is -0.69 (column 4). A 10% real appreciation
20

of the Renminbi leads directly a fall of 6.9% in manufacturing employment because of higher
international competition and higher wages.
The total impact of the real exchange rate on manufacturing employment obviously
depends on the impact of the real exchange rate on the variables identified as channels of
transmission. Table 2 presents the regressions of capital intensity, export volume and export
ratio variables on the real exchange rate. The estimated results show that these variables are
effectively the main transmission channels of the real exchange rate to manufacturing
employment. As expected, a real appreciation exerts a positive effect on capital intensity, due
to the relative price decrease of imported equipment goods, and a negative effect on the export
volume and export ratio. Thus, capital intensity and export penetration variables are factors of
lower levels of manufacturing employment, while export volumes exert a positive effect on
manufacturing employment. Furthermore, capital intensity and export volumes are more
important transmission channels than export penetration. The adjusted R² for capital intensity
and export volumes regressions are estimated at 0.59 and 0.61 respectively, while it is only
0.14 for export ratio.
The residuals of these regressions are then substituted for these channeling variables
for an employment estimation (column 4 in table 9). The results of the new estimation show
the total (or net) impact of the real exchange rate on manufacturing employment. The total
manufacturing employment elasticity of the real exchange rate increases from -0.69 (direct
effect, column 4) to –1.74 (total effect, column 9). Thus, the indirect effect of the real
exchange rate is -1.05 (-1.74+0.69). A 10% real appreciation of the real exchange rate via its
direct effect on efficiency and its indirect effect on capital/labor intensity, export volume and
export penetration variables leads to a fall of 17.4% in the manufacturing employment.
To measure the indirect effect of the real exchange rate via each channel variable, only
the residual of the regression of capital intensity on the real exchange rate is substituted for
21
capital intensity in column 7, while the residuals of capital intensity and export volume
regressions are substituted for capital intensity and export volume in the column 8.
The real appreciation exercises a positive effect on capital intensity (table 2), and the
latter exerts a negative effect on manufacturing employment (table 1). The introduction of the
residual of capital intensity increases the coefficients of the real effective exchange rate (more
negative). It allows the coefficient of the exchange rate to increase from -0.69 to -1.65
(column 7, table 1). In other words, the indirect effect of the real exchange rate via capital
intensity is -0.96 (-1.65+0.69).
The appreciation of the real effective exchange rate has a negative effect on export
volume which exercises a positive effect on employment, the introduction of the residual of
export volume regression should increase the coefficient relative to the real effective exchange
rate (making it more negative for manufacturing employment). As the indirect effect of the
real exchange rate via both capital intensity and export volume causes the coefficients to
increase to –2.33 (column 8, table 3), the indirect effect of the real exchange rate via export
volumes is -0.68 (-2.33 + 1.65).
In the same way, the appreciation of the real effective exchange rate has a negative
effect on the export ratio which exercises a negative effect on employment. The introduction
of the residual of the export volume regression should decrease the coefficient relative to the
real effective exchange rate (lead it less negative for manufacturing employment). As the
indirect effect via capital intensity, export volume and the export ratio causes the coefficients
to increase to –1.74 (column 9), the indirect effect of the real exchange rate via export ratio is
there 0.59 (-1.74 + 2.33). From this analysis, it can be seen that the indirect effect of the real
exchange rate via capital intensity is the most important.
4. Conclusion
This paper found that the real appreciation of the Renminbi exerts a statistically
significant negative effect on Chinese manufacturing employment. A real appreciation exerts
22

strong direct pressure on efficiency improvement in the use of labor. This negative effect of
real appreciation on manufacturing employment is reinforced via its positive effect on
capital/labor intensity and its negative effect on export volume, but is dampened via its
negative effect on export penetration.
Given that the annual average growth of the real effective exchange rate appreciated
from 1.6% to 5.9% in the different provinces for the period 1993-2002, manufacturing jobs
were reduced from 3 to 10 points of percentage for an average annual growth of
manufacturing jobs equal to -3.1%. As regards the possible impact of a new real appreciation
of the Renminbi on manufacturing employment, the estimated results of our analysis do not
favor a strong real appreciation, if the Chinese government considers its serious
unemployment problem as priority.
Furthermore, Hua (2005) shows that a real appreciation of the Renminbi may lead to a
redistribution within Asian exports towards developed countries to the detriment of Chinese
exports. A real appreciation of the Renminbi may increase manufacturing employment in
developed countries only if the currencies of other Asian countries appreciate simultaneously
in real terms.
Finally, the interpretation of the results obtained is limited only to the manufacturing
sector. However, the impact of the real exchange rate on total employment as a whole may be
different due to the effects of job reallocation between the sectors when confronted with a
changing exchange rate. The total employment responses to China’s exchange rates require
further study.
References
Baldwin R.E. (1995). The Effect of Trade and Foreign Direct Investment on Employment and
Relative Wages, NBER Working Paper Series, No. 5037.
23

Baum C. F., M. E. Schaffer and S. Stillman (2003). Instrumental Variables and GMM
Estimation and Testing. Working Paper 545, February, Department of Economics,
Boston College.
Branson W.H. and J. P. Love (1986). Dollar Appreciation and Manufacturing Employment
and Output. NBER Working Paper Series, No. 1972, July.
Branson W.H. and J. P. Love (1987). The Real Exchange Rate and Employment in U.S.
Manufacturing: State and Region Results. NBER Working Paper Series, No. 2435,
November.
Burgess S. and M. Knetter (1998). An International Comparison of Employment Adjustment
to Exchange Rate Fluctuations. Review of International Economics, 6, February, pp.
151-163.
Campa J.M. and L. S. Goldberg (2001). Employment versus Wage Adjustment and the U.S.
Dollar. Review of Economics and Statistics, 83(3), pp. 477-489.
Caves R. and M. Krepps (1993). Fat: The Displacement of Non-produciton Workers from the
U.S Manufacturing Industries. in Brooking Papers: Macroeconomics 2, Washington
D.C., The Brookings Institution.
China Daily (2003). Focus Shifts to Manufacturing to Create Jobs. China Daily HK edition,
august 23.
Dekle R. (1998). The Yen and Japanese Manufacturing Employment. Journal of International
Money and Finance, 17, pp. 785-801.
Feder G. (1983). On Exports and Economic Growth. Journal of Development Economics, 12,
1-2, pp. 59--73.
Filiztekin A. (2004). Exchange Rates and Employment in Turkish Manufacturing. Working
Paper, Sabanci University, August.
Fisher E. O’N. (2004). Why are We Losing Manufacturing Jobs? Federal Reserve Bank of
Cleveland Economy Commentary, July.
24

Frenkel R. (2004). Real Exchange Rate and Employment in Argentina, Brazil, Chile and
Mexico. paper prepared for the G24, Universidad de Buenos Aires.
Fu X.L. and V. N. Balasubramanyam (2005). Exports, Foreign Direct Investment and
Employment: The Case of China. The World Economy, 28, 4, pp. 607-625.
Giles J., Park A. and J. W. Zhang (2005). What is China’s True Unemployment Rate? China
Economic Review, forthcoming.
Greenaway D.R. and R. Hine and P. Wright (1999). An Empirical Assessment of the Impact
of Trade on Employment in the United Kingdom. European Journal of Political
Economy 15, pp. 485-500.
Goldstein M. (2004). Adjusting China’s Exchange Rate Policies. Revised version of the Paper
presented at the International Monetary Fund’s seminar on China’s Foreign Exchange
System, Dalina, China, May, pp. 26-27.
Gourinchas P.O. (1999). Exchange Rates do Matter: French Job Reallocation and Exchange
Rate Turbulence, 1984-1992. European Economic Review, 43(7): pp. 1279-1316.
Guillaumont P. and S. Guillaumont Jeanneney (1992). Exchange Rate Policies and the Social
Consequences of Adjustment in Africa, in eds. Chhibber A. and Fischer S. Economic
Reform in Sub-Saharan Africa, The World Bank, Washington D.C. pp. 12-24.
Guillaumont Jeanneney S. and P. Hua, (1996). ″Politique du Change et Développement des
Exportations Manufacturées en Chine,″ Revue Economique, N° 3, vol. 47, May, pp. 851-
860.
Guillaumont Jeanneney S. and P. Hua, (2001). ″How does Real Exchange Rate Influence
Income Inequality Between Urban and Rural Areas in China?” Journal of
Development Economics, 64, 2, pp.529-545.
Guillaumont Jeanneney S. and P. Hua, (2002). "The Balassa–Samuelson Effect and Inflation
in the Chinese Provinces", China Economic Review, 13, 2-3, pp.134-160.
25

Guillaumont Jeanneney S. and P. Hua, (2005). Real Exchange Rate and Productivity in
China? Nanjing Business Review, forthcoming.
Harris R.G. (2001), “Is there a Case for Exchange Rate Induced Productivity Changes”
mimeo, Department of Economics, Simon Fraser University, Canadian Institute for
Advanced Research.
Holtz-Eakin D. (2003), “The Chinese Exchange Rate and U.S. Manufacturing Employment,”
CBO Testimony before the Committee on Ways and Means U.S. House of
Representatives, October 30.
Hua P. (1996). Les Déterminants du Commerce Extérieur de la Chine. Revue d’Economie du
Développement, 1-2, pp. 207-232.
Hua P. (2002). Exports, Foreign direct investment and growth in China. Current Politics and
Economics of China, 3, 3, pp.447-462.
Hua P. (2005). Real exchange rate and China’s bilateral exports towards industrialized
countries. In Zhang Z.Q. (ed). Reform of Exchange Rate Regime: International
Experience and China’s Selection, Financial publishing Houses of China.
Khor, H. E. (1993). China’s Foreign Currency Swap Market. IMF Paper on Policy Analysis
and Assessment, PPAA/94/1. December.
Koren M. (2001). Employment Response to Real Exchange Rate Movements: Evidence from
Hungarian Exporting Firms. May, Harvard University, Department of Economics,
Littauer 200, Cambridge, MA 02138.
Krugman P. (1989). Surévaluation et Accélération des Productivités : un Modèle Spéculatif,
in Laussel D. and C. Montet (Eds.), Commerce international et concurrence parfaite,
Paris, Economica, 121--135.
Leibenstein H., (1957). Economic Backwardness and Economic Growth. New-York, Wiley.
Leibenstein H., (1966). Allocative Efficiency versus X-Efficiency. American Economic
Review, June, pp. 392--415.
26

Lin Y.F. and B.L. Liu, (2003). The Impact of the Strategy of Development of Chinese
Economy on Per Capita Capital Accumulation and Technical Progress, Evidence from
the Chinese Provinces. CCER Peking University, working paper, (in Chinese), no.
2003001.
Milner C. and Wright P. (1998). Modeling Labour Market Adjustment to Trade Liberalization
in an Industrializing Economy. Economic Journal, 108, pp. 509-28.
Revenga A. (1992). Exporting jobs? The Impact of Import Competition on Employment and
Wages in the U.S. Manufacturing. Quarterly Journal of Economics, 107 (1), pp. 255-
284.
Sun H., Hone P. and H. Doucouliagos (1999). Economic Openness and Technical Efficiency,
A Case Study of Chinese Manufacturing Industries. Economics of Transition, 7, 3, pp.
615-636.
Wang Y. and Yao Y.D. (2003). Source of China’s Economic Growth, 1952-99: Incorporating
Human Capital Accumulation. China Economic Review, 14, pp. 32-52.
Wu Y. R. (2003). Has Productivity Contributed to China's Growth? Pacific Economic Review,
8,1,15, January.
Xu J.Y., Spiegelman M., McGuckin R.H., Liu Y.D. and Jiang Y. (2004). China’s Experience
with Productivity and Jobs. June, Research Report, R-1352-04-RR, The Conference
Board.
Yue C. J. and Hua P. (2002). Does Comparative Advantage Explains Export Patterns in
China? China Economic Review, pp. 13, 276--296.
Zhang J. (2004). Capital Formation and Economic Growth since Reforms: some Findings and
Interpretations. Department of Economics, Fudan University, working Paper, 200433 (in
Chinese).
Zheng J.H. and Hu A.G. (2004). An Empirical Analysis of Provincial Productivity in China,
1979-2001. CCS Working Paper Series, Tsinghua University, 1, February 26.
27
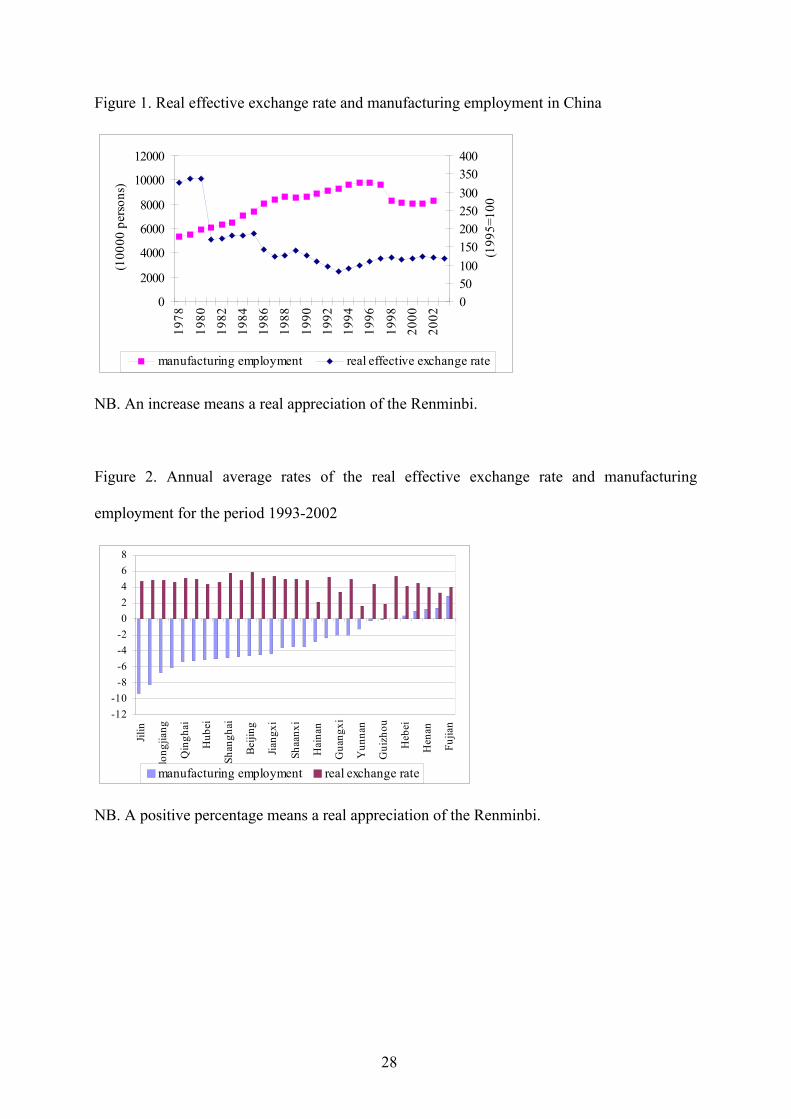
Figure 1. Real effective exchange rate and manufacturing employment in China
0
2000
4000
6000
8000
10000
12000
1978
1980
1982
1984
1986
1988
1990
1992
1994
1996
1998
2000
2002
(100
00 p
erso
ns)
050100150200250300350400
(199
5=10
0)
manufacturing employment real effective exchange rate
NB. An increase means a real appreciation of the Renminbi.
Figure 2. Annual average rates of the real effective exchange rate and manufacturing
employment for the period 1993-2002
-12-10
-8-6-4-202468
Jilin
Hei
long
jiang
Qin
ghai
Hub
ei
Shan
ghai
Beiji
ng
Jiang
xi
Shaa
nxi
Hai
nan
Gua
ngxi
Yun
nan
Gui
zhou
Heb
ei
Hen
an
Fujia
n
manufacturing employment real exchange rate
NB. A positive percentage means a real appreciation of the Renminbi.
28
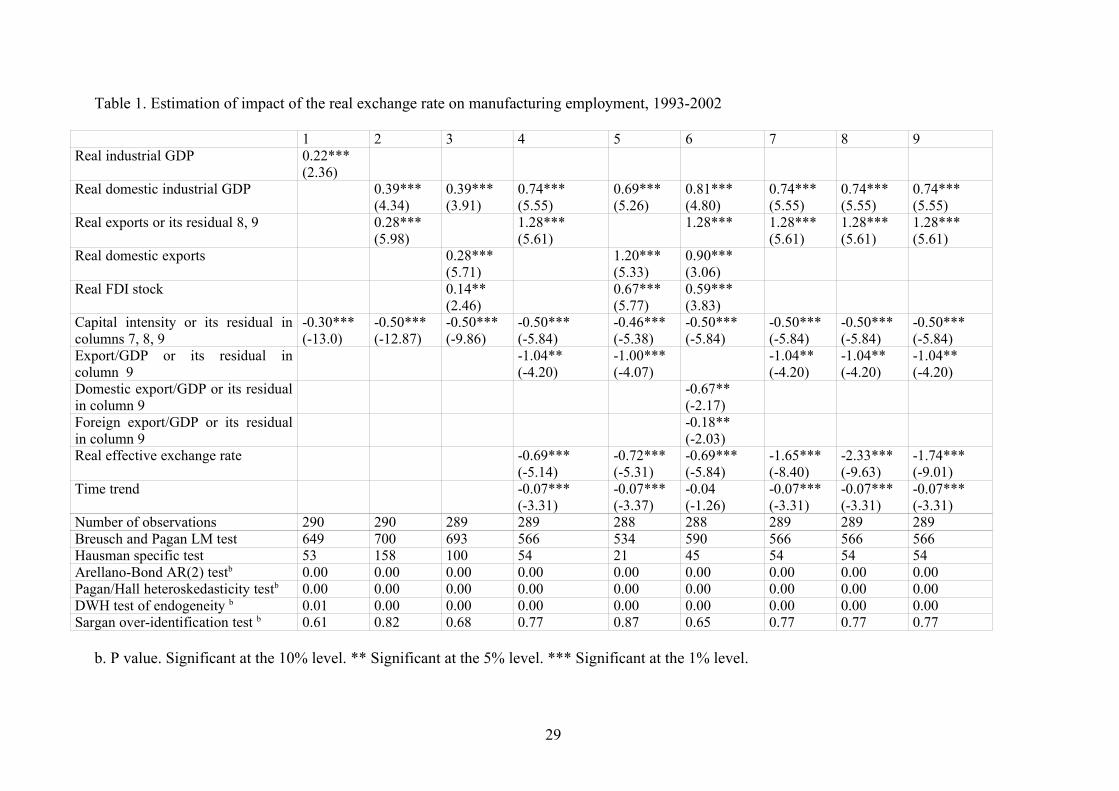
Table 1. Estimation of impact of the real exchange rate on manufacturing employment, 1993-2002
1 2 3 4 5 6 7 8 9Real industrial GDP 0.22***
(2.36)Real domestic industrial GDP 0.39***
(4.34)0.39***(3.91)
0.74***(5.55)
0.69***(5.26)
0.81***(4.80)
0.74***(5.55)
0.74***(5.55)
0.74***(5.55)
Real exports or its residual 8, 9 0.28***(5.98)
1.28***(5.61)
1.28*** 1.28***(5.61)
1.28***(5.61)
1.28***(5.61)
Real domestic exports 0.28***(5.71)
1.20***(5.33)
0.90***(3.06)
Real FDI stock 0.14**(2.46)
0.67***(5.77)
0.59***(3.83)
Capital intensity or its residual incolumns 7, 8, 9
-0.30***(-13.0)
-0.50***(-12.87)
-0.50***(-9.86)
-0.50***(-5.84)
-0.46***(-5.38)
-0.50***(-5.84)
-0.50***(-5.84)
-0.50***(-5.84)
-0.50***(-5.84)
Export/GDP or its residual incolumn 9
-1.04**(-4.20)
-1.00***(-4.07)
-1.04**(-4.20)
-1.04**(-4.20)
-1.04**(-4.20)
Domestic export/GDP or its residualin column 9
-0.67**(-2.17)
Foreign export/GDP or its residualin column 9
-0.18**(-2.03)
Real effective exchange rate -0.69***(-5.14)
-0.72***(-5.31)
-0.69***(-5.84)
-1.65***(-8.40)
-2.33***(-9.63)
-1.74***(-9.01)
Time trend -0.07***(-3.31)
-0.07***(-3.37)
-0.04(-1.26)
-0.07***(-3.31)
-0.07***(-3.31)
-0.07***(-3.31)
Number of observations 290 290 289 289 288 288 289 289 289Breusch and Pagan LM test 649 700 693 566 534 590 566 566 566Hausman specific test 53 158 100 54 21 45 54 54 54Arellano-Bond AR(2) testb 0.00 0.00 0.00 0.00 0.00 0.00 0.00 0.00 0.00Pagan/Hall heteroskedasticity testb 0.00 0.00 0.00 0.00 0.00 0.00 0.00 0.00 0.00DWH test of endogeneity b 0.01 0.00 0.00 0.00 0.00 0.00 0.00 0.00 0.00Sargan over-identification test b 0.61 0.82 0.68 0.77 0.87 0.65 0.77 0.77 0.77
b. P value. Significant at the 10% level. ** Significant at the 5% level. *** Significant at the 1% level.
29

Table 2: Estimation of the transmission channel variables of the real exchange rate to
manufacturing employment, 1993-2002
Capital intensity Exports volume Export/GDP ratio9 10 11
Real effectiveexchange rate
1.67***(21.7)
-0.34**(-2.26)
-0.56***(-3.87)
Constant 17.8***(50.3)
12.2***(16.4)
-0.33(-0.46)
Time trend 0.09***(10.8)
-0.001(-0.18)
Number ofobservations
290 290 290
Adjusted R² 0.64 0.51 0.17
* Significant at the 10% level. ** Significant at the 5% level. *** Significant at the 1% level.
30