REAL ESTATE ASSESSMENTS OFFICE FINANCE DEPARTMENT PRINCE WILLIAM COUNTY ... · Christopher E....
68
REAL ESTATE ASSESSMENTS OFFICE FINANCE DEPARTMENT PRINCE WILLIAM COUNTY, VIRGINIA
Transcript of REAL ESTATE ASSESSMENTS OFFICE FINANCE DEPARTMENT PRINCE WILLIAM COUNTY ... · Christopher E....

REAL ES TATE AS SE SSME NTS OFFICE FINANCE DEPART MENT
PRINCE WILLIAM COUNTY, VIRGINIA

Real Estate Assessments Office Finance Department
Prince William County, Virginia
Board of County Supervisors
Sean T. Connaughton Chairman At-Large Corey A. Stewart Occoquan District Martin E. Nohe Coles District Wally E. Covington Brentsville District
Maureen S. Caddigan Vice Chairman Dumfries District John D. Jenkins Neabsco District John T. Stirrup, Jr. Gainesville District Hilda M. Barg Woodbridge District
COUNTY EXECUTIVE
Craig S. Gerhart

This page intentionally left blank

Estate Assessments Office 2005 Annual Report
Management Analyst IIVictor Molina
Accounting Assistant IVacant
Accounting Assistant IAnnette Rivera
Real Estate Assessments Office Organizational Chart as of July 1, 2005
Administrative Support Assistant III
Diane Honeycutt
Accounting Assistant IBrenda Wilson
Appraiser IICommercial Appraiser
Vacant
Accounting Assistant IRosie Graus
Appraiser IIsabel Salumbides-Calangi
Appraiser TraineeEric Williams
Appraiser TraineeMaryleen Dudley
Appraiser IISupervisor
Charlie Tolbert
Appraiser IMildred Norris
Real Estate Assessments Division ChiefAllison Lindner
Assistant Director of FinanceSteve Ferlotti
Director of FinanceChristopher E. Martino, CPA
Appraiser I (part-time)Susan Spicer
Assessments CoordinatorKerem Oner, CAE
Appraiser TraineeSimar Singh
Appraiser TraineeJohn Oakes
Appraiser IJessika Kontur
Appraiser IISupervisor
Pam Stepanick
Appraiser ILeslie Burke
Appraiser I (part-time)Bridget Affeldt
Appraiser IISupervisor
John E. Malone, RES
Appraiser TraineeLaPointe Crismond
Appraiser ITammy Palowitch
Title ResearcherClaire Lapham
Appraiser IMick Majdi
Appraiser TraineeDavid Turner
Appraiser TraineeLaura Fallon
Appraiser TraineePam Murray
Title ResearcherBarbara Hill
Appraiser IMichelle Turner
Appraiser IISupervisorKen Baxter
Title ResearcherTheresa Harris
Financial Systems Analyst I(OIT)
Valerie Fawcett
Real
GIS AnalystDebra Watson-Grady

This page intentionally left blank

Real Estate Assessments Office 2005 Annual Report
TABLE OF CONTENTS
INTRODUCTION ................................................................................................................. 3 MAINTAINING PROPERTY RECORDS......................................................................... 4 ASSESSING REAL PROPERTY ........................................................................................ 6
REASSESSING EXISTING PROPERTIES.................................................................................... 6 ASSESSMENT PERFORMANCE ............................................................................................... 9 ASSESSING NEW CONSTRUCTION ....................................................................................... 10 ASSESSMENT NOTIFICATION .............................................................................................. 12
REAL ESTATE TAX RELIEF PROGRAMS.................................................................. 14
TAX RELIEF FOR THE ELDERLY AND DISABLED ................................................................. 14 TAX RELIEF BASED ON USE VALUE ASSESSMENT.............................................................. 17 PARTIAL TAX EXEMPTION FOR REHABILITATED REAL ESTATE ......................................... 18
PROVIDING CUSTOMER SERVICE............................................................................. 20
WALK-IN CUSTOMERS........................................................................................................ 20 TELEPHONE REQUESTS....................................................................................................... 20 INTERNET ACCESS.............................................................................................................. 21
REAL ESTATE VALUES .................................................................................................. 22
LANDBOOK VALUES: GROWTH AND APPRECIATION .......................................................... 23 RESIDENTIAL...................................................................................................................... 24 APARTMENTS ..................................................................................................................... 27 COMMERCIAL AND INDUSTRIAL ......................................................................................... 27 STATE-VALUED PUBLIC SERVICE PROPERTIES................................................................... 28 UNDEVELOPED LAND......................................................................................................... 29 SUPPLEMENTAL ASSESSMENTS .......................................................................................... 30 TAX-EXEMPT PROPERTIES ................................................................................................. 30
STATISTICAL APPENDIX.............................................................................................A-1
TABLE 1: HISTORY OF PROPERTY RECORD MAINTENANCE ACTIVITY..............................A-3 TABLE 2: HISTORY OF TAX RELIEF FOR THE ELDERLY AND DISABLED ............................A-3 TABLE 3: HISTORY OF APPEALS ACTIVITY.......................................................................A-3 TABLE 4: HISTORY OF ADJUSTMENTS ..............................................................................A-3 TABLE 5: USE VALUE ASSESSMENT SUMMARY ...............................................................A-4 TABLE 6: AVERAGE ASSESSED VALUE HISTORY OF RESIDENTIAL PROPERTY .................A-5 TABLE 7: ASSESSED VALUES AND ESTIMATED MARKET VALUES....................................A-6 TABLE 7: ASSESSED VALUES AND ESTIMATED MARKET VALUES (CONT.).......................A-7 TABLE 8: HISTORY OF THE REAL ESTATE TAX BASE .......................................................A-8 TABLE 9: PUBLIC SERVICE AND COMMERCIAL/INDUSTRIAL ASSESSMENTS .....................A-9
Page 1

TABLE 10: ASSESSMENT PERFORMANCE STATISTICS .....................................................A-10 TABLE 11A: GROWTH AND APPRECIATION ....................................................................A-11 TABLE 11B: HISTORY OF APPRECIATION RATES ............................................................A-12 TABLE 11C: HISTORY OF GROWTH RATES.....................................................................A-12 TABLE 11D: HISTORY OF RESIDENTIAL APPRECIATION AND INFLATION........................A-13 TABLE 12: TOP FIFTY REAL ESTATE TAXPAYERS –FY2005 ..........................................A-13 TABLE 13: TAX RATES ...................................................................................................A-14
Addenda.............................................................................................................................. B-1
ADDENDUM A: SAMPLE NOTICE OF REASSESSMENT........................................................ B-3 ADDENDUM B: TAX SAVINGS FOR REHABILITATED PROPERTIES ..................................... B-5 ADDENDUM C: TAX RELIEF PROGRAMS FOR ELDERLY AND DISABLED PERSONS ............ B-7 ADDENDUM D: SAMPLE TAX BILL ................................................................................... B-9
Page 2
Real Estate Assessments Office 2005 Annual Report
Introduction
The Finance Department’s Real Estate Assessments Office is responsible for annually assessing all real property in Prince William County, maintaining property ownership records, and administering the County’s tax relief programs. In order to perform these duties, the Real Estate Assessments Office gathers and maintains data on every property in the County. The Real Estate Assessments Office also collects and analyzes data pertaining to real estate market indicators such as sales and property income and expense data. This information enables staff to assess property at fair market value as required by law.
The Finance Department
provides quality customer service through financial
and fiduciary management
Real estate assessments and taxes are based on the “tax year”, which
coincides with the calendar year. Assessments for 2005 were made effective on January 1, 2005, and were entered into the County’s 2005 landbook. Tax payments are divided into two equal installments. Payment for the first installment is due July 15 and payment for the second installment is due December 5. The County accounts for the revenues from this tax during the fiscal year in which the due dates fall. That is, real estate assessments and taxes for tax year 2005 are recognized as fiscal year 2006 County revenues.
Tax year 2004 (fiscal year 2005) information is presented in this report. Tax year 2005 (fiscal year 2006) information is also presented although supplemental assessments and rollback taxes for tax year 2005 are not yet available and are estimated. All references regarding years are tax (calendar) years rather than fiscal years unless otherwise noted.
The Real Estate Assessments Office performs the following key functions:
• Maintains property records • Reassesses existing properties • Assesses new construction • Facilitates assessment notification and appeal • Administers real estate tax relief programs • Provides quality customer service
Page 3
Real Estate Assessments Office 2005 Annual Report
Maintaining Property Records The Real Estate Assessments
Office maintains property records for purposes of assessment and
taxation
The Real Estate Assessments Office is responsible for determining
taxable ownership of property. This requires interpreting all legal documents relating to real estate. The documents (deeds, plats, wills, court orders, etc.) are recorded by the Clerk of Circuit Court in Manassas, Virginia. The recorded documents contain information regarding transfers, consolidations, subdivisions, and other legal changes.
By reading each document, a determination is made whether it affects the taxable ownership, size, or configuration of the property. If it does, the necessary changes are made to property records. In some cases, information contained in the deed is conflicting. The Real Estate Assessments Office may send correspondence to settlement attorneys and title companies documenting a title issue with a deed and requesting clarification. This process ensures up-to-date records with accurate legal descriptions.
There are four types of documents and transactions handled by the Real Estate Assessments Office:
• Wills – instruments recorded upon the death of an individual. They may or may not transfer real estate.
• New Lots – parcels that are created from a subdivision or consolidation of existing land.
• Deeds – legal instruments recorded that convey an estate or interest in real property. One deed may transfer no parcels or several hundred parcels.
• Transfers – legal changes in ownership of property.
Page 4

Real Estate Assessments Office 2005 Annual Report
Property Record Maintenance Activity
-
5,000
10,000
15,000
20,000
25,000
30,000
Num
ber
of O
ccur
renc
es
Wills and Deeds 16,680 20,725 21,323 23,758 24,368
FY 2001 FY 2002 FY 2003 FY 2004 FY 2005
Property record maintenance activity
has increased by 7,688 transactions
or 46% from FY2001 to FY2005
Types of Property Maintenance Activity
0
5,000
10,000
15,000
20,000
25,000
30,000
35,000
Wills 580 408 404 329 829
New Lots 3,867 4,779 3,701 4,140 4,762
Deeds 16,100 20,317 20,919 23,429 23,539
Transfers 16,652 20,239 21,854 23,822 25,584
FY 2001 FY 2002 FY 2003 FY 2004 FY 2005
Sales transactions are used as the
basis for valuing most residential properties in the
County
Property maintenance activity increased 65% in the five year period
from FY01 to FY05. Types of property record maintenance activity for the most recent three years are shown above. A more detailed history of property record maintenance activity is shown in the Statistical Appendix, Table 1, page A-3.
Page 5

Real Estate Assessments Office 2005 Annual Report
Assessing Real Property Prince William
County has performed annual
assessments of property since
l979
The Real Estate Assessments Office provides services to all taxpayers in the form of accurate, equitable assessments. In this manner, the Real Estate Assessments Office supports the Finance Department’s mission in providing quality customer service through financial and fiduciary management.
Reassessing Existing Properties The Code of Virginia, § 58.1-3252, requires counties to reassess real
estate at least every four years, and § 58.1-3253 authorizes annual and biennial assessments. Prince William County has performed annual assessments of property since l979, when technology made this feasible. Tax policy organizations recommend annual reassessment because assessments at longer intervals may result in large disparities and inequities between properties, especially during periods of rapid changes in the real estate market.
Maintaining equity is a primary
goal when assessing real
estate for taxation Regular reassessment helps maintain equity between properties as
market conditions change. The standard for all assessments in Virginia is established in the Virginia Constitution, Article X, Section 2, which requires assessment at “fair market value”. The only exception to this requirement is for certain agricultural, forestal, horticultural, and open space property in the Use Value Assessment Program (see page 17). The Code of Virginia §58.1-3253 further provides that annual assessments are to be made as of January 1 of each year. To perform equitable assessments, the Real Estate Assessments Office must gather accurate and consistent property information and perform proper analyses of sales and other market indicators.
Data Collection The Real Estate Assessments Office collects information on property descriptions, sales, income and expenses, and other real estate market data. To ensure property descriptions are accurate, County appraisers periodically inspect properties and verify current data. Property characteristics are relatively stable, and physical inspections of each property are not necessary every year. However, physical characteristics such as condition do change
Page 6
Real Estate Assessments Office 2005 Annual Report
slowly over time, and properties are reviewed approximately every five years to ensure assessments are based on accurate information.
Sales and income data are the primary data sources for establishing the value of real estate. Sales transactions are used as the basis for valuing most residential properties in the County. Because inaccurate sales information can lead to incorrect conclusions about property values, sales must be reviewed to verify the physical and financial circumstances that led to a particular sale price. Surveys are mailed monthly to verify information on the sale that was obtained from documents at the courthouse. Further review may include a physical inspection of the property to confirm its condition. The review may also include contact with the buyer, seller, or other parties involved in the transaction to verify the presence and amount of unusual financial terms that may have affected the sale price. To aid in valuing commercial and industrial property using the income approach, the Real Estate Assessments Office collects income and expense information from commercial property owners.
Sales and income data are the primary data
sources for establishing the
value of real estate
Analysis of Data The Real Estate Assessments Office analyzes the information about
market activity (sales, income, etc.) and values property based on the real estate market. Properties are reassessed each year. Therefore, each year the most recent sales, income information, and other market factors are studied and values are re-assessed according to the current real estate market.
Several standard appraisal
methods are used to value
property
Application of Results Appraisers use several approaches to value property for assessment
purposes. These approaches are as follows:
Cost Approach: In the cost approach, the improvement value is determined by first estimating the cost to replace the building with a new one, and then subtracting depreciation, which makes the existing building worth less than the cost of a new one. Depreciation can be caused by physical deterioration, functional obsolescence (poor functional design), or by economic obsolescence (effects of factors outside the property such as high traffic). The improvement value is added to the land value to produce total value by the cost approach.
Cost Approach
Page 7
Real Estate Assessments Office 2005 Annual Report
Sales Comparison Approach: The sales comparison approach is based on the principle of substitution by comparing a property with similar properties that have sold. In this approach, several similar properties that have recently sold are selected. Each of the sale prices is adjusted for differences between the property that sold and the subject property. This gives an indication of what each of the buyers would likely have paid for their property had it been identical to the subject property.
Sales Comparison Approach
Income Capitalization Approach: The income capitalization approach produces a value indication by converting an income stream into property value. In this approach, the effective gross income of a property is estimated by considering market rents, vacancy rates, and collection losses. Estimated normal operating expenses are deducted to generate an estimate of net operating income. This income is capitalized into an estimate of value by application of an appropriate market capitalization rate. Capitalization rates can be derived from market data by dividing the income stream by sale price. There are also reliable published sources for national, regional, and local capitalization rates within each major commercial sector.
Income Capitalization
Approach
Page 8

Real Estate Assessments Office 2005 Annual Report
Assessment Performance The tool used to measure the accuracy of assessments is the
assessment-to-sale ratio, which is calculated by dividing the assessment by the selling price. For example, a single family home assessed for $300,000 that sells for $315,000 has an assessment-to-sale ratio of 95.2%. This ratio is calculated for all valid sales in the County and is used to monitor the level and equity of assessments. The median assessment-to-sale ratio is called the level of assessment. The median (midpoint of arrayed ratios) is used to reduce the effect of outlying ratios.
The overall assessment level has been above 95% for the past
five years
For performance measurement, the Real Estate Assessments Office calculates the internal measure of assessment level based on sales that occurred prior to the assessment date of January 1. The average error is the average percentage each sale deviates from the median ratio or level of assessment. A small average error indicates individual ratios are relatively close to the median ratio. A large average error indicates ratios vary greatly. The following table shows assessment level and error for the most recent five years:
Calendar Year 2001 2002 2003 2004 2005Overall Assessment Level 96.7% 96.9% 96.5% 96.7% 96.5%Overall Average Accuracy, measured as average error 6.7% 6.6% 6.6% 6.2% 7.9%
The median level of assessment is the performance statistic published annually in the Assessment/Sales Ratio Study by the Virginia Department of Taxation. The median level of assessment is the most accurate indicator of a locality’s existing assessment/sales ratio. The State calculates the 2004 level of assessment by comparing January 1, 2004 assessed values to sales occurring after January 1, 2004 throughout calendar year 2004. While parcels are assessed as of January 1, The Virginia Department of Taxation study does not adjust for inflation between the start of the year and the actual sales date of parcels. As a result, any appreciation in real estate values during the year acts to understate the assessment to sales ratio. The greater the rate of appreciation, the greater the understatement of the ratio. Equity of assessments is also published in the Assessment/Sales Ratio Study and indicates the uniformity in real property assessment by measuring average error. This information is reported in Table 10 of the Appendix.
Page 9
Real Estate Assessments Office 2005 Annual Report
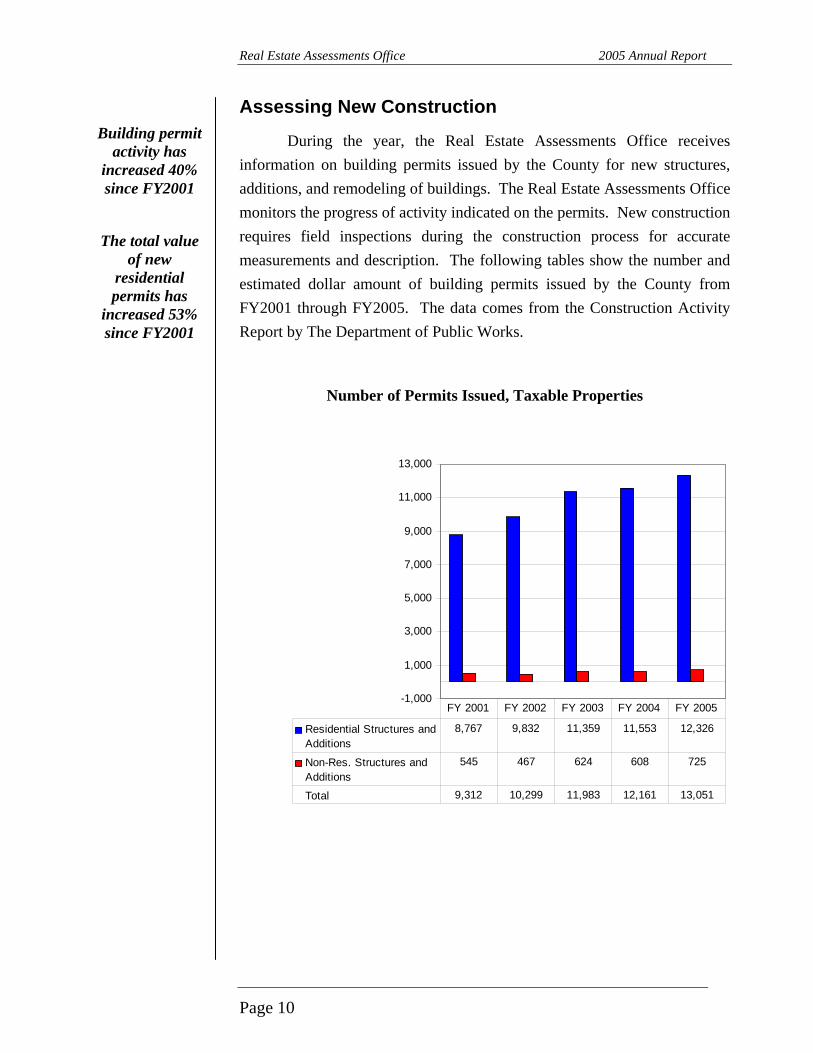
Assessing New Construction Building permit
activity has increased 40% since FY2001
During the year, the Real Estate Assessments Office receives information on building permits issued by the County for new structures, additions, and remodeling of buildings. The Real Estate Assessments Office monitors the progress of activity indicated on the permits. New construction requires field inspections during the construction process for accurate measurements and description. The following tables show the number and estimated dollar amount of building permits issued by the County from FY2001 through FY2005. The data comes from the Construction Activity Report by The Department of Public Works.
The total value of new
residential permits has
increased 53% since FY2001
Number of Permits Issued, Taxable Properties
-1,000
1,000
3,000
5,000
7,000
9,000
11,000
13,000
Residential Structures andAdditions
8,767 9,832 11,359 11,553 12,326
Non-Res. Structures andAdditions
545 467 624 608 725
Total 9,312 10,299 11,983 12,161 13,051
FY 2001 FY 2002 FY 2003 FY 2004 FY 2005
Page 10

Real Estate Assessments Office 2005 Annual Report
Estimated Dollar Amount of Permits Issued for Structures and Additions, Taxable Properties
$
$100
$200
$300
$400
$500
$600
$700
$800
in millions
New Residential $469,328,572 $501,982,735 $723,285,866 $654,194,276 718,148,110
Residential Additions, etc. 33,698,391 46,996,277 58,463,484 69,757,708 89,154,877
New Non-Residential 134,661,716 91,090,568 97,642,905 110,116,427 113,650,930
Non-Residential Additions, etc. 34,394,686 40,882,357 38,115,089 29,417,291 34,553,231
FY 2001 FY 2002 FY 2003 FY 2004 FY 2005
Page 11
Real Estate Assessments Office 2005 Annual Report
Assessment Notification The Code of Virginia § 58.1-3330 requires the County to notify
property owners whenever reassessment results in an increase in assessed value. The County has chosen to notify all property owners of reassessment, even if there was a reduction or no change in the value. This notification takes place in March of each year and advises the taxpayer of the previous year’s assessment and the current assessment. (See Addendum A, page B-3 for a sample Notice of Reassessment.)
The Real Estate Assessments
Office mailed out over 115,000 reassessment
notices in 2004
Appeal Procedures Taxpayers who are uncertain about the accuracy of their assessment
on the basis of value or equity with other properties can request a review of their property value. The County appraiser considers market information relative to the property and information provided by the taxpayer. If this information shows the assessed value should be changed, the appraiser makes the necessary adjustment. If the evidence does not support a change, the appraiser explains the reasons for sustaining the assessment.
Taxpayers may also appeal to the Board of Equalization (BOE) or Circuit Court. Taxpayers are not required to appeal to the Real Estate Assessments Office before appealing to the BOE or Circuit Court. The BOE is comprised of eight County taxpayers and is established by the Board of County Supervisors to render an independent third party opinion in cases of disagreement between the taxpayer and the assessing official. Although the BOE is a quasi-judicial board, there is no application fee and an attorney is not required.
Appeal Adjustments As a result of an appeal to the Real Estate Assessments Office, the
BOE, or Circuit Court, an assessment may be revised. Developers may appeal many residential lots at the same time and each lot appealed is counted separately. Upon review, the Real Estate Assessments Office may change any or all of the lot values. Since each lot is counted separately, the number of appeals and the number changed by the assessor may be large and may fluctuate substantially from year to year. Some properties are appealed to both the Real Estate Assessments Office and to the BOE. In tax
Page 12
Real Estate Assessments Office 2005 Annual Report
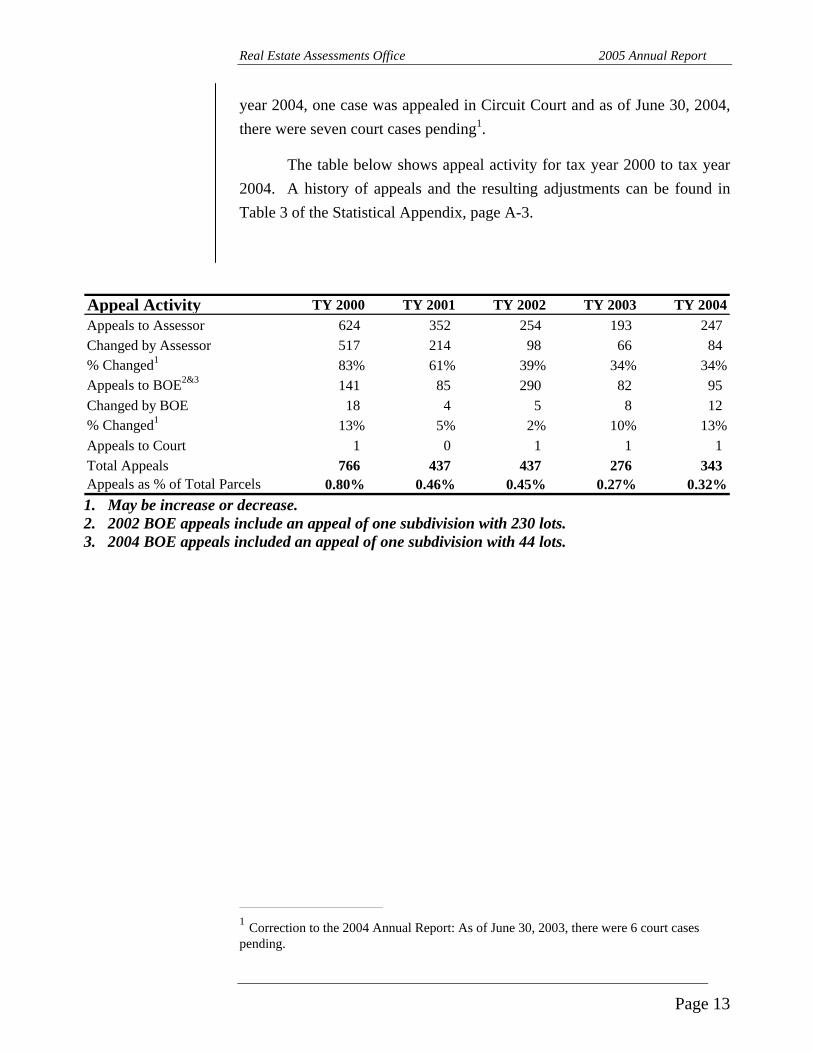
year 2004, one case was appealed in Circuit Court and as of June 30, 2004, there were seven court cases pending1.
The table below shows appeal activity for tax year 2000 to tax year 2004. A history of appeals and the resulting adjustments can be found in Table 3 of the Statistical Appendix, page A-3.
Appeal Activity TY 2000 TY 2001 TY 2002 TY 2003 TY 2004Appeals to Assessor 624 352 254 193 247Changed by Assessor 517 214 98 66 84% Changed1 83% 61% 39% 34% 34%Appeals to BOE2&3 141 85 290 82 95Changed by BOE 18 4 5 8 12% Changed1 13% 5% 2% 10% 13%Appeals to Court 1 0 1 1 1Total Appeals 766 437 437 276 343Appeals as % of Total Parcels 0.80% 0.46% 0.45% 0.27% 0.32% 1. May be increase or decrease. 2. 2002 BOE appeals include an appeal of one subdivision with 230 lots. 3. 2004 BOE appeals included an appeal of one subdivision with 44 lots.
___________________________
1 Correction to the 2004 Annual Report: As of June 30, 2003, there were 6 court cases pending.
Page 13

Real Estate Assessments Office 2005 Annual Report
Real Estate Tax Relief Programs Prince William County provides relief from real estate taxes and
personal property taxes for those who are elderly or disabled and meet specified income and net worth requirements. Certain land uses may also qualify for tax relief to encourage preservation of agriculture, forestry, and open space. Lastly, older properties which undergo substantial renovations can receive a partial tax exemption for the increase in taxes caused by the renovation.
In December 2004, the Board of County Supervisors approved
expanded requirements for Tax
Relief
Tax Relief for the Elderly and Disabled Elderly or disabled persons are eligible for relief from all or part of
the real estate taxes on their home and a home site of 1 acre if they meet the following criteria:
• Are over 65 years of age on or before December 31, or are totally and permanently disabled.
• Have less than $340,000 in total assets (residence and up to 25 acres excluded).
• Do not exceed the maximum combined income requirements set forth in local ordinances.
The following table summarizes exemptions of 2005 taxes for
different ranges of income. The income ranges are based on the Housing and Urban Development (HUD) low income limit and are adjusted annually. For 2005, the HUD low income limit is $46,000 and each range is determined using a percentage of that value.
Income Limits for 2005 Tax Relief Program
Combined Percentage ofIncome Tax Relieved
$0-$46,000 100%$46,001-$52,900 75%$52,901-$59,800 50%$59,801-$66,700 25%
Page 14

Real Estate Assessments Office 2005 Annual Report
The Real Estate Assessments Office provides information to taxpayers about the tax relief program in the following ways:
The Real Estate Assessments Office
utilizes many communication
methods to reach citizens regarding the Tax Relief Program for the Elderly and
Disabled
o The notice of reassessment is sent to all property owners in March and contains the criteria for tax relief and the deadline for filing (see Addendum A, page B-3).
o The personal property verification forms briefly address the Tax Relief Program.
o Advertisements in the Potomac News and the Washington Post. o Notices are run in each INFOCUS, the County’s newsletter mailed to
all homeowners. o A representative from the Real Estate Assessments Office visits the
Harbour House Senior Citizen Home and Merriwood in Manassas in February to assist applicants in completing the application.
o A representative presents the Program at the Senior Expo at Potomac Mills sponsored by Fire & Rescue and Public Safety.
o A representative presents the program at the Community Leadership Institute in the Spring and Fall.
o A tax relief brochure (in both English and Spanish) containing specific information regarding eligibility and application is available in the Real Estate Assessments Office and various other County agencies (see Addendum C, page B-7), including Finance Department counters and senior citizens' centers.
o The County’s website: www.pwcgov.org
The County sends renewal applications to those who received tax relief the preceding year. Individuals who do not receive an application may request one by calling the Real Estate Assessments Office. Applications are also available on the County’s website. A summary of real estate tax relief for the elderly and disabled is shown in the following table. Additional historical information about real estate tax relief is provided in the Appendix, Table 2, page A-3.
Page 15

Real Estate Assessments Office 2005 Annual Report
Summary of Tax Relief for the Elderly and Disabled
Real Estate TY2001 TY2002 TY2003 TY2004 TY20052
Households Exempted 864 827 1,385 1,632 2,220 Households Deferred 1 131 139 - - -
Total # of Households 995 966 1,385 1,632 2,220 Amount Exempted 1,176,134$ 1,439,894$ 2,589,472$ 3,317,670$ 5,083,034$ Amount Deferred 207,490 257,400 - - - Total Amount Relieved 1,383,624$ 1,697,294$ 2,589,472$ 3,317,670$ 5,083,034$
Avg. Amount Exempted 1,361$ 1,741$ 1,870$ 2,032$ 2,289$
Avg. Amount Deferred 1,584$ 1,852$ -$ -$ -$ Personal Property
Approved Personal Property Applicants 1,217 1,223 1,506 1,752 2,317
Notes: • Taxpayers may qualify for real estate tax relief, personal property, or both. • Beginning in 2002, multiple qualifying properties owned by one taxpayer were eliminated and counted as one taxpayer. 1. Deferrals were eliminated with the 2003 program and all income limits were increased to capture anyone who may otherwise been deferred. 2. ● Data as of July 1, 2005.
● Exemption may be 100%, 75%, 50%, or 25%. If the applicant turned 65 or became totally and permanently disabled during calendar year 2005, the exemption is prorated based on the date the applicant turned 65 or became totally and permanently disabled.
Page 16
Real Estate Assessments Office 2005 Annual Report
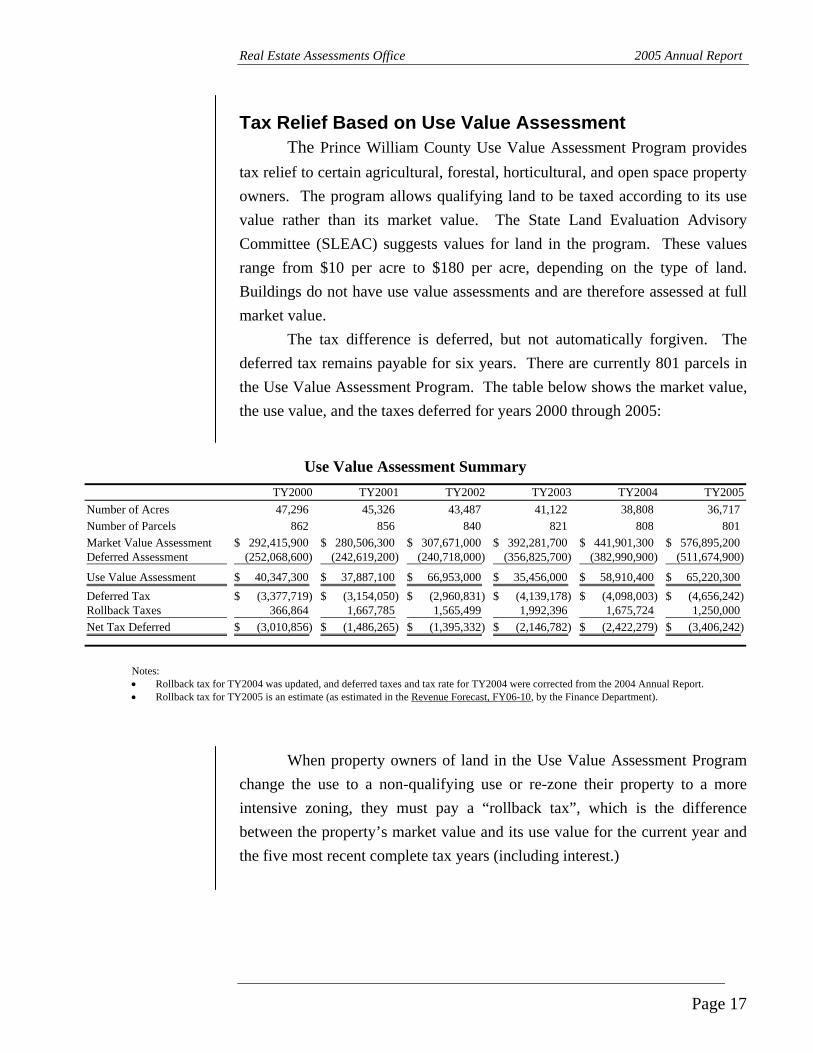
Tax Relief Based on Use Value Assessment The Prince William County Use Value Assessment Program provides
tax relief to certain agricultural, forestal, horticultural, and open space property owners. The program allows qualifying land to be taxed according to its use value rather than its market value. The State Land Evaluation Advisory Committee (SLEAC) suggests values for land in the program. These values range from $10 per acre to $180 per acre, depending on the type of land. Buildings do not have use value assessments and are therefore assessed at full market value.
The tax difference is deferred, but not automatically forgiven. The deferred tax remains payable for six years. There are currently 801 parcels in the Use Value Assessment Program. The table below shows the market value, the use value, and the taxes deferred for years 2000 through 2005:
Use Value Assessment Summary TY2000 TY2001 TY2002 TY2003 TY2004 TY2005
Number of Acres 47,296 45,326 43,487 41,122 38,808 36,717 Number of Parcels 862 856 840 821 808 801 Market Value Assessment 292,415,900$ 280,506,300$ 307,671,000$ 392,281,700$ 441,901,300$ 576,895,200$ Deferred Assessment (252,068,600) (242,619,200) (240,718,000) (356,825,700) (382,990,900) (511,674,900)
Use Value Assessment 40,347,300$ 37,887,100$ 66,953,000$ 35,456,000$ 58,910,400$ 65,220,300$ Deferred Tax (3,377,719)$ (3,154,050)$ (2,960,831)$ (4,139,178)$ (4,098,003)$ (4,656,242)$ Rollback Taxes 366,864 1,667,785 1,565,499 1,992,396 1,675,724 1,250,000 Net Tax Deferred (3,010,856)$ (1,486,265)$ (1,395,332)$ (2,146,782)$ (2,422,279)$ (3,406,242)$
Notes: • Rollback tax for TY2004 was updated, and deferred taxes and tax rate for TY2004 were corrected from the 2004 Annual Report. • Rollback tax for TY2005 is an estimate (as estimated in the Revenue Forecast, FY06-10, by the Finance Department).
When property owners of land in the Use Value Assessment Program change the use to a non-qualifying use or re-zone their property to a more intensive zoning, they must pay a “rollback tax”, which is the difference between the property’s market value and its use value for the current year and the five most recent complete tax years (including interest.)
Page 17

Real Estate Assessments Office 2005 Annual Report
Partial Tax Exemption for Rehabilitated Real Estate An ordinance enacting a partial tax exemption for real estate that is
substantially repaired, rehabilitated, or replaced became effective on January 1, 1998. The program is intended to encourage owners of older properties to improve the condition and appearance of their properties. All improved property types are eligible for the exemption. The rehabilitation or replacement structure must increase the value of the original structure by at least 25% to qualify for the exemption. Minimum age and maximum size increase requirements depending on property type must also be met. Applications and information are available on the County’s website.
The Board of County Supervisors
adopted the Tax Rehabilitation
Program to encourage owners of older properties
to improve the condition and
appearance of their properties
The tax exemption for properties in the rehabilitation program is applied over a fifteen-year period. The total tax saving is equal to 100% of the exemption each year for the first ten years. Over the next five years the tax savings is reduced and the exemption is phased out as follows: 80% in year 11, 60% in year 12, 40% in year 13, 20% in year 14, and 0% in year 5. The tax exemption is transferable to a new property owner during the program period.
The following is an example of a rehabilitated property participating in the program:
Before Rehabilitation
Page 18

Real Estate Assessments Office 2005 Annual Report
After Rehabilitation
Summary of Tax Exemption for Rehabilitated Real Estate
Property Type
Year Exemption
Began
Tax Savings for 2001
Tax Savings for 2002
Tax Savings for 2003
Tax Savings for 2004
Tax Savings for 2005
Residential 1999 $ 2,988 $ 2,988 $ 2,988 $ 2,988 $ 2,988 Commercial 2000 59,990 59,990 59,990 59,990 59,990 Commercial 2000 4,086 4,086 4,086 4,086 4,086 Commercial 2000 3,546 3,546 3,546 3,546 3,546 Commercial 2000 334 334 334 334 334 Commercial 2001 1,910 1,910 1,910 1,910 1,910 Residential 2001 2,647 2,647 2,647 2,647 2,647 Residential 2001 458 458 458 458 458 Residential 2001 385 385 385 385 385 Residential 2002 1,451 1,451 1,451 1,451 Residential 2002 339 339 339 339 Residential 2003 549 549 549 Residential 2003 443 443 443 Residential 2003 386 386 386 Residential 2004 703 703 Residential 2004 635 635 Residential 2004 519 519 Residential 2004 289 289 Residential 2005 495 Residential 2005 238
76,342$ 78,133$ 79,511$ 81,657$ 82,390$ Total Tax Savings
Page 19
Real Estate Assessments Office 2005 Annual Report
Providing Customer Service The Real Estate Assessments Office provides services to all taxpayers
in the form of accurate, equitable assessments. In addition, each year the Real Estate Assessments Office provides direct assistance to thousands of citizens on an individual basis. One of the most direct forms of customer service is responding to appeals by taxpayers who are not certain their assessment is correct. Taxpayer appeals are explained in the “Appeal Procedures” section, page 12. Several other direct customer services provided by the Real Estate Assessments Office are as follows:
The Real Estate Assessments
Office pledges to do the right thing for the customer
and the community every
time
Walk-in Customers The Real Estate Assessments Office has two main types of walk-in
customers: taxpayers and real estate professionals. When taxpayers come to the Real Estate Assessments Office for assistance with understanding and applying for tax relief programs, the office staff works directly with them. The Real Estate Assessments Office also has brochures about tax relief for rehabilitated properties (see Addendum B, page B-5) and tax relief for the elderly and disabled (see Addendum C, page B-7). Appraisers and real estate agents use the Real Estate Assessments Office sales lists, microfiche copies of tax records, and on-line access to the assessment database for research purposes.
Telephone Requests Many citizens call for information about the method of assessment used
in valuing their property or about tax due dates and other general facts. The Real Estate Assessments Office also provides tax professionals ownership, tax and property data. In previous years, this information was provided via a 900-number telephone service. With the implementation of the County’s Real Estate Assessments internet site, the 900-service was discontinued.
Page 20
Real Estate Assessments Office 2005 Annual Report
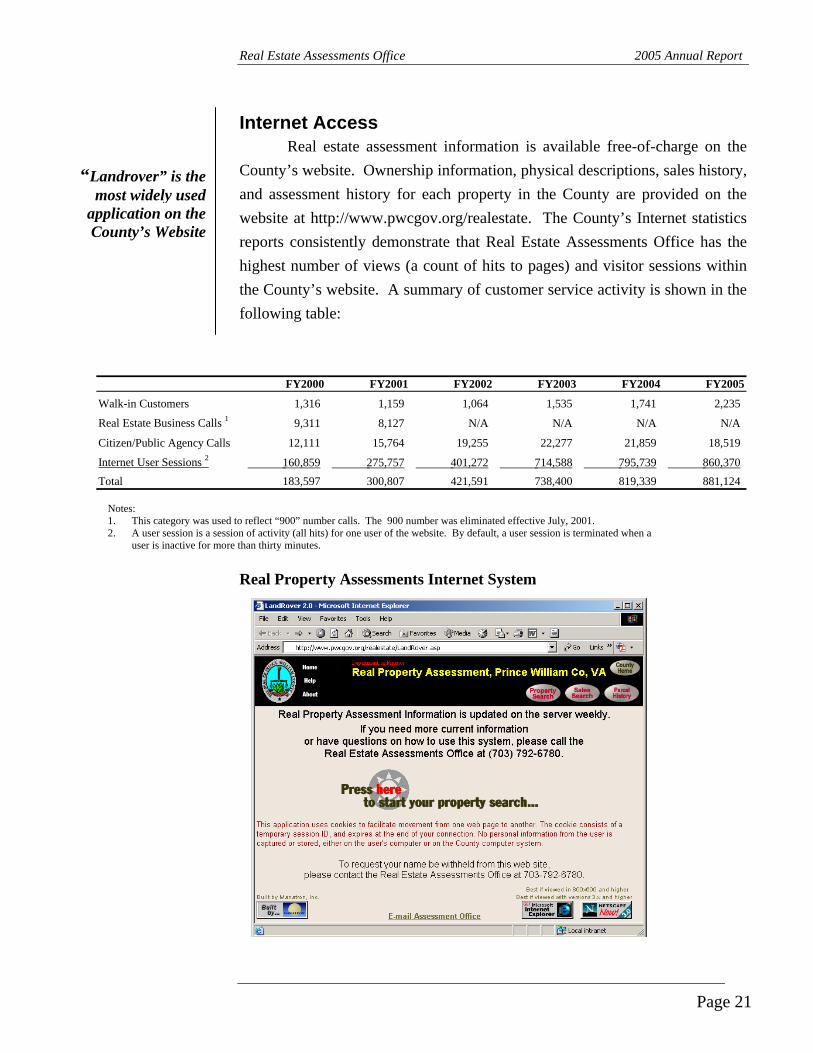
Internet Access Real estate assessment information is available free-of-charge on the County’s website. Ownership information, physical descriptions, sales history, and assessment history for each property in the County are provided on the website at http://www.pwcgov.org/realestate. The County’s Internet statistics reports consistently demonstrate that Real Estate Assessments Office has the highest number of views (a count of hits to pages) and visitor sessions within the County’s website. A summary of customer service activity is shown in the following table:
“Landrover” is the most widely used
application on the County’s Website
FY2000 FY2001 FY2002 FY2003 FY2004 FY2005
Walk-in Customers 1,316 1,159 1,064 1,535 1,741 2,235
Real Estate Business Calls 1 9,311 8,127 N/A N/A N/A N/A
Citizen/Public Agency Calls 12,111 15,764 19,255 22,277 21,859 18,519
Internet User Sessions 2 160,859 275,757 401,272 714,588 795,739 860,370 Total 183,597 300,807 421,591 738,400 819,339 881,124
Notes: 1. This category was used to reflect “900” number calls. The 900 number was eliminated effective July, 2001. 2. A user session is a session of activity (all hits) for one user of the website. By default, a user session is terminated when a
user is inactive for more than thirty minutes. Real Property Assessments Internet System
Page 21

Real Estate Assessments Office 2005 Annual Report
Real Estate Values For the purpose of comparing and analyzing real estate assessments,
property in the County has been divided into several categories. The following table compares assessed values for each type of property for tax years 2004 and 2005. Landbook values are assessments as of January 1. Supplemental assessments and State-valued public service assessments are added to the landbook to form the total real estate tax base for the County. The assessed values of tax-exempt properties are added to taxable properties to show the total assessed value of real property in the County.
The total taxable value of the Land-
book increased 29.2% from
January 1, 2004 to January 1, 2005
Landbook Values from 2004 to 2005
2004 2005 PercentageAssessed Value Assessed Value Change
Taxable Landbook Residential 27,093,333,200$ 35,545,112,500$ 31.2 Apartments 1,178,785,400 1,321,238,000 12.1 Commercial and Industrial 3,831,406,100 4,659,140,600 21.6 Undeveloped Land 257,766,700 274,871,400 6.6
Total Taxable Landbook 32,361,291,400 41,800,362,500 29.2 Supplements (1)
Residential 479,967,900 519,719,500 Apartments 11,415,800 16,418,400 Commercial and Industrial 37,577,400 28,636,500 Undeveloped Land 19,200 -
Total Supplements 528,980,300 564,774,400 6.8 Public Service (2) 1,249,775,269 1,262,273,022 1.0 Total Tax Base 34,140,046,969 43,627,409,922 27.8
Rollbacks (3) 156,609,720 116,822,430 Tax Exempt 2,223,993,000 2,567,585,100 15.4 Deferred Use Value (4) 382,990,900 511,674,900 33.6 Total County Value 36,903,640,589$ 46,823,492,352$ 26.9
Notes: 2004 and 2005 Assessed Values form the basis for FY2005 and FY2006 revenues,
respectively. 1. Supplements are taxes billed for construction completed during the year. Supplemental
assessments include prorated assessments on newly completed construction and prorated assessments for properties which become taxable during the year. Supplements 1, 2 and 3 for 2005 are not currently available. The values shown are estimated.
2. Public Service assessments are received by the County from the State in September of each year. 2005 Public Service assessment is estimated.
3. Rollbacks account for properties that were eliminated from the use value program due to re-zoning or development. Rollbacks for 2005 are estimated and are calculated using the base tax rate of $0.91 per $100 of assessed value.
4. Deferred use value is the difference between the market value and use value of properties in the Use Value Assessment Program.
Page 22
Real Estate Assessments Office 2005 Annual Report
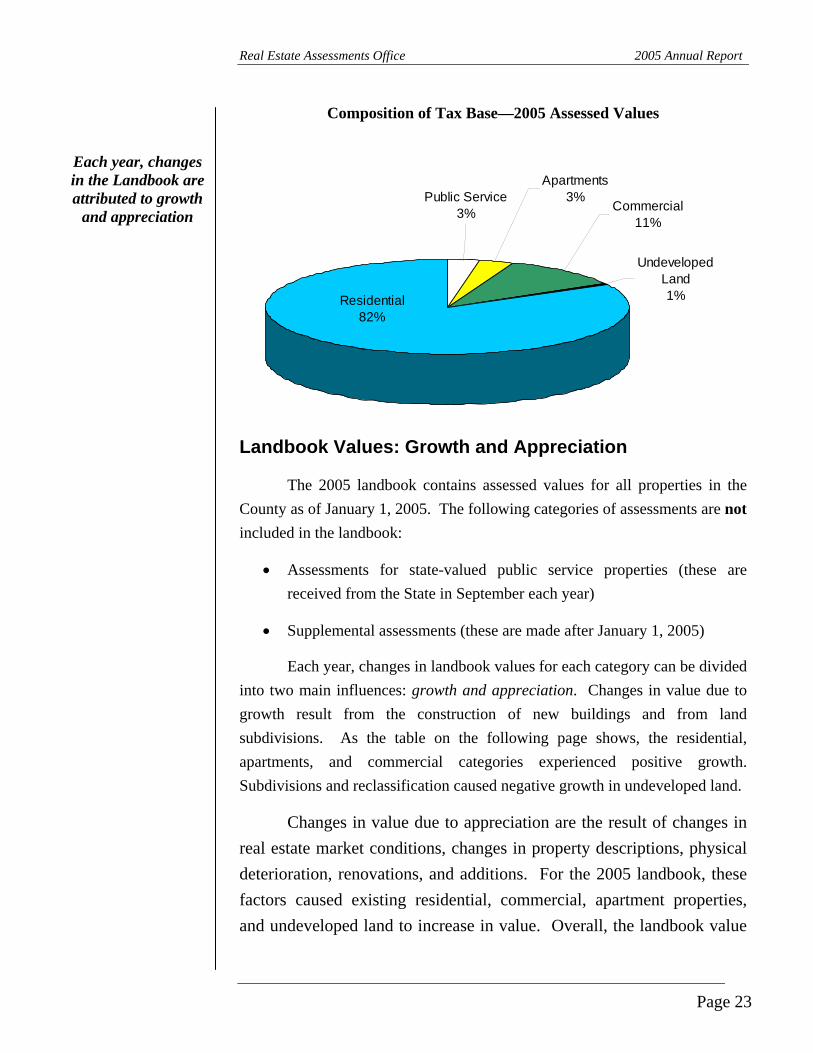
Composition of Tax Base—2005 Assessed Values
Residential82%
Undeveloped Land1%
Commercial11%
Public Service3%
Apartments3%
Each year, changes in the Landbook are attributed to growth
and appreciation
Landbook Values: Growth and Appreciation
The 2005 landbook contains assessed values for all properties in the County as of January 1, 2005. The following categories of assessments are not included in the landbook:
• Assessments for state-valued public service properties (these are received from the State in September each year)
• Supplemental assessments (these are made after January 1, 2005)
Each year, changes in landbook values for each category can be divided into two main influences: growth and appreciation. Changes in value due to growth result from the construction of new buildings and from land subdivisions. As the table on the following page shows, the residential, apartments, and commercial categories experienced positive growth. Subdivisions and reclassification caused negative growth in undeveloped land.
Changes in value due to appreciation are the result of changes in real estate market conditions, changes in property descriptions, physical deterioration, renovations, and additions. For the 2005 landbook, these factors caused existing residential, commercial, apartment properties, and undeveloped land to increase in value. Overall, the landbook value
Page 23
Real Estate Assessments Office 2005 Annual Report
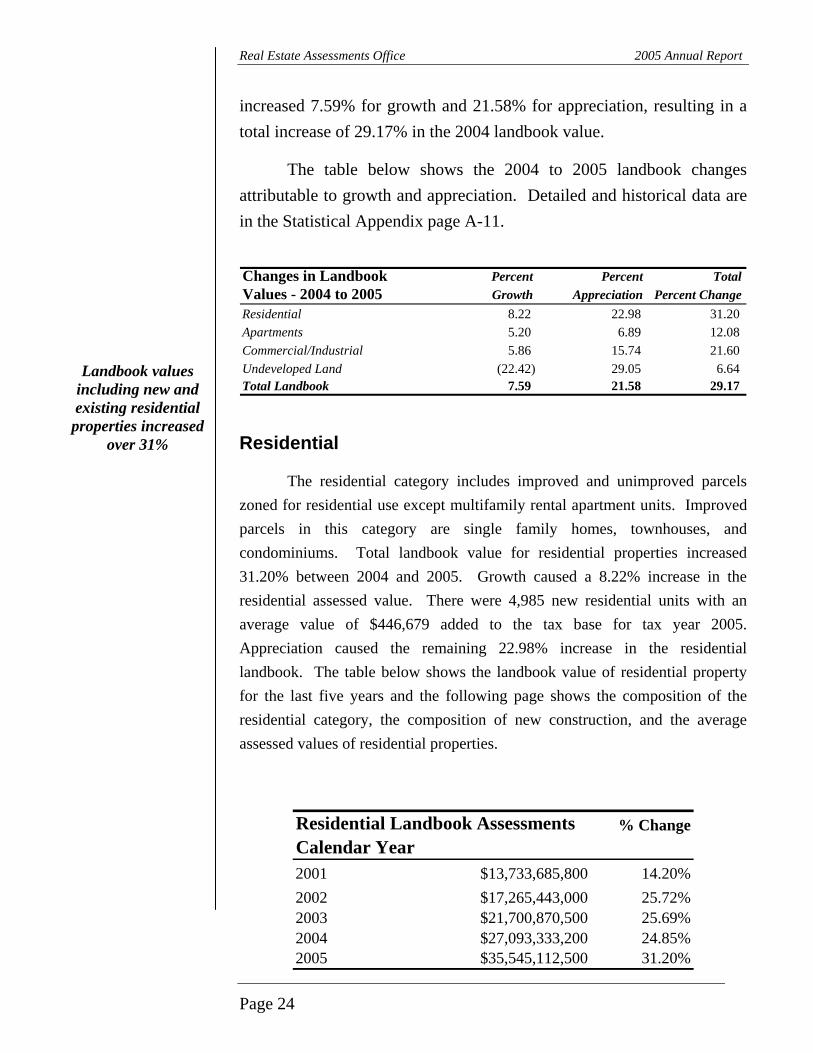
increased 7.59% for growth and 21.58% for appreciation, resulting in a total increase of 29.17% in the 2004 landbook value.
The table below shows the 2004 to 2005 landbook changes attributable to growth and appreciation. Detailed and historical data are in the Statistical Appendix page A-11.
Changes in Landbook Percent Percent TotalValues - 2004 to 2005 Growth Appreciation Percent ChangeResidential 8.22 22.98 31.20 Apartments 5.20 6.89 12.08 Commercial/Industrial 5.86 15.74 21.60 Undeveloped Land (22.42) 29.05 6.64 Total Landbook 7.59 21.58 29.17
Landbook values including new and existing residential properties increased
over 31%
Residential
The residential category includes improved and unimproved parcels zoned for residential use except multifamily rental apartment units. Improved parcels in this category are single family homes, townhouses, and condominiums. Total landbook value for residential properties increased 31.20% between 2004 and 2005. Growth caused a 8.22% increase in the residential assessed value. There were 4,985 new residential units with an average value of $446,679 added to the tax base for tax year 2005. Appreciation caused the remaining 22.98% increase in the residential landbook. The table below shows the landbook value of residential property for the last five years and the following page shows the composition of the residential category, the composition of new construction, and the average assessed values of residential properties.
Residential Landbook Assessments % ChangeCalendar Year2001 $13,733,685,800 14.20%2002 $17,265,443,000 25.72%2003 $21,700,870,500 25.69%2004 $27,093,333,200 24.85%2005 $35,545,112,500 31.20%
Page 24

Real Estate Assessments Office 2005 Annual Report
Types of Residential Property - 2005 Landbook
Townhouses20%
Other0%
Vacant Land4%
Condominiums3%
Single Family73%
Notes: This table is not a count of dwelling units in the County. Some parcels in the Single Family category may have more than one dwelling unit. New homes that were partially built as of January 1, 2005 are counted as if they were complete, although their value is discounted depending on the level of completion. Tax-exempt properties and apartment units are not included in this table.
Of the 4,985 new homes built in the County during 2005, 86% were single-family homes and townhouses assessed at over $300,000 for tax year 2005. The average assessment of all residential new construction increased from $382,374 in 2003 to $446,679 in 2005. The following table shows the breakdown of new homes by type and value:
Type of NewResidential Count Average Count Average Count Average Single Family 3,562 496,694$ 62 288,119$ 3,624 493,125$ Townhouses 720 358,199 387 271,855 1,107 328,014 Condominiums 104 369,654 150 253,682 254 301,167 Total Residential 4,386 470,946 599 268,988 4,985 446,679
Average Residential Real Estate Tax for New Homes (Tax Rate = $0.91 per $100) 4,065$
New Units Over $300,000 New Units Under All New Units
Note: This table includes residential homes completed during 2004. Homes partially built as of January 1, 2005 have been excluded.
Page 25

Real Estate Assessments Office 2005 Annual Report
As of January 1, 2005, all types of existing residential properties experienced increases in average assessed value. Listed below are the average assessments of residential dwelling types for the last five years.
As of January 1, 2005, the average
residential assessment was above $330,000
Average Residential Assessments by Type
2001 2002 2003 2004 2005Single Family Detached 189,567$ 224,474$ 263,961$ 309,307$ 381,548$ Townhouses 112,962$ 133,259$ 161,247$ 195,017$ 251,764$ Condominiums 78,672$ 91,495$ 110,323$ 133,597$ 182,287$ All Types 160,116$ 189,946$ 225,149$ 266,502$ 333,510$
Note: These averages do not include tax-exempt properties, vacant lots, residences on commercial or agricultural land, parcels with more than one residence, or houses that were partially complete as of January 1, 2005.
Comparison of Average Residential Assessments by Type
$-
$50,000
$100,000
$150,000
$200,000
$250,000
$300,000
$350,000
$400,000
$450,000
Single FamilyDetached
Townhouses Condominiums All Types
2001 2002 2003 2004 2005
The average single family dwelling value was over $381,000 as of January 1, 2005
New houses can influence the overall average assessed value of all homes positively or negatively, depending on the size, quality, and type of new construction. In general, new houses are more expensive than typical existing houses in the County and therefore cause an increase in the overall average assessed value. As a result, even if market factors or physical deterioration cause a decline in the value of existing properties, construction of new units may cause the overall average value to increase. In recent years, there has been a general upward trend of average values in residential properties in the County. A ten-year history of average values is included in the Statistical Appendix, Table 6, page A-5.
Page 26
Real Estate Assessments Office 2005 Annual Report
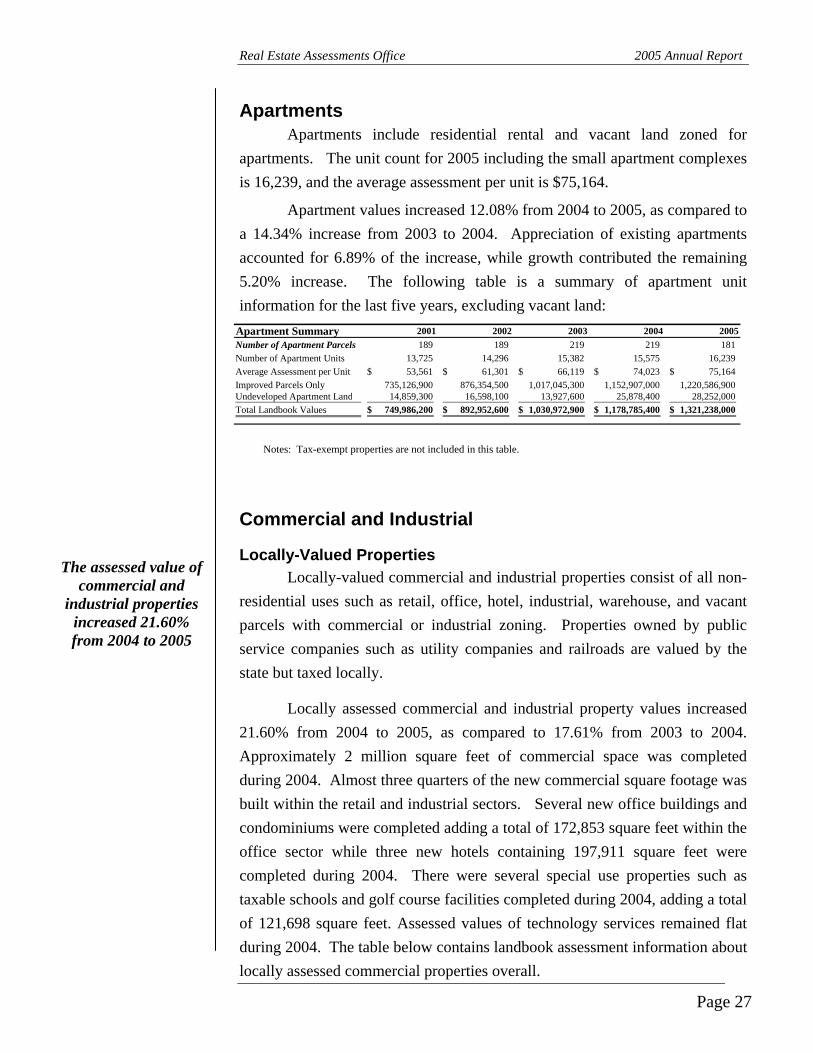
Apartments Apartments include residential rental and vacant land zoned for
apartments. The unit count for 2005 including the small apartment complexes is 16,239, and the average assessment per unit is $75,164.
Apartment values increased 12.08% from 2004 to 2005, as compared to a 14.34% increase from 2003 to 2004. Appreciation of existing apartments accounted for 6.89% of the increase, while growth contributed the remaining 5.20% increase. The following table is a summary of apartment unit information for the last five years, excluding vacant land:
Apartment Summary 2001 2002 2003 2004 2005Number of Apartment Parcels 189 189 219 219 181 Number of Apartment Units 13,725 14,296 15,382 15,575 16,239 Average Assessment per Unit 53,561$ 61,301$ 66,119$ 74,023$ 75,164$ Improved Parcels Only 735,126,900 876,354,500 1,017,045,300 1,152,907,000 1,220,586,900 Undeveloped Apartment Land 14,859,300 16,598,100 13,927,600 25,878,400 28,252,000 Total Landbook Values 749,986,200$ 892,952,600$ 1,030,972,900$ 1,178,785,400$ 1,321,238,000$
Notes: Tax-exempt properties are not included in this table.
Commercial and Industrial
Locally-Valued Properties The assessed value of
commercial and industrial properties
increased 21.60% from 2004 to 2005
Locally-valued commercial and industrial properties consist of all non-residential uses such as retail, office, hotel, industrial, warehouse, and vacant parcels with commercial or industrial zoning. Properties owned by public service companies such as utility companies and railroads are valued by the state but taxed locally.
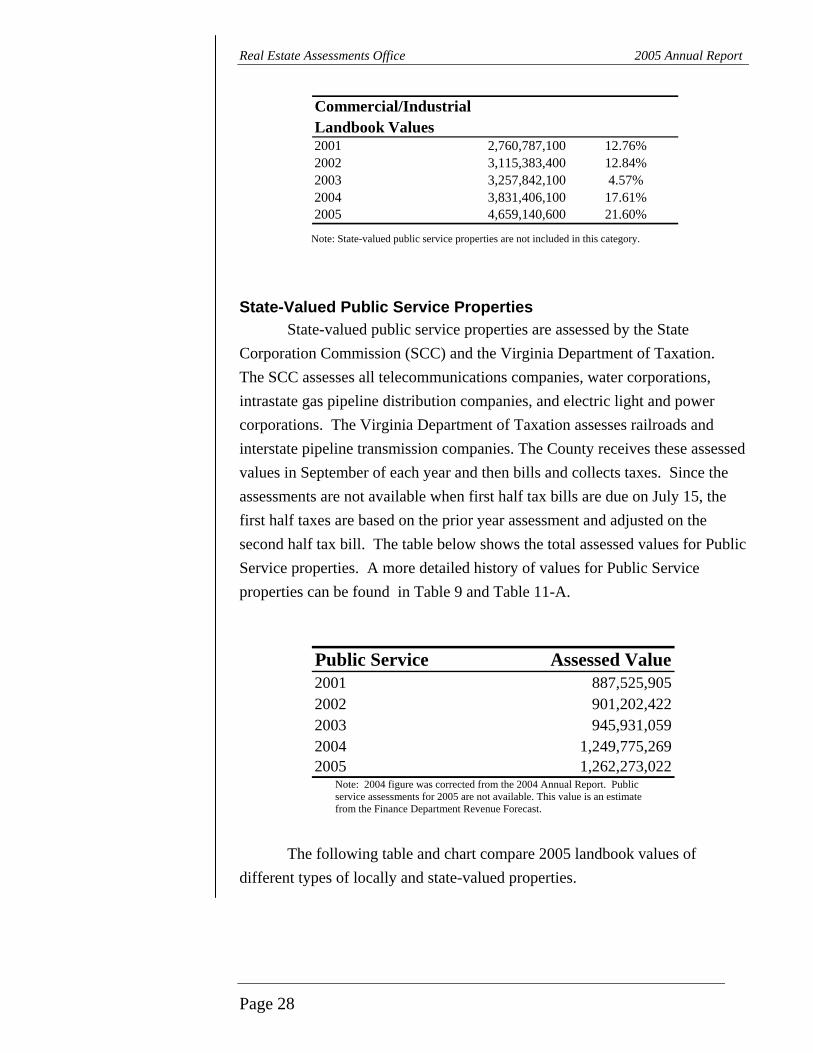
Locally assessed commercial and industrial property values increased 21.60% from 2004 to 2005, as compared to 17.61% from 2003 to 2004. Approximately 2 million square feet of commercial space was completed during 2004. Almost three quarters of the new commercial square footage was built within the retail and industrial sectors. Several new office buildings and condominiums were completed adding a total of 172,853 square feet within the office sector while three new hotels containing 197,911 square feet were completed during 2004. There were several special use properties such as taxable schools and golf course facilities completed during 2004, adding a total of 121,698 square feet. Assessed values of technology services remained flat during 2004. The table below contains landbook assessment information about locally assessed commercial properties overall.
Page 27
Real Estate Assessments Office 2005 Annual Report
Commercial/IndustrialLandbook Values2001 2,760,787,100 12.76%2002 3,115,383,400 12.84%2003 3,257,842,100 4.57%2004 3,831,406,100 17.61%2005 4,659,140,600 21.60%
Note: State-valued public service properties are not included in this category.
State-Valued Public Service Properties State-valued public service properties are assessed by the State
Corporation Commission (SCC) and the Virginia Department of Taxation. The SCC assesses all telecommunications companies, water corporations, intrastate gas pipeline distribution companies, and electric light and power corporations. The Virginia Department of Taxation assesses railroads and interstate pipeline transmission companies. The County receives these assessed values in September of each year and then bills and collects taxes. Since the assessments are not available when first half tax bills are due on July 15, the first half taxes are based on the prior year assessment and adjusted on the second half tax bill. The table below shows the total assessed values for Public Service properties. A more detailed history of values for Public Service properties can be found in Table 9 and Table 11-A.
Public Service Assessed Value2001 887,525,9052002 901,202,4222003 945,931,0592004 1,249,775,2692005 1,262,273,022
Note: 2004 figure was corrected from the 2004 Annual Report. Public service assessments for 2005 are not available. This value is an estimate from the Finance Department Revenue Forecast.
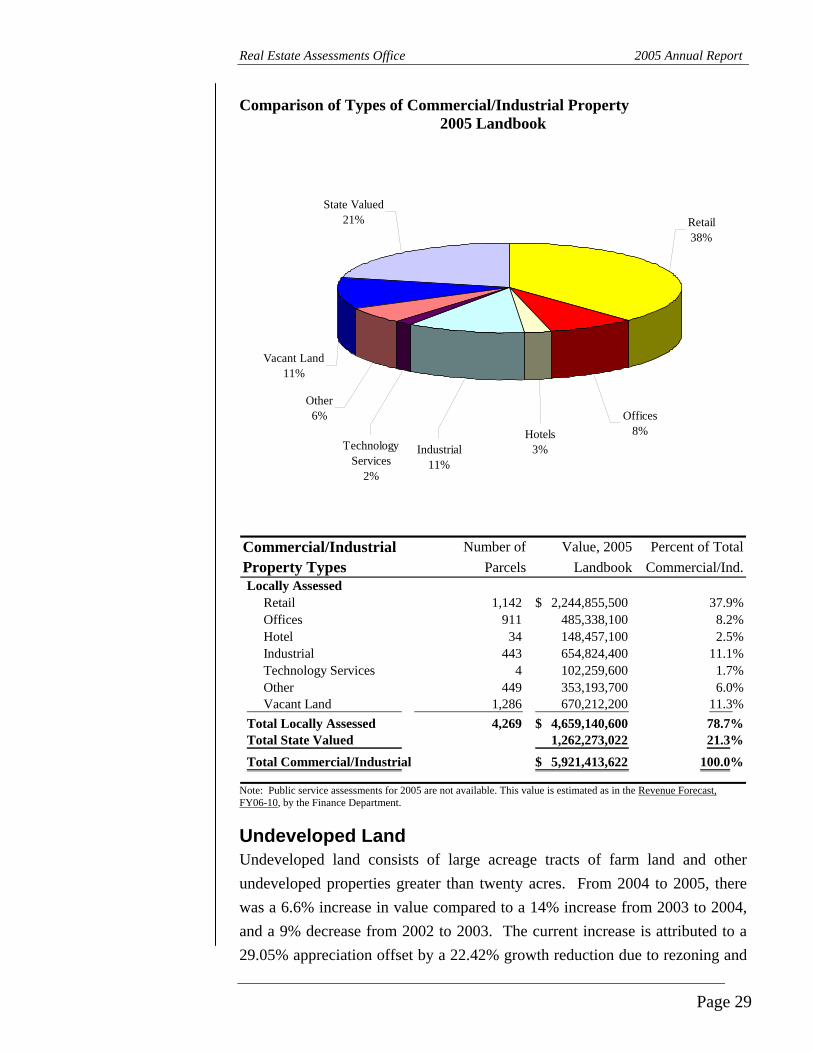
The following table and chart compare 2005 landbook values of
different types of locally and state-valued properties.
Page 28
Real Estate Assessments Office 2005 Annual Report
Comparison of Types of Commercial/Industrial Property 2005 Landbook
Retail38%
Offices8%Hotels
3%Industrial11%
Other6%
Technology Services
2%
Vacant Land11%
State Valued21%
Commercial/Industrial Number of Value, 2005 Percent of TotalProperty Types Parcels Landbook Commercial/Ind.Locally Assessed Retail 1,142 2,244,855,500$ 37.9% Offices 911 485,338,100 8.2% Hotel 34 148,457,100 2.5% Industrial 443 654,824,400 11.1% Technology Services 4 102,259,600 1.7% Other 449 353,193,700 6.0% Vacant Land 1,286 670,212,200 11.3%Total Locally Assessed 4,269 4,659,140,600$ 78.7%Total State Valued 1,262,273,022 21.3%Total Commercial/Industrial 5,921,413,622$ 100.0%
Note: Public service assessments for 2005 are not available. This value is estimated as in the Revenue Forecast, FY06-10, by the Finance Department.
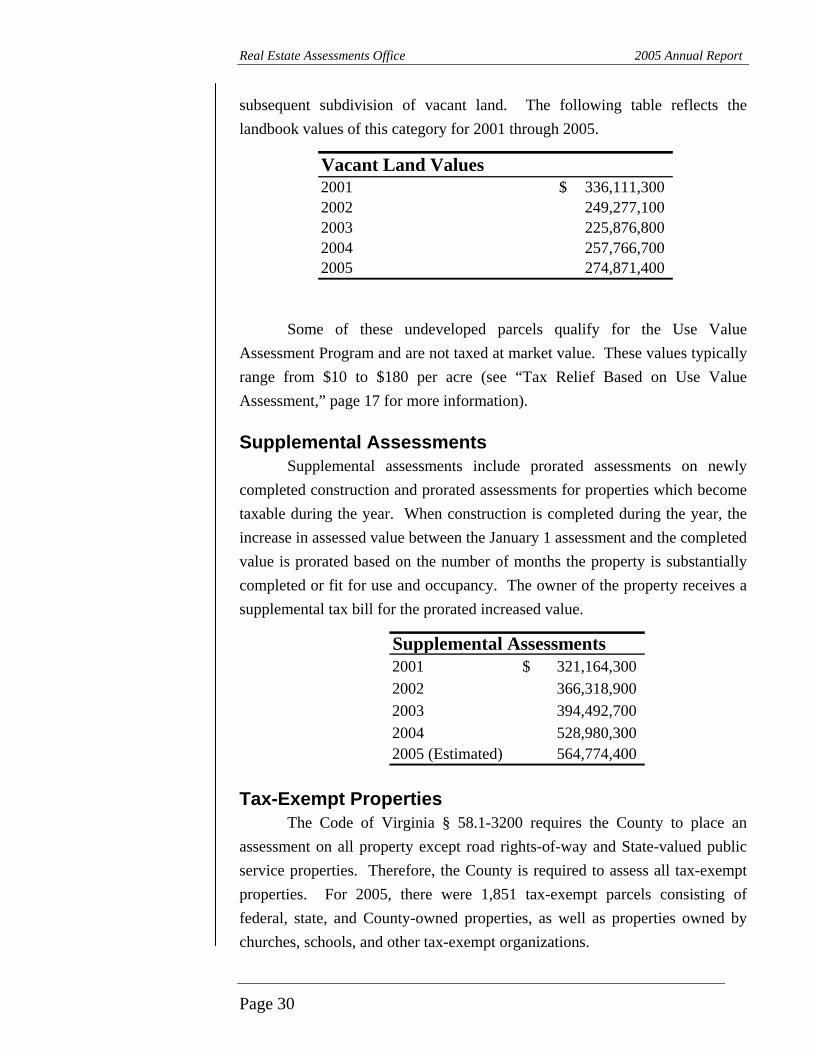
Undeveloped Land Undeveloped land consists of large acreage tracts of farm land and other undeveloped properties greater than twenty acres. From 2004 to 2005, there was a 6.6% increase in value compared to a 14% increase from 2003 to 2004, and a 9% decrease from 2002 to 2003. The current increase is attributed to a 29.05% appreciation offset by a 22.42% growth reduction due to rezoning and
Page 29
Real Estate Assessments Office 2005 Annual Report
subsequent subdivision of vacant land. The following table reflects the landbook values of this category for 2001 through 2005.
Vacant Land Values2001 336,111,300$ 2002 249,277,1002003 225,876,8002004 257,766,7002005 274,871,400
Some of these undeveloped parcels qualify for the Use Value Assessment Program and are not taxed at market value. These values typically range from $10 to $180 per acre (see “Tax Relief Based on Use Value Assessment,” page 17 for more information).
Supplemental Assessments Supplemental assessments include prorated assessments on newly
completed construction and prorated assessments for properties which become taxable during the year. When construction is completed during the year, the increase in assessed value between the January 1 assessment and the completed value is prorated based on the number of months the property is substantially completed or fit for use and occupancy. The owner of the property receives a supplemental tax bill for the prorated increased value.
Supplemental Assessments2001 321,164,300$ 2002 366,318,9002003 394,492,7002004 528,980,3002005 (Estimated) 564,774,400
Tax-Exempt Properties The Code of Virginia § 58.1-3200 requires the County to place an
assessment on all property except road rights-of-way and State-valued public service properties. Therefore, the County is required to assess all tax-exempt properties. For 2005, there were 1,851 tax-exempt parcels consisting of federal, state, and County-owned properties, as well as properties owned by churches, schools, and other tax-exempt organizations.
Page 30

Real Estate Assessments Office 2005 Annual Report
Tax-exempt properties are less
than 6% of the total County tax base
The total assessed value of exempt properties for 2005 is $2,567,585,100 and the total amount of taxes exempted is $23,724,486. A summary of the assessed values of tax-exempt properties by category for 2001 through 2005 and a chart showing the relative proportion of each category of tax-exempt properties for 2005 follows.
Religious8%
Educational7%
Other2%Charitable
2%Federal
29%
State 5%
Regional1%
Local46%
Values of Tax Exempt PropertiesCalendar Years 2001 2002 2003 2004 2005Federal 479,848,400$ 530,630,700$ 418,998,100$ 738,824,400$ 750,911,100$ State 90,327,900 99,841,500 105,556,900 112,161,800 132,510,500 Regional 17,041,000 18,014,400 19,148,900 21,326,200 24,380,500 Local 734,630,600 780,837,100 909,128,500 1,058,180,900 1,170,487,700 Religious 144,111,800 151,009,400 163,432,100 184,271,600 216,548,800 Charitable 23,412,700 25,748,900 28,814,000 34,500,400 46,352,900 Educational 10,660,600 11,578,900 13,650,600 34,189,200 174,780,000 Other 29,647,800 28,839,900 36,813,800 40,538,500 51,613,600
Total Tax Exempt 1,529,680,800$ 1,646,500,800$ 1,695,542,900$ 2,223,993,000$ 2,567,585,100$ % of Total County Value 7.44% 6.63% 6.63% 6.11% 5.48%
Page 31

This page intentionally left blank
Statistical Appendix
A-1

This page intentionally left blank

Table 1: History of Property Record Maintenance Activity
FY 1996 FY 1997 FY 1998 FY 1999 FY 2000 FY 2001 FY 2002 FY 2003 FY 2004 FY 2005Wills 428 450 473 520 550 580 408 404 329 829New Lots 2,170 2,238 2,945 2,130 3,189 3,867 4,779 3,701 4,140 4,762Deeds 8,710 9,631 10,438 12,120 12,941 16,100 20,317 20,919 23,429 23,539Transfers* n/a n/a 14,381 14,243 14,831 16,652 20,239 21,854 23,822 34,125 *Data for transfers not tracked prior FY1998.
Table 2: History of Tax Relief for the Elderly and Disabled
TY 1996 TY 1997 TY 1998 TY 1999 TY 2000 TY 2001 TY 2002 TY 2003 TY 2004 TY 2005Real EstateNumber Exempted 737 730 682 731 712 864 827 1,385 1,632 2,220Amount Exempted $920,860 $952,411 $905,620 $1,010,781 $998,470 $1,176,134 1,439,894$ 2,589,472$ 3,317,670$ 5,083,034$ Number Deferred 154 163 211 188 204 131 139 n/a n/a n/aAmount Deferred $181,398 $210,384 $274,127 $254,824 $297,292 $207,490 $257,400 n/a n/a n/aPersonal PropertyNumber Exempted* n/a n/a n/a 1,203 1,234 1,217 1,223 1,506 1,752 2,317 *Not Available Prior FY 1999.
Table 3: History of Appeals Activity
TY 1995 TY 1996 TY 1997 TY 1998 TY 1999 TY 2000 TY 2001 TY 2002 TY 2003 TY 2004Appeals to Assessor 490 835 616 376 736 624 352 254 193 247Changed by Assessor* 269 607 317 292 373 517 214 98 66 84% Changed 55% 73% 51% 78% 51% 83% 61% 39% 34% 34%Appeals to BOE 641 415 615 334 126 141 85 290 82 95Changed by BOE** 229 189 42 42 50 18 4 5 8 12% Changed 36% 46% 7% 13% 40% 13% 5% 2% 10% 13%Appeals to Court 7 16 8 2 2 1 0 1 1 1Total 1,138 1,266 1,239 712 864 766 437 545 276 343 *May have been decrease or increase. **2002 BOE Appeals included an appeal of a subdivision with 230 lots. 2004 BOE appeals included an appeal of one subdivision with 44 lots.
Table 4: History of Adjustments TY 1995 TY 1996 TY 1997 TY 1998 TY 1999 TY 2000 TY 2001 TY 2002 TY 2003 TY 2004
Number Adjusted 1,055 725 385 416 808 858 746 638 447 504Tax Amt. Reduced $1,463,971 $1,332,849 $1,034,111 $1,244,595 $829,138 $707,867 $1,258,958 $923,841 $790,081 $1,066,612 Note: These numbers include all adjustments as a result of appeals and highway takings.
A-3

Table 5: Use Value Assessment Summary
# of Market Value Use Value Assessment Percent Tax Rate Tax Rollback Net AnnualYear Parcels Acres Assessment Assessment Reduction Reduction per $100 Reduction Taxes* Deferral1996 885 52,929 318,738,300 50,737,900 268,000,400 84.08 1.36 3,644,805 389,541 3,255,2641997 849 50,796 302,470,900 47,371,000 255,099,900 84.34 1.36 3,469,359 1,221,495 2,247,8641998 841 49,481 293,863,600 47,168,900 246,694,700 83.95 1.36 3,355,048 356,859 2,998,1891999 867 49,853 299,518,000 45,764,900 253,753,100 84.72 1.36 3,451,042 223,779 3,227,2642000 862 47,296 292,415,900 40,347,300 252,068,600 86.20 1.34 3,377,719 366,864 3,010,8562001 856 45,326 280,506,300 37,887,100 242,619,200 86.49 1.30 3,154,050 1,667,785 1,486,2652002 840 43,487 307,671,000 37,426,100 240,718,000 78.24 1.23 2,960,831 1,565,499 1,395,3322003 821 41,122 392,281,700 35,456,000 356,825,700 90.96 1.16 4,139,178 1,992,396 2,146,7822004 808 38,808 441,901,300 58,910,400 382,990,900 86.67 1.07 4,098,003 1,675,724 2,422,2792005 801 36,717 576,895,200 65,220,300 511,674,900 88.69 0.91 4,656,242 1,250,000 3,406,242 *2005 rollback taxes are estimated.
A-4

Table 6: Average Assessed Value History of Residential Property
Single Family All Percent Total NumberYear and Duplexes Townhouses Condominiums Residential Change of Units*1996 147,836 97,399 72,307 128,700 0.49% 69,3921997 149,867 97,802 72,319 129,831 0.88% 71,3791998 153,564 98,953 73,416 132,435 2.01% 73,6411999 160,347 99,785 73,264 136,841 3.33% 76,0092000 170,719 103,867 74,778 144,979 5.95% 79,0972001 189,567 112,962 78,672 160,116 10.44% 82,2732002 224,474 133,259 91,495 189,946 18.63% 86,2692003 263,961 161,247 110,323 225,149 18.53% 90,7882004 309,307 195,017 133,597 266,502 18.37% 95,4692005 381,548 251,764 182,287 333,510 25.14% 100,462
* The units included in this table are all residential properties in the Single Family Detached, Duplex, Townhouse and Condominium categories. Houses on commercially zoned or agricultural parcels and houses that were partially complete as of January 1, 2005 are not included. Tax exempt properties and parcels owned by homeowners associations are also not included. The difference between the unit counts in successive years does not always equal the number of new houses added since during reassessment some properties are reclassified to or from a non-residential type.
Average Assessed Value—All Residential
1996-2006
$0
$50,000
$100,000
$150,000
$200,000
$250,000
$300,000
$350,000
$400,000
1996 1997 1998 1999 2000 2001 2002 2003 2004 20050%
5%
10%
15%
20%
25%
30%
Average Overall Assessment% Change
A-5
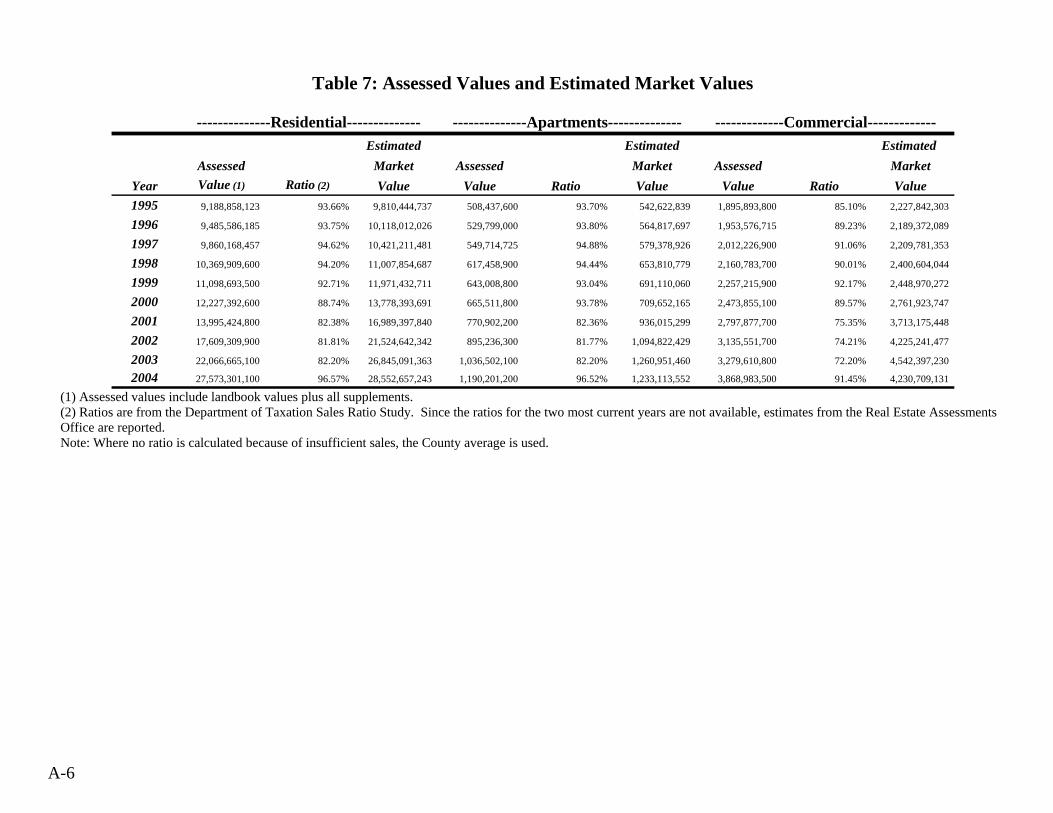
Table 7: Assessed Values and Estimated Market Values
--------------Residential-------------- --------------Apartments-------------- -------------Commercial------------- Estimated Estimated Estimated Assessed Market Assessed Market Assessed Market
Year Value (1) Ratio (2) Value Value Ratio Value Value Ratio Value1995 9,188,858,123 93.66% 9,810,444,737 508,437,600 93.70% 542,622,839 1,895,893,800 85.10% 2,227,842,303
1996 9,485,586,185 93.75% 10,118,012,026 529,799,000 93.80% 564,817,697 1,953,576,715 89.23% 2,189,372,089
1997 9,860,168,457 94.62% 10,421,211,481 549,714,725 94.88% 579,378,926 2,012,226,900 91.06% 2,209,781,353
1998 10,369,909,600 94.20% 11,007,854,687 617,458,900 94.44% 653,810,779 2,160,783,700 90.01% 2,400,604,044
1999 11,098,693,500 92.71% 11,971,432,711 643,008,800 93.04% 691,110,060 2,257,215,900 92.17% 2,448,970,272
2000 12,227,392,600 88.74% 13,778,393,691 665,511,800 93.78% 709,652,165 2,473,855,100 89.57% 2,761,923,747
2001 13,995,424,800 82.38% 16,989,397,840 770,902,200 82.36% 936,015,299 2,797,877,700 75.35% 3,713,175,448
2002 17,609,309,900 81.81% 21,524,642,342 895,236,300 81.77% 1,094,822,429 3,135,551,700 74.21% 4,225,241,477
2003 22,066,665,100 82.20% 26,845,091,363 1,036,502,100 82.20% 1,260,951,460 3,279,610,800 72.20% 4,542,397,230
2004 27,573,301,100 96.57% 28,552,657,243 1,190,201,200 96.52% 1,233,113,552 3,868,983,500 91.45% 4,230,709,131 (1) Assessed values include landbook values plus all supplements. (2) Ratios are from the Department of Taxation Sales Ratio Study. Since the ratios for the two most current years are not available, estimates from the Real Estate Assessments Office are reported. Note: Where no ratio is calculated because of insufficient sales, the County average is used.
A-6

Table 7: Assessed Values and Estimated Market Values (cont.)
--------------Land------------- -----------------Public Service---------- --------------------Totals--------------------
Use Estimated Estimated Public Estimated Total Total Total Total Value Market Use Market Service Market Use Value Market Estimated Estimated
Year Assm't (3) Assm't Ratio Value Value Equal Ratio Value Assessment (4) Assessment Ratio Use Value Market Value1995 519,823,006 793,374,506 93.70% 554,773,752 846,717,723 835,162,501 93.70% 891,315,369 12,948,175,030 13,221,726,530 92.34% 14,026,999,001 14,318,942,971
1996 515,215,493 783,215,893 93.80% 549,270,248 834,984,961 825,728,680 93.80% 880,307,761 13,309,906,073 13,577,906,473 93.08% 14,301,779,822 14,587,494,534
1997 541,820,016 796,919,916 94.88% 571,058,196 839,924,026 830,430,439 94.88% 875,242,874 13,794,360,537 14,049,460,437 94.13% 14,656,672,829 14,925,538,660
1998 468,798,700 715,493,400 94.44% 496,398,454 757,616,900 866,813,779 94.44% 917,846,018 14,483,764,679 14,730,459,379 93.60% 15,476,513,982 15,737,732,428
1999 421,488,000 675,241,100 93.04% 453,018,057 725,753,547 871,897,315 93.04% 937,120,932 15,292,303,515 15,546,056,615 92.68% 16,501,652,032 16,774,387,522
2000 378,120,400 630,189,000 88.96% 425,045,414 708,395,908 877,768,069 88.96% 986,699,718 16,622,647,969 16,874,716,569 89.07% 18,661,714,734 18,945,065,229
2001 337,530,000 580,149,200 82.36% 409,822,729 704,406,508 887,525,905 82.31% 1,078,272,269 18,789,260,605 19,031,879,805 81.26% 23,126,683,585 23,421,267,364
2002 249,277,100 489,995,100 81.77% 304,851,535 599,235,783 901,202,422 81.77% 1,102,118,652 22,790,577,422 23,031,295,422 80.68% 28,251,676,435 28,546,060,683
2003 227,277,000 584,102,700 82.20% 276,492,701 710,587,226 945,931,059 82.20% 1,150,767,712 27,555,986,059 27,912,811,759 80.88% 34,075,700,465 34,509,794,990
2004 257,785,900 640,776,800 96.52% 267,080,294 663,879,818 1,249,775,269 96.52% 1,294,835,546 34,140,046,969 34,523,037,869 95.96% 35,578,395,766 35,975,195,289 (3) Certain agricultural and forestal land is granted special use value assessment. (4) Figures do not include rollbacks.
A-7

Table 8: History of the Real Estate Tax Base*
Amount Percent Amount Percent Amount Percent Amount PercentResidential 10,370$ 71.60 11,099$ 72.58 12,227$ 73.56 13,995$ 74.49 Apartments 617 4.26 643 4.20 666 4.00 771 4.10 Commercial/Ind. 2,161 14.92 2,257 14.76 2,474 14.88 2,798 14.89 Agricultural 469 3.24 421 2.76 378 2.27 338 1.80
Total Local 13,617 94.02 14,420 94.30 15,745 94.72 17,902 95.28 Public Service 867 5.98 872 5.70 878 5.28 888 4.72
Total 14,484$ 100.00 15,292$ 100.00 16,623$ 100.00 18,789$ 100.00
----------2001--------------------1998---------- ----------1999---------- ----------2000------------
Amount Percent Amount Percent Amount Percent Amount PercentResidential 17,609$ 77.27 22,067$ 80.08 27,573$ 80.77 36,065$ 82.67 Apartments 895 3.93 1,037 3.76 1,190 3.49 1,338 3.07 Commercial/Ind. 3,136 13.76 3,280 11.90 3,869 11.33 4,688 10.75 Agricultural 249 1.09 227 0.82 258 0.76 275 0.63
Total Local 21,889 96.05 26,610 96.57 32,890 96.34 42,365 97.11 Public Service 901 3.95 946 3.43 1,250 3.66 1,262 2.89
Total 22,791$ 100.00 27,556$ 100.00 34,140$ 100.00 43,627$ 100.00
----------2004---------- ----------2005--------------------2002---------- ----------2003----------
*Assessments include original landbook plus supplements. Note: All amounts are in millions. Supplements are estimated for 2005.
A-8

Table 9: Public Service and Commercial/Industrial Assessments As a Percentage of the Tax Base
1996 1997 1998 1999 2000 2001 2002 2003 2004 2005
Public Service 6.20% 6.02% 5.98% 5.70% 5.28% 4.72% 3.95% 3.43% 3.66% 2.89%Commercial/Ind. 14.68% 14.59% 14.92% 14.76% 14.88% 14.89% 13.76% 11.90% 11.33% 10.75%Apartments 3.98% 3.99% 4.26% 4.20% 4.00% 4.10% 3.93% 3.76% 3.49% 3.07%Total 20.88% 20.61% 20.90% 20.46% 20.16% 19.61% 17.71% 15.33% 14.99% 13.64%
Notes: Supplements are included. Supplements for 2005 are estimated.
0%
5%
10%
15%
20%
25%
30%
Perc
enta
ge o
f Tax
Bas
e
1996 1997 1998 1999 2000 2001 2002 2003 2004 2005
Commercial/Ind. Public Service Apartments
A-9

Table 10: Assessment Performance Statistics
Level of Assessments(1)
1995 1996 1997 1998 1999 2000 2001 2002 2003 (4) 2004 (4) Standard (3)
Residential Urban 93.90% 94.06% 95.28% 95.20% 93.43% 89.31% 82.55% 81.81% 82.20% 96.57% 100.00%Residential Suburban 92.50% 92.14% 91.78% 89.90% 88.77% 85.14% 80.98% 81.81% ** ** 100.00% Weighted Average (Residential) 93.66% 93.75% 94.62% 94.20% 92.71% 88.74% 82.38% 81.81% 82.20% 96.57% 100.00%Apartment * * * * * * * * * * 100.00%Commercial/Industrial 85.10% 89.23% 91.06% 90.01% 92.17% 89.57% 75.35% 74.21% 72.20% 91.45% 100.00%Agricultural * * * * * * * * * * 100.00%Overall Median 93.70% 93.80% 94.88% 94.44% 93.04% 88.96% 82.31% 81.77% 82.20% 96.52% 100.00%
Equity of Assessments(2)
1995 1996 1997 1998 1999 2000 2001 2002 2003 2004 Standard (3)
Residential Urban 7.04% 6.75% 5.50% 5.98% 5.91% 6.46% 7.34% 8.52% ** ** 10.00%Residential Suburban 9.69% 9.03% 10.37% 10.41% 10.71% 11.33% 12.55% 13.63% ** ** 10.00% Weighted Average (Residential) 7.49% 7.12% 6.42% 6.81% 6.65% 7.12% 7.91% 9.04% ** ** 10.00%Apartment * * * * * * * * ** ** 15.00%Commercial/Industrial 18.85% 31.07% 17.86% 28.13% 24.59% 22.86% 28.60% 28.61% ** ** 15.00%Agricultural * * * * * * * * ** ** 20.00%Overall Equity 7.77% 7.48% 6.87% 7.50% 7.06% 7.42% 8.25% 9.31% ** ** 10.00%
* Insufficient sales. ** Equity of Assessments data are unavailable. (1) "Assessment Level" refers to the median ratio of assessment to selling price as reported by the Department of Taxation. (2) "Equity of Assessments" is the average percentage sales deviate from the median ratio. (3) Standards are provided by the International Association of Assessing Officers. (4) Estimates utilizing state formula from the Assessments Office.
A-10

Table 11A: Growth and Appreciation
2003 to 2004 2003 --------Appreciation-------- ------------Growth------------ 2004 Total
Landbook Value Amount % Amount % Landbook Value ChangeResidential 21,700,870,500$ 3,971,425,100$ 18.30 1,421,037,600$ 6.55 27,093,333,200$ 24.85 Apartments 1,030,972,900 114,109,900 11.07 33,702,600 3.27 1,178,785,400 14.34 Commercial/Industrial 3,257,842,100 380,578,600 11.68 192,985,400 5.92 3,831,406,100 17.61 Agricultural 225,876,800 46,214,400 20.46 (14,324,500) (6.34) 257,766,700 14.12
Total Landbook 26,215,562,300 4,512,328,000 17.21 1,633,401,100 6.23 32,361,291,400 23.44 Total Supplements 394,492,700 528,961,100 34.09 Public Service* 945,931,059 - - 303,844,210 32.12 1,249,775,269 32.12
Total 27,555,986,059$ 4,512,328,000$ 16.38 1,937,245,310$ 7.03 34,140,027,769$ 23.89 Rollbacks 136,984,621 4,512,328,000 156,609,720 14.33 Tax Exempt 1,695,542,900$ 2,223,993,000$ 31.17 Deferred Use Value 356,825,700$ 382,990,900$ 7.33 Total 29,745,339,280$ 36,903,621,389$ 24.07
2004 to 2005
2004 --------Appreciation-------- ------------Growth------------ 2005 TotalLandbook Value Amount % Amount % Landbook Value Change
Residential 27,093,333,200$ 6,225,083,200$ 22.98 2,226,696,100$ 8.22 35,545,112,500$ 31.20 Apartments 1,178,785,400 81,179,200 6.89 61,273,400 5.20 1,321,238,000 12.08 Commercial/Industrial 3,831,406,100 603,029,100 15.74 224,705,400 5.86 4,659,140,600 21.60 Agricultural 257,766,700 74,890,200 29.05 (57,785,500) (22.42) 274,871,400 6.64
Total Landbook 32,361,291,400 6,984,181,700 21.58 2,454,889,400 7.59 41,800,362,500 29.17 Total Supplements 528,980,300 564,774,400 564,774,400 6.77 Public Service* 1,249,775,269 - - 12,497,753 1.00 1,262,273,022 1.00
Total 34,140,046,969$ 6,984,181,700$ 20.46 3,032,161,553$ 8.88 43,627,409,922$ 27.79 Rollbacks 156,609,720 116,822,430 (25.41) Tax Exempt 2,223,993,000 2,567,585,100 15.45 Deferred Use Value 382,990,900 511,674,900 33.60 Total 36,903,640,589$ 46,823,492,352$ 26.88
* All changes in Public Service are attributed to growth. The 2005 Public Service assessed value is an estimate made by the assessments office. ** 2005 Rollbacks are estimated.
A-11
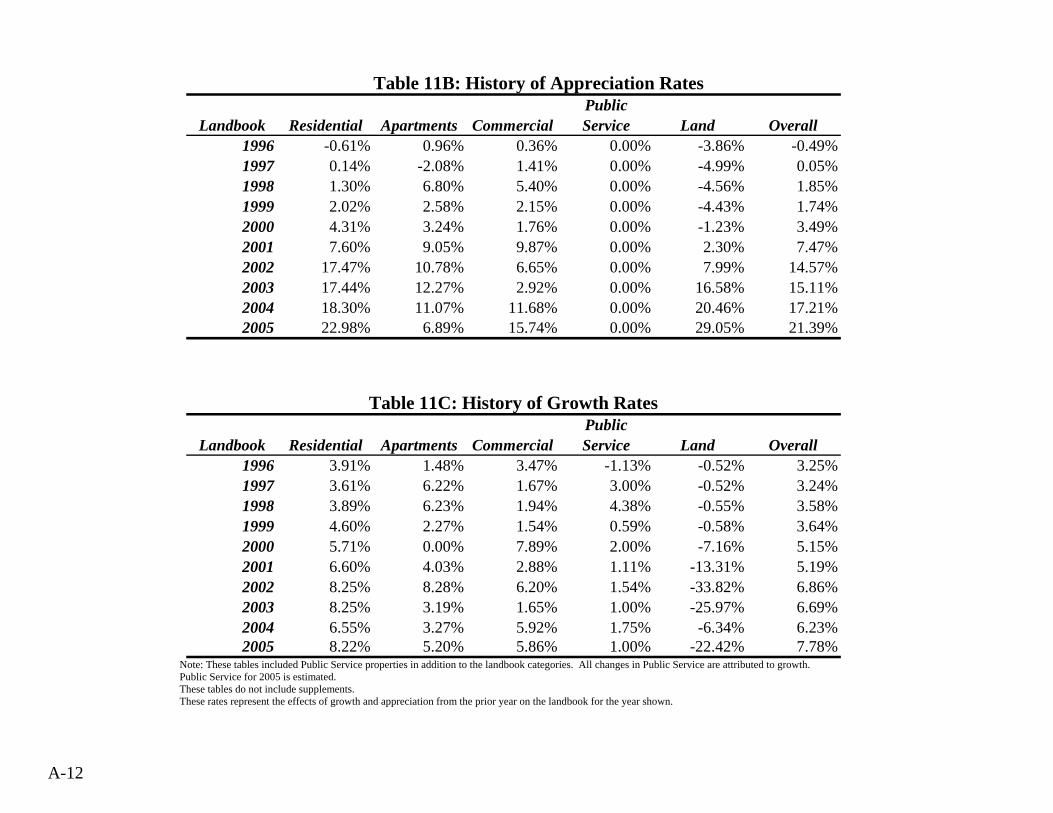
Table 11B: History of Appreciation Rates
PublicLandbook Residential Apartments Commercial Service Land Overall
1996 -0.61% 0.96% 0.36% 0.00% -3.86% -0.49%1997 0.14% -2.08% 1.41% 0.00% -4.99% 0.05%1998 1.30% 6.80% 5.40% 0.00% -4.56% 1.85%1999 2.02% 2.58% 2.15% 0.00% -4.43% 1.74%2000 4.31% 3.24% 1.76% 0.00% -1.23% 3.49%2001 7.60% 9.05% 9.87% 0.00% 2.30% 7.47%2002 17.47% 10.78% 6.65% 0.00% 7.99% 14.57%2003 17.44% 12.27% 2.92% 0.00% 16.58% 15.11%2004 18.30% 11.07% 11.68% 0.00% 20.46% 17.21%2005 22.98% 6.89% 15.74% 0.00% 29.05% 21.39%
Table 11C: History of Growth Rates
PublicLandbook Residential Apartments Commercial Service Land Overall
1996 3.91% 1.48% 3.47% -1.13% -0.52% 3.25%1997 3.61% 6.22% 1.67% 3.00% -0.52% 3.24%1998 3.89% 6.23% 1.94% 4.38% -0.55% 3.58%1999 4.60% 2.27% 1.54% 0.59% -0.58% 3.64%2000 5.71% 0.00% 7.89% 2.00% -7.16% 5.15%2001 6.60% 4.03% 2.88% 1.11% -13.31% 5.19%2002 8.25% 8.28% 6.20% 1.54% -33.82% 6.86%2003 8.25% 3.19% 1.65% 1.00% -25.97% 6.69%2004 6.55% 3.27% 5.92% 1.75% -6.34% 6.23%2005 8.22% 5.20% 5.86% 1.00% -22.42% 7.78%
Note: These tables included Public Service properties in addition to the landbook categories. All changes in Public Service are attributed to growth. Public Service for 2005 is estimated. These tables do not include supplements. These rates represent the effects of growth and appreciation from the prior year on the landbook for the year shown.
A-12
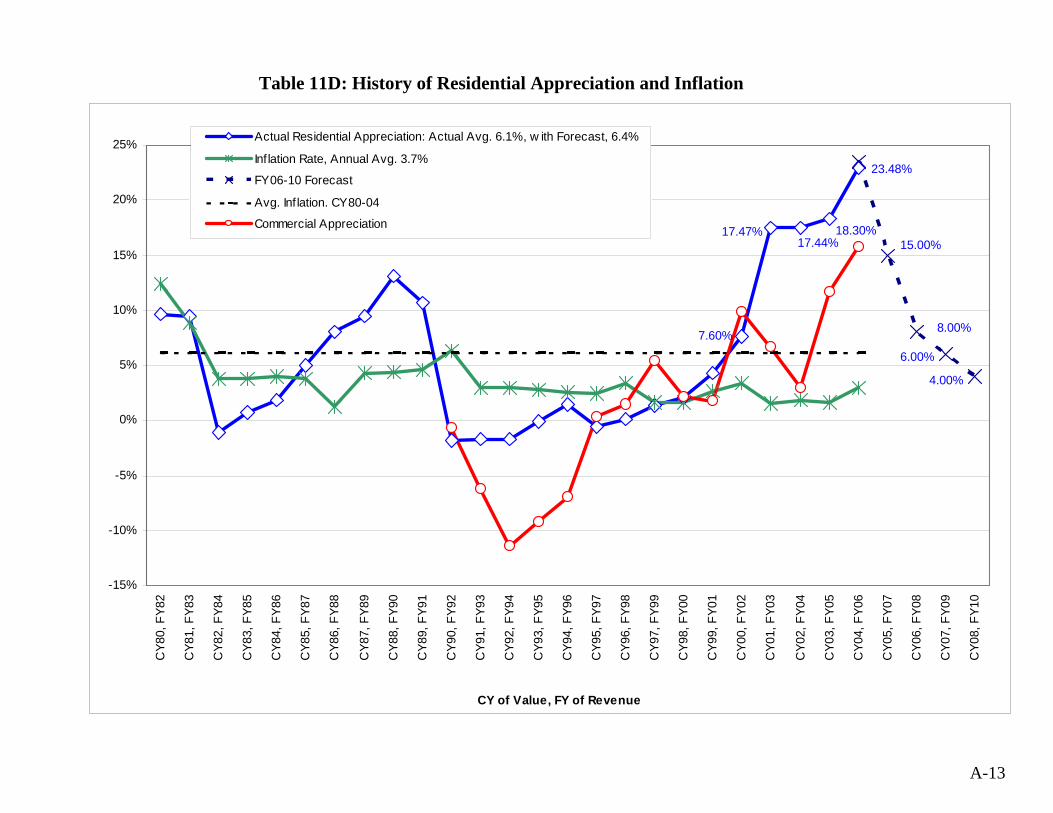
Table 11D: History of Residential Appreciation and Inflation
7.60%
17.44%17.47% 18.30%
4.00%
6.00%
8.00%
15.00%
23.48%
-15%
-10%
-5%
0%
5%
10%
15%
20%
25%C
Y80,
FY8
2
CY8
1, F
Y83
CY8
2, F
Y84
CY8
3, F
Y85
CY8
4, F
Y86
CY8
5, F
Y87
CY8
6, F
Y88
CY8
7, F
Y89
CY8
8, F
Y90
CY8
9, F
Y91
CY9
0, F
Y92
CY9
1, F
Y93
CY9
2, F
Y94
CY9
3, F
Y95
CY9
4, F
Y96
CY9
5, F
Y97
CY9
6, F
Y98
CY9
7, F
Y99
CY9
8, F
Y00
CY9
9, F
Y01
CY0
0, F
Y02
CY0
1, F
Y03
CY0
2, F
Y04
CY0
3, F
Y05
CY0
4, F
Y06
CY0
5, F
Y07
CY0
6, F
Y08
CY0
7, F
Y09
CY0
8, F
Y10
CY of Value, FY of Revenue
Actual Residential Appreciation: Actual Avg. 6.1%, w ith Forecast, 6.4%
Inflation Rate, Annual Avg. 3.7%
FY06-10 Forecast
Avg. Inf lation. CY80-04
Commercial Appreciation
A-13
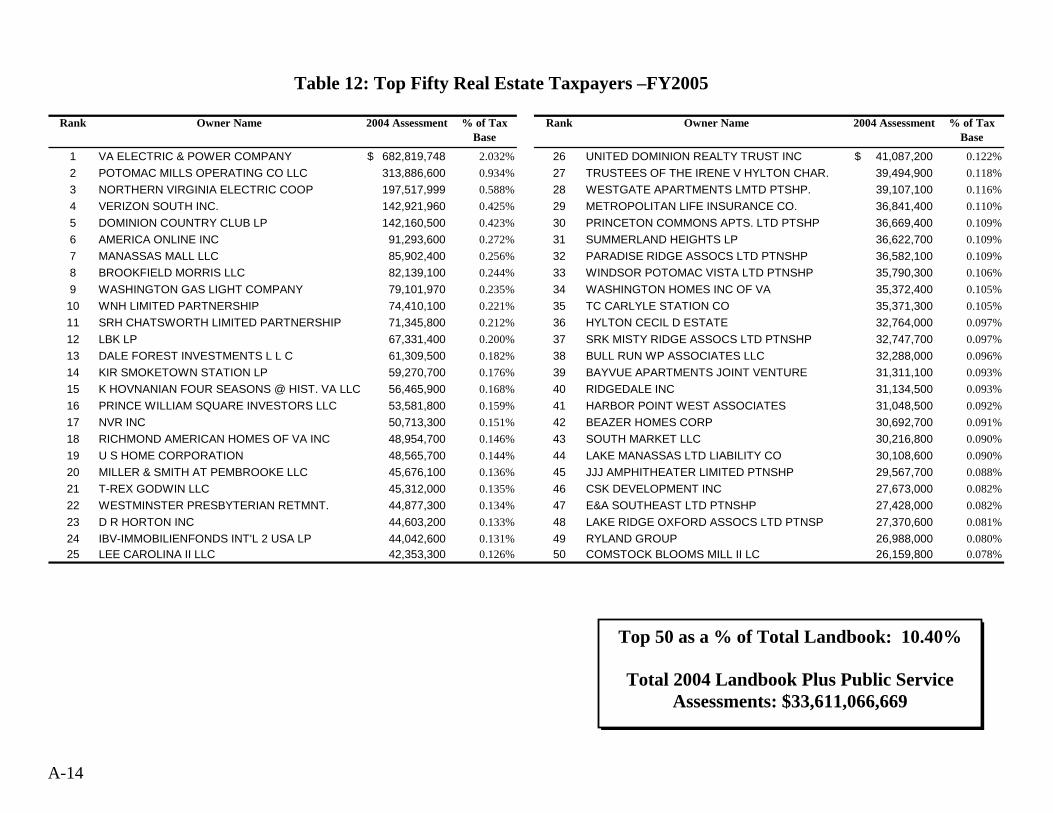
Table 12: Top Fifty Real Estate Taxpayers –FY2005
Rank Owner Name 2004 Assessment % of Tax
BaseRank Owner Name 2004 Assessment % of Tax
Base
1 VA ELECTRIC & POWER COMPANY 682,819,748$ 2.032% 26 UNITED DOMINION REALTY TRUST INC 41,087,200$ 0.122%2 POTOMAC MILLS OPERATING CO LLC 313,886,600 0.934% 27 TRUSTEES OF THE IRENE V HYLTON CHAR. 39,494,900 0.118%3 NORTHERN VIRGINIA ELECTRIC COOP 197,517,999 0.588% 28 WESTGATE APARTMENTS LMTD PTSHP. 39,107,100 0.116%4 VERIZON SOUTH INC. 142,921,960 0.425% 29 METROPOLITAN LIFE INSURANCE CO. 36,841,400 0.110%5 DOMINION COUNTRY CLUB LP 142,160,500 0.423% 30 PRINCETON COMMONS APTS. LTD PTSHP 36,669,400 0.109%6 AMERICA ONLINE INC 91,293,600 0.272% 31 SUMMERLAND HEIGHTS LP 36,622,700 0.109%7 MANASSAS MALL LLC 85,902,400 0.256% 32 PARADISE RIDGE ASSOCS LTD PTNSHP 36,582,100 0.109%8 BROOKFIELD MORRIS LLC 82,139,100 0.244% 33 WINDSOR POTOMAC VISTA LTD PTNSHP 35,790,300 0.106%9 WASHINGTON GAS LIGHT COMPANY 79,101,970 0.235% 34 WASHINGTON HOMES INC OF VA 35,372,400 0.105%10 WNH LIMITED PARTNERSHIP 74,410,100 0.221% 35 TC CARLYLE STATION CO 35,371,300 0.105%11 SRH CHATSWORTH LIMITED PARTNERSHIP 71,345,800 0.212% 36 HYLTON CECIL D ESTATE 32,764,000 0.097%12 LBK LP 67,331,400 0.200% 37 SRK MISTY RIDGE ASSOCS LTD PTNSHP 32,747,700 0.097%13 DALE FOREST INVESTMENTS L L C 61,309,500 0.182% 38 BULL RUN WP ASSOCIATES LLC 32,288,000 0.096%14 KIR SMOKETOWN STATION LP 59,270,700 0.176% 39 BAYVUE APARTMENTS JOINT VENTURE 31,311,100 0.093%15 K HOVNANIAN FOUR SEASONS @ HIST. VA LLC 56,465,900 0.168% 40 RIDGEDALE INC 31,134,500 0.093%16 PRINCE WILLIAM SQUARE INVESTORS LLC 53,581,800 0.159% 41 HARBOR POINT WEST ASSOCIATES 31,048,500 0.092%17 NVR INC 50,713,300 0.151% 42 BEAZER HOMES CORP 30,692,700 0.091%18 RICHMOND AMERICAN HOMES OF VA INC 48,954,700 0.146% 43 SOUTH MARKET LLC 30,216,800 0.090%19 U S HOME CORPORATION 48,565,700 0.144% 44 LAKE MANASSAS LTD LIABILITY CO 30,108,600 0.090%20 MILLER & SMITH AT PEMBROOKE LLC 45,676,100 0.136% 45 JJJ AMPHITHEATER LIMITED PTNSHP 29,567,700 0.088%21 T-REX GODWIN LLC 45,312,000 0.135% 46 CSK DEVELOPMENT INC 27,673,000 0.082%22 WESTMINSTER PRESBYTERIAN RETMNT. 44,877,300 0.134% 47 E&A SOUTHEAST LTD PTNSHP 27,428,000 0.082%23 D R HORTON INC 44,603,200 0.133% 48 LAKE RIDGE OXFORD ASSOCS LTD PTNSP 27,370,600 0.081%24 IBV-IMMOBILIENFONDS INT'L 2 USA LP 44,042,600 0.131% 49 RYLAND GROUP 26,988,000 0.080%25 LEE CAROLINA II LLC 42,353,300 0.126% 50 COMSTOCK BLOOMS MILL II LC 26,159,800 0.078%
Top 50 as a % of Total Landbook: 10.40%
Total 2004 Landbook Plus Public Service Assessments: $33,611,066,669
A-14
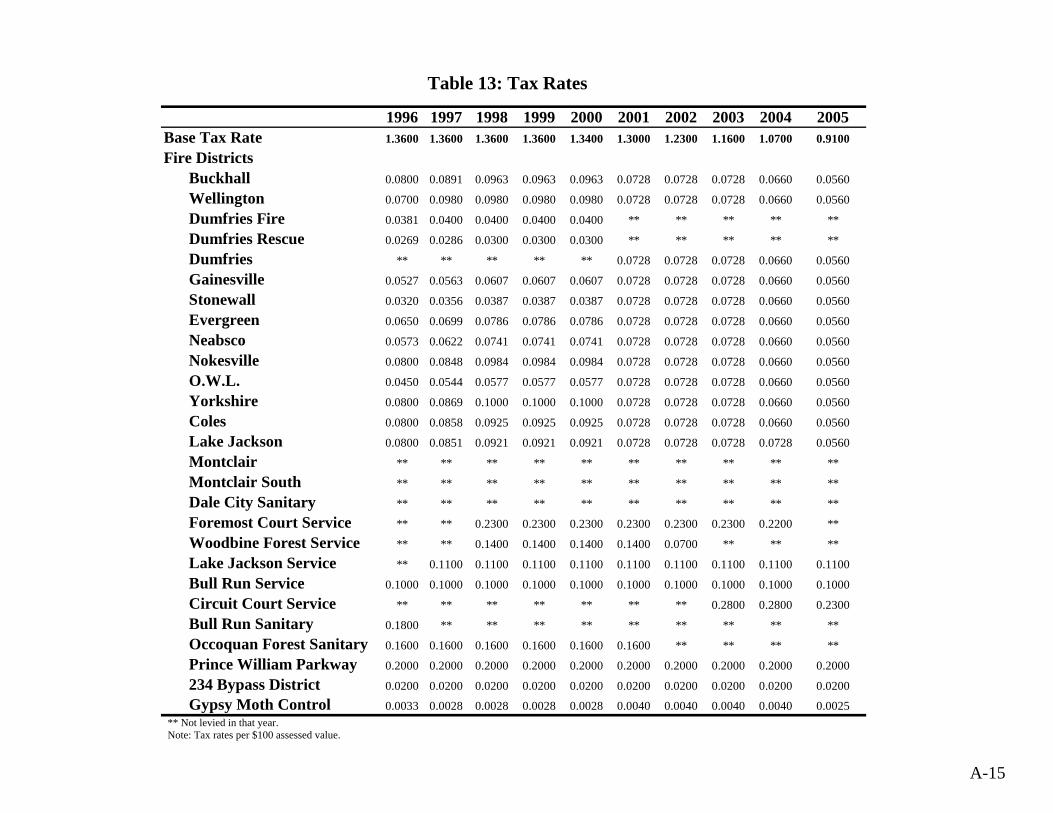
Table 13: Tax Rates
1996 1997 1998 1999 2000 2001 2002 2003 2004 2005Base Tax Rate 1.3600 1.3600 1.3600 1.3600 1.3400 1.3000 1.2300 1.1600 1.0700 0.9100
Fire DistrictsBuckhall 0.0800 0.0891 0.0963 0.0963 0.0963 0.0728 0.0728 0.0728 0.0660 0.0560
Wellington 0.0700 0.0980 0.0980 0.0980 0.0980 0.0728 0.0728 0.0728 0.0660 0.0560
Dumfries Fire 0.0381 0.0400 0.0400 0.0400 0.0400 ** ** ** ** **
Dumfries Rescue 0.0269 0.0286 0.0300 0.0300 0.0300 ** ** ** ** **
Dumfries ** ** ** ** ** 0.0728 0.0728 0.0728 0.0660 0.0560
Gainesville 0.0527 0.0563 0.0607 0.0607 0.0607 0.0728 0.0728 0.0728 0.0660 0.0560
Stonewall 0.0320 0.0356 0.0387 0.0387 0.0387 0.0728 0.0728 0.0728 0.0660 0.0560
Evergreen 0.0650 0.0699 0.0786 0.0786 0.0786 0.0728 0.0728 0.0728 0.0660 0.0560
Neabsco 0.0573 0.0622 0.0741 0.0741 0.0741 0.0728 0.0728 0.0728 0.0660 0.0560
Nokesville 0.0800 0.0848 0.0984 0.0984 0.0984 0.0728 0.0728 0.0728 0.0660 0.0560
O.W.L. 0.0450 0.0544 0.0577 0.0577 0.0577 0.0728 0.0728 0.0728 0.0660 0.0560
Yorkshire 0.0800 0.0869 0.1000 0.1000 0.1000 0.0728 0.0728 0.0728 0.0660 0.0560
Coles 0.0800 0.0858 0.0925 0.0925 0.0925 0.0728 0.0728 0.0728 0.0660 0.0560
Lake Jackson 0.0800 0.0851 0.0921 0.0921 0.0921 0.0728 0.0728 0.0728 0.0728 0.0560
Montclair ** ** ** ** ** ** ** ** ** **
Montclair South ** ** ** ** ** ** ** ** ** **
Dale City Sanitary ** ** ** ** ** ** ** ** ** **
Foremost Court Service ** ** 0.2300 0.2300 0.2300 0.2300 0.2300 0.2300 0.2200 **
Woodbine Forest Service ** ** 0.1400 0.1400 0.1400 0.1400 0.0700 ** ** **
Lake Jackson Service ** 0.1100 0.1100 0.1100 0.1100 0.1100 0.1100 0.1100 0.1100 0.1100
Bull Run Service 0.1000 0.1000 0.1000 0.1000 0.1000 0.1000 0.1000 0.1000 0.1000 0.1000
Circuit Court Service ** ** ** ** ** ** ** 0.2800 0.2800 0.2300
Bull Run Sanitary 0.1800 ** ** ** ** ** ** ** ** **
Occoquan Forest Sanitary 0.1600 0.1600 0.1600 0.1600 0.1600 0.1600 ** ** ** **
Prince William Parkway 0.2000 0.2000 0.2000 0.2000 0.2000 0.2000 0.2000 0.2000 0.2000 0.2000
234 Bypass District 0.0200 0.0200 0.0200 0.0200 0.0200 0.0200 0.0200 0.0200 0.0200 0.0200
Gypsy Moth Control 0.0033 0.0028 0.0028 0.0028 0.0028 0.0040 0.0040 0.0040 0.0040 0.0025 ** Not levied in that year. Note: Tax rates per $100 assessed value.
A-15

This page intentionally left blank

B-1
Addenda

This page intentionally left blank
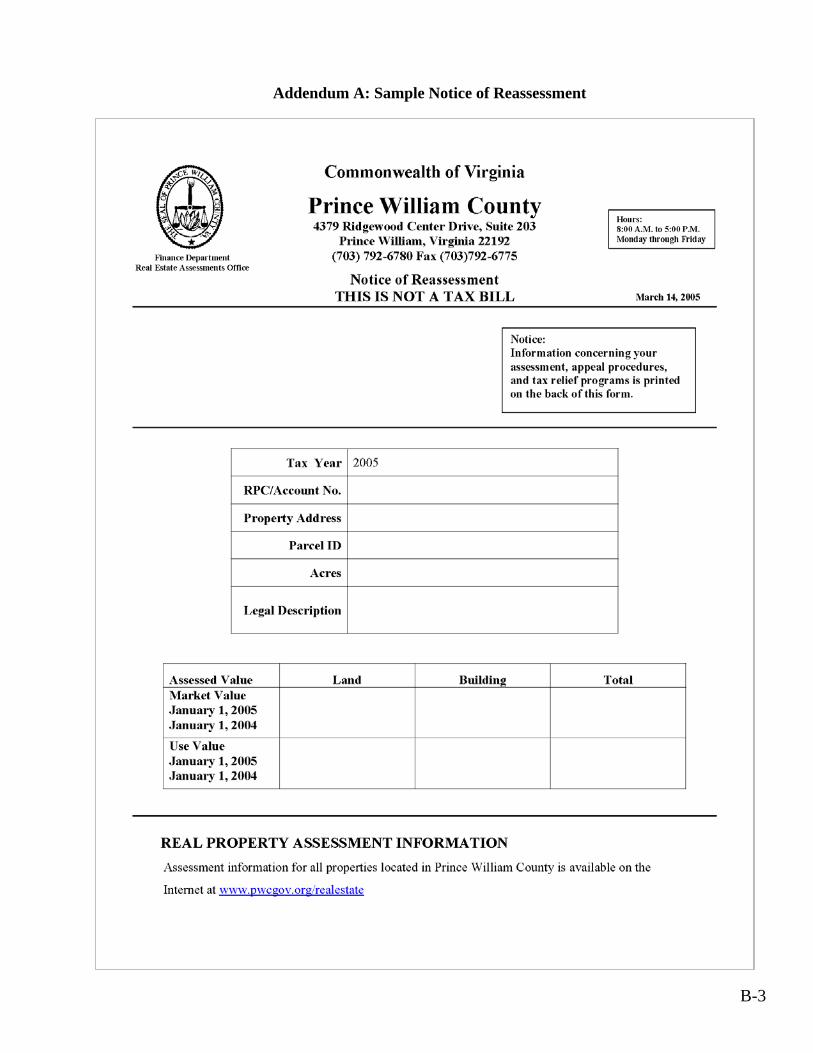
B-3
Addendum A: Sample Notice of Reassessment

B-4
Addendum A: Sample Notice of Reassessment (cont.)
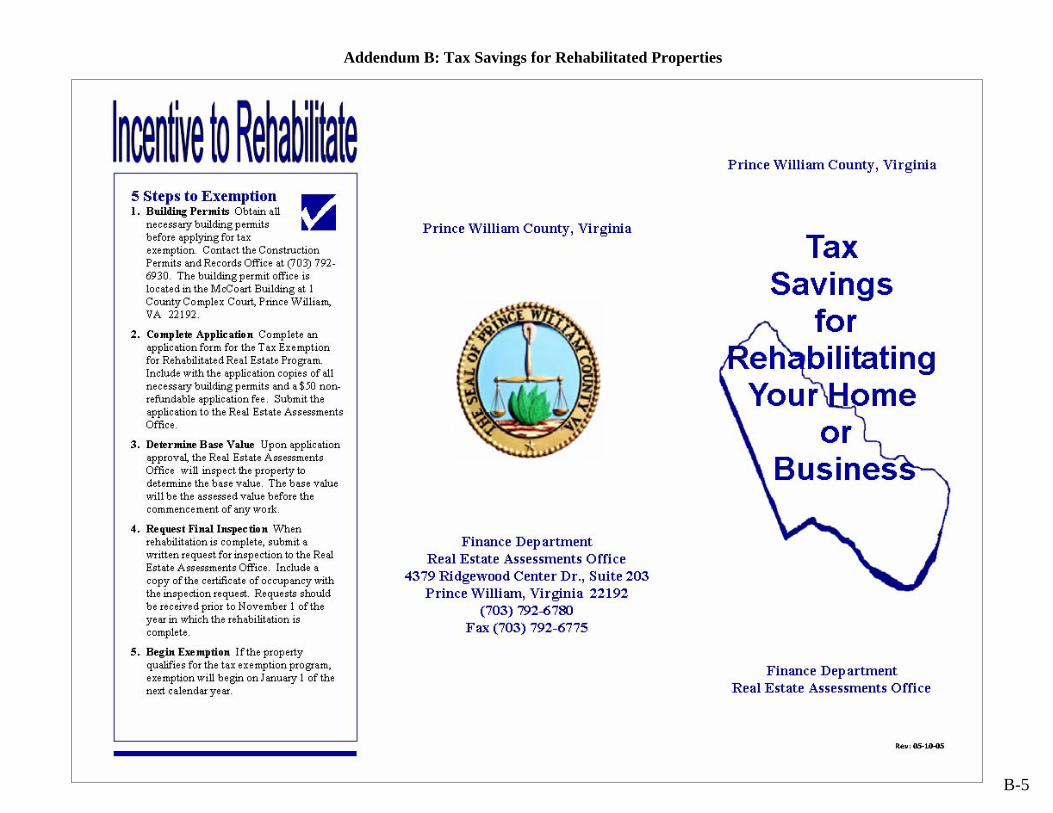
B-5
Addendum B: Tax Savings for Rehabilitated Properties

B-6
Addendum B: Tax Savings for Rehabilitated Properties (cont.)
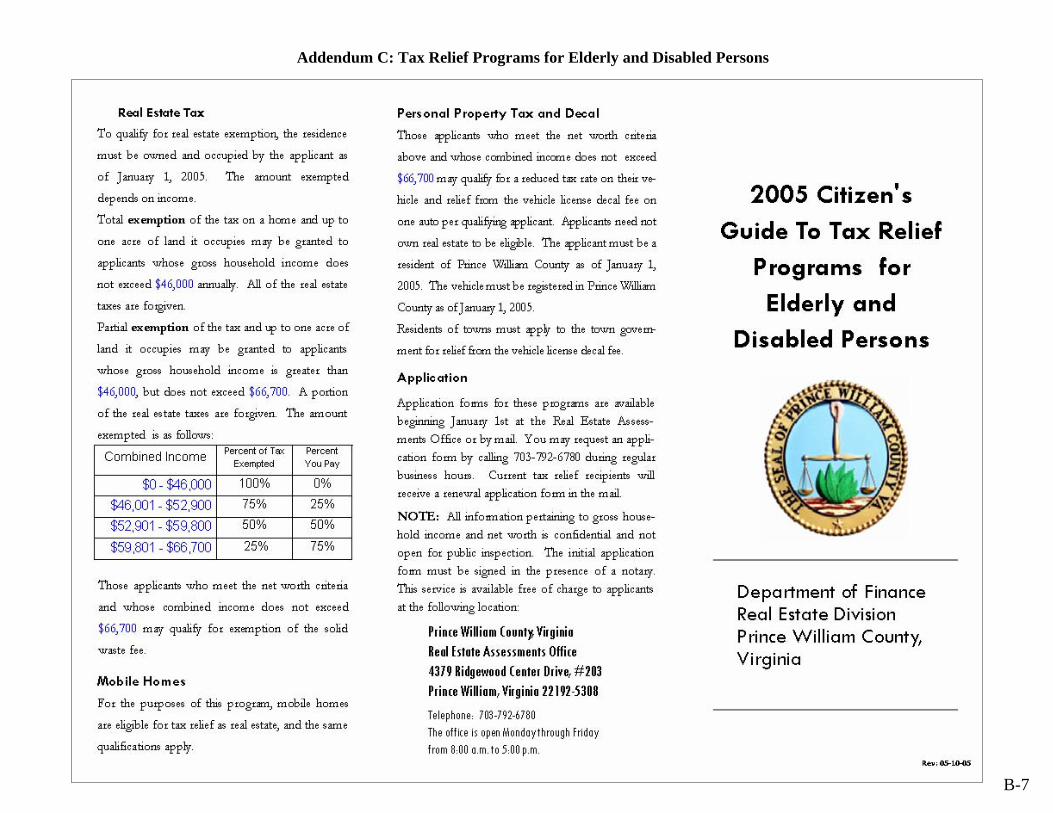
B-7
Addendum C: Tax Relief Programs for Elderly and Disabled Persons
B-8
Addendum C: Tax Relief Programs for Elderly and Disabled Persons (cont.)

B-9
B-9
Addendum D: Sample Tax Bil
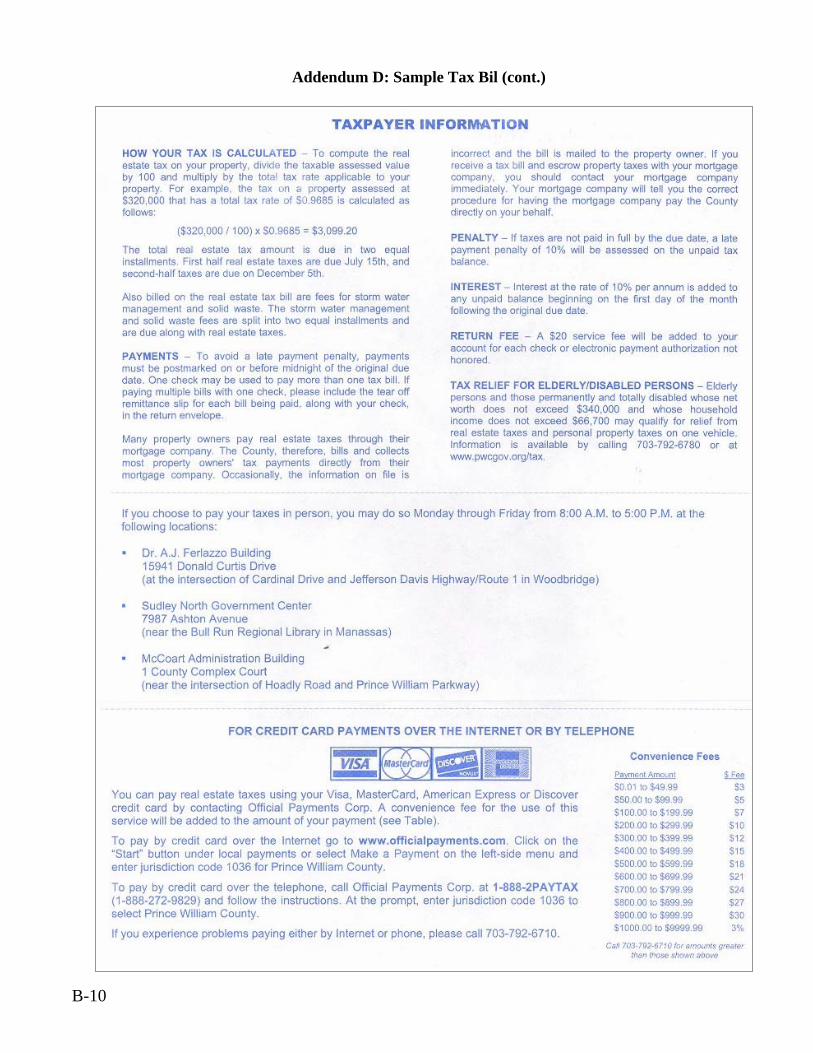
B-10
Addendum D: Sample Tax Bil (cont.)

This page intentionally left blank

This page intentionally left blank