REAL EFFECTIVE EXCHANGE RATE AND UNEMPLOYMENT RATE: …
54
Clemson University TigerPrints All eses eses 8-2013 REAL EFFECTIVE EXCHANGE TE AND UNEMPLOYMENT TE: THE DIFFERENCE BETWEEN RE-EXPORTING AND NON-RE-EXPORTING COUNTRIES Xiaolong He Clemson University, [email protected] Follow this and additional works at: hps://tigerprints.clemson.edu/all_theses Part of the Economics Commons is esis is brought to you for free and open access by the eses at TigerPrints. It has been accepted for inclusion in All eses by an authorized administrator of TigerPrints. For more information, please contact [email protected]. Recommended Citation He, Xiaolong, "REAL EFFECTIVE EXCHANGE TE AND UNEMPLOYMENT TE: THE DIFFERENCE BETWEEN RE- EXPORTING AND NON-RE-EXPORTING COUNTRIES" (2013). All eses. 1716. hps://tigerprints.clemson.edu/all_theses/1716
Transcript of REAL EFFECTIVE EXCHANGE RATE AND UNEMPLOYMENT RATE: …
Clemson UniversityTigerPrints
All Theses Theses
8-2013
REAL EFFECTIVE EXCHANGE RATE ANDUNEMPLOYMENT RATE: THEDIFFERENCE BETWEEN RE-EXPORTINGAND NON-RE-EXPORTING COUNTRIESXiaolong HeClemson University, [email protected]
Follow this and additional works at: https://tigerprints.clemson.edu/all_theses
Part of the Economics Commons
This Thesis is brought to you for free and open access by the Theses at TigerPrints. It has been accepted for inclusion in All Theses by an authorizedadministrator of TigerPrints. For more information, please contact [email protected].
Recommended CitationHe, Xiaolong, "REAL EFFECTIVE EXCHANGE RATE AND UNEMPLOYMENT RATE: THE DIFFERENCE BETWEEN RE-EXPORTING AND NON-RE-EXPORTING COUNTRIES" (2013). All Theses. 1716.https://tigerprints.clemson.edu/all_theses/1716
REAL EFFECTIVE EXCHANGE RATE AND UNEMPLOYMENT RATE:
THE DIFFERENCE BETWEEN RE-EXPORTING
AND NON-RE-EXPORTING
COUNTRIES
A Thesis
Presented to
the Graduate School of
Clemson University
In Partial Fulfillment
of the Requirements for the Degree
Master of Arts
Economics
by
Xiaolong He
August 2013
Accepted by:
Dr. Michal Jerzmanowski, Committee Chair
Dr. Curtis Simon
Dr. Dan Wood

ii
ABSTRACT
In this paper, I examine the relationship between unemployment rate and real
effective exchange rate in several countries from 1994 to 2009. The analysis shows that
most of countries have a negative relationship between those two factors, which implies
increase of exchange rate can improve employment rate in an economy. However, re-
exporting countries like the Netherlands, Singapore and Hong Kong has a less negative
relationship than other countries. I hypothesize that those results are caused by the
different elasticity of demand for imports.

iii
DEDICATION
I would like to dedicate this thesis to my family, for their support and
encouragement.

iv
ACKNOWLEDGMENTS
First of all, I would like thank my adviser Michal Jerzmanoski. He always
answers my questions patiently and carefully. He taught me how to build an economic
model and how to use it.
I also thank to Matthew Watkins who is a faculty in Clemson University. He
helped me revise my thesis.

v
TABLE OF CONTENTS
Page
TITLE PAGE .................................................................................................................... i
ABSTRACT ..................................................................................................................... ii
DEDICATION ................................................................................................................ iii
ACKNOWLEDGMENTS .............................................................................................. iv
LIST OF TABLES ......................................................................................................... vii
LIST OF FIGURES ...................................................................................................... viii
CHAPTER
I. INTRODUCTION ......................................................................................... 1
II. LITERATURE REVIEW .............................................................................. 5
III. DEFINITION OF KEY WORDS .................................................................. 6
3.1 What is real effective exchange rate .................................................. 6
3.2 What are re-exports ............................................................................ 7
3.3 What countries are re-exports countries in the world ........................ 8
3.4 What characteristics of those typical re-exporting countries ............. 8
IV. THEORIES .................................................................................................. 10
4.1 AD-AS Model .................................................................................. 10
4.2 Exchange rate and trade ................................................................... 11
V. ANALYSIS .................................................................................................. 14
VI. DATA AND MODELS ............................................................................... 17
6.1 Data Sources .................................................................................... 17
6.2 Models .............................................................................................. 17
6.3 Methodologies .................................................................................. 18
VII. RESULTS .................................................................................................... 21
vi
Table of Contents (Continued)
Page
VIII. CONCLUSIONS AND FUTHER DISCUSSIONS ..................................... 24
8.1 Conclusions ...................................................................................... 24
8.2 Further Discussions .......................................................................... 24
APPENDICES ............................................................................................................... 26
A: Tables ........................................................................................................... 27
B: Figures .......................................................................................................... 39
C: Computation of Chow Test Statistics .......................................................... 42
REFERENCES .............................................................................................................. 45
vii
LIST OF TABLES
Table Page
1.1 Direct Exports and Re-exports of Chinese Goods, 1988-1999 ..................... 25
1.2 Trade volume (Net Exports+Imports) for re-exporting countries, The
Netherlands, Singapore, Belgium, Hong Kong, Germany and USA
from 1994 to 2000 .................................................................................. 26
1.3 Estimation Results for 16 Countries ............................................................. 27
1.4 Summary for 16 countries ............................................................................. 28
1.5 Estimation Results for 25 Countries but do not add interest rate ................. 29
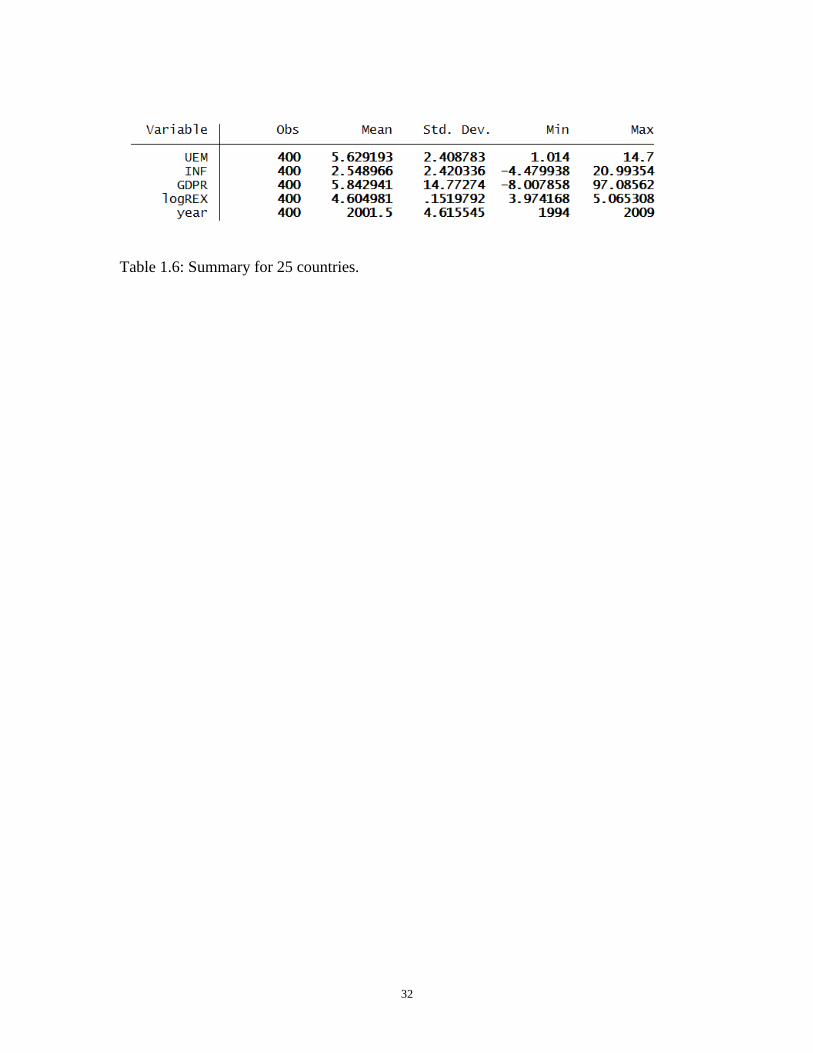
1.6 Summary for 25 countries ............................................................................. 30
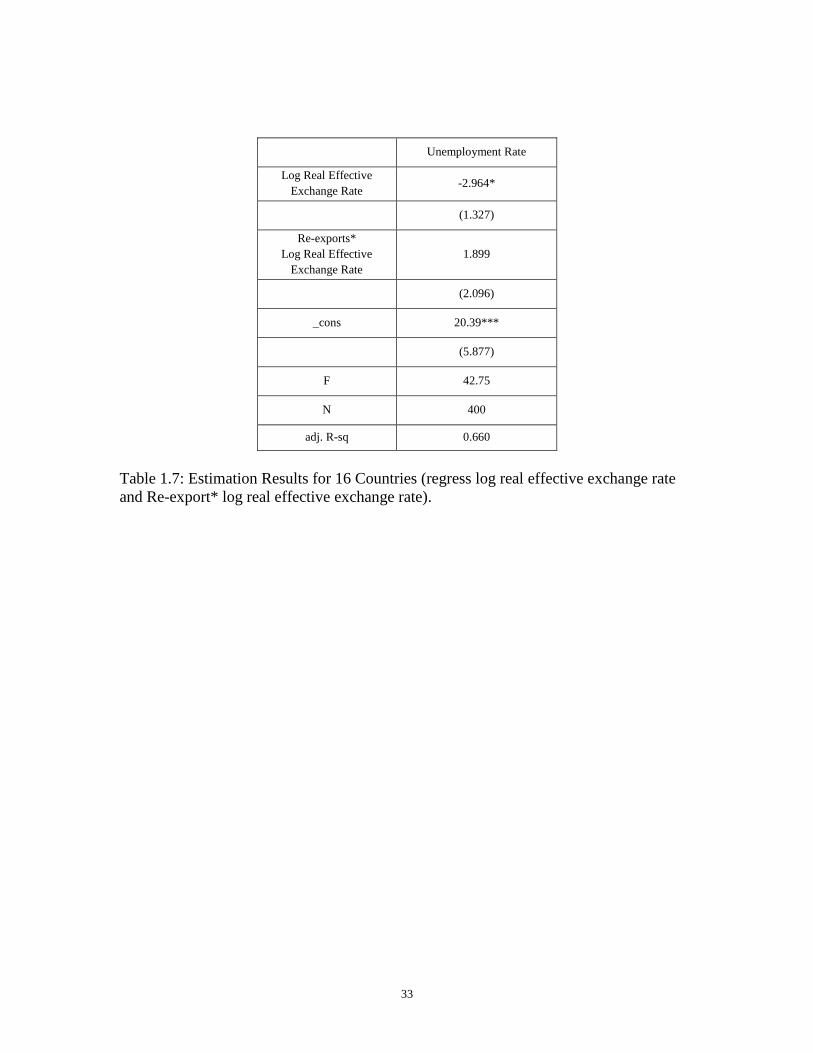
1.7 Estimation Results for 16 Countries (regress log real effective
exchange rate and Re-export* log real effective exchange rate) ......... 31
1.8 Summary for 16 countries ............................................................................. 32
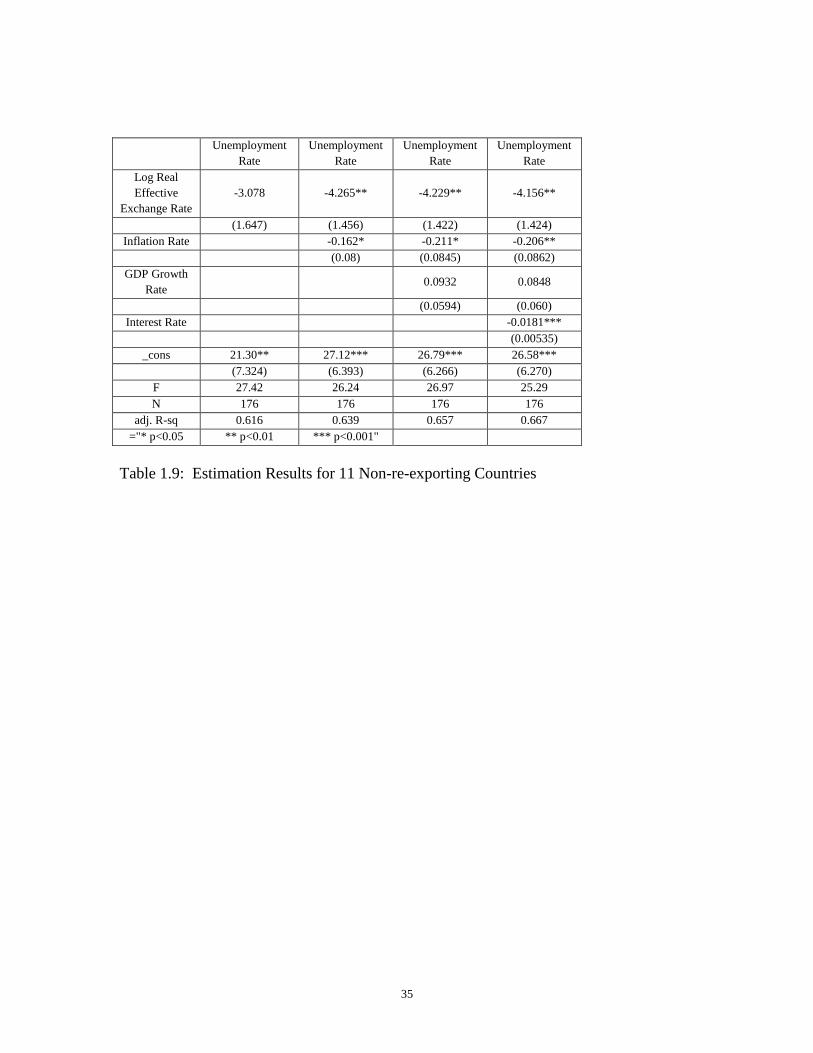
1.9 Estimation Results for 11 Non-re-exporting Countries ................................ 33
2.0 Summary for 11 countries ............................................................................. 34
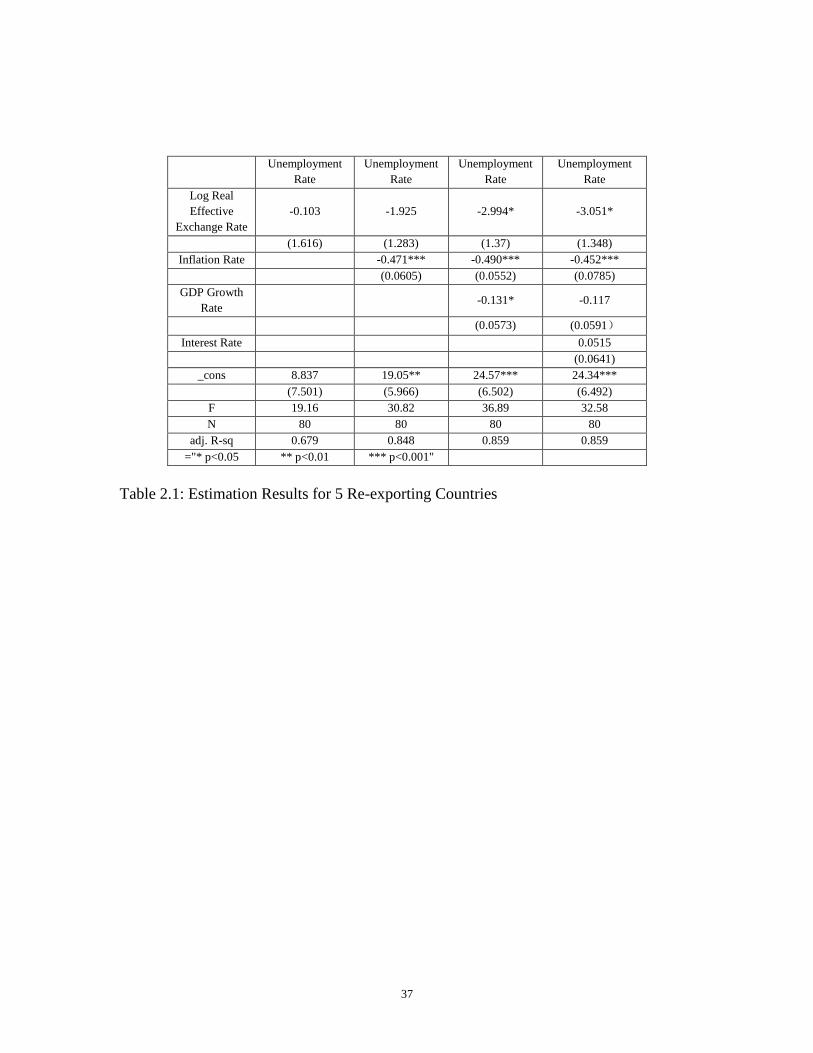
2.1 Estimation Results for 5 Re-exporting Countries ........................................ 35
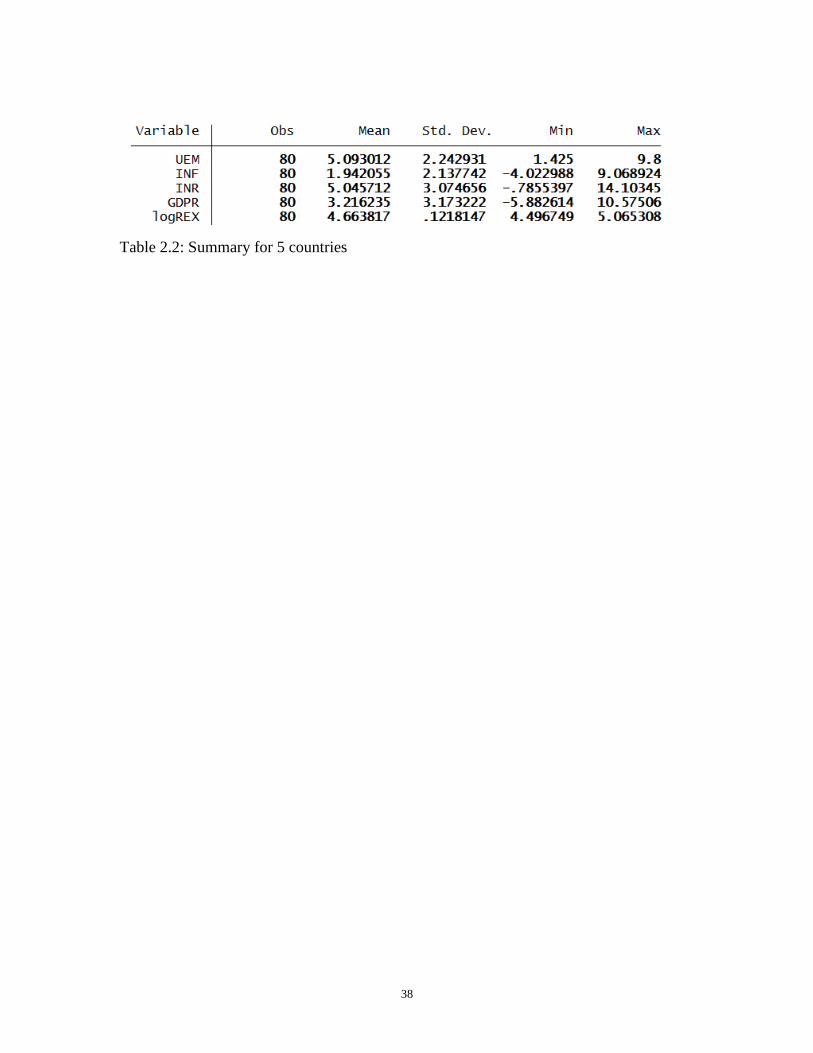
2.2 Summary for 5 countries .............................................................................. 36
viii
LIST OF FIGURES
Figure Page
1.1 ........................................................................................................................... 37
1.2 ........................................................................................................................... 37
1.3 ........................................................................................................................... 37

1
CHAPTER ONE
INTRODUCTION
What effects do movements in the real exchange rate have on unemployment rate
is uncertain. The US politicians often improve their positions by attacking exchange rate.
The common idea that they usually use is Chinese workers replace American workers
because of the depreciation policy of China government so that Chinese labor force
become cheaper. However, Charles Evans, the chief of Chicago Federal Reserve, was
interviewed by the journalists of China Economics Weekly said" It is very hard to draw
the conclusion that unemployment rate will decrease a lot when there is an appreciation
of Chinese currency.”1 In addition, Robert C. Feenstra also points out the labor
productivity of American workers get improved when low-productivity goods are
distributed to developing countries with outsourcing. The unemployment rate will come
back to natural unemployment rate in the long run after the temporary shock like
exchange rate. (Feenstra, 2009) Therefore, the relationship between exchange rate and
unemployment rate is not clear.
In this article, I would like focusing on studying the relationship between
unemployment rate and real effective exchange rate, by adding some major factors that
are important on country’s economic progress such as inflation rate, interest rate, GDP
growth rate. At the same time, a panel data is used from 1994 to 2010 and 25 countries is
1 Jialong Tan and Xuelian Song who is journalist of China Economics Weekly report that
the exchange rate does not have relationship with unemployment rate of USA in 2010.

2
included. The conclusion is that real effective exchange rate has a negative influence on
unemployment rate from the general data.
Afterwards, I test if there are different relationships between real effective
exchange rate on unemployment rate for re-exporting and non-re-exporting countries.
According to theory of international trade, devaluation of currency of home country
increases exports of home goods. However, devaluation of currency of home country has
an unsure relationship on imports of home goods. The unsure relationship is decided by
the elasticity for imports. Therefore, Net exports (Imports- exports) are unsure if there is
a change in real exchange rate.
I think the elasticity for imports is different for re-exporting countries and non-re-
exporting countries, holding other factors fixed. For instance, Entrepot economics such as
Hong Kong and Singapore are an important feature of global exchange. (Findlay and
Wellisz, 1993: Sung, 1997) These trading centers specialize in matching buyers and
sellers in different markets. In particular, they intermediate a substantial fraction of trade
between Asia and the rest of the world. In 1998, the ratio of total trade to GDP was 259%
in Hong Kong and 256% in Singapore. Hong Kong, a typical re-exporting country,
imports goods from China and then distributes them to a final distribution. In 1996, re-
exports of Chinese goods equaled 52% of Hong Kong GDP. (Feenstra Hanson, 2000) Re-
exports play a very important role for economy of Hong Kong. Therefore, different from
normal trades, entrepot activities have a strong demand for imports from origin, which
makes real effective exchange rate has different effect on unemployment rate for re-
export countries.
3
I assume other factors in two kinds of countries are same like resources and
technology. Same technology level can ensure the benefit from processing is same. Same
amount of resources can ensure same demand for imports to meet domestic uses. In a
simple example, a re-exporting country seems like an intermediary company. The
company specialize importing goods from some companies and then selling those goods
to other companies. The value of money the company holds is very critical because it
decides how many goods the company can import to make markups. On the contrary,
there is no extra profit for non-re-exporting countries to import besides satisfying
domestic consumptions and process, because non-re-exporting countries cannot make
more profits through re-exports. Since resources and technology are same for two kinds
of countries, the demands for imports to meet domestic uses are same. But re-exporting
countries can gain more benefits through re-exports. Hence, I believe re-exporting
countries have a stronger demand for imports than non-re-exports by holding other
factors same.
The result from general data is that there is an obvious difference of real effective
exchange rate on unemployment. The coefficient for re-exporting countries is less
negative than non-re-exporting countries.
This article is composed by several chapters. The first chapter is this introduction.
In the second chapter, I give a brief literature review. In the third chapter, I describe the
definition and implication of key words. In the next chapter, I discuss formal theories and
how they influence the relationship between exchange rate and unemployment rate. The
analysis is presented in chapter 5, which applies to explain how exchange rate affects

4
unemployment rate in different ways for re-exporting countries and non-re-exporting
countries. The empirical specifications are in section 6, and the results from that are
showed in section 7. Conclusions are drawn in the last section 8.
5
CHAPTER TWO
LITERATURE REVIEW
There are a lot of literature focuses on this topic of the relationship between real
effective exchange rate and unemployment rate and among other variables. Chimnani,
Hina, Bhutto, Niaz, Butt, Falauddin, Shaikh Sheeraz and Devi, Warcha pointed out
exchange rate has positive impact on unemployment rate in ten Asian countries (2012).
Filztekin found a positive relationship of exchange rate and unemployment rate. (2004)
Chang and Shen for Taiwan, South Korea and Singapore and Burgess (2011) and Knetter
for G-7 countries (2008) found a positive relationship between exchange rate and
unemployment rate.
On the other hand, in recent decades, re-exports has been increasing in some
countries because of world openness in trade. By now, more than 50% Dutch
manufacturing exports are re-exports. In Germany, re-exports account for more 15% of
total exports, in Singapore for more than 50%, and in Hong Kong around 95 %.( Mellens,
Noordman,Verbruggen, 2007) Feenstra also underlined the importance of re-exports in
some countries. Hong Kong plays a role that distributes a large fraction of China’s
exports including customs, insurance, and freight charges since 1997. Re-exports of
Chinese goods are much more expensive when they leave Hong Kong than when than
enter. (Feensta, Hanson, 2000)
6
CHAPTER THREE
DEFINITION OF KEY WORDS
2.1 What is real effective exchange rate?
Effective Exchange Rate is an index that shows the relative strength of a currency
relative to a basket of other currencies. The definition is “weighted average value of a
country's currency relative to all major currencies being traded within an index or pool of
currencies. The value is determined by the importance a home country places on all other
currencies traded within the pool, as measured by the balance of trade, taking account of
price indicates. ”2 Real effective exchange rate is the nominal effective exchange
rate3divided by a price deflator or index of costs. The difference between real and
nominal effective exchange rate is the real effective exchange rate considering the price
deflator. On the other hand, the difference between real effective exchange rate and real
exchange rate is that real effective exchange rate is a weighted average of exchange rate
of home country versus oversea countries’ currencies, considering the weight for each
foreign country equal to its share in trade. In short, the real effective rate considers the
multilateral trade. While, the real exchange rate is only focusing on bilateral relationship.
I introduce this vector in my article to replace real exchange rate, since I think real
effective exchange rate is more authoritative to study the effect of exchange rate on trade.
For instance, a country named A has trade relationships with B & C. And the trade share
with B is 90% the trade share with C is only 10%. In this case, Country B currency
2 This definition is from Investopedia and National Institution of Statistics and
Economics Studies 3 Weighted average of several foreign currencies.
7
definitely will has a bigger effect on trade than country C with the same change of
currency and the effective exchange rate can reflect the true results directly. On the
contrary, if we only focus on the real exchange rate, we may not get the true result caused
by the change of currency. In the trade of world, Hong Kong could be a good reason to
explain how important of real effective exchange rate and why I use real effective
exchange rate to replace real exchange rate. Hong Kong holds a special place regard to
re-exports because of its special in relation to China.(Noordman and Verbruggen, 2007)
In 1996, re-exports of Chinese goods equaled 52% of Hong Kong GDP. (Hsieh and Woo,
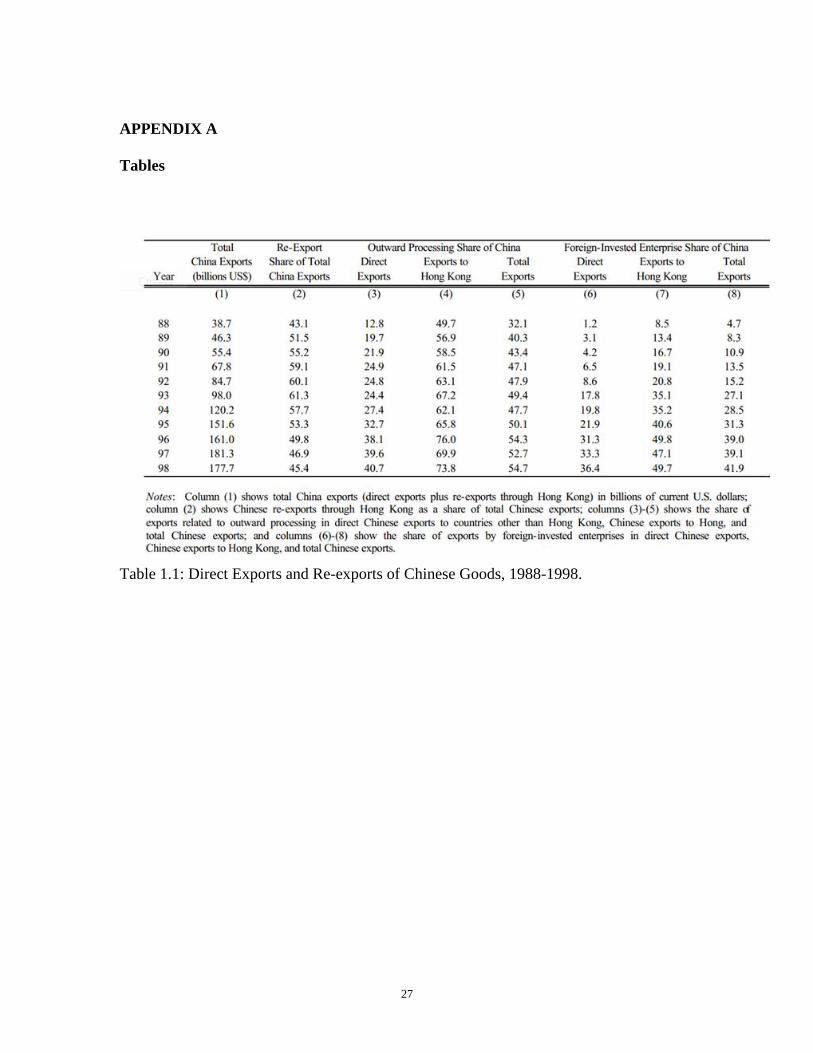
1999) Eyeballing Table 1.1 column (2), we see Chinese re-exports through Hong Kong is
a big share of total Chinese exports. In this arrangement, traders in Hong Kong import
goods from China and then distribute them to a destination. (Feenstra and Hanson, 2000)
It is believed that Hong Kong is very dependent on China on trade. Meanwhile, there is
no doubt that Hong Kong uses Renminbi to import goods, which is Chinese currency. In
this situation, it is nonsense to study influences on unemployment rate from other
countries currency if those countries own too little trade share with Hong Kong. Even
though there is an obvious change of the value of those currencies related to Hong Kong
dollars, the trade volume between Kong and those countries will not change a lot,
because of the little share of them. As a result, I use real effective exchange rate to
replace real exchange rate because it consider comprehensively trade relationships with
whole countries rather than just one country.
2.2 What are re-exports?

8
Re-exports are goods which are imported, undergo little or no processing, and are
then exported again, matching the buyers the sellers in different markets. (Feenstra and
Hanson 2000) On the other hand, the definition from IMF is “Exports of foreign goods in
the same state as previously imported”. Statistic Netherlands (CBS) gives a more
concrete definition “re-exports as goods which have been imported into the Netherlands
and leave the country again after no (or virtually no) further processing. At the same time,
they include goods among domestically-produced exports if these goods undergo some
processing and consequently are given a new six-digit product code.” However, there is
still no international agreement about the definition on the definition of the re-exports.
Some people think that “If computers are imported and exported again with only user
manuals in the language of the destination country added to the boxes, this is intuitively
clearly a case of re-exports.” (Mellens, Noordman and Verbruggen, 2007) Because of this
unclear and different definition from different countries, our data on re-exports may be
not so accurate.
2.3 What countries are re-exports countries in the world?
Re-exporting country is a country has a large share of re-exports in total exports
of goods. Scholars point out large re-exporting countries include Belgium, Germany,
United States, Netherlands, Singapore and so on that have more than 10 percent of their
exports are re-exports.(Gehlhar, Narayanan and Walmsley, 2008) Here, I use those
countries to stand for re-exporting countries in the paper.
2.4 What characteristics of those typical re-exporting countries?
9
Although Belgium, Germany, USA, Singapore, Hong Kong, the Netherlands are
re-exporting countries. However, trade plays a much more important in Singapore, Hong
Kong, Belgium compared with USA and Germany. Singapore, Hong Kong, Belgium and
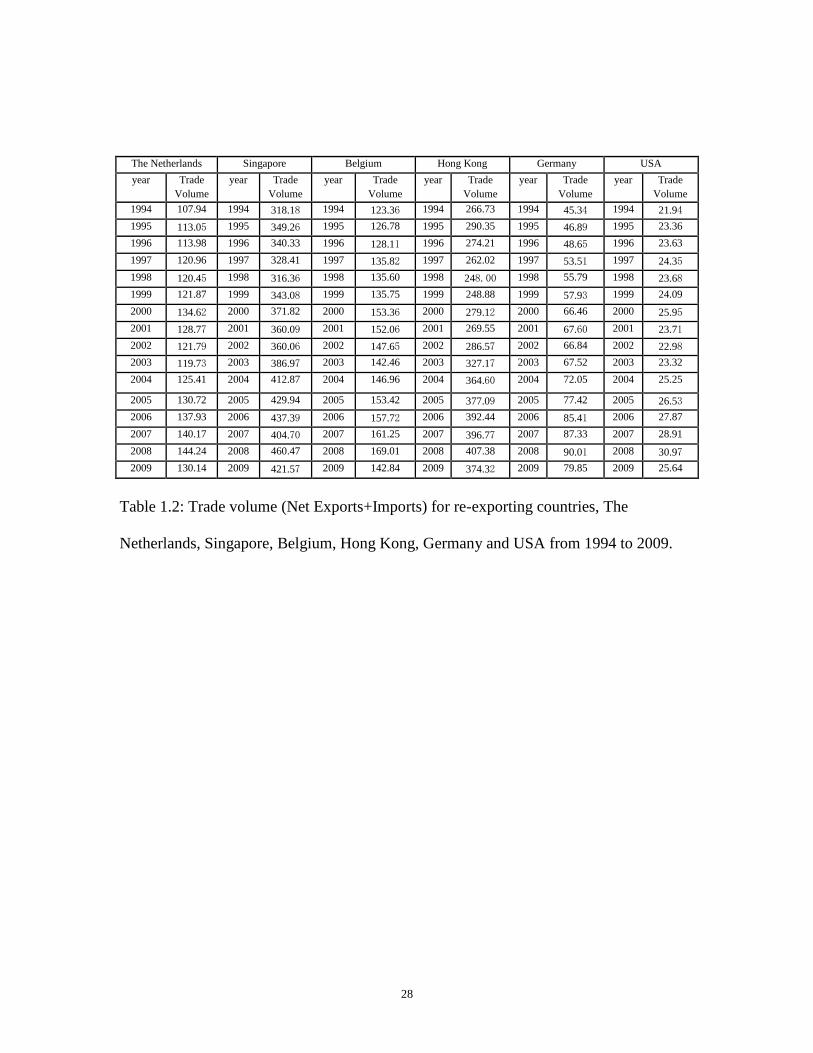
the Netherlands that are typical re-exporting countries have an extreme big trade volume
that is over than 100% except German and USA. (Table 1.2) Trade volume is the “sum of
exports and imports of goods and services as a share of gross domestic product.”4 We
may claim that this big trade volume means that trade plays a very important role in those
countries. In addition, most of re-exports countries are high income countries. Singapore
has the top GDP per capita in the world as well as the other re-exports countries have.
4 This definition is from World Bank.
10
CHAPTER FOUR
THEORIES
3.1 AD-AS Model
According to open Keynesian theory (Y=C+I+G+NX) (Keynes, 1936), net
exports affect aggregate demand positively. But increased aggregate demand does not
mean higher employment rate.
Short run
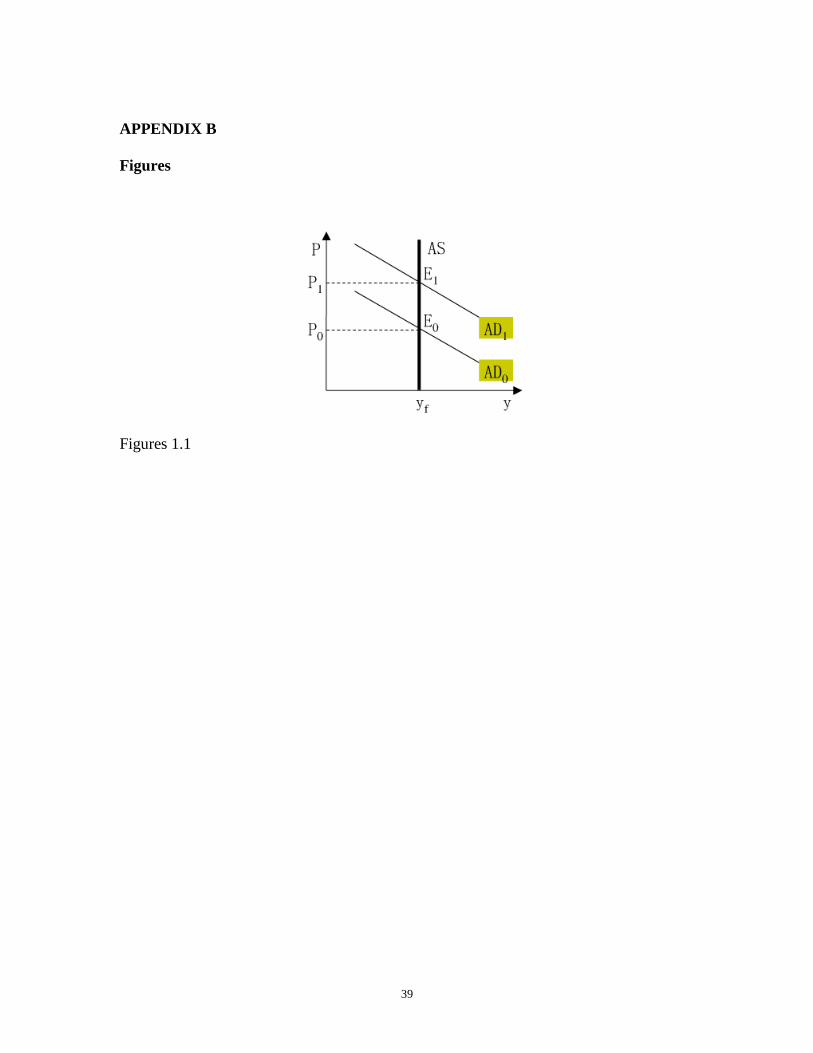
a. Classic AD-AS Model
No matter in classic AD-AS Model or Keynesian Model, AD (Aggregate Demand)
curve is a downward curve. However, AS (Aggregate Supply) curves are different each
other. In classic AD-AS Model, (Glanville and Alan, 2011), the assumptions are real
wage can be adjusted all the time. Labor market stays in equilibrium. Employment rate is
not affected by price level and it always stays in full-employment situation. And the
output also stays in full-outputs situation. Hence, AS curve should be vertical curve
which shows price level does not affect output. From the Figure 1.1, we can also find the
change of aggregate demand does not change output at all but price level, because of full-
employment level in short run according to Class AD-AS model.
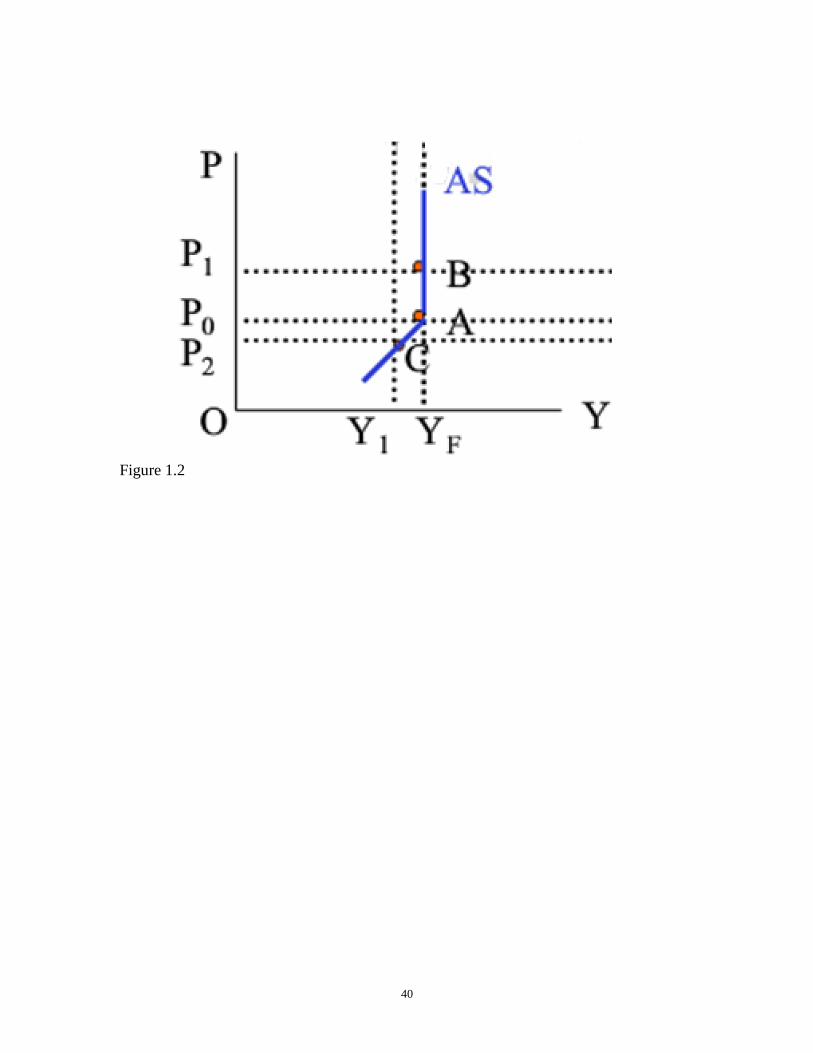
b. Keynesian Model
The aggregate supply curve is different in Keynesian Model. Keynes argues that it
is wrong to assume the competitive markets. He believes that employment does not
always stay in full-employment because of sticky in wages and price. (Keynes, 1936)
11
Before the full-employment, the aggregate supply is an upward curve that means more
productions will be produced with increase of price level. Hence, the increase of
aggregate demand will increase the output and employment rate if economy is in
recession, like the point C to point A in Figure1.2. However, if employment stays in full-
employment, increase of aggregate demand does not increase outputs and employment
rate, like point A to point B.
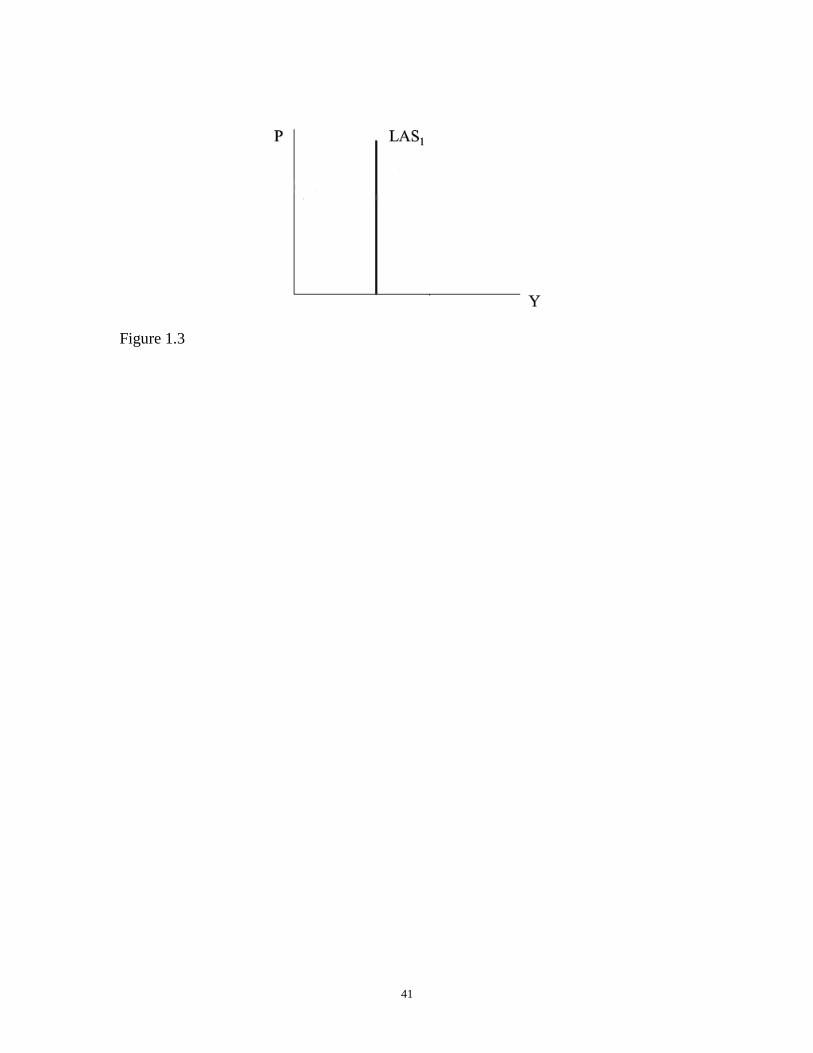
Long run
In the long-term, the aggregate supply curve should be a vertical line like it in
classic AD-AS model. (Figure 1.3) Wage and cost of productions will also increase when
price level increases. There is no reason for firms to hire more workers or produce more.
Aggregate demand does not affect employment rate in long-term.
All in all, I believe in Keynesian model that most of employment level does not
get into full-employment in the world. Net exports tend to decrease unemployment rate.
3.2 Exchange rate and Trade
Exchange rate has a direct influence on net exports. However, the effect of
exchange rate on the net export is uncertain and the elasticity of demand for imports plays
a crucial factor. In international finance, for the exports side, when domestic exchange
rate becomes higher (domestic currency depreciation), domestic country can export more
because their goods become relatively cheaper. Depreciation of home country’s currency
has two effects for home country. 1. A rise in the home currency prices of a foreign
currency. 2. It makes home goods cheaper for foreigners and foreign goods more
expensive for domestic residents. (Paul R. Krugman and Maurice Obstfeld, 2011) For
12
example, in 1986, people can use 3.45 yuans to trade for 1 US dollar.5 In 1995, the
exchange rate was 8.35. The Chinese currency got a huge depreciation. In 1986, if the
price of a cloth was 100 yuans, US customers paid 100/3.45= 28.98 dollars to buy one.
Holding the price expressed in yuans constant in 1995, US customers just need to pay
100/8.35=11.97 dollars. The depreciation of yuan makes the Chinese goods looks very
cheap and more clothes would be exported to US. So, the depreciation of home country
currency will increase the volume of exports normally. (EX=P*Q, EX is the exports, P is
the price of exports, one cloth which is 100 yuans in here, Q is the quantity of clothes
which are exported. In here, China is the home country. The quantity of clothes which are
exported to US goes up because the relative price goes down, while price of clothes keep
constant that is 100 yuans, so exports for China will go up. )
For the side of imports, because the exchange rate goes up, the price of imports
rise,6 (domestic currency depreciation) but the quantity also decreases. Those two factors
which one is bigger are unsure and it depends on the elasticity of the product. (IM=P*Q,
IM is the imports, P is the price of imports, Q is the quantity of imports. Because the
home currency value goes down, home country has to spend more domestic money on
imports, at the time, the quantity will goes down because go the higher relative price. So,
P goes up and Q goes down, it is unsure for the result of imports. The key factor is the
elasticity for imports.) For instance, oil is very inelastic. Although world oil prices
5 Yuan is the unit of Renminbi.
6 When the exchange rate goes up(depreciation of home currency), home importers have
to spend more home money to trade for foreign money to purchase same amount of goods
compare to the original. For instance, US firms use 5 dollars (40 yuans) firms to import a
shirt from China. However, when the US dollars depreciate, the shirt is still 40 yuans, but
US firms have to spend more money to buy it like 6 or 7 dollars.
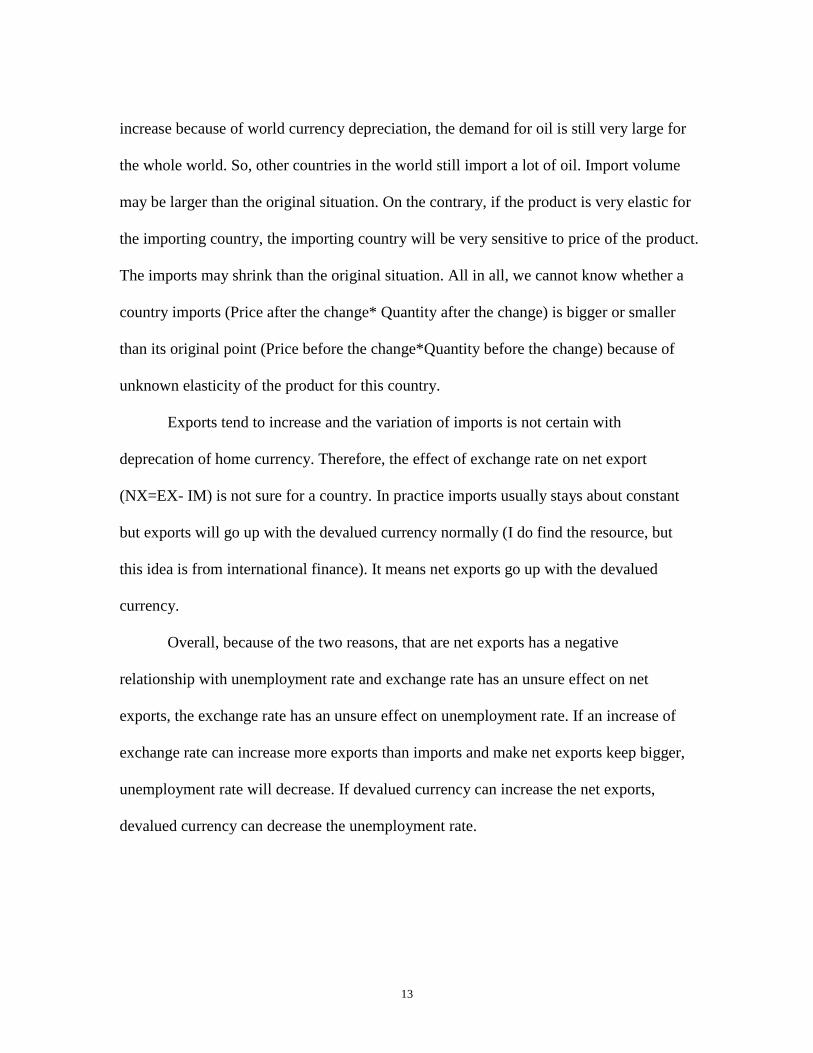
13
increase because of world currency depreciation, the demand for oil is still very large for
the whole world. So, other countries in the world still import a lot of oil. Import volume
may be larger than the original situation. On the contrary, if the product is very elastic for
the importing country, the importing country will be very sensitive to price of the product.
The imports may shrink than the original situation. All in all, we cannot know whether a
country imports (Price after the change* Quantity after the change) is bigger or smaller
than its original point (Price before the change*Quantity before the change) because of
unknown elasticity of the product for this country.
Exports tend to increase and the variation of imports is not certain with
deprecation of home currency. Therefore, the effect of exchange rate on net export
(NX=EX- IM) is not sure for a country. In practice imports usually stays about constant
but exports will go up with the devalued currency normally (I do find the resource, but
this idea is from international finance). It means net exports go up with the devalued
currency.
Overall, because of the two reasons, that are net exports has a negative
relationship with unemployment rate and exchange rate has an unsure effect on net
exports, the exchange rate has an unsure effect on unemployment rate. If an increase of
exchange rate can increase more exports than imports and make net exports keep bigger,
unemployment rate will decrease. If devalued currency can increase the net exports,
devalued currency can decrease the unemployment rate.

14
CHAPTER FIVE
ANALYSIS
Singapore and Hong Kong are typical extended re-exporting countries. The
advantage is their geography that they are natural ports. But their resources are very
scarce. Although Singapore is much industrialized now, they still rely on imported good.
The Singaporean economy depends heavily on exports and refining imported goods,
especially in manufacturing, which constituted 27.2% of GDP in 2010. Like Feenstra said
in his paper, Hong Kong imports from China, and then distributes them to the world.
(Feenstra and Hanson, 2000) This is the mechanism of re-exports. Singaporean also has
to import first, and then directly export these products later. The elasticity for imports
should be very inelastic. When Singapore currency depreciate (exchange rate increase),
Singapore still imports a lot of products but with a higher price. The amount of imports
will increase; On the other hand, when Singapore tries to re-export these products, they
have to increase the price because of the increasing import costs. It may make the
advantage on exports caused by the depreciation of currency become less. In fact, there
are a lot of trade-related services producing industries in Singapore, like trade insurance.
Therefore, currency depreciation for typical extended re-exporting countries will not
bring so much benefit for unemployment rate as it should do. In addition, Singapore also
has scarce resources which make import cost become bigger when currency of Singapore
depreciates for domestic uses not for re-exports, and then unemployment rate will not be
improved so much.
15
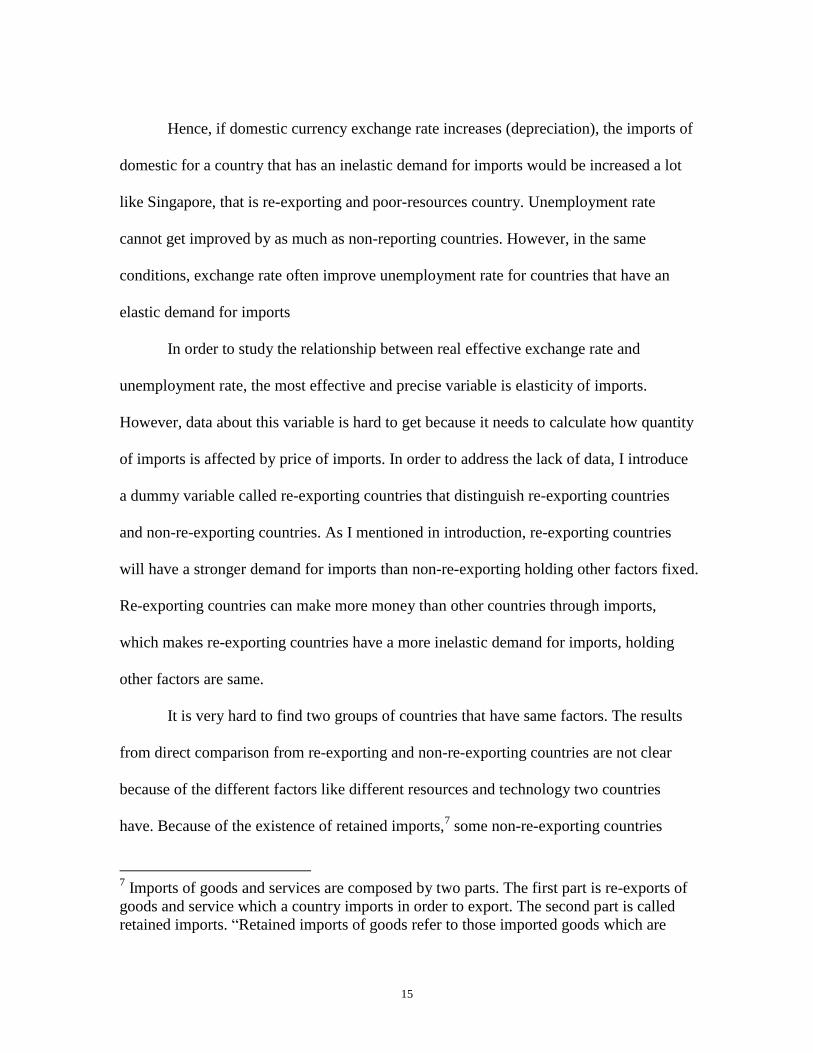
Hence, if domestic currency exchange rate increases (depreciation), the imports of
domestic for a country that has an inelastic demand for imports would be increased a lot
like Singapore, that is re-exporting and poor-resources country. Unemployment rate
cannot get improved by as much as non-reporting countries. However, in the same
conditions, exchange rate often improve unemployment rate for countries that have an
elastic demand for imports
In order to study the relationship between real effective exchange rate and
unemployment rate, the most effective and precise variable is elasticity of imports.
However, data about this variable is hard to get because it needs to calculate how quantity
of imports is affected by price of imports. In order to address the lack of data, I introduce
a dummy variable called re-exporting countries that distinguish re-exporting countries
and non-re-exporting countries. As I mentioned in introduction, re-exporting countries
will have a stronger demand for imports than non-re-exporting holding other factors fixed.
Re-exporting countries can make more money than other countries through imports,
which makes re-exporting countries have a more inelastic demand for imports, holding
other factors are same.
It is very hard to find two groups of countries that have same factors. The results
from direct comparison from re-exporting and non-re-exporting countries are not clear
because of the different factors like different resources and technology two countries
have. Because of the existence of retained imports,7 some non-re-exporting countries
7 Imports of goods and services are composed by two parts. The first part is re-exports of
goods and service which a country imports in order to export. The second part is called
retained imports. “Retained imports of goods refer to those imported goods which are

16
could also have a strong demand for imports, because non-re-exporting countries can
process imports and increase domestically produced exports like Japan. Hence, the
different influence on unemployment rate can be small from real effective exchange rate
between re-exporting countries and others when I selected a lot of all varieties of
countries into data.
Consequently, I have such hypotheses.
1. Real effective Exchange rate has a negative influence on unemployment
rate considering the whole data.
2. Real effective Exchange rate in re-exporting countries has a less negative
effect on unemployment rate compared with non-re-exporting countries, but the
difference would not be pretty large. The reasons are re-exporting countries
include USA that are rich in resources and non-re-exporting countries include
Japan and so on that are scared in resources but are not re-exporting countries.
retained for use in Hong Kong rather than being re-exported to other places. The value of
retained imports of goods is derived by subtracting the estimated import value of re-
exports of goods from the value of imports of goods. (Continued) The former is obtained
by removing an estimated re-export margin from the value of re-exports of goods. The
Census and Statistics Department regularly conducts a survey of re-export trade, based on
which the rates of re-export margin for different categories of goods are estimated for
deriving retained import statistics. Retained import statistics are subject to revision when
the latest estimates on rates of re-export margin become available. ” ( Census and
Statistics Department of Hong Kong )
17
CHAPTER SIX
DATA AND MODELS
4.1. Data Sources
The trade data I use for thesis are from several sources: Inflation rate, Interest rate,
GDP growth rate, Trade volume, Net export from database of World Bank. The Real
effective real exchange rate is provided by Bank for International Settlements. The
unemployment rate data is from International Monetary Fund - 2011 World Economic
Outlook. All the data span 1995 to 2009.
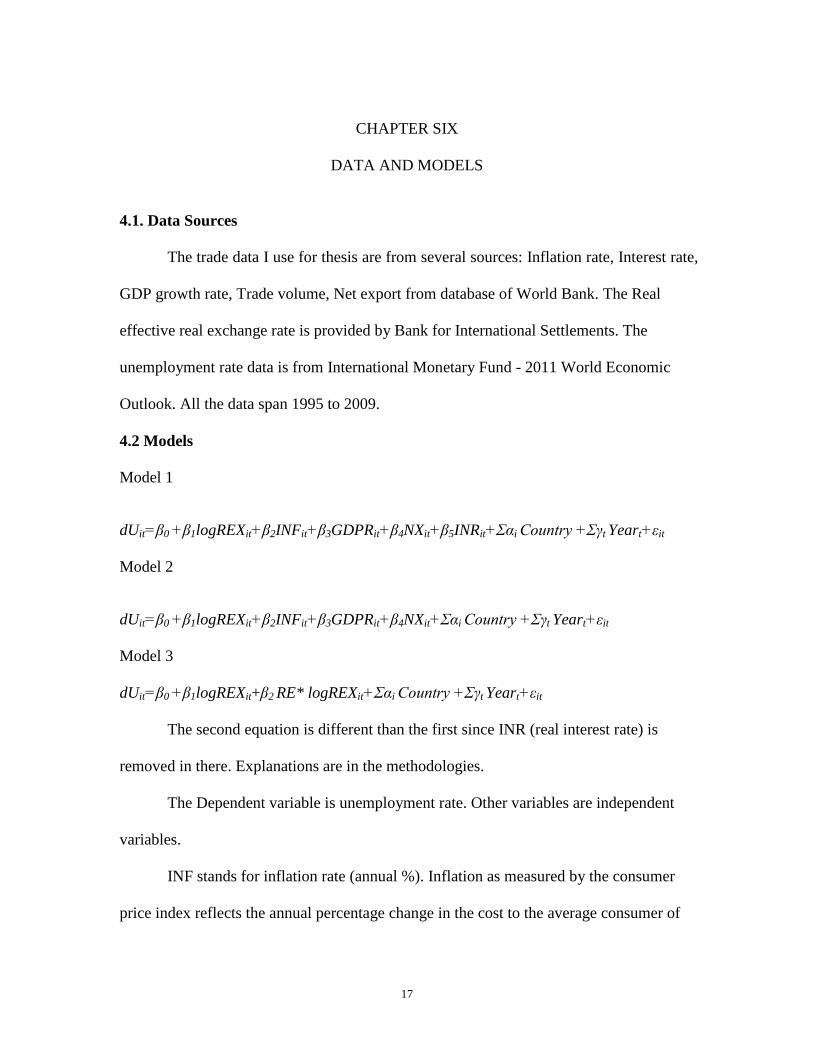
4.2 Models
Model 1
dUit=β0 +β1logREXit+β2INFit+β3GDPRit+β4NXit+β5INRit+Σαi Country +Σγt Yeart+εit
Model 2
dUit=β0 +β1logREXit+β2INFit+β3GDPRit+β4NXit+Σαi Country +Σγt Yeart+εit
Model 3
dUit=β0 +β1logREXit+β2 RE* logREXit+Σαi Country +Σγt Yeart+εit
The second equation is different than the first since INR (real interest rate) is
removed in there. Explanations are in the methodologies.
The Dependent variable is unemployment rate. Other variables are independent
variables.
INF stands for inflation rate (annual %). Inflation as measured by the consumer
price index reflects the annual percentage change in the cost to the average consumer of
18
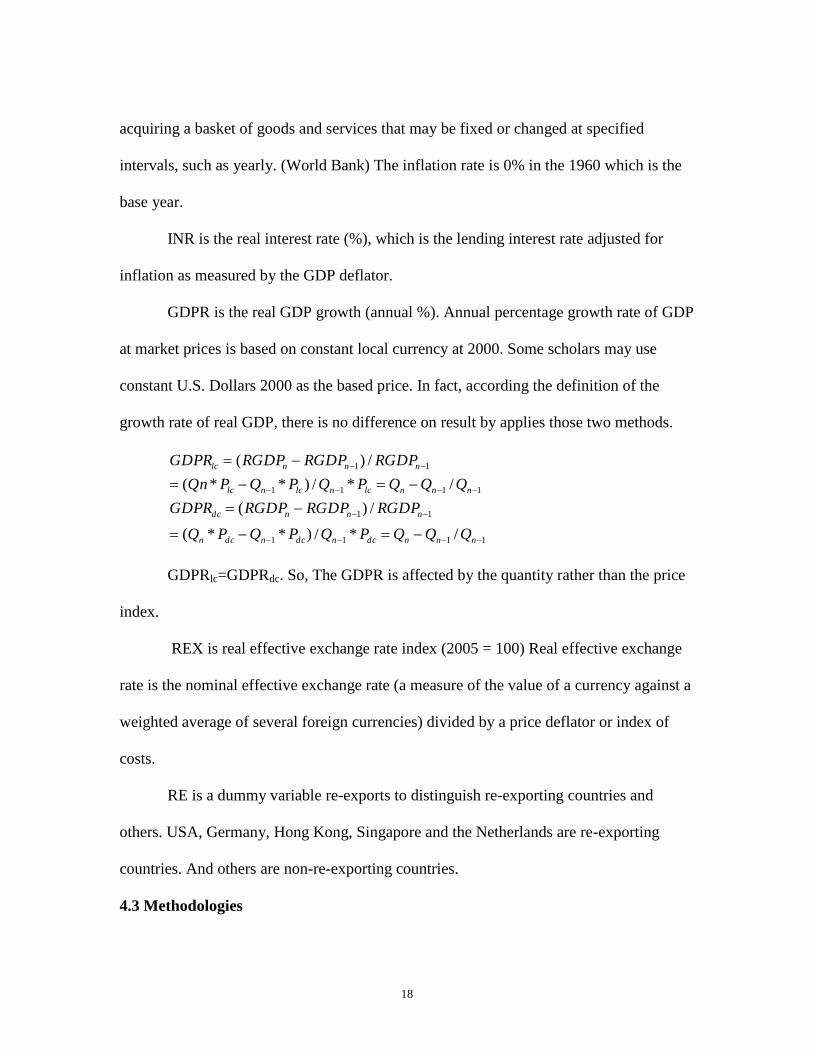
acquiring a basket of goods and services that may be fixed or changed at specified
intervals, such as yearly. (World Bank) The inflation rate is 0% in the 1960 which is the
base year.
INR is the real interest rate (%), which is the lending interest rate adjusted for
inflation as measured by the GDP deflator.
GDPR is the real GDP growth (annual %). Annual percentage growth rate of GDP
at market prices is based on constant local currency at 2000. Some scholars may use
constant U.S. Dollars 2000 as the based price. In fact, according the definition of the
growth rate of real GDP, there is no difference on result by applies those two methods.
1111
11
1111
11
/*/)**(
/)(
/*/)**(
/)(
nnndcndcndcn
nnndc
nnnlcnlcnlc
nnnlc
QQQPQPQPQ
RGDPRGDPRGDPGDPR
QQQPQPQPQn
RGDPRGDPRGDPGDPR
GDPRlc=GDPRdc. So, The GDPR is affected by the quantity rather than the price
index.
REX is real effective exchange rate index (2005 = 100) Real effective exchange
rate is the nominal effective exchange rate (a measure of the value of a currency against a
weighted average of several foreign currencies) divided by a price deflator or index of
costs.
RE is a dummy variable re-exports to distinguish re-exporting countries and
others. USA, Germany, Hong Kong, Singapore and the Netherlands are re-exporting
countries. And others are non-re-exporting countries.
4.3 Methodologies
19
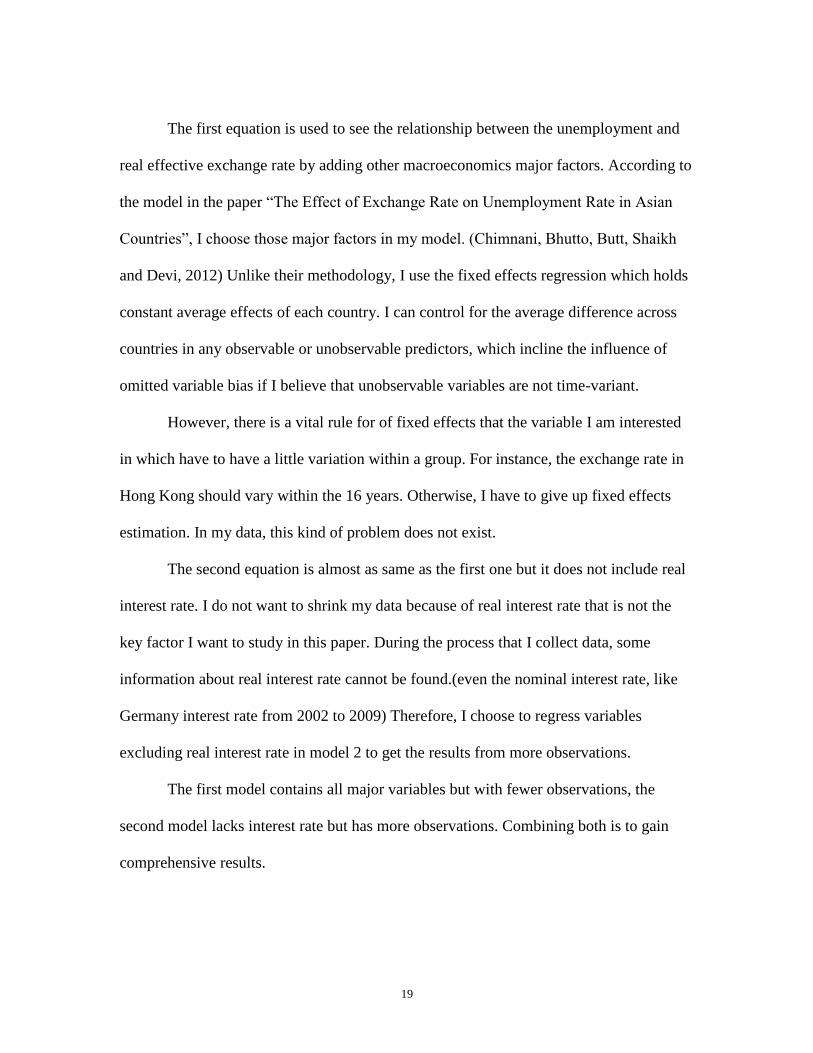
The first equation is used to see the relationship between the unemployment and
real effective exchange rate by adding other macroeconomics major factors. According to
the model in the paper “The Effect of Exchange Rate on Unemployment Rate in Asian
Countries”, I choose those major factors in my model. (Chimnani, Bhutto, Butt, Shaikh
and Devi, 2012) Unlike their methodology, I use the fixed effects regression which holds
constant average effects of each country. I can control for the average difference across
countries in any observable or unobservable predictors, which incline the influence of
omitted variable bias if I believe that unobservable variables are not time-variant.
However, there is a vital rule for of fixed effects that the variable I am interested
in which have to have a little variation within a group. For instance, the exchange rate in
Hong Kong should vary within the 16 years. Otherwise, I have to give up fixed effects
estimation. In my data, this kind of problem does not exist.
The second equation is almost as same as the first one but it does not include real
interest rate. I do not want to shrink my data because of real interest rate that is not the
key factor I want to study in this paper. During the process that I collect data, some
information about real interest rate cannot be found.(even the nominal interest rate, like
Germany interest rate from 2002 to 2009) Therefore, I choose to regress variables
excluding real interest rate in model 2 to get the results from more observations.
The first model contains all major variables but with fewer observations, the
second model lacks interest rate but has more observations. Combining both is to gain
comprehensive results.
20
After I confirm unemployment rate has an obvious relationship with real effective
exchange rate, I try to see the different relationship in re-exporting countries and non-
exporting countries. No matter in Model 1 or Model 2, the effect of each independent
variable is assumed to be same across the groups which show an average within-group
effect. However, I believe there are different slopes across all groups because the country
is a re-exporting country or not. Hence, I use chow test to check the state of pooled and
separate function. The conclusion is that I should run separate regressions for the two
types of countries. (See Appendix)

21
CHAPTER SEVEN
RESULTS
Table 1.3 and Table 1.4 are used to see the relationship between real effective
exchange rate and unemployment. Table 1.3 which uses Model 1 to points out that the
results of exchange rate on unemployment rate along with other variables by using 16
high income countries8 from 1994 to 2009. A different regression is represented by each
column and each row stands for a coefficient and standard error. Individual coefficient
are statistically significant at *5%, **1% and ***10%. Numbers in parentheses stand for
standard error.
Column (01) in table 1.3 shows the directly negative influence of real effective
exchange rate on unemployment rate. Real effective exchange rate increase by 1%,
unemployment rate will go down by 0.02967% which is significant at 5% significance
level. Column (02) shows that real effective exchange rate has a greater negative effect
on employment rate by adding inflation rate with the 0.1% significance level. The
inflation rate is chose by me because inflation has a relationship with unemployment rate
in the short run according to Philips Curve. (Blanchard, Olivier , 2000) R2 increases from
64.4% to 69.4%. In column (03), GDP growth rate is added in the regression, since the
growth of GDP tends to have a relationship with unemployment rate. Real effective
exchange rate still has a negative effect on unemployment rate at 0.1% significant level.
R2 jumps from 69.4% to 70.1%. By adding the last variable interest rate, real effective
8 The Netherlands, Singapore, Norway, Slovenia, UK, US, Australia, Belgium, Canada,
Denmark, Hong Kong, Iceland, North Korea, Japan, Czech Republic, Switzerland.

22
exchange rate still makes negative influence on unemployment rate. The R2
is 70.6% in
the end, which means 70.6% of the variation of unemployment rate is explained by the
model. The paper selected real interest because interest rate will affect firms’ investment
decisions. When interest rate goes up, the cost of loan will be bigger for industries, and
then unemployment rate will rise. These results are consistent with my expectation that
exchange rate has a negative relationship with unemployment rate in the world normally.
Table 1.4 that is regressed from Model 2 which is as almost same as Table 1.3,
but interest rate is removed in here. By deleting this variable, I make the number of
observations increase from 256 to 400 and the number of countries is 25.9 Consequently,
the results are as same as Table 1.3 that real effective exchange rate has a negative
influence on unemployment rate at different significant levels.
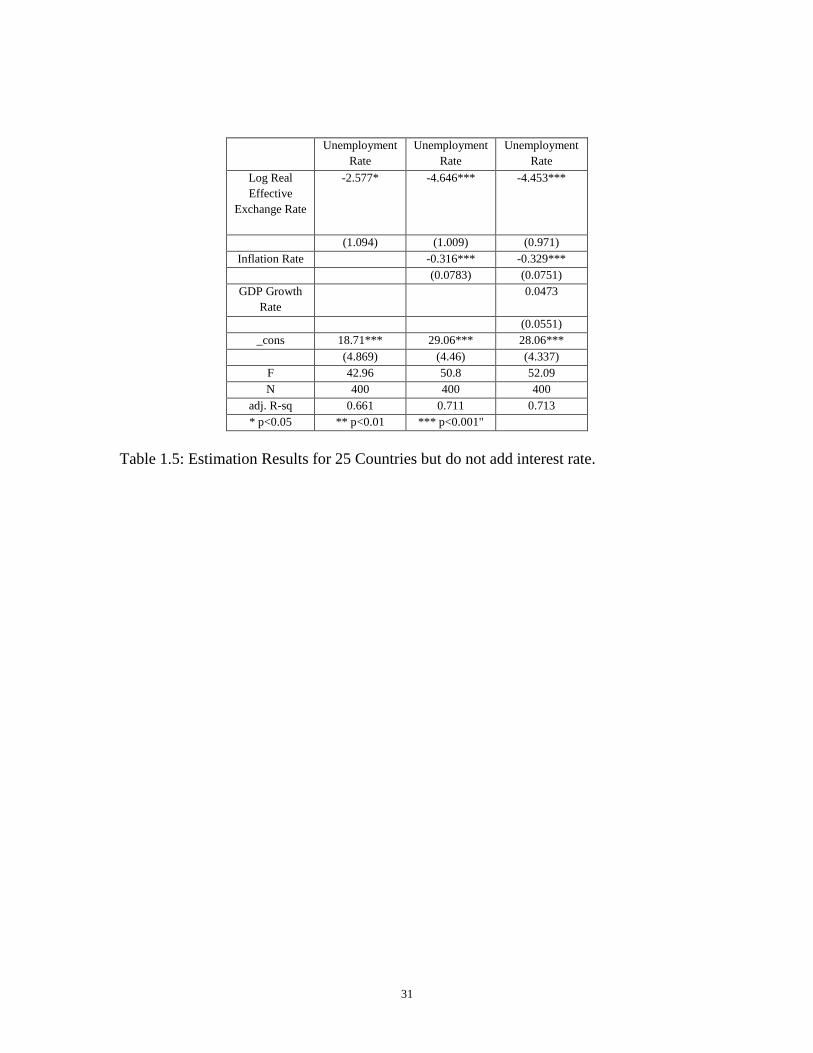
Table 1.5 is from Model 3. This regression contains an interaction re-exports
times log real effective exchange rate. The coefficient of this variable is 1.899 which
means log real effective exchange rate has a larger negative influence on unemployment
rate for re-exporting countries compared with non-re-exporting countries.
Table 1.6 and E are used to examine the relationship between real effective
exchange rate and unemployment rate for re-exporting countries and non-re-exporting
countries. The observations of Table 1.6 and Table 1.7 are from Table 1.3. (16 countries
9 The Netherlands, Singapore, Norway, Slovenia, UK, US, Australia, Belgium, Canada,
Denmark, Hong Kong, Iceland, North Korea, Japan, Czech Republic, Switzerland,
Germany, Austria, Cyprus, Greece, Ireland, Luxembourg, Portugal, Sweden, New
Zealand.
23
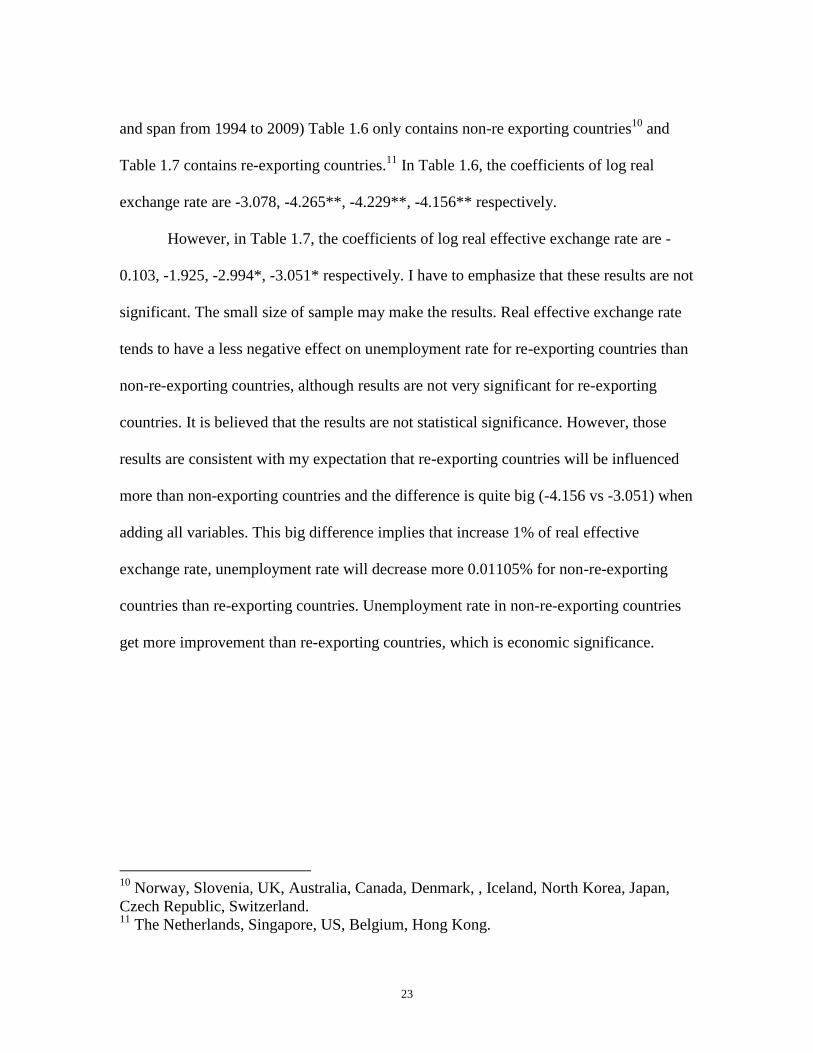
and span from 1994 to 2009) Table 1.6 only contains non-re exporting countries10
and
Table 1.7 contains re-exporting countries.11
In Table 1.6, the coefficients of log real
exchange rate are -3.078, -4.265**, -4.229**, -4.156** respectively.
However, in Table 1.7, the coefficients of log real effective exchange rate are -
0.103, -1.925, -2.994*, -3.051* respectively. I have to emphasize that these results are not
significant. The small size of sample may make the results. Real effective exchange rate
tends to have a less negative effect on unemployment rate for re-exporting countries than
non-re-exporting countries, although results are not very significant for re-exporting
countries. It is believed that the results are not statistical significance. However, those
results are consistent with my expectation that re-exporting countries will be influenced
more than non-exporting countries and the difference is quite big (-4.156 vs -3.051) when
adding all variables. This big difference implies that increase 1% of real effective
exchange rate, unemployment rate will decrease more 0.01105% for non-re-exporting
countries than re-exporting countries. Unemployment rate in non-re-exporting countries
get more improvement than re-exporting countries, which is economic significance.
10
Norway, Slovenia, UK, Australia, Canada, Denmark, , Iceland, North Korea, Japan,
Czech Republic, Switzerland. 11
The Netherlands, Singapore, US, Belgium, Hong Kong.
24
CHAPTER EIGHT
CONCLUSIONS AND FUTHER DISCUSSIONS
6.1 Conclusions
In this paper, I explore the relationship between exchange rate and unemployment
rate. Real effective exchange rate that is used to replace exchange rate and other major
macroeconomic variables are added in the model as independent variables. The results
present that higher real effective exchange rate will lower the unemployment rate. After
examining this relationship, I divide the whole group into two clusters by introducing re-
exports in the model which is a dummy variable so as to see the different influences on
unemployment rate for two clusters. The conclusion is that real effective exchange rate
has a less negative effect on unemployment rate in re-exporting countries compared with
non-re-exporting countries, this difference is big but the results from non-re-exporting
countries are not statistically significant. The results are not very statistical significant but
economic significant.
6.2. Further Discussions
I want to use share of imports (%GDP) as a variable to replace elasticity of
demand for imports. Indeed, in my opinion, the share of imports (%GDP) maybe
correlated positively with the elasticity of demand for imports in a country.12
However,
this selecting method is not precise and scientific. In fact, imports share (%GDP) cannot
explain the elasticity. For instance, we regard a country as a person. He just needs to
12
If imports take a big share of a country’s GDP, it may show this country really needs
imports in some degree.
25
spend little money to buy foods because the relatively cheap price and fixed little demand
for foods. Hence, the share of consuming foods of income (%income) is not very high.
However, foods are definitely inelastic demand for him because he has to purchase fixed
little foods although price of foods becomes expensive. Therefore, the low share of foods
(%income) cannot show the strong elasticity of demand for foods. Similarity, the low
share of imports cannot show the strong elasticity of demands for imports. If we are
intended for a more authorized result, we need to know how the price of imports affect
the quantity to which is the method to get the elasticity.

26
APPENDICES
27
APPENDIX A
Tables
Table 1.1: Direct Exports and Re-exports of Chinese Goods, 1988-1998.
28
The Netherlands Singapore Belgium Hong Kong Germany USA
year Trade
Volume
year Trade
Volume
year Trade
Volume
year Trade
Volume
year Trade
Volume
year Trade
Volume
1994 107.94 1994 318.18 1994 123.36 1994 266.73 1994 45.34 1994 21.94
1995 113.05 1995 349.26 1995 126.78 1995 290.35 1995 46.89 1995 23.36
1996 113.98 1996 340.33 1996 128.11 1996 274.21 1996 48.65 1996 23.63
1997 120.96 1997 328.41 1997 135.82 1997 262.02 1997 53.51 1997 24.35
1998 120.45 1998 316.36 1998 135.60 1998 248.00 1998 55.79 1998 23.68
1999 121.87 1999 343.08 1999 135.75 1999 248.88 1999 57.93 1999 24.09
2000 134.62 2000 371.82 2000 153.36 2000 279.12 2000 66.46 2000 25.95
2001 128.77 2001 360.09 2001 152.06 2001 269.55 2001 67.60 2001 23.71
2002 121.79 2002 360.06 2002 147.65 2002 286.57 2002 66.84 2002 22.98
2003 119.73 2003 386.97 2003 142.46 2003 327.17 2003 67.52 2003 23.32
2004 125.41 2004 412.87 2004 146.96 2004 364.60 2004 72.05 2004 25.25
2005 130.72 2005 429.94 2005 153.42 2005 377.09 2005 77.42 2005 26.53
2006 137.93 2006 437.39 2006 157.72 2006 392.44 2006 85.41 2006 27.87
2007 140.17 2007 404.70 2007 161.25 2007 396.77 2007 87.33 2007 28.91
2008 144.24 2008 460.47 2008 169.01 2008 407.38 2008 90.01 2008 30.97
2009 130.14 2009 421.57 2009 142.84 2009 374.32 2009 79.85 2009 25.64
Table 1.2: Trade volume (Net Exports+Imports) for re-exporting countries, The
Netherlands, Singapore, Belgium, Hong Kong, Germany and USA from 1994 to 2009.

Unemployment
Rate
Unemployment
Rate
Unemployment
Rate
Unemployment
Rate
Log Real
Effective
Exchange Rate
-2.967* -4.593*** -4.446*** -4.366**
(-1.201) (-1.095) (1.069) (1.074)
Inflation Rate -0.244** -0.268*** -0.229***
(0.0784) (0.0765) (-0.0674)
GDP Growth
Rate
0.067 0.063
(0.0571) (0.0429)
Interest Rate -0.0164
(0.00672)
_cons 20.42*** 28.54*** 27.70*** 27.46***
(5.344) (4.792) (4.711) (4.724)
F 34.5 37.4 38.76 35.48
N 256 256 256 256
adj. R-sq 0.644 0.694 0.701 0.706
="* p<0.05 ** p<0.01 *** p<0.001"
Table 1.3. Estimation Results for 16 Countries.

30
Table 1.4: Summary for 16 countries.
31
Unemployment
Rate
Unemployment
Rate
Unemployment
Rate
Log Real
Effective
Exchange Rate
-2.577* -4.646*** -4.453***
(1.094) (1.009) (0.971)
Inflation Rate -0.316*** -0.329***
(0.0783) (0.0751)
GDP Growth
Rate
0.0473
(0.0551)
_cons 18.71*** 29.06*** 28.06***
(4.869) (4.46) (4.337)
F 42.96 50.8 52.09
N 400 400 400
adj. R-sq 0.661 0.711 0.713
* p<0.05 ** p<0.01 *** p<0.001"
Table 1.5: Estimation Results for 25 Countries but do not add interest rate.
32
Table 1.6: Summary for 25 countries.
33
Unemployment Rate
Log Real Effective
Exchange Rate -2.964*
(1.327)
Re-exports*
Log Real Effective
Exchange Rate
1.899
(2.096)
_cons 20.39***
(5.877)
F 42.75
N 400
adj. R-sq 0.660
Table 1.7: Estimation Results for 16 Countries (regress log real effective exchange rate
and Re-export* log real effective exchange rate).

34
Table 1.8: Summary for 16 countries.
35
Unemployment
Rate
Unemployment
Rate
Unemployment
Rate
Unemployment
Rate
Log Real
Effective
Exchange Rate
-3.078 -4.265** -4.229** -4.156**
(1.647) (1.456) (1.422) (1.424)
Inflation Rate -0.162* -0.211* -0.206**
(0.08) (0.0845) (0.0862)
GDP Growth
Rate 0.0932 0.0848
(0.0594) (0.060)
Interest Rate -0.0181***
(0.00535)
_cons 21.30** 27.12*** 26.79*** 26.58***
(7.324) (6.393) (6.266) (6.270)
F 27.42 26.24 26.97 25.29
N 176 176 176 176
adj. R-sq 0.616 0.639 0.657 0.667
="* p<0.05 ** p<0.01 *** p<0.001"
Table 1.9: Estimation Results for 11 Non-re-exporting Countries

36
Table 2.0: Summary for 11 countries
37
Unemployment
Rate
Unemployment
Rate
Unemployment
Rate
Unemployment
Rate
Log Real
Effective
Exchange Rate
-0.103 -1.925 -2.994* -3.051*
(1.616) (1.283) (1.37) (1.348)
Inflation Rate -0.471*** -0.490*** -0.452***
(0.0605) (0.0552) (0.0785)
GDP Growth
Rate -0.131* -0.117
(0.0573) (0.0591)
Interest Rate 0.0515
(0.0641)
_cons 8.837 19.05** 24.57*** 24.34***
(7.501) (5.966) (6.502) (6.492)
F 19.16 30.82 36.89 32.58
N 80 80 80 80
adj. R-sq 0.679 0.848 0.859 0.859
="* p<0.05 ** p<0.01 *** p<0.001"
Table 2.1: Estimation Results for 5 Re-exporting Countries
38
Table 2.2: Summary for 5 countries
39
APPENDIX B
Figures
Figures 1.1
40
Figure 1.2
41
Figure 1.3

42
Appendix C
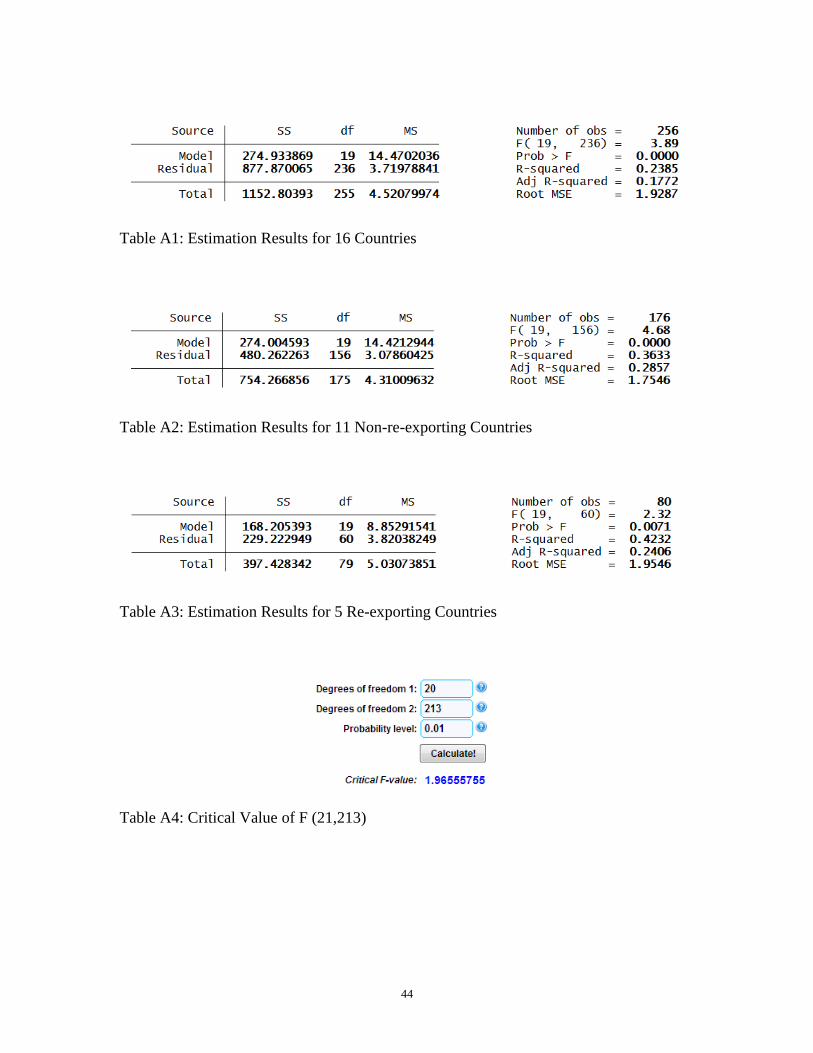
Computation of Chow Test Statistics
Chow Test Statistics are used in the thesis in order to see re-exports is a reliable
dummy variable to divide the whole data. There are two methods to calculate the Chow
Test Statistics. The one I used is that regress each of the models and calculate by hand.
The formula for Chow Test is
I run the pooled regression and two separate regressions, and then got three results
Table A1, Table A2 and Table A3 by using the 16 countries data.
By eyeballing those three tables, I know ess_c is 877.87 which is the error sum of
squares of the pooled regression. Ess_1 is 480.26 which is the error sum of squares of
separate regression 1 as well as ess_2 is 229.22. K is 20 that is the number of estimated
parameters. N_1 and N_2 are 176 and 80 which are the number of observations in groups.
After the calculation, the numerator is 8.42 and the denominator is 3.28. The final
result is 2.57. Therefore, the F statistic is 2.57. The critical F-value is 1.97 at 1%

43
significant level. (Table A4) We conclude that the pooled function is an inadequate
specification and we should run separate regressions for the two types of countries. 13
13
William Gould and Christopher Dougherty present how to use Chow Test.
44
Table A1: Estimation Results for 16 Countries
Table A2: Estimation Results for 11 Non-re-exporting Countries
Table A3: Estimation Results for 5 Re-exporting Countries
Table A4: Critical Value of F (21,213)
45
References
Blanchard, Olivier , 2000, ”Macroeconomics (Second ed.),” Prentice Hall.
Chimnani, Hina, Bhutto, Niaz, Butt, Falauddin, Shaikh Sheeraz and Devi, Warcha, 2012,
“The effect of Exchange Rate on Unemployment Rate in Asian Countries,” Proceeding of
2nd
International Conference on Business Management.
Feenstra, Robert, and Alan M. Taylor, 2010, “International Trade.”
Feenstra, Robert, and Hanson, Gordon, 2000, “Intermediaries in Entrepot Trade: Hong
Kong Re-exports of Chinese Goods”, December.
Gould, William, 1999, “Computing the Chow statistic”, January.
Glanville, Alan, 2011, “Economics From a Global Perspective,” Third Edition Glanville
Books Ltd, p.224
Hoon, Hian Teck and Phepls Edmund, 2002, “Asset Prices, the Real Exchange Rate and
Unemployment in a Small Open Economy: A Medium-Run Structuralist Perspective, p.
275-288.”
Ha, Jiming, Fan, Kelvin and Shu, Chang, 2003, “Export Performance in Hong Kong
Offshore Trade and Re-exports,” Hong Kong Monetary Authority Quarterly Bulletin.
June.
John Maynard Keynes, 1936, “The General Theory of Employment, Interest and Money”,
Brace and company Press.
Paul R. Krugman, Maurice Obstfeld, 2011, “ International Economics: Theory and Policy
(8th Edition)”, Prentice Hall Press
M.C. Mellens, H.G.A Noordman and J.P. Verbruggen, 2007, “ Re-exports: international
comparison and implications for performance indicators,” CPB Netherlands Bureau for
Economic Policy Analysis, July.
Narayanan, Badri and Walmsley Terrie, 2008, “Re-Export Trade for the Netherlands and
Singapore,” the GTAP 7 Data Base, Chapter 9.