Real E ects of the Sovereign Debt Crisis in Europe ... · PDF fileReal E ects of the Sovereign...
62
Real Effects of the Sovereign Debt Crisis in Europe: Evidence from Syndicated Loans Viral V. Acharya, Tim Eisert, Christian Eufinger, and Christian Hirsch * ABSTRACT In this paper, we explore the impact of the European Sovereign Debt Crisis and the resulting credit crunch on the corporate policies of firms. Existing theory suggests that sovereign crises can affect the real economy in complex ways based on the nature of the interaction between bank and sovereign health. We show that banks’ exposures to impaired sovereign debt and risk-shifting behavior of undercapitalized banks are of first-order importance for explaining the negative real effects suffered by European firms, while moral suasion by governments to buy more domestic sovereign debt does not seem to have played a major role. In particular, we present firm-level evidence showing that the lending contraction at banks affected by the crisis depresses the investment, job creation, and sales growth of firms with significant business relationships to these banks. These firms increase their precautionary motives to save cash out of free cash flows and rely more on cash holdings than bank lines of credit for their liquidity management during the crisis, a typical behavior of financially constrained firms. Our estimates suggest that the credit crunch explains between one fifth and one half of the overall negative real effects in the sample. JEL classification: G01, G21, G28, E44. * Acharya is with the New York University, CEPR, and NBER. Eisert is with the Erasmus University Rotterdam. Eufinger is with the IESE Business School. Hirsch is with the Goethe University Frankfurt and SAFE. We appreciate helpful comments from Heitor Almeida (NBER SI Discussant), Bo Becker, Matteo Crosignani, Giovanni Dell’Ariccia, Daniela Fabbri, Rainer Haselmann, Jhangkai Huang, Yi Huang, Vasso Ioannidou, Victoria Ivashina (EFA Discussant), Anil Kashyap (NBER SI Discussant), Augustin Landier, Francesco Manaresi (ESCB Discussant), Tatyana Marchuk, Steven Ongena, Marco Pagano, Andrea Presbitero (MoFiR Discussant), Sjoerd van Bekkum, and Annette Vissing- Jorgensen. Furthermore, we thank conference participants at the 2015 NBER SI, EFA Meeting 2014, the CSEF conference on “Bank Performance, Financial Stability and the Real Economy”, the RELTIF CEPR Meeting Oxford 2015, the ESCB Day ahead conference, the 4th MoFiR workshop on banking, the International Conference on “Financial Market Reform and Regulation”, and the Tsinghua Finance Workshop 2014, as well as seminar participants at Berkeley, NYU, Columbia, Duke, Amherst, Temple, Zurich, IESE, the European Central Bank, CUNY, Mainz, and Konstanz. Eisert is grateful for financial support by the German National Scientific Foundation and the Erasmus Research Institute of Management. Hirsch gratefully acknowledges support from the Research Center SAFE, funded by the State of Hessen initiative for research Loewe. Eufinger gratefully acknowledges the financial support of the Public-Private Sector Research Center of the IESE Business School, University of Navarra, Spain.
Transcript of Real E ects of the Sovereign Debt Crisis in Europe ... · PDF fileReal E ects of the Sovereign...

Real Effects of the Sovereign Debt Crisis in Europe: Evidence
from Syndicated Loans
Viral V. Acharya, Tim Eisert, Christian Eufinger, and Christian Hirsch∗
ABSTRACT
In this paper, we explore the impact of the European Sovereign Debt Crisis and the resulting credit
crunch on the corporate policies of firms. Existing theory suggests that sovereign crises can affect
the real economy in complex ways based on the nature of the interaction between bank and sovereign
health. We show that banks’ exposures to impaired sovereign debt and risk-shifting behavior of
undercapitalized banks are of first-order importance for explaining the negative real effects suffered
by European firms, while moral suasion by governments to buy more domestic sovereign debt does
not seem to have played a major role. In particular, we present firm-level evidence showing that
the lending contraction at banks affected by the crisis depresses the investment, job creation, and
sales growth of firms with significant business relationships to these banks. These firms increase
their precautionary motives to save cash out of free cash flows and rely more on cash holdings than
bank lines of credit for their liquidity management during the crisis, a typical behavior of financially
constrained firms. Our estimates suggest that the credit crunch explains between one fifth and one
half of the overall negative real effects in the sample.
JEL classification: G01, G21, G28, E44.
∗Acharya is with the New York University, CEPR, and NBER. Eisert is with the Erasmus University Rotterdam.Eufinger is with the IESE Business School. Hirsch is with the Goethe University Frankfurt and SAFE. We appreciatehelpful comments from Heitor Almeida (NBER SI Discussant), Bo Becker, Matteo Crosignani, Giovanni Dell’Ariccia,Daniela Fabbri, Rainer Haselmann, Jhangkai Huang, Yi Huang, Vasso Ioannidou, Victoria Ivashina (EFA Discussant),Anil Kashyap (NBER SI Discussant), Augustin Landier, Francesco Manaresi (ESCB Discussant), Tatyana Marchuk,Steven Ongena, Marco Pagano, Andrea Presbitero (MoFiR Discussant), Sjoerd van Bekkum, and Annette Vissing-Jorgensen. Furthermore, we thank conference participants at the 2015 NBER SI, EFA Meeting 2014, the CSEFconference on “Bank Performance, Financial Stability and the Real Economy”, the RELTIF CEPR Meeting Oxford2015, the ESCB Day ahead conference, the 4th MoFiR workshop on banking, the International Conference on“Financial Market Reform and Regulation”, and the Tsinghua Finance Workshop 2014, as well as seminar participantsat Berkeley, NYU, Columbia, Duke, Amherst, Temple, Zurich, IESE, the European Central Bank, CUNY, Mainz,and Konstanz. Eisert is grateful for financial support by the German National Scientific Foundation and the ErasmusResearch Institute of Management. Hirsch gratefully acknowledges support from the Research Center SAFE, fundedby the State of Hessen initiative for research Loewe. Eufinger gratefully acknowledges the financial support of thePublic-Private Sector Research Center of the IESE Business School, University of Navarra, Spain.

Starting in 2009, countries on the periphery of the eurozone drifted into a severe sovereign debt
crisis as concerns about the deterioration of credit quality made it increasingly difficult for the
affected countries to refinance and service existing debt. Since the deterioration in the sovereigns’
creditworthiness fed back into the financial sector (Acharya, Drechsler, and Schnabl, 2014b; Acharya
and Steffen, 2014), lending to the private sector contracted substantially in Greece, Ireland, Italy,
Portugal, and Spain (the GIIPS countries). For example, in Ireland, Spain, and Portugal, the
overall lending volume of newly issued loans fell by 82%, 66%, and 45% over the 2008-2013 pe-
riod, respectively.1 This contraction in loan supply led to a sharp increase in the uncertainty for
borrowing firms as to whether they would be able to access bank funding in the future. As Pietro
Fattorini, the owner and manager of a 23-year old Italian company, puts it: “It’s like starting to
drive on the motorway without knowing if you’ll find gas stations on the way.”2
This statement suggests that the contraction in bank lending negatively affected the corporate
policies of borrowing firms and thus might have been one important contributor to the severity of
the European Sovereign Debt Crisis. However, there is still no conclusive evidence as to (i) how
important the bank lending channel was for the severity of the crisis as opposed to the overall
macroeconomic shock; (ii) whether the credit crunch had any real effects for the borrowing firms
in Europe since firms facing a withdrawal of credit from one financing source might have been able
to get funding from a different source (Adrian, Paolo, and Shin, 2013; Becker and Ivashina, 2014a);
and (iii) what actually caused the decline in bank lending.
Against this background, our paper makes two important contributions to the literature. First,
we show that the decline in bank lending during the European Sovereign Debt Crisis was indeed an
important contributor to the severity of the crisis. In particular, we present firm-level evidence that
the loan supply contraction of banks affected by the sovereign debt crisis made firms with a higher
dependence on these banks financially constrained. These firms display an increased precautionary
motive to save cash out of free cash flow relative to unaffected firms, and also rely more on cash
holdings relative to lines of credit their for liquidity management. As a result of the limited access
to bank financing, we show that firms encountered strong negative real outcomes; their investments,
employment growth, and sales growth became depressed. Our estimates suggest that the credit
crunch explains between one fifth and one half of the overall negative real effects in the sample.
Second, to the best of our knowledge, we are the first to explore the possibly complex set of
channels through which the European Sovereign Debt Crisis caused a reduction in bank lending, as
well as the associated negative real effects for borrowing firms. We document that the negative real
effects of the European Sovereign Debt Crisis that can be attributed to the bank lending channel
are primarily associated with (i) banks from GIIPS countries facing increased risk of losses on their
significant domestic sovereign bondholdings, and (ii) the resulting incentive of undercapitalized
banks from GIIPS countries to engage in risk-shifting behavior by buying even more domestic
sovereign bonds, thereby crowding out corporate lending.
1“SMEs in peripheral Eurozone face far steeper borrowing rates” by Patrick Jenkins, Financial Times, October10, 2013
2“Italian Banks’ Woes Hurt Small Firms” by Giovanni Legorano, Wall Street Journal, December 1, 2013
2

Our sample is based on loan information data obtained from Thomson Reuters LPC’s DealScan,
which provides extensive coverage of bank-firm relationships throughout Europe. We augment this
dataset by hand-matching firm-specific information from Bureau van Dijk’s Amadeus database
and bank-specific information from various sources. The sample includes firms from all European
countries that were severely affected by the sovereign debt crisis (the GIIPS countries) and firms
incorporated in Germany, France, and the U.K. (the non-GIIPS countries) which are the coun-
tries with the largest number of syndicated loans among the European countries that were not
significantly affected by the sovereign debt crisis. Our sample period covers the years 2006 until
2012.
Our dataset provides three key advantages for studying the economic impact of the sovereign
debt crisis and the resulting lending supply contraction on European firms. First, the fact that the
sample is pan-European and includes a geographical breakdown of the firms’ subsidiary revenues
enables us to more precisely disentangle the adverse effects on the real economy caused by the
macroeconomic demand and the bank credit supply shock. Second, our sample enables us to rule
out the possibility that a reduction in bank lending by domestic banks is substituted by bank credit
from foreign financial institutions. Third, and most importantly, the bank-specific information
together with data on bank-firm relationships allows us to determine which channels drive the
contraction in bank lending, and thus cause the negative real effects for borrowing firms.
There are at least three potential channels through which the sovereign debt crisis might have
affected bank lending and, in turn, the corporate policies of borrowing firms: one passive and
two active. The passive channel is the hit on a bank’s balance sheet. The active channels are risk-
shifting and moral suasion. The passive channel suggests that the dramatic increase in risk of GIIPS
sovereign debt directly translates into losses for banks due to their large sovereign bondholdings,
as shown by the recent European Banking Authority’s (EBA’s) EU-wide stress tests and capital
exercises. To cope with these losses, banks had to deleverage and thus might have reduced lending
to the private sector (e.g., Bocola, 2014).
In the first active channel, the risk-shifting motive arises since weakly-capitalized banks from
GIIPS countries might have had an incentive to increase their risky domestic sovereign bondholdings
even further. This is due to the fact that this asset class offers a relatively high return and
at the same time has a very high correlation with the banks’ existing portfolio (Diamond and
Rajan, 2011; Crosignani, 2014). The latter is important since a proper “risk-shifting asset” only
generates large losses in states of the world in which the bank is in default anyway, which is true for
domestic sovereign debt as European banks usually have large domestic government debt holdings.
In addition, eurozone regulators consider these bonds to be risk-free (i.e., attach zero risk weights)
and removed the concentration limits for sovereign debt exposures, which allows large bets without
having to put up equity capital. This risk-shifting mechanism might have led to a crowding-out of
lending to the private sector and thus might have negatively impacted the real economy.
In the second active channel, according to the moral suasion motive, a government might have
explicitly or implicitly pressured domestic banks to increase their domestic sovereign bondholdings
3

in case it found it difficult to refinance its debt (e.g., Becker and Ivashina, 2014b), which also might
have crowded out lending to the real sector.
To assess whether the European Sovereign Debt Crisis affected the real economy in Europe
through the bank lending channel, we start by taking into account all potential bank lending
channels (i.e., balance sheet hit, risk-shifting, and moral suasion) by using a bank’s country of
incorporation as a proxy for how affected the bank was by the crisis. Based on a bank’s country of
incorporation, we divide banks into two groups: (i) GIIPS banks, which are banks headquartered
in GIIPS countries given that these countries are most affected by the European Sovereign Debt
Crisis and (ii) non-GIIPS banks, that is, banks from Germany, France, and the U.K., which are
the countries with the largest number of syndicated loans among the European countries that were
not significantly affected by the sovereign debt crisis.
To consistently estimate the real effects for borrowing firms of having pre-crisis relationships
with banks affected by the sovereign debt crisis, we compare in our main specification the change
in the corporate policies after the beginning of the crisis across firms from the same country and
industry whose lending banks are incorporated in the same group of countries. In particular, we
include industry-country-year fixed effects to capture any time-varying shocks to an industry in a
given country that may have affected the credit demand of borrowing firms, their access to credit,
or their real outcomes. Moreover, we include foreign bank country-year fixed effects to absorb any
unobserved, time-varying heterogeneity that may arise because a firm’s dependency on banks from
a certain country might be influenced by whether this firm has business in the respective country.
Consider as an example a German firm borrowing from a Spanish and a German bank. For this
firm, we include a Spain-year fixed effect to capture the firm’s potential exposure to the macroe-
conomic downturn in Spain during the European Sovereign Debt Crisis. Furthermore, we control
for unobserved, time-constant firm heterogeneity and observable time-varying firm characteristics
that affect the firms’ corporate policies, loan demand, or loan supply.
Our results document that during the sovereign debt crisis, firms with a high dependence on
banks incorporated in GIIPS countries exhibit behavior that is typical for financially constrained
firms. That is, they have lower leverage, demonstrate a significantly positive propensity to save
cash out of their cash flows, and rely more on cash holdings relative to bank lines of credit for their
liquidity management. These results are not observed for firms that are not dependent on GIIPS
banks, nor for highly GIIPS bank-dependent firms in the period prior to the sovereign debt crisis.
We then explore how these financially constrained firms adjusted their corporate policies. We find
that firms that had significant business relationships with GIIPS banks decreased investment more,
and experienced less job creation and sales growth compared to firms that were less dependent on
GIIPS banks.
These findings do not seem to be driven by how firms and banks formed business relationships
in the pre-crisis period. Comparing firms with high and low dependency on GIIPS banks suggests
that firms in the two groups are comparable along observable dimensions in the pre-crisis period.
Furthermore, there are no significant pre-crisis differences between GIIPS and non-GIIPS banks
4

that could explain our results. Lastly, we can rule out that syndicates that include GIIPS banks
are of lower quality in the pre-crisis period.
To ensure the robustness of our results, we alternatively identify the real effects caused by the
decrease in loan supply by tracking the change in corporate policies of firms that are not directly
affected by the macroeconomic shock in the periphery of the eurozone or any other part of the
world. In particular, we focus our analysis on non-GIIPS firms that had a pre-crisis relationship
to a GIIPS bank, but which do not have business exposure to other than non-GIIPS countries.3
To this end, we collect information on the revenues of all foreign and domestic subsidiaries of the
borrowing firms in our sample.
An investigation of the history of the lending relationships between non-GIIPS firms without
GIIPS subsidiaries and their respective GIIPS lenders shows that 90% of these firm-bank matches
can be explained by reasons that are not related to the geographical distribution of the firms’
business exposure. First, many non-GIIPS firms inherited their relationship to a GIIPS bank
through bank mergers or acquisitions. That is, the firm had a relationship to a domestic bank, that
was later acquired by a foreign GIIPS bank. Second, some foreign GIIPS banks have historically
a large presence in non-GIIPS countries. To rule out that a firm’s dependency on GIIPS banks
is positively correlated with its non-observed business exposure to GIIPS countries, we hence only
consider non-GIIPS firms with GIIPS bank relationships that can be explained by these two reasons,
which are not related to the firms’ business activities.
All results continue to hold for this alternative identification strategy, confirming that indeed
the bank lending channel is an important contributor to the negative real effects for European
borrowing firms during the sovereign debt crisis. In addition, this result shows that even European
firms that were not directly affected by the crisis had to face indirect consequences if they had strong
ties to banks that were affected by the sovereign debt crisis. This finding thus highlights that the
extensive cross-border lending in Europe amplifies the shock transmission across the eurozone.
Furthermore, we show that for our sample of GIIPS firms, all results continue to hold if we
restrict the analysis to firms that have a substantial part of their revenues generated by non-GIIPS
subsidiaries.4 Since these firms have a larger part of their business in non-GIIPS countries, it is
plausible to assume that they faced a lower overall macroeconomic shock compared to firms that
operate primarily in affected countries.
We use a partial equilibrium analysis to quantify the importance of the credit supply shock. By
estimating the counterfactual real outcome if a firm had a lower exposure to affected banks, we can
get an estimate of the magnitude of the real effects that were caused by the loan supply disruptions
of GIIPS banks. Our results suggest that in the case of GIIPS firms, between one third and one
half of the overall negative real effects in our sample can be attributed to banks’ lending behavior.
For non-GIIPS firms we can explain between one fifth to one quarter of the aggregate reduction
3For example, a German company without significant business activity in GIIPS or non-EU countries that had apre-crisis lending relationship with a Spanish bank.
4For example, a Spanish company with a German subsidiary that generates a significant fraction of the company’stotal returns.
5
in the real outcome variables. Not surprisingly, we can explain less of the overall evolution for
non-GIIPS firms since a substantial number of borrowers in non-GIIPS countries have no exposure
to GIIPS banks.
After highlighting the importance of the bank lending channel for the real effects for borrowing
firms, we specifically test the importance of the supply factors of bank lending and follow Sufi
(2007) by splitting our sample into listed and non-listed firms. The underlying assumption is that
non-listed firms have fewer alternative sources of funding and, in case bank-related loan supply
factors played a role during the crisis, the non-listed firms should have been much more affected
than listed firms, which may have other sources of funding available. Our results show that non-
listed firms are indeed negatively affected by the sovereign debt crisis. We do not find any evidence
that listed firms had significantly negative real effects during the crisis. Moreover, we show that
banking relationships are in general sticky and that mostly non-listed firms are unable to switch
their bank. This finding again confirms that bank lending supply played a major role in causing
the real effects for borrowing firms.
Furthermore, to even more precisely isolate a potential loan demand shock from a loan supply
shock and to test what actually causes the contraction in bank lending, we adapt the methodology
first utilized by Khwaja and Mian (2008), which exploits multiple bank-firm relationships. However,
since syndicated loans usually have relatively long maturities and we do not observe changes within
the same loan over time (e.g., credit line drawdowns), a large number of observations in our sample
have no significant year-to-year change in the bank-firm lending relationships. Therefore, we have
to resort to aggregating firms into clusters to generate enough time-series heterogeneity in bank
lending, which then allows us to control for observed and unobserved firm characteristics that are
shared by firms in the same cluster. In particular, we form firm clusters based on (i) the country
of incorporation, (ii) the industry, and (iii) the firm rating. The results confirm that European
borrowing firms that had lending relationships with banks that were significantly affected by the
sovereign debt crisis suffered a severe loan supply shock.
To provide evidence on what actually caused the contraction in bank lending and ultimately
the negative real effects for borrowing firms, we then determine for each bank in our sample to
which degree it is “affected” by the sovereign debt crisis. Affected is defined, in line with the three
potential channels through which the European Sovereign Debt Crisis might have affected bank
lending, as having an above median exposure to sovereign risk (balance sheet hit), a below median
capitalization or rating (risk-shifting), or an above median influence of governments (moral suasion).
To collect evidence for the hit on the balance sheet channel, we use data from the EBA’s EU-wide
stress tests and capital exercises and calculate each bank’s risk exposure to the sovereign debt
crisis. Furthermore, we obtain information about the banks’ health from SNL Financial (leverage)
and Bloomberg (ratings) to analyze whether GIIPS banks with low capital buffers engaged in risk-
shifting by buying additional domestic sovereign debt and cutting corporate lending. Finally, we
use data about government interventions, government bank ownership, and government board seats
to measure the influence of governments on their domestic banks and test whether real effects can
6

also be attributed to the moral suasion channel.
Using the modified version of the Khwaja and Mian (2008) estimator, our results show that
banks with larger sovereign risk in their portfolios reduce lending and charge higher loan spreads
in the crisis period more than banks with lower sovereign risk exposure. Furthermore, the findings
show that weakly-capitalized GIIPS banks cut their lending to the real sector and charge higher
spreads than well-capitalized GIIPS banks, irrespective of whether risk-shifting incentives are prox-
ied with leverage or rating. With regard to the moral suasion channel, none of the three proxies
indicates that moral suasion influenced bank lending during the sovereign debt crisis.
Given this evidence on the importance of the different channels on bank lending, we then check
whether these channels also play an important role in causing the real effects for borrowing firms.
For each firm in our sample, we determine how dependent the firm is on affected banks, where
affected is again defined according to the three possible channels. In line with our bank lending
regressions, our results confirm that the negative real effects of the sovereign debt crisis, which
can be attributed to the bank lending channel, are mainly caused by the hit on banks’ balance
sheets resulting from their large holdings of impaired sovereign debt and their incentive to engage
in risk-shifting behavior by buying risky sovereign bonds. Moral suasion, on the other hand, does
not seem to significantly impact the corporate policy of firms in our sample period.
In summary, we shed light on the complex interaction between bank and sovereign health
and its impact on the real economy. In particular, we show that there are significant spillovers
from periphery sovereigns to the local real economy, as well as cross-border spillovers to firms
in non-GIIPS countries that are transmitted through the bank lending channel. Therefore, we
document that, while the eurozone greatly benefits its members by deepening the degree of financial
integration, the extensive cross-border bank lending also facilitates the transmission of shocks
across the eurozone when the banking sector experiences an aggregate shock such as the periphery
sovereign crisis and remains undercapitalized.
I. Related Literature
In general, our paper contributes to the literature on how shocks on banks’ liquidity or solvency
are transmitted to the real economy. Starting with Bernanke (1983), several researchers have taken
on this theme.5
In particular, our paper adds to the literature on the consequences of the European Sovereign
Debt Crisis on bank lending. Existing theory suggests that sovereign crises can affect the real
economy through several channels in complex ways based on the nature of the interaction between
bank and sovereign health. According to Acharya, Drechsler, and Schnabl (2014b), distress in the
financial sector might induce governments to bailout weak banks, which, in turn, increases sovereign
credit risk. An increase in sovereign risk, however, lowers the value of both government guarantees
5For a comprehensive overview over the “natural experiment” literature on shocks that induce variation in thecross-section of credit availability, see Chodorow-Reich (2014).
7

and the banks’ bondholdings, thereby again weakening the financial sector. Bocola (2014) shows
that higher sovereign risk not only tightens the banks’ funding constraints, but also raises the risks
associated with lending to the corporate sector, both leading to a decrease in credit supply to firms.
Farhi and Tirole (2014) allow for both sovereign debt forgiveness and financial sector bailouts. With
this setup, the authors show that banks might have an incentive to engage in collective risk-shifting
by buying domestic bonds, which might not be prohibited by their domestic governments if there is
a possibility of sovereign debt forgiveness. Uhlig (2014) shows that governments in risky countries
have an incentive to allow their banks to load up on domestic sovereign debt if these bonds can be
used for repurchase agreements with a common central bank.
Regarding the empirical evidence, De Marco (2014) and Popov and Van Horen (2014) find that
after the outbreak of the European Sovereign Debt Crisis, non-GIIPS European banks that had
significant exposures to GIIPS sovereign bonds reduced lending to the real economy and increased
loan rates more than non-exposed banks. Similar to our study, De Marco (2014) and Popov
and Van Horen (2014) also use data on syndicated lending. Bofondi, Carpinelli, and Sette (2013)
confirm this finding using bank-firm matches from the Bank of Italy’s Credit Register data. Finally,
Becker and Ivashina (2014b) conclude that banks shifting from firm lending to increasing their
domestic sovereign bondholdings is aggravated by the moral suasion of European governments.
These studies, however, do neither analyze the consequences of the contraction in bank lending
during the sovereign debt crisis for the real economy, nor determine which channels actually cause
the significant negative effects for the real economy.
Most importantly, our paper adds to the natural experiment literature on the real effects of
bank lending supply shocks at the firm-level, which is a challenging task as it requires data on
bank-firm relationships, as well as firm-level information. Therefore, there have only been very few
papers addressing this research question. Regarding the recent 2007-2009 financial crisis, Chodorow-
Reich (2014) uses the DealScan database and employment data from the U.S. Bureau of Labor
Statistics Longitudinal Database to show that firms that had pre-crisis relationships with banks
that struggled during the crisis reduced employment more than firms that had relationships with
healthier lenders. Similarly, Bentolila, Jansen, Jimenez, and Ruano (2013) match employment
data from the Iberian Balance sheet Analysis System and loan information obtained from the Bank
of Spain’s Central Credit Register to document that during the recent financial crisis, Spanish
firms that had relationships with banks that obtained government assistance recorded a larger job
destruction than firms that were only exposed to healthy banks. Finally, Cingano, Manaresi, and
Sette (2013) use the Bank of Italy’s Credit Register database to provide evidence that firms which
borrowed from banks with a higher exposure to the interbank market experienced a larger drop in
investment and employment levels in the aftermath of the recent financial crisis.
However, the impact of sovereign debt crisis on bank lending is much more complex compared
to the bank lending supply shock caused by the recent financial crisis, which mainly impaired the
banks’ financial health. As shown by the theoretical literature, aside from its impact on bank
health, a sovereign debt crisis might additionally lead to a crowding-out of corporate lending as
8

it creates incentives for banks to increase their risky domestic sovereign bondholdings. Moreover,
governments might feel the need to pressure domestic banks to buy even more domestic sovereign
debt, which might also crowd out corporate lending. To our knowledge, our paper and a concurrent
paper by Balduzzi, Brancati, and Schiantarelli (2014) are the only papers that investigate the real
effects of the European Sovereign Debt Crisis. Using survey data on micro and small Italian firms,
Balduzzi, Brancati, and Schiantarelli (2014) find that firms with connections to banks with high
CDS spreads invest less, hire fewer workers, and reduce the growth of bank borrowing. In contrast,
we use data from syndicated loans, which is mainly used by large corporations. Therefore, our
estimates serve as a lower bound for the adverse effects of the bank credit supply shock in Europe,
since these effects are supposedly even more pronounced for smaller firms given their inability to
substitute bank financing with other funding sources.
Furthermore, Balduzzi, Brancati, and Schiantarelli (2014) do not investigate through which
channels the European Sovereign Debt Crisis actually caused a contraction in bank lending and
the resulting real effects for borrowing firms. Therefore, and most importantly, our paper is the
only one that sheds light on this open question. In particular, we are the first to document that
the negative real effects of the sovereign debt crisis are due to both risk-shifting behavior and a
reduction in bank health from exposures to impaired sovereign debt.
II. Data
We use a novel hand-matched dataset that contains bank-firm relationships in Europe, along
with detailed firm and bank-specific information. Information about bank-firm relationships are
taken from Thomson Reuters LPC’s DealScan, which provides a comprehensive coverage of the Eu-
ropean syndicated loan market. In contrast to the United States, bank financing is the key funding
source for firms in our sample since only very few bonds are issued in Europe (Standard&Poor’s,
2010). Figure 8 in the online appendix highlights that especially syndicated loans are an important
financing source for European non-financial corporations as on average between 2005 and 2009
roughly 20% of all extended loans to these firms were syndicated loans. We collect information on
syndicated loans to non-financial firms from all GIIPS countries. In addition, to be better able to
disentangle the macro and bank lending supply shock, we include firms incorporated in Germany,
France, and U.K. (non-GIIPS countries), which are the countries with the largest number of syn-
dicated loans among the European countries that were not significantly affected by the sovereign
debt crisis. Consistent with the literature (e.g., Sufi, 2007), all loans are aggregated to a bank’s
parent company. Our sample period covers the pre-crisis years starting in 2006 and ending in 2012,
such that we have a symmetric time window around the beginning of the European Sovereign Debt
Crisis.
We augment the data on bank-firm relationships with firm-level accounting data taken from
Bureau van Dijk’s Amadeus database. This database contains information about 19 million public
and private companies from 34 countries, including all EU countries. DealScan and Amadeus do
9

not share a common identifier. To merge the information in these databases, we hand-match firms
to the DealScan database. Amadeus groups firms into different size categories ranging from “Small”
to “Very Large”. Perhaps not surprisingly, firms in the intersection of Amadeus and DealScan are
either classified as “Large” or “Very Large”. For firms to be classified as large, they have to satisfy
at least one of the following criteria: operating revenue of at least 10 million Euro, total assets of at
least 20 million Euro, at least 150 employees, or the firm has to be publicly listed. The respective
criteria for very large companies are: at least 100 million Euro operating revenue, at least 200
million Euro total assets, or at least 1000 employees. Table XI in the online appendix compares
firms in the intersection of Amadeus and DealScan and the remaining firms from GIIPS countries
and Germany, France, and U.K. in the the category of ”Very Large” Companies in Amadeus. The
comparison shows that the firms in our sample are significantly larger and have a higher ratio of
tangible to total asset, but are comparable along other observable firm characteristics. Furthermore,
we hand-match our sample to the Capital IQ database to obtain detailed data on the whole debt
structure for a subsample of our firms including detailed information on total outstanding and
undrawn credit lines.
In addition, we augment the dataset with bank-level information from various sources. We get
data about the sovereign debt holdings of European banks from the EBA’s EU-wide stress tests and
capital exercises. Furthermore, we obtain information about the banks’ health from SNL Financial
(leverage) and Bloomberg (ratings). To get data about governmental influence on European banks,
we obtain data about government interventions compiled from information disclosed on the official
EU state-aid websites.6 Finally, we compile government bank ownership data from Bankscope,
and extract the fraction of directors affiliated with the respective government from the BoardEx
database. The exact definitions of all variables are summarized in Table I.
III. Financial and Real Effects of the European Sovereign Debt
Crisis
Our objective is to examine the association between a bank’s exposure to the European Sovereign
Debt Crisis and the resulting corporate policy of its borrowing firms. We expect that firms that
are more dependent on banks significantly affected by the sovereign debt crisis are more financially
constrained and thus behave differently both in terms of financial and real decisions compared to
less affected firms.
A. Methodology
We start with broadly assessing whether the European Sovereign Debt Crisis affected the real
economy through the bank lending channel. Therefore, to first capture all channels through which
banks were affected, we use a bank’s country of incorporation as a measure for its exposure to
6The data can be obtained from: http://ec.europa.eu/competition/elojade/isef/index.cfm?clear=1&
policy_area_id=3.
10

the sovereign debt crisis. In particular, we divide banks into two groups: (i) GIIPS banks, which
are banks headquartered in GIIPS countries given that these countries are most affected by the
European Sovereign Debt Crisis and (ii) non-GIIPS banks, that is, banks from Germany, France,
and the U.K., which are the countries with the largest number of syndicated loans among the
European countries that were not significantly affected by the sovereign debt crisis.
There are at least three reasons for choosing a bank’s country of incorporation as a proxy for
its exposure to the European Sovereign Debt Crisis. First, banks’ bond portfolios are generally
biased towards domestic sovereign bondholdings, implying that there is a strong positive relation
between a bank’s country of incorporation and its exposure to the sovereign debt of that country
(hit on balance sheet). Second, GIIPS banks have an incentive to buy additional risky domestic
debt (risk-shifting) and, third, GIIPS governments potentially pressure domestic banks to increase
their domestic sovereign bondholdings (moral suasion). All three channels could potentially lead to
a reduction in the corporate loan supply, either by reducing a bank’s debt capacity (hit on balance
sheet), or by crowding-out corporate lending (risk-shifting and moral suasion). In Section IV, we
then provide detailed evidence on which of these channels are of first-order importance for the
negative real effects incurred by the borrowing firms.
To measure a firm’s dependency on GIIPS banks in a given year, we determine the fraction of
the firm’s total outstanding syndicated loans that is provided by GIIPS lead arrangers. Therefore,
the GIIPS Bank Dependence of firm i in country j in year t is defined as:
GIIPS Bank Dependenceijht =
∑l∈Lijht
%GIIPS Lead Arranger in Syndicatelijht · Loan Amount lijht
Total Loan Amount ijht, (1)
where Lijt are all of the firm’s loans outstanding at time t. Our choice to measure GIIPS Bank
Dependence based on lead arrangers is motivated by the central role that these banks play in
originating and monitoring a syndicated loan (Ivashina, 2009). Therefore, when a lead arranger
either chooses or is forced to cut back its lending activities, we expect this to significantly impact the
borrowing firm. We follow Ivashina (2009) and identify the lead arranger according to definitions
provided by Standard & Poor’s, which for the European loan market are stated in Standard &
Poor’s Guide to the European loan market (2010). Therefore, we classify a bank as a lead arranger
if its role is either “mandated lead arranger”, “mandated arranger”, or “bookrunner”.
The change in a borrowing firm’s financial and real variables after the start of the European
Sovereign Debt Crisis is determined by a firm’s pre-crisis lending relationships (our main variable
of interest), its observable and unobservable firm characteristics, and an unobserved idiosyncratic
component uncorrelated with the observable and unobservable firm characteristics. To consistently
estimate the financial and real effects for borrowing firms of having a pre-crisis relationship with
banks affected by the sovereign debt crisis, we thus need statistical independence between a firm’s
pre-crisis lending relationships, in particular, its exposure to GIIPS banks, and the unobserved
firm characteristics that affect either their financial or real outcomes. Therefore, in our empirical
analysis, we control for a rich set of firm characteristics to remove any confounding factors and
avoid an omitted-variable bias.
11

In particular, we include firm fixed effects to capture unobserved time-invariant firm heterogene-
ity and firm-level control variables to capture other determinants of the firms’ corporate policies,
loan demand, and loan supply. These controls include firm size, leverage, net worth, the fraction
of tangible assets, the interest coverage ratio, and the ratio of EBITDA to total assets. For the
analysis of the firms’ the cash flow sensitivity of cash we also include a firm’s cash flow and its
capital expenditures.
Furthermore, GIIPS countries went through a severe recession starting in 2010 (2009 in the
case of Greece) while non-GIIPS countries were significantly less affected by economic downturns.
To alleviate concerns that our results are driven by different aggregate demand fluctuations in our
sample countries and/or in particular industries within our sample countries, we add interactions
between industry, year and country fixed effects remove the possibility of spurious results due to
time-varying shocks to an industry in a given country that may have affected the credit demand of
borrowing firms as well as their real outcomes.
Perhaps our biggest challenge is the concern that a firm’s dependency on GIIPS and non-GIIPS
banks might be determined by whether this firm has business in the respective countries. For
example, a German firm might choose to borrow from a Spanish bank because it has business in
Spain. If this is the case, we would potentially overestimate the negative real effects that can be
attributed to the bank lending channel since our results could then be driven by the possibility that
a firm’s business exposure to affected countries impacts both, its GIIPS Bank Dependence and the
negative real effects.
To address this concern, and ensure orthogonality between a firm’s GIIPS Bank Dependence
and its unobserved characteristics, our main specification also includes foreign bank country times
year fixed effects. Consider as an example a German firm borrowing from a Spanish and a German
bank. Besides the industry-country-year fixed effect, we include for this firm a Spain-year fixed
effect to capture the firm’s potential exposure to the macroeconomic downturn in Spain during the
European Sovereign Debt Crisis.
In the following, we present descriptive statistics and explore whether our identification as-
sumptions are plausible. In Panel A of Table II, we show the pre-crisis differences of the corporate
policies of firms across groups of high and low GIIPS Bank Dependence. The fact that there is no
systemic difference between the real outcomes of firms with high and low GIIPS Bank Dependence
before the European Sovereign Debt Crisis indicates that bank specialization by certain firm char-
acteristics or, more general, bank-firm matching cannot explain the real outcomes for borrowing
firms in a bivariate OLS context.
Panel B of Table II presents descriptive statistics for the firm-level control variables, split into
firms with high and low GIIPS Bank Dependence in the pre-crisis periods. Firms with high GIIPS
Bank Dependence tend to be larger, have more tangible assets, a higher leverage, and lower interest
coverage ratios. To test these observed differences more formally, we follow Imbens and Wooldridge
(2009) and report the normalized difference of the two subsamples that are defined as the averages
by treatment status, scaled by the square root of the sum of the variances, as a scale-free measure
12

of the difference in distributions. This measure avoids the mechanical increase in sample size, that
one typically observes when reporting t-statistics. Imbens and Wooldridge (2009) suggest as a rule
of thumb that the normalized difference should not exceed an absolute value of one quarter. We
also report standard t-statistics for the difference in means between the two groups. As can be seen
in Panel B of Table II, only total assets is close to (but still below) this threshold (t-tests reveal
significant differences for total assets and tangibility) while all others are well below this threshold,
suggesting that firms in the two groups are comparable along most observable dimensions.
The descriptive statistics also help to rule the possibility of spurious results due to an endogenous
matching of firms and banks in the pre-crisis period that is driven by firm quality. If low quality
firms were more likely to enter into business relationships with GIIPS banks before the European
Sovereign Debt Crisis, our results could be driven by the fact that these firms are less resilient
against the shock of the crisis. However, the fact that there is no systematic difference between the
corporate policies and real outcomes of firms with high and low GIIPS Bank Dependence before
the European Sovereign Debt Crisis and that the correlation between GIIPS Bank Dependence and
the firm control variables is in general very low alleviates this concern.
Furthermore, to ensure that the negative real effects for borrowing firms are actually caused
by the shock of the European Sovereign Debt Crisis on GIIPS banks, we have to rule out two
alternative explanations for how firms’ pre-crisis lending relationships could have affected loan
outcomes and, in turn, the firms’ financial and real decisions.
First, GIIPS banks might have been already less healthy than non-GIIPS banks in the pre-crisis
period. This would not have necessarily affected firms borrowing from GIIPS bank in the pre-crisis
period. However, a lower bank health might have made GIIPS banks less resilient against the crisis.
In this case, the real effects for borrowing firms would not solely be caused by the negative impact of
the European Sovereign Debt Crisis on banks, but, in addition, by the fact that GIIPS banks were
less able to cope with the consequences of the crisis. To address this possibility, Panel E of Table II
presents descriptive statistics for various bank quality measures, split into GIIPS and non-GIIPS
banks in the pre-crisis period. We report the normalized difference and t-statistics below the table.
The results show that GIIPS banks are smaller and have significantly higher equity ratio compared
to non-GIIPS banks, while impaired loans to equity, the Tier 1 ratio, and the average 5-year CDS
Spread are not significantly different across the two subgroups of banks. Therefore, we can reject
the possibility that the negative real effects for borrowing firms are caused by a lower pre-crisis
quality and, in turn, lower crisis resilience of GIIPS banks. If anything, GIIPS banks seem to be
in better shape than non-GIIPS banks before the crisis.
Second, we have to rule out the possibility that the negative real effects are caused by ex-ante
differences in the quality of the loan syndicates. If, for some reason, better non-GIIPS banks have
avoided entering into loan syndicates with GIIPS banks, GIIPS banks would have been left with
ex-ante worse non-GIIPS banks. For example, despite the fact that firms with high and low GIIPS
Bank Dependence do not differ significantly, there could be ex-ante information asymmetries be-
tween non-GIIPS banks and firms regarding the resilience of GIIPS banks against a future crisis.
13

Hence, in contrast to borrowing firms, better non-GIIPS banks might have foreseen the conse-
quences of the European Sovereign Debt Crisis for GIIPS banks. This would imply that syndicates
with GIIPS lead arrangers would be of lower quality to begin with, which could drive our results.
To alleviate this concern, we divide non-GIIPS banks into two groups: banks with an above median
fraction of deals with GIIPS banks and those with a below median fraction of deals with GIIPS
banks. Comparing these two groups of banks, we find that they do not differ in terms of capital
ratios and that non-GIIPS banks that are issuing a high fraction of loans with GIIPS banks have a
lower fraction of impaired loans (see Panel F of Table II). CDS spreads again do not differ between
these two groups of banks. Hence, the negative real effects for borrowing firms do not seem to be
caused by an ex-ante lower quality of syndicates that include GIIPS banks.
B. Empirical Results for Main Specification
This section presents results for the effect of a firm’s GIIPS Bank Dependence on its financial
and real outcomes. For the analysis, we divide our sample into two periods: one before the sovereign
debt crisis (2006-2008 for Greece, 2006-2009 for all other countries) and one during sovereign debt
crisis (2009-2012 for Greece, 2010-2012 for all other countries).7 This yields a symmetric time
window around the beginning of the European Sovereign Debt Crisis. We construct an indicator
variable, Crisis, which is equal to one if the financial information reported in Amadeus falls in the
respective crisis period. It is important to note that our results are robust to choosing alternative
definitions of the crisis period, that is, setting the start of the crisis period in Greece to 2010 and/or
the start of the crisis period in Ireland and Portugal to 2009.
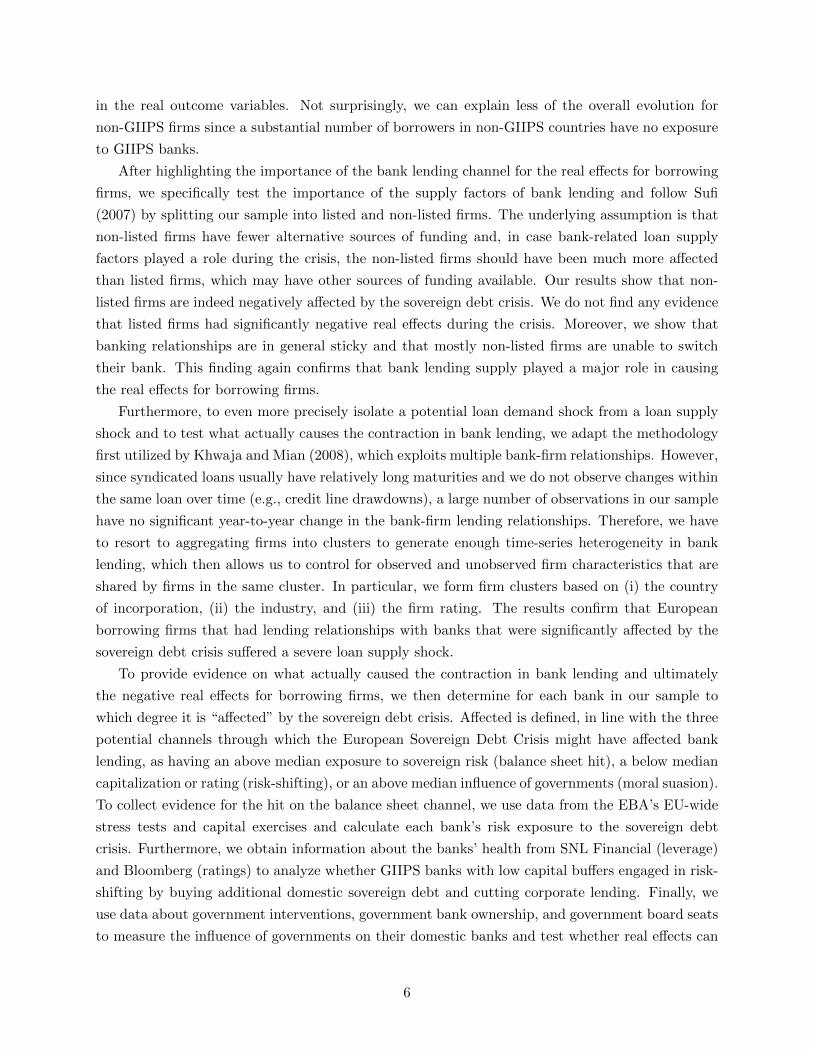
We begin by exploring the effect of the sovereign debt crisis on several firm outcomes graphically.
In Panels A-C in Figure 1, we plot the time series of the average employment growth rates, the
investment levels, and sales growth rates, respectively, for firms with a high and low GIIPS Bank
Dependence, which is defined in Eq. (1). Figure 1 suggests that, while the pre-crisis trend is similar
for the two groups of firms, a higher GIIPS Bank Dependence leads to larger negative real effects
during the crisis period. For example, employment growth rates for borrowing firms with a high
GIIPS Bank Dependence do not recover during the crisis period while employment rates for firms
with a lower GIIPS Bank Dependence show an increase. Similar results can be found for the other
dependent variables.
To formally investigate whether borrowing firms with significant business relationships to GIIPS
banks became financially constrained during the sovereign debt crisis, we follow Almeida, Campello,
and Weisbach (2004). They show that firms that expect to be financially constrained in the future
respond by saving more cash out of their cash flow today, whereas financially unconstrained firms
have no significant link between their cash flow and the change in cash holdings. For the cash flow
sensitivity of cash, we thus employ the following specification for firm i in country j and industry
7In 2009, Greek bond yields started to diverge from the yields of other eurozone members and the Greek 5-yearsovereign CDS spread escalated from 100 basis points in May 2009 to 250 points by the end of the year. During 2010investors also started to lose confidence in Italy, Ireland, Portugal, and Spain. For these countries, the CDS spreadsmore than doubled between March and May 2010.
14

h:
∆Cashijht+1 = α+ β1 ·GIIPS Bank Dependenceijh,min{t,tlj} + β2 · Crisisjt · Cash Flow ijt
+ β3 ·GIIPS Bank Dependenceijh,min{t,tlj} · Crisisjt+ β4 ·GIIPS Bank Dependenceijh,min{t,tlj} · Cash Flow ijht
+ β5 ·GIIPS Bank Dependenceijh,min{t,tlj} · Crisisjt · Cash Flow ijht
+ β6 · Cash Flow ijht + γ ·Xijht + Firmijh + Industryh · Countryj ·Year t+1
+ ForeignBankCountryk 6=j ·Year t+1 + uit+1. (2)
where tlj refers to the last pre-crisis year (2008 for Greece, 2009 for other countries). Note that
we keep the GIIPS Bank Dependence constant at its pre-sovereign debt crisis level for each crisis
year to address the concern that firms with bad performance during the crisis lost the opportunity
to get funding from non-GIIPS banks and thus could only rely on GIIPS banks.8 Otherwise, our
results could be biased since badly performing firms then have a higher GIIPS Bank Dependence
due to the lack of alternative funding sources, and we could not attribute the effects we find to the
credit crunch.
The unit of observation is a firm-year. Our key variables of interest in regression Eq. (2) is the
firms’ cash flow sensitivity of cash during the crisis period (β5 in Eq. (2)). If firms with a high
GIIPS Bank Dependence become financially constrained during the sovereign debt crisis, we expect
that they save more cash out of their generated cash flows to build up a liquidity buffer against the
possibility of not being able to obtain additional funding in the future, that is, we expect β5 in Eq.
(2) to be positive.
For the firms’ employment growth and sales growth rates as well as their net debt and investment
levels we estimate the following panel regressions:9
yijht+1 = α+ β1 ·GIIPS Bank Dependenceijh,min{t,tlj}
+ β2 ·GIIPS Bank Dependenceijh,min{t,tlj} · Crisisjt+ γ ·Xijht + Firmijh + Industryh · Countryj ·Year t+1
+ ForeignBankCountryk 6=j ·Year t+1 + uit+1. (3)
The unit of observation is again a firm-year. Our key variables of interest in regression Eq. (3) is
the firms’ GIIPS Bank Dependence during the crisis period (β2 in Eq. (3)). If firms were adversely
affected by the sovereign debt crisis through the bank lending channel, then we expect β2 in Eq.
(3) to be negative.
8As indicated by the term min{t, tlj}. We obtain qualitatively similar results if we use the average (2005 to 2009)pre-crisis GIIPS Bank Dependence of each firm (please see Panel C of Table XIV in the online appendix) or if weallow the GIIPS Bank Dependence to be time varying during the crisis period as well. The reason is that lendingrelationships are quite sticky (see Section III.D for more details).
9Since roughly 90% of our observations have no information on R&D expenses in Amadeus, we cannot investigatethe impact of GIIPS bank dependence on R&D.
15

The results of our main specification of how GIIPS Bank Dependence is affecting firms’ financial
and real decisions are presented in Table III. Column (1) provides results for net debt ((current
+ non-current liabilities - cash)/total assets). The coefficient of the interaction of GIIPS Bank
Dependence with the Crisis dummy (β2 in Eq. (3)) is negative, indicating that during the sovereign
debt crisis, firms with higher exposure to GIIPS banks reduced external debt financing more than
other firms. A one standard deviation higher GIIPS Bank Dependence during the crisis period
leads to a reduction in net debt of 1.5 percentage points.10
Column (2) of Table III presents results for the degree to which firms save cash out of their cash
flow. The coefficient of the triple interaction of GIIPS Bank Dependence with cash flow and the
Crisis dummy (β5 in Eq. (2)) is statistically significant at the 5% level. This positive coefficient
implies that a higher GIIPS Bank Dependence induces firms to save more cash out of their cash
flow for precautionary reasons. Note that there is no significant relation between the GIIPS Bank
Dependence of a borrowing firm and its propensity to save cash out of its cash flow in the pre-crisis
period. Furthermore, firms in general do not show the typical behavior of financially constrained
firms during the crisis, as can be seen from the insignificant interaction term of cash flow with
the crisis dummy. More precisely, a one standard deviation higher GIIPS Bank Dependence of
borrowing firms during the crisis implies that these firms save 3 cents more per euro of cash flow.
This compares well to the magnitudes found by Almeida, Campello, and Weisbach (2004), who
show that financially constrained firms save on average 5-6 cents per dollar of cash flow, while
financially unconstrained firms have no significant relation between cash flow and the change in
cash holdings. Taken together, these results indicate that firms with a high GIIPS Bank Dependence
become financially constrained during the crisis.
Acharya, Almeida, Ippolito, and Perez (2014a) show that firms with higher liquidity risk are
more likely to use cash rather than bank credit lines for liquidity management because the cost of
credit lines increases with liquidity risk. This is due to the fact that banks retain the right to revoke
access to liquidity precisely in states where the firms need liquidity due to, for example, a liquidity
shortfall because of negative cash flows. Since banks themselves faced a substantial liquidity shock
during the sovereign debt crisis, we expect that firms with a high GIIPS Bank Dependence could
lose access to their bank credit lines either because the credit lines are not prolonged or cut off.
These firms should thus increasingly rely on cash rather than on lines of credit to manage their
liquidity.
To test this implication, we follow Acharya et al. (2014a) and hand-match our sample to the
Capital IQ database. This enables us to obtain data on the whole debt structure for a subsample
of our firms including detailed information on total outstanding and undrawn credit lines. We
construct two measures for the liquidity composition of borrowing firms from these data. First, we
consider the fraction of the total amount of outstanding credit lines over the sum of the amount of
total outstanding credit line and cash. Second, we construct a measure that captures the fraction
of undrawn credit lines (i.e., the amount of a firm’s credit line that is still available and can be
10Results are qualitatively similar if we use the leverage ratio instead of net debt as the dependent variable.
16

drawn in case of liquidity needs) over undrawn credit lines and cash. In Panels A and B of Figure
2, we plot the time series of the average total and undrawn credit lines. We show that there is a
clear change in firm liquidity management during the sovereign debt crisis. Column (3) of Table III
reports results for a firm’s overall credit line, whereas column (4) reports results for the undrawn
credit lines. Across both specifications, we find that firms with a higher GIIPS Bank Dependence
are less able to rely on secure funding from lines of credit.11
To summarize, our results on the firms’ financial policy indicate that firms with a high GIIPS
Bank Dependence show the typical pattern of financially constrained firms during the sovereign
debt crisis. They rely more on cash holdings for their liquidity management because the possibility
of getting liquidity from their bank lines of credit becomes more uncertain. Hence, if firms became
financially constrained during the sovereign debt crisis due to the lending behavior of their main
banks, then these firms should also have responded by adjusting their real activities.
Therefore, we next examine how the sovereign debt crisis impacted the corporate policies of
firms. We estimate panel regressions (see Eq. (3)) where yijt+1 measures employment growth (∆ log
Employment), investment (CAPX /Tangible Assets), or sales growth (∆ log Sales), respectively.12
Table III presents the results. Consistent with the suggestive evidence from Figure 1, Columns
(5)-(7) show that firms with a high GIIPS Bank Dependence had a significantly lower employment
growth rate, cut investment by more, and experienced a larger sales growth reduction than firms
that were less dependent on GIIPS banks. More precisely, a one standard deviation higher GIIPS
Bank Dependence of borrowing firms during the sovereign debt crisis leads to a 4.1 percentage point
reduction in employment growth, a 6 percentage point decrease in capital expenditures, and a 4.9
percentage point decrease in sales growth.
C. Controlling for Firms’ Business Exposure to the Sovereign Debt Crisis
In our main specification, we ensure the statistical independence between a firm’s GIIPS Bank
Dependence and its unobservable firm characteristics by controlling for a firm’s business exposure
to its foreign lenders’ home countries via fixed effects. In this section, we alternatively identify the
real effects caused by the decrease in loan supply by tracking the change in corporate policies of
non-GIIPS firms that had a pre-crisis relationship to a GIIPS bank. The strategy is similar to the
one applied by Peek and Rosengren (1997), who also use domestic firms (in their case U.S. firms)
that had borrowed from foreign banks (in their case Japanese banks) to isolate supply effects of the
bank lending channel. However, compared to their approach, we take two additional precautionary
steps to ensure that the results are not driven by the possibility that domestic firms that borrowed
from a foreign bank are also more likely to have business exposure to the respective country and
are thus potentially also affected by the macroeconomic downturn in this country.
11Given the smaller number of observations in this analysis, we cannot use it in our various sample splits. Moreover,we have to drop foreign bank country*year fixed effects for this analysis due to limited number of observations.
12Amadeus does not report capital expenditures. We construct a proxy for investments using the following proce-
dure:Fixed Assetst+1−Fixed Assetst+Depreciation
Fixed Assetst. We set CAPX to 0 if negative.
17

First, we restrict our sample to firms that are not directly affected by the macroeconomic
shock in the periphery of the eurozone or any other part of the world. In particular, we restrict
our sample to non-GIIPS firms without subsidiaries in a GIIPS or any other non-EU country
(e.g., a German firm without subsidiaries). To this end, we collect information on all foreign
and domestic subsidiaries of the borrowing firms in our sample, along with information about the
revenues generated by their subsidiaries.13
To enhance our understanding of how the firm-bank relationships between non-GIIPS firms
without GIIPS subsidiaries and GIIPS banks emerged, we investigate the history of these lending
relationships prior to our sample period. Two main explanations for the existence of these firm-
bank relationship stand out, which can jointly explain roughly 90% of the lending relationships.
First, many non-GIIPS firms inherited their relationship to a GIIPS bank through bank mergers
or acquisitions. That is, the firm had a relationship to a domestic bank, that was later acquired by
a foreign GIIPS bank. Consider as an example the German catering firm “Die Menu Manufaktur
Hofmann”, a firm located in Southern Germany that delivers food to canteens of hospitals, corpo-
rations, etc. Figure 3 shows that its business activities are limited to Germany and Austria. Before
our sample period begins, this company obtained a loan from the Bavarian-based Bayerische Hypo-
und Vereinsbank AG which was later acquired by the Italian bank UniCredit in 2005. After 2005
all its syndicated loans were originated by UniCredit. Second, some foreign GIIPS banks have his-
torically a large presence in non-GIIPS countries. The main example here is Bank of Ireland, which
was the fifth largest bank in terms of the number of deals in the U.K. in 2006 (ranked only after
the four largest British banks). Therefore, a large fraction of the firm-bank relationships between
non-GIIPS firms without GIIPS subsidiaries and GIIPS banks were established due to reasons that
were not related to the geographical distribution of the firms’ business exposure.
As a second precautionary step, we thus restrict our analysis to non-GIPPS firms whose lending
relationship to a GIIPS firm can be explained by one of these two main explanations. That is, that
they either inherited their pre-crisis lending relationship with a GIIPS banks due to an acquisition
or that they pre-crisis borrowed from a GIIPS bank that is very active in the respective country’s
credit market on a regular basis. Applying these two preventive measures alleviates the concern
that a non-GIIPS firm’s dependency on GIIPS banks might be determined by whether this firm
has business in the periphery of the eurozone and thus ensures statistical independence between a
firm’s GIIPS Bank Dependence and its unobservable firm characteristics.
In Panels A-C of Figure 4, we plot the time series of the average employment growth rates, the
investment levels, and sales growth rates, respectively, of the firms in this subsample. The figure
shows that also for non-GIIPS firms without GIIPS subsidiaries, firms with a higher GIIPS Bank
Dependence suffered larger negative real effects during the crisis period, while their pre-crisis trend
was comparable to firms that were less dependent on GIIPS banks. This suggestive evidence is
consistent with the evidence presented in Panels A-C in Figure 1.
13Ideally, we would also like to control for the export/import dependence of our firms and their subsidiaries tospecific countries. These data, however, are only available for a very small subsample of our firms in Amadeus,rendering it impossible to also control for export/import dependence.
18

For the formal analysis, we apply specifications that are very similar to our main specifications
from Eqs. (2) and (3). The only difference is that due to the reduced sample size, we cannot control
for both industry-country-year fixed effects and foreign bank country-year fixed effects at the same
time in the subsidiary analysis. We therefore include industry-year and foreign bank country-year
fixed effects, assuming that industry-specific shocks in non-GIIPS countries were similar. Panel A
of Table IV provides multivariate results for the evidence presented in Figure 4. As the table shows,
all results continue to hold, confirming that the decline in lending of banks, which are adversely
affected by the sovereign debt crisis, has negative real effects for borrowing firms. Panel C of Table
II shows that firms in this subsample do not differ across GIIPS Bank Dependence, which again
rules out that there is an endogenous matching of firms and banks in the pre-crisis period that is
driven by firm quality.
D. Supply and Demand Factors of Bank Lending
To further evaluate the importance of the bank lending channel for the real effects suffered by
borrowing firms, we now consider supply and demand factors of bank lending in more detail. In
particular, we analyze whether only firms that were prone to becoming financially constrained are
actually incurring negative real effects when having a high GIIPS Bank Dependence. In contrast,
firms that were either very likely able to substitute the reduction in loan supply with other means
of financing or which recorded an even larger decrease in loan demand, in which case the reduction
in loan supply did not lead to a financing shortage, should not display additional negative real
effects of having a high GIIPS Bank Dependence.
We start with analyzing the latter, that is, testing whether firms that were more exposed to the
negative macroeconomic shock in the periphery of the eurozone, and, in turn, had a lower demand
for bank loans, suffered less real effects through the bank lending channel compared to firms that
had less business exposure to the affected regions. To check this, we use the revenue information
for all foreign and domestic subsidiaries of the borrowing firms in our sample to determine each
firm’s geographical revenue distribution.
As shown by Panel A of Table IV, non-GIIPS firms that had no observable business exposure to
GIIPS countries did display strong negative real effects of having a high GIIPS Bank Dependence.
In contrast, according to the above-mentioned arguments, we would expect that the real effects of
having a high GIIPS Bank Dependence are significantly less pronounced for non-GIIPS firms that
had business exposure to GIIPS countries (e.g., a German firm with subsidiaries in Italy or Spain)
and thus had a lower demand for bank loans. Indeed, looking at Panel B of Table IV, these firms
seem less financially constrained when having a high GIIPS Bank Dependence and, in line with
this result, we find weaker negative effects for employment and no negative effects for investments
and sales growth.
As an additional robustness check, we do the same exercise for GIIPS firms and split them
according to their business exposure to non-GIIPS countries. For GIIPS firms, we would expect
to see larger negative real effects of having a high GIIPS Bank Dependence for firms that have a
19

large fraction of their revenue generated by non-GIIPS subsidiaries (e.g., a Spanish firm that has
a significant fraction of its revenues generated by a German subsidiary) compared to GIIPS firms
that generate their revenue mainly in GIIPS countries. Therefore, we first restrict our sample to
GIIPS firms with an above median fraction of their revenue generated by non-GIIPS subsidiaries.
Panels A-C of Figure 5 show that firms with higher dependence on GIIPS banks have to incur
larger negative real effects. Consistent with this suggestive evidence, the formal analysis presented
in Panel C of Table IV shows that indeed GIIPS firms with a high fraction of their revenue gen-
erated by foreign non-GIIPS subsidiaries suffer significant real effects of having a pre-crisis lending
relationship with GIIPS banks. In contrast, when looking at Panel D of Table IV, we again find
weaker effects for GIIPS firms with a majority of their business in GIIPS countries (e.g., a Spanish
firm without subsidiaries) both in terms of economic and statistical significance.
To further analyze the importance of supply versus demand factors for bank lending, we follow
Sufi (2007) and split our main sample into listed and non-listed firms. The underlying assumption
is that non-listed firms have fewer alternative sources of funding, since they are not able to raise
additional public equity or issue bonds, implying that these firms are more bank-dependent. More-
over, there is less publicly available information for non-listed firms, requiring more monitoring and
information collection on the banks’ side. Overall, in case bank-related loan supply factors play a
role during the crisis, non-listed firms should thus be much more affected than listed firms, which
have potentially other sources of funding available. Indeed Becker and Ivashina (2014b) show that
very large firms with access to alternative funding sources (e.g., bonds) are able to substitute the
lack of funding from banks.
Panel A of Table V presents the results for the subsample of listed firms, whereas results for
non-listed firms are presented in Panel B of Table V. As can be seen from the table, our results
continue to hold for non-listed firms; however, we do not find any evidence that listed firms show
the typical behavior of a financially constrained firm or that they have significantly negative real
effects during the crisis period. In line with the argument of Becker and Ivashina (2014b), listed
firms thus seem to be able to substitute the lack of bank financing with other funding sources,
whereas non-listed firms cannot easily alter their funding sources. As a further robustness check
we split our sample into rated and unrated firms. Results are presented in Table XIII in the online
appendix. As can be seen, all our results are driven by firms without access to the public bond
market. Only for unrated firms we find significant real effects that can be attributed to banks’
lending behavior.
Furthermore, larger and public firms should also find it easier than smaller and private firms
to borrow from other banks than their previous relationship lender. Therefore, we investigate in
greater detail the evolution of bank relationships during the crisis period. Previous work (e.g.,
Chodorow-Reich (2014)) documents that bank relationships in the syndicated loan market are
sticky, suggesting that most firms do not switch banks. Indeed, we find in our sample as well
that for roughly 80% of firms the GIIPS Bank Dependence does not change throughout the sample
period. As expected, mostly listed firms with better access to alternative funding sources and
20

thus potentially higher bargaining power are able to switch banks. In contrast, 70% of firms with
constant bank relationships are non-listed firms. Panel C of Table V shows that all results continue
to hold for the subsample of firms that do not switch banks, whereas we do not find significant
effects for firms that switch banks. Firms that switch banks only differ in size and whether they
are public or not from firms that do not switch banks. Along all other observable dimensions they
are similar. This finding again confirms that the bank lending supply shock that occurred during
the European Sovereign Debt Crisis played a major role in causing the real effects for borrowing
firms.
Therefore, two important contributions of this study are: (i) we document the existence of strong
spillovers from high-spread euro area sovereigns to the local real economy through the bank lending
channel and (ii) we show that there are significant cross-border spillovers from the sovereign debt
crisis in GIIPS countries to firms in non-GIIPS countries that are also transmitted through the bank
lending channel. Therefore, while the euro greatly benefits its members by deepening the degree
of financial integration, the extensive cross-border bank lending has facilitated the transmission of
shocks across the eurozone.
E. Aggregate Effects
With some additional assumptions, we can use the firm-level results for the different subsamples
from Table IV to inform the debate regarding the aggregate effects of the loan supply shock of the
European Sovereign Debt Crisis. The strategy to estimate aggregate effects is similar in spirit to
the procedure used in Chodorow-Reich (2014). In a nutshell, we will estimate for each borrower
what his performance would have been, if he had borrowed from the most liberal syndicate, which
in our case is a syndicate with zero GIIPS Banks acting as lead arrangers. Before we detail our
procedure, it is important to emphasize that the analysis performed in this section is a partial
equilibrium analysis, that is, we assume that the overall real effect equals the sum of the real effects
at the firm level. Moreover, it is important to acknowledge that the we assume that the most
liberal syndicate did not shift its lending supply function. In what follows, we explain our strategy
to estimate aggregate effects using employment growth rates as an example. We perform the same
analysis for investment and sales growth rates.
We start by defining the counterfactual employment growth rate of Firmijh if it had borrowed
entirely from non-GIIPS banks.
yijht = yijht − β1 ·GIIPS Bank Dependenceijh,min{t,tlj}
− β2 ·GIIPS Bank Dependenceijh,min{t,tlj} · Crisisjt, (4)
where yijt denotes the fitted value from the respective regression. In the case of employment, we
then use the counterfactual employment growth rate to calculate the counterfactual employment
level Empijt and similarly the fitted value employment level Empijt. The total losses due to the
21

bank lending shock during the crisis period are then given by
Total Losses =∑ijht
[Empijht − Empijht]. (5)
The fraction of the sample net employment change during the crisis that is caused by banks’ lending
behavior is then given by
∑ijt [Empijht − Empijht]∑
ijt[Empijht−1 − Empijht]. (6)
In reporting our results, we focus on the two subsamples of firms, where we are best able to
disentangle the macroeconomic shock from the bank lending shock. Looking at the results for
GIIPS firms with a high fraction of revenue generated by non-GIIPS subsidiaries first, we find
that overall employment fell by 5.6% during the European Sovereign Debt Crisis period. Our effect
accounts for 53.6% of this decline, that is, firms would have cut employment by 53.6% less, had they
borrowed from syndicates without GIIPS Banks acting as lead arrangers. Similarly, investment fell
by 13% of which 43.2% can be explained by banks’ lending behavior. For the evolution of sales, we
find an overall decrease of 3.6% over the European Sovereign Debt Crisis period of which we can
explain 37%.
Considering the sample of non-GIIPS firms without subsidiaries in GIIPS or other non-EU
countries, we find that overall employment decreased by 1.6% during the European Sovereign Debt
Crisis period. We can attribute 25% of this decline to the bank lending supply shock. Similarly,
investment fell by 2% of which we can explain 24.8% with a contraction in bank lending. Finally,
sales decreased by 2% and we are able to explain 21.4% of this reduction in sales by the loan supply
shock.
There are two things to note about these magnitudes. First, perhaps not surprisingly, the
reduction in employment, investment, and sales was smaller in non-GIIPS countries, which were
less affected by the European Sovereign Debt Crisis, than in GIIPS countries. Second, we can
explain less of the overall reduction in employment, investment, and sales in non-GIIPS countries.
The main reason for this is that a considerable number of non-GIIPS firms without subsidiaries in
GIIPS or other non-EU countries have zero exposure to GIIPS banks, implying that for them yijt
equals yijt. Put differently, for a substantial number of non-GIIPS firms in this subsample there
are no loan supply disruptions caused by GIIPS banks implying, that, overall, we can explain less
of the overall macroeconomic evolution.
IV. Active and Passive Transmission Channels
Given that firms that had a pre-crisis lending relationship with a bank affected by the European
Sovereign Debt Crisis, which we so far broadly measured by the banks’ country of incorporation,
suffered significant negative real effects, in this section, we shed more light on how exactly sovereign
22

credit risk translated into the bank lending contraction and the resulting negative real effects for
borrowing firms.
Compared to financial crises, which only impaired the banks’ financial health, the impact of
sovereign crises on bank lending is much more complex. There are at least three potential channels
through which banks might have been affected by the European Sovereign Debt Crisis: one passive
and two active.
The passive channel works through the dramatic increase in credit risk of GIIPS sovereign debt
during the sovereign debt crisis. Recent data published by the EBA show that banks generally
had large direct holdings of domestic government debt. Therefore, the increase in risk of GIIPS
sovereign debt directly translated into losses that weakened the asset side of GIIPS banks’ balance
sheets and as a result made these banks riskier (Acharya and Steffen, 2014). This can lead to losses
for the banks via three channels: (i) banks sell government bonds realizing a loss (ii) bonds are
in the trading book and therefore marked to market (iii) bonds are pledged to ECB which makes
margin calls in case the value of the collateral falls. Table XVII in the online appendix shows that
indeed there is a significant positive relationship between banks’ GIIPS sovereign debt holdings
and their CDS spreads over the crisis period. To cope with these losses, GIIPS banks might have
deleveraged and reduced lending to the private sector (e.g., Bocola, 2014). We call this the “hit on
balance sheet channel”. This effect is amplified by the significant withdrawal of wholesale funding
by U.S. money market funds (Ivashina, Scharfstein, and Stein, 2015).
To get a better idea of how strongly a bank is affected by the risk of its domestic sovereign
portfolio, we construct a similar measure as in Popov and Van Horen (2014), and measure the
dependency on domestic sovereign risk of bank b in year t as follows:
Domestic Sovereign Debt Risk bt =Domestic Sov. Bondholdingsbt ·Domestic Sov. CDS t
Total Assetsbt. (7)
Given that the sovereign bondholdings are multiplied with the respective CDS spreads, this measure
accounts for the amount of domestic sovereign bondholdings of the respective bank, as well as for
the risk associated with these holdings. We classify a bank as affected if its CDS-weighted holdings
of domestic sovereign debt are above the sample median.
The two active channels are the risk-shifting channel and the moral suasion channel. The risk-
shifting motive arises since, as default risk of GIIPS countries increases, highly levered GIIPS banks
have an incentive to increase their domestic sovereign bondholdings (Diamond and Rajan, 2011;
Crosignani, 2014). The reason for this behavior is as follows. In case a bank wants to engage in
risk-shifting, it is looking for an asset that is correlated with the bank’s other sources of revenue and
that, at the same time, offers a comparatively high expected return. In particular, the asset should
only generate large losses in states of the world in which the bank is in default anyway. Since
banks usually have large holdings of domestic government debt (e.g., the holdings of domestic
sovereign bonds of Unicredit and Intesa in mid 2011 amounted to 121 percent and 175 of their core
capital, respectively), they would fail anyway as soon as their domestic government is not able to
23
repay its sovereign debt.14 Furthermore, during the European Sovereign Debt Crisis, the sovereign
debt of GIIPS countries promised a high return, thereby making this asset class very attractive
for risk-shifting purposes. In addition, according to the “Capital Requirements Directive” (CRD),
European regulators consider that sovereign bonds are risk-free (i.e., attach zero risk weights); thus,
banks do not need to hold any capital against potential losses on government bonds. On top of
that, European regulators removed the concentration limits for sovereign debt exposures, while
the exposure to a single borrowing firm is limited to 25% of a bank’s Tier 1 capital. For these
reasons, sovereign debt allows larger bets compared to other asset classes, in particular corporate
loans. Furthermore, for risk-shifting purposes, corporate loans have in addition the disadvantage
that they have an idiosyncratic risk component, while the banks’ domestic sovereign debt holdings
all default in the same states of the world.
One might argue that banks might have an incentive to buy the GIIPS sovereign debt that
generates the highest yields, which during the European Sovereign Debt Crisis was Greek sovereign
debt. However, even though there probably is a positive correlation between the default probability
of Greek and other GIIPS sovereign debt, the relationship is far from being perfectly correlated.
Since non-Greek GIIPS banks hardly had any exposure to Greek sovereign debt during the European
Sovereign Debt Crisis (in fact already at the beginning of the European Sovereign Debt Crisis
in early 2010 periphery banks had 90% of their GIIPS sovereign bond holdings from their own
sovereign; this number rose to 97% by the end of 2012 (Crosignani, 2014)), it is very unlikely
that non-Greek GIIPS banks would fail in case Greece defaults on its sovereign debt. Therefore,
for these banks, domestic dominates Greek sovereign debt with regard to its suitability as a risk-
shifting asset. This incentive of GIIPS banks’ to engage in risk-shifting by loading up on risky
domestic sovereign debt might have led to a crowding-out of lending to the private sector during
the sovereign debt crisis.
We apply two different measures to identify which banks are weakly-capitalized and thus more
prone to risk-shifting behavior. First, we consider a GIIPS bank to be weakly-capitalized if its
ratio between total equity to total assets (obtained from SNL Financial) at the end of 2009 is below
the sample median. Second, as a robustness check, we use the banks’ rating before the sovereign
debt crisis (i.e., at the end of 2009) as an alternative measure of bank health. To determine
the rating cutoff, we follow Drechsler, Drechsel, Marques-Ibanez, and Schnabl (2014) and use the
ratings (obtained from Bloomberg) from the main rating agencies (Moody’s, Standard & Poor’s,
and Fitch). We then assign a numerical value to each rating: 1 for AAA, 2 for AA+, and so on.
We then compute the median rating for each bank. This rating measure has the advantage that it
is based on assessments by market participants, rather than on accounting-based measures.
The second active channel that might have led to a crowding-out of corporate lending is the
moral suasion channel (see Becker and Ivashina, 2014b). As the sovereign debt crisis peaked,
governments in GIIPS countries faced severe problems in refinancing their debt. In these cases,
governments may turn to their domestic banks and force them to purchase domestic sovereign debt.
14“Europe’s Banks Struggle With Weak Bonds” by Landon Thomas Jr., NYTimes.com, August 3, 2011.
24

We use three proxies for the degree to which banks are prone to moral suasion of their sovereigns.
First, following Acharya and Steffen (2014), we use data about government interventions compiled
from information disclosed on the official EU state-aid websites to classify banks into intervened
and non-intervened banks.15 The idea is that intervened banks are more prone to moral suasion
as the influence of governments on these banks is arguably larger than for non-intervened banks.
We classify banks as affected if a bank received some form of financial aid by the government.
Second, we follow Iannotta, Nocera, and Sironi (2013) and compile government bank ownership
data from Bankscope. As shown in De Marco and Macchiavelli (2014), government ownership seems
to have an influence on banks’ domestic sovereign bondholdings as banks with a high government
ownership share hold, in general, significant more domestic sovereign debt compared to other banks.
We construct an indicator variable “High Fraction of Government Ownership”, which is equal to
1 if the share owned by the government for a given bank in a certain year is above the median
of the distribution. Lastly, government control over banks can also be measured by government
board representation. We follow Becker and Ivashina (2014b) and extract the fraction of directors
affiliated with the government from the BoardEx database. For our empirical analysis, we construct
an indicator variable equal to 1 if the fraction of affiliated directors exceeds the median fraction of
government affiliated directors.
A. Change in Banks’ Sovereign Holdings
Both active channels, the risk-shifting and the moral suasion channel, are consistent with an
increase in domestic sovereign bondholdings over the crisis period, which makes their disentangle-
ment particularly challenging. Therefore, we start with exploring whether and which banks changed
their sovereign debt holdings after the outbreak of the European Sovereign Debt Crisis.
In Figure 6, we plot the evolution of GIIPS (Panel A) and domestic (Panel B) sovereign debt
exposure over time for banks incorporated in non-GIIPS countries (left part of graph) and GIIPS
countries (right part of graph). The blue solid line shows the evolution of the sum of the respective
banks’ sovereign bondholdings scaled by the sum of banks’ total assets at the end of the respective
year. The red dashed line shows the sum of sovereign bondholdings multiplied by the sovereign’s
CDS spread as a fraction of the sum of total assets.
Figure 6 shows that most of the GIIPS sovereign bondholdings held by GIIPS banks are domes-
tic, implying a very high correlation between measures of bank affectedness based on overall GIIPS
sovereign bondholdings and domestic sovereign bondholdings. In addition, Figure 6 indicates that
the riskiness of GIIPS sovereign bondholdings spiked in the crisis period, which severely affected
the health of GIIPS banks due to their large domestic sovereign bondholdings.
Furthermore, Panel A of Figure 6 shows that, while non-GIIPS banks slightly decreased their
GIIPS sovereign debt exposure between 2009 and 2011, GIIPS banks kept their GIIPS sovereign
debt holdings constant. Regarding the domestic sovereign debt holdings, Panel B of Figure 6
15The data can be obtained from: http://ec.europa.eu/competition/elojade/isef/index.cfm?clear=1&
policy_area_id=3.
25

documents that both GIIPS and non-GIIPS banks hold their domestic sovereign exposure con-
stant. Hence, this preliminary evidence is not consistent with the risk-shifting and moral suasion
hypotheses.
However, even though GIIPS banks on average have not significantly increased their domestic
sovereign bondholdings, as shown in Panel B of Figure 6, we cannot rule out that the risk-shifting
channel and the moral suasion channel played an important role for banks’ lending behavior and
the resulting real effects of borrowing firms. The fact that, on average, the domestic sovereign
bondholdings of GIIPS banks do not change is also consistent with distressed banks (i.e., those
with high risk-shifting incentives) increasing their holdings, while other banks decrease their do-
mestic sovereign bondholdings. Similarly, only those GIIPS banks that are very dependent on
their governments might be pressured to increase their domestic sovereign bondholdings, while less
dependent banks might not.
To investigate these possibilities, we analyze the respective subsets of GIIPS banks separately.
We start with the risk-shifting channel and plot the evolution of the domestic sovereign debt expo-
sure over time separately for well-capitalized (low leverage) and weakly-capitalized (high leverage)
GIIPS banks. As can be seen from Panel A of Figure 7, weakly-capitalized GIIPS banks increased
their holdings of domestic sovereign debt significantly by roughly 4 percentage points of total as-
sets. This indicates that risk-shifting might have played a role for the cutback in lending of highly
leveraged banks.
To test the robustness of this finding, we use the banks’ rating before the sovereign debt crisis
(i.e., at the end of 2009) as an alternative measure of bank health. In Panel B of Figure 7, we
plot the evolution of the domestic sovereign debt exposure for high-rated GIIPS banks (left part
of graph) and low-rated GIIPS banks (right part of graph), where we consider a GIIPS bank to be
low-rated if its median rating is below the A+ threshold. Results remain qualitatively unchanged,
which again supports the risk-shifting hypothesis.
To test whether this increase is also statistically significant, Table XVI in the online appendix
presents regressions where the dependent variable is the change in a bank’s domestic sovereign
debt holdings over the period from 2009 to 2011. As can be seen from Panels A and B, both high
leverage and low rating GIIPS banks significantly increased their holdings of domestic sovereign
debt, whereas Panels C to E show that for none of the moral suasion proxies there are significant
effects on the change in a bank’s domestic sovereign debt holdings.
B. Lending
Given this evidence, we now investigate the importance of these three channels, that is, hit on
balance sheet, risk-shifting, and moral suasion, for the contraction of lending supply by banks in
our sample period formally.
26

B.1. Methodology
To test the importance of the different channels for the reduction in bank lending, we apply
a modified version of the Khwaja and Mian (2008) estimator, which exploits multiple bank-firm
relationships before and during the sovereign debt crisis to control for loan demand and other
observed and unobserved borrowing firm characteristics.
While we observe a large number of firms borrowing from multiple banks, we face some con-
straints in data availability, that render it unfeasible to use the original setup of Khwaja and Mian
(2008). First, in contrast to their approach, our dataset contains information only at the time of
the origination of the loan, which does not allow us to observe changes over time for a particular
loan (e.g., on credit line drawdowns). Second, the syndicated loans in our sample generally have
long maturities. Taken together, these two facts imply that a large number of observations in
our sample experience no significant year-to-year change in bank-firm lending relationships. This
requires us to modify the Khwaja and Mian (2008) estimator and aggregate firms into clusters to
generate enough time-series bank lending heterogeneity to meaningfully apply the estimator to our
data.
To this end, we form firm clusters based on the following three criteria, which capture important
drivers of loan demand, as well as the quality of firms in our sample: (1) the country of incorpora-
tion; (2) the industry; and (3) the firm rating. The main reason for aggregating firms based on the
first two criteria is that firms in a particular industry in a particular country probably share a lot of
firm characteristics and were thus likely affected in a similar way by macroeconomic developments
during our sample period. Our motivation behind forming clusters based on credit quality follows
from theoretical research in which credit quality is an important source of variation driving a firm’s
loan demand (e.g., Diamond, 1991). To aggregate firms into clusters, we assign ratings estimated
from interest coverage ratio medians for firms by rating category provided by Standard & Poor’s.16
This approach exploits the fact that our measure of credit quality which is based on accounting
information is monotone across credit categories (Standard&Poor’s, 2006). We follow Standard &
Poor’s and assign ratings on the basis of the three-year median interest coverage ratio of each firm,
where the median is calculated from the period preceding the sovereign debt crisis.
We use the following the panel regression to estimate the annual change in loan volume provided
by bank k in country j to the cluster of firms m:
∆V olumekm,t+1 = α+ β1 ·GIIPS Bankkj · Crisisjt+ β2 ·Affected Bankkj · Crisisjt+ β3 ·Affected GIIPS Bankkj · Crisisjt+ γ ·Xkjt + Firm Clusterm ·Year t+1
+ Firm Clusterm · Bankkj + uit+1. (8)
16Note that only a small fraction of all firms in our sample have a rating from one of the rating agencies.
27

The unit of observation in this regression is a bank-year-firm cluster. Besides controlling for ob-
servable bank characteristics (log of total assets, capital ratio, ratio of impaired loans to equity)
we add firm-cluster times year fixed effects. This allows us to control for any observed and unob-
served characteristics that are shared by firms in the same cluster and that might influence loan
outcomes. Moreover, we interact firm-cluster and bank fixed effects. By doing this, we exploit
the variation within the same firm cluster and bank over time. This not only controls for any
unobserved characteristics that are shared by firms in the same cluster, or bank heterogeneity, but
also for relationships between firms in a given cluster and the respective bank.
B.2. Lending Results
Panel A of Table VI presents results for the change in lending volume. The dependent variable
accordingly represents the annual change in loan volume provided by a given bank to a given cluster
of firms.
To check whether the results for the financial and real effects of borrowing firms from Section
III are indeed associated with a reduction in bank lending, we start with our broad measure for a
bank’s affectedness (i.e., the banks’ country of incorporation) used to capture all three potential
channels. Column (1) presents the results for this proxy. The coefficient is negative and statistically
significant, which is consistent with the interpretation that GIIPS banks significantly decreased their
lending volume to the real sector during the sovereign debt crisis. This finding thus supports the
results presented in Section III that the lending contraction of banks affected by the crisis was an
important driver for the negative real effects suffered by their borrowing firms.
In the following, we present the results for the three different channels that may affect the lending
behavior of banks to the real sector. Column (2) in Panel A of Table VI shows the results for the
hit on balance sheet channel. The coefficient of the sovereign risk dummy variable interacted with
the crisis dummy variable is negative and significant. This finding indicates that banks with larger
sovereign risk in their portfolios reduced lending during the crisis by a larger fraction than banks
with lower sovereign risk exposure.17 Therefore, the risk associated with the sovereign bondholdings
and thus the losses incurred due to the sovereign debt crisis indeed play an important role for the
lending behavior of banks.
Next, we test whether the reduction in bank lending is also driven by risk-shifting incentives, that
is, whether weakly-capitalized GIIPS banks, which increased their domestic sovereign bondholdings
during the sovereign debt crisis, also decreased their corporate lending. The results are presented in
columns (3) and (4) in Panel A of Table VI. We find that weakly-capitalized GIIPS banks cut their
lending to the real sector more than well-capitalized GIIPS banks, irrespective of how we proxy
for risk-shifting incentives. These results indicate that the active increase in domestic sovereign
bondholdings, shown in Figures 7, results in a crowding-out of lending to the private sector for
17As described before, for most banks the majority of their sovereign bondholdings are domestic, which is why thecoefficients for the domestic and GIIPS sovereign risk exposure measures are very similar in magnitude. For brevity,we only report the results for the domestic sovereign risk exposure measures.
28

weakly-capitalized GIIPS banks.
Finally, we examine whether the moral suasion channel affects bank lending during the sovereign
debt crisis. Columns (5) to (7) of Table VI present the results for our three proxies for moral suasion:
government interventions, government ownership, and government control over banks. The point
estimates of the three proxies for moral suasion interacted with the crisis indicator variable are
not significantly different from zero. For example, the interaction of the intervened GIIPS bank
variable with the crisis indicator variable is zero in magnitude and not statistically significant.
Overall, moral suasion does not appear to play a role for the banks’ lending decisions in our sample
period.
Panel B of Table VI shows the robustness of our results when we use the change in the spread of
newly issued loans instead of the change in volume as the dependent variable. We find qualitatively
similar results here.
We draw two main conclusions from the results in Table VI. First, our evidence indicates that
the balance sheet hit caused by the increase in sovereign risk and the risk-shifting channel are of
first-order importance regarding the effect of the sovereign debt crisis on bank lending behavior.
Second, we do not find evidence that moral suasion plays a crucial role for banks’ lending decisions.
We note that GIIPS banks might have engaged in even greater risk-shifting and/or might have
been forced by their governments to buy domestic debt after the end of our sample period, that
is, after 2012. Furthermore, GIIPS governments might not have faced the need to pressure banks
into buying more domestic sovereign debt since the weakly-capitalized banks did so anyway due to
their risk-shifting incentives.
C. Financial and Real Outcomes
C.1. Methodology
We now examine which of the three channels contributed to the financial and real effects of
borrowing firms. We rerun our main panel regressions from Eqs. (4) and (5). We construct several
variables at the firm-year level, reflecting how much credit comes from affected banks in a given
year, where we distinguish between affected and non-affected banks using the same proxies as in
Table VI. This leads to the following measure for firm i in country j in year t:
Affected Bank Dependenceijht =
∑l∈Lijht
%Affected Banks in Syndicate lijht · Loan Amount lijht
Total Loan Amount ijht, (9)
where as before Lijht are all of the firm’s loans outstanding at time t. For the firms’ employment
growth and sales growth rates as well as their net debt and investment levels we estimate the
29

following panel regressions:
yijht+1 = α+ β1 ·GIIPS Bank Dependenceijh,min{t,tlj}
+ β3 ·Affected Bank Dependenceijh,min{t,tlj}
+ β4 ·Affected GIIPS Bank Dependenceijh,min{t,tlj}
+ β5 ·GIIPS Bank Dependenceijh,min{t,tlj} · Crisisjt+ β6 ·Affected Bank Dependenceijh,min{t,tlj} · Crisisjt+ β7 ·Affected GIIPS Bank Dependenceijh,min{t,tlj} · Crisisjt+ γ ·Xijht + Firmijh + Industryh · Countryj ·Year t+1
+ ForeignBankCountryk 6=j ·Year t+1 + uit+1. (10)
The unit of observation is again a firm-year.
C.2. Real outcomes
We begin by reporting results for the passive bank lending channel, that is, whether the increase
in sovereign risk that forced banks to deleverage and thus decrease their corporate lending, affected
borrowing firms by making them financially constrained. The results are presented in Table VII. In
Panel A, the affected indicator variable is equal to one if a bank’s GIIPS sovereign portfolio credit
risk exposure is above the sample median. In Panel B, the domestic sovereign portfolio credit risk
exposure is used to distinguish between affected and non-affected banks. The interaction term of
affected bank indicator and the Crisis variable is negative and significant for all dependent variables.
Therefore, Panels A and B show that the hit on the affected banks’ balance sheets results in negative
financial and real effects for firms that have a lending relationship with these banks.
Next, we examine whether the active bank lending channels, that is, the risk-shifting and the
moral suasion channel, led to real effects for borrowing firms. Table VIII reports results for the real
effects if we construct our affected bank dependence variable using GIIPS banks’ leverage (Panel
A) or rating (Panel B), respectively. The results for both bank health proxies indicate that the
real effects are much stronger for firms that have a lending relationship with a GIIPS bank that
is weakly-capitalized and thus not able to cope with losses caused by the sovereign debt crisis.
These banks engage in risk-shifting by increasing their risky domestic sovereign bondholdings and
thus decrease bank lending even more compared to well-capitalized GIIPS banks that could better
manage the losses incurred during the sovereign debt crisis.
Finally, the results for the moral suasion proxy are presented in Table IX. We find that moral
suasion does not appear to impact the corporate policies of borrowing firms. Neither government
interventions, nor government board seats or government ownership have any explanatory power in
the cross section. This is consistent with the fact that moral suasion does not significantly impact
the lending behavior of banks in our sample.
30

V. Conclusion
In this paper, we show that the European Sovereign Debt Crisis and the resulting credit crunch
in the eurozone periphery caused significant negative real effects for borrowing firms in Europe.
We find that firms that had a pre-crisis business relationship with banks that suffered from the
sovereign debt crisis became financially constrained during the crisis. As a result, these firms had
lower employment growth rates, lower levels of investment, and lower sales growth rates. This holds
true for both GIIPS and non-GIIPS firms.
Moreover, we shed light on the question of how the European Sovereign Debt Crisis actually
caused a contraction in bank lending and the resulting real effects for borrowing firms. We document
that the negative real effects that can be attributed to the bank lending channel are primarily
associated with (i) banks from GIIPS countries facing losses on their significant domestic sovereign
bondholdings, and (ii) the resulting incentives of undercapitalized banks from GIIPS countries
to engage in risk-shifting behavior by buying even more risky domestic sovereign bonds, thereby
crowding out corporate lending.
We are thus the first to provide cross-country evidence that negative spillovers from the sovereign
to the banking sector were also transmitted into the real economy throughout Europe as well as
the first to analyze how this transmission worked. We show that the high interdependence of bank
and sovereign health is one important contributor to the severe economic downturn in the southern
European countries during the sovereign debt crisis. The findings help to understand the unfolding
of the European Sovereign Debt Crisis and yield important insights on how to design a more stable
European financial system.
31

REFERENCES
Acharya, Viral V, Heitor Almeida, Filippo Ippolito, and Ander Perez, 2014a, Credit lines as mon-
itored liquidity insurance: Theory and evidence, Journal of Financial Economics 112, 287–319.
Acharya, Viral V, Itamar Drechsler, and Philipp Schnabl, 2014b, A pyrrhic victory? bank bailouts
and sovereign credit risk, Journal of Finance 69, 2689–2739.
Acharya, Viral V, and Sascha Steffen, 2014, The greatest carry trade ever? understanding eurozone
bank risks, Journal of Financial Economics 115, 215–236.
Adrian, Tobias, Colla Paolo, and Hyun Song Shin, 2013, Which financial frictions? parsing the
evidence from the financial crisis of 2007-09, in Daron Acemoglu, Jonathan Parker, and Michael
Woodford, eds., NBER Macroeconomics Annual 2012 (Chicago: University of Chicago Press,
2013).
Almeida, Heitor, Murillo Campello, and Michael S Weisbach, 2004, The cash flow sensitivity of
cash, Journal of Finance 59, 1777–1804.
Balduzzi, Pierluigi, Emanuele Brancati, and Fabio Schiantarelli, 2014, Financial markets, banks’
cost of funding, and firms’ decisions: Lessons from two crises, Working Paper .
Becker, Bo, and Victoria Ivashina, 2014a, Cyclicality of credit supply: Firm level evidence, Journal
of Monetary Economics 62, 76–93.
Becker, Bo, and Victoria Ivashina, 2014b, Financial repression in the european sovereign debt crisis,
Working Paper .
Bentolila, Samuel, Marcel Jansen, Gabriel Jimenez, and Sonia Ruano, 2013, When credit dries up:
Job losses in the great recession, CESifo Working Paper .
Bernanke, Ben, 1983, Nonmonetary effects of the financial crisis in the propagation of the great
depression, American Economic Review 73, 257–276.
Bocola, Luigi, 2014, The pass-through of sovereign risk, Working Paper .
32

Bofondi, Marcello, Luisa Carpinelli, and Enrico Sette, 2013, Credit supply during a sovereign debt
crisis, Bank of Italy Temi di Discussione Working Paper .
Chodorow-Reich, Gabriel, 2014, The employment effects of credit market disruptions: Firm-level
evidence from the 2008-09 financial crisis, Quarterly Journal of Economics 129, 1–59.
Cingano, Federico, Francesco Manaresi, and Enrico Sette, 2013, Does credit crunch investments
down? new evidence on the real effects of the bank-lending channel, Working Paper .
Crosignani, Matteo, 2014, Why are banks not recapitalized during crises?, Working Paper .
De Marco, Filippo, 2014, Bank lending and the sovereign debt crisis, Working Paper .
De Marco, Filippo, and Marco Macchiavelli, 2014, The political origin of home bias: The case of
europe, Working Paper .
Diamond, Douglas W, 1991, Monitoring and reputation: The choice between bank loans and di-
rectly placed debt, Journal of Political Economy 99, 689–721.
Diamond, Douglas W, and Raghuram G Rajan, 2011, Fear of fire sales, illiquidity seeking, and
credit freezes, The Quarterly Journal of Economics 126, 557–591.
Drechsler, Itamar, Thomas Drechsel, David Marques-Ibanez, and Philipp Schnabl, 2014, Who
borrows from the lender of last resort?, Working Paper .
Farhi, Emmanuel, and Jean Tirole, 2014, Deadly embrace: Sovereign and financial balance sheets
doom loops, Working Paper .
Iannotta, Giuliano, Giacomo Nocera, and Andrea Sironi, 2013, The impact of government ownership
on bank risk, Journal of Financial Intermediation 22, 152–176.
Imbens, Guido M, and Jeffrey M Wooldridge, 2009, Recent developments in the econometrics of
program evaluation, Journal of Economic Literature 47, 5–86.
Ivashina, Victoria, 2009, Asymmetric information effects on loan spreads, Journal of Financial
Economics 92, 300–319.
33

Ivashina, Victoria, David S Scharfstein, and Jeremy C Stein, 2015, Dollar funding and the lending
behavior of global banks, The Quarterly Journal of Economics qjv017.
Khwaja, Asim Ijaz, and Atif Mian, 2008, Tracing the impact of bank liquidity shocks: Evidence
from an emerging market, American Economic Review 98, 1413–1442.
Peek, Joe, and Eric S Rosengren, 1997, The international transmission of financial shocks: The
case of japan, American Economic Review 87, 495–505.
Popov, Alexander, and Neeltje Van Horen, 2014, Exporting sovereign stress: Evidence from syndi-
cated bank lending during the euro area sovereign debt crisis, Review of Finance forthcoming.
Standard&Poor’s, 2006, Corporate Ratings Criteria ((New York, NY: The McGraw-Hill Companies,
Inc.)).
Standard&Poor’s, 2010, A Guide To The European Loan Market.
Sufi, Amir, 2007, Information asymmetry and financing arrangements: Evidence from syndicated
loans, Journal of Finance 62, 629–668.
Uhlig, Harald, 2014, Sovereign default risk and banks in a monetary union, German Economic
Review 15, 23–41.
34

Table I - Variable Definitions
Dependent Variables (all winsorized at the 5% level)
Variable Definition
Net Debt Current + Non-Current Liabilities - CashTotal Assets
∆Cash Casht+1−Casht
Total Assets t
Employment Growth ln(Employmentt+1)− ln(Employmentt)
CAPXFixed Assets t+1−Fixed Assets t+Depreciation
Fixed Assets t, set to 0 if negative
Sales Growth ln(Salest+1)− ln(Salest)
Key Explanatory Variables
Variable Definition
Crisis Indicator variable equal to one for the period of the sovereign debt crisis (starting in 2009
for Greece, in 2010 for all other countries)
GIIPS Bank Dependenceijt
∑l∈Lijt
%GIIPS Lead Arranger in Syndicate lijt·Loan Amount lijt
Total Loan Amount ijt
Affected Bank Dependenceijt
∑l∈Lijt
%Affected Banks in Syndicate lijt·Loan Amount lijt
Total Loan Amount ijt
Affected Bank Measures
Variable Definition
CDS Weighted GIIPS Sov. Bondholdings Banks with an above median ratio of∑
k Sov. Bondholdingskt·CDSkt
Total Assetst, for all k ∈ GIIPS
CDS Weighted Domestic Sov. Bondholdings Banks with an above median ratio ofDomestic Sov. Bondholdings t·Domestic Sov. CDS t
Total Assets t
High Leverage Banks with a below median ratio ofTotal EquityTotal Assets
Low Rating Banks with a rating of A+ or worse
Gov. Intervention Banks that received government support during the sovereign debt crisis
High Fraction Gov. Own. Banks with an above median fraction of government ownership
High Fraction Gov. Board Banks with an above median fraction of government affiliated directors on the board
Control Variables (all winsorized at the 5% level)
Variable Definition
ln(Assets) Natural logarithm of total assets
LeverageTotal Assets-Total Equity
Total Assets
Net WorthTotal shareholder funds&Liabilities - Current&Non-Current Liabilities - Cash
Total Assets
Tangibility Fixed AssetsTotal Assets
Interest Coverage Ratio EBITInterest Expense
EBITDA/Assets EBITDATotal Assets
Cash FlowCash flow
Total Assets
35

Tab
leII
-D
escr
ipti
ve
Sta
tist
ics
pre
-Cri
sis
Pan
el
A:
Dep
en
dent
Vari
ab
les
Pan
el
B:
Exp
lan
ato
ryV
ari
ab
les
Em
pG
row
thC
AP
XSal
esG
row
thT
otal
Ass
ets
(mn)
Tan
gibilit
yIn
t.C
ov.
Net
Wor
thE
BIT
DA
/Ass
ets
Lev
erage
Mea
n0.
054
0.19
50.
057
4330
0.61
02.
980.2
20
0.1
080.6
20
Hig
hG
IIP
SB
ank
Dep
.M
edia
n0.
033
0.11
60.
056
737
0.63
21.
940.2
06
0.1
040.6
19
Std
.D
ev.
0.15
70.
243
0.22
177
100.
211
3.32
0.1
74
0.0
750.1
98
Mea
n0.
045
0.19
20.
049
2460
0.54
73.
240.2
27
0.1
150.6
04
Low
GII
PS
Bank
Dep
.M
edia
n0.
021
0.11
20.
052
416
0.55
72.
060.2
33
0.1
040.5
92
Std
.D
ev.
0.16
20.
249
0.20
553
700.
240
3.50
0.1
87
0.0
980.2
56
Diff
.0.
009
0.00
30.
007
3050
0.06
2-0
.267
-0.0
07-0
.0062
0.163
(t-S
tat)
(1.1
4)(0
.25)
(0.6
9)(7
.08)
(5.5
5)(-
1.5
8)(-
0.84
)(-
1.41
)(1
.41)
Norm
alize
dD
iff.
0.24
20.
197
-0.0
53
-0.0
27
-0.0
56
0.0
49
Cor
rela
tion
wit
hG
IIP
SB
ank
Dep
.-0
.037
0.08
7-0
.116
-0.0
64-0
.127
0.1
17
Panel
Apre
sents
des
crip
tive
stati
stic
sof
dep
enden
tand
Panel
Bof
expla
nato
ryva
riable
ssp
lit
into
firm
sw
ith
posi
tive
and
zero
GIIPSBankDepen
den
cefo
rth
e
pre
-cri
sis
per
iods.
Crisis
isan
indic
ato
rva
riable
equal
toone
start
ing
in2009
for
Gre
ece
and
in2010
for
all
oth
erco
untr
ies
(beg
innin
gof
the
sover
eign
deb
t
cris
is)
and
zero
bef
ore
.T
he
sam
ple
consi
sts
of
all
firm
sin
the
inte
rsec
tion
of
Dea
lSca
nand
Am
adeu
sth
at
are
loca
ted
inth
efo
llow
ing
countr
ies:
Gre
ece,
Italy
,
Irel
and,
Port
ugal,
Spain
(GII
PS
countr
ies)
or
Ger
many,
Fra
nce
,U
.K.
(non-G
IIP
Sco
untr
ies)
.
36

Tab
leII
-D
escr
ipti
ve
Sta
tist
ics
(con
td.)
Pan
el
C:
Non
-GII
PS
firm
sw
ith
ou
tG
IIP
Sor
oth
er
non
-EU
sub
sid
iari
es
Tota
lA
sset
s(m
n)
Tan
gib
ilit
yIn
t.C
ov.
Net
Wor
thE
BIT
DA
/Ass
ets
Lev
erag
e
Mea
n63
300.
580
1.96
80.
200
0.08
70.
664
Hig
hG
IIP
SB
ank
Dep
.M
edia
n13
700.
527
1.34
00.
182
0.08
50.
673
Std
.D
ev.
1020
00.
223
2.54
60.
132
0.04
80.
139
Mea
n87
100.
559
1.93
90.
210
0.10
10.
646
Low
GII
PS
Ban
kD
ep.
Med
ian
2560
0.55
81.
300
0.18
00.
099
0.67
8
Std
.D
ev.
1200
00.
167
2.54
00.
143
0.06
20.
128
Diff
.(t
-Sta
t)-2
380
(-1.
37)
-0.2
08(-
0.68
)-0
.028
(-0.
07)
0.01
0(0
.50)
-0.1
45(-
1.35
)0.
177
(0.8
4)
Nor
mal
ized
Diff
.-0
.151
-0.0
75-0
.008
0.05
1-0
.178
0.09
5
Corr
elat
ion
wit
hG
IIP
SB
ank
Dep
.-0
.07
-0.0
30
0.01
-0.0
9-0
.02
Pan
el
D:
GII
PS
firm
sw
ith
hig
hfr
acti
on
of
revenu
egen
era
ted
by
non
-GII
PS
sub
sid
iari
es
Mea
n10
800.
536
3.50
80.
208
0.11
80.
662
Hig
hG
IIP
SB
ank
Dep
.M
edia
n49
50.
570
2.54
00.
216
0.10
60.
625
Std
.D
ev.
2980
0.24
03.
358
0.20
90.
070
0.22
8
Mea
n13
100.
564
2.85
50.
210
0.10
50.
655
Low
GII
PS
Ban
kD
ep.
Med
ian
233
0.57
91.
855
0.19
90.
093
0.63
0
Std
.D
ev.
3510
0.28
43.
036
0.22
50.
082
0.29
5
Diff
.(t
-Sta
t)-2
24(-
0.47
)0.
027
(0.7
0)-0
.653
(-1.
52)
-0.0
01(-
0.04
)-0
.012
(-1.
11)
0.00
6(0
.16)
Nor
mal
ized
Diff
.0.
049
0.07
5-0
.142
-0.0
06-0
.120
0.01
8
Corr
elat
ion
wit
hG
IIP
SB
ank
Dep
.-0
.037
0.08
7-0
.092
-0.0
64-0
.127
0.16
9
Panel
sC
and
Dpre
sent
des
crip
tive
stati
stic
sof
expla
nato
ryva
riable
sfo
rth
epre
-cri
sis
per
iod.
Panel
Cre
port
ssu
mm
ary
stati
stic
sfo
rnon-G
IIP
Sfirm
sw
ithout
GII
PS
or
oth
ernon-E
Usu
bsi
dia
ries
and
Panel
Dre
port
sre
sult
sfo
rG
IIP
Sfirm
sw
ith
ahig
hfr
act
ion
of
reven
ue
gen
erate
dby
non-G
IIP
Ssu
bsi
dia
ries
.B
oth
panel
sare
split
into
firm
sw
ith
hig
hand
low
GIIPS
BankDepen
den
ce(s
ubsa
mple
spec
ific
cuto
ffp
oin
tsare
use
dto
class
ify
firm
sas
hig
hor
low
GIIPS
Bank
Depen
den
ce).
Panel
Cin
cludes
firm
slo
cate
din
Ger
many,
Fra
nce
,or
U.K
.(n
on-G
IIP
Sco
untr
ies)
that
do
not
hav
eany
fore
ign
subsi
dia
rylo
cate
din
Gre
ece,
Italy
,Ir
eland,
Port
ugal,
or
Spain
(GII
PS
countr
ies)
or
any
oth
ernon-E
Uco
untr
y.P
anel
Din
cludes
firm
sin
GII
PS
countr
ies,
whic
hhav
ea
hig
hfr
act
ion
of
thei
r
reven
ues
gen
erate
dby
non-G
IIP
Ssu
bsi
dia
ries
.
37

Tab
leII
-D
escr
ipti
ve
Sta
tist
ics
(con
td.)
Pan
el
E:
GII
PS
vs.
Non
-GII
PS
Banks
Tot
alA
sset
s(m
n)
Equ
ity/A
sset
sIm
pai
red
Loa
ns/
Equ
ity
Tie
r1R
atio
avg
5-ye
arC
DS
Spre
ad
Mea
n19
2330
0.06
40.
376
0.08
560.7
9
GII
PS
Ban
ks
Med
ian
8037
80.
062
0.32
50.
080
60.
95
Std
.D
ev.
2603
560.
018
0.27
10.
025
18.3
4
Mea
n65
8094
0.03
00.
412
0.08
760.2
7
Non
-GII
PS
Ban
ks
Med
ian
4129
770.
027
0.35
10.
086
44.4
9
Std
.D
ev.
6589
260.
013
0.27
60.
018
45.0
7
Diff
.(t
-Sta
t)-4
6576
3(-
6.07
)0.
034
(13.
03)
-0.0
35(0
.76)
-0.0
01(-
0.51
)0.
5(0
.04)
Nor
mal
ized
Diff
.-0
.657
1.53
1-0
.093
-0.0
640.
017
Pan
el
F:
Non
-GII
PS
Ban
ks
Mea
n71
0191
0.03
00.
350.
087
63.
62
Non
-GII
PS
wit
hh
igh
fract
ion
GII
PS
syn
dic
ate
sM
edia
n41
9654
0.02
50.
270.
087
45.2
4
Std
.D
ev.
6220
900.
013
0.25
0.01
854.1
8
Mea
n57
3659
0.03
40.
480.
088
55.
00
Non
-GII
PS
wit
hlo
wfr
acti
onG
IIP
Ssy
nd
icat
esM
edia
n22
3165
0.03
30.
430.
082
42.7
2
Std
.D
ev.
7178
220.
010
0.29
0.01
928.4
6
Diff
.(t
-Sta
t)13
6532
(0.8
7)-0
.004
(-1.
55)
-0.0
12(-
1.81
)-0
.001
(-0.
12)
-8.6
1(-
0.3
8)
Nor
mal
ized
Diff
.0.
178
-0.2
43-0
.336
-0.0
38-0
.140
Panel
sE
and
Fpre
sent
des
crip
tive
stati
stic
sfo
rth
ebanks
inour
sam
ple
inth
epre
-cri
sis
per
iod.
Panel
Eco
mpare
sG
IIP
Sand
Non-G
IIP
Sbanks
while
Panel
Fco
mpare
sN
on-G
IIP
Sbanks
wit
han
ab
ove
and
bel
owm
edia
nfr
act
ion
of
dea
lsis
sued
wit
hG
IIP
SB
anks.
Non-G
IIP
Sbanks
are
hea
dquart
ered
inG
erm
any,
Fra
nce
,or
U.K
.(n
on-G
IIP
Sco
untr
ies)
wher
eas
GII
PS
banks
are
hea
dquart
ered
inG
reec
e,It
aly
,Ir
eland,
Port
ugal,
or
Spain
(GII
PS
countr
ies)
.
38

Tab
leII
I-
Rea
lan
dF
inan
cial
Ou
tcom
es
(1)
(2)
(3)
(4)
(5)
(6)
(7)
Net
Deb
t∆
Cas
hTotalC
red
itLin
eCash
+TotalC
red
itLin
eUndrawnCred
itLin
eCash
+UndrawnCred
itLin
eE
mp
Gro
wth
CA
PX
Sal
esG
row
th
GII
PS
Ban
kD
ep.*
Cri
sis
-0.0
39**
*0.
003
-0.0
91**
-0.1
64**
*-0
.041
***
-0.0
60***
-0.0
49***
(-2.
98)
(0.7
3)(-
2.31
)(-
3.33
)(-
2.97
)(-
2.70
)(-
2.96
)
Cas
hF
low
*Cri
sis
0.00
1
(0.2
4)
Cas
hF
low
*GII
PS
Ban
kD
ep.
-0.0
03
(-0.
50)
Cas
hF
low
*GII
PS
Ban
kD
ep.*
Cri
sis
0.00
7**
(2.4
4)
Cas
hF
low
0.000
(0.1
0)
R2
0.54
30.
442
0.83
10.
841
0.42
30.5
870.
494
N44
4840
0350
7507
3781
4351
4214
Fir
mC
ontr
ols
YE
SY
ES
YE
SY
ES
YE
SY
ES
YE
S
Fir
mF
ixed
Eff
ects
YE
SY
ES
YE
SY
ES
YE
SY
ES
YE
S
Ind
ust
ry*C
ountr
y*Y
ear
Fix
edE
ffec
tsY
ES
YE
SY
ES
YE
SY
ES
YE
SY
ES
For
eign
Ban
kC
ou
ntr
y*Y
ear
Fix
edE
ffec
tsY
ES
YE
SN
ON
OY
ES
YE
SY
ES
Table
III
pre
sents
firm
-lev
elre
gre
ssio
ns.
The
dep
enden
tva
riable
sare
net
deb
t,th
ech
ange
inca
shhold
ings,
cred
itlines
as
afr
act
ion
of
the
sum
of
cred
itlines
and
cash
,undra
wn
cred
itlines
as
afr
act
ion
of
the
sum
of
undra
wn
cred
itlines
and
cash
,em
plo
ym
ent
gro
wth
,in
ves
tmen
ts,
and
sale
sgro
wth
,re
spec
tivel
y.T
he
sam
ple
consi
sts
of
all
firm
sin
the
inte
rsec
tion
of
Dea
lSca
nand
Am
adeu
sth
at
are
loca
ted
inth
efo
llow
ing
countr
ies:
Gre
ece,
Italy
,Ir
eland,
Port
ugal,
Spain
(GII
PS
countr
ies)
or
Ger
many,
Fra
nce
,U
.K.
(non-G
IIP
Sco
untr
ies)
for
the
emplo
ym
ent
gro
wth
,in
ves
tmen
ts,
sale
sgro
wth
,net
deb
tand
cash
flow
regre
ssio
ns.
For
the
cred
itline
regre
ssio
ns,
the
sam
ple
consi
sts
of
all
firm
sin
the
inte
rsec
tion
of
Dea
lSca
n,
Am
adeu
s,and
Capit
al
IQth
at
are
loca
ted
ina
GII
PS
or
non-G
IIP
Sco
untr
y.
GIIPSBankDepen
den
ceis
defi
ned
as
fract
ion
of
tota
louts
tandin
glo
ans
pro
vid
edby
GII
PS
lead
arr
anger
s.Crisis
isan
indic
ato
rva
riable
equal
toone
start
ing
in2009
for
Gre
ece
and
in2010
for
all
oth
erco
untr
ies
(beg
innin
gof
the
sover
eign
deb
tcr
isis
)and
zero
bef
ore
.F
irm
contr
ol
vari
able
sin
clude
the
logari
thm
of
tota
lass
ets,
tangib
ilit
y,in
tere
stco
ver
age
rati
o,
EB
ITD
Aas
afr
act
ion
of
tota
lass
ets,
lever
age,
net
wort
hand
for
the
cash
regre
ssio
na
firm
’sca
shflow
and
capit
al
exp
endit
ure
s.A
llfirm
-lev
elco
ntr
ol
vari
able
sare
lagged
by
one
per
iod.
All
vari
able
sare
defi
ned
inT
able
I.A
llre
gre
ssio
ns
incl
ude
firm
and
indust
ry-c
ountr
y-y
ear
fixed
effec
tsas
wel
las
all
firm
-lev
elco
ntr
ols
.C
olu
mns
(1)-
(2)
and
(5)-
(7)
addit
ionally
incl
ude
fore
ign
bank
countr
y-y
ear
fixed
effec
ts.
Sta
ndard
erro
rsare
adju
sted
for
het
erosk
edast
icit
yand
clust
ered
at
the
firm
-lev
el.
Sig
nifi
cance
level
s:*
(p<
0.1
0),
**
(p<
0.0
5),
***
(p<
0.0
1).
39

Table IV - Subsidiaries
Panel A: Non-GIIPS firms without GIIPS or other non-EU subsidiaries
(1) (2) (3) (4) (5)
Net Debt ∆ Cash Emp Growth CAPX Sales Growth
GIIPS Bank Dep.*Crisis -0.123** -0.037 -0.097*** -0.186** -0.149**(-2.59) (-1.14) (-2.95) (-2.07) (-2.16)
Cash Flow*GIIPS Bank Dep.*Crisis 0.177***(3.12)
R2 0.496 0.475 0.419 0.583 0.443N 1175 997 892 1107 1079
Panel B: Non-GIIPS firms with GIIPS subsidiaries
GIIPS Bank Dep.*Crisis -0.002 -0.005 -0.027* -0.010 -0.014(-0.10) (-0.91) (-1.93) (-0.48) (-0.74)
Cash Flow*GIIPS Bank Dep.*Crisis 0.041**(2.49)
R2 0.561 0.379 0.344 0.600 0.446N 1315 1282 1192 1304 1302
Panel C: GIIPS firms with high fraction of revenue generated by non-GIIPS subsidiaries
GIIPS Bank Dep.*Crisis -0.086** -0.021 -0.168*** -0.156** -0.140**(-2.07) (-1.21) (-2.64) (-2.05) (-2.55)
Cash Flow*GIIPS Bank Dep.*Crisis 0.039**(2.30)
R2 0.671 0.664 0.621 0.670 0.730N 485 462 424 471 450
Panel D: GIIPS firms with low fraction of revenue generated by non-GIIPS subsidiaries
GIIPS Bank Dep.*Crisis -0.054** 0.010 -0.047 -0.098* -0.046(-2.33) (0.93) (-1.38) (-1.88) (-0.91)
Cash Flow*GIIPS Bank Dep.*Crisis 0.020(1.02)
R2 0.594 0.483 0.435 0.630 0.536N 923 747 779 913 858
Firm Controls YES YES YES YES YESFirm Fixed Effects YES YES YES YES YESIndustry*Year Fixed Effects YES YES YES YES YESForeign Bank Country*Year Fixed Effects YES YES YES YES YES
Table IV presents firm-level regressions. The dependent variables are net debt, the change in cash holdings, employ-
ment growth, investments, and sales growth, respectively. The sample consists of firms in the intersection of DealScan
and Amadeus. Panel A includes firms located in Germany, France, or U.K. (non-GIIPS countries) that do not have
any foreign subsidiary located in Greece, Italy, Ireland, Portugal, or Spain (GIIPS countries) or any other non-EU
country. Panel B includes firms located in a non-GIIPS country that have at least one foreign GIIPS subsidiary.
Panel C includes firms in GIIPS countries that have a high fraction (in the highest tercile of the distribution) of
their revenues generated by non-GIIPS subsidiaries. Panel D includes firms located in a GIIPS country that have
a low fraction of their revenue generated by non-GIIPS subsidiaries. GIIPS Bank Dependence is defined as fraction
of total outstanding loans provided by GIIPS lead arrangers. Crisis is an indicator variable equal to one starting
in 2009 for Greece and in 2010 for all other countries (beginning of the sovereign debt crisis) and zero before. Firm
control variables include the logarithm of total assets, leverage, net worth, tangibility, interest coverage ratio, and
EBITDA as a fraction of total assets and for the cash regression a firm’s cash flow and capital expenditures. All
firm-level control variables are lagged by one period. All variables are defined in Table I. All regressions include
firm, industry-year and foreign bank country-year fixed effects, as well as all firm-level controls. Standard errors are
adjusted for heteroskedasticity and clustered at the firm-level. Significance levels: * (p < 0.10), ** (p < 0.05), ***
(p < 0.01).40

Table V - Listed vs. Non-Listed Firms
Panel A: Listed Firms
(1) (2) (3) (4) (5)
Net Debt ∆ Cash Emp Growth CAPX Sales Growth
GIIPS Bank Dep.*Crisis 0.013 0.013* -0.038 -0.018 -0.037
(0.68) (1.95) (-1.41) (-0.62) (-1.36)
Cash Flow*GIIPS Bank Dep.*Crisis -0.005
(-1.41)
R2 0.669 0.569 0.552 0.673 0.648
N 1805 1772 1737 1786 1748
Panel B: Non-Listed Firms
GIIPS Bank Dep.*Crisis -0.045** 0.003 -0.047** -0.073** -0.056**
(-2.31) (0.50) (-2.20) (-2.12) (-2.06)
Cash Flow*GIIPS Bank Dep.*Crisis 0.010**
(2.46)
R2 0.637 0.558 0.548 0.678 0.592
N 2643 2231 2044 2565 2466
Panel C: Firms with constant GIIPS Bank Dependence
GIIPS Bank Dep.*Crisis -0.039** 0.001 -0.047** -0.076*** -0.049*
(-2.22) (0.14) (-2.23) (-2.67) (-1.95)
Cash Flow*GIIPS Bank Dep.*Crisis 0.011***
(2.80)
R2 0.617 0.489 0.481 0.663 0.546
N 3242 2831 2648 3156 3068
Panel D: Switcher vs. Non-Switcher
Listed Non-Listed Cum.
Switcher 62.38% 37.62% 100%
Non-Switcher 27.27% 72.73% 100%
Table V presents firm-level regressions. The dependent variables are net debt, the change in cash holdings, em-
ployment growth, investments, and sales growth, respectively. The sample consists of all firms in the intersection
of DealScan and Amadeus and located in the following countries: Greece, Italy, Ireland, Portugal, Spain (GIIPS
countries) or Germany, France, U.K. (non-GIIPS countries). Panel A includes firms that are publicly listed while
Panel B firms that are not publicly listed. Panel C includes firms that have a constant GIIPS Bank Dependence
throughout the sample period. Finally, Panel D reports the fraction of firms with constant GIIPS Bank Depen-
dence (non-switcher) in the listed and non-listed subsamples. GIIPS Bank Dependence is defined as fraction of
total outstanding loans provided by GIIPS lead arrangers. Crisis is an indicator variable equal to one starting in
2009 for Greece and in 2010 for all other countries (beginning of the sovereign debt crisis) and zero before. Firm
control variables include the logarithm of total assets, leverage, net worth, tangibility, interest coverage ratio, and
EBITDA as a fraction of total assets and for the cash regression a firm’s cash flow and capital expenditures. All
firm-level control variables are lagged by one period. All variables are defined in Table I. All regressions include firm,
industry-country-year and foreign bank country-year fixed effects, as well as all firm-level controls. Standard errors
are adjusted for heteroskedasticity and clustered at the firm-level. Significance levels: * (p < 0.10), ** (p < 0.05),
*** (p < 0.01). 41

Table VI - Lending Volume and Spread
Panel A: Loan Volume
(1) (2) (3) (4) (5) (6) (7)∆Volume ∆Volume ∆Volume ∆Volume ∆Volume ∆Volume ∆Volume
GIIPS*Crisis -0.046** -0.018 -0.045* -0.068** -0.046* -0.039*(-2.04) (-0.71) (-1.74) (-2.12) (-1.78) (-1.66)
CDS Weighted Dom. Bondholdings*Crisis -0.048**(-2.00)
High Leverage*GIIPS*Crisis -0.076**(-2.04)
Low Rating*GIIPS*Crisis -0.096**(-1.97)
Gov. Intervention*GIIPS*Crisis 0.044(1.08)
High Gov. Board*GIIPS*Crisis -0.012(-0.37)
High Gov. Own.*GIIPS*Crisis -0.045(-1.12)
R2 0.707 0.744 0.731 0.730 0.727 0.730 0.730N 5448 4947 5372 5372 5372 5372 5372
Panel B: Loan Spread
∆Spread ∆Spread ∆Spread ∆Spread ∆Spread ∆Spread ∆Spread
GIIPS*Crisis 0.041* 0.018 0.045* 0.043 0.044* 0.052**(1.92) (1.06) (1.84) (0.98) (1.69) (2.21)
CDS Weighted Dom. Bondholdings*Crisis 0.047*(1.92)
High Leverage*GIIPS*Crisis 0.082**(2.03)
Low Rating*GIIPS*Crisis 0.157*(1.93)
Gov. Intervention*GIIPS*Crisis -0.022(-0.45)
High Gov. Board*GIIPS*Crisis -0.075(-1.14)
High Gov. Own.*GIIPS*Crisis -0.072(-1.07)
R2 0.685 0.737 0.747 0.747 0.745 0.748 0.748N 3230 3004 3171 3171 3171 3171 3171
Bank-Level Controls YES YES YES YES YES YES YESFirm Cluster-Year Fixed Effects YES YES YES YES YES YES YESFirm Cluster-Bank Fixed Effects YES YES YES YES YES YES YES
Table VI presents the results of an adapted version of the Khwaja and Mian (2008) bank lending channel regression.
The unit of observation is a firm cluster-bank-year. The dependent variable is the change in log loan volume (Panel
A) or change in log spread (Panel B) of a bank-firm cluster relation in a given year where firm clusters are formed
based on a firm’s country of incorporation, industry, and rating. The rating of each firm is estimated from EBIT
interest coverage ratio medians for firms by rating category provided by Standard & Poor’s. We assign ratings on the
basis of the pre-crisis median interest coverage ratio of each firm. Data is restricted to: (i) the set of firm cluster-bank
relations that existed before the start of the sovereign debt crisis, and (ii) firm cluster-bank years where firms in a
cluster borrow at least from one GIIPS bank and one non-GIIPS bank. Crisis is an indicator variable equal to one
starting in 2009 for Greece and in 2010 for all other countries (beginning of the sovereign debt crisis) and zero before.
All variables are defined in Table I. All regressions include firm cluster-year fixed effects, firm cluster-bank fixed
effects and bank controls (logarithm of total assets, equity to total assets, impaired loans to total equity). Standard
errors are clustered at the bank level. Significance levels: * (p < 0.10), ** (p < 0.05), *** (p < 0.01).
42

Tab
leV
II-
Pas
sive
Ch
ann
el:
Hit
onb
alan
cesh
eet
Pan
el
A:
Ris
kof
GII
PS
sovere
ign
bon
dh
old
ings
(1)
(2)
(3)
(4)
(5)
Net
Deb
t∆
Cas
hE
mp
Gro
wth
CA
PX
Sal
esG
row
th
CD
SW
eighte
dG
IIP
SSov
.B
ondhold
ings*
Cri
sis
-0.0
18**
-0.0
00-0
.025*
*-0
.029*
*-0
.031*
(-2.
02)
(-0.
01)
(-2.0
3)(-
2.0
7)(-
1.80
)
CD
SW
eighte
dG
IIP
SSov
.B
ondhold
ings*
Cri
sis*
Cas
hF
low
0.01
1***
(2.7
3)
R2
0.55
30.
472
0.44
10.
609
0.51
6
N41
9137
81357
3409
9397
2
Pan
el
B:
Ris
kof
dom
est
icso
vere
ign
bon
dh
old
ings
CD
SW
eighte
dD
om
esti
cSov
.B
ondhol
din
gs*C
risi
s-0
.019
**0.
000
-0.0
27*
*-0
.031*
*-0
.027*
*
(-2.
24)
(0.1
4)(-
2.23)
(-2.
23)
(-2.2
2)
CD
SW
eighte
dD
om
esti
cSov
.B
ondhol
din
gs*C
ash
Flo
w*C
risi
s0.
011*
**
(2.8
1)
R2
0.55
30.
474
0.44
20.
609
0.50
2
N41
9137
81357
3409
9397
2
Table
VII
pre
sents
firm
-lev
elre
gre
ssio
ns.
The
dep
enden
tva
riable
sare
net
deb
t,th
ech
ange
inca
shhold
ings,
emplo
ym
ent
gro
wth
,in
ves
tmen
ts,
and
sale
sgro
wth
,
resp
ecti
vel
y.T
he
sam
ple
consi
sts
of
all
firm
sin
the
inte
rsec
tion
of
Dea
lSca
nand
Am
adeu
sth
at
are
loca
ted
inth
efo
llow
ing
countr
ies:
Gre
ece,
Italy
,Ir
eland,
Port
ugal,
Spain
(GII
PS
countr
ies)
or
Ger
many,
Fra
nce
,U
.K.
(non-G
IIP
Sco
untr
ies)
,w
hic
hhav
ea
lendin
gre
lati
onsh
ipto
abank
that
was
part
of
the
EB
A
stre
sste
sts.
CDS
WeightedGIIPS
Sov.
Bondholdings
(Panel
A)
andCDS
WeightedDomesticSov.
Bondholdings
(Panel
B)
mea
sure
the
fract
ion
of
aff
ecte
d
lead
arr
anger
sbase
don
the
risk
-adju
sted
GII
PS
and
dom
esti
cso
ver
eign
bondhold
ings
of
banks
ina
firm
’ssy
ndic
ate
,re
spec
tivel
y.Crisis
isan
indic
ato
rva
riable
equal
toone
start
ing
in2009
for
Gre
ece
and
in2010
for
all
oth
erco
untr
ies
(beg
innin
gof
the
sover
eign
deb
tcr
isis
)and
zero
bef
ore
.F
irm
contr
ol
vari
able
sin
clude
the
logari
thm
of
tota
lass
ets,
lever
age,
net
wort
h,
tangib
ilit
y,in
tere
stco
ver
age
rati
o,
and
EB
ITD
Aas
afr
act
ion
of
tota
lass
ets
and
for
the
cash
regre
ssio
na
firm
’sca
shflow
and
capit
al
exp
endit
ure
s.A
llfirm
-lev
elco
ntr
ol
vari
able
sare
lagged
by
one
per
iod.
All
vari
able
sare
defi
ned
inT
able
I.A
llre
gre
ssio
ns
incl
ude
firm
,in
dust
ry-c
ountr
y-y
ear
and
fore
ign
bank
countr
y-y
ear
fixed
effec
ts,
as
wel
las
all
firm
-lev
elco
ntr
ols
.Sta
ndard
erro
rsare
adju
sted
for
het
erosk
edast
icit
yand
clust
ered
at
the
firm
-lev
el.
Sig
nifi
cance
level
s:*
(p<
0.1
0),
**
(p<
0.0
5),
***
(p<
0.0
1).
43

Table VIII - Active Channel: Risk Shifting
Panel A: Leverage(1) (2) (3) (4) (5)
Net Debt ∆ Cash Emp Growth CAPX Sales Growth
High Leverage GIIPS*Crisis -0.032* -0.003 -0.036** -0.049** -0.040**(-1.94) (-0.73) (-2.13) (-2.13) (-2.01)
High Leverage*Crisis -0.006 0.003 0.007 0.001 0.013(-0.69) (0.82) (0.66) (0.05) (1.35)
GIIPS*Crisis -0.015 0.006 -0.025** -0.031* -0.019(-1.17) (1.41) (-2.00) (-1.70) (-1.29)
High Leverage GIIPS*Crisis*Cash Flow 0.011**(2.06)
High Leverage*Crisis*Cash Flow 0.001(0.51)
GIIPS*Crisis*Cash Flow 0.003(0.68)
R2 0.554 0.461 0.430 0.594 0.500N 4339 3918 3695 4246 4115
Panel B: Rating
Low Rating GIIPS*Crisis -0.026* -0.004 -0.032** -0.044** -0.063***(-1.68) (-0.70) (-2.01) (-1.99) (-2.72)
Low Rating*Crisis 0.023** -0.002 0.012 0.045*** 0.055***(2.10) (-0.53) (1.07) (2.68) (2.63)
GIIPS*Crisis -0.033*** 0.008* -0.025* -0.037** -0.032**(-2.72) (1.89) (-1.94) (-2.10) (-2.10)
Low Rating GIIPS*Crisis*Cash Flow 0.017*(1.83)
Low Rating*Crisis*Cash Flow -0.010(-1.28)
GIIPS*Crisis*Cash Flow 0.008**(2.54)
R2 0.553 0.464 0.430 0.596 0.502N 4339 3918 3695 4246 4115
Table VIII presents firm-level regressions. The dependent variables are net debt, the change in cash holdings,
employment growth, investments, and sales growth, respectively. The sample consists of all firms in the intersection
of DealScan and Amadeus and located in the following countries: Greece, Italy, Ireland, Portugal, and Spain (GIIPS
countries) and Germany, France, and U.K. (non-GIIPS countries), with a lending relationship to a bank that was
part of the EBA stress tests. GIIPS measures the fraction of syndicated loans provided by banks incorporated in a
GIIPS country and High Leverage GIIPS (Low Rating GIIPS) the fraction provided by high leverage (low rating)
banks incorporated in a GIIPS country. A bank is considered highly leveraged if its ratio of total equity to total
assets is below the sample median in 2009 (separate median split for GIIPS and non-GIIPS banks) (Panel A) and
it is considered to have a low rating if its median rating is A+ or lower in 2009 (Panel B). Crisis is an indicator
variable equal to one starting in 2009 for Greece and in 2010 for all other countries (beginning of the sovereign debt
crisis) and zero before. Firm control variables include the logarithm of total assets, leverage, net worth, tangibility,
interest coverage ratio, and EBITDA as a fraction of total assets and for the cash regression a firm’s cash flow and
capital expenditures. All firm-level control variables are lagged by one period. All variables are defined in Table I.
All regressions include firm, industry-country-year and foreign bank country-year fixed effects, as well as all firm-level
controls. Standard errors are adjusted for heteroskedasticity and clustered at the firm-level. Significance levels: *
(p < 0.10), ** (p < 0.05), *** (p < 0.01).
44

Table IX - Active Channel: Moral Suasion
Panel A: Intervened Banks(1) (2) (3) (4) (5)
Net Debt ∆ Cash Emp Growth CAPX Sales GrowthGIIPS Gov. Intervention*Crisis -0.004 -0.006* 0.002 0.001 -0.011
(-0.44) (-1.95) (0.21) (0.04) (-0.62)Gov. Intervention*Crisis 0.001 0.002 0.004 0.014 -0.011
(0.10) (0.54) (0.39) (1.02) (-0.80)GIIPS*Crisis -0.032** 0.009* -0.032** -0.040** -0.038**
(-2.55) (1.95) (-2.44) (-2.26) (-2.37)GIIPS Gov. Intervention*Crisis*Cash Flow 0.009
(1.54)Gov. Intervention*Crisis*Cash Flow 0.001
(0.22)GIIPS*Crisis*Cash Flow 0.007*
(1.83)
R2 0.552 0.463 0.429 0.593 0.500N 4339 3918 3695 4246 4115
Panel B: Government OwnershipHigh Fraction Gov. Own. GIIPS*Crisis 0.003 0.000 0.011 0.012 0.015
(0.31) (0.03) (1.22) (0.81) (1.33)High Fraction Gov. Own.*Crisis 0.020 0.003 0.004 0.003 -0.014
(1.57) (0.70) (0.38) (0.16) (-1.05)GIIPS*Crisis -0.024* 0.006 -0.031** -0.044** -0.046***
(-1.74) (1.33) (-2.14) (-2.36) (-2.80)High Fraction Gov. Own. GIIPS*Crisis*Cash Flow -0.000
(-0.04)High Fraction Gov. Own.*Crisis*Cash Flow -0.011***
(-2.84)GIIPS*Crisis*Cash Flow 0.010***
(2.69)
R2 0.554 0.463 0.430 0.593 0.500N 4339 3918 3695 4246 4115
Panel C: Government Board SeatsHigh Fraction Gov. Board GIIPS*Crisis 0.012 -0.004 0.011 0.012 0.015
(1.10) (-1.23) (1.04) (0.83) (1.21)High Fraction Gov. Board*Crisis -0.002 0.003 0.006 0.007 -0.029**
(-0.16) (0.84) (0.46) (0.41) (-2.00)GIIPS*Crisis -0.032** 0.006 -0.026* -0.037** -0.048***
(-2.47) (1.40) (-1.80) (-2.16) (-3.02)High Fraction Gov. Board GIIPS*Crisis*Cash Flow -0.002
(-0.41)High Fraction Gov. Board*Crisis*Cash Flow 0.002
(0.37)GIIPS*Crisis*Cash Flow 0.012***
(3.31)
R2 0.553 0.462 0.431 0.593 0.500N 4339 3918 3695 4246 4115
Table IX presents firm-level regressions. The dependent variables are net debt, the change in cash holdings, em-
ployment growth, investments, and sales growth, respectively. The sample consists of all firms in the intersection of
DealScan and Amadeus and located in the following countries: Greece, Italy, Ireland, Portugal, and Spain (GIIPS
countries) and Germany, France, and U.K. (non-GIIPS countries), with a lending relationship to a bank that was
part of the EBA stress tests. GIIPS measures the fraction of syndicated loans provided by banks incorporated in
a GIIPS country. Gov. Intervention measures the fraction of loans provided by banks that received government
support during the crisis (Panel A). High Fraction Gov. Own. measures the fraction of loans provided by banks
with an above median government ownership (Panel B). High Fraction Gov. Board measures the fraction of loans
provided by banks with an above median fraction of government affiliated directors (Panel C). Crisis is an indicator
variable equal to one starting in 2009 for Greece and in 2010 for all other countries (beginning of the sovereign debt
crisis) and zero before. Firm control variables include the logarithm of total assets, leverage, net worth, tangibility,
interest coverage ratio, and EBITDA as a fraction of total assets and for the cash regression a firm’s cash flow and
capital expenditures. All firm-level control variables are lagged by one period. All variables are defined in Table I.
All regressions include firm, industry-country-year and foreign bank country-year fixed effects, as well as all firm-level
controls. Standard errors are adjusted for heteroskedasticity and clustered at the firm-level. Significance levels: *
(p < 0.10), ** (p < 0.05), *** (p < 0.01).
45
Figure 1. - Real Effects - Entire Sample
-.025
0
.025
.05
-2 -1 0 1 2
Panel A: Employment Growth
.075
.1
.125
.15
.175
.2
-2 -1 0 1 2YEAR
Panel B: Investment
-.025
0
.025
.05
.075
-2 -1 0 1 2YEAR
High GIIPS Bank Dep. Low GIIPS Bank Dep.
Panel C: Sales Growth
YEAR
Figure 1 shows employment growth rates (Panel A), capital expenditures as a fraction of tangible assets (Panel
B), and sales growth rates (Panel C) for firms with high (red solid line) and low (blue dashed line) GIIPS Bank
Dependence in the pre-crisis period (years -2 and -1) and the crisis period (starting in year 0). We consider all loans
in DealScan to firms located in the following countries: Greece, Italy, Ireland, Portugal, Spain, Germany, France, and
U.K. We restrict the sample to firms with financial information available in Amadeus.
46

Figure 2. - Liquidity Management - Entire Sample
.5
.55
.6
.65
.7
.75
-2 -1 0 1 2YEAR
High GIIPS Dep. Low GIIPS Dep.
Panel A: Total Credit Line/(Total Credit Line+Cash)
.4
.45
.5
.55
.6
.65
-2 -1 0 1 2YEAR
High GIIPS Dep. Low GIIPS Dep.
Panel B: Undrawn Credit Line/(Undrawn Credit Line+Cash)
Figure 2 shows firms’ total outstanding credit lines as a fraction of their credit lines plus cash holdings (Panel A)
and firms’ undrawn credit lines as a fraction of their undrawn credit lines plus cash holdings (Panel B) for firms with
high (red solid line) and low (blue dashed line) GIIPS Bank Dependence in the pre-crisis period (years -2 and -1) and
the crisis period (starting in year 0). We consider all loans to firms located in the following countries: Greece, Italy,
Ireland, Portugal, Spain, Germany, France, and U.K. We restrict the sample to firms in the intersection of DealScan,
Amadeus, and Capital IQ.
47

Figure 3. - Example for Matching of Firms and Banks
Figure 3 shows the geographical overview of business activities conducted by the German catering firm “Die Menu
Manufaktur Hofmann”, a firm located in Southern Germany that delivers food to canteens of hospitals, corporations,
etc.
48

Figure 4. - Real Effects - Non-GIIPS firms without GIIPS or other non-EU subsidiaries
-.025
0
.025
.05
-2 -1 0 1 2YEAR
Panel A: Employment Growth
.075
.1
.125
.15
.175
.2
-2 -1 0 1 2YEAR
Panel B: Investment
-.05
-.025
0
.025
.05
.075
-2 -1 0 1 2YEAR
High GIIPS Bank Dep. Low GIIPS Bank Dep.
Panel C: Sales Growth
Figure 4 shows employment growth rates (Panel A), capital expenditures as a fraction of tangible assets (Panel B),
and sales growth rates (Panel C) for firms located in France, U.K., or Germany with high (red solid line) and low
(blue dashed line) GIIPS Bank Dependence in the pre-crisis period (years -2 and -1) and the crisis period (starting
in year 0) that do not have subsidiaries in Greece, Italy, Ireland, Portugal, Spain, or other non-EU countries. We
restrict the sample to firms with financial information available in Amadeus.
49

Figure 5. - Real Effects - GIIPS firms with a high fraction of revenue from non-GIIPS subsidiaries.
-.05
-.025
0
.025
.05
-2 -1 0 1 2YEAR
Panel A: Employment Growth
.05
.075
.1
.125
.15
.175
-2 -1 0 1 2YEAR
Panel B: Investment
-.05
-.025
0
.025
.05
.075
-2 -1 0 1 2YEAR
High GIIPS Bank Dep. Low GIIPS Bank Dep.
Panel C: Sales Growth
Figure 5 shows employment growth rates (Panel A), capital expenditures as a fraction of tangible assets (Panel B),
and sales growth rates (Panel C) for firms located in Greece, Italy, Ireland, Portugal, or Spain with high (red solid
line) and low (blue dashed line) GIIPS Bank Dependence in the pre-crisis period (years -2 and -1) and the crisis
period (starting in year 0) that generate an above median fraction of their revenue in subsidiaries not located in
GIIPS countries. We restrict the sample to firms with financial information available in Amadeus.
50

Figure 6. - Evolution of sovereign debt holdings - All Banks
0
5
10
15
20
25
30
35
.01
.02
.03
.04
.05
.06
.07
.08
.09
2009 2010 2011 2009 2010 2011
Non-GIIPS Banks GIIPS Banks
Panel A: GIIPS Sovereign Debt Exposure (% Bank Assets)
0
5
10
15
20
25
.01
.02
.03
.04
.05
.06
.07
.08
.09
2009 2010 2011 2009 2010 2011
Non-GIIPS Banks GIIPS Banks
Holdings Country CDS-weighted Holdings
Panel B: Domestic Sovereign Debt Exposure (% Bank Assets)
Figure 6 shows the banks’ aggregated GIIPS (Panel A) and domestic (Panel B) sovereign bondholdings (solid blue
line, left axis, as a fraction of total assets) and the banks’ aggregated GIIPS (Panel A) and domestic (Panel B)
sovereign bondholdings multiplied by the CDS spread of the respective GIIPS country (dashed red line, right axis,
as a fraction of total assets). GIIPS banks comprise all banks headquartered in Greece, Italy, Ireland, Portugal, and
Spain. Non-GIIPS banks consist of banks headquartered in France, Germany, and U.K. Sovereign bondholdings are
from the EBA. We compile total assets from SNL Financial and CDS spreads from Datastream. CDS spreads are
measured at the end of the preceding year.
51

Figure 7. - Evolution of domestic sovereign debt holdings - GIIPS Banks
051015202530354045505560657075
.01
.02
.03
.04
.05
.06
.07
.08
.09
2009 2010 2011 2009 2010 2011
low leverage GIIPS bank high leverage GIIPS bank
Panel A: Domestic Sovereign Debt Exposure (% Bank Assets)
051015202530354045505560657075
.01
.02
.03
.04
.05
.06
.07
.08
.09
2009 2010 2011 2009 2010 2011
high rating GIIPS bank low rating GIIPS bank
Holdings Country CDS-weighted Holdings
Panel B: Domestic Sovereign Debt Exposure (% Bank Assets)
Figure 7 shows the banks’ aggregated domestic sovereign bondholdings (solid blue line, left axis, as a fraction of total
assets) and these holdings multiplied by the CDS spread of the banks’ home countries (dashed red line, right axis,
as a fraction of total assets). High (low) leverage GIIPS banks comprise all banks headquartered in Greece, Italy,
Ireland, Portugal, and Spain that have a below (above) median ratio of total equity to total assets (Panel A). Low
(high) rating GIIPS banks comprise all banks headquartered in a GIIPS country that have a rating of A+ or lower
(AA- or better) (Panel B). We compile total assets from SNL Financial and CDS spreads from Datastream. CDS
spreads are measured at the end of the preceding year.
52

VI. Online Appendix
Table X - Number of Borrowers and Banks per Country
Borrowers Lead BanksGermany 150 13Spain 165 26France 180 7United Kingdom 342 8Greece 12 1Ireland 14 2Italy 171 8Portugal 22 4
Table X presents a breakdown of the number of firms and lead arranger banks by country.
53

Tab
leX
I-
Des
crip
tive
Sta
tist
ics
-D
ealS
can
Sam
ple
vs.
Ver
yL
arge
Am
adeu
s
Pan
el
A:
Dep
en
dent
Vari
ab
les
Pan
el
B:
Exp
lan
ato
ryV
ari
ab
les
Em
pG
row
thC
AP
XS
ales
Gro
wth
Tot
alA
sset
s(m
n)
Tan
gib
ilit
yIn
t.C
ov.
Net
Wor
thE
BIT
DA
/Ass
ets
Lev
erage
Mea
n0.
052
0.19
30.
055
378
00.5
763.
060.2
240.1
120.6
10
Dea
lSca
nS
amp
leM
edia
n0.
024
0.12
0.052
592
0.5
872.
550.2
200.1
060.6
10
Std
.D
ev.
0.14
50.
181
0.16
1961
00.2
383.
090.1
700.0
700.1
74
Mea
n0.
056
0.19
90.
049
471
0.3
902.
960.2
170.1
130.6
03
Ver
yL
arg
eA
mad
eus
Med
ian
0.01
70.
140.
044
114
0.3
433.
010.1
980.0
990.6
21
Std
.D
ev.
0.18
60.
165
0.17
5210
00.2
694.
230.2
280.
080.2
46
Diff
.-0
.004
-0.0
06-0
.006
331
00.1
860.
1-0
.007
-0.0
010.0
07
(t-S
tat)
(0.5
8)(-
1.45
)-1
.52)
(19.
49)
(29.
98)
(1.1
4)
(1.4
3)(-
0.1
6)(0
.91)
Nor
mali
zed
Diff
.0.3
360.
530.
02-0
.025
-0.0
030.0
16
Panel
Aof
XI
pre
sents
des
crip
tive
stati
stic
sof
dep
enden
tand
Panel
Bof
expla
nato
ryva
riable
sfo
rth
epre
-cri
sis
per
iod
split
into
firm
sth
at
are
inth
ein
ters
ecti
on
of
Am
adeu
sand
Dea
lSca
nand
the
rem
ain
ing
firm
sin
the
the
cate
gory
of
”V
ery
Larg
e”C
om
panie
sin
Am
adeu
sin
the
follow
ing
countr
ies:
Gre
ece,
Italy
,Ir
eland,
Port
ugal,
Spain
(GII
PS
countr
ies)
or
Ger
many,
Fra
nce
,U
.K.
(non-G
IIP
Sco
untr
ies)
.
54

Tab
leX
II-
Com
par
ison
Dea
lSca
not
her
Ban
ks
Tot
alA
sset
s(m
n)
Impai
red
Loa
ns
Equit
yT
ier1
Cap
ital
Rat
ioE
quit
y/T
otal
Ass
ets
Mea
n15
7242
0.23
60.
080
0.06
1
Dea
lSca
nB
anks
Med
ian
46427
0.18
20.
075
0.05
6
Std
.D
ev.
219
245
0.20
30.
020
0.03
1
Mea
n5611
00.
249
0.09
70.
068
Oth
erB
anks
Med
ian
1295
90.
162
0.08
70.
059
Std
.D
ev.
133
031
0.20
30.
036
0.03
6
Diff
.(t
-Sta
t)10
1131
(5.2
1)-
0.01
2(-
0.39
)-0
.016
(-4.
01)
-0.0
06(
-1.5
9)
Norm
aliz
edD
iff.
0.3
94-0
.036
-0.4
02-0
.136
Table
XII
pre
sents
des
crip
tive
stati
stic
sfr
om
the
pre
-cri
sis
per
iod
for
banks
that
are
act
ive
inth
esy
ndic
ate
dlo
an
mark
etand
all
oth
erbanks
inco
rpora
ted
inth
e
follow
ing
countr
ies:
Gre
ece,
Italy
,Ir
eland,
Port
ugal,
and
Spain
(GII
PS
countr
ies)
and
Ger
many,
Fra
nce
,and
U.K
.(n
on-G
IIP
Sco
untr
ies)
.A
lldata
are
from
SN
L
Fin
anci
al.
55

Table XIII - Rated vs. Unrated Firms
Panel A: Unrated Firms
(1) (2) (3) (4) (5)
Net Debt ∆ Cash Emp Growth CAPX Sales Growth
GIIPS Bank Dep.*Crisis -0.043*** 0.005 -0.043*** -0.070*** -0.050***
(-2.87) (0.98) (-2.71) (-2.96) (-2.63)
Cash Flow*GIIPS Bank Dep.*Crisis 0.008***
(2.75)
R2 0.568 0.468 0.461 0.614 0.502
N 3876 3441 3242 3786 3675
Panel B: Rated Firms
GIIPS Bank Dep.*Crisis -0.037 0.033 -0.033 -0.056 -0.043
(-1.15) (1.59) (-1.10) (-1.50) (-1.22)
Cash Flow*GIIPS Bank Dep.*Crisis -0.034
(-1.26)
R2 0.763 0.787 0.739 0.764 0.826
N 572 562 539 565 546
Table XIII presents firm-level regressions. The dependent variables are net debt, the change in cash holdings,
employment growth, investments, and sales growth, respectively. The sample consists of all firms in the intersection
of DealScan and Amadeus and located in the following countries: Greece, Italy, Ireland, Portugal, and Spain (GIIPS
countries) and Germany, France, and U.K. (non-GIIPS countries), and that have no credit rating (Panel A) or have
a credit rating (Panel B). GIIPS Bank Dependence is defined as fraction of total outstanding loans provided by
GIIPS lead arrangers. Crisis is an indicator variable equal to one starting in 2009 for Greece and in 2010 for all other
countries (beginning of the sovereign debt crisis) and zero before. Firm control variables include the logarithm of total
assets, leverage, net worth, tangibility, interest coverage ratio, and EBITDA as a fraction of total assets and for the
cash regression a firm’s cash flow and capital expenditures. All firm-level control variables are lagged by one period.
All variables are defined in Table I. All regressions include firm, industry-country-year and foreign bank country-year
fixed effects (Panel A only), as well as all firm-level controls. Standard errors are adjusted for heteroskedasticity and
clustered at the firm-level. Significance levels: * (p < 0.10), ** (p < 0.05), *** (p < 0.01).
56

Table XIV - Alternative Measures
Panel A: Indirect Sovereign Debt Holdings
(1) (2) (3) (4) (5)
Net Debt ∆ Cash Emp Growth CAPX Sales Growth
Risk Weighted Indirect Sov. Bondholdings -0.030** 0.001 -0.024** -0.039** -0.029*
(-2.17) (0.49) (-2.18) (-2.20) (-1.91)
Risk Weighted Indirect Sov. Bondholdings*Cash Flow 0.009**
(2.24)
R2 0.569 0.481 0.455 0.631 0.540
N 4101 3696 3495 4014 3890
Panel B: GIIPS Bank Dependence as a fraction of total debt
GIIPS Bank Dep./Total Debt*Crisis -0.027*** 0.000 -0.020** -0.039*** -0.054***
(-2.90) (0.09) (-1.97) (-2.60) (-4.06)
Cash Flow*Crisis*GIIPS Bank Dep./Total Debt 0.003*
(1.90)
R2 0.541 0.442 0.421 0.586 0.495
N 4448 4003 3781 4351 4221
Panel C: Average GIIPS Bank Dependence
Avg. GIIPS Bank Dep.*Crisis -0.031*** 0.002 -0.030*** -0.054*** -0.041***
(-2.78) (0.57) (-2.63) (-3.21) (-3.04)
Cash Flow*Avg.GIIPS Bank Dep.*Crisis 0.004**
(2.11)
R2 0.541 0.441 0.422 0.586 0.492
N 4448 4003 3781 4351 4221
Table XIV presents firm-level regressions. The dependent variables are net debt, the change in cash holdings,
employment growth, investments, and sales growth, respectively. The sample consists of all firms in the intersection
of DealScan and Amadeus and located in the following countries: Greece, Italy, Ireland, Portugal, and Spain (GIIPS
countries) and Germany, France, and U.K. (non-GIIPS countries). Panel A considers the Risk Weighted Indirect Sov.
Bondholdings of firms, defined as the amount of domestic sovereign bondholdings multiplied with the sovereign CDS
spread (taken from EBA stress test data) that a firm holds (indirectly) through the lead banks in a firm’s syndicate.
Panel B considers the fraction of a firms total debt that is issued by GIIPS lead arrangers in the form of syndicated
loans. Panel C considers the average GIIPS Bank Dependence (measured over the period 2005-2009) for each firm.
Crisis is an indicator variable equal to one starting in 2009 for Greece and in 2010 for all other countries (beginning
of the sovereign debt crisis) and zero before. Firm control variables include the logarithm of total assets, leverage,
net worth, tangibility, interest coverage ratio, and EBITDA as a fraction of total assets and for the cash regression
a firm’s cash flow and capital expenditures. All firm-level control variables are lagged by one period. All variables
are defined in Table I. All regressions include firm, industry-country-year and foreign bank country-year fixed effects,
as well as all firm-level controls. Standard errors are adjusted for heteroskedasticity and clustered at the firm-level.
Significance levels: * (p < 0.10), ** (p < 0.05), *** (p < 0.01).
57

Table XV - Placebo Test
(1) (2) (3) (4) (5)
Net Debt ∆ Cash Emp Growth CAPX Sales Growth
GIIPS Bank Dep.*Placebo Crisis 0.008 0.001 0.012 0.010 -0.010
(0.73) (0.23) (1.04) (0.58) (-0.79)
Cash Flow*Placebo Crisis -0.001
(-0.35)
Cash Flow*GIIPS Bank Dep. -0.004
(-1.46)
Cash Flow 0.005
(1.15)
Cash Flow*Placebo Crisis*GIIPS Bank Dep. -0.001
(-0.34)
R2 0.544 0.441 0.421 0.585 0.493
N 4448 4003 3781 4351 4221
Table XV presents firm-level regressions. The dependent variables are net debt, the change in cash holdings, em-
ployment growth, investments, and sales growth, respectively. The sample consists of all firms in the intersection of
Dealscan and Amadeus and located in the following countries: Greece, Italy, Ireland, Portugal, and Spain (GIIPS
countries) and Germany, France, and U.K. (non-GIIPS countries). GIIPS Bank Dependence is defined as fraction
of total outstanding loans provided by GIIPS lead arrangers. Placebo Crisis is an indicator variable equal to one
for the pre crisis years 2006-2008. Firm control variables include the logarithm of total assets, leverage, net worth,
tangibility, interest coverage ratio, and EBITDA as a fraction of total assets and for the cash regression a firm’s cash
flow and capital expenditures. All firm-level control variables are lagged by one period. All variables are defined in
Table I. All regressions include firm, industry-country-year and foreign bank country-year fixed effects, as well as all
firm-level controls. Standard errors are adjusted for heteroskedasticity and clustered at the firm-level. Significance
levels: * (p < 0.10), ** (p < 0.05), *** (p < 0.01).
58

Table XVI - Change in Sovereign Holdings
Panel A: LeverageDelta Holdings Delta Holdings
High Leverage -0.008 (-1.62) -0.010 (-1.57)High Leverage*GIIPS 0.020** (2.33) 0.027** (2.44)GIIPS 0.005 (1.13)
R2 0.352 0.458
Panel B: Rating
Low Rating 0.002 (0.25) 0.002 (0.27)Low Rating*GIIPS 0.021** (2.18) 0.026** (2.29)GIIPS 0.005 (1.28)
R2 0.512 0.559
Panel C: Government Intervention
Gov. Intervention -0.001 (-0.26) -0.004 (-0.75)Gov. Intervention*GIIPS 0.008 (1.11) 0.006 (0.75)GIIPS 0.006 (1.31)
R2 0.238 0.422
Panel D: Government Ownership
High Fraction Gov. Own. 0.000 (0.03) 0.001 (0.22)High Fraction Gov. Own.*GIIPS -0.004 (-0.40) -0.003 (-0.22)GIIPS 0.014*** (2.94)
R2 0.303 0.318
Panel E: Government Board Seats
High Fraction Gov. Board 0.001 (0.16) 0.001 (0.23)High Fraction Gov. Board*GIIPS 0.001 (0.15) 0.010 (1.18)GIIPS 0.009** (2.10)
R2 0.197 0.458N 32 32Country Fixed Effects NO YES
Table XVI presents bank-level regressions. The dependent variable is the change in a bank’s domestic sovereign debt
holdings from 2009-2011. The sample consists of all banks in the following countries: Greece, Italy, Ireland, Portugal,
and Spain (GIIPS countries) and Germany, France, and U.K. (non-GIIPS countries), that were included in all EBA
stress tests/capital exercises between 2009 and 2011. High Leverage is an indicator variable equal to one if a bank
had an above median leverage in 2009, and zero otherwise. Low Rating is an indicator variable equal to one if a
bank had a median rating of A+ or lower in 2009, and zero otherwise. Government intervention is an indicator
variable equal to one if a bank received government support during the 2008-09 financial crisis, and zero otherwise.
High Fraction Gov. Ownership is an indicator variable equal to one if a bank had an above median fraction of shares
by the respective government in 2009, and zero otherwise. High Fraction Gov. Board Seats is an indicator variable
equal to one if a bank has an above median fraction of government affiliated directors, and zero otherwise. GIIPS
is an indicator variable equal to one if a bank is incorporated in one of the GIIPS countries. Significance levels: *
(p < 0.10), ** (p < 0.05), *** (p < 0.01).
59

Table XVII - Change in Bank CDS
Delta CDS Delta log CDS
GIIPS sov. Bondholdings 0.002*** 0.112***
(3.35) (4.40)
log Total Assets -0.003 0.014
(-1.54) (0.13)
R2 0.457 0.408
N 25 25
Table XVII presents bank-level regressions. The dependent variable is the change in bank CDS or the log change in
bank CDS over the crisis period. The sample consists of all banks in the following countries: Greece, Italy, Ireland,
Portugal, and Spain (GIIPS countries) and Germany, France, and U.K. (non-GIIPS countries), that were included
in the 2010 EBA stress tests and with available CDS data. GIIPS sov. Bondholdings is measured as the amount
of GIIPS sovereign bondholdings divided by a bank’s total assets. Standard errors are clustered at the bank-level.
Significance levels: * (p < 0.10), ** (p < 0.05), *** (p < 0.01).
60

Figure 8. - Fraction of syndicated loans to total loans in Europe
0.1
.2.3
Frac
tion
France Germany Greece Ireland Italy Portugal Spain UKSource: ECB and Dealscan
Figure 8 shows the fraction of syndicated loans relative to the total amount of loans issued to non-financial corporations
in a given country, measured as the average fraction from 2005-2009.
61

Figure 9. - Distribution of GIIPS Bank Dependence
0.1
.2.3
.4.5
Frac
tion
0 0.2-0.4 0.6-0.8 60.01-02 0.4-0.6 0.8-1GIIPS Bank Dependence
0.2
.4.6
Frac
tion
0 0.2-0.4 0.6-0.8 60.01-0.2 0.4-0.6 0.8-1GIIPS Bank Dependence
0.1
.2.3
.4Fr
actio
n
0 0.01-0.2 0.2-0.4 0.4-0.6 0.6-0.8 0.8-1GIIPS Bank Dependence
0.2
.4.6
.8Fr
actio
n
0 0.2-0.4 0.6-0.8 60.01-0.2 0.4-0.6 0.8-1GIIPS Bank Dependence
Figure 9 shows the distribution of GIIPS Bank Dependence for various subsamples. Panel A shows the distribution
of GIIPS Bank Dependence for our entire sample of firms. Panel B plots the distribution for firms incorporated
in GIIPS countries. Panel C shows the distribution for non-GIIPS firms while Panel D shows the distribution for
non-GIIPS firms conditional on having a positive GIIPS Bank Dependence.
62