
MAT 2720 Discrete Mathematics Section 2.2 More Methods of Proof Part II

IS : 2720 ( Part XII ) - 1984 (Reaffirmed 1997)
Indian Standard
METHODS OF TEST FOR SOILS PART XII DETERMINATION OF SHEAR STRENGTH
PARAMETERS OF SOIL FROM CONSOLIDATED UNDRAINED TRIAXIAL COMPRESSION TEST WITH
MEASUREMENT OF PORE WATER PRESSURE
( First Revision )
Gr 9
Second Reprint DECEMBER 1998
UDC 624’131’439’5 : 624’131’536
BUREAU OF INDIAN STANDARDS MANAK BHAVAN, 9 BAHADUR SHAH ZAFAR MARG
NEW DELHI 110002
November 1982

Indian
IS:272O(PartXII)-1981
Standard METHODS OF TEST FOR SOILS
PART XII DETERMINATION OF SHEAR STRENGTH PARAMETERS OF SOIL FROM CONSOLIDATED UNDRAINED TRIAXIAL
COMPRESSION TEST WITH MEASUREMENT OF PORE WATER PRESSURE
( First Revision )
Soil Engineering and Rock Mechanics Sectional Committee, BDC 23
Chairman
DR JAGDISH NARAIN
Representing
University of Roorkee, Roorkee
Members
ADDITIONAL DIRECTOR, IRI Irrigation Department, Government of Bihar, Patna
ADD~ONAL DIRECTOR R~EARCH (F. E.), RDSO
DEPUTY DIRECTOR RESEARCH
Ministry of Railways
( &XL-MECH ), RDSO ( AIfernale ) PROF ALAM SINGB University of Jodhpur, Jodhpur SHRI P. D. AGARWAL Public Works Department, Government of Uttar
Pradesh, Lucknow DR B. L. DHAWAN ( Alternate )
COL AVTAR SINGH Engineer-in-Chief’s Branch, Army Headquarters LT-COL V. K. KANITKAR (Alternate )
CHIEF ENGINEER ( D & R ) Irrigation Department, Government of Punjab, Chandigarh
DR G. S. DH~LLON ( Alternate ) SHR~ M. C. DANDAVATE
SHRI N. C. DUGGAL ( Alternate ) The Concrete Association of India, Bombay
( Continued on page 2 )
@J Copyright 1982
BUREAU OF INDIAN STANDARDS This publication is-protected under the In&m Copyright Act ( XIV of 1957 ) and
reproduction in whole or in part by any means except with written permission of the
publisher shall be deemed to be an infringement of copyright under the said act.

( Continuedfrompage 1 )
Members SHRI A. G. DASTIDAR
DR G. S. DHILLON DIRECIDR, IRI
SHRI A. H. DIVANJI
!TI-IRI A. N. JANGLE ( Alternate ) DR GOPAL RAJAN DR GOPAL RANJAN SHRI S. G~~PTA
Institution of Bngineers ( India ), Calcutta University of Roorkee, Roorkee Cemindia Co Ltd, Bombay
SHRI N. V. DE Sousa ( Alternate ) SHRI G. S. JAIN G. S. Jam & Associates, Roorkee
SHRI VIJAY K. JAIN (Alternate ) SHRI A. B. JOSHI Central Water Commission, New Delhi
DEPUTY DIRECTOR ( CSMRS ) ( Alternate ) CAL M. V. KAYERKAR Ministry of Defence ( R & D )
SHRI V. B. GHORPADE ( Alternate )
Representing In personal capacity ( 5 Hungerford Street, 12/l
Ifungerford Court, Calcutta-700017 ) Indian Geotechnicai Society, New Delhi Irrigation Department, Government of Uttar
Pradesh, T+know Asisg%~&ons and Construction (P) Ltd.
SHRI 0. P. MALHOTRA
SHRI D. R. NARAHARI
SHRI B . G. RAO ( Alternate ) Smu T. K. NATRAJAN
DR G. V. RAO DR K. K. GU~TA ( Alternate )
R-ARCH OFFICER ( B & RRL )
SHRI K. R. SAXENA
SECRETARY Depury SECRETARY ( Alternate )
SHRI N. SIVAGURU
SHRI D. V. SIKKA ( Alternate ) SHRI K. S. SRINIVASAN
SHRI SUNIL BERRY ( Alternate ) SHRI N. SUBRAMANYAM
SUPERINTENDING ENGINEER (P&DC)
EXJXUT~~E ENGINEER ( SMRD ) ( Alternate )
SHR~ G. RAMAN, Director ( Civ Engg )
Public Works Department, Chandigarh Adminis- tration,~+andigarh
CentrRal~rl~dmg Research Institute ( CSIR ),
Central Road Research Institute ( CSIR ), New .Delhi
Indian Institute of Technology, New Delhi
Publ$hW~~~~~partment, Government of Punjab,
Engineering Research Laboratories, Government of Andhra Pradesh, Hyderabad
Central Board of Irrigation & Power, New Delhi
Roa$_W$;) ( Ministry of Shipping and
National Buildings Organization, New Delhi
Kamataka Engineering Research Station, Krishanarajasagar
Public Works Department, Government of Tamil Nadu, Madras
Director General, ISI ( Ex-officio Member )
Secretary
SFI K. M. MATHUR
Deputy Director ( Civ Engg ), ISI
( Continued on page 39 )
2

Indian METHODS OF
Is:272o(PartxII)-1981
Standard TEST FOR SOILS
PART XII DETERMINATION OF SHEAR STRENGTH PARAMETERS
OF SOIL FROM CONSOLIDATED UNDRAINED TRIAXIAL
COMPRESSION TEST WITH MEASUREMENT OF PORE
WATER PRESSURE
( First Revision )
O.FOREWORD
0.1 This Indian Standard was adopted by the Indian Standards Institution on 24 December 1981, after the draft finalized by the Soil Engineering and Rock Mechanics Sectional Committee had been approved by the Civil Engineering Division Council.
0.2 This standard ( Part XII ) was first published in 1975. Based on the experience gained in the use of this standard in the past five years, this Part has been revised. The principal modifications being made are in regard to permitting the other types of apparatus also which meet the basic requirements given in the standard and also other sizes of specimen.
0.3 In reporting the results of a test or analysis made in accordance with this standard, if the final value, observed or calculated, is to be rounded off, it shall be done in accordance with IS : 2-1960*
1. SCOPE
1.1 This standard ( Part XII ) lays down the method of determining the shear strength parameters of saturated soils from triaxial compression shear tests conducted under consolidated undrained conditions with measurements of pore water pressures. It also describes a procedure.
1.2 The test is limited to specimens in the form of right cylinders of nominal diameter 38, 50, 70 or 100 mm with height twice its diameter. The ratio of diameter of the sample to the maximum size of the particle in the soil shall not be less than five.
*Rules for rounding off numerical values ( revised ).
3

1s: 2720 ( Part XII ) - 1981
2. TERMINOLOGY
2.1 For the purpose of this standard the terminology given in IS : 2809- 1972* shall apply.
3. APPARATUS
3.1 For conducting the a test, the testing system consists of the following five major functional components:
a) A system to house the sample, that is, a triaxial cell;
b) A system to apply cell pressure and maintain it at a constant magnitude;
c) A system to apply additional axial stress;
d) A system to measure pore water pressure; and
e) A system to measure changes of volume of the soil sample.
3.2 Any of the apparatus which can achieve the five functions listed above can be used. One of the suggested variety of the anuaratus and the alter- nate variety suitable are given below. The given in Fig. I.
general set up of apparatus is
Functional Component ( see 3.1 )
Suggested Variety Alternate Variety
a) A, triaxial cell with two valves providing access to cell and two to pedestal. Operation of valves shall not produce a change of volume in the lines in which the valves exist. The cell has one air vent and one oil inlet. It has a stainless steel loading ram running in a lapp- ed or honed bush lubricated with oil. The triaxial cell con- sidered can be subjected to a maximum pressure of 10 kgf/ cm2
Jariation in number of valves and vents acceptable. Tri- axial cells with higher pres- sure capacity may be used. The bush through which the loading ram passes should not have a ‘0’ ring seal which will increase the ram friction
*Glossary of terms and symbols relating to soil engineering (first revision ).
4

IS : 2720 ( Part XII ) - 1981
Any system employing air or hydraulic pressure so long as it can be maintained at a constant level with a preci- sion of f 0.01 kgf/cm2
Any device to effect incre- mental loading for conduct- ing tests under stress control conditions
b)
4
d)
e>
Self compensating meri;ury pot system able to keep pressure at a constant level with a vari- ation of less than 0’01 kgf/cm*
Loading frame able to subject soil sample to axial deforma- tion at constant rates in the range from 0.50 to 0.02 mm/ min
Mechanical null indicator system able to measure pore water pressure with an accu- racy of 0.01 kgf/cm2
Burette of 10 ml capacity with a least count of O-05 ml
i) Electrical null systems ii) Pressure transducers act-
uated by insignificantly little flow of water
The system shall be such as to measure pore water pres- sure with an accuracy of 001 kgf/cms
Burette of larger capacity but with a least count of at least O-05 ml
3.3 The details of the suggested variety except the loading frame and its accessories are shown in Fig. 1. The details of the alternate varieties will depend on their types.
3.4 Components - The suggested variety shall consist of the components given in 3.4.1 to 3.4.14. The components of the other varieties will depend upon their types.
3.4.1 The Triaxial Cell -See( ll)to(25)inFig. 1.
3.4.2 A system to FilZ Water in Cell - See ( 7 ), ( I ) and ( II ) in Fig. 1. The water reservoir ( 7 ) can be filled with de-aired water by connecting lead ( I) to a vacuum pump and lead ( II ) to a.sump of de-aired water with valves Wl and W2 open and valves Gl, G2 and G3 closed. After reservoir ( 7 ) is filled, disconnect vacuum pump from lead ( I ). For filling cell with water open valves Wl, G2, C3 and C2 and air vent ( 12 ) and keep all other valves closed.
3.4.3 A System to Apply Cell Pressure and Maintain it at Constant Pressure - See ( 1 ) to ( 6 ) in Fig. 1. With valves M2 and M3 closed and valves Ml, C3 and C2 open, cell pressure can be applied on account of the difference in elevation of the level of mercury in the top movable mercury
5


pot ( 3 ) and its corresponding bottom mercury pot ( 4 ). The movable brac- ket ( 1) can be moved up or down as necessary to apply any desired pressure. The maximum amount of pressure that can be thus applied is controlled by. the floor to ceiling height of the laboratory. The range of cell pressure that can be applied as noted above can be doubled by using two pairs of mercury pots in series by closing valve Ml and opening valves M2, M3, C3 and C2. Pressure from mercury pots ( 3 ) and ( 4 ), is conveyed via valve M3 to top of mercury pot ( 5 ) fixed at the ceiling and is thus added to the pres- sure contribution from mercury pots, ( 5 ) and ( 6 ) before it is conveyed to the cell via valves M2, C3 and C2.
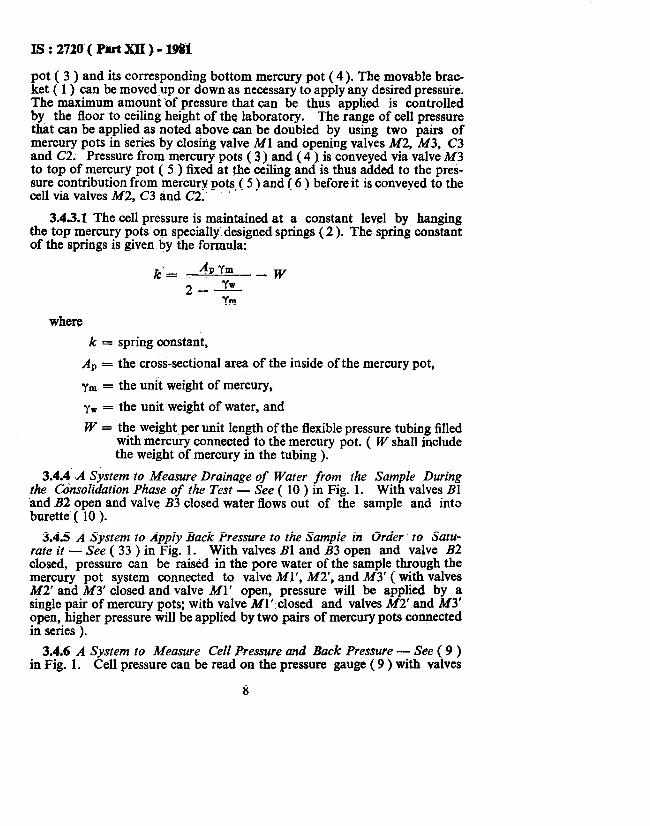
3.4.3.1 The cell pressure is maintained at a constant level by hanging the top mercury pots on specially designed springs ( 2 ). The spring constant of the springs is given by the formula:
k’= 4PYm _ w
2 YW -- Ym
where
k = spring constant,
AP = the cros$sectional area of the inside of the mercury pot,
ym = the unit weight of mercury,
yw = the unit weight of water, and
W = the weight per unit length of the flexible pressure tubing filled with mercury conneoted to the mercury pot. ( W shall include the weight of mercury in the tubing ).
3.44 A System to Measure Drainage of Water from the Sample During the Consolidation Phase of the Test - See ( 10 ) in Fig. 1. With valves Bl and B2 open and valve B3 closed water flows out of the sample and into burette ( 10 ).
3.4.5 A System to Apply Back Pressure to the Sample in Order to Satu- rate it - See ( 33 ) in Fig. 1. With valves Bl and B3 open and valve B2 closed, pressure .can be raised in the pore water of the sample through the mercury pot system connected to valve Ml’, M2’, and M3’ ( with valves M2’ and M3’ closed and valve Ml’ open, pressure will be applied by a single pair of mercury pots; with valve Ml’ closed and valves M2’ and M3’ open, higher pressure will be applied by two pairs of mercury pots corrected in series ).
3.4.6 A System to Measure Cell Pressure and Back Pressure - See ( 9 ) in Fig. 1. Cell pressure can be read on the pressure gauge ( 9 ) with valves
8 .;”
Is:272O(PartxII)-X981
C2, C3, G2 and Gl open and valves Wl, W2 and G3 closed. Back pressure can be read on the pressure gauge ( 9 ) with valves Bl, B3, G3 and Gl open and valves Wl, W2, G2 and B2 closed. The pressure gauge ( 9 ) which, should have a least count of at least 0.1 kgf/cma shall be so mounted in the system that it is at about the same elevation as the mid-height of the soil sample.
3.4.7 A System to Push. Water into or to Withdraw Water from Zones in the Cell Pressure Application System and in the Back Pressure Application System - See ( 8 ) in Fiq. 1. Clockwise rotation of the handle of the screw control cylinder ( 8 9) pushes water out of the cylinder and into the zone determined by valve positions anti-clockwise rotation of the handle draws water into the cylinder.
3.4.8 A System to Measure Pore Water Pressure - See ( 26 ) to ( 32 ) in Fig. 1. Pore water pressure measurement is made with valves Bl, A4, A5 and A6 closed and valves Al, A2 and A3 open if pressure is to be read in the pressure gauge ( 30 ). If pressure is to be measured on the monometer ( 32) then valves Bl, A3, A5 and A6 are closed and valves Al, A2 and A4 are opened. The pressure gauge ( 30 ) which should have a least count of at - least 0.1 kgf/cm2 and the manometer ( 32 ) shall be so mounted in the sjrsteni _ that they are at about the same elevation as the mid height of the sample.~ The crucial requirement for the pore water pressure measuring system is that it shall be able to measure the pore water pressure under undrained condi- tion, that is, water should neither flow out of the soil sample nor flow into it during the process of measurement. This is ensured by:
b)
4
using a tube which expands a negligible amount when stressed internally ( for example, annealed tube ) between the valve A! and the null indicator;
completely de-airing the drainage and back-pressure line ( 23 ), the pore pressure measurement line ( 25 ), the tubing ( 26 ) and the null indicator ( 27 ); and
using the null indicator. NOTE - For the purpose of understanding how this equipment works, the null
indicator may be considered to be narrow bore U-tube with mercu ‘Itl
filled in the bottom of the U-tube, and also partially filling a vertical limb of. e U-tube. Before beginning to make a measurement, the pore water pressure measuring system shall be brought to the same pressure which exists in the pore water of the sample and which is determined by the position of valves B2 and B3 in the drainage and back pressure line ( 23 ). This is achieved by opening valves A2, A3 and A4 but keeping valve A6 closed and using screw control cylinder ( 29 ) to build up pressure in the pore pressure measuring system to approximately equal the pore water pressure in the soil sample and then by connecting the pore pressure measurement line ( 25 ) and the drainage and back pressure line ( 23 ) together by keeping open valve Bl and opening valve A 1. With pressure m the measuring system now equal to the initial pore water pressure in the sample and recorded by pressure
9

IS : 2720 ( Part XII) - 1981
gauge ( 30 ), the position of the mercury-water interface in the left limb of the U-tube is set at a convenient height by using the screw control cylinder ( 29 ). Valve Bl is closed. The external stress conditions on the soil sample are changed which induce changes in pore water pressure. If the induced pore water pressure is positive there will be a tendency for the pore water to move out of the sample, travel through the tubing ( 26 ) and push the mercury-water meniscus ,in the left limb of the U-tube down from its initially set position. This movement of the meniscus is prevented by ope- rating the screw control cylinder ( 29 ) and raising pressure on the right limb of the U-tube. When the pressure built up by the screw control cylinder equals the induced pore water pressure there will be no tendency for the meniscus to move. By keeping the meniscus at its initially set position, the null condition or the undrained condition is maintained and the increase in pore water pressure is obtained by observing the increase in the pressure reading in the gauge ( 30 ). If the induced pressure in the pore water had been negative there would have been a tendency for the mercury- water meniscus to rise which can be countered by operating the screw control cylinder ( 29 ) and reducing the pressure on the right limb. The induced reduction in pressure can then be obtained by observing the decrease in the pressure reading in the gauge ( 30 ).
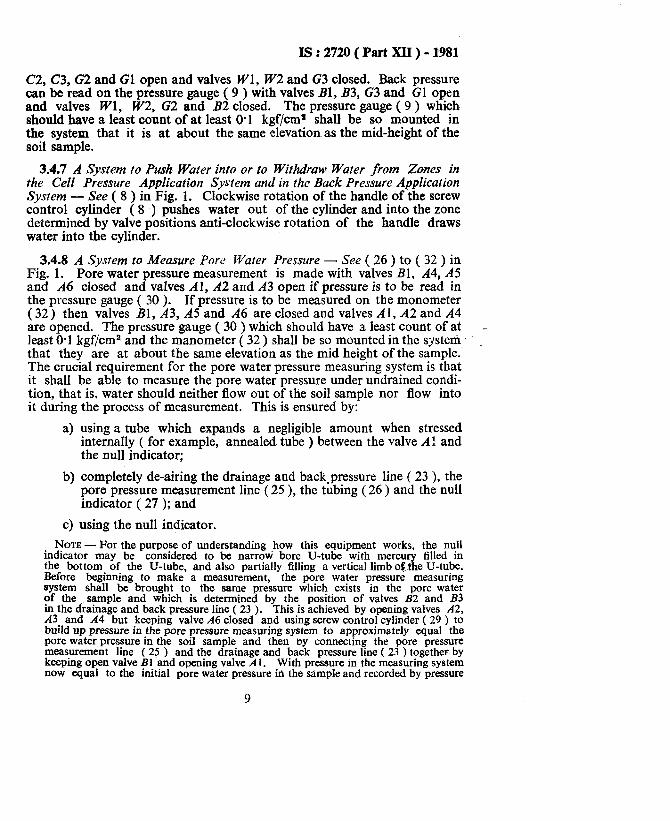
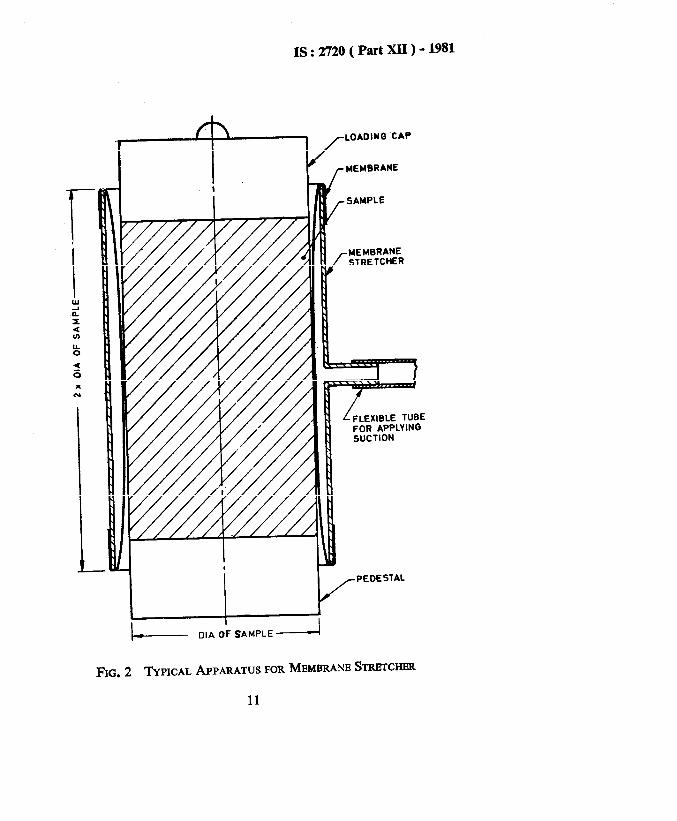
3.4.9 The Membrane Stretcher - See Fig. 2. To mount the membrane and the rubber ‘0’ rings on the soil sample and loading cam/pedestal.
3.4.10 Rubber Membrane - See ( 16 ) in Fig. 1. The soil sampIe is enclosed in a. rubber membrane impermeable to water, to isolate the sample from the water in the cell. The membrane should be about 140 mm long. Its thickness should be about 0.2 mm.
3.4.11 Rubber ‘0’ Rings - See ( 17 ) in Fig. 1. Seamless rubber ‘0’ rings should be used to seal the rubber membrane to the loading cap and pedestal. The unstretched inside diameter of the ‘0’ ring should be 31 &- 1 mm. At least two, usually more, ‘0’ rings are used both for sealing with the loading cap and with the pedestal.
3.412 Coarse Porous Stones - See (18) and ( 21 ) in Fig. 1. Coarse porous stones should be placed at the top and bottom of the sample to provide a free draining surface to the pore water. The stones should be about 3 mm thick and should be made of material whose particle size is between 180 and 150 micron IS Sieves.
3.4.13 Filter Paper for Strips [ See ( 19 ) in Fig. 1 ] and Discs - Filter paper strips should be provided along the height of the sample at its cir- cumference to induce radial drainage. In lieu of strips a rectangular paper of appropriate size with parallel slits may be wrapped around the sample after soaking the paper in water. Filter paper discs should be placed bet- ween the sample ends and the coarse porous stones to prevent the stones from becoming clogged due to migration of fine soil particles with the pore water. The filter paper to be used for this purpose should be such that it does not soften in water ( for example, Whatman’s No. 54 or equivalent ).
3.4.14 Accessories - Also required are accessories for soil sample preparation, extrusion, trimming and for measurement of size, weight, water content, etc.
10
IS : 2720 ( Part XII ) - 1981
I I
DIA OF SAMPLE -
-LOADING CAP
. MEMBRANE
r SAMPLE
/ MEMBRANE STRETCHER
/
PEDESTAL
FIG. 2 TYPICAL APPARATUS FOR MEMBRANE STRETCHBR
11
IS : 2720 ( Part XII ) - 1981
4. PROCEDURES FOR COMMISSIONING APPARATUS
4.1 Desiring of Pore Pressure Measurement Line - To make accurate measurements of pore water pressure, the pore pressure measurement line shall be completely de-aired and shall contain deaired water from the line’s outlet in the pedestal of the base of the triaxial cell to the mercury-water meniscus in the null indicator. This is achieved as described in 4.1.1 to 4.1.5. The description assumes that all valves are initially closed, and the top of the triaxial cell is lying on a table separated from the base.
4.1.1 Open valve A6 and fill delaired water in screw control cylinder ( 29 ) from reservoir of de-aired water ( 31 ) by moving the handle of the screw control cylinder in the anti-clockwise direction. Close valve A6 when cylinder is more than three quarters full.
4.1.2 Open valves A2 and A3 and adjust pressure so that pressure gauge reads zero. Open valve Al and by operating the handle of the screw con- trol cylinder bring the mercury down to the horizontal part of U-tube in the null indicator. Tilt the null indicator such that the mercury settles at the bottom part of the horizontal limb of the U-tube and such that when the water is pushed from the screw control cylinder it passes over the mer- cury to the tubing ( 26 ). Mercury shall always be prevented from coming in contact with brass and copper fittings since it reacts with these materials. By operating the screw control cylinder push water from the cylinder to pass over the mercury in the null indicator. through the tubing ( 26 ) and let it overflow at the pedestal on the base of the triaxial cell. Flush water thus through the pore pressure measurement line until screw control cylinder is empty. Close valve A2, open valve A6, refill screw control cylinder, then close valve A6, open valve A2 and flush the pore pressure measurement line again until screw control cylinder is half empty. This flushing will push out most of the air from the pore pressure measurement line. Close valve Al, build up pressure of about 6 kgf/cma in the tubing ( 26 ) and null indicator by rotating the handle of the screw control cylinder in the clock- wise direction. Leave the system under pressure for one to two hours. Open valve Al and flush out some more water through the pore pressure measurement line. The line is most likely deaired.
4.1.3 To check whether the pore pressure line has been de-aired or not proceed as follows. This check, however, tests the line from the null indi- cator to valve Al only and not beyond vaIve Al to the pedestal.
With valves A I, A4 and A6 closed and valves A2 and A3 open, tilt null indicator so that mercury shifts to the left side of the horizontal part of the U-tube. Build up pressure by operating the screw control cylinder ( 29 ). As pressure is built up, mercury will rise in the left limb of the U-tube. lf the pore pressure line from the null indicator to valve Al has a lot of air it will compress as pressure builds up and lot of mercury will
12

IS : 2720 ( Part XII ) - 1981
be pushed into the left limb of the U-tube. On the other hand, if the above mentioned portion of the pore pressure line has been deaired, the rise of the mercury in the left limb of the U-tube when pressure is built up will be insignificant and only due to the slight expansion of the tubing ( 26 ), The rise should be less than 10 mm for an increase pres- sure of 8-O kgf/cm*.
4.1.4 Apart from de-airing, there shall be no leaks in the pore pressure measuring apparatus. This may be checked visually as well as by subjecting different segments of the apparatus to pressure by operating the screw con- trol cylinder ( 29 ) and seeing, by observing the pressure gauge ( 30 ), if pressure is maintained in the segment; if the pressure drops to zero with time, some leak in the segment under study is indicated and this shall be isolated and eliminated.
4.1.5 When the pore pressure measuring apparatus has been de-aired and systematically checked to ensure that no leaks exist, the mercury in the null indicator is again brought to the horizontal part of the U-tube as des- cribed in 4.1.2, water is pushed from the screw control cylinder through valve A2 over the mercury, through valve Al until the pedestal is covered with water. Valve Al is then closed and pressure built up in the apparatus to about 6 kgf/cm2 by operating the screw control cylinder (29 ). The apparatus is left thus under pressure until required.
NOTE - During the consolidation phase of the E test, the pore pressure measur- ing unit is not required. The unit may be used elsewhere in the laboratory. For such purpose close valves Al and A2 and disconnect the unit where the tubing ( 26 ) meets valve Al. Prior to applying back pressure this connection shall be remade and to avoid any air getting trapped in the line during connection, the following procedure shall bc observed: the connection shall be made under water : ( a ) while water is flowing out from the tubing ( 26 ) which can be arranged by keeping mercury in the horizontal limb of the null indicator, valve A2 open and moving the screw control cylinder ( 29 ) clockwise, and ( b ) while water is flowing out from valve Al which can be arranged by opening valves Al, Bl and B2 and letting water flow from burette ( 10 ) through the pedestal and out at valve Al.
4.2 De-airing of Drainage and Back Pressure Line (Jee Fig. 1 ) - There shall be no air in the drainage and back pressure line ( 23 ) ( see 3.4.8 ). The deairing is achieved as in 4.2.1 to 4.2.3 and the description with refe- rence to Fig. 1 assumes that initially all valves associated with this line are closed.
4.2.1 Open valves B2 and Bl and let de-aired water flow from burette ( 10 ) to overflow at top of pedestal on the base of the triaxial cell. Keep the burette supplied with de-aired water and let water flow until no air bubbles are observed to emerge at the pedestal. Close valve B2.
4.2.2 Open valves Wl, Gl, G3 and B3 and let de-aired water flow from water reservoir ( 7 ) to overflow at top of the pedestal on the base of the
13

IS : 2720 ( Part m ) - 1981
triaxial cell until no air bubbles are observed to emerge at the pedestal. Close valves Wl and Bl.
4.2.3 Operate screw control cylinder ( 8 ) and build up pressure in the back pressure and drainage line ( 23 ) to 6 kgf/cm*. Leave the system under pressure for one to two hours. Open valve Bl and flush out some more water through the drainage and back pressure &ne by operating the screw control cylinder. Let some water stand on the pedestal and close valve Bl.
4.2.4 Check for leaks in the line in a manner similar to that described in 4.1.4 and systematically eliminate leaks.
4.3 Commissioning Self-Compensating Mercury Pot Systems - The mercury pot systems apply pressure on account of the difference in the elevation of levels of mercury in the top and the corresponding bottom mercury pots. For applying pressure it is necessary, therefore, that there be mercury in both the top and the corresponding bottom mercury pots. Mercury can be moved from one pot to another as in 4.3.1 to 4.3.4. The description with reference to Fig. 1 assumes that all valves associated with the system are initially closed.
43.1 To Bring Mercury Down from Movable Pot ( 3 ) to Bottom Pot ( 4 ) - Open valves Ml, G2 and Wl; mercury will thus flow from mova- ble pot ( 3 ) to bottom pot ( 4) and water from pot ( 4 ) will be pushed up into water reservoir ( 7 ). When required amount of mercury has come down to pot ( 4 ) close valve Wl.
4.3.2 To Push Mercury Up from Bottom Pot ( 4 ) to Movable Pot ( 3 ) - With valves Ml and G2 open, operate screw control cylinder ( 8 ) and push water from screw control cylinder to bottom pot ( 4 ) which will push mer- cury up to movable pot ( 3 ).
4.3.3 To Bring Mercury Down from Fixed Pot ( 5 ) to Bottom Pot ( 6) - This can be accomplished only by simultaneously bringing down mercury from movable pot ( 3 ) to bottom pot ( 4 ). Open.valves M2, M3, G2 and Wl and valve Ml closed, mercury will flow from movable pot ( 3 ) to bottom pot ( 4 ) which will push water up through valve M3 to top fixed pot ( 5 ) and mercury from pot ( 5 ) will then flow down to bottom pot ( 6 ) which in turn will push water up through valves M2, G2 and WI to water reservoir ( 7 ). When required amount of mercury has come down from top pots to corresponding bottom ones, close valve W,.
43.4 Tb Push Mercury Up from Bottom Pot ( 6) to Top Fixed Pot ( 5 ) - This too can be accomplished only by simultaneously pushing mercury UP from bottom pot ( 4 ) to movable top pot ( 3 ). With valves M2, M3 and G2 open, operate screw control cylinder ( 8 ) and push water from screw control cylinder to bottom pot ( 6 ) which will push mercury up to pot ( 5 ) and simultaneously mercury from pot ( 4 ) will go up to pot ( 3 ).
14

IS: 2720( Part XII)- 1981
4.4 De-aii of Filter Paper Strips and Discs and Porous Stones - For rapid drainage of water from soil sample during consolidation axid for rapid eqetion of pore water pressure during shear, it is necessary to place two coarse porous stones and two filter paper discs, one set of stone and disc at top of the sample ( 18 ) in Fig. 1 and one set at the bottom of the sample ( 21 ) and to place about 8 filter paper strips of suitable dimensions vertically along the exposed surface of the sample ( see Note ). The filter paper strips should be placed so that they are in contact with the top and bottom porous stones and so that they do not protrude out from under tlie rubber ‘0’ rings. The filter paper strips and discs and the porous stones should also be de-aired. The de-airing is achieved by immersing them in a pan of water and boiling the water. After the water has boiled for about 10 minutes let the water cool keeping the strips, discs and stones immersed.
Nope - Alternately a filter paper of length ( IT& + 5 ) mm and width equal to ( L, + 6 ) mm with slits of 5 mm width leaving 5 mm width of filter paper cut with a sharp blade or knife, may be wrapped around the sample ( where Do is the diameter of the sample and LO is the height of the sample ).
4.5 The Rubber Membrane - See ( 16 ) in Fig. 1. The membrane shall be checked for leaks, by pinching one end and filling the membrane with water, then pinching the other end and building up pressure by squeezing the water into small zones in turn. After checking for leaks the rubber membrane should be dried and some french chalk applied to it.
4.6 The Loading Ram - See ( 13 ) in Fig. 1. The ram should move freely in its bush at the top of the triaxial cell. If it does not, it should be cleaned with a soft and absolutely clean cloth and lightly oiled. The loading ram when fully lifted should fall freely and smoothly under its own weight.
4.7 The Pedestal and Loading Cap - The pedestal at the base of the cell ( see Fig. 1 ), and the loading cap ( 15 ) should be carefully cleaned and their vertical sides lightly greased with high vacuum silicon grease.
5. SOIL, SAMPLES FOR TEST
5.1 Number of Samples - Normally a minimum of three samples of the soil are required to be able to determine the strength parameters. The three samples are then tested under three different effective confining stresses in the stress range of interest for the investigation in hand. 5.2 Type of Sample and Soil - The method described herein is equally valid for disturbed or undisturbed samples obtained by sampling from the field as well as for samples prepared in the laboratory by compaction, remoulding or any other process. Cohesionless soil samples are unable to stand on their own without lateral support. Samples of such soil are formed directly on the pedestal at the base of the triaxial cell. The procedures relevant to cohesionless soils are described in Appendix A. The procedure
15

IS : 2720 ( Part XII ) - 1981
described in 6 is for soii samples which are cohesive enough to stand on their own and which can be handled. The samples shall be brought to a diameter equal to the diameter of the pedestal of the triaxial cell and they shall have a height equal to twice their diameter.
5.3 Pre-sample Handling Operations - Prior to handling the soil for pre- paration of soil samples, the equipment should be commissioned and thoroughly checked as described in 4.
5.4 Control Measurements - For control purposes, the initial diameter, length and weight of the sample shall be measured before setting it up for test; the measurements shall be recorded in the proforma given in Appendix B. The water content of the soil sample which may be ascer- tamed by determining the water content of the parent soil from which the sample has been trimmed or shaped should also be recorded in the proforma.
6. TEST PROCEDURE
6.1 The test should be conducted in an environment in which ambient temperature is constant.
6.2 Setting Up of Sample - See Fig. 1. All valves are assumed to be closed and it is also assumed that the pedestal at the base of triaxial cell is covered with water as described in 4.1.5.
6.2.1 Gently slide one de-aired coarse porous stone on to the top of the pedestal and blow off any excess water from the pedestal. Place a filter paper disc on the stone and then place the soil sample on the disc. Place the second de-aired disc and then the coarse porous stone on top of the sample and’ the loading cap on top of the second porous stone. Ensure that the sample, the stones, the discs, and the loading cap are all concentri- cally placed on the pedestal.
6.2.2 Envelope the sample with eight de-aired filter paper strips placing each strip in turn so that it touches the top and bottom porous stones and arranging them so that they are placed at regular intervals around the entire circumference of the sample. Alternately wrap the filter paper with slits, around the sample.
6.2.3 Mount the rubber membrane on the membrane stretcher ( see Fig. 2 ). Suck out the air between the membrane and the stretcher wall and lower the stretcher on to the soil sample. Release the vacuum between the membrane and the stretcher wall and let the membrane cling on to the soil sample. Unfold the membrane from the top and bottom of the stretcher and loading cap and the pedestal.
16

IS : 2720 (Part XII ) - 1981
6.2.4 Mount rubber ‘0’ rings at the edge of the membrane stretcher and by again lowering the stretcher on the sample, slip off two ‘0’ rings to seal the membrane to the pedestal and then two ‘0’ rings to seal the membrane to the loading cap.
6.2.5 Place the top of the triaxial cell on its base and screw the two together. While placing the top make sure the loading ram is pulled suffi- ciently out of the top so that it does not hit the soil sample when the cell is being assembled.
6.2.6 Fill up cell with water as described in 3.4.2 until the cell is almost full. Fill the remaining space in the top of the cell by injecting oil through the oil inlet ( 14 ). When excess oil begins to spill out through the air vent ( 12 ) close both the air vent and the oil inlet.
6.2.7 With valves Cl, Al and Bl closed and valve C2 open, apply cell pressure as described in 3.4.3 equal to the desired amount of effective con- fining pressure and record it in the proforma given in Appendix B. The sample is now set up.
6.3 Consolidation of Sample - The sample will begin to consolidate as soon as valves 131 and B2 are opened ( valves B3, Al and Cl are still closed ). Before opening valves Bl and B2 ensure the following:
a) That the water level in burette ( 13 ) is at an appropriate level so that water draining from or into the sample can be observed and recorded. The burette should be so positioned that the water level in it is approximately at the same elevation as the mid-height of the sample.
b) That the initial reading of the water level in the burette ( 10 ) is recorded in the proforma in Appendix B.
c) That the observer is ready to record data time versus flow of water into or out of the burette ( 10 ).
6.3.1 Recording Data - Immediately upon opening valves Bl and B2 data of burette reading versus time and elapsed time should be recorded in the proforma in Appendix B. Readings may be taken for elapsed times which have a whole number for their square root, that is, for 1, 4, 9, 16, 25, 36, 49 and 64 minutes, etc, and continued until essentially complete consolidation has occurred, or for a maximum of 24 hours.
6.3.2 Computation qf Post-Consolidation Dimensions of Sample - On account of volume change occurring in the soil during consolidation the length and diameter of the sample alter. The dimensions after consolidation
17

IS : 2720 ( Part XII ) - 1981
may be estimated on the assumption that the sample remains a cylinder and that the soil behaves isotropically as follows:
L = Lo *_s- 3v0 >
D Do = 1 - _n_v 3v0 >
where
L = post-consolidation length,
L, = original length,
A V = change in volume during consolidation and is positive if volume has decreased,
V, = original volume,
D = post-consolidation diameter, and
Do = original diameter.
These dimensions should be recorded in the proforma in Appendix BS
6.3.3 Computing Coe$ficient of Consolidation - From data recorded as in 6.3.1, the coefficient of consolidation, cV, a parameter which is used for determining the deformation rate as described in 6.4.4 may be determined. In co1 3 of Pre-shear Data Sheet No. 1 of Appendix B fill in square root of t, the elapsed time, and in co1 5 fill in A V, the change in sample volume, being the difference between burette reading at each time and the initial burette reading. Plot A V WYSUS square root of time as shown in Fig. 3 and determine t,,. cv can then be determined from the formula:
TCD= c” = --- 100 t100
where D is the diameter of the sample in cm.
This formula is valid only for a sample whose length is twice its diameter and which has a coarse porous stone on its two ends and is enve- loped with filter paper strips.
6.4 Pre-shear Operations - Before proceeding to shear the soil sample, a number of operations should be completed and a few decisions taken as described in 6.4.1 to 6.4.4.
6.4.1 Application of Back Pressure - During the consolidation process described in 6.3 the pore water was allowed to drain into the burette until equilibrium was achieved. This implies that the pore water pressure at the
18

IS:272O(Pa&XII)-1981
6
IO 20 30 40
fi in min
FIG. 3 PLOT OF AVVerms l/F
end of consolidation became zero, that is atmospheric pressure. The total stress on the sample is equal to the cell pressure and since pore water pres- sure is zero, the effective stress is also equal to the cell pressure. The sample can be sheared under undrained conditions with this same effective stress and sample volume but by using elevated cell and pore water pressure. This is achieved by merely increasing both the cell pressure and the pore water pressure by equal amounts. The difference between the two elevated pres- sures thus equals the initial cell pressure. Testing under an artificially elevated cell, pressure and pore water pressure is referred to as testing under a back pressure. The back pressure equals the elevated pore water pressure. This has two advantages:
a) During shear, negative pore water pressure is induced in some soils. If pre-shear pore water pressure is zero, development of negative pore water pressure implies below atmospheric pore water pressure which is diEcult and sometimes impossible to measure on account of the consequent cavitation in the water in the pore water pressure measuring system. Development of negative pore water pressure during shear when sample has a back pressure results merely in lowering the positive value of pore water pressure and if back pressure selected is higher than the maximum negative pore dater pressure induced, the magnitude of pore water pressure remains above atmospheric and is readily measurable.
19

IS : 2720 ( Part XII ) - 1981
b) Even in supposedly saturated soil samples, the pore space some- times contains some air which on application of total stress to the sample compresses and causes volume change in the sample as well as causes effective stress to increase even under undrained conditions. By application of back pressure the air gets compressed and dissolved in pore water and one can ensure that the soil is fully saturated. This can be tested by measuring the B-factor of the soil as described in 6.4.2. Back pressure may be continued to be increased until B-factor becomes unity thus assuring that soil is 100 percent saturated.
6.4.1.1 To apply back pressure, cell pressure and pore water pressure should be increased simultaneously by the same amount. This is achieved as follows ( see Fig. 1 ) :
Close valves B2, Bl and C2 ( valves Cl and Al are already closed ). By operating valves C3, G2, Gl, Ml, M2, M3 and associated mercury pots as described in 3.4.3 increase cell pressure to be applied by an amount equal to the back pressure to be applied. ( Back pressure should be app- lied in small steps of about 0’5 kgf/cm2 so as to avoid creating stress con- centration in soil sample ). Close valve G2. Operate valves Gl, G3, B3, Ml’, M2’ and M3’ and the associated mercury pots as described in 3.4.5 and set the system to apply the desired amount of back pressure. Simul- taneously open valves Bl and C2 and let the sample come to equilibrium by allowing the new stresses to act on it for say 2 to 4 hours. Repeat the above process in steps until enough back pressure has been applied to achieve the two advantages described in (a) and (b) of 6.3.1.
6.4.2 Testing for B-Factor - As noted in 6.4.1(b) the sample is saturated when it exhibits a B-factor of preferably 1’0 but not less than O-9. The sample can be tested for B-factor at any stage during the process of back pressure application. The procedure is as given in 6.4.2.1 ( see Fig. 1 ).
NOTE - Iri certain soils such as residual clays and very stiff soils B-factor may be less than one at saturation.
6.4.2.1 Open valves A2 and A3 and bring pressure in the pore pressure measuring system to a value approximately equal to the pressure then exist- ing in the pore water of the sample by operating screw control cylinder ( 29 ). Open valve Al and let the pressure in the pore pressure measuring system equalize with the existing pore water pressure. Tilt the null indi- cator (27 ) and set the mercury in the left limb of the U-tube as described in 3.4.8. Close valve Bl. Increase cell pressure through valve C2 by a known amount and measure the increase in pore water pressure as described in 3.4.8. The ratio of increase in pore water pressure to the increase in cell pressure is the B-factor which should be recorded at the bottom of Pre- shear Data Sheet No. 1 of Appendix B. If B-factor is less than l-0, greater back pressure needs to be applied. To bring the system back to the set up
20
IS: 272O(Part XII)-1981
used for applying back pressure set the back pressure to be applied using valves Ml’, M2’, M3’, etc, and use screw control cylinder ( 29 ) to increase the pore water pressure to the desired level of back pressure, then open valve Bl . Use screw control cylinder ( 29 ) to withdraw mercury from the left limb of the U-tube to the bottom part of the U-tube and then close valve A 1. Let the sample equilibrate under the new cell and back pressure.
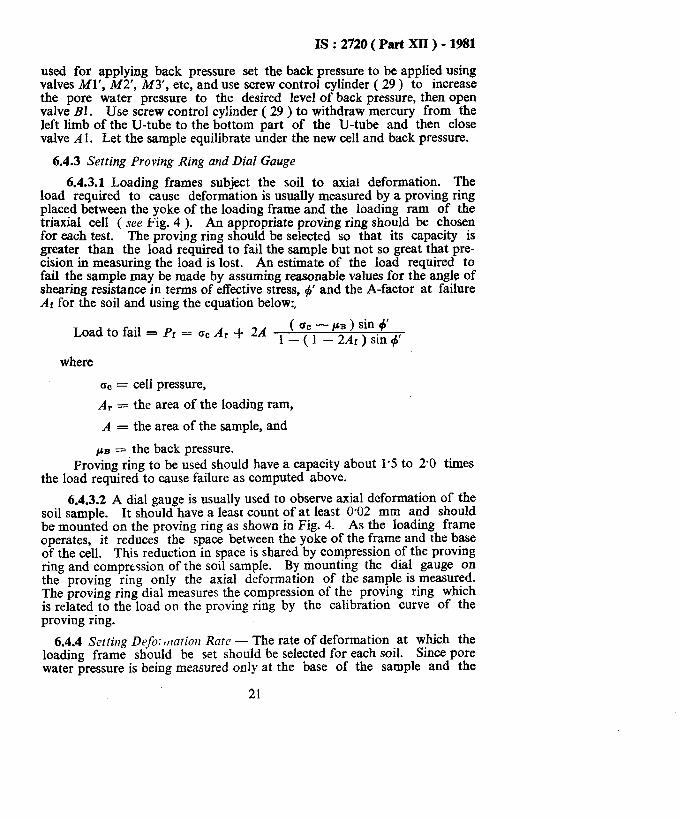
6.4.3 Setting Proving Ring and Dial Gauge
6.4.3.1 Loading frames subject the soil to axial deformation. The load required to cause deformation is usually measured by a proving ring placed between the yoke of the loading frame and the loading ram of the triaxial cell ( see Fig. 4 ). An appropriate proving ring should be chosen for each test. The proving ring should be selected so that its capacity is greater than the load required to fail the sample but not so great that pre- cision in measuring the load is lost. An estimate of the load required to fail the sample may be made by assuming reasonable values for the angle of shearing resistance in terms of effective stress, Fb) and the A-factor at failure AI for the soil and using the equation below:,
Load to fail = Pi = QC A, + 2A ( =c - pB ) sin 4’ 1 _ ( 1 _ 2Ar ) sin $’
where
oc = cell pressure,
Ar = the area of the loading ram,
A = the area of the sample, and
PB = the back pressure. Froving ring to be used should have a capacity about l-5 to 2-O times
the load required to cause failure as computed above.
6.4.3.2 A dial gauge is usually used to observe axial deformation of the soil sample. It should have a least count of at least 0.02 mm and should be mounted on the proving ring as shown in Fig. 4. As the loading frame operates, it reduces the space between the yoke of the frame and the base of the cell. This reduction in space is shared by compression of the proving ring and compression of the soil sample. By mounting the dial gauge on the proving ring only the axial deformation of the sample is measured. The proving ring dial measures the compression of the proving ring which is related to the load on the proving ring by the calibration curve of the proving ring.
6.4.4 Setting Defo; rrlntiou Rote - The rate of deformation at which the loading frame should be set should be selected for each soil. Since pore water pressure is being measured only at the base of the sample and the
21
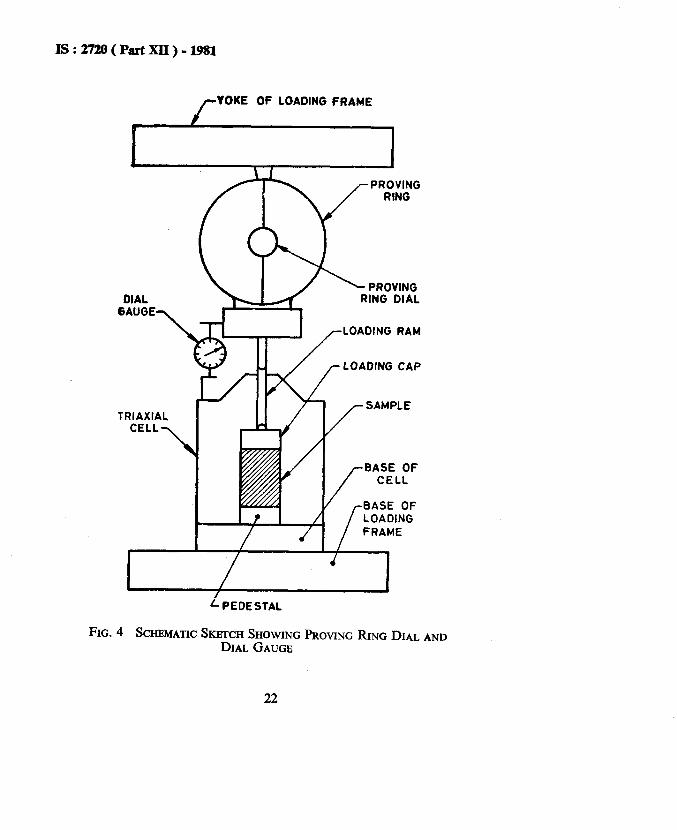
FIG
YOKE OF LOADING FRAME
I 1
DIAL GAUGE
LOADING RAM
LOADING CAP
BASE OF CELL
BASE OF LOADING FRAME
i PEDESTAL
.4 SCHEMATIC SKETCH SHOWING PROVING RING DIAL DIAL GAUGE
AND
22

Is:mB(PartxrI)-1981
failure zone is away from the base, it is imperative to shear slowly so that the pore water has an opportunity to equalize and the measured value equals the value in the shear zone. to failure, TV* may be computed from:
For 95 percent equalization the time
ri = 0.071 L.=
&_ v
L = post-consolidation length of sample; and
co = as given in 6.3.3 and filter paper strips, discs and porous stones are used as described in 6.2.
and by estimating axial strain necessary to produce failure or, rate of deformation may be calculated as:
qL-+- Deformation rate = K
ff
where
Pi = load to fail, and
K = a linear estimate of the proving ring calibration charac- teristics.
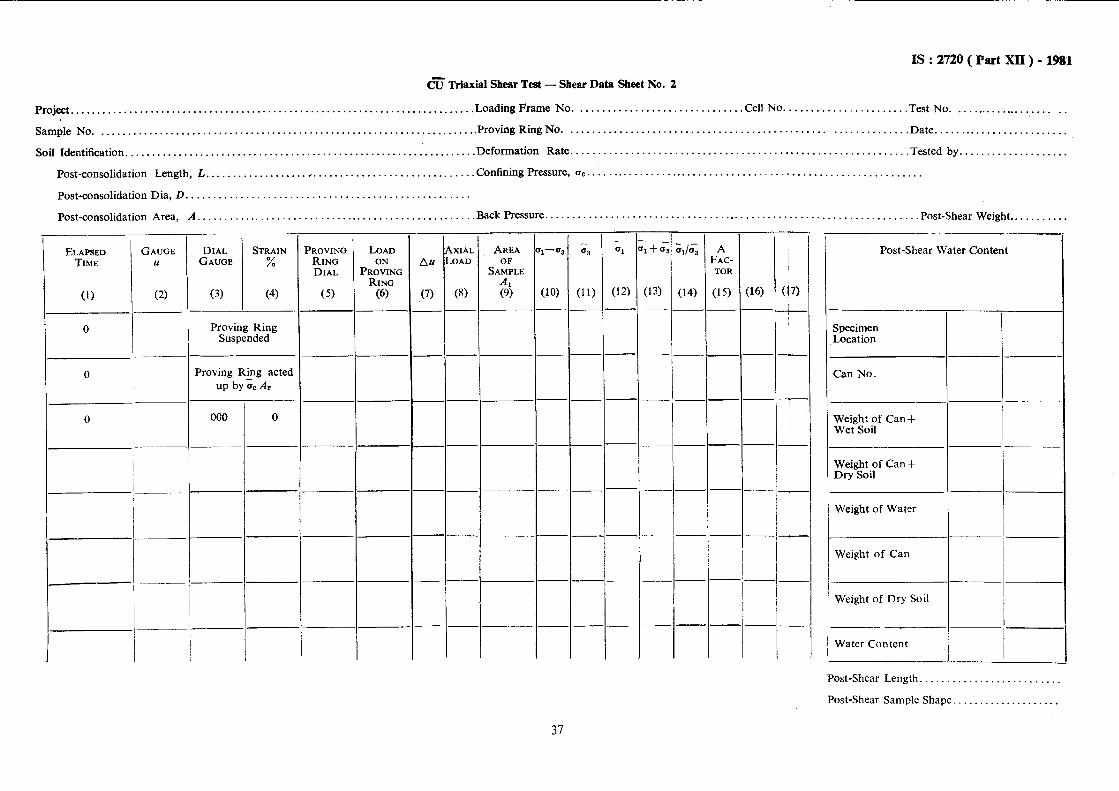
6.5 Shearing of Sample - When the sample is ready to be sheared, the pore water pressure measuring equipment should be again brought into the circuit as described in the initial part of 6.4.2.1 and valve Bl closed. The reading in gauge ( 30 ) should be recorded in first row of co1 2 of Shear Data Sheet No. 2 of Appendix B and is taken to be equivalent to a pore pressure in the soil sample equal to the back pressure. The proving ring should be suspended from the yoke and in the suspended position the pro- ving ring dial should be set to zero and the zero reading recorded in first row of co1 5 of Shear Data Sheet No. 2 of Appendix B. Using manual control of loading frame the loading ram should be then pushed into the cell but not allowed to touch the loading cap. The loading frame should be run at the selected deformation rate. During this operation the proving ring records the force arising from the cell pressure acting upon the area of the loading ram, aC A, and the friction mobilized between the ram and bush; this should be recorded in second row in co1 5 of Shear Data Sheet No. 2 of Appendix B. I&ectrical operation of the loading frame should then be
*This is valid if only the condition of failure is of interest; if, however, the complete stress path is required, this. time should equal the time to the first significant value to be plotted.
23

IS:272O(PartXII)-1981
stopped. With manual controls the loading ram should be pushed further into the cell gently bringing it in contact with the loading cap. The dial gauge for measuring axial deformation of the sample should now be aligned and set to zero ( see.Fig. 4 ). The sample is now ready to be subjected to additional axial stresses, that is, it is ready to be sheared. During the pro- cess of shearing, by a constant gradual adjustment of the screw control cylinder ( 29 ) the level of mercury in the left hand lintb of the U-tube of the null indicator shall be maintained at its initially set location.
6.5.1 Recording Data - During shear the three observations listed below should be recorded at regular intervals of axial deformation as read on the dial gauge and noted in co1 3 of Shear Data Sheet No. 2 of Appendix B corresponding to axial strain values of about 0.33 percent, 0.67 percent, 1 percent, 2 percent, 3 percent, 4 percent, etc, until failure or until 20 percent .of axial strain. Observations may also be made at other suitable values of axial strain:
4
b)
4 6.5.2
The reading on the proving ring dial in co1 5 of Shear Data Sheet No. 2 of Appendix B,
The reading on the pressure gauge ( 30 ) of pore water pressure in co1 2 of Shear Data Sheet No. 2 of Appendix B, and
Elapsed time in co1 1 of Shear Data Sheet No. 2 of Appendix B.
Dismantling ( see_ Fig. 1 ) _- Upon completion of the test, first close valve Al, thereby isolating the pore water pressure measuring system and thus eliminating any hazard of altering the water content of the sample during dismantling. Then shut off the loading frame and using the manual control on the loading frame remove all additional axial stress from the sample. Next shut off valve Ml/M2 and M3 and open valve WI to let the cell pressure reduce to about zero. Open temporarily air and oil vents and let oil spill over the top of the triaxial cell which can be wiped clean by a dust free rag. Close valve GI to isolate gauge and apply vacuum to ( I ); then open air vent and water will be forced up into water reservoir ( 7 ). Close valve C2 when there is just a little water left in the cell and shut off vacuum at ( I ). Remove top of triaxial cell. Wipe rubber mem- brane. Slip off rubber ‘0’ rings ( 17 ) and membrane ( 16 ) and remove loading cap ( 15 ) and top coarse porous stone ( 18 ) and recover sample. Peel off filter paper strips and discs and weigh the soil sample making sure that no part of the sample is lost. The post-shear weight of the sample, and the post-shear length and shape should be recorded in the Shear Data Sheet No. 2 of Appendix B. Water content data readings should be recorded in Shear Data Sheet No. 2 of Appendix B.
The triaxial cell should be cleaned with grit-free soap and water, the loading ram oiled, and the rubber membrane washed, dried and sprinkled with french chalk powder for storage until required for the next test.
24

IS : 2720 ( Part XII ) - 1981
6.5.3 Computation of Results - The entire computations for each triaxial test may be done on Shear Data Sheet No. 2 of Appendix B ( see alw Note ). At the end of the test co1 1 is filled with readings of elapsed time, co1 2 with gauge readings of pore water pressure, co1 3 with values of axial deformation in terms of dial gauge readings, and co1 5 with readings of proving ring dial. Calculations should prove as follows:
a)
b)
d
d)
4
By dividing axial deformation ( co1 3 ) by post-consolidation length fill up co1 4 for percentage axial strain.
Using calibration curve for the proving ring used, fill up co1 6 for load on proving ring.
By subtracting each reading of pore water pressure ( co1 2 ) from the initial reading of pore water pressure ( co1 2, row 1 ) obtain change in pore water pressure and note it in co1 7.
By subtracting the value of load on proving ring when the loading frame was operated without the loading ram touching the sample ( co1 6, row 2 ) from each value of load on proving ring ( co1 6 ) obtain respective values of axial load for co1 8.
By dividing post-consolidation area A, by ( 1 - z ) where E is the axial strain, obtain for each E the value of the area of the sam- ple AI at that strain.
f) By dividing each value of axial load ( co1 8 ) by corresponding value of area of the sample A, ( co1 9‘) obtain values of deviator stress ( o1 - a3 ), in co1 10.
s)
h)
3
k)
By subtracting from the value of initial effective cell pressure, that is, cell pressure minus back pressure, each value of change in pore water pressure ( co1 7 ), obtain values of minor principal effective stress & for co1 11.
By adding values of deviator stress ( co1 10 ) and minor principal effective stress ( co1 11 ) for each row in turn obtain values of major principal effective stress GI, for co1 12.
By adding value of minor principal effective stress ( co1 11 ) and major principal effective stress ( co1 12 ) for each row in turn obtain vaIues of sum of principal stresses G, + &, for co1 13.
By dividing each value of major principal effective stress ( co1 12) by corresponding value of minor principal effective stress ( co1 11 ) obtain values of principal effective stress ratio OI& for co1 14.
25

ZS:272O(PartXlI)-1931
m) By dividing each value of change in pore water pressure ( co1 7 ) by corresponding value of deviator stress ( co1 10 ) obtain values of A-factor for co1 15.
Node- For soils of low shear strength suitable corrections may be applied for the effects of membrane, filter strip and loading ram diction. Then corrections may not lx necessary for routine testing.
7. DRTERMINATION OF STRENGTH PARAMEIZRS
7.1 For determining strength parameters it is necessary to test at least three samples of the soil under investigation at three different effective cell pressures in the stress’ range of interest. The three soil samples should initially be as identM to each other as possible.
7.2 Stpgtb Parameters in Terms of Effective Stress - From respective Shear Data Sheets of Appendix B or from respective stress strain curves ( see. Fig. 5 ) identify the condition of failure ( see Note I under 7.2.1) of each of the three samples. Plot a Mohr circle for the state of stress at failure in, terms of et&ctive stresses for each of the three samples ( see Fig. 6 )_ Draw thebest common tangent to the three circles. The angle the tangent makes with the horizontal is the angle of shearing resistance in terms of effective stresses, d;‘. and the intercept the tangent makes on the y-axis is the cohesion intercept in terms of efhxtive stresses, c’ (see Fig. 6).
7.2.1 The strength parameters mathematically describe the best tangent, that is, the failure envelope as follows:
7tr = the shear stress at failure on the plane of tangency ( see Note 2 ), and
-&r = the normal effective stress on the plane of tangency.
NOTE 1 - What constitutes failure depends on the context in which results are to be used. Often used criteria are : ( a ) at peak deviator stress, ( b ) at peak principal effective stress ratio, ( c ) at 5 percent axial strain, and ( d ) at 20 percent axial strain.
NOTE 2 - For engineering purposes, the plane of tangency may be considered identical to the failure plane and c’ and 4’ may be considered as follows:
~=c’+Olttan+
where
nr = shear stress at failure on the failure plane, and
a~ = effective normal stress at failure on the failure plane.
26

Js:mo(PartW)-l9a
< - J”
- 1.0
4 -i-o -3.0 l*O
4: o*o
- 1.0
0 4 8 12 16 20
STRAIN f %
FIG. 5 STRESS-STRAIN CURVES
27


Is:272o(P8rmlI)-l981
7.3 Strength Parameters in Terms of Total Stresses - Follow the procedure as described in 7.2 with the difference that the Mohr circles are to be plotted in terms of total stresses. The major/minor principal total stress at failure is equal to the major/minor principal effective stress at f-e plus the pore water pressure at failure. The pore water pressure at failure is equal to the back pressure plus the change in pore water pressure until failure ( from co1 7 Appendix B Data Sheet No. 2). The angle the tangent makes with the horizontal is angle of shearing resistance in terms of total stresses as obtained from a m test, Qcu, and the intercept the tangent makes on the y-axis is the cohesion intercept in terms of total stresses as obtained from a CU test, ccu ( see Fig. 7 ).
7.3.1 #CU and cou are parameters that mathematically describe the failure envelope in terms of total stresses as follows:
7tf A ccu + et2 tan &YU
where
7tf = shear stress at failure on the plane of tangency, and
Ott = the total normal stress at failure on the plane of tangency ( see Note ).
NOTE - Plane of tangency obtained from failure envelope in terms of total stress is different from the plane obtained in terms of effective stresses; only rhe latter may be considered as being identical to the failure plane, in the soil sample.
7.4 Undraiued Strength Over Effective Confining Stress Ratio - This ratio can be obtained by obtaining for each sample the ratio of half the deviator stress at failure to the initial effective cell pressure. For normally consoli- dated soil this ratio is usually a constant.
7.5 c’ and 4’ may also be obtained by plotting ‘% i G3 at failure versus
1 +‘;;, 2
at failure for the samples tested, as shown in Fig. 8.
8. PRESENTATION OF RESULTS
8.1 Stress-Strain Results - The results of the test on each sample may be presented in the form of stress-strain curves as follows:
Fig. 5 ( a ) shows deviator stress versus strain
Fig. 5 ( b ) shows principal effective stress ratio versus strain
Fig. 5 ( c ) shows change in pore water pressure versus strain
Fig. 5 ( d ) shows A-factor versus strain.
29

1
FAKIJRE ENVELOPE ttf =CCU + a,+ tan 9cu
d kgf/cm2 TOTAL NORMAL STRESS
FIG. 7 STRSSS 0 DITION AT FAILURE IN TERMS OF TOTAL STRESS

( q l a, 1
3 (AT FAILURE)
sin # = tan Y; c’ d =S-$-
-- - FIG. 8 DETEXMINING c’ and +6’ USING F ( AT FAILURE ) versus 0q
( AT FAILURE ) PLOT
8.2 Failure Stress Results - The failure condition of all the three samples may be shown in terms of Mohr circles at failure both in terms of effective stresses, Fig. 6 and in terms of total stresses, Fig. 7.
SETTING UP
A-l. PROCEDURE
APPENDIX A ( Clause 5.2 )
SAMPLES OF COHESIONLESS SOIL
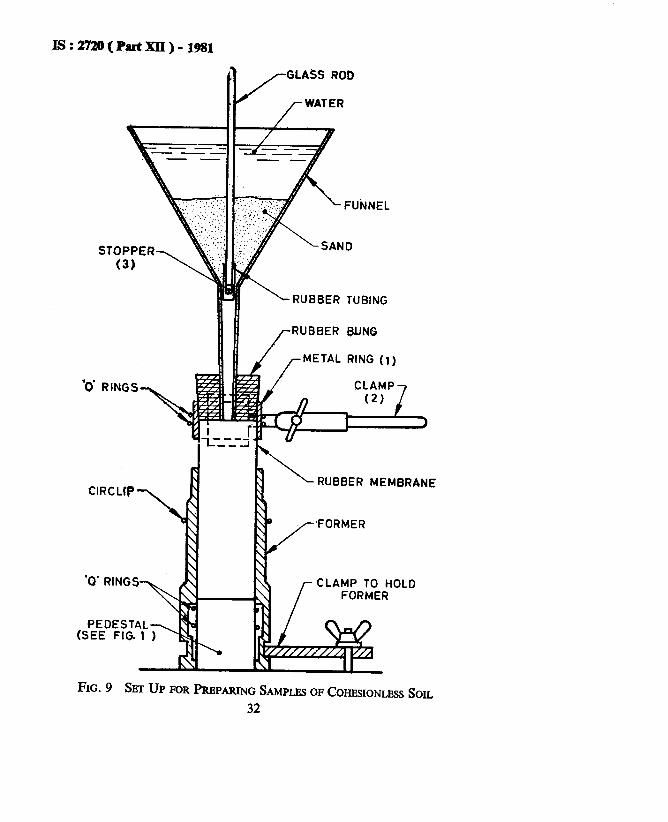
A-l.1 In order to make samples of cohesionless soil for use in a triaxial test it is necessary to use a former which will maintain the required speci- men shape until effective stress of sufficient magnitude to make the sample self-supporting can be applied. The former ( see Fig. 9) is a split mould of
31
‘0’ RINGS
/-
GLASS ROD
WATER
RUBBER TUBING
/-RUBBER BUNG
J /- METAL RING (1)
CLAMP 7
L RUBBER MEMBRANE
FIG.~ SETUP FORPRBPARINGSAMPLBS OF COHESIONLSSS SOIL
32

IS : 2720 ( Part XII ) - 1981
38.3 mm internal diameter which encloses the rubber membrane and is clamped to the base of the cell. The lower ‘0” rings are accommodated in a groove in the former.
A-l.2 After the equipment has been commissioned as described in 5.3 the j sample can be set up as given in A-1.2.1 to A-1.2.3 ( All valves in Fig. 1 are assumed to be closed ).
A-1.2.1 Coarse porous stone should be placed on the pedestal. The rubber membrane should be sealed to the pedestal by two ‘0’ rings and the split former clamped into position. The upper ring ( 1 ) in Fig. 9 should be placed inside the top of the membrane and held with the clamp ( 2 ) in Fig. 9 before placing the funnel and rubber bung in position. The mem- brane and funnel should be then filled with de-aired water; the pressure due to the head of water holds the rubber membrane against the inside of the former. Sufficient sand to fill the former should be weighed out and saturated by mixing in a beaker with enough water just to cover the sand. The mixture should be boiled to remove trapped air and then placed with a spoon in the funnel, the stopper f 3 ) being in position.
A-1.2.2 The sample should be built up by allowing a continuous rapid flow into the former. To increase density of sample the former may be subjected to vibration. The funnel and stopper should then be removed. The ‘0’ rings should be slipped off the metal ring and the membrane folded over on to the sides of the former. After the surface of the sample has been levelled a coarse porous stone should be placed on it and the loading cap should be lowered into position. Rubber ‘0’ rings should be used to seal the membrane to the cap.
A-1.2.3 A small negative pore water pressure should be applied to the sample to give it rigidity, by opening valves Bl and B2 ( see Fig. 1 ) and lowering the burette ( 10 ) ( see Fig. 1 ) to the floor. Consolidation under this effective stress occurs almost at once, and is indicated by the change in the water level in the burette. The split mould should then be removed and the height and diameter of the sample measured, the thickness of the membrane being deducted to obtain actual sample dimensions. The rest of the test proceeds as described in 6.2 to 6.4 except that in the dismantling process the sample again loses its shape; the entire sample is used to deter- mine the dry weight of the soil used.
33
Is: 272o(Partxll)-1981
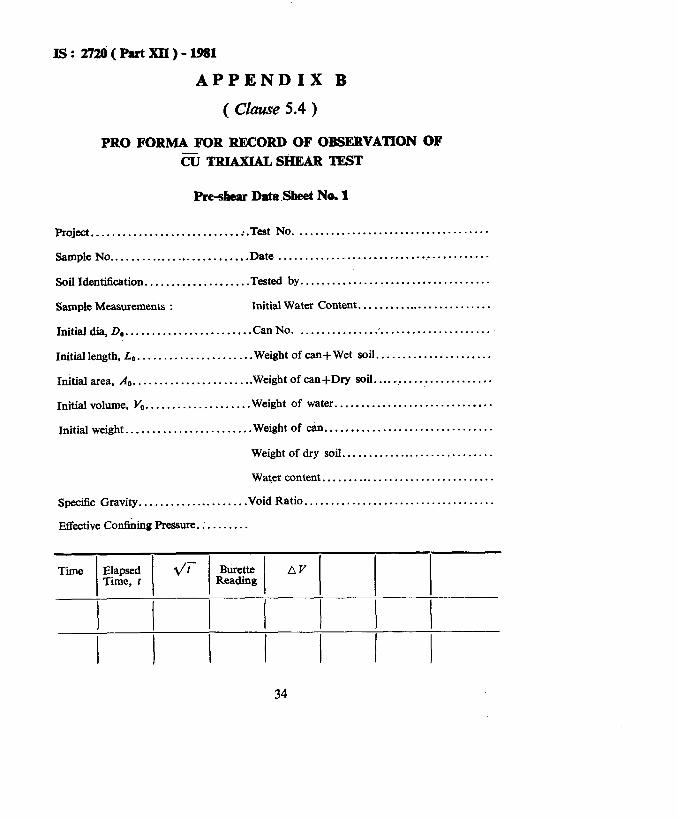
APPENDIX B
( Clause 5.4 )
PRO FORMA FOR RECORD OF OBSERVATION OF ~TRUXIALSHEARTEST
Project ........................... ..-. Test No. ....................................
Sample No .......................... .Date ............................ . ...........
Soil Identihcation. .................. .Tested by ....................................
Sample Measurements : Initial Water Content ..........................
Initial dia, D 0 ........................ CanNo. ....................................
Initial length, L 0 ...................... Weight of can+ Wet soil. .....................
Initial area, A 0 ....................... Weight of can+Dry soil.. .....................
Initial volume, V 0 .................... Weight of water ..............................
Initial weight ........................ Weight of can ................................
Weight of dry soil .............................
Water content .................................
Specifk Gravity. ................... .Void Ratio ....................................
Effective Co&ing Pressure ..........
34

IS:272O(PartXII)-1981
Post-Consolidation Water Content . . . . . . . . . . . . . . . . . . . . . . . . . . . . . . . .
Post-Consolidation Void Ratio. . . . . . . . . . . . . .cv. . . . . . . . . . . . . . . . . . . .
I Back Pressure
I
B-factor I I i Remarks:
35

As in the Original Standard, this Page is Intentionally Left Blank
IS : 2720 ( Part XII ) - 1981
s Triaxial Shear Test - Shear Data Sheet No. 2
Project............................................................................LoadingF~me NO. . . . . . . . . . . . . . . . . . I . . . . . . . . . . . . CellNo. . . . . . . . . . . . . . . . . . . . . . . Test No. . . . . . . . . . . . . . . . . . . . . .
Sample No. . . . . . . . . . . . . . . . . . . . . . . . . . . . . . . . . . . . . . . . . . . . . . . . . . . . . . . . . . . . . . . . . . . . . . . .Proving Ring No. . . . . . . . . . . . . . . . . . . . . . . . . . . . . . . . . . . . . . . . . . . . . . . . . . . . . . . . . . . . . . Date. . . . . . . . . . . . . . . . . . . . . . . . . .
Soil Identification. . . . . . . . . . . . . . . . . . . . . . . . . . . . . . . . . . . . . . . . . . . . . . . . . . . . . . . . . . . . . . . . . . Deformation Rate..............................................................Tested by....................
Post-consolidation Length, L ................................................. .Confining Pressure, UC ..................................... . ........................
Post-consolidation Dia, D ....................................................
Post-consolidation Area, A. .................................................. .Back Pressure. ................................................................... .Post-Shear Weight ...........
i- ELAPSED GAUGE DIAL STRAIN
TIME ” GAUGE %
hWING LOAD RING DIAL PR::ING
RING
(5) (6)
.XIAL AREA
AU
(7)
-
L
1 -
_-
_-
--
-_
OAD S A:LE
A, (8) (9)
1-Q
(10)
- 03
(11)
-
-_
-
-_
--
--
-_
--
--
=1
(12)
- - ISO3
(13)
- - (I
_
._
‘_
. -
-
Jo,
14)
-
0
( -
I-
--
_-
_-
_-
A :AC- TOR
(1) (2) (3) (4) :151
-
F
( ,-
--
_-
..-
_-
--
_-
--
(16)
-
_
_-
_-
_-
-I
-.
-‘.
-
(
.-
.-
_-
-_
-_
_-
:171
:
-
i
Post-Shear Water Content
Specimen Location
Can No.
Weight of Can+ Wet Soil
Weight of Can + Dry Soil
___-
____
Weight of Water
Weight of Can
--
Weight of Dry Soil
Water Content
--
--
--
--
--
--
--
Proving Ring Suspended
0
1
_ ;- -I
Proving Ring acted up by& Ar
0
--
_-
- --
~-
I
I i --
--
Post-Shear Length. .........................
Post-Shear Sample Shape ....................
37

As in the Original Standard, this Page is Intentionally Left Blank

( Conrinuedfrom page 2 )
Soil Testing Procedures and Equipment Subcommittee, BDC 23 : 3
Convener Reipresenting
DR ALAM SINGH univesrdty of Jodhpur, JOdhPF
Members
SHRI AMAR SINGH Ccn~~l33ding Research Institute ( CSIR ),
SHRI M. R. SONEIA ( Akernare ) COL ALTAR SINGH Ministry of Defencc
LT-CoL V. K. KANITKAR ( Akernare ) DEPTH DIRECTOR RESEARCH Ministry of Railways
( FE-II ), RDSO D~PWIY DIRECTOR RI?.~EARCH
( SM )-III, RDSO ( Alternate )Ministry of Irrigation DIRECX~R ( CSMRS )
DBPUTY DIRECXOR ( CSMRS ) ( Alternate ) DIRECXOR ( PWDRI )
DR B. L. DHAWAN ( AIrernute ) Public Works Department, Lucknow
PROP GOPAL RANJAN DR S. C. HANDA ( Akernare )
Univerdity of Roorkee, Roorkee
SHRI H. K. GUHA Geologists Syndicate Pvt Ltd, Cdcutta SHRI N. N. BHATTACHARAYA ( Alternate )
DR SHASHI K. GULHATI SHRI P. JAOANA~A RAO
Indian Institute of Technology, New Delhi Cent;raw ;;hq Research Institute ( CSIR ),
SHRI M. D. NAIR Associated Instruments Mfrs (I) Pvt Ltd, New Delhi
PROP T. S. NAGARAI ( Alternate ) SHRI N. M. PATEL Delhi College of Engineering, Delhi RBBARCH OPIJICER ( B & RRL ) Public Works Department, Government of Punjab,
Chandigarh
39

BUREAU OF INDtAN STANDARDS
Headquarters: Manak Bhavan, 9 Bahadur Shah Zafar Marg, NEW DELHI 110002
Telephones: 323 0131, 323 3375,323 9402
Fax : 91 11 3234062, 91 11 3239399,91 11 3239382
Telegrams : Manaksanstha
(Common to all Offices)
Central Laboratory: Telephone
Plot No. 20/9, Site IV, Sahibabad Industrial Area, Sahibabad 201010 8-77 00 32
Regional Offices:
Central : Manak Bhavan, 9 Bahadur Shah Zafar Marg, NEW DELHI 110002 32376 17
‘Eastern : l/14 CIT Scheme VII M, V.I.P. Road, Maniktola, CALCUTTA 700054 337 86 62
Northern : SC0 335336, Sector 34-A, CHANDIGARH 160022 60 38 43
Southern : C.I.T. Campus, IV Cross Road, CHENNAI 600113 235 23 15
twestern : Manakalaya, E9, Behind Marol Telephone Exchange, Andheri (East), 832 92 95
MUMBAI 400093
Branch Offices:
‘Pushpak’, Nurmohamed Shaikh Marg, Khanpur, AHMEDABAD 380001 550 13 48
$ Peenya Industrial Area, 1 st Stage, Bangalore-Tumkur Road, 839 49 55
BANGALORE 560058
Gangotri Complex, 5th Floor, Bhadbhada Road, T.T. Nagar, BHOPAL 462003 55 40 21
Plot No. 62-63, Unit VI, Ganga Nagar, BHUBANESHWAR 751001 40 36 27
Kalaikathir Buildings, 670 Avinashi Road, COIMBATORE 641037 21 01 41
Plot No. 43, Sector 16 A, Mathura Road, FARIDABAD 121001 8-28 88 01
Savitri Complex, 116 G.T. Road, GHAZIABAD 201001 8-71 19 96
53/5 Ward No. 29, R.G. Barua Road, 5th By-lane, GUWAHATI 781003 541137
5-8-56C, L.N. Gupta Marg, Nampally Station Road, HYDERABAD 500001 20 10 83
E-52, Chitaranjan Marg, C-Scheme, JAIPUR 302001 37 29 25
117/418 B, Sarvodaya Nagar, KANPUR 208005 21 68 76
Seth Bhawan, 2nd Floor, Behind Leela Cinema, Naval Kishore Road, 23 89 23
LUCKNOW 226001
NIT Building, Second Floor, Gokulpat Market, NAGPUR 440010 52 51 71
Patliputra Industrial Estate, PATNA 8000t3 26 23 05
Institution of Engineers (India) Building 1332 Shivaji Nagar, PUNE 411005 32 36 35
T.C. No. 14/1421, University PO. Palayam, THIRUVANANTHAPURAM 695034 621 17
‘Sales Office is at 5 Chowringhee Approach, P.O. Princep Street, 27 10 85 CALCUTTA 700072
tSales Office is at Novelty Chambers, Grant Road, MUMBAI 400007
*Sales Office is at ‘F’ Block, Unity Building, Narashimaraja Square,
BANGALORE 560002
309 65 28
222 39 71
Printed al Simco Printing Press, Delhi


![COMPARATIVE STUDIES OF CBR VALUE OF SOIL SAMPLE …[2] IS 2720 Part-5 “Metod of test for Soil-Determination of Liquid limit and Plastic limit”. [3] IS 2720 Part –8 “Method](https://static.fdocuments.in/doc/165x107/5e760ad3faec88301076bc03/comparative-studies-of-cbr-value-of-soil-sample-2-is-2720-part-5-aoemetod-of-test.jpg)


