Read Full Report - Houghton Mifflin Harcourt
41
Advisory Board: Michael Beck, President Beck Evaluation & Testing Associates, Inc. Keith Cruse, Former Managing Director Texas Assessment Program Joseph A. Fernandez, Former Chancellor New York City Public Schools A LONGITUDINAL ANALYSIS OF STATE MATHEMATICS SCORES FOR INDIANA SCHOOLS USING SAXON MATH Report Number 362 March 2009
Transcript of Read Full Report - Houghton Mifflin Harcourt
Advisory Board:
Michael Beck, PresidentBeck Evaluation & Testing Associates, Inc.
Keith Cruse, Former Managing DirectorTexas Assessment Program
Joseph A. Fernandez, Former ChancellorNew York City Public Schools
A LONGITUDINAL ANALYSIS OF STATE MATHEMATICS SCORES FOR INDIANA
SCHOOLS USINGSAXON MATH
Report Number 362 March 2009

1 Educational Research Institute of America
Contents
Project Background............................................................................................................. 2
Research Questions............................................................................................................. 3
Design of the Study............................................................................................................. 3
Instructional Approach under Study ................................................................................... 4
Description of the Research Sample ................................................................................... 5
Description of the ISTEP+.................................................................................................. 5
Data Analyses ..................................................................................................................... 7
Grade 3............................................................................................................................ 7 Pretest/Posttest Analyses of SAXON MATH Schools............................................... 7
Whole Group Pretest/Posttest Analyses.................................................................. 7 Socio-Economic Group Pretest/Posttest Analyses.................................................. 9 Pretest Score Group Pretest/Posttest Analyses ..................................................... 12
SAXON MATH Schools Compared to the State...................................................... 16 Grade 5.......................................................................................................................... 17
Pretest/Posttest Analyses of SAXON MATH Schools............................................. 17 Whole Group Pretest/Posttest Analyses................................................................ 17 Socio-Economic Group Pretest/Posttest Analyses................................................ 18 Pretest Score Group Pretest/Posttest Analyses ..................................................... 21
SAXON MATH Schools Compared to the State...................................................... 25
Conclusions....................................................................................................................... 26
References......................................................................................................................... 28
Appendices........................................................................................................................ 30
Appendix A................................................................................................................... 30 Demographic Characteristics of Schools Included in the Grade 3 Group ............ 30
Appendix B ................................................................................................................... 31 Demographic Characteristics of Schools Included in the Grade 5 Group ............ 31
Appendix C ................................................................................................................... 33 Indiana Academic Math Standards – Grade 3 ...................................................... 33
Appendix D................................................................................................................... 37 Indiana Academic Math Standards – Grade 5 ...................................................... 37

2 Educational Research Institute of America
A LONGITUDINAL ANALYSIS OF STATE MATHEMATICS SCORES FOR INDIANA SCHOOLS USING SAXON MATH This report describes a three year longitudinal study of the instructional effectiveness of SAXON MATH, a mathematics program designed for use in kindergarten through grade 12.
Project Background
We live in a mathematical world. Never before has the workplace demanded such complex levels of mathematical thinking and problem solving (National Council of Teachers of Mathematics, 2009). Clearly, those who understand and can do mathematics will have increased opportunities in the workplace. Mathematical competence can open doors that will allow for educational and career advancements. A lack of mathematical competence can close those doors.
Unfortunately, in terms of mathematical skills, the United States is quickly falling behind the rest of the developed world. A recent study comparing the math skills of students in industrialized nations found that U.S. students in grades 4 and 8 consistently performed below most of their peers around the world, a trend that continues into high school (Mullis, Martin, Gonzalez, & Chrostowski, 2004). And although the latest results from the National Assessment of Educational Progress (2007) showed improvements in the math performance of students in grades 4 and 8 nationally, upon closer examination, only fourteen of the fifty states showed improved scores at both grade levels. Seventeen states did not show improvements at either grade level. Further, low-income and minority students in the U.S. perform relatively poorly in math as early as kindergarten and first grade (Denton & West, 2002). By the third grade, the number of American students showing signs of math learning difficulties increases significantly (Ostad, 1998, 1997; Geary, Hoard, Byrd-Craven, & DeSoto, 2004). To address concerns that many students lack essential skills to be successful in mathematics-related careers, President Bush called for the creation of a National Mathematics Advisory Panel in April, 2006. This panel was charged with fostering “greater knowledge of and improved performance in mathematics among American students” (U.S. Department of Education, 2008). On March 13, 2008, the National Mathematics Advisory Panel submitted its final report. In the report, the Panel stressed how critical it is that students succeed in algebra, in part because doing so will make them much more likely to succeed in college and be prepared for better career opportunities in the global economy of the 21st century. The Panel also emphasized the importance of children having a strong base in mathematics. Research shows that a strong start can be a major contributor to preventing later difficulties in math learning. Efforts must begin in early childhood, with a particular focus on the foundational skills learned from kindergarten through third grade. Effective early math education can help students to:

3 Educational Research Institute of America
• Acquire the foundational knowledge and skills that they will need to be successful with algebra and other advanced math courses (National Association for the Education of Young Children and National Council of Teachers of Mathematics, 2002);
• Avoid retention in the early years by increasing math skills (Magnuson, Myers, Ruhm, & Waldfogel, 2003); and
• Develop positive attitudes toward learning math early on (Ma, 2000). There has never been a greater need to ensure that the math programs today’s young students are using are optimally supporting them in developing the mathematical skills and strategies required for success in high school, in college, and in the workplace. Because of the importance of determining the effectiveness of programs designed to support young children with mathematics instruction, Houghton Mifflin Harcourt contracted with the Educational Research Institute of America (ERIA) to study the effectiveness of the SAXON MATH program. This report presents the findings from that study.
Research Questions The following research questions guided the design of the study:
• Is SAXON MATH instructionally effective in improving students’ mathematical skills and strategy use over time?
• Do students whose math instruction is supported by SAXON MATH show improvements in their mathematical skills and strategy use that are above those shown by students using other math programs?
Design of the Study A quasi-experimental, pretest/posttest design was used for this study. Indiana schools using the SAXON MATH program at grades 3 and/or 5 during the 2004-2005, 2005-2006, and 2006-2007 school years were included in the study. Standard scores from the fall 2004 administration of the math portion of the Indiana Statewide Testing for Educational Progress-Plus (ISTEP+) were used as the pretest and standard scores from the fall 2007 administration of the math portion of the ISTEP+ were used as the posttest.
In order to identify Indiana SAXON MATH schools for inclusion in the study, Houghton Mifflin Harcourt provided researchers with a list of Indiana elementary schools that had purchased SAXON MATH. Researchers then telephoned the administrators at each of these schools to determine the year each one had started using SAXON MATH at grades 3 and 5 and for how long each one had continued to use the program at those same grade levels. Schools were included in the study if it could be verified that they had started using the program at grade 3 and/or grade 5 no later than the 2004-2005 academic year and had continued to do so through the 2006-2007 academic year or longer.
A total of 49 schools in Indiana were verified as having used SAXON MATH at grade 3 from the 2004-2005 academic year through the 2006-2007 academic year. A total of 61 Indiana schools were verified as having used SAXON MATH at grade 5 for the same three

4 Educational Research Institute of America
year period. The two lists of schools are similar but not identical. Some of the differences can be explained by the variability of grade levels offered at the schools (e.g. K-5 or K-6). Other differences are due to the fact that some schools did not adopt the program at all grade levels during the same academic year but instead adopted the program at one or two grade levels each year over several years until the program was implemented at all grade levels.
For each school, researchers downloaded the ISTEP+ mathematics data that is available to the public from the Indiana Department of Education (IDOE) Web site. Additional data was secured by contacting personnel in the IDOE Assessment Office. Ultimately, the average standard score in math and the percent of students passing the math portion of the ISTEP+ at grades 3 and 5 at each SAXON MATH school during the fall 2004 and fall 2007 administrations of the ISTEP+ were obtained.
The current study also provides comparisons of the performances of grades 3 and 5 students at Indiana SAXON MATH schools on the fall 2004 and fall 2007 administrations of the math portion of the ISTEP+ to the performances of all grades 3 and 5 students in the state. The average standard scores on the math portion of the ISTEP+ for all grade 3 and grade 5 Indiana students for the fall 2004 and fall 2007 administrations of the test were determined using data made available by the IDOE. The IDOE provides average scores for public and non-public schools separately. However, the SAXON MATH schools include both public and non-public schools. Therefore, the mean scores provided in the current report for all grade 3 and grade 5 students are average scores computed from the total list of public and non-public schools. In addition, it should be pointed out that the mean standard scores for all grade 3 and grade 5 Indiana students for the fall 2004 and fall 2007 administrations does include the SAXON MATH grade 3 and grade 5 students.
Instructional Approach under Study The description of SAXON MATH provided by the publisher states the following:
A well-articulated curriculum challenges students to learn increasingly more sophisticated mathematical ideas as they continue their studies. John Saxon had a similar philosophy in mind when in the early 1980s he developed his theory-based distributed approach to mathematics instruction, practice, and assessment. Utilizing this approach, the SAXON MATH K–12 program was created with a comprehensive approach to mathematics. Because smaller pieces of information are easier to teach and easier to learn, the SAXON MATH series was developed by breaking down complex concepts into related increments. The instruction, practice, and assessment of those increments were systematically distributed across each grade level. Practice is continual, and assessment is cumulative. The SAXON MATH approach differs from most programs in that it distributes instruction, practice, and assessment instead of massing these elements throughout the lessons and school year. In a massed approach, instruction, practice, and assessment of a skill or concept occur within a short period of time and are clustered within a single chapter or unit. In the SAXON MATH program, as students encounter new increments of instruction, they are also continually reviewing previously introduced math concepts. Frequent assessments of newer and older concepts are

5 Educational Research Institute of America
encountered throughout the lessons, ensuring that students truly integrate and retain critical math skills.
Description of the Research Sample
A total of 49 schools were verified as having used SAXON MATH at grade 3 from the 2004-2005 academic year through the 2006-2007 academic year. The grades enrolled at each school varied considerably across the 49 schools, although 59% of the schools enrolled students in grades K to 5 or K to 6. Table 1 provides a demographic summary of the schools included in the grade 3 group. The average enrollment for the schools was 416. The average percent of students enrolled in free and reduced lunch programs across the schools was 35%. The average percent of minority students was 7%.
Table 1 Means of Demographic Characteristics of Schools Included in the Grade 3 Group
Mean Student
Enrollment
Mean % of Students in Free/Reduced Lunch Programs
Mean % ofMinority Students
Mean % of Special Education Students
Mean % of Limited English Proficient
Students 416 35% 7% 16% 2%
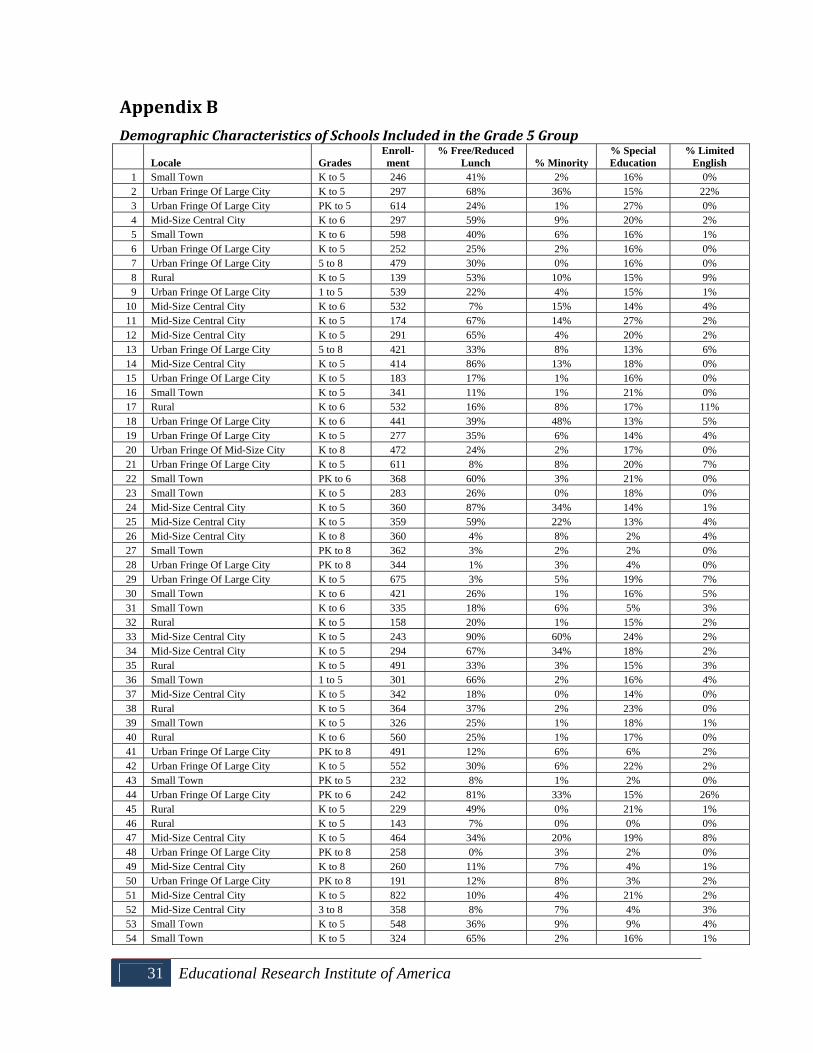
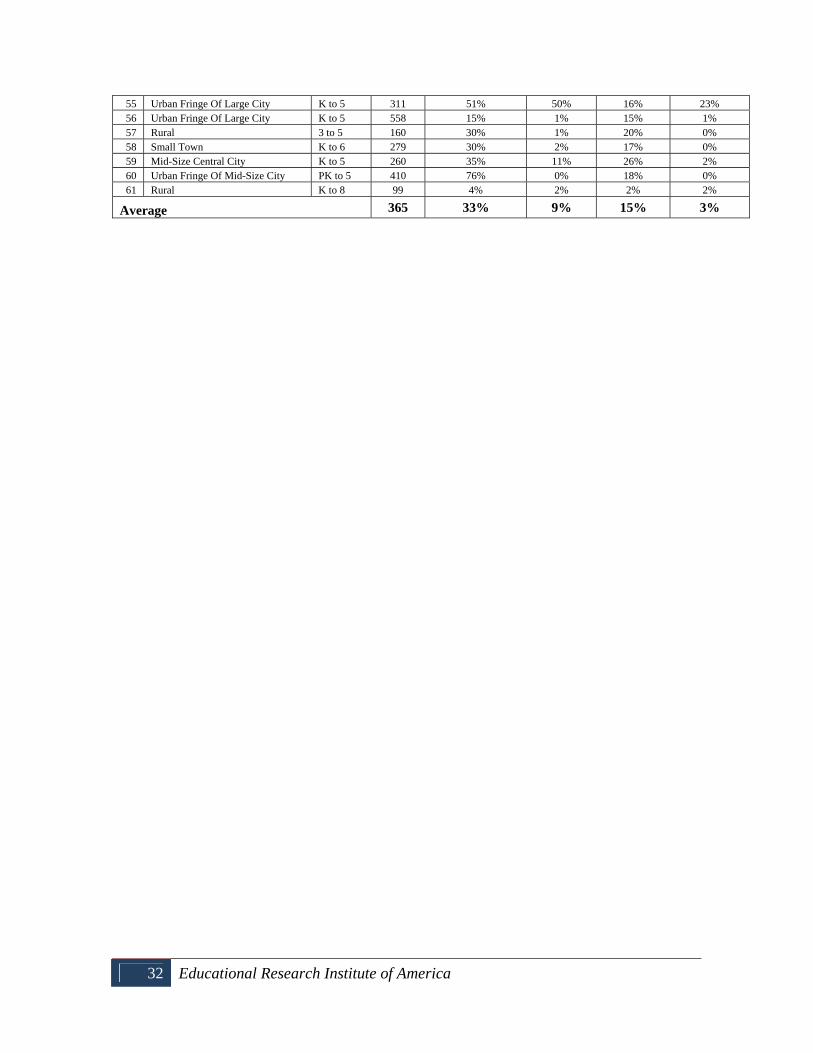
A total of 61 schools were verified as having used SAXON MATH at grade 5 from the 2004-2005 academic year through the 2006-2007 academic year. As for the grade 3 schools, the grades enrolled at each grade 5 school varied considerably across the 61 schools, although 67% of the schools enrolled students in grades K to 5 or K to 6. Table 2 provides a demographic summary of the schools included in the grade 5 group. The average enrollment for the schools was 365. The average percent of students enrolled in free and reduced lunch programs across the schools was 33%. The average percent of minority students was 9%.
Table 2 Means of Demographic Characteristics of Schools Included in the Grade 5 Group
Mean Student
Enrollment
Mean % of Students in Free/Reduced Lunch Programs
Mean % ofMinority Students
Mean % of Special Education Students
Mean % of Limited English Proficient
Students 365 33% 9% 15% 3%
(See Appendix A for demographic information for each grade 3 school and Appendix B for each grade 5 school included in the study.)
Description of the ISTEP+ The following explanation of the ISTEP+ was taken from the Indiana Department of Education Web site (Indiana Department of Education, 2009):
The Indiana Statewide Testing for Educational Progress-Plus (ISTEP+) measures what students know and are able to do at each grade level. Based on Indiana’s Academic Standards, ISTEP+ provides a learning check-up to make sure students are on track and signal whether they need extra help.

6 Educational Research Institute of America
At grades 3 and 5, Indiana’s Academic Standards for Mathematics are organized into six overarching topics: Number Sense, Computation, Algebra and Functions, Geometry, Measurement, and Problem Solving. At grade 5 there is an additional topic: Data Analysis and Probability. Table 3 provides sample grade 3 and grade 5 Indiana Academic Standards for Mathematics for each of the topics (Indiana Department of Education, 2008). (A complete set of Indiana’s Academic Standards for Mathematics in grade 3 can be found in Appendix C, and grade 5 can be found in Appendix D.)
Table 3 Samples from Indiana’s Academic Standards for Mathematics in Grades 3 and 5
Number Sense Grade 3 Sample 3.1.1 Count, read, and write whole numbers up to 1,000.
Grade 5 Sample 5.1.1 Convert between numbers in words and numbers in figures, for numbers up to millions and decimals to thousandths.
Computation
Grade 3 Sample 3.2.1 Add and subtract whole numbers up to 1,000 with or without regrouping, using relevant properties of the number system.
Grade 5 Sample 5.2.1 Solve problems involving multiplication and division of any whole numbers.
Algebra and Functions
Grade 3 Sample 3.3.1 Represent relationships of quantities in the form of a numeric expression or equation.
Grade 5 Sample 5.3.1 Use a variable to represent an unknown number. Geometry
Grade 3 Sample 3.4.1 Identify quadrilaterals as four-sided shapes.
Grade 5 Sample 5.4.1 Measure, identify, and draw angles, perpendicular and parallel lines, rectangles, triangles and circles by using appropriate tools (e.g. ruler, compass, protractor, appropriate technology and media tools).
Measurement Grade 3 Sample 3.5.1 Measure line segments to the nearest half-inch.
Grade 5 Sample 5.5.1 Understand and apply the formulas for the area of a triangle, parallelogram, and trapezoid.
Problem Solving
Grade 3 Sample 3.6.1 Analyze problems by identifying relationships, telling relevant from irrelevant information, sequencing and prioritizing information, and observing patterns.
Grade 5 Sample 5.7.1 Analyze problems by identifying relationships, telling relevant from irrelevant information, sequencing and prioritizing information, and observing patterns.
Data Analysis and Probability Grade 3 Sample No grade 3 standards in this category
Grade 5 Sample 5.6.1 Explain which types of display are appropriate for various sets of data.

7 Educational Research Institute of America
Data Analyses Two primary analyses were conducted at grade 3 and grade 5:
1. Analyses to determine whether the average standard scores on the math portion of the ISTEP+ increased significantly from the fall 2004 test administration to the fall 2007 test administration for Indiana SAXON MATH schools.
A Paired Comparison t-test was used to compare average standard scores on the math portion of the ISTEP+ from the fall 2004 test administration (pretest) to the fall 2007 test administration (posttest) for grade 3 and grade 5 students at Indiana SAXON MATH schools. In addition, the percentages of Indiana SAXON MATH schools reporting pass rates at grades 3 and 5 of less than 70%, from 70% to 89%, and 90% or higher from pretest to posttest were compared. A Paired Comparison t-test was also used to compare the grade 3 and grade 5 pretest to posttest gains of higher socio-economic Indiana SAXON MATH schools to the gains of the lower socio-economic schools, as well as to compare the grade 3 and grade 5 pretest to posttest gains of SAXON MATH schools that had lower average pretest scores to those that had higher average pretest scores.
2. Analyses allowing for comparisons of the fall 2004 and fall 2007 average standard scores on the ISTEP+ math test of SAXON MATH schools in Indiana to the Indiana state averages.
For several reasons, it would be inappropriate and misleading to conduct any statistical analyses comparing ISTEP+ math scores for all of the schools in Indiana to those schools using the SAXON MATH program. One concern, for example, is that the sample sizes are not comparable. Also, the SAXON MATH schools were not randomly assigned to the experimental group. They were a self-selected group in that they chose to adopt the SAXON MATH program. Therefore, descriptive statistics are provided as a way to compare grade 3 and grade 5 students at Indiana SAXON MATH schools with other grade 3 and grade 5 students throughout the state.
Grade 3
Pretest/Posttest Analyses of SAXON MATH Schools
Whole Group Pretest/Posttest Analyses Researchers at ERIA conducted a Paired Comparison t-test to determine if the differences in pretest and posttest scores of grade 3 students in Indiana SAXON MATH schools were statistically significant. The .05 level of significance was used as the level at which differences would be considered statistically significant. For the grade 3 analyses, 49 schools were included.

8 Educational Research Institute of America
In addition to the Paired Comparison t-test, effect-size analyses were computed for each of the comparisons. Cohen’s d statistic was used to determine the effect size. This statistic provides an indication of the strength of the effect of the treatment regardless of the statistical significance. Cohen’s d statistic is interpreted as follows:
.2 = small effect
.5 = medium effect
.8 = large effect
Table 4 presents the results of the t-test performed to determine if the difference in pretest and posttest standard scores at grade 3 was statistically significant. The average standard score on the pretest was 420.8, and the posttest the average standard score was 428.8, a difference that was statistically significant at the .0001 level. This level of significance indicates that such a difference would have occurred by chance less than once out of 10,000 repetitions. The effect size was medium.
Table 4 Results Comparing the ISTEP+ Math Standard Scores of Grade 3 Students at Indiana SAXON MATH Schools in Fall 2004 (Pretest) and Fall 2007 (Posttest)
Test
Number of
Schools Mean Score SD t-Test Significance Effect Size
Pretest 49 420.8 19.8 Posttest 49 428.8 18.1
4.548 <.0001 .51

9 Educational Research Institute of America
Figure 1 shows the percentages of Indiana SAXON MATH schools with fewer than 70%, with 70% to 89%, and with 90% or higher of their grade 3 students passing the math portion of the ISTEP+ in fall 2004 (pretest) and in fall 2007 (posttest). The figure shows a decrease in the percentage of schools with pass rates below 70% and increases in the percentage of schools with pass rates from 70% to 89% and 90% or higher.
Figure 1 Percentage of Indiana SAXON MATH Schools with Various Ranges of Percentages
of Grade 3 Students Passing the ISTEP+ Math in Fall 2004 (Pretest) and in Fall 2007 (Posttest)
SocioEconomic Group Pretest/Posttest Analyses A Paired Comparison t-test was used to compare the pretest and posttest scores of the grade 3 Indiana SAXON MATH schools categorized as being of higher and lower socio-economic status (SES). The percentage of students receiving free and reduced lunch was used as the indicator of SES for this comparison. Schools were ranked from highest to lowest according to the percentage of students receiving free and reduced lunch at each school. That list was then divided in half with 25 schools in the lower free/reduced lunch group and 24 schools in the higher free/reduced lunch group. The lower free/reduced lunch schools were considered the higher socio-economic schools, and the higher free/reduced lunch schools were considered the lower socio-economic schools. The .05 level of significance was used as the level at which increases would be considered statistically significant.

10 Educational Research Institute of America
Table 5 presents the results of the t-test performed to determine if the difference between pretest and posttest standard scores for the lower and higher SES schools at grade 3 was statistically significant. For the higher SES schools, the average standard score on the pretest was 418.9, and the posttest was 426.6. For the lower SES schools, the average standard score on the pretest was 422.7, and the posttest was 431.0. Both differences were statistically significant at the .004 level. This level of significance indicates that such a difference would have occurred by chance less than four out of 1,000 repetitions. The effect size for both groups was small.
Table 5 Results Comparing the ISTEP+ Mathematics Standard Scores of Grade 3 Students at
Indiana SAXON MATH Schools in Fall 2004 (Pretest) and in Fall 2007 (Posttest) For High and Low SES Schools
Test
Number of
Schools Mean Score SD t-Test Significance Effect Size
Higher Socio Economic Schools Pretest 25 418.9 17.4 Posttest 25 426.6 16.9
3.146 <.004 .45
Lower Socio Economic Schools Pretest 24 422.7 22.1 Posttest 24 431.0 19.5
3.220 <.004 .40
11 Educational Research Institute of America
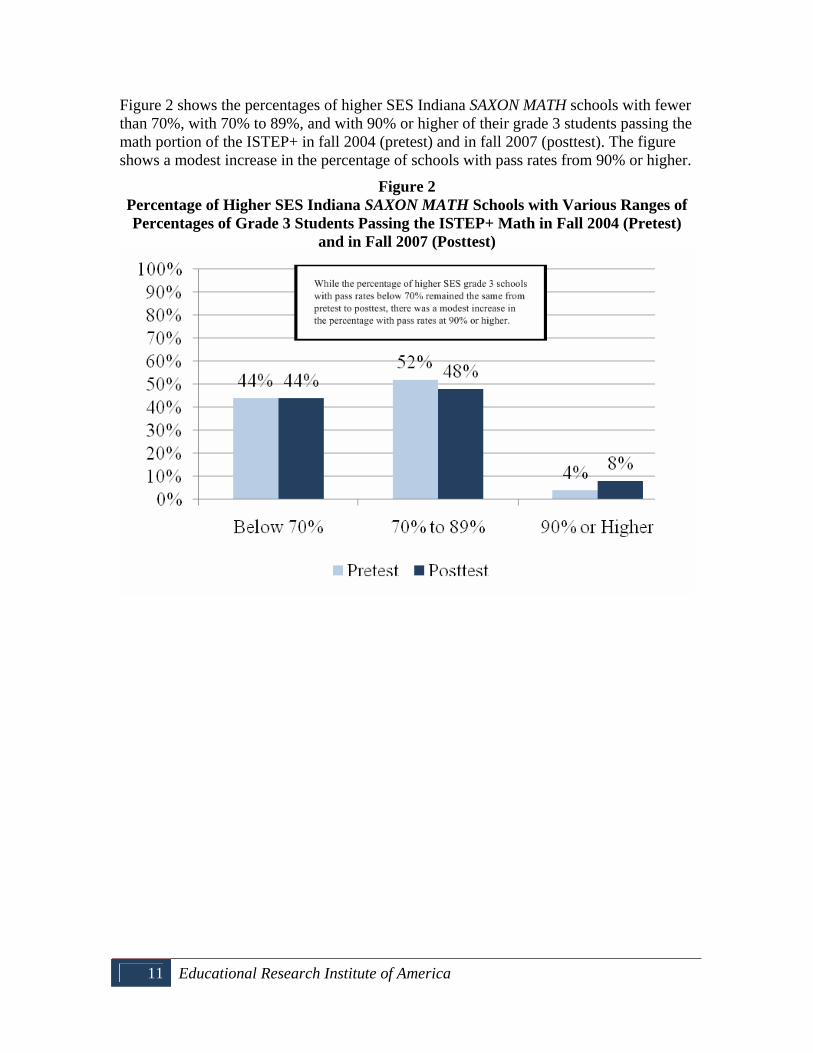
Figure 2 shows the percentages of higher SES Indiana SAXON MATH schools with fewer than 70%, with 70% to 89%, and with 90% or higher of their grade 3 students passing the math portion of the ISTEP+ in fall 2004 (pretest) and in fall 2007 (posttest). The figure shows a modest increase in the percentage of schools with pass rates from 90% or higher.
Figure 2 Percentage of Higher SES Indiana SAXON MATH Schools with Various Ranges of Percentages of Grade 3 Students Passing the ISTEP+ Math in Fall 2004 (Pretest)
and in Fall 2007 (Posttest)

12 Educational Research Institute of America
Figure 3 shows the percentages of lower SES Indiana SAXON MATH schools with fewer than 70%, with 70% to 89%, and with 90% or higher of their grade 3 students passing the math portion of the ISTEP+ in fall 2004 (pretest) and in fall 2007 (posttest). The results are very different for the lower SES schools than for the higher SES schools. For the lower SES schools, the percentage of schools with pass rates below 70% dropped considerably from pretest to posttest while the percentage of schools with pass rates from 70% to 89% and 90% and higher increased.
Figure 3 Percentage of Lower SES Indiana SAXON MATH Schools with Various Ranges of Percentages of Grade 3 Students Passing the ISTEP+ Math in Fall 2004 (Pretest)
and in Fall 2007 (Posttest)
Pretest Score Group Pretest/Posttest Analyses The grade 3 schools were divided into two approximately equal groups based on their pretest scores. The lower pretest group included 25 schools and the higher pretest group included 24 schools. Paired Comparison t-tests were conducted to determine if both groups made significant pretest to posttest gains.

13 Educational Research Institute of America
Table 6 presents the results of the t-test performed to determine if the difference between pretest and posttest standard scores for lower and higher pretest scoring schools at grade 3 was statistically significant. The average standard score for the lower scoring group increased from 406.0 to 419.6. The difference for the lower scoring pretest group was statistically significant at the .0001 level, indicating a change that would have occurred by chance less than once out of 10,000 repetitions. The effect size was large.
The average standard score for the higher scoring group increased from 436.1 to 438.4. The difference for the higher scoring pretest group was not statistically significant. The lack of statistical significance was most likely due to the fact that these schools were already high-achieving math schools at the time of the pretest and simply maintained their average scores, with slight increases, three years later at the time of the posttest.
Table 6 Results Comparing the ISTEP+ Math Standard Scores of Grade 3 Students at
Indiana SAXON MATH Schools in Fall 2004 (Pretest) and in Fall 2007 (Posttest) For Lower and Higher Scoring Pretest Groups
Test
Number of
Students Mean Score SD t-test Significance Effect Size
Lower Scoring Pretest Schools Pretest 25 406.0 10.0 Posttest 25 419.6 12.9
5.121 <.0001 1.17
Higher Scoring Pretest Schools Pretest 24 436.1 15.0 Posttest 24 438.4 18.0
1.346 Non-Significant .13

14 Educational Research Institute of America
Figure 4 shows the percentages of Indiana SAXON MATH schools in the lower scoring pretest group with fewer than 70%, with 70% to 89%, and with 90% or higher of their grade 3 students passing the math portion of the ISTEP+ in fall 2004 (pretest) and in fall 2007 (posttest). The figure shows a large decrease in the percentage of schools with pass rates below 70% and a large increase in the passes rates from 70% to 89%. The percent of schools with pass rates above 90% went from 0 to 4%.
Figure 4
Percentage of Indiana SAXON MATH Schools in the Lower Scoring Pretest Group with Various Ranges of Percentages of Grade 3 Students Passing the ISTEP+ Math
in Fall 2004 (Pretest) and in Fall 2007 (Posttest)

15 Educational Research Institute of America
Figure 5 shows the percentages of Indiana SAXON MATH schools in the higher scoring pretest group with fewer than 70%, with 70% to 89%, and with 90% or higher of their grade 3 students passing the math portion of the ISTEP+ in fall 2004 (pretest) and in fall 2007 (posttest). These schools were already scoring at high levels at the time of the pretest and, for the most part, maintained high performance levels at the time of the posttest.
Figure 5 Percentage of Indiana SAXON MATH Schools in the Higher Scoring Pretest Group with Various Ranges of Percentages of Grade 3 Students Passing the ISTEP+ Math
in Fall 2004 (Pretest) and in Fall 2007 (Posttest)
16 Educational Research Institute of America
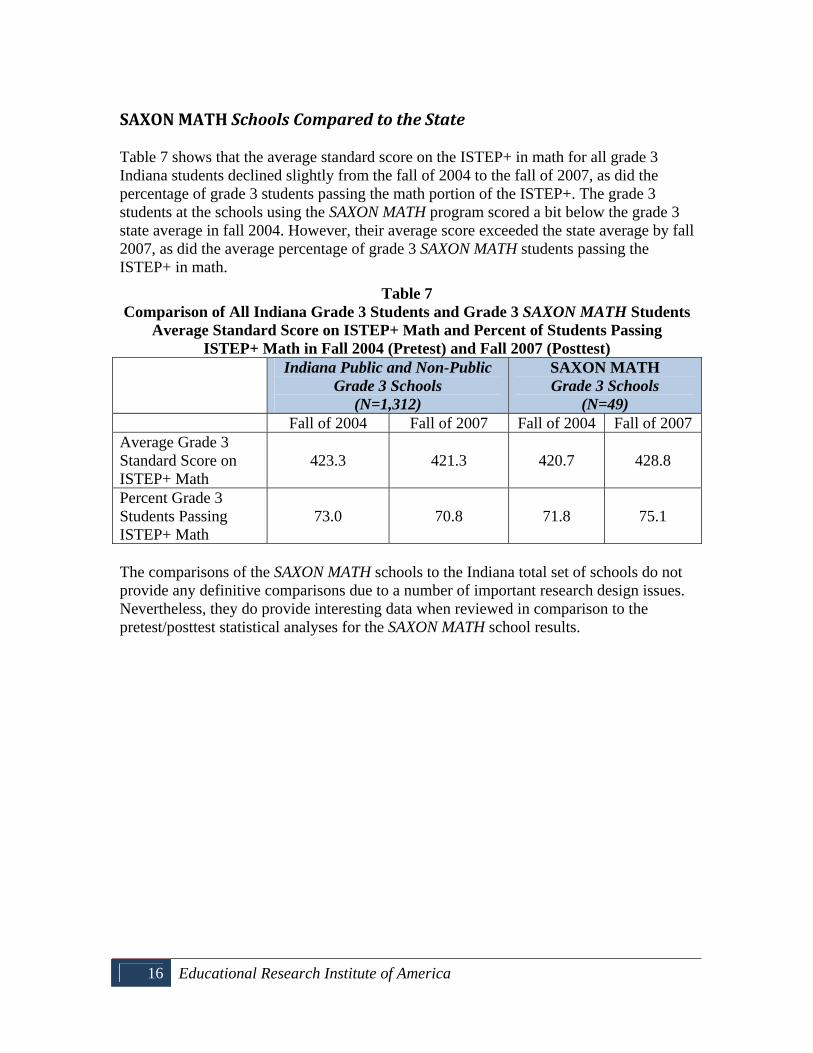
SAXON MATH Schools Compared to the State Table 7 shows that the average standard score on the ISTEP+ in math for all grade 3 Indiana students declined slightly from the fall of 2004 to the fall of 2007, as did the percentage of grade 3 students passing the math portion of the ISTEP+. The grade 3 students at the schools using the SAXON MATH program scored a bit below the grade 3 state average in fall 2004. However, their average score exceeded the state average by fall 2007, as did the average percentage of grade 3 SAXON MATH students passing the ISTEP+ in math.
Table 7 Comparison of All Indiana Grade 3 Students and Grade 3 SAXON MATH Students
Average Standard Score on ISTEP+ Math and Percent of Students Passing ISTEP+ Math in Fall 2004 (Pretest) and Fall 2007 (Posttest)
Indiana Public and Non-Public Grade 3 Schools
(N=1,312)
SAXON MATH Grade 3 Schools
(N=49) Fall of 2004 Fall of 2007 Fall of 2004 Fall of 2007 Average Grade 3 Standard Score on ISTEP+ Math
423.3 421.3 420.7 428.8
Percent Grade 3 Students Passing ISTEP+ Math
73.0 70.8 71.8 75.1
The comparisons of the SAXON MATH schools to the Indiana total set of schools do not provide any definitive comparisons due to a number of important research design issues. Nevertheless, they do provide interesting data when reviewed in comparison to the pretest/posttest statistical analyses for the SAXON MATH school results.

17 Educational Research Institute of America
Grade 5
Pretest/Posttest Analyses of SAXON MATH Schools
Whole Group Pretest/Posttest Analyses Researchers at ERIA conducted a Paired Comparison t-test to determine if the differences in pretest and posttest scores of grade 5 students in Indiana SAXON MATH schools were statistically significant. The .05 level of significance was used as the level at which differences would be considered statistically significant. For the grade 5 analyses, 61 schools were included.
In addition to the Paired Comparison t-test, effect-size analyses were computed for each of the comparisons. Cohen’s d statistic was used to determine the effect size. This statistic provides an indication of the strength of the effect of the treatment regardless of the statistical significance. Cohen’s d statistic is interpreted as follows:
.2 = small effect
.5 = medium effect
.8 = large effect
Table 8 presents the results of the t-test performed to determine if the difference in pretest and posttest standard scores at grade 5 was statistically significant. The average standard score on the pretest was 466.0, and for the posttest, the average standard score was 478.7, a difference that was statistically significant at the .0001 level. This level of significance indicates that such a difference would have occurred by chance less than once out of 10,000 repetitions. The effect size was medium.
Table 8
Results Comparing the ISTEP+ Math Standard Scores of Grade 5 Students at Indiana SAXON MATH Schools in Fall 2004 (Pretest) and Fall 2007 (Posttest)
Test
Number of
Schools Mean Score SD t-Test Significance Effect Size
Pretest 61 466.0 23.6 Posttest 61 478.7 20.0
4.878 <.0001 .58

18 Educational Research Institute of America
Figure 6 shows the percentages of Indiana SAXON MATH schools with fewer than 70%, with 70% to 89%, and with 90% or higher of their grade 5 students passing the math portion of the ISTEP+ in fall 2004 (pretest) and in fall 2007 (posttest). The figure shows a large decrease in the percentage of schools with pass rates below 70% and increases in the percentage of schools with pass rates from 70% to 89% and 90% or higher.
Figure 6 Percentage of Indiana SAXON MATH Schools with Various Ranges of Percentages
of Grade 5 Students Passing the ISTEP+ Math in Fall 2004 (Pretest) and in Fall 2007 (Posttest)
SocioEconomic Group Pretest/Posttest Analyses A Paired Comparison t-test was used to compare the pretest and posttest scores of the grade 5 Indiana SAXON MATH schools categorized as being of higher and lower socio-economic status (SES). The percentage of students receiving free and reduced lunch was used as the indicator of socio-economic status for this comparison. Schools were ranked from highest to lowest according to the percentage of students receiving free and reduced lunch at each school. That list was then divided in half with 30 schools in the lower free/reduced lunch group and 31 schools in the higher free/reduced lunch group. The lower free/reduced lunch schools were considered the higher socio-economic schools and the higher free/reduced lunch schools were considered the lower socio-economic schools. The .05 level of significance was used as the level at which increases would be considered statistically significant.

19 Educational Research Institute of America
Table 9 presents the results of the t-test performed to determine if the difference between pretest and posttest standard scores for the lower and higher socio-economic status schools at grade 5 was statistically significant. For the higher SES schools, the average standard score on the pretest was 477.9, and on the posttest was 488.2, a difference that was significant at the .009 level. This level of significance indicates that such a difference would have occurred by chance less than nine out of 1,000 repetitions. For the lower SES schools, the average standard score on the pretest was 465.6, and on the posttest was 468.9, a difference that was statistically significant at the .0001 level. This level of significance indicates that such a difference would have occurred by chance less than once out of 10,000 repetitions. The effect size was medium for the higher SES group and large for the lower SES group.
Table 9 Results Comparing the ISTEP+ Mathematics Standard Scores of Grade 5 Students at
Indiana SAXON MATH Schools in Fall 2004 (Pretest) and in Fall 2007 (Posttest) For High and Low SES Schools
Test
Number of
Schools Mean Score SD t-Test Significance Effect Size
Higher Socio Economic Schools Pretest 31 477.9 20.8 Posttest 31 488.2 17.7
2.814 <.009 . 53
Lower Socio Economic Schools Pretest 30 465.6 19.7 Posttest 30 468.9 17.6
4.084 <.0001 .82

20 Educational Research Institute of America
Figure 7 shows the percentages of higher SES Indiana SAXON MATH schools with fewer than 70%, with 70% to 89%, and with 90% or higher of their grade 5 students passing the math portion of the ISTEP+ in fall 2004 (pretest) and in fall 2007 (posttest). The figure shows a decrease in the percentage of schools with grade 5 pass rates of below 70% from pretest to posttest and increases in the percentage of schools with pass rates from 70% to 89% and 90% or higher.
Figure 7 Percentage of Higher SES Indiana SAXON MATH Schools with Various Ranges of Percentages of Grade 5 Students Passing the ISTEP+ Math in Fall 2004 (Pretest)
and in Fall 2007 (Posttest)
21 Educational Research Institute of America
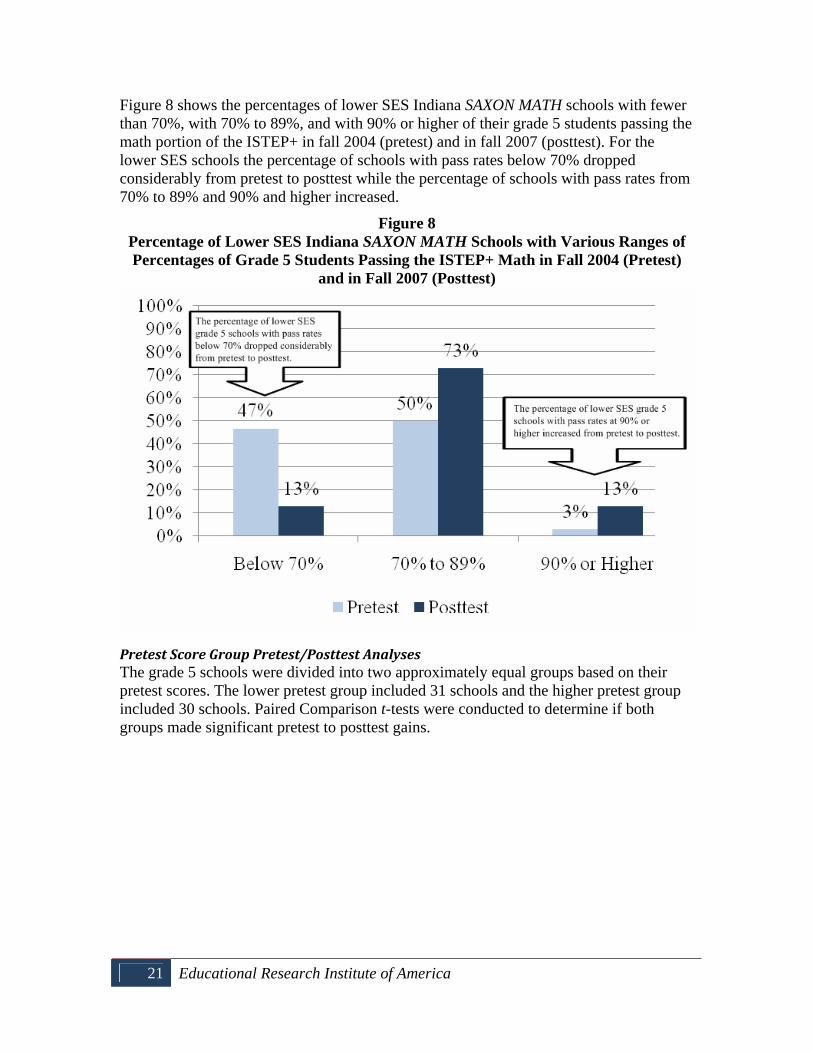
Figure 8 shows the percentages of lower SES Indiana SAXON MATH schools with fewer than 70%, with 70% to 89%, and with 90% or higher of their grade 5 students passing the math portion of the ISTEP+ in fall 2004 (pretest) and in fall 2007 (posttest). For the lower SES schools the percentage of schools with pass rates below 70% dropped considerably from pretest to posttest while the percentage of schools with pass rates from 70% to 89% and 90% and higher increased.
Figure 8 Percentage of Lower SES Indiana SAXON MATH Schools with Various Ranges of Percentages of Grade 5 Students Passing the ISTEP+ Math in Fall 2004 (Pretest)
and in Fall 2007 (Posttest)
Pretest Score Group Pretest/Posttest Analyses The grade 5 schools were divided into two approximately equal groups based on their pretest scores. The lower pretest group included 31 schools and the higher pretest group included 30 schools. Paired Comparison t-tests were conducted to determine if both groups made significant pretest to posttest gains.

22 Educational Research Institute of America
Table 10 presents the results of the t-test performed to determine if the difference between pretest and posttest standard scores for lower and higher pretest scoring schools at grade 5 was statistically significant. The average standard score for the lower scoring group increased from 448.0 to 470.7. The difference for the lower scoring pretest group was statistically significant at the .0001 level, indicating a change that would have occurred by chance less than once out of 10,000 repetitions. The effect size was large.
The average standard score for the higher scoring group increased from 484.4 to 487.0. The difference for the higher scoring pretest group was not statistically significant. The lack of statistical significance was most likely due to the fact that these schools were already high-achieving math schools at the time of the pretest and simply maintained their average scores, with slight increases, three years later at the time of the posttest.
Table 10 Results Comparing the ISTEP+ Math Standard Scores of Grade 5 Students at
Indiana SAXON MATH Schools in Fall 2004 (Pretest) and in Fall 2007 (Posttest) For Lower and Higher Scoring Pretest Groups
Test
Number of
Schools Mean Score SD t-Test Significance Effect Size
Lower Scoring Pretest Schools Pretest 31 448.0 15.8 Posttest 31 470.7 20.7
5.680 <.0001 1.2
Higher Scoring Pretest Schools Pretest 30 484.4 14.0 Posttest 30 487.0 15.6
1.170 Non-Significant .17

23 Educational Research Institute of America
Figure 9 shows the percentages of Indiana SAXON MATH schools in the lower scoring pretest group with fewer than 70%, with 70% to 89%, and with 90% or higher of their grade 3 students passing the math portion of the ISTEP+ in fall 2004 (pretest) and in fall 2007 (posttest). The figure shows a large decrease in the percentage of schools with pass rates below 70% and a large increase in the passes rates from 70% to 89%. The percent of schools with pass rates above 90% went from 3 to 13%.
Figure 9 Percentage of Indiana SAXON MATH Schools in the Lower Scoring Pretest Group with Various Ranges of Percentages of Grade 5 Students Passing the ISTEP+ Math
in Fall 2004 (Pretest) and in Fall 2007 (Posttest)

24 Educational Research Institute of America
Figure 10 shows the percentages of Indiana SAXON MATH schools in the higher scoring pretest group with fewer than 70%, with 70% to 89%, and with 90% or higher of their grade 5 students passing the math portion of the ISTEP+ in fall 2004 (pretest) and in fall 2007 (posttest). These schools were already scoring at high levels at the time of the pretest and, for the most part, maintained high performance levels at the time of the posttest.
Figure 10 Percentage of Indiana SAXON MATH Schools in the Higher Scoring Pretest Group with Various Ranges of Percentages of Grade 5 Students Passing the ISTEP+ Math
in Fall 2004 (Pretest) and in Fall 2007 (Posttest)
25 Educational Research Institute of America
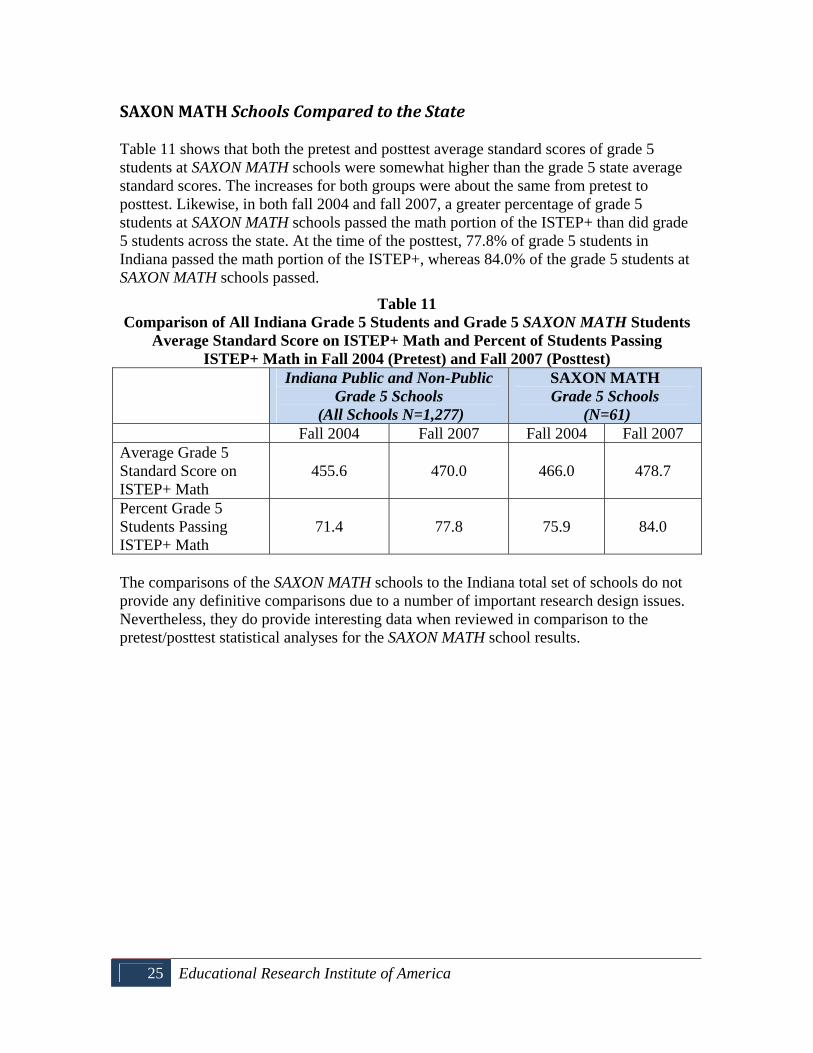
SAXON MATH Schools Compared to the State Table 11 shows that both the pretest and posttest average standard scores of grade 5 students at SAXON MATH schools were somewhat higher than the grade 5 state average standard scores. The increases for both groups were about the same from pretest to posttest. Likewise, in both fall 2004 and fall 2007, a greater percentage of grade 5 students at SAXON MATH schools passed the math portion of the ISTEP+ than did grade 5 students across the state. At the time of the posttest, 77.8% of grade 5 students in Indiana passed the math portion of the ISTEP+, whereas 84.0% of the grade 5 students at SAXON MATH schools passed.
Table 11 Comparison of All Indiana Grade 5 Students and Grade 5 SAXON MATH Students
Average Standard Score on ISTEP+ Math and Percent of Students Passing ISTEP+ Math in Fall 2004 (Pretest) and Fall 2007 (Posttest)
Indiana Public and Non-Public Grade 5 Schools
(All Schools N=1,277)
SAXON MATH Grade 5 Schools
(N=61) Fall 2004 Fall 2007 Fall 2004 Fall 2007 Average Grade 5 Standard Score on ISTEP+ Math
455.6 470.0 466.0 478.7
Percent Grade 5 Students Passing ISTEP+ Math
71.4 77.8 75.9 84.0
The comparisons of the SAXON MATH schools to the Indiana total set of schools do not provide any definitive comparisons due to a number of important research design issues. Nevertheless, they do provide interesting data when reviewed in comparison to the pretest/posttest statistical analyses for the SAXON MATH school results.

26 Educational Research Institute of America
Conclusions
This study sought to determine the effect of the SAXON MATH program on students’ math skills and strategy use.
When comparing the pretest to posttest gains made by grade 3 and grade 5 students at Indiana SAXON MATH schools, gains were statistically significant at both grade levels. In addition, significant gains were made for both the lower and higher SES SAXON MATH schools at both grades 3 and 5. Grade 3 and grade 5 students at SAXON MATH schools with lower pretest scores made significant gains from pretest to posttest. However, at the SAXON MATH schools with higher pretest scores, neither grade level made significant pretest to posttest gains. (This was most likely because their pretest scores were already high.) A summary of the results is provided in Table 12 below. The table indicates whether the gains were significant and provides the effect size of each significant gain.
Table 12
Summary of the Pretest/Posttest Score Analyses Conducted to Determine if Significant Gains were Made on the ISTEP+ Math
for Grade 3 and Grade 5 Students at Indiana SAXON MATH Schools Grade 3 Grade 5
Group Gain Statistically
Significant? Effect Size Gain Statistically
Significant? Effect Size All SAXON MATH Schools Yes Medium Yes Medium Higher SES SAXON MATH Schools Yes Small Yes Medium
Lower SES SAXON MATH Schools Yes Small Yes Large
Higher Pretest Group SAXON MATH Schools No -- No --
Lower Pretest Group SAXON MATH Schools Yes Large Yes Large

27 Educational Research Institute of America
Table 13 summarizes the increases and decreases from pretest to posttest in the percentages of Indiana SAXON MATH schools with fewer than 70%, with 70% to 89%, and with 90% or higher of their grade 3 and grade 5 students passing the math portion of the ISTEP+.
Table 13 Summary of Changes from Pretest to Posttest of Percentages of
Grade 3 and Grade 5 SAXON MATH Students Passing the Math Portion of the ISTEP+
Student Sample and Grade Level Below 70%
70% to 89% 90% or Higher
All SAXON MATH Schools Grade 3 -10% +6% +4% Grade 5 -26% +15% +12% Higher SES SAXON MATH Schools Grade 3 -- -4% +4% Grade 5 -19% +7% +13% Lower SES SAXON MATH Schools Grade 3 -21% +17% +5% Grade 5 -34% +23% +10% Higher Pretest Group SAXON MATH Schools Grade 3 +9% -12% +4% Grade 5 -10% -4% +14% Lower Pretest Group SAXON MATH Schools Grade 3 -28% +24% +4% Grade 5 -42% +32% +10%
This study sought to determine if SAXON MATH is instructionally effective. Based on the results of this study, instruction based on SAXON MATH significantly increases grade 3 and grade 5 students’ knowledge and understanding of mathematics over a three year period in Indiana schools using the SAXON MATH program.
28 Educational Research Institute of America
References Denton, K., & West, J. (2002). Children's reading and mathematics achievement in
kindergarten and first grade. Washington, D.C.: National Center for Education Statistics.
Geary, D. C., Hoard, M.K., Byrd-Craven, J., & DeSoto, M.C. (2004). Strategy choices in
simple and complex addition: Contributions of working memory and counting knowledge for children with mathematical disability. Experimental Child Psychology, 88, 121 - 151.
Indiana Department of Education. (2009). ISTEP+ InfoCenter. Retrieved February 11,
2009 from the Indiana Department of Education Web site: http://www.doe.in.gov/istep/
Indiana Department of Education. (2008). Indiana’s academic standards for mathematics
in grade 3 and grade 5. Retrieved February 11, 2009, from the Indiana Department of Education Web site: http://dc.doe.in.gov/Standards/AcademicStandards/StandardSearch.aspx
Ma, X. (2000). A longitudinal assessment of antecedent course work in mathematics and
subsequent mathematical attainment. Journal of Educational Research, 94, 16 - 28.
Magnuson, K., Myers, M., Ruhm, C., & Waldfogel, J. (2003). Inequality in preschool
education and school readiness. New York, NY: Columbia University Press. Mullis, I.V.S., Martin, M.O., Gonzalez E.J., & Chrostowki, S.J. (2004). TIMSS 2003
International mathematics report: Findings from IEA’s Trends in International Mathematics and Science study at the fourth and eighth grades. Chestnut Hill, MA: Boston College, Center for the Study of Testing, Evaluation, and Educational Policy.
National Assessment of Educational Progress. (2007). The nation’s report card:
Mathematics 2007. Retrieved February 11, 2009, from the National Assessment of Educational Progress Web site: http://nces.ed.gov/nationsreportcard/pubs/main2007/2007494.asp
National Association for the Education of Young Children and National Council of
Teachers of Mathematics. (2002). Position statement. Early childhood mathematics: Promoting good beginnings. Retrieved February 11, 2009, from the National Association for the Education of Young Children Web site: http://www.naeyc.org/about/positions/psmath.asp

29 Educational Research Institute of America
National Council of Teachers of Mathematics. (2009). Principals and standards for school mathematics. Retrieved February 11, 2009, from the National Council of Teachers of Mathematics Web site: http://standards.nctm.org/document/chapter1/index.htm
Ostad, S. A. (1997). Developmental differences in addition strategies: A comparison of
mathematically disabled and mathematically normal children. British Journal of Educational Psychology, 67, 345 - 357.
Ostad, S. A. (1998). Developmental differences in solving simple arithmetic word
problems and simple number-fact problems: A comparison of mathematically normal and mathematically disabled children. Mathematical Cognition, 4(1), 1 - 19.
U.S. Department of Education. (2008). Foundations for success: The final report of the
National Mathematics Advisory Panel. Retrieved February 11, 2009, from the U.S. Department of Education Web site: http://www.ed.gov/about/bdscomm/list/mathpanel/report/final-report.pdf

30 Educational Research Institute of America
Appendices
Appendix A
Demographic Characteristics of Schools Included in the Grade 3 Group
Locale Grades Enroll-ment
% Free/Reduced Lunch % Minority
% Special Education
% Limited English
1 Rural K to 6 537 31% 1% 12% 1% 2 Urban Fringe Large City K to 5 225 62% 4% 29% 1% 3 Urban Fringe Large City 3 to 5 676 28% 3% 7% 0% 4 Urban Fringe Mid-Size City 3 to 5 261 29% 0% 23% 0% 5 Mid-Size Central City K to 4 558 28% 1% 17% 0% 6 Small Town K to 4 588 7% 11% 17% 0% 7 Rural K to 5 364 37% 2% 23% 0% 8 Small Town K to 5 456 30% 1% 21% 0% 9 Urban Fringe Of Large City 1 to 5 512 27% 5% 14% 1%
10 Rural K to 4 303 29% 0% 23% 0% 11 Mid-Size Central City K to 5 326 66% 43% 23% 2% 12 Small Town K to 6 578 29% 1% 17% 0% 13 Rural K to 6 532 16% 8% 17% 11% 14 Small Town K to 6 591 30% 13% 15% 10% 15 Rural PK to 5 474 38% 5% 18% 1% 16 Rural K to 5 355 23% 8% 12% 5% 17 Urban Fringe Of Large City K to 5 681 11% 16% 18% 6% 18 Mid-Size Central City K to 5 360 87% 34% 14% 1% 19 Urban Fringe Of Large City K to 5 483 76% 24% 13% 1% 20 Urban Fringe Of Large City K to 5 219 59% 14% 14% 20% 21 Urban Fringe Of Large City K to 6 355 14% 14% 14% 5% 22 Urban Fringe Of Large City K to 6 301 25% 31% 16% 6% 23 Small Town 3 to 5 510 47% 0% 18% 1% 24 Rural K to 5 162 45% 0% 28% 2% 25 Small Town K to 3 329 32% 0% 19% 0% 26 Rural K to 5 201 35% 0% 18% 0% 27 Small Town K to 6 153 41% 0% 18% 0% 28 Rural K to 6 595 20% 2% 12% 0% 29 Urban Fringe Of Large City K to 6 327 35% 2% 12% 0% 30 Urban Fringe Of Large City K to 6 606 20% 1% 12% 0% 31 Small Town K to 6 495 34% 1% 22% 0% 32 Mid-Size Central City K to 5 443 50% 6% 19% 3% 33 Small Town K to 6 297 59% 9% 20% 2% 34 Mid-Size Central City K to12 345 52% 8% 17% 1% 35 Small Town K to 6 198 67% 1% 24% 0% 36 Mid-Size Central City K to 6 451 14% 1% 17% 1% 37 Rural 3 to 5 500 40% 1% 15% 1% 38 Urban Fringe Of Large City K to 6 476 26% 1% 13% 0% 39 Rural K to 8 194 6% 33% 12% 0% 40 Urban Fringe Of Large City K to 8 435 2% 0% 0% 0% 41 Rural PK to 6 403 33% 3% 11% 0% 42 Mid-Size Central City PK to 8 552 45% 10% 10% 6% 43 Small Town PK to 8 297 28% 2% 13% 2% 44 Rural K to 8 403 29% 3% 0% 0% 45 Small Town PK to 8 543 37% 9% 15% 1% 46 Rural K to 8 297 35% 2% 11% 0% 47 Rural K to 6 537 31% 1% 12% 1% 48 Small Town K to 5 225 62% 4% 29% 1% 49 Mid-Size Central City 3 to 5 676 28% 3% 7% 0%
AVERAGE 416 35% 7% 16% 2%
31 Educational Research Institute of America
Appendix B
Demographic Characteristics of Schools Included in the Grade 5 Group
Locale Grades Enroll-ment
% Free/Reduced Lunch % Minority
% Special Education
% Limited English
1 Small Town K to 5 246 41% 2% 16% 0% 2 Urban Fringe Of Large City K to 5 297 68% 36% 15% 22% 3 Urban Fringe Of Large City PK to 5 614 24% 1% 27% 0% 4 Mid-Size Central City K to 6 297 59% 9% 20% 2% 5 Small Town K to 6 598 40% 6% 16% 1% 6 Urban Fringe Of Large City K to 5 252 25% 2% 16% 0% 7 Urban Fringe Of Large City 5 to 8 479 30% 0% 16% 0% 8 Rural K to 5 139 53% 10% 15% 9% 9 Urban Fringe Of Large City 1 to 5 539 22% 4% 15% 1%
10 Mid-Size Central City K to 6 532 7% 15% 14% 4% 11 Mid-Size Central City K to 5 174 67% 14% 27% 2% 12 Mid-Size Central City K to 5 291 65% 4% 20% 2% 13 Urban Fringe Of Large City 5 to 8 421 33% 8% 13% 6% 14 Mid-Size Central City K to 5 414 86% 13% 18% 0% 15 Urban Fringe Of Large City K to 5 183 17% 1% 16% 0% 16 Small Town K to 5 341 11% 1% 21% 0% 17 Rural K to 6 532 16% 8% 17% 11% 18 Urban Fringe Of Large City K to 6 441 39% 48% 13% 5% 19 Urban Fringe Of Large City K to 5 277 35% 6% 14% 4% 20 Urban Fringe Of Mid-Size City K to 8 472 24% 2% 17% 0% 21 Urban Fringe Of Large City K to 5 611 8% 8% 20% 7% 22 Small Town PK to 6 368 60% 3% 21% 0% 23 Small Town K to 5 283 26% 0% 18% 0% 24 Mid-Size Central City K to 5 360 87% 34% 14% 1% 25 Mid-Size Central City K to 5 359 59% 22% 13% 4% 26 Mid-Size Central City K to 8 360 4% 8% 2% 4% 27 Small Town PK to 8 362 3% 2% 2% 0% 28 Urban Fringe Of Large City PK to 8 344 1% 3% 4% 0% 29 Urban Fringe Of Large City K to 5 675 3% 5% 19% 7% 30 Small Town K to 6 421 26% 1% 16% 5% 31 Small Town K to 6 335 18% 6% 5% 3% 32 Rural K to 5 158 20% 1% 15% 2% 33 Mid-Size Central City K to 5 243 90% 60% 24% 2% 34 Mid-Size Central City K to 5 294 67% 34% 18% 2% 35 Rural K to 5 491 33% 3% 15% 3% 36 Small Town 1 to 5 301 66% 2% 16% 4% 37 Mid-Size Central City K to 5 342 18% 0% 14% 0% 38 Rural K to 5 364 37% 2% 23% 0% 39 Small Town K to 5 326 25% 1% 18% 1% 40 Rural K to 6 560 25% 1% 17% 0% 41 Urban Fringe Of Large City PK to 8 491 12% 6% 6% 2% 42 Urban Fringe Of Large City K to 5 552 30% 6% 22% 2% 43 Small Town PK to 5 232 8% 1% 2% 0% 44 Urban Fringe Of Large City PK to 6 242 81% 33% 15% 26% 45 Rural K to 5 229 49% 0% 21% 1% 46 Rural K to 5 143 7% 0% 0% 0% 47 Mid-Size Central City K to 5 464 34% 20% 19% 8% 48 Urban Fringe Of Large City PK to 8 258 0% 3% 2% 0% 49 Mid-Size Central City K to 8 260 11% 7% 4% 1% 50 Urban Fringe Of Large City PK to 8 191 12% 8% 3% 2% 51 Mid-Size Central City K to 5 822 10% 4% 21% 2% 52 Mid-Size Central City 3 to 8 358 8% 7% 4% 3% 53 Small Town K to 5 548 36% 9% 9% 4% 54 Small Town K to 5 324 65% 2% 16% 1%
32 Educational Research Institute of America
55 Urban Fringe Of Large City K to 5 311 51% 50% 16% 23% 56 Urban Fringe Of Large City K to 5 558 15% 1% 15% 1% 57 Rural 3 to 5 160 30% 1% 20% 0% 58 Small Town K to 6 279 30% 2% 17% 0% 59 Mid-Size Central City K to 5 260 35% 11% 26% 2% 60 Urban Fringe Of Mid-Size City PK to 5 410 76% 0% 18% 0% 61 Rural K to 8 99 4% 2% 2% 2%
Average 365 33% 9% 15% 3%

33 Educational Research Institute of America
Appendix C
Indiana’s Academic Standards for Mathematics – Grade 3
Standard 1 - Number Sense
Students understand the relationships among numbers, quantities, and place value in whole numbers* up to 1,000. They understand the relationship among whole numbers, simple fractions, and decimals.
3.1.1 Count, read, and write whole numbers up to 1,000. 3.1.2 Identify and interpret place value in whole numbers up to 1,000. 3.1.3 Use words, models, and expanded form to represent numbers up to 1,000. 3.1.4 Identify any number up to 1,000 in various combinations of hundreds, tens,
and ones. 3.1.5 Compare whole numbers up to 1,000 and arrange them in numerical order. 3.1.6 Round numbers less than 1,000 to the nearest ten and the nearest hundred. 3.1.7 Identify odd and even numbers up to 1,000 and describe their characteristics. 3.1.8 Show equivalent fractions* using equal parts. 3.1.9 Identify and use correct names for numerators and denominators. 3.1.10 Given a pair of fractions, decide which is larger or smaller by using objects or
pictures. 3.1.11 Given a set* of objects or a picture, name and write a decimal to represent
tenths and hundredths. 3.1.12 Given a decimal for tenths, show it as a fraction using a place-value model. 3.1.13 Interpret data displayed in a circle graph and answer questions about the
situation. 3.1.14 Identify whether everyday events are certain, likely, unlikely, or impossible. 3.1.15 Record the possible outcomes for a simple probability experiment.
Standard 2 - Computation
Students solve problems involving addition and subtraction of whole numbers. They model and solve simple problems involving multiplication and division.
3.2.1 Add and subtract whole numbers up to 1,000 with or without regrouping, using relevant properties of the number system.
3.2.2 Represent the concept of multiplication as repeated addition. 3.2.3 Represent the concept of division as repeated subtraction, equal sharing, and
forming equal groups. 3.2.4 Know and use the inverse relationship between multiplication and division
facts, such as 6 × 7 = 42, 42 ÷ 7 = 6, 7 × 6 = 42, 42 ∞÷ 6 = 7.

34 Educational Research Institute of America
3.2.5 Show mastery of multiplication facts for 2, 5, and 10. 3.2.6 Add and subtract simple fractions with the same denominator. 3.2.7 Use estimation to decide whether answers are reasonable in addition and
subtraction problems. 3.2.8 Use mental arithmetic to add or subtract with numbers less than 100.
Standard 3 - Algebra and Functions
Students select appropriate symbols, operations, and properties to represent, describe, simplify, and solve simple number and functional relationships.
3.3.1 Represent relationships of quantities in the form of a numeric expression or equation.
3.3.2 Solve problems involving numeric equations. 3.3.3 Choose appropriate symbols for operations and relations to make a number
sentence true. 3.3.4 Understand and use the commutative* and associative* properties of
multiplication. 3.3.5 Create, describe, and extend number patterns using multiplication. 3.3.6 Solve simple problems involving a functional relationship between two
quantities. 3.3.7 Plot and label whole numbers on a number line up to 10.
Standard 4 - Geometry
Students describe and compare the attributes of plane and solid geometric shapes and use their understanding to show relationships and solve problems.
3.4.1 Identify quadrilaterals* as four-sided shapes. 3.4.2 Identify right angles in shapes and objects and decide whether other angles are
greater or less than a right angle. 3.4.3 Identify, describe, and classify: cube, sphere*, prism*, pyramid, cone, and
cylinder. 3.4.4 Identify common solid objects that are the parts needed to make a more
complex solid object. 3.4.5 Draw a shape that is congruent* to another shape. 3.4.6 Use the terms point, line, and line segment in describing two-dimensional
shapes. 3.4.7 Draw line segments and lines. 3.4.8 Identify and draw lines of symmetry in geometric shapes (by hand or using
technology). 3.4.9 Sketch the mirror image reflections of shapes.

35 Educational Research Institute of America
3.4.10 Recognize geometric shapes and their properties in the environment and specify their locations.
Standard 5 Measurement
Students choose and use appropriate units and measurement tools for length, capacity, weight, temperature, time, and money.
3.5.1 Measure line segments to the nearest half-inch. 3.5.2 Add units of length that may require regrouping of inches to feet or
centimeters to meters. 3.5.3 Find the perimeter of a polygon*. 3.5.4 Estimate or find the area of shapes by covering them with squares. 3.5.5 Estimate or find the volumes of objects by counting the number of cubes that
would fill them. 3.5.6 Estimate and measure capacity using quarts, gallons, and liters. 3.5.7 Estimate and measure weight using pounds and kilograms. 3.5.8 Compare temperatures in Celsius and Fahrenheit. 3.5.9 Tell time to the nearest minute and find how much time has elapsed. 3.5.10 Find the value of any collection of coins and bills. Write amounts less than a
dollar using the ¢ symbol and write larger amounts in decimal notation using the $ symbol.
3.5.11 Use play or real money to decide whether there is enough money to make a purchase.
3.5.12 Carry out simple unit conversions within a measurement system (e.g., centimeters to meters, hours to minutes).
Standard 6 - Problem Solving
Students make decisions about how to approach problems and communicate their ideas.
3.6.1 Analyze problems by identifying relationships, telling relevant from irrelevant information, sequencing and prioritizing information, and observing patterns.
3.6.2 Decide when and how to break a problem into simpler parts.
Students use strategies, skills, and concepts in finding and communicating solutions to problems.
3.6.3 Apply strategies and results from simpler problems to solve more complex problems.

36 Educational Research Institute of America
3.6.4 Express solutions clearly and logically by using the appropriate mathematical terms and notation. Support solutions with evidence in both verbal and symbolic work.
3.6.5 Recognize the relative advantages of exact and approximate solutions to problems and give answers to a specified degree of accuracy.
3.6.6 Know and use strategies for estimating results of whole-number addition and subtraction.
3.6.7 Make precise calculations and check the validity of the results in the context of the problem.
Students determine when a solution is complete and reasonable and move beyond a particular problem by generalizing to other situations.
3.6.8 Decide whether a solution is reasonable in the context of the original situation. 3.6.9 Note the method of finding the solution and show a conceptual understanding
of the method by solving similar problems.

37 Educational Research Institute of America
Appendix D Indiana’s Academic Standards for Mathematics – Grade 5
Standard 1 - Number Sense
Students compute with whole numbers*, decimals, and fractions and understand the relationship among decimals, fractions, and percents. They understand the relative magnitudes of numbers. They understand prime* and composite* numbers.
5.1.1 Convert between numbers in words and numbers in figures, for numbers up to millions and decimals to thousandths.
5.1.2 Round whole numbers and decimals to any place value. 5.1.3 Arrange in numerical order and compare whole numbers or decimals to two
decimal places by using the symbols for less than (<), equals (=), and greater than (>).
5.1.4 Interpret percents as a part of a hundred. Find decimal and percent equivalents for common fractions and explain why they represent the same value.
5.1.5 Explain different interpretations of fractions: as parts of a whole, parts of a set, and division of whole numbers by whole numbers.
5.1.6 Describe and identify prime and composite numbers. 5.1.7 Identify on a number line the relative position of simple positive fractions,
positive mixed numbers, and positive decimals.
Standard 2 - Computation
Students solve problems involving multiplication and division of whole numbers and solve problems involving addition, subtraction, and simple multiplication and division of fractions and decimals.
5.2.1 Solve problems involving multiplication and division of any whole numbers. 5.2.2 Add and subtract fractions (including mixed numbers) with different
denominators. 5.2.3 Use models to show an understanding of multiplication and division of
fractions. 5.2.4 Multiply and divide fractions to solve problems. 5.2.5 Add and subtract decimals and verify the reasonableness of the results. 5.2.6 Use estimation to decide whether answers are reasonable in addition,
subtraction, multiplication, and division problems. 5.2.7 Use mental arithmetic to add or subtract simple decimals.

38 Educational Research Institute of America
Standard 3 - Algebra and Functions
Students use variables in simple expressions, compute the value of an expression for specific values of the variable, and plot and interpret the results. They use two-dimensional coordinate grids to represent points and graph lines.
5.3.1 Use a variable to represent an unknown number. 5.3.2 Write simple algebraic expressions in one or two variables and evaluate them
by substitution. 5.3.3 Use the distributive property* in numerical equations and expressions. 5.3.4 Identify and graph ordered pairs of positive numbers. 5.3.5 Find ordered pairs (positive numbers only) that fit a linear equation, graph the
ordered pairs, and draw the line they determine. 5.3.6 Understand that the length of a horizontal line segment on a coordinate plane
equals the difference between the x-coordinates and that the length of a vertical line segment on a coordinate plane equals the difference between the y-coordinates.
5.3.7 Use information taken from a graph or equation to answer questions about a problem situation.
Standard 4 - Geometry
Students identify, describe, and classify the properties of plane and solid geometric shapes and the relationships between them.
5.4.1 Measure, identify, and draw angles, perpendicular and parallel lines, rectangles, triangles, and circles by using appropriate tools (e.g., ruler, compass, protractor, appropriate technology, media tools).
5.4.2 Identify, describe, draw, and classify triangles as equilateral*, isosceles*, scalene*, right*, acute*, obtuse*, and equiangular*.
5.4.3 Identify congruent* triangles and justify your decisions by referring to sides and angles.
5.4.4 Identify, describe, draw, and classify polygons*, such as pentagons and hexagons.
5.4.5 Identify and draw the radius and diameter of a circle and understand the relationship between the radius and diameter.
5.4.6 Identify shapes that have reflectional and rotational symmetry*. 5.4.7 Understand that 90°, 180°, 270°, and 360° are associated with quarter, half,
three-quarters, and full turns, respectively. 5.4.8 Construct prisms* and pyramids using appropriate materials. 5.4.9 Given a picture of a three-dimensional object, build the object with blocks.

39 Educational Research Institute of America
Standard 5 - Measurement
Students understand and compute the areas and volumes of simple objects, as well as measuring weight, temperature, time, and money.
5.5.1 Understand and apply the formulas for the area of a triangle, parallelogram, and trapezoid.
5.5.2 Solve problems involving perimeters and areas of rectangles, triangles, parallelograms, and trapezoids, using appropriate units.
5.5.3 Use formulas for the areas of rectangles and triangles to find the area of complex shapes by dividing them into basic shapes.
5.5.4 Find the surface area and volume of rectangular solids using appropriate units. 5.5.5 Understand and use the smaller and larger units for measuring weight (ounce,
gram, and ton) and their relationship to pounds and kilograms. 5.5.6 Compare temperatures in Celsius and Fahrenheit, knowing that the freezing
point of water is 0°C and 32°F and that the boiling point is 100°C and 212°F.
5.5.7 Add and subtract with money in decimal notation.
Standard 6 - Data Analysis and Probability
Students collect, display, analyze, compare, and interpret data sets. They use the results of probability experiments to predict future events.
5.6.1 Explain which types of displays are appropriate for various sets of data. 5.6.2 Find the mean*, median*, mode*, and range* of a set of data and describe
what each does and does not tell about the data set. 5.6.3 Understand that probability can take any value between 0 and 1, events that
are not going to occur have probability 0, events certain to occur have probability 1, and more likely events have a higher probability than less likely events.
5.6.4 Express outcomes of experimental probability situations verbally and numerically (e.g., 3 out of 4, 3
4 ).
Standard 7 - Problem Solving
Students make decisions about how to approach problems and communicate their ideas.
5.7.1 Analyze problems by identifying relationships, telling relevant from irrelevant information, sequencing and prioritizing information, and observing patterns.
5.7.2 Decide when and how to break a problem into simpler parts.

40 Educational Research Institute of America
Students use strategies, skills, and concepts in finding and communicating solutions to problems.
5.7.3 Apply strategies and results from simpler problems to solve more complex problems.
5.7.4 Express solutions clearly and logically by using the appropriate mathematical terms and notation. Support solutions with evidence in both verbal and symbolic work.
5.7.5 Recognize the relative advantages of exact and approximate solutions to problems and give answers to a specified degree of accuracy.
5.7.6 Know and apply appropriate methods for estimating results of rational-number computations.
5.7.7 Make precise calculations and check the validity of the results in the context of the problem.
Students determine when a solution is complete and reasonable and move beyond a particular problem by generalizing to other situations.
5.7.8 Decide whether a solution is reasonable in the context of the original situation. 5.7.9 Note the method of finding the solution and show a conceptual understanding
of the method by solving similar problems.