
Reactivity Monitoring of Accelerator-Driven Nuclear ... · of Accelerator-Driven Nuclear Reactor...
190
For the public defense of my PhD thesis Reactivity Monitoring of Accelerator-Driven Nuclear Reactor Systems MONDAY JANUARY 4, 2016 Senaatszaal, Aula of TU Delft, Mekelweg 5, Delft - The Netherlands 14:30 Introductory talk 15:00 Thesis defense Wim Uyttenhove More information on www.thebindingenergy.com/phd INVITATION BE - Doctoraat uitnodiging.indd 1 15/12/15 20:01 Reactivity Monitoring of Accelerator-Driven Nuclear Reactor Systems Wim Uyttenhove Department of Radiation Science and Technology Wim Uyttenhove Reactivity Monitoring of Accelerator-Driven Nuclear Reactor Systems ISBN 978-94-6295-440-3 TBE - Cover Doctoraat-DEF.indd 1 16/12/15 10:02
-
Upload
vuongthuan -
Category
Documents
-
view
217 -
download
0
Transcript of Reactivity Monitoring of Accelerator-Driven Nuclear ... · of Accelerator-Driven Nuclear Reactor...

For the public defense of my PhD thesis
Reactivity Monitoringof Accelerator-DrivenNuclear Reactor Systems
MONDAY JANUARY 4, 2016 Senaatszaal,Aula of TU Delft, Mekelweg 5,Delft - The Netherlands
14:30 Introductory talk15:00 Thesis defense
Wim Uyttenhove
More information on www.thebindingenergy.com/phd
INVITATION
TBE - Doctoraat uitnodiging.indd 1 15/12/15 20:01
Reactivity Monitoringof Accelerator-DrivenNuclear Reactor Systems
Wim Uyttenhove
Department of Radiation Science and Technology
Wim
UyttenhoveRea
ctivity Monitoring
of Accelerator-D
riven Nuclea
r Reactor System
s
ISBN 978-94-6295-440-3
TBE - Cover Doctoraat-DEF.indd 1 16/12/15 10:02

Reactivity Monitoring
of Accelerator-Driven
Nuclear Reactor Systems


Reactivity Monitoring
of Accelerator-Driven
Nuclear Reactor Systems
Proefschrift
ter verkrijging van de graad van doctor
aan de Technische Universtiteit Delft,
op gezag van de Rector Magnificus Prof. ir. K.C.A.M. Luyben,
voorzitter van het College voor Promoties,
in het openbaar te verdedigen
op maandag 4 januari 2016 om 15:00 uur
door
Wim UYTTENHOVE
Nucleair en werktuigkundig-elektrotechnisch ingenieur, Universiteit Gent, België
geboren te Gent op 9 december 1980

Dit proefschrift is goedgekeurd door de promotor:
Prof. dr. ir. T.H.J.J van der Hagen
Samenstelling promotiecommissie:
Rector Magnificus,Prof. dr. ir. T.H.J.J van der Hagen,dr. ir. D. Lathouwers,Prof. dr. H. van der Graaf,Prof. dr. S. Roeser,Prof. dr. P. Désesquelles,Prof. dr. ir. W. D’Haeseleer,dr. ir. P. Baeten,
voorzitterTechnische Universiteit Delft, promotorTechnische Universiteit Delft, copromotorTechnische Universiteit DelftTechnische Universiteit DelftUniversité Paris-SudKU LeuvenSCK•CEN, Vrije Universiteit Brussel
Prof. dr. ir. J.-L. Kloosterman (Technische Universiteit Delft) en dr. ir. G. Van denEynde (SCK•CEN, Universiteit Hasselt) hebben een belangrijke bijdrage geleverdin de begeleiding en ondersteuning van deze thesis.
© 2016, Wim Uyttenhove
All rights reserved. No part of this book may be reproduced, stored in a retrievalsystem, or transmitted, in any form or by any means, without prior permissionfrom the copyright owner.
ISBN 978-94-6295-440-3
Keywords: nuclear, accelerator-driven systems, reactivity, reactor physics, experi-ments, modal analysis, VENUS, MYRRHA
The research described in this thesis was performed in the section Physics ofNuclear Reactors (PNR), of the department Radiation, Radionuclides & Reactors(R3), of the Delft University of Technology, Delft, The Netherlands.
The research described in this thesis was (financially) supported by the BelgianNuclear Research Centre (SCK•CEN) and by the GUINEVERE and FREYA projectswithin the 6th and 7th Framework Program of the European Commission.
Printed by Proefschriftmaken.nl || Uitgeverij BOXPress, ′s-Hertogenbosch, TheNetherlands


Contents
Contents
1 Introduction 1
1.1 ADS Physics and Technology . . . . . . . . . . . . . . . . . . . . . . . . . . . 2
1.2 Motivation for Accelerator-Driven Systems . . . . . . . . . . . . . . . . . 5
1.3 Subcriticality Monitoring Techniques . . . . . . . . . . . . . . . . . . . . . 7
1.4 Ongoing ADS Projects . . . . . . . . . . . . . . . . . . . . . . . . . . . . . . . . 17
1.5 The EFIT, MYRRHA and VENUS-F Reactor Designs . . . . . . . . . . . 21
1.6 Research Outline . . . . . . . . . . . . . . . . . . . . . . . . . . . . . . . . . . . . 29
2 Spatial Effects in Subcriticality Monitoring 33
2.1 Modal Analysis Approach . . . . . . . . . . . . . . . . . . . . . . . . . . . . . . 34
2.2 Start-up Reactivity Monitoring Techniques . . . . . . . . . . . . . . . . . 38
2.3 The Current-To-Flux Reactivity Monitor . . . . . . . . . . . . . . . . . . . 48
2.4 The Source Jerk Interim Reactivity Cross-Checking Method . . . . . 51
2.5 Obtaining a Reference Subcriticality Level . . . . . . . . . . . . . . . . . . 55
2.6 Experiment Simulation via the DALTON Diffusion Code . . . . . . . 57
2.7 Summary . . . . . . . . . . . . . . . . . . . . . . . . . . . . . . . . . . . . . . . . . . 59
3 Validation by Experimental Results from Subcriticality Measurements 61
3.1 The VENUS-F Subcritical ‘Reference’ State . . . . . . . . . . . . . . . . . 62
3.2 Subcriticality Monitoring during Start-up . . . . . . . . . . . . . . . . . . 67
3.3 Subcriticality Monitoring during Operation . . . . . . . . . . . . . . . . . 90
3.4 Interim Reactivity Cross-Checking Techniques . . . . . . . . . . . . . . 97
3.5 Conclusion and Outlook . . . . . . . . . . . . . . . . . . . . . . . . . . . . . . . 101
4 Subcriticality Monitoring in a Power ADS 103
4.1 Selected MYRRHA Subcritical Cores for Reactivity Monitoring . . . 104
4.2 Subcriticality Monitoring during Start-up . . . . . . . . . . . . . . . . . . 108
vi

Contents
4.3 On-line Subcriticality Monitoring during Normal Operation . . . . 1144.4 Robustness of the Reactivity Monitoring against Incident Scenarios 1234.5 Discussion . . . . . . . . . . . . . . . . . . . . . . . . . . . . . . . . . . . . . . . . . 1294.6 Conclusion . . . . . . . . . . . . . . . . . . . . . . . . . . . . . . . . . . . . . . . . 130
5 Conclusions and Recommendations 133
5.1 Conclusions . . . . . . . . . . . . . . . . . . . . . . . . . . . . . . . . . . . . . . . . 1335.2 Recommendations . . . . . . . . . . . . . . . . . . . . . . . . . . . . . . . . . . . 137
A The VENUS-F Models in DALTON 139
A.1 Geometry Description . . . . . . . . . . . . . . . . . . . . . . . . . . . . . . . . 139A.2 Cross Section Generation . . . . . . . . . . . . . . . . . . . . . . . . . . . . . . 143
B The MYRRHA Model in DALTON 145
B.1 Geometry Description . . . . . . . . . . . . . . . . . . . . . . . . . . . . . . . . 145B.2 Cross Section Generation . . . . . . . . . . . . . . . . . . . . . . . . . . . . . . 147
C List of Abbreviations 149
References 151
Summary 165
Samenvatting 169
Acknowledgements 173
List of Publications 175
Curriculum Vitae 181
vii

Contents
viii

1INTRODUCTION
For Christ’s sake, Soddy, don’t call it transmutation.They’ll have our heads off as alchemists.
Ernest Rutherford, to his colleague Frederick Soddyon the discovery of transmutation of thorium, 1901.
Picture: Homer Simpson ©FOX Broadcasting Company
1

1. Introduction
In an Accelerator-Driven System (ADS) [Nifenecker et al., 2003; Kadi and Revol,2002] accelerated particles create external source neutrons that drive a subcriticalreactor. Thanks to the subcriticality of the reactor, fuels with a small delayedneutron fraction can be used in a safe way, i.e. in a reactor with a larger marginto supercriticality. Therefore, on the long term, the incineration of long-lived ra-diotoxic minor actinides (MA) can be envisaged in ADS. Subcriticality monitoringis required for both operational as well as safety reasons.
In this first chapter, the conceptual design of ADS is presented and the moti-vation of ADS is discussed. The ongoing projects are discussed and candidatereactivity measurement techniques are presented. The MYRRHA and VENUS-Freactors will be investigated in this thesis, being the major ongoing demonstratorproject and zero power operational facility, respectively. Finally, the research topicis explained and coupled to the structure of this PhD thesis text.
1.1 ADS Physics and Technology
In an ADS, a particle accelerator, a spallation target and a nuclear reactor witha subcritical core are coupled, as shown in Fig. 1.1 [Nifenecker et al., 2001].The accelerated particles, usually protons in power ADS designs, impinge on aspallation target, where they produce external source neutrons that drive thesubcritical reactor. This section discusses the general neutron physics and maincomponents of a full-scale ADS.
The fission power of an ADS is directly proportional to its beam current by[Gandini and Salvatores, 2002; Salvatores et al., 1994]
P =keff
1−keff
ip E f
νZφ∗ (1.1)
with P the total power (W), keff the effective multiplication factor of the reactor,
ip the number of incident protons per second (1/s), E f the average energy per fis-sion (J), ν the average neutron yield per fission, Z the number of source neutronsper incident source proton and φ∗ the neutron source efficiency [Gandini andSalvatores, 2002; Mellier, 2005]. φ∗ is defined by
φ∗ =−ρ
!Fφ"
⟨S ⟩(1.2)
2

1.1. ADS Physics and Technology
Figure 1.1: Concept of an Accelerator-Driven System.
with ρ=keff−1
keffthe reactivity of the reactor. The term
!Fφ"
represents the total
production of neutrons by fission, ⟨S ⟩ is the total production of neutrons by theexternal source and the brackets indicate integration over volume, solid angleand energy.
The fluxφ (in n/cm2/s) is the solution of the inhomogeneous transport equa-tion [Bell and Glasstone, 1985]
(F − L )φ+S = 0 (1.3)
with F the fission operator, L the transport operator comprising neutron lea-kage, neutron collisions and neutron scattering, and S the source strength (n/cm3/s):
Fφ =χ (E )
4π
# ∞
0
d E ′#
4π
d $Ω′ν(E ′)Σ f (r , E ′)φ(r ,%Ω′, E ′) (1.4)
Lφ = $Ω.∇φ(r , $Ω, E ) +Σt (r , E )φ(r , $Ω, E )−
# ∞
0
d E ′#
4π
d $Ω′Σs (r ,%Ω′ → $Ω, E ′ → E )φ(r , $Ω, E )
(1.5)
S = S (r , $Ω, E ) (1.6)
3

1. Introduction
The neutron source efficiency can also be defined as
φ∗ =
1−keffkeff
1−ksks
(1.7)
with ks the source multiplication factor
ks =
!Fφ"
!Fφ"+ ⟨S ⟩
(1.8)
The neutron source efficiency plays an important role in the ADS performanceassessment. It expresses the importance of the external source generated neutronsrelative to the neutrons generated by fission in the subcritical reactor. A valuehigher than 1 can reduce proportionally the proton beam current requirementfor a given subcriticality level. Typical values vary around unity, e.g. between0.9 (for a source positioned at the core-reflector interface) and 1.1 (for a sourcepositioned at the centre height) [Gandini and Salvatores, 2002].
The accelerator provides high energy charged particles that drive the subcri-tical core. The choice between a linear accelerator or a cyclotron is applicationdependent. In order to reduce thermal stresses, a power ADS should be extremelyreliable with regard to beam interruptions.
The spallation target provides the source neutrons that feed the fission processin the core. In case of a power ADS, they are produced by the spallation reaction ofcharged particles on a heavy metal target. An optimal target creates a maximumamount of neutrons per incident particle and per unit energy of the beam, andis able to remove the heat generated by the spallation process. Therefore, thetarget must be cooled. In case of power ADS, liquid (metal) targets are candidateto fulfill these requirements. Both lead and lead-bismuth eutectic are two pri-mary candidates for the production of spallation targets in a power ADS. For theseparation between the coolant and the beam guide (in vacuum), a beam windowis foreseen [Keyers, 2010] in the ongoing designs. The period for replacementof the window due to radiation damage (by protons) is therefore an importantparameter in the operation of a power ADS.
The coolants considered for fast reactors are also candidates to serve for ADS.Given the high power densities, liquid metals such as sodium, lead and lead-
4

1.2. Motivation for Accelerator-Driven Systems
bismuth are suitable candidates. Also gases, such as helium and CO2, are possiblecandidates. A comparative overview of both liquid metals as well as gases ascoolant is provided in [NEA, 2003], Chapter 4. For an ADS, lead and lead-bismuthhave the additional advantage to serve as coolant as well as spallation target.
The subcritical reactor of an ADS acts as an amplifier for the source neutrons.The neutron energy spectrum of the subcritical reactor depends on its composi-tion. A fast neutron spectrum leads to a better energetic yield for the transmuta-tion of Minor Actinides (MA)1, as well as a lower MA production. Power control inan ADS reactor can be performed by control rod movements or by beam currentvariations.
1.2 Motivation for Accelerator-Driven Systems
1.2.1 History
A comprehensive overview of the history of ADS is provided by [Gudowski, 1999;Kadi and Revol, 2002]. Already in 1940, E.O. Lawrence (USA) and W.N. Semenov(USSR) studied the use of accelerators to provide neutrons. In 1941, Glenn Seaborgwas the first to produce Plutonium by using a 6 MeV deuteron accelerator im-pinging on U-238. In 1950, Lawrence proposed the Material Testing Accelerator(MTA) at the Lawrence Livermore Radiation Lab to produce Pu-239 from depleteduranium [Van Atta, 1977]. In 1952, W.B. Lewis (Canada) recommended to usean accelerator for the production of U-233 from thorium, for the CANDU reac-tors [Bartholomew and Tunnicliffe, 1966]. Both projects were slowed down orstopped by the discovery of rich uranium deposits in the USA and the reliabilityand cost of accelerator beams. The concept of accelerator breeding was also stu-died by Russian scientists. R.G. Vassylkov [Vassylkov et al., 1978]made a neutronyield experiment in depleted uranium blocks using the Dubna accelerator.
Renewed interest in ADS was gained in the 1980s at Brookhaven National Lab(USA) [Brookhaven National Laboratory, 2013], when the USA decided to slow
1Nuclear transmutation is the conversion of one chemical element or isotope into anotherthrough nuclear reactions or through radioactive decay. Transmutation technology has the potentialto greatly reduce the long-term negative effects of radioactive wastes on human populations byreducing its radioactive half-life. This is the case for the MAs, i.e. the actinide elements (withatom number 89 until 103) other than uranium and plutonium, which are called major actinides.Minor actinides concerned in nuclear fuel are neptunium-237, americium-241, americium-243,curium-242 through -248, and californium-249 through -252.
5

1. Introduction
down the development of critical fast reactors, and in the 1990s at CERN (Switzer-land), when C. Rubbia became convinced that accelerator technology is matureenough for an exploitation of the ADS idea. He proposed a proton acceleratordriven subcritical system with fast neutrons, based on thorium fuel and leadas spallation target, moderator and coolant [Rubbia et al., 1995]. Later on thescientific feasibility and the verification of the principle of energy amplificationby a high energy cascade were proven in experiments such as FEAT [Andriamonjeet al., 1995] and TARC [Arnould et al., 1999].
1.2.2 Motivation
Incineration and Transmutation
Today, multiple ADS projects are ongoing at different continents. They are pre-sented in § 1.4. The principal goal, which makes an industrial scale ADS unique,is the incineration of large quantities of nuclear waste. A subtle difference shouldbe made between transmutation and incineration.
During transmutation, a neutron capture causes the transformation of a ra-dioactive nucleus. However, as stable nuclei could be transformed in radioactiveones, the method may require an initial separation of the isotopes that shouldbe transmuted. Incineration is related to nuclear fission following neutron cap-ture. This method goes on with transuranic elements and is already applied onplutonium, causing energy and neutron production.
Concerning safety, when inserting a considerable fraction of transuranic ele-ments (in particular minor actinides) in a reactor fuel, its delayed neutron fractiondecreases. This effect makes a critical reactor more difficult to control and limitsthe concentration of MA in fast reactor (FR) MOX fuel to 2.5 % ( [IAEA, 2009a],Section 6.2.1). An alternative approach is to burn MA in an ADS, guaranteeingthat in all conditions of operation, a sufficient margin to criticality is foreseen (see§ 1.6.1).
Concerning the decay heat removal issue (the second important safety issue ofa typical critical nuclear installation), no fundamental changes appear by usingan ADS. The power density remains an important factor to study, and is designdependent.
6

1.3. Subcriticality Monitoring Techniques
Thorium ADS
A second motivation for an ADS is related to the use of thorium (Th). Th-232 is afertile material. It is not fissionable by thermal neutrons, but can be convertedinto a fissile material by neutron absorption and subsequent nuclei conversions.Th-232 can be used for the production of fissile U-233 material. The fission of thisisotope causes less radiotoxic waste (due to minor actinides) than the fission ofU-235 or Pu-239 ( [Nifenecker et al., 2003], Chapter 11). If a low reactivity variationis required during operation, a reactor with plutonium and minor actinides fuelis recommended rather than a thorium reactor, in order to reduce the requiredbeam power in an industrial ADS.
1.2.3 Challenges
Compared to the incineration of minor actinides in (critical) fast reactors, chal-lenges of industrial ADSs will be related to the fabrication of the fuel with a highconcentration of minor actinides, towards the reliability of the accelerator and toother design-dependent technological issues.
Moreover, before studying incineration of minor actinides, partitioning is thefirst step to pass when studying the feasibility of transmutation of spent fuel minoractinides. A good overview of advanced fuel cycle partitioning is given in [IAEA,2009b], Section IV, [Baetslé, 2001], Chapter 3 or [Chauvin et al., 2011]. Today,separation of minor actinides has only been demonstrated in small quantities,and needs to be simplified in order to allow upscaling to technological levels.Heterogeneous recycling of minor actinides is a way to avoid the dilution by trou-blesome nuclides, such as Cm-244 (as a major source of α-radiation), throughoutthe fuel fabrication step. Current research is only in an early stage of development.
1.3 Subcriticality Monitoring Techniques
Different techniques for subcriticality monitoring exist, based on manipulationswith the ADS source. For each technique, multiple evaluation methods are pos-sible, as both static and dynamic reactor physics can be applied in order to de-termine the reactivity value. The static approach relies on an integration of thedetector response over a certain time period, whereas dynamic methods studythe time dependent profile of the detector response. An overview of the exis-ting techniques and related evaluation methods is provided in Table 1.1. In this
7

1. Introduction
section, each evaluation method is presented, focusing on the applicability tosubcriticality monitoring.
Technique Evaluation Method Static (S)Dynamic (D)
Pulsed neutron source Area S § 1.3.1α D § 1.3.1kp D § 1.3.1Noise D § 1.3.6
Source jerk Integrated (ISJ) S § 1.3.2Standard (SJ) S § 1.3.2α D § 1.3.2kp D § 1.3.2
Source modulation Prompt jump S § 1.3.3
Continuous beam Current-to-flux (CTF) S-D § 1.3.4Source multiplication S § 1.3.5Noise D § 1.3.6
Table 1.1: Overview of the different reactivity monitoring techniques for ADS and theirrelated evaluation methods.
1.3.1 The Pulsed Neutron Source (PNS) Technique
During the Pulsed Neutron Source (PNS) experiment [Sjöstrand, 1956], (Diracshaped) neutron pulses are introduced in a subcritical reactor. The requiredperiod of the pulse (in general in the order of 0.1-1 ms) depends on the reactordesign. In order to obtain a repetitive detector output, the prompt decay of thedetector response on a neutron pulse should have died out before the next pulseis noticed in the detector response. Secondly, many (about 200000) pulses shouldbe given to establish a stable ’delayed’ level in the detector output of a pulse train[Baeten et al., 2006].
The PNS technique will be studied in this work as a candidate to determinethe initial reactivity level before (power) operation of the ADS, as this techniquerequires the neutron to work in pulsed mode. From the pulse shape detectoroutput, different evaluation techniques exist that provide the reactivity of the
8

1.3. Subcriticality Monitoring Techniques
reactor in dollars 2.
Figure 1.2: Graphical representation of the evaluation methods applicable on the PNStechnique. [Bell and Glasstone, 1970]
The static evaluation of the PNS technique by the area (also called Sjöstrand)method [Sjöstrand, 1956] provides the subcriticality level of the reactor by theratio of two areas in the decay of the neutron density after a pulse, as shown inFig. 1.2:
−ρ
β=
Ap
Ad(1.9)
with ρ the reactivity, β the delayed neutron fraction, Ap the area related to theprompt decay of the neutron density and Ad the area related to the delayed decayof the neutron density.
The area method is a well-known robust method. Robust means that the reacti-vity (in dollars) can be derived directly from the ratio of the integrated prompt anddelayed neutron fissions, without other reactor physics parameters intervening.
Dynamic evaluation techniques, such as the prompt decayα-method [Simmonsand King, 1958; Garelis and Russell, 1963; Bell and Glasstone, 1970], are based onthe prompt decay of the neutron density to determine the reactivity level. Theprompt decay method allows to determine the reactivity via
ρ =αΛ+βeff (1.10)
2ρ=1 $ corresponds to ρ=βeff , the effective delayed neutron fraction of the fuel.
9

1. Introduction
with α the fundamental time eigenvalue of the subcritical system (1/s), i.e. theslope of the prompt neutron decay indicated in Fig. 1.2, and Λ the generationtime (s).
Dynamic methods however are sensitive to some kinetic integral parametersvalues (e.g. the neutron generation time Λ) that are cumbersome to measureprecisely and lose their physical significance [Dulla et al., 2011]. Therefore, thesemethods are less robust [Jammes et al., 2006] than the static ones.
Another dynamic method, the kp method [Perdu et al., 2003], provides the re-activity by fitting the recorded pulse response to an interpretation model thatmakes use of a calculated fission time distribution. This method requires a signifi-cant calculational effort and a precise model description. This makes the methodless robust than e.g. the area method.
1.3.2 The ADS Source Jerk Techniques
The source jerk technique [Ott and Neuhold, 1985] comprises the rapid removalof a neutron source out of an ADS. Both the physical removal of a (continuous)external neutron source or an interruption of the accelerator neutron source canrepresent the source jerk. Two types of source jerks exist.
The Integrated Source Jerk (ISJ) method consists in the evaluation of the neu-tron population over the complete dying-out time of the signal (in the order ofhundreds of seconds), see [Ott and Neuhold, 1985], section 9-4:
−ρ
β=
n (0)&q
i=1aiλi'∞
0n (t )d t
(1.11)
with n (0) the neutron density before beam stop, ai =βi
β the delayed neutronfraction in precursor group i , λi the precursor decay constant of group i , and'∞
0n (t )d t the time integral from t=0 s (after beam interruption) until the dying
out of the final precursor neutrons.
The (beam interruption) Source Jerk (SJ) method consists in determining theratio of the prompt to the slowly decaying delayed neutron population directly inthe first hundreds of µs after beam interruption, as shown in Fig. 1.3:
−ρ
β=
n0−n1
n1(1.12)
10

1.3. Subcriticality Monitoring Techniques
Figure 1.3: Graphical representation of the beam interruption Source Jerk (SJ) method.[Becares and Blazquez, 2012]
Both methods provide the reactivity of the subcritical reactor in dollars. Forgood statistics, the source jerk technique requires repetition (as for the PNS tech-nique), whereas the integrated source jerk technique requires a high initial fluxlevel and cannot be repeated.
During operation of an ADS, only the (beam interruption) source jerk modeis a candidate for subcriticality measurements. By briefly interrupting the con-tinuous beam at regular times, a cross checking of reactivity is performed. Thenthe equivalent continuous beam current is the average value over the period ofthe beam interruption. The limiting factor to apply this technique is the beaminterruption time, which should not be too long in order to avoid thermal stressesin the ADS, and which may not be too short in order to allow to determine withsufficient statistics the delayed neutron level.
The (beam interruption) source jerk technique allows also dynamic evaluationmethods such as the α-methods and the kp method, described in § 1.3.1 and[Billebaud et al., 2009]. In case the standard method (eq. (1.12)) cannot be used,e.g. because of a too long beam interruption time, these methods can serve asalternative.
1.3.3 The Source Modulation Technique
The source modulation technique [Baeten et al., 2006; Carta and D’Angelo, 1999;Ott and Neuhold, 1985] consists in changing the frequency of a pulsed source, asshown in Fig. 1.4. When looking on a macroscopic time scale, one can determine
11

1. Introduction
the reactivity level, as for the source jerk technique, based on prompt and delayedneutron densities:
−ρ
β=
nH −nC
nC −nL(1.13)
Figure 1.4: Graphical representation of the source modulation method on a microscopic(top) and macroscopic (bottom) level. [Baeten et al., 2006]
The technique can be used as a calibration technique during start-up, but easierevaluation methods for techniques with fixed frequency (e.g. the PNS technique)exist. In theory, this method is an alternative for the standard source jerk tech-nique. In reality, it is technologically complicated to change from continuousbeam to a source modulation mode.
1.3.4 The Current-to-Flux (CTF) Technique
The Current-to-Flux (CTF) technique ( [Mellier, 2005], § 9.1, and [Becares et al.,2013]) relates the reactivity level of a subcritical reactor with continuous neutronsource to the ratio between beam current (or source neutrons) and flux (or neutrondensity, or fission neutrons, or power):
ρ =−cS
φ(1.14)
withφ the neutron flux (n/cm2/s), S the accelerator beam current (A) and c theCurrent-to-Flux (CTF) proportionality coefficient (n/cm2/s/A). The proportiona-
12

1.3. Subcriticality Monitoring Techniques
lity coefficient c can be calibrated if a reference reactivity is known. No otherparameters are involved in the expression for the reactivity, this makes the CTFmethod robust as on-line reactivity monitoring technique during operation.
The CTF technique is only a relative monitor. Therefore, the behaviour ofthe proportionality coefficient, which takes into account the spatial dependentevolution of the dynamic behaviour of the neutron flux, can vary during operationof the ADS. Cross-checking with an absolute reactivity measurement technique isrequired at a regular base.
1.3.5 Source Multiplication Method
The source multiplication method [Ott and Neuhold, 1985; Blaise et al., 2011]allows to determine the subcriticality level of a new reactor state (‘2’) startingfrom another reactor state (‘1’) with a known subcriticality level, by keeping theneutron source constant and measuring the differences in neutron density (ordetector count rates):
ρ2
ρ1=
n1
n2(1.15)
The source multiplication technique is static, so statistics on the count rates(and the derived reactivity level) can be improved by increasing the measurementtime. This method is robust, as no other parameters than count rates and reactivitylevels are applied. It can be applied to determine a reference subcritical levelagainst which the techniques mentioned in this paragraph can be validated. Todo so, a slightly subcritical state is obtained from a critical reactor by the roddrop technique [Ott and Neuhold, 1985]. From this state, the subcriticality levelof deeper subcritical reactors can be determined by the source multiplicationmethod (see § 2.5).
1.3.6 Noise Measurement Techniques
Noise methods are based on the study of the neutron fluctuations in a reactor.Several noise measurement techniques are available to determine reactivity levels,such as the Rossi-alpha, Feynman-alpha and the Cross Power Spectral Density(CPSD) techniques [Uhrig, 1956; J.A. Thie, 1963]. These reactivity measurementmethods rely on the determination of the prompt neutron fundamental timedecay constant α.
13

1. Introduction
The noise techniques have the advantage to determine the reactivity level onan absolute scale. However, the methods are quite complicated to analyse, as nosimple reactivity value can be determined by point kinetics evaluation techniques.Moreover, for an acceptable signal-to-noise ratio for ADS reactivity measurements,it is recommended to add a pulsed neutron source to the existing continuousbeam [Baeten, 2003]. This is only possible at zero power operation. By doing this,evaluation techniques approach the dynamic PNS evaluation technique, which isnot such a robust evaluation technique as its static alternative (see §1.3.1).
1.3.7 Experience with Zero Power Facilities
The main experiments related to subcriticality monitoring were performed du-ring the FP5 MUSE project experiments [Soule et al., 2004; Mellier, 2005], at theMASURCA zero power facility at CEA Cadarache, France, and during measure-ments at the YALINA booster in Sosny, Belarus [Persson et al., 2005; Becares et al.,2013]. During both experiments, there was no possibility to obtain a referencesubcriticality level via the alternative methodology presented in § 1.3.5.
A conclusion of this research programme is that an on-line reactivity monitoringmethodology should consist of a combination of several techniques, for each stageof operation of an ADS. As a continuous monitor, the current-to-flux methodseems a promising candidate, but needs to be tested extensively [Soule et al.,2004].
The reactivity was calibrated during MUSE with a relative accuracy of 10 % viathe PNS technique [Soule et al., 2004; Cao and Lee, 2010]. The area method forthe analysis of the PNS calibration experiment came out as a promising method,not depending on kinetic parameters [Mellier, 2005]. Particular attention shouldbe paid to the careful determination of a ‘reference’ reactivity level (for validationpurposes) and to perform measurements with sufficient statistics.
The area method seems the most robust evaluation method for the PNS tech-nique. Fitting techniques [Soule et al., 2004] require the knowledge of kineticparameters, and the kp technique is sensitive to calculations and their relatedmodels [Chabod et al., 2014].
Beam interruption evaluation techniques could offer an additional reactivitycross-check, but could not be tested during the MUSE project. A so-called reflectoreffect (slow beam decay in the reflector after beam interruption) could hamperthe efficient determination of reactivity levels via pulsed or beam interruption
14

1.3. Subcriticality Monitoring Techniques
techniques in that region. This effect should be investigated [Becares et al., 2013].The Integrated Source Jerk (ISJ) method was not tested during MUSE, but can onlybe used during start-up, as the beam needs to be stopped for a while. The sourcestrength should be high enough to assure good statistics of the ISJ method [Mellier,2005].
Noise measurements seem to be interesting only close to criticality. In moredeep subcritical reactors, long measurement times are required and the accuracyis limited [Berglof et al., 2011]. In order to improve the accuracy, noise measure-ments with a pulsed neutron source are investigated [Mellier, 2005], however theycan serve only as start-up method. For that purpose, more robust techniques areavailable without the need to know the neutron generation time Λ.
1.3.8 Selected Monitoring Techniques
Based on the nature of the subcriticality measurement techniques and experiencefeedback presented in this section, an overview of the candidate monitoringtechniques is presented in Table 1.2. One can conclude that one single technique isnot sufficient to monitor the subcriticality of an ADS during all stages of operation.For a power ADS such as MYRRHA (see § 1.4), the start-up mode ends by movingthe control rods to reach the desired reactivity level. Afterwards, the beam level israised until 1 % of nominal power (Cold Zero Power - CZP). From that momenton, the beam power will rise and only short interruptions of the beam are allowed,to limit thermal stresses in the reactor.
In this work, the PNS area method is studied as a robust start-up reactivitymeasurement method (with the ISJ technique as alternative). The current-to-flux monitor, combined with the source jerk interim cross-checking technique isproposed for analysis as on-line reactivity monitor during operation. The selectionis based on the robustness of the method and the technological ability to performthe experiment on (a full power) ADS.
The rod drop - source multiplication method will be applied in order to providea subcriticality level via an alternative pathway against which the different selectedtechniques can be tested.
15

1. Introduction
Eva
luat
ion
Met
ho
dR/A
Sel
ecte
d?
(Y/N
)O
per
ati
on
al
Mo
de
Dis
cuss
ion
PN
SA
rea
AY
Star
t-u
pIn
tegr
alm
eth
od
,no
oth
erp
aram
eter
sin
volv
ed,r
epro
-d
uci
ble
.P
NSα
AN
Star
t-u
pD
epen
den
to
nΛ
,mo
rero
bu
stal
tern
ativ
eb
yP
NS
area
.P
NS
kp
AN
Star
t-u
pR
equ
ires
calc
ula
tio
na
lef
fort
,d
epen
den
to
nin
pu
tm
od
el,m
ore
rob
ust
alte
rnat
ive
by
PN
Sar
ea.
ISJ
AY
Star
t-u
pIn
tegr
alm
eth
od
,dep
end
so
nd
ela
yed
neu
tro
nco
effi
-ci
ents
,no
tre
pro
du
cib
le.
SJ
(sta
nd
ard
)A
YO
per
atio
nN
oo
ther
par
amet
ers
invo
lved
,rep
rod
uci
ble
,pro
vid
esab
solu
teva
lue
of
the
reac
tivi
ty.
SJα
AN
Op
erat
ion
Sa
me
as
PN
Seq
uiv
ale
nt,
alt
ern
ati
vem
eth
od
if(s
tan
-d
ard
)S
Jca
nn
ot
be
app
lied
.S
Jk
pA
NO
per
atio
nS
am
ea
sP
NS
equ
iva
len
t,a
lter
na
tive
met
ho
dif
(sta
n-
dar
d)
SJ
can
no
tb
eap
pli
ed.
Sou
rce
Mo
du
lati
on
AN
Sta
rt-u
pa
nd
op
erat
ion
Inte
rest
ing
met
ho
d,b
ut
tech
nic
alc
om
ple
xity
tova
ryb
eam
freq
uen
cy.
CT
FR
NO
per
atio
nSi
mp
lete
chn
iqu
ew
ith
no
oth
erp
aram
eter
sin
volv
ed,
wh
ich
pro
vid
esco
nti
nu
ou
sm
on
ito
r.St
atis
tics
dep
end
on
tim
ein
terv
alfo
rm
on
ito
rin
gSo
urc
eM
ult
ipli
cati
on
RY
Ref
eren
ceS
imp
lifi
edC
TF
tech
niq
ue
use
dfo
rd
eter
min
ing
refe
-re
nce
sub
crit
ical
ity
leve
lsta
rtin
gfr
om
crit
ical
stat
e.N
ois
eTe
chn
iqu
esA
NSt
art
-up
an
dO
per
atio
nD
epen
den
to
nΛ
.P
NS
sup
erp
osi
tio
nn
eed
edfo
rac
cep
-ta
ble
stat
isti
cs,w
hic
hli
mit
sap
pli
cati
on
tost
art-
up
.F
or
that
mo
de
mo
rero
bu
stte
chn
iqu
esar
eav
aila
ble
.
Tab
le1
.2:
Ove
rvie
wo
fth
ed
iffe
ren
tre
acti
vity
mo
nit
ori
ng
tech
niq
ues
for
AD
S,b
ased
on
the
nat
ure
of
the
met
ho
dan
dth
eex
per
ien
cefe
edb
ack
fro
mp
revi
ou
sze
ro-p
ow
erex
per
imen
ts.
R=
Rel
ativ
ete
chn
iqu
e,A=
Ab
solu
tete
chn
iqu
e.
16

1.4. Ongoing ADS Projects
1.4 Ongoing ADS Projects
A recent overview on the international ongoing ADS programmes is given in[Gohar, 2012]. The latest status report from the OECD Nuclear Energy Agency(NEA) dates from 2003 [NEA, 2003]. In this section, an overview of the majorongoing ADS programmes is given, ranging from zero power experiments topower ADS.
1.4.1 Europe
Zero-Power Experiments
Subcritical reactor physics and reactivity measurement techniques were investi-gated between 2000 and 2004 within the European Framework Programme (FP5)project MUSE (MUltiplication avec Source Externe) [Soule et al., 2004; Mellier,2005]. Sodium and lead reactors with 30 wt% MOX fuel were implemented at theMASURCA facility at CEA Cadarache, driven by the GENEPI deuteron accelerator.
On an international level, research went on at the YALINA facility in Belarus [Go-har and Smith, 2010], coordinated by the IAEA and International Science andTechnology Centre (ISTC), between 1997-2008. The YALINA-Booster is a subcriti-cal fast-thermal reactor. The reactor consists of a fast central lead zone with 36wt% enriched U (booster), a thermal PolyEthylene (PE) zone with natural U, aradial graphite reflector and a front and back biological shielding of borated PE.
In 2006 the GUINEVERE (Generator of UnInterrupted NEutrons at the VEnusREactor) project was launched within the European FP6 IP-EUROTRANS col-laboration [Knebel, 2006; Baeten et al., 2008] (2005-2010), in order to develop amethodology for reactivity monitoring in ADS. The existing zero-power VENUSfacility at SCK•CEN, Belgium, was modified towards VENUS-F: a fast spectrumlead reflected system that can be operated in both critical and subcritical mode.In the latter mode, the reactor is coupled to the GENEPI-3C accelerator [Baylacet al., 2010], an updated version of the GENEPI-2 machine previously used for theMUSE experiments.
In February 2011, VENUS-F passed its first criticality. The first coupling withthe accelerator was realised in October 2011. Today experiments go on in theframework of the FP7 Project FREYA (Fast Reactor Experiments for hYbrid Appli-cations) [Kochetkov, 2010; Kochetkov et al., 2013].
17

1. Introduction
The MYRRHA Demonstrator Project
Today, the main European ADS research is grouped into European FrameworkProgrammes (FP). The Belgian nuclear research centre SCK•CEN inspired the Eu-ropean ADS research with its national ADONIS (Accelerator Driven Operated NewIrradiation System, 1995-1997) and MYRRHA (Multi-purpose hYbrid ResearchReactor for High-tech Applications, 1998-2005) projects [Aït Abderrahim et al.,2012; Van den Eynde et al., 2012, 2014]. While ADONIS was a water cooled 1.5MWth ADS design with a U-235 fuel target to produce Mo-99 for medical appli-cations, MYRRHA aims to serve as a fast neutron material test facility, as well asto prove the feasibility of transmutation in a demonstrator ADS. The target andcoolant is eutectic Pb-Bi, foreseen to be driven by 350 MeV protons in a MOX fuelcore. The MYRRHA design power evolved from 30 MWth (2002) towards 52 MWth(2005).
Later on, the MYRRHA knowledge base was shared for the European FP6 projectIP-EUROTRANS [Knebel, 2006] (2005-2009), a successor of the FP5 PDS-XADSproject (2001-2004) [Bianchi et al., 2006]. Detailed design studies were carriedout in the so-called XT-ADS version of MYRRHA. Then the FP7 CDT (CentralDesign Team) project (2009-2012) [De Bruyn and Fernandez, 2012] was launchedto obtain a more advanced design of a flexible irradiation facility FASTEF (FAstSpectrum Transmutation Experimental Facility) with a maximum power of 100MWth, able to work in both subcritical and critical mode.
In 2010, the Belgium government expressed its support to realise the MYRRHAproject after a positive evaluation of the project proposal by the MYRRHA Inter-national Review Team (MIRT) [Aït Abderrahim et al., 2008; OECD/NEA, 2009],coordinated by the OECD on request of the Belgian government. During the 2010-2014 period SCK•CEN has to finalise the Front End Engineering Design (FEED) tosecure the licensing, and to set-up an international consortium for the financialand technical support to the project.
Today MYRRHA is presented as a multi-purpose facility to perform research forGeneration IV fission reactors, fusion, fundamental physics and transmutationstudies, meanwhile producing radio-isotopes. Since 2010, MYRRHA is recognisedon the priority list of the European Strategy Forum on Research Infrastructures(ESFRI) [ESFRI, 2010], as well as by the Strategic Research and Innovation Agendaof the Sustainable Nuclear Energy Technology Platform (SNETP) [SNETP, 2013].The complete installation should be operational by 2024, making it today the
18

1.4. Ongoing ADS Projects
most concrete ADS demonstrator design in the world.
The European Facility for Industrial Transmutation (EFIT)
In the framework of the IP-EUROTRANS FP6 project, a design study was made foran industrial transmutation machine, called EFIT [Artioli et al., 2008; Mansaniet al., 2011]. EFIT consists of a 800 MeV proton accelerator, providing spallationneutrons inside a Pu-MA fueled core, cooled by Pb, with a 400 MWth power.
1.4.2 Japan
Japan’s ADS programme envisages the transmutation of transuranics and thegeneration of nuclear energy [Pyeon, 2013]. On the long term, a 800 MWth designis proposed with a 1.5 GeV∼20 MW proton beam, Pb-Bi spallation target andcoolant, and (Pu+MA)N+ZrN fuel with a 2.5 ton MA initial inventory. Experimentstoday are ongoing with regard to the target window and Lead-Bismuth Eutectic(LBE) loops (JLBL1-3).
The Kyoto University runs the KUCA subcritical assembly [KUCA, 2013], whichis driven by a 14 MeV D-T neutron source in a highly enriched uranium core with aPE reflector. Recently, KUCA has been combined with a proton beam acceleratorto supply spallation neutrons to its subcritical reactor.
In the near future, Japan aims to construct the Japan Proton Accelerator Re-search Complex (J-PARC), which will host TEF-T (an ADS target test facility),foreseen to be operational by 2017, and TEF-P (a transmutation physics zeropower critical assembly), foreseen to be operational by 2022.
1.4.3 China
The Chinese ADS programme [Pyeon, 2013] is related to fissile material breeding.Measurements are being performed on VENUS-1, operated by the Chinese Insti-tute of Atomic Energy (CIAE). VENUS-1 is a subcritical physics experiment, drivenby a 14 MeV pulsed neutron source in a reactor with a fast (natural U in an Al grid)and thermal (enriched U in PE) zone.
In 2011, the Chinese Academy of Science (CAS) announced to build an ADS sys-tem, including the development of the China LEad Alloy cooled Reactor (CLEAR).Four phases of development are foreseen: a lead based zero-power facility (CLEAR-0), a 10MWth lead-bismuth cooled research reactor (CLEAR-I) to be built in the
19

1. Introduction
2010s, a 100MWth lead alloy cooled experimental reactor (CLEAR-II) to be built inthe 2020s, and a 1000MWth lead alloy cooled demonstration reactor (CLEAR-III)to be built in the 2030s.
1.4.4 India
India’s ADS programme [Degweker et al., 2013] aims to support the thorium fuelcycle by producing U-233. Also the transmutation of nuclear waste is consideredon the long term. The first phase of research covers the different ADS researchdomains such as a windowless spallation target and Heavy Liquid Metal (HLM)experiments with mercury and lead-bismuth. A physics experiment is available atthe PURNIMA labs at the Bhaba Atomic Research Centre (BARC). In a further stage,the development of two demo ADS (of 1 and 40 MWth power) with a spallationneutron source of LBE (cooled by light water) are scheduled.
1.4.5 The United States of America (USA)
Although the USA have no national full ADS project, they are active in the construc-tion of an electron accelerator driven system in Ukraine at the Kharkov Institute ofPhysics and Technology (KIPT), via an IAEA collaboration [Gohar, 2012] (see § 1.2).This ADS, which should be operational in 2014, will operate with low enricheduranium as fuel, water as coolant and beryllium as reflector.
Other US research deals with the development of an ADS concept for the na-tional spent fuel inventory (by Argonne National Laboratory), material test stands(at Los Alamos National Laboratory) and the physics of ADS using zero powerfacilities. For the latter, experiments were carried out at the YALINA booster inBelarus [Gohar and Smith, 2010].
1.4.6 Other International Programmes
In 2013, the IAEA reports that 18 countries are performing R&D in one or moredomains of the ADS research: Argentina and Brazil (physics programme), Polandand Belarus (experimental physics programme), Italy and Russia (physics andtechnology programme), South Korea and Spain (transmutation programme),Norway (energy and thorium fuel cycle studies) and Germany (complete ADSprogramme) [Gohar, 2012].
20

1.5. The EFIT, MYRRHA and VENUS-F Reactor Designs
1.5 The EFIT, MYRRHA and VENUS-F Reactor Designs
In this section, the design of the industrial EFIT ADS, the MYRRHA demonstratorand the VENUS-F zero power facility are presented. First the EFIT study is pre-sented to show the transmutation capacities of an industrial design, and to checkthe expected reactivity swing during operation of an industrial ADS. Then theMYRRHA project is discussed, being the most advanced demonstrator ADS projectcurrently ongoing. On this design, the subcriticality monitoring methodologywill be applied. Finally, VENUS-F will serve for the validation of the subcriticalitymonitoring concept for the MYRRHA demonstrator ADS.
Table 1.3 provides the main characteristics of the three systems. VENUS-F can,thanks to a (unique) critical reference state, validate the different subcriticalitymonitoring techniques for MYRRHA and perform benchmarking activities. Forthe MYRRHA project however, the research is focused on beam reliability, thestudy of power effects and the behaviour of the Pb-Bi coolant. For EFIT studies,the minor actinide fuel design, the fuel performance and the lead coolant are themain challenges.
VENUS-F MYRRHA EFIT
Power Max 500 W 65-100 MWth 400 MWth
Accelerator D, 250 keV P, 600 MeV P, 800 MeV
Neutron Source (D,T) fusion neu-trons
spallation neu-trons
spallationneutrons
Fuel Metallic U (30 wt%enriched)
MOX (30 wt% en-riched)
Pu-MA
Coolant Pb simulatedcoolant
Pb-Bi Pb
Table 1.3: Main Characteristics of VENUS-F, MYRRHA and EFIT. [Uyttenhove and Vanden Eynde, 2012]
1.5.1 EFIT
As industrial transmuter, EFIT aims to burn about 42 kg/TWh minor actinides, upto 20-25 % of the initial heavy metal in the fuel within 4-6 years. These goals shouldbe met in a U-free fuel, by obtaining a break-even Pu balance. A flat reactivityprofile is envisaged around keff=0.97 ± 0.01, to limit the compensation by beamcurrent variations or control rod movements. As electricity production with an
21

1. Introduction
acceptable efficiency is foreseen, higher primary circuit temperatures are reachedwith Pb: 400 C at reactor inlet and 480 C at reactor outlet.
The design of the EFIT reactor is presented in figure 1.5. Inside the core, 3 (or 6)rings of fuel assemblies can be hosted, comprising 198 position for fuel assembliesand 19 positions for the spallation target. The core barrel is completed with 252positions for Pb dummy assemblies and absorber elements. Two types of fuelsare studied, one with ceramic MgO (CERCER) and the other with metallic Mo(CERMET) as matrix material. In order to optimise the goals with regard to burn-up and reactivity swing, the fuel assembly parameters are optimised [Uyttenhoveet al., 2011b; Sobolev et al., 2011b]. The final reactor design foresees an active fuelheight of about 90 cm.
Figure 1.5: The EFIT reactor design from [Mansani et al., 2011] (1-core, 2-active zone,3-diagrid, 4-primary pump, 5-cylindrical inner vessel, 6-reactor vessel, 7-reactor cavity,8-reactor roof, 9-reactor vessel support, 10-rotating plug, 11-above core structure, 12-target unit, 13-steam generator unit, 14-fuel handling machine, 15-filter unit, 16-coreinstrumentation, 17-rotor lift machine).
22

1.5. The EFIT, MYRRHA and VENUS-F Reactor Designs
1.5.2 MYRRHA
At the time of the writing of this text, the MYRRHA design is in continuous evolu-tion. A general description of the MYRRHA project is found in [Aït Abderrahimet al., 2008], and the latest design status is presented in [Aït Abderrahim andBaeten, 2012; Aït Abderrahim et al., 2012; Van den Eynde et al., 2014]. In thiswork, the MYRRHA-FASTEF (FAst Spectrum Transmutation Experimental Facility)reactor will be studied [De Bruyn and Fernandez, 2012; Sarotto et al., 2013].
The layout of the MYRRHA-FASTEF reactor is shown in figure 1.6. While MYRRHA-FASTEF is a pool-type ADS, the reactor vessel houses all the primary systems. Thereactor has a double stainless steel vessel with an outer diameter of about 8 mand a height of about 11 m. The inner vessel contains all the LBE and the outervessel serves as secondary containment in case the inner reactor vessel breaks.The reactor cover closes the vessel and supports all the in-vessel components. Inthe MYRRHA-FASTEF design, the diaphragm divides the LBE into a hot (upper)and a cool (lower) pool. Two axial pumps circulate the LBE while two primaryheat exchangers per pump will cool the LBE. The main parameters are listed inTable 1.4.
Fuel assembly length 200 cm
Nominal power 100 MWth
Reactor inlet temperature 270 C
Reactor outlet temperature 410 C
Coolant velocity inside the reactor 2 m/s
Coolant pressure drop 2.5 bar
Primary coolant LBE
Secondary coolant saturated water/steam
Tertiary coolant air
Table 1.4: Main Characteristics of MYRRHA-FASTEF.
MYRRHA can be operated in both critical and subcritical mode. The MYRRHA-FASTEF reactor is cylindrical, with an active fuel height of 60 cm inside the as-sembly with length 200 cm, and a variable width (critical core radius of about 60cm), depending on the subcriticality level of the reactor and the experimentalassemblies inside. The core radius is limited by the barrel with internal radius71.5 cm. The reactor consists of typical mixed U-Pu oxide (MOX) fuel assemblies,LBE dummy assemblies, dedicated reflector assemblies, control rods and safetyrods. Different positions can be loaded with In-Pile Sections (IPS), foreseen for
23

1. Introduction
~11 m
1
2
3 4
5
6
7
Figure 1.6: The MYRRHA-FASTEF reactor design from [De Bruyn and Fernandez, 2012] (1-reactor vessel, 2-cover, 3-diaphragm, 4-core, 5-primary pump, 6-primary heat exchanger,7-in-vessel fuel handling machine).
experiments and isotope production units. The windowed beam-tube spallationtarget for operation in subcritical mode fits in the central fuel assembly position.As an example, Fig. 1.7 shows the FASTEF Beginning-Of-Life (BOL) subcriticalcore configuration.
The design of a MYRRHA fuel assembly (FA) is similar to the liquid sodiumcooled fast reactors (SFR) [Sobolev et al., 2011a]. Each FA consists of a hexagonalbundle (hexagon pitch of 5.225 cm) of cylindrical fuel elements (also called rodsor pins, 126 for the MYRRHA-FASTEF design) surrounded by a hexagonal shroud(wrapper), as shown in figure 1.8. The upper and lower ends of the shroud areconnected to the inlet and outlet nozzles guiding a LBE coolant through the FA.
24

1.5. The EFIT, MYRRHA and VENUS-F Reactor Designs
Figure 1.7: The MYRRHA-FASTEF BOL subcritical core design from [Sarotto, 2011](orange: 57 FAs, yellow: 7 IPS including the spallation unit, green: 6 control rods, white:3 safety rods, light blue: 36 inner dummy LBE assemblies, dark blue: 42 outer dummyYZrO assemblies, red circles: available positions for inserts from the top).
Figure 1.8: The MYRRHA-FASTEF fuel assembly design ©SCK•CEN.
25

1. Introduction
1.5.3 VENUS-F
During the GUINEVERE project, the VENUS facility, hosted at the SCK•CENsite in Mol (Belgium) was modified from the existing zero-power thermal water-moderated VENUS reactor towards the fast VENUS-F reactor. The GENEPI-3Caccelerator [Baylac et al., 2010], an updated version of the GENEPI-1 machinepreviously used for the MUSE experiments, was installed in a new acceleratorhall on top of the existing VENUS bunker. Deuterons accelerated to an energy of220 keV hit a Ti-Tritium target in the middle of the core, producing 14 MeV fusionneutrons. A picture of the updated VENUS facility (with additional acceleratorroom) is shown in Fig. 1.9 and 1.10.
Figure 1.9: The VENUS-F accelerator hall.
As the zero power VENUS-F reactor should be representative for a full scaleADS like MYRRHA, solid lead blocks are chosen as reactor material within theexisting VENUS vessel. The reactor design is almost symmetrical, as shown infigure 1.11. A detailed design of the VENUS-F reactor for the GUINEVERE projectis given in [Uyttenhove et al., 2009]. In the centre of the cylindrical reactor (withradius 80 cm and height 160 cm), a 12x12 grid is introduced, in which squareassemblies (width 8 cm) fit. This core grid will mainly be filled with lead andfuel assemblies (FAs), as well as with safety and control rods, and experimentalassemblies. Around the fuel, a 40 cm lead top and bottom reflector is foreseen, aswell as a radial reflector around the grid that fills the existing VENUS vessel.
The fuel assemblies for the first VENUS-F core, analysed in this thesis, are
26

1.5. The EFIT, MYRRHA and VENUS-F Reactor Designs
Figure 1.10: The VENUS-F reactor bunker.
Pb top reflector
Reactor core
Pb bottom reflector
Pb radial reflector
B4C safety rod with fuel follower
160
cm
Deuteron beam
Figure 1.11: The VENUS-F reactor design ©SCK•CEN.
27

1. Introduction
designed based on the experience from the MUSE project. The fuel rodlets aremade of metallic uranium 30 wt. % enriched in U-235, with a diameter of 1.27 cmand a height of 20.32 cm. Three of them are piled up in a 5x5 lattice filled withlead blocks and fuel rodlets, as shown in figure 1.12, in order to obtain an activefuel height of 60.96 cm, representative for the MYRRHA reactor design. The fuelis arranged in a symmetrical way in the 5x5 grid of the FA, so possible types of FAscan comprise 4,9,13 or 25 positions in the 5x5 grid. Above the active fuel part, thetop reflector is included in the fuel assembly in order to allow easy manipulationsinside the grid.
Pb top reflector
Active fuel height
Stainless steel casing
U rodlets
Pb elements
Pb plates
Figure 1.12: The VENUS-F fuel assembly design ©SCK•CEN.
The lead assemblies of the VENUS-F reactor are similar to the fuel assemblies,except for the active fuel part. In that zone, the complete 5x5 lattice is filled withlead elements.
6 safety rods are foreseen in a fixed position of the grid to cover any type ofreactivity insertion in the reactor. They have the same design as a fuel assembly,except for the top reflector, which is replaced by boron carbide (B4C). This design
28

1.6. Research Outline
leads to a double reactivity effect: inserting the safety rods implies not only anintroduction of neutron poison but also a removal of the fuel. Two control rodswith B4C inside the 12x12 grid can be introduced in the reactor for fine-tuningthe reactivity level.
Also different types of experimental assemblies can be loaded in the 12x12 grid.Thanks to this set-up a symmetrical and so-called ’clean’ and ’modular’ reactor isobtained, that is representative for a lead cooled ADS.
1.6 Research Outline
In this section, the PhD research question is motivated and described. Finally, thestructure of the thesis is presented.
1.6.1 Motivation for an Accurate Reactivity Monitoring System
The main goal of on-line subcriticality monitoring in ADS is to guarantee a suf-
ficient margin against criticality during all stages of operation of an ADS [NEA,2003]. From the other side, for full-power ADS, one strives for the highest keff levelfor economical reasons, i.e. to limit the required beam power (in eq. (1.1)) of theaccelerator.
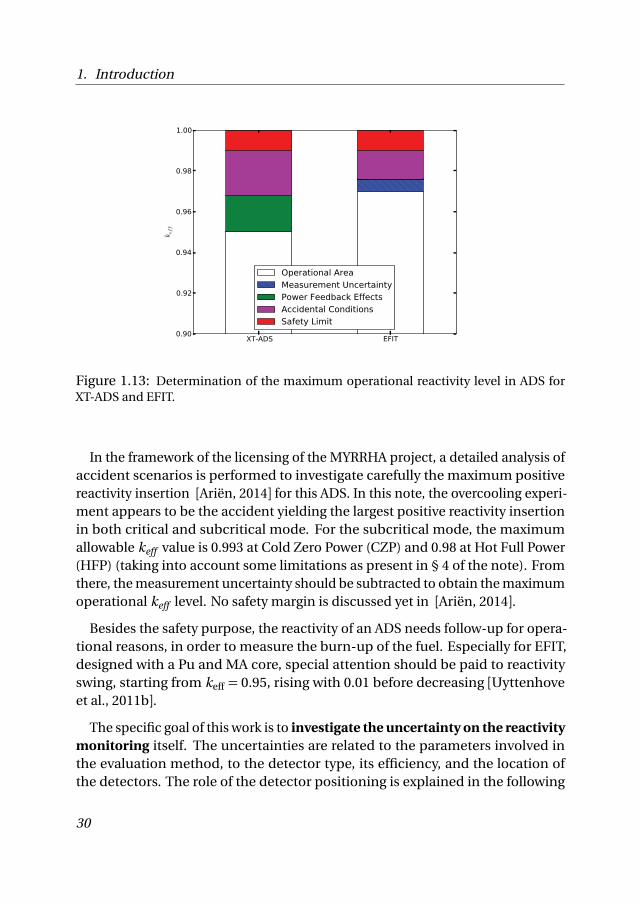
In this view, the reactivity impact of different accidental scenarios is estimated.The maximum (positive) reactivity insertion limits the upper value for keff of anADS. The maximum allowable keff level is also depending on the operationalmode of the installation. Power feedback effects induce a decrease in reactivityfor a temperature increase in the reactor. The elimination of this effect should betaken into account in the Cold Zero Power (CZP) operational phase.
Preliminary estimations of the maximum allowable subcriticality level weredone in the framework of the XT-ADS [Van den Eynde, 2009] and EFIT [Artioli et al.,2008] project. The results are shown in Fig. 1.13. A safety limit of 1000 pcm (percent mille, as in [Van den Eynde, 2009], value not motivated) is taken into accountfor the two designs. For XT-ADS an operational level for keff=0.95 is determinedwithout margin for monitoring uncertainty, whereas for EFIT, keff=0.97 is foreseenwith a 1000 pcm reactivity measurement uncertainty. The 1000 pcm remains areference target for subcriticality monitoring at zero-power ADS [Baeten et al.,2008].
29
1. Introduction
Figure 1.13: Determination of the maximum operational reactivity level in ADS forXT-ADS and EFIT.
In the framework of the licensing of the MYRRHA project, a detailed analysis ofaccident scenarios is performed to investigate carefully the maximum positivereactivity insertion [Ariën, 2014] for this ADS. In this note, the overcooling experi-ment appears to be the accident yielding the largest positive reactivity insertionin both critical and subcritical mode. For the subcritical mode, the maximumallowable keff value is 0.993 at Cold Zero Power (CZP) and 0.98 at Hot Full Power(HFP) (taking into account some limitations as present in § 4 of the note). Fromthere, the measurement uncertainty should be subtracted to obtain the maximumoperational keff level. No safety margin is discussed yet in [Ariën, 2014].
Besides the safety purpose, the reactivity of an ADS needs follow-up for opera-tional reasons, in order to measure the burn-up of the fuel. Especially for EFIT,designed with a Pu and MA core, special attention should be paid to reactivityswing, starting from keff = 0.95, rising with 0.01 before decreasing [Uyttenhoveet al., 2011b].
The specific goal of this work is to investigate the uncertainty on the reactivity
monitoring itself. The uncertainties are related to the parameters involved inthe evaluation method, to the detector type, its efficiency, and the location ofthe detectors. The role of the detector positioning is explained in the following
30

1.6. Research Outline
paragraphs.
1.6.2 Spatial Corrections on Subcriticality Measurement Results
All evaluation methods for the candidate reactivity measurement techniquespresented in § 1.3 are based on point kinetics and therefore only valid close tocriticality. Therefore, the reactivity values obtained by a measurement techniqueshould be corrected by so-called spatial correction factors (SCFs). The commonapproach during previous and ongoing experimental programmes includes simu-lations of the experiment by deterministic and probabilistic codes (see [Chevretet al., 2014; Marie et al., 2013; Dulla et al., 2014] for VENUS-F). These calculationsallow to obtain (precise) SCFs at specific detector locations. Moreover, someexperimental techniques are difficult to simulate by using probabilistic codes.
This work aims to understand the SCFs of the selected experimental techniquesfor a complete ADS reactor, not only for specific detector positions. Rather thancalculating SCFs precisely, it is important to know the behaviour of the SCFsduring the different operational phases of an ADS. Therefore, the SCFs for theevaluation methods of candidate experimental techniques are derived analyticallyvia static modal analysis. In this view, a static approach is chosen to simplify thedetermination of the SCF (see also § 1.3). By performing modal analysis of the SCFof the considered experimental techniques, the SCF behaviour can be understoodby studying the eigenmodes characteristics in an ADS. The understanding isvalidated by 3D simulations of the SCF for the selected experimental techniques.
A reactivity monitoring system for ADS should be robust. As a first step, ro-bust evaluation methods are selected in § 1.3.8. Secondly, the theory developedin this work aims to identify robust detector positions by means of a thorough
understanding of the SCF of the selected experimental techniques. Robust po-sitioning does not exclude spatial correction factors to be applied, but requiresdetector positions with a constant (or small change in) SCF during different phasesof operation of an ADS.
1.6.3 Validation of a Subcriticality Monitoring Methodology on aZero-Power ADS
In order to confirm the analytical development and simulation methods of the
SCFs for reactivity monitoring techniques, the different candidate measurementtechniques will be assessed on the VENUS-F ADS presented in § 1.5.3. Thanks to
31

1. Introduction
the modular character of the installation, different cores can be loaded. Moreover,the critical reference state allows to determine a ‘reference’ subcriticality levelvia an alternative methodology (see § 2.5) to evaluate the selected measurementtechniques.
Operational parameters are determined on VENUS-F for the different expe-rimental techniques (e.g. pulse frequency, beam interruption time, detectorspecifications, ...). Measurement uncertainties on the point kinetic reactivityvalues are derived. SCFs obtained by modal analysis and experiment simula-tions (made by the same calculational tool) are validated by measurement results.Thanks to the development of the SCFs for the complete ADS reactor, robust
detector positions and types are determined for different phases of operation
of a zero-power ADS.
1.6.4 Robustness of Subcriticality Monitoring for a Power ADS
As a final step to set up a monitoring methodology, an extrapolation towardsa demonstrator ADS (MYRRHA) is made. Different aspects proper to a reacti-
vity monitoring system for a demonstrator (power) ADS like MYRRHA are stu-died based on the methodology validated in the previous section. The abovementioned parameters of the selected experimental techniques are checked forMYRRHA. The effect of burn-up, inhomogeneous core loadings and accidentalconditions is investigated.
Finally, the outcome of this work presents an approach to a robust reactivitymonitoring system for ADS. Detector types and positions are selected for a powerADS, able to limit the uncertainty on the reactivity during normal operation, andable to identify possible incident scenarios.
1.6.5 Thesis Structure
The related reactor physics behind each selected monitoring technique is studiedby modal analysis in Chapter 2. In this chapter also the calculation tools are pre-sented. In Chapter 3, the analytical SCFs for the selected monitoring techniquesare validated by VENUS-F measurement results and completed by experimentsimulations. Chapter 4 deals with the extrapolation of the techniques towards ademonstrator power ADS (MYRRHA).
32

2SPATIAL EFFECTS
IN SUBCRITICALITY MONITORING
Whenever anyone says, ‘theoretically’, they really mean, ‘not really’.
Dave Parnass (1941-), Canadian computer scientist pioneer.
Picture: Lambda ©Sigfried Lundberg
33

2. Spatial Effects in Subcriticality Monitoring
The selected candidate methods (from § 1.3) for subcriticality monitoring (start-up, continuous monitoring, interim cross-checking) are under theoretical investi-gation in this chapter. Point kinetics evaluations of the monitoring techniquesneed to be corrected for the spatial variation of the flux in a subcritical core withan external neutron source. The physical understanding of the Spatial Correc-tion Factor (SCF) for each experimental method is indispensable to study robustsubcriticality monitoring.
In this chapter, the SCFs are determined analytically in terms of λ-modes,via static modal analysis by neutron diffusion theory. The motivation for staticmodal analysis is given in § 1.6.2. Moreover, the analytical approach allows afull understanding of SCFs, and the identification of the important contributingfactors to the SCF for each selected monitoring method.
In addition to the analysis of the selected measurement methods, the advantageof a reference critical state for subcriticality monitoring is presented, in orderto obtain an alternative ‘reference’ subcriticality level to validate the selectedtechniques. The spatial dependence of this alternative pathway is discussed. Atthe end of this chapter, the calculational tools are presented, which will be usedto perform a modal analysis and to simulate experiments in the next chapters.
2.1 Modal Analysis Approach
2.1.1 λ-Eigenmodes
The behaviour of a nuclear reactor is determined by the distribution of the neu-trons in the system as a function of time, space and energy. The prediction ofthis behaviour is obtained by solving the transport equation or Boltzmann equa-tion [Bell and Glasstone, 1985]. In steady state and presented in operator form,this equation becomes
(F − L )φ+S = 0 (2.1)
withφ the neutron flux, S the source strength, F the fission operator and L thetransport operator comprising neutron leakage, neutron collisions and neutronscattering as explained in § 1.1.
The λ-eigenvalue problem is set up by scaling the fission operator F with λ inthe homogeneous Boltzmann equation, i.e. (2.1) with S=0. Each eigenmode l of
34

2.1. Modal Analysis Approach
the flux is then associated with an eigenfunctionφl [Bell and Glasstone, 1970]
Lφl =λl Fφl (2.2)
The smallest eigenvalue λ1 is equal to the inverse of the effective multiplicationfactor keff .
The application of λ-mode analysis has been used for the modal study of insta-bilities in reactors, e.g. for oscillations typical for Boiling Water Reactors (BWRs).When calculating λ-modes for a BWR case [Verdu et al., 1994], a typical shape ofthe harmonics is obtained, as shown in Fig. 2.1. The first higher modes are twoazimuthal ones, followed by an axial mode and two azimuthal (so-called rotating)modes. In the following chapters, λ-mode analysis of he VENUS-F and MYRRHAsubcritical cores are performed, as motivated in § 2.1.3, in order to check thepattern of the mode shapes.
Figure 2.1: Typical 3-dimensional shapes of static spatial eigenfunctions for a criticalBWR reactor. [Verdu et al., 1994]
35

2. Spatial Effects in Subcriticality Monitoring
2.1.2 Reconstruction of a Subcritical Fixed Source System byλ-Modes Amplification
Static modal analysis can be applied to determine the amplification coefficientof each eigenfunction in order to reconstruct the full flux solution of a staticfixed source problem [Bell and Glasstone, 1970]. The outcome of this analysisallows determining the validity of a point kinetics approach, to distinguish im-portant modes contributing to the full solution and to determine the number ofmodes required to reconstruct the fixed source problem with a sufficient degreeof accuracy.
The general (i.e. time-dependent) modal expansion of the neutron flux is writ-ten as
φ(r , $Ω, E , t ) =∞(
l=1
Pl (t )φl (r , $Ω, E ) (2.3)
Pl (t ) is the amplification factor of mode l . An infinite number of modes is neededto reconstruct the full flux [Bell and Glasstone, 1970]. In its static form, Pl becomesa constant.
Between the modes there exists an orthogonality relationship, obtained bymultiplying the λ-eigenvalue problem (2.2) for mode l with the adjoint mode m
(indicated with the + sign):
(λl −λ+m )!φ+m , Fφl
"= 0 (2.4)
with
⟨X , Y ⟩=
#
4π
#
E
#
V
X (r , $Ω, E )Y (r , $Ω, E )d V d E d $Ω (2.5)
By introducing eq. (2.3) in the static transport equation (2.1) and multiplyingwith the adjoint eigenfunctionφ+m , one obtains the amplitude Pl for each mode:
Pl =−
!φ+l ,S"
(1− 1λl)!φ+l , Fψl
" (2.6)
with S the steady state neutron source density (n/cm3/s).
36

2.1. Modal Analysis Approach
In problems that are geometrically symmetric, often degenerate eigenvaluesshow up (λl=λm for l = m). In that case, more than one (mostly two, rarelythree) eigenfunction is associated to the same eigenmode. As a consequence, aset of equations needs to be solved to obtain the amplification factors. For twodegenerate modes l and m the system of equations becomes
)(1−λl )!φ+m , Fφl
"(1−λm )!φ+m , Fφm
"
(1−λl )!φ+l , Fφl
"(1−λm )!φ+l , Fφm
"*)
Pl
Pm
*=
)−!φ+m ,S"
−!φ+l ,S"*
(2.7)
The development of this theory on a basic example is shown in [Uyttenhove et al.,2012b].
2.1.3 Diffusion Theory to understand Spatial Dependence ofReactivity Measurement Techniques
The evaluation methods of experimental techniques for subcriticality measure-ments make use of point kinetics theory to obtain an expression for the reactivity.Therefore, one assumes that the flux can be represented by a single, called fun-damental, mode [Duderstadt and Hamilton, 1976]. In an ADS however, a localexternal neutron source is introduced in a subcritical core and many modes (so-called harmonics) are amplified to contribute to the total flux. When applyingpoint kinetics evaluation techniques, Spatial Correction Factors (SCFs) are neededto correct the obtained results [Dulla et al., 2005].
The choice of static evaluation methods for the selected experimental tech-niques is motivated in § 1.6.2. Moreover, when performing static modal analysis,analytical expressions for SCFs are obtained in the following sections for theconsidered evaluation methods for the experimental techniques, by means ofdiffusion theory. This approach allows a better understanding of the behaviour ofthe SCFs throughout subcritical cores of ADS, compared to SCFs determined byexperiment simulations. Diffusion calculations are chosen for the sake of compu-tational cost and availability of an appropriate software code for the purpose ofthis work (see § 2.6).
The approximations related to diffusion theory ( [Duderstadt and Hamilton,1976], 4.IV) and eigenmode calculations [Saracco et al., 2012] need to be evaluatedfor each case study. In the case of fast ADS systems, only the limitation on theflux gradient could hamper a proper interpretation of calculational results close
37

2. Spatial Effects in Subcriticality Monitoring
to large flux gradients (control rods, neutron source,...). Several mean free pathsaway from any sources or boundaries (in a weakly absorbing medium), the fluxis slowly varying in space and the diffusion theory is valid. In this work however,one aims to understand the spatial dependence in ADS cores to check robustnessof detector positions, rather than determining precise correction factors. For thelatter purpose, probabilistic software codes are more appropriate.
2.2 Start-up Reactivity Monitoring Techniques
2.2.1 The Area Method Evaluation of the Pulsed Neutron SourceTechnique
The area method (also called Sjöstrand method) [Sjöstrand, 1956] is a static eva-luation for subcriticality measurements by means of a Pulsed Neutron Source(PNS), presented in § 1.3.1. It states that the reactivity of a subcritical systemdriven by a pulse train of external source neutrons, can be estimated by the ratioof two areas in the decay of the neutron density (or proportional detector signal)after a pulse, as shown in eq. (1.9) and Fig. 1.2.
In order to derive the area ratio by point kinetics, the time dependent behaviourof the homogeneous point kinetics equations for neutron density n (t ) and precur-sor density C (t ) is derived via basic reactor theory and Laplace transformation
(assuming|ρ−β |Λ>>λ):
n (t ) = A1e s1t +A2e s2t (2.8)
C (t ) = A1β
Λ(s1+λ)e s1t +A2
β
Λ(s2+λ)e s2t (2.9)
with Λ the neutron generation time (s), λ the average decay constant of the pre-cursors (1/s), and
s1 =ρ−β
Λ(2.10)
s2 =ρλ
ρ−β(2.11)
38
2.2. Start-up Reactivity Monitoring Techniques
The coefficients A1 and A2 are determined via the initial conditions at t=0. Sup-pose at t=0 a Dirac pulse from an external neutron source with strength S (n/s)in a subcritical medium with C (0)=0, then the neutron density is given by [Baetenet al., 2006]1
n (t ) = S
)eρ−βΛ
t +λβΛ
(ρ−β )2e−ρλρ−β t
*(2.12)
The theory can be easily expanded towards more groups of delayed neutrons.For clarity, only one family of delayed neutrons is shown in eq. (2.12). One candistinguish the prompt and delayed contribution to the neutron density via thedifferent exponential constants.
The area method however is only valid when the asymptotic precursor concen-tration is reached, i.e. after (tens of) thousands of pulses with pulse period T . Inthat case
C (0) =−Sβ
ρλT(2.13)
In [Baeten et al., 2006] the derivation of the neutron density is performed for aninfinite pulse train
&∞n=0δ(t −nT )S :
n (t ) = S
)eρ−βΛ
t +βΛ
(ρ−β )ρTe−ρλρ−β t
*(2.14)
At t = 0 the neutron density is slightly higher than S due to the delayed neutroncontribution from the second term in eq. (2.14). When integrating (2.14) overthe period T and separating the prompt from the delayed contribution, (1.9) isobtained, as [Baeten et al., 2006]
Ap =ΛS
(ρ−β )T(2.15)
Ad =SβΛ
(ρ−β )ρT(2.16)
1At t=0 the second term in eq. (2.12) can be neglected.
39

2. Spatial Effects in Subcriticality Monitoring
2.2.2 Modal Analysis of the SCF for the Area Method
Definition of SCFarea
In this work, SCFs will be applied on reactivity values obtained by point kinetics,in order to obtain a credible estimation of the reactivity at different locations in asubcritical core. They will depend on the reactivity level, the fuel burn-up, thedetector type used for the measurements, etc. In this section, the SCF for the areaevaluation of the PNS experiment is defined as
SCFarea(r ) =
Ap (r )
Ad (r )ρref
β
(2.17)
withρref the reference ‘true’ reactivity value (in $, see § 2.5), Ap and Ad the detectorcounts during a pulse at a detector location, associated to prompt and delayedneutrons, as in eq. (1.9).
Derivation of SCFarea
In Appendix III of [Sjöstrand, 1956] the modal analysis of SCFarea is determined viaage theory for a one energy group case in a homogeneous core. In this paragraph, ageneral multigroup area (Sjöstrand) correction factor is derived via modal analysisand diffusion theory, with one lumped family of precursors.
The diffusion equation for total flux and precursor density is written as (notationas in [Duderstadt and Hamilton, 1976])
1
v
∂ φ(r , E , t )
∂ t=
∇.D (r , E )∇φ(r , E , t )−Σt (r , E )φ(r , E , t ) +
# ∞
0
Σs (r , E ′ → E )φ(r , E ′, t )d E ′
+χp (E )
# ∞
0
(1−β )ν(E ′)Σ f (r , E ′)φ(r , E ′, t )d E ′+χd (E )λC (r , t ) +S (r , E , t )
(2.18)
∂ C (r , t )
∂ t=β
# ∞
0
ν(E )Σ f (r , E )φ(r , E , t )d E −λC (r , t ) (2.19)
40

2.2. Start-up Reactivity Monitoring Techniques
Assuming the precursor density constant during the pulse, C (r ) corresponds to afixed source problem with constant neutron source strength S
T :
C (r ) =β
λ
# ∞
0
ν(E )Σ f (r , E )φ(r , E , t )d E (2.20)
As the integral of the flux over the pulse is required to determine the promptand delayed areas, we introduce eq. (2.20) in eq. (2.18) and integrate over a timeinterval T . Moreover, as for the PNS experiment evaluation,φ(t = T )≡φ(t = 0),
# T
0
1
v
∂ φ(r , E , t )
∂ td t =
1
v
+φ(t = T )−φ(t = 0)
,= 0=
# T
0
∇.D (r , E )∇φ(r , E , t )d t
−Σt (r , E )
# T
0
φ(r , E , t )d t +
# T
0
# ∞
0
Σs (r , E ′ → E )φ(r , E ′, t )d E ′d t
+χ (E )
# T
0
# ∞
0
ν(E ′)Σ f (r , E ′)φ(r , E ′, t )d E ′d t +
# T
0
S (r , E , t )d t (2.21)
with χ (E ) =χp (E )(1−β ) +χd (E )β .
When performing a modal expansion of the neutron flux:
φ(r , E , t ) =∞(
n=1
Pn (t )φn (r , E ) (2.22)
the k -eigenmodes (kn=1λn
) are the solution of the homogeneous steady statesolution of eq. (2.18):
∇.D (r , E )∇φn (r , E )−Σt (r , E )φn (r , E ) +
# ∞
0
Σs (r , E ′ → E )φn (r , E ′)d E ′
+χ (E )
kn
# ∞
0
ν(E ′)Σ f (r , E ′)φn (r , E ′)d E ′ = 0 (2.23)
Substituting the eigenmode expression for∇.D (r , E )∇φn (r , E ) in eq. (2.21) yields:
41

2. Spatial Effects in Subcriticality Monitoring
∞(
n=1
# T
0
Pn (t )d tχ (E )1−kn
kn
# ∞
0
ν(E ′)Σ f (E′)φn (r , E ′)d E ′ =
# T
0
S (r , E , t )d t
(2.24)
In order to obtain an expression for' T
0Pn (t )d t , we multiply both sides by the
adjoint functionφ+m (r , E ) and apply the orthogonality relationship (2.4). Then,supposing no degenerate eigenvalues,
# T
0
Pn (t )d t =kn
1−kn
-φ+n (r , E ),' T
0S (r , E , t )d t.
/φ+n (r , E ),χ (E )'∞
0ν(E ′)Σ f (E ′)φn (r , E ′)d E ′
0 (2.25)
with the meaning of the brackets ⟨⟩ as explained in eq. (2.5).
The total area under the pulse can then be written as
At (r ) =∞(
n=1
# T
0
Pn (t )d t
# ∞
0
Σd (E )φn (r , E )d E =
∞(
n=1
kn
1−kn
-φ+n (r , E ),' T
0S (r , E , t )d t.
/φ+n (r , E ),χ (E )'∞
0ν(E ′)Σ f (E ′)φn (r , E ′)d E ′
0# ∞
0
Σd (E )φn (r , E )d E
(2.26)
with Σd the macroscopic cross section for the detector of interest. In order toinvestigate the spatial dependence of the complete core for the area method, Σd
is independent of its position.
In a similar way, the expansion coefficient' T
0Pn ,p (t )d t related to the prompt
eigenvalue problem can be calculated. Therefore, the fission operator F in (2.1)is modified towards its prompt equivalent Fp . This corresponds to a replacementof χ (E ) by (1−β )χp (E ) in eq. (2.21). Then
42

2.2. Start-up Reactivity Monitoring Techniques
Ap (r ) =∞(
n=1
kn ,p
1− (1−β )kn ,p
-φ+n ,p (r , E ),' T
0S (r , E , t )d t.
/φ+n ,p (r , E ),χp (E )
'∞0ν(E ′)Σ f (E ′)φn ,p (r , E ′)d E ′
0
# ∞
0
Σd (E )φn ,p (r , E )d E (2.27)
The area ratio can now be determined via
Ap (r )
Ad (r )=
Ap (r )
At (r )−Ap (r )(2.28)
φn (r , E ) is the solution of eq. (2.23), and φn ,p (r , E ) is the solution of the sameequation with χ (E ) replaced by χp (E ). Therefore, one can suppose
-φ+n (r , E ),' T
0S (r , E , t )d t.
/φ+n (r , E ),χ (E )'∞
0ν(E ′)Σ f (E ′)φn (r , E ′)d E ′
0 ∼=
-φ+n ,p (r , E ),' T
0S (r , E , t )d t.
/φ+n ,p (r , E ),χp (E )
'∞0ν(E ′)Σ f (E ′)φn ,p (r , E ′)d E ′
0
(2.29)
as both eigenfunctions appear as a ratio in this formula. By a similar reasoning,kn ,p=(1-β )kn can be replaced by kn when introducing eq. (2.26) and (2.27) in eq.(2.28), as for mode n
kn ,p
1−(1−β )kn ,p
kn1−kn−
kn ,p
1−(1−β )kn ,p
∼=
kn1−(1−β )kn
kn1−kn− kn
1−(1−β )kn
(2.30)
Then
Ap (r )
Ad (r )=
&∞n=1
kn1−(1−β )kn
In
'∞0Σd (E )φn (r , E )d E
&∞n=1
kn(1−(1−β )kn )
βkn
1−knIn
'∞0Σd (E )φn (r , E )d E
(2.31)
via eq. (2.28), with
43

2. Spatial Effects in Subcriticality Monitoring
In =
-φ+n (r , E ),' T
0S (r , E , t )d t.
/φ+n (r , E ),χ (E )'∞
0ν(E ′)Σ f (E ′)φn (r , E ′)d E ′
0 (2.32)
In order to identify the SCF for the area method, n = 1 is separated from thesummation in eq. (2.31) and, according to eq. (2.17)
Ap (r )
Ad (r )=−ρ
βSCFarea =
−ρ
β
1+&∞
n=2
In (1−(1−β )k1)kn
'∞0Σd (E )φn (r ,E )d E
I1(1−(1−β )kn )k1
'∞0Σd (E )φ1(r ,E )d E
1+&∞
n=2
In k 2n (1−(1−β )k1)(1−k1)
'∞0Σd (E )φn (r ,E )d E
I1k 21 (1−(1−β )kn )(1−kn )
'∞0Σd (E )φ1(r ,E )d E
(2.33)
with ρ = k1−1k1
the reactivity. Then
SCFarea(r ) =
1+&∞
n=2
In (1−(1−β )k1)kn
'∞0Σd (E )φn (r ,E )d E
I1(1−(1−β )kn )k1
'∞0Σd (E )φ1(r ,E )d E
1+&∞
n=2
In k 2n (1−(1−β )k1)(1−k1)
'∞0Σd (E )φn (r ,E )d E
I1k 21 (1−(1−β )kn )(1−kn )
'∞0Σd (E )φ1(r ,E )d E
(2.34)
Analysis
In order to understand the behaviour of SCFarea in an ADS core, the parametersthat contribute to the area method SCF in eq. (2.34) require further attention. Firstof all, it is important to note the similarity between numerator and denominator ineq. (2.34). The only difference is inside the k -eigenvalue ratio. As β << 1, one canreduce this factor to kn (1−k1)
k1(1−kn )in the numerator and (kn (1−k1)
k1(1−kn ))2 in the denominator.
This ratio is positive in both numerator and denominator, however the influenceof this factor on the SCF is dominated by the term in the denominator.
If the neutron source of the ADS is positioned in the centre of the core, modesthat obtain a maximum in the centre of the core are highly amplified (representedby a high numerator in eq. (2.32)). Moreover, the factor kn (1−k1)
k1(1−kn )is exponentially
decreasing for ADS (e.g. see Fig. 3.16), so higher order modes are reduced by thisfactor. Therefore, one could assume that close to the zeros of the first higher ordermodes with a maximum in the centre, the spatial correction factor should be closeto unity. At these locations the contribution of the most important modes (exceptfrom the fundamental one) to the SCF is extinguished.
44

2.2. Start-up Reactivity Monitoring Techniques
This location is not necessarily a suitable detector location, but provides va-luable information about the boundary between SCF < 1 (safe overestimation ofthe keff level) and SCF > 1 (unsafe underestimation of the keff level). Criteria forrobust detector positioning are developed in the next chapters of this thesis.
2.2.3 The Integrated Source Jerk Method
An alternative calibration method for the initial subcriticality level determinationin ADS could be the Integrated Source Jerk (ISJ) method, presented in § 1.3.2. TheISJ method allows determining the reactivity value (in $) of a subcritical core byanalysing the neutron decay after stopping the external neutron source (i.e. theaccelerator beam in an ADS) until complete dying out of the neutron population,according to eq. (1.11).
The ISJ evaluation method makes use of inverse point kinetics theory to obtainthe expression (1.11) for the reactivity. Therefore, as for the area method, spatialcorrections need to be investigated to improve the point kinetic estimation. Giventhe nature of the method, the spatial correction for the ISJ method can be differentfrom the one for the PNS area method, influencing the applicability of the ISJmethod for calibration purposes.
2.2.4 Modal Analysis of the SCF for the ISJ Method
Definition of SCFISJ
The definition of SCFISJ is similar to the one of SCFarea:
SCFISJ (r ) =β
ρref
'∞0Σd (E )φ(r , E , 0)d E
&qi=1
aiλi'∞
0
'∞0Σd (E )φ(r , E , t )d E d t
(2.35)
with ρref the reference ‘true’ reactivity value (in $, see § 2.5),φ(r , E , 0) the flux attime ‘0’ (corresponding to the stable state before interruption of the beam) and q
the number of precursor groups.
Derivation of SCFISJ
The steady state fluxφ(r , E ,0) and precursor density C (r ,0) before beam inter-ruption are derived from the diffusion equation (2.18) and (2.19). By integra-ting over the time period after the beam stop, i.e. from t=0 s to t=∞, withφ(r , E ,∞)=C (r ,∞)=0
45

2. Spatial Effects in Subcriticality Monitoring
−φ(r , E , 0)
v=
# ∞
0
1∇.D (r , E )∇φ(r , E , t )−Σt (r , E )φ(r , E , t )
+
# ∞
0
Σs (r , E ′ → E )φ(r , E ′, t )d E ′
+χp (E )
# ∞
0
(1−β )ν(E ′)Σ f (r , E ′)φ(r , E ′, t )d E ′2d t +χd (E )λ
# ∞
0
C (r , t )d t
(2.36)
−C (r , 0) = β
# ∞
0
# ∞
0
ν(E )Σ f (r , E )φ(r , E , t )d E d t −λ
# ∞
0
C (r , t )d t (2.37)
The initial flux just at beam interruption time becomes
φ(r , E , 0)
v= n (r , E , 0) =
# ∞
0
−1∇.D (r , E )∇φ(r , E , t )−Σt (r , E )φ(r , E , t )+
# ∞
0
Σs (r , E ′ → E )φ(r , E ′, t )d E ′
+χ (E )
# ∞
0
ν(E ′)Σ f (r , E ′)φ(r , E ′, t )d E ′2d t −χd (E )C (r , 0) (2.38)
with n (r , E , 0) the steady state neutron density before beam interruption. Equa-tion (2.38) is expanded to
n (r , E , 0) =−∞(
n=1
# ∞
0
Pn (t )d t1∇.D (r , E )∇φn (r , E )−Σt (r , E )φn (r , E )
+
# ∞
0
Σs (r , E ′ → E )φn (r , E ′)d E ′+χ (E )
# ∞
0
ν(E ′)Σ f (r , E ′)φn (r , E ′)d E ′2−χd (E )C (r , 0)
(2.39)
Now, the homogeneous steady state diffusion equation (2.23) is used to intro-duce the eigenmodes of the system in equation (2.39). In order to determine
46

2.2. Start-up Reactivity Monitoring Techniques
'∞0
Pn (t )d t , the summation is eliminated by making use of the orthogonalityrelationship (2.4) between the eigenfunctions. Therefore, from the previous equa-tion,
# ∞
0
Pn (t )d t =1
ρn
−!φ+n (r , E ), n (r , E , 0) +χd (E )C (r , 0)
"
/φ+n (r , E ),χ (E )'∞
0ν(E ′)Σ f (E ′)φn (r , E ′)d E ′
0 =Rn
ρn(2.40)
with
Rn =−
!φ+n (r , E ), n (r , E , 0) +χd (E )C (r , 0)
"
/φ+n (r , E ),χ (E )'∞
0ν(E ′)Σ f (E ′)φn (r , E ′)d E ′
0 (2.41)
Using the definition eq. (2.35), SCFISJ becomes
SCFISJ =β
ρ
q(
i=1
ai
λi
&∞n=1 Pn (0)'∞
0Σd (E )φn (r , E )d E
&∞n=1
'∞0
Pn (t )d t'∞
0Σd (E )φn (r , E )d E
(2.42)
Via (2.40) one gets
SCFISJ =βq(
i=1
ai
λi
3P1(0)'∞
0Σd (E )φ1(r , E )d E +
&∞n=2 Pn (0)'∞
0Σd (E )φn (r , E )d E
R1
'∞0Σd (E )φ1(r , E )d E +
&∞n=2 Rn
ρ1ρn
'∞0Σd (E )φn (r , E )d E
4
(2.43)or finally
SCFISJ =βq(
i=1
ai
λi
P1(0) +&∞
n=2 Pn (0)
'∞0Σd (E )φn (r ,E )d E'∞
0Σd (E )φ1(r ,E )d E
R1+&∞
n=2 Rnρ1ρn
'∞0Σd (E )φn (r ,E )d E'∞
0Σd (E )φ1(r ,E )d E
(2.44)
When simplifying this equation to point kinetics, one neglects the first termin the numerator of eq. (2.41). This is also done to obtain the point kinetics eq.(1.11). Indeed, as before interruption of the beam, via point kinetics,
C (0) =βn (0)
Λλ(2.45)
47

2. Spatial Effects in Subcriticality Monitoring
one notices that C (0) exceeds many times n (0). Therefore, by making the sameassumption in eq. (2.41) using point kinetics
R1 =C (0)
νΣ f φ1=
1
νΣ f
keffβ
λl
P1(0)φ1
v(2.46)
and with one group of precursors for simplification, one gets, as the summationsdisappears in equation (2.44)
SCFISJ =β
λ
P1(0)
R1= 1 (2.47)
as expected.
Analysis
SCFISJ is more complex to analyse than SCFarea. The factor is determined by twoterms (P1(0) and R1) linked to the fundamental mode, and two summations withhigher modes that are related to the spatial correction. Terms with a high amplifi-cation Pn (0), i.e. with a maximum in the centre of the ADS core, will contributesignificantly to SCFISJ . Therefore, the spatial correction factor will be closer tounity at positions where these modes have zero crossings, as for SCFarea. Secondly,the denominator summation will be reduced for higher modes, as
ρ1ρn
decreaseswith increasing mode number.
2.3 The Current-To-Flux Reactivity Monitor
2.3.1 Point Kinetics Analysis
By monitoring the ratio of the beam current and the flux level of an ADS usinga continuous accelerator current, one can evaluate the reactivity by using therelation (1.14). This formula can easily be derived from point kinetics [Duder-stadt and Hamilton, 1976]. The proportionality coefficient c can be defined in adifferent way, taking into account the measurement methods for S and φ. Therelationship between current and flux only remains valid when c does not vary asa function of time, i.e. when there is no variation of spatial dependence in time,when the source neutron production does not vary, etc. This section provides adeeper insight into the proportionality between beam current and neutron flux,taking into account the spatial dependence by modal analysis.
48

2.3. The Current-To-Flux Reactivity Monitor
2.3.2 Modal Analysis of the SCF for the CTF Method
Definition of SCFCTF
As alternative to the CTF coefficient in point kinetics, the SCF for the CTF reactivityratio between the two states in the monitoring process is defined as
SCFCTF =
ρ′C T FρC T F
ρ′r e f
ρr e f
(2.48)
with the original known (calibrated) state indicated without prime, and the actualstate with prime. ρ(’)CTF is the reactivity obtained via the CTF monitor in (seeeq. (1.14)), and ρ(’)ref is the ‘true’ reactivity obtained via another reference tech-nique such as the PNS method at the original state, or an interim cross-checkingtechnique such as the beam trip method at the actual state. In point kineticsequivalent, SCFCTF corresponds to c
c ′ .
Derivation of SCFCTF
In order to identify the spatial dependence in the CTF relationship, we start - si-milar to the PNS SCF determination - from the stationary homogeneous diffusionequation in which the eigenmodes are introduced, i.e. eq. (2.23). By replacingthe flux Laplacian in the stationary diffusion equation with eliminated precursorterm (from eq. (2.18) and (2.19)) by the stationary eigenfunction expansion fromeq. (2.22) one finds
∞(
n=1
Pn
5Σt (r , E )φn (r , E )−
# ∞
0
Σs (r , E ′ → E )φn (r , E ′)d E ′
−χ (E )
kn
# ∞
0
ν(E ′)Σ f (r , E ′)φn (r , E ′)d E ′6−Σt (r , E )
∞(
n=1
Pnφn (r , E )
+
∞(
n=1
# ∞
0
Σs (r , E ′ → E )φn (r , E ′)d E ′+χ (E )∞(
n=1
Pn
# ∞
0
ν(E ′)Σ f (r , E ′)φn (r , E ′)d E ′
+S (r , E ) = 0
or
49

2. Spatial Effects in Subcriticality Monitoring
∞(
n=1
Pn1−kn
knχ (E )
# ∞
0
ν(E ′)Σ f (r , E ′)φn (r , E ′)d E ′ = S (r , E ) (2.49)
Similar to the derivation of the SCF for the area method, an expression for Pn isderived via a multiplication with the adjoint functionφ+n (r , E ) and application ofthe orthogonality relationship (2.4). Therefore, from (2.49)
Sn =−ρn I f ,n Pn (2.50)
with
Sn =!φ∗n (r , E ),S (r, E )
"(2.51)
I f ,n =
7
φ∗n (r , E ),χ (E )
# ∞
0
ν(E ′)Σ f (E′)φn (r , E ′)d E ′8
(2.52)
Therefore, the ratio for the change in flux between the two monitoring states iswritten as
&∞n=1 P
′
nφ′
n (r , E )&∞
n=1 Pnφn (r , E )=
&∞n=1
S′
nφ′
n (r ,E )
ρ′n I′f ,n
&∞n=1
Snφn (r ,E )ρn I f ,n
=ρ1
ρ′1
1+&∞
n=2
S′
n I′
f ,1ρ′
1φ′
n (r ,E )
S′1 I′f ,nρ
′nφ′1(r ,E )
S1I′f ,1φ1(r ,E )
S′1 I f ,1φ
′1(r ,E )
+&∞
n=2
Sn I′f ,1ρ1φn (r ,E )
S′1 I f ,nρnφ
′1(r ,E )
(2.53)
The modal SCFCTF becomes, via eq. (2.48),
SCFCTF =S ′
S
&∞n=1 Pn
'∞0Σd (E )φn (r ,E )d E
&∞n=1 P
′n
'∞0Σd (E )φ
′n (r ,E )d E
ρ′(1)
ρ(1)
=S ′
S
S1I′
f ,1
'∞0Σd (E )φ1(r ,E )d E
S′1 I f ,1
'∞0Σd (E )φ
′1(r ,E )d E
+&∞
n=2
Sn I′
f ,1ρ1
'∞0Σd (E )φn (r ,E )d E
S′1 I f ,nρn
'∞0Σd (E )φ
′1(r ,E )d E
1+&∞
n=2
S′n I′f ,1ρ′1
'∞0Σd (E )φ
′n (r ,E )d E
S′1 I′f ,nρ
′n
'∞0Σd (E )φ
′1(r ,E )d E
(2.54)
50

2.4. The Source Jerk Interim Reactivity Cross-Checking Method
When the beam current is not changed between the two states, S=S ′ and eq.(2.54) becomes
SCFCTF =
&∞n=1 Pn
'∞0Σd (E )φn (r ,E )d E
&∞n=1 P
′n
'∞0Σd (E )φ
′n (r ,E )d E
ρ′(1)
ρ(1)
=
S1I′
f ,1
'∞0Σd (E )φ1(r ,E )d E
S′1 I f ,1
'∞0Σd (E )φ
′1(r ,E )d E
+&∞
n=2
Sn I′
f ,1ρ1
'∞0Σd (E )φn (r ,E )d E
S′1 I f ,nρn
'∞0Σd (E )φ
′1(r ,E )d E
1+&∞
n=2
S′n I′f ,1ρ′1
'∞0Σd (E )φ
′n (r ,E )d E
S′1 I′f ,nρ
′n
'∞0Σd (E )φ
′1(r ,E )d E
(2.55)
Please note that Sn can differ from S ′n for S=S ′ if e.g. the beam position changesbetween the actual (indicated with prime) state and the original (indicated withoutprime) state.
Analysis
When comparing SCFCTF to SCFarea from eq. (2.34), one notices a dedicatedterm in the nominator, different from 1, due to the difference in fundamentalmode between the original and the perturbed case. Only a slight difference infundamental mode shape between the original and perturbed case can causea SCF different from 1 as starting point. Moreover, similar to SCFPNS, modes
that obtain a maximum in the centre of the core will be amplified (high S (′)nS (′)1
factor). One also notices the decreasing contribution of higher modes due to thedecreasing factor
ρ1ρn
.
2.4 The Source Jerk Interim Reactivity Cross-Checking
Method
2.4.1 Point Kinetics Evaluation
The standard Source Jerk (SJ) method ( [Ott and Neuhold, 1985], section 9.3) eva-luates the repetitive fast removal of a neutron source out of an initially stationarysubcritical medium. In the case of ADS operation, the accelerator beam is in-terrupted. Contrary to the Integrated Source Jerk (ISJ) method from § 2.2.3, thebeam is restored quickly in order to avoid thermal stresses in the ADS. The beam
51

2. Spatial Effects in Subcriticality Monitoring
interruption should however be long enough to identify the prompt neutron decay(order of microseconds). The period of the source jerk comprises also the timeneeded for the beam to obtain its original level (in the order of milliseconds).
Before the removal of the source (state ‘0’ at t=0 s), the neutron and precursorpopulation are given by
n0 =ΛS
−ρ(2.56)
C0 =βn0
Λλ(2.57)
with S the average source strength in equilibrium conditions, andλ the one-groupprecursor decay constant.
In order to obtain an expression for the absolute reactivity level, the evolutionof the neutron density n (t ) directly after a beam stop (supposing a constantprecursor level) is given by
n (t ) =
)ΛS
−ρ+β
ρ−βn0
*eρ−βΛ
t −β
ρ−βn0 (2.58)
After the dying out of the prompt neutrons (state ‘1’) the neutron density isgiven by
n1 =−β
ρ−βn0 (2.59)
Therefore, by using the detector count rates at the two states ‘0’ and ‘1’, expression(1.12) for the reactivity is found
ρ
β=
n1−n0
n1(2.60)
2.4.2 Modal Analysis
Definition of SCFSJ
Similar to the definition of the other reactivity measurement SCFs, the definitionof SCFSJ is given by the difference between the measured reactivity via (1.12) and
52

2.4. The Source Jerk Interim Reactivity Cross-Checking Method
the reference reactivity (in $)
SCFSJ (r ) =1
ρref
'∞0Σd (E )φ0(r , E )d E −
'∞0Σd (E )φ1(r , E )d E
'∞0Σd (E )φ1(r , E )d E
(2.61)
Determination SCFSJ
For the determination of SCFSJ , the precursor concentration will be kept constant,as only the first microseconds after a beam stop are considered. Therefore, usingequations (2.18) and (2.19) after elimination of the neutron source one gets
1
v
∂ φ(r , E , t )
∂ t=∇.D (r , E )∇φ(r , E , t )−Σt (r , E )φ(r , E , t )
+
# ∞
0
Σs (r , E ′ → E )φ(r , E ′, t )d E ′+χp (E )(1−β )
# ∞
0
ν(E ′)Σ f (r , E ′)φ(r , E ′, t )d E ′
+χd (E )β
# ∞
0
ν(E ′)Σ f (r , E ′)φ(r , E ′, 0)d E ′ (2.62)
By expanding the flux in eigenfunctions, and introducing the eigenmodes via(2.23)
1
v
∞(
n=1
d Pn (t )
d tφn (r , E ) =
∞(
n=1
Pn (t )
)χp (E )(1−β )−
χ (E )
kn
*# ∞
0
ν(E ′)Σ f (r , E ′)φn (r , E ′)d E ′
+
∞(
n=1
Pn (0)χd (E )β
# ∞
0
ν(E ′)Σ f (r , E ′)φn (r , E ′)d E ′ (2.63)
By multiplying with the adjoint eigenfunction and applying the biorthogonalrelationship (2.4) one can write
d Pn (t )
d t= An Pn (t ) +Bn (2.64)
with
53

2. Spatial Effects in Subcriticality Monitoring
An =
-φ+n (r , E ),9χp (E )(1−β )−
χ (E )kn
:'∞0ν(E ′)Σ f (E
′)φn (r , E ′)d E ′.
/φ+n (r , E ), 1
vφn (r , E )0 (2.65)
Bn =
/φ+n (r , E ),χd (E )βPn (0)
'∞0ν(E ′)Σ f (E
′)φn (r , E ′)d E ′0
/φ+n (r , E ) 1
vφn (r , E )0 (2.66)
Then the initial flux conditions are used to determine the behaviour of theamplification coefficient Pn (t ) as a function of time
Pn (t ) = (Pn (0) +Bn
An)e An t −
Bn
An(2.67)
Finally, for the definition of state ‘1’ in the SCF, the exponential in eq. (2.67)disappears. Expanding the point kinetics evaluation (1.12) of the dollar reactivitytowards full fluxes, one gets
&∞n=1(Pn (0) +
BnAn)'∞
0Σd (E )φn (r , E )d E
&∞n=1
BnAn
'∞0Σd (E )φn (r , E )d E
(2.68)
and, with
χ (E ) = (1−β )χp (E ) +βχd (E ) (2.69)
the separation of n=1 and isolation ofβρ(1)
leads to
SCFSJ =
1+&∞
n=2ρnρ1
Pn (0)P1(0)
InI1
J1Jn
'∞0Σd (E )φn (r ,E )d E'∞
0Σd (E )φ1(r ,E )d E
L1J1+&∞
n=2Pn (0)P1(0)
KnI1
J1Jn
'∞0Σd (E )φn (r ,E )d E'∞
0Σd (E )φ1(r ,E )d E
(2.70)
with
54

2.5. Obtaining a Reference Subcriticality Level
In =
7
φ+n (r , E ),χ (E )
# ∞
0
ν(E ′)Σ f (E′)φn (r , E ′)d E ′8
(2.71)
Jn =
7
φ+n (r , E ), (χp (E )(1−β )−χ (E )
kn)
# ∞
0
ν(E ′)Σ f (E′)φn (r , E ′)d E ′8
(2.72)
Kn =
7
φ+n (r , E ),χd (E )
# ∞
0
ν(E ′)Σ f (E′)φn (r , E ′)d E ′8
(2.73)
Analysis
The SCFSJ has a similar form as the SCFarea in (eq. 2.34), although the scalingintegrals are a little more complicated. The same tendency can be seen in boththe numerator and the denominator. When assuming χp (E )≈χ (E ), the term
ρnρ1
and all related integrals disappear in the second term of the numerator, andρ1ρn
is created in the second term of the denominator. Therefore, the contributionof higher modes to the SCF is reduced by the increasing denominator term forhigher modes.
For an ADS with a neutron source in the centre of the core, one could (as for thePNS area method) again assume that close to the zeros of the higher order modeswith n low and a maximum in the centre, the SCF should be close to unity.
2.5 Obtaining a Reference Subcriticality Level
In order to validate the candidate experimental techniques for subcriticality mea-surements, it is recommended to have a (zero-power) test facility at a well-knownreference subcriticality level. The methodology to obtain a reference subcriticalitylevel is explained in § 2 of [Uyttenhove et al., 2011a].
First a critical reference state is required. In this state the so-called rod dropexperiment ( [Ott and Neuhold, 1985], section 9-3C) is performed to obtain a slightsubcritical state. Then the Modified Source Multiplication (MSM) method [Blaiseet al., 2011] is applied to link the slightly subcritical state to any other subcriticallevel.
55

2. Spatial Effects in Subcriticality Monitoring
2.5.1 Rod Drop Technique
The rod drop technique is based on the rapid insertion of a control rod (in this casefrom a critical state). The subsequent time evolution of the neutron population isrecorded and the reactivity is derived by the inverse point-kinetics method [Souleet al., 2004; Mellier, 2005]:
ρ(t ) = β +Λd
dt
+ln(n (t ),−λβ
# t
0
n (t ′)
n (t )e −λ(t−t ′)d t ′ −Λ
s (t )
n (t )(2.74)
with n (t ) the neutron density (n/cm3), s (t ) the source strength (n/s), β and λ theeffective delayed neutron fraction and the corresponding decay constant (1/s),and Λ the neutron generation time (s).
For fast reactors with a very short generation time, the expression above canbe simplified using micro kinetics (i.e. the study of the time dependencies of theaverage fission chains, see [Ott and Neuhold, 1985], Chapter 7). The result for thereactivity in $, for clarity shown for one group of precursors, becomes [Klooster-man et al., 2002]
ρ(t )
β=
1
n (t )
;
n (t ) +n0
<
e −λt −λ
# t
0
n (t ′)e −λ(t−t ′)d t ′=>
(2.75)
Using this expression, the reactivity value can be evaluated at whatever timeafter the rod drop experiment. For statistics, it is recommended to fit the valueby calculating ρ(t )x N (t ) at every timestep after the rod drop ( [Lecouey et al.,2015b] for VENUS-F). By fitting this equation to the results of a set of repeatedexperimental data, an accurate reactivity value of the slightly subcritical state isobtained. For small antireactivity insertions (up to 0.5 $), no spatial correction isneeded.
2.5.2 Modified Source Multiplication Method
The MSM method relates the reactivity levels of two subcritical states (1 and 2) tothe detector count rates in the two states (assuming a constant neutron source)via a spatial correction factor. Using the common parameters as in [Blaise et al.,2011] one gets
56

2.6. Experiment Simulation via the DALTON Diffusion Code
ρ2
ρ1= SCFMSM
'∞0Σd (E )φ1(r , E )d E'∞
0Σd (E )φ2(r , E )d E
(2.76)
with SCFMSM being equal to the SCFCTF from eq. (2.55) with a constant source(S=S ′).
2.5.3 Analysis
This methodology to obtain a reference subcriticality level is also subject to spa-tial correction factors. The same analysis as for the CTF method (see § 2.3.2) isapplicable. As for the other candidate measurement techniques, an intelligentchoice of the neutron source and the detector position can reduce the necessityof a spatial correction.
It is not foreseen that demonstrator or power ADS will be able to work in criticalmode. The different approach to obtain the reference reactivity level howeverallows a validation of the proposed experimental techniques mentioned in thischapter, e.g. on a zero-power experimental facility.
2.6 Experiment Simulation via the DALTON Diffusion
Code
2.6.1 Description
DALTON [Boer et al., 2008, 2010] is a 3D diffusion code developed by TUDelft. Thecode can solve fixed source problems and calculate fundamental and higher orderλ and α-modes through the Arnoldi method by linking with the ARPACK package[Lehoucq et al., 1998]. Forward and adjoint calculations are implemented. Forspatial discretisation, a second order accurate finite volume method is applied.
Moreover, DALTON is also able to perform transient analyses with or withoutprecursors. The implementation in the DALTON code is based on implicit timeintegration of the diffusion equation [Pautz and Birkhofer, 2003]. Thanks to thesefeatures, both experiment simulations and modal analysis can be performed bythe same code in an efficient way. Thanks to the modular character of the code,subroutines can be added easily to process the simulation data needed for theevaluation of each experimental technique.
57
2. Spatial Effects in Subcriticality Monitoring
In the following chapters, static modal analysis will be compared to experimentsimulations in DALTON. This approach allows to assess the capability of modalanalysis to understand the SCFs for reactivity measurement methods (determinedin the sections above). This section explains how the experiment simulations areperformed in DALTON.
2.6.2 Start-up Reactivity Monitoring Methods
The area method (see § 2.2.1) is only valid when an equilibrium condition of pre-cursors is obtained in the system, i.e. when C (0) =C (T ). This only happens aftera few hundred thousand pulses [Baeten et al., 2006]. The precursor decay duringthe pulse is assumed to be negligible, given the short pulse period (hundreds ofµs), compared to the precursor decay constants.
Contrary to probabilistic codes such as MCNP(X) [Pelowitz, 2008, 2011], onecan bypass the time consuming simulation of the building-up of precursors byusing an initial flux and precursor concentration estimation. As long as the pulseperiod T is much smaller than the decay of the precursors, constant precursorconcentrations can be used as initial conditions. The precursor concentrationcan be linked to the steady state flux φav(r , E ) from a stationary fixed sourceproblem. In that case, the source strength Sav is equal to the pulse source strengthS averaged over the pulse period T . Then, using eq. (2.20):
C (r ) =β
λ
# ∞
0
ν(E )Σ f (r , E )φav(r , E )d E (2.77)
The average flux and the related precursor concentration are used as initialconditions for the simulation of a few pulses. Mostly 3 pulses are sufficient toobtain a stable reactivity value via the area method. Pulses for the PNS experimentare simulated as a Dirac pulse during one time step of 1 µs, used to simulate thecomplete experiment. The area values do not change when simulating the Diracpulse during more than one time step, given the nature of the PNS area method.The introduced number of neutrons however should be correct.
For the integrated source jerk method first a fixed source calculation with fullsource strength S is performed. The output flux and precursor concentrationof this calculation is used as input for the time dependent calculation, which issimply a decay simulation. The decay time is in the order of tens of seconds, asthe longest-living precursor should die out. Therefore, an appropriate time step of
58
2.7. Summary
the time-dependent calculation is 0.1 s. There is no need for precise simulationsof the prompt jump after beam interruption, seen the integrated character of themethod.
2.6.3 Current-to-Flux Reactivity Monitor
The simulation of the CTF reactivity monitor is straightforward and based onfixed source calculations and calculations of keff , the fundamental lambda mode.In this way, the CTF parameter c can be determined via eq. (1.14). Differentreactor states can be compared to study the evolution of the CTF parameter andto identify robust detector positions (e.g. places with a constant SCFCTF , see nextchapters of this work).
2.6.4 Source Jerk Interim Cross-Checking Method
For the source jerk interim cross-checking method, the same calculations asfor the integrated source jerk method are used. The output of the fixed sourcecalculation with source strength S is used as input of the time dependent decaysimulation. For this method however, only a few tens of microseconds after beaminterruption are sufficient to determine the required flux levels. Therefore, thetime step of the time-dependent calculation is chosen equal to 1 µs.
The actual average source strength will be slightly lower than S , as the sourcejerk experiment is repeated for statistical reasons. Therefore, the real precursorconcentration should correspond to the average source strength, taking intoaccount the repeated small beam interruptions. As the beam interruption time ismuch smaller than the time to restore the flux level, this effect is assumed to benegligible.
2.7 Summary
As the available evaluation methods to determine the reactivity level rely onpoint kinetics theory, Spatial Correction Factors (SCFs) need to be applied onthe measured reactivity values. Static modal analysis of each selected evaluationmethod for subcriticality measurements is outlined in this chapter.
Via modal analysis, the SCFs for the different methods are determined ana-lytically. This approach allows a straightforward understanding of the spatial
59
2. Spatial Effects in Subcriticality Monitoring
dependence for the PNS area method, the Integrated SJ method and the CTFmethod. The modal SCF for the SJ method is more complex to interpret.
If an ADS core can be modified towards a critical reactor without major designchanges (e.g. in some zero-power facilities), a so-called reference subcriticalitylevel can be derived starting from criticality via the rod-drop technique and theModified Source Multiplication (MSM) method. Although this procedure is alsosubject to spatial dependence, a subcriticality level to validate the candidatemeasurement techniques is derived via an alternative methodology.
The DALTON diffusion code is extended in order to simulate the selected expe-rimental techniques. Thanks to its ability to calculate forward and adjoint modes,both modal analysis and experiment simulation can be performed with this code.
60

3VALIDATION BY EXPERIMENTAL RESULTS
FROM SUBCRITICALITY MEASUREMENTS
It doesn’t matter how beautiful your theory is, it doesn’t matter how smart you are.If it doesn’t agree with experiment, it’s wrong.
Richard Feynman, The Character of Physical Law, 1965.
Picture: The VENUS-F facility at SCK•CEN, Mol (Belgium).
61

3. Validation by Experimental Results from Subcriticality Measurements
In this chapter, the modal analysis of the SCFs for the selected reactivity monito-ring methods from Chapter 2, as well as the SCFs from experiment simulations arevalidated by experimental results from the zero-power VENUS-F ADS (describedin § 1.5.3).
First the VENUS-F subcritical ‘reference’ state (SC1) is derived. Starting fromthis configuration, the PNS area and Integral Source Jerk (ISJ) candidate start-upreactivity measurement methods are tested. Then, a case study for subcriticalitymonitoring is analysed. Finally, the Source Jerk (SJ) candidate interim reactivitycross-checking technique is assessed. The validation of the various experimentsare completed by simulations for different energy groups and reactor configura-tions, in order to derive detector type and positioning recommendations for thedifferent phases of ADS operation.
The subcriticality measurements are carried out on VENUS-F by different Euro-pean partners within the FREYA project [Kochetkov, 2010; Kochetkov et al., 2013].The facility is described in § 1.5.3. The related calculational model used in thischapter is presented in Appendix A.
All experiments and simulations in this (and the next) chapter are performedin the centre plane of the VENUS-F reactor. As common ADS designs have theirneutron source located in the centre of the core, the centre plane is the suitablelocation to reduce the SCFs for all selected experimental techniques. This choiceis motivated in Chapter 2 and this chapter.
3.1 The VENUS-F Subcritical ‘Reference’ State
Thanks to the modular character of the VENUS-F reactor, it is possible to operatein critical or subcritical mode. Via the steps explained in § 2.5, a ‘reference’ subcri-ticality level is derived, for which the selected measurement methods are tested.The estimation of this level for the VENUS-F SC1 configuration is described indetail in [Lecouey et al., 2015b]. In this section, only a short overview is provided,focusing on the spatial correction factors (SCFs) related to this methodology.
3.1.1 The VENUS-F Critical Reactor
Before assessing subcriticality measurement techniques, the first configurationsmade in the VENUS facility were critical. The critical state CR0 considered in thiswork is shown in Fig. 3.1, consisting of 97 fuel assemblies (FAs), the control rods
62

3.1. The VENUS-F Subcritical ‘Reference’ State
positioned at 497.3 mm1, with the PEAR (PEllet Absorber Rod) experimental rodin its upper position. The related detector characteristics are shown in Table 3.1.
The design choices (such as fuel assembly design and reflector dimensions)as well as the licensing requirements (e.g. a sufficient safety rod worth able todeal with reactivity incidents) for the first VENUS-F critical configurations are ex-plained in [Uyttenhove et al., 2011a; Mercatali et al., 2010]. After obtaining the firstcriticality in VENUS-F, licensing [Uyttenhove et al., 2012a] and characterisation[Uyttenhove, 2013] experiments are performed, to understand the neutronicsbehaviour of this homogenous lead fast reactor. This analysis, out of the scope ofthis work, comprises the measurement of radial and axial flux profiles, spectralindices, peak flux factors, and control and safety rod performances.
No Name Deposit Mass (mg)
1 CFUL659 235U (≈ 92 wt%) 10002 CFUL658 235U (≈ 92 wt%) 10003 CFUL653 235U (≈ 92 wt%) 10004 RS10072 235U (≈ 90 wt%) 1005 RS10071 235U (≈ 90 wt%) 1006 RS10074 235U (≈ 90 wt%) 1007 RS10075 235U (≈ 90 wt%) 1008 CFUF34 235U (≈ 100 wt%) 19 CFUM21-668(325) 235U (≈ 90 wt%) 10
10 CFUM21-667(326) 235U (≈ 90 wt%) 10
Table 3.1: Detectors (uranium fission chambers) in the VENUS-F reactor for the subcriti-cal experiments analysed in this work.
3.1.2 The PEAR Drop Experiment
In order to derive a ‘reference’ subcritical state at a keff level about 0.96, firsta slightly subcritical state needs to be derived, as explained in § 2.5. To do so,the experimental PEAR rod with a light antireactivity worth is dropped into thecritical reactor, and via inverse point kinetics (see § 2.5.1), a slight subcritical stateis determined.
1The control rods have an active length of 600 mm. At 0 mm the rods are completely introducedin the core, at 600 mm they are fully withdrawn.
63

3. Validation by Experimental Results from Subcriticality Measurements
SR2
SR1 SR6
SR5
SR3 SR4
CR1
CR2
PEAR
CFUL659
RS10075
CFUL658
RS10071 CFUL653
CFUF34
RS10074
RS10072
Figure 3.1: Setup of the VENUS-F critical CR0 reactor (97 FAs) at middle height withassociated detector locations (orange - fuel, blue - lead, grey - stainless steel, SR - safetyrod, CR - control rod, PEAR - experimental PEllet Absorber Rod). The yellow star indicatesthe position of the external Am-Be source.
After statistical analysis of the different detector outputs during this experiment,a reactivity value of -0.1881 ± 0.0024 $ is found for this reactor state [Lecoueyet al., 2015b]2. This reactivity value is obtained by fitting the experimental datafor ρ$(t ).N (t ) against N (t )with a linear curve (N (t ) being the average count ratefrom the different PEAR drop experiments), and by selecting the detectors that arenot affected by spatial effects from the PEAR rod drop, as these effects are not takeninto account in this methodology (close to critical). Using this methodology, the
2ρ=1 $ corresponds to ρ=βeff . A value of 722 pcm is used in [Lecouey et al., 2015b] for theVENUS-F CR0 and SC1 configurations, based on deterministic calculations with the ERANOScode [Bianchini et al., 2010]. This value is applicable to all reactivities in dollar on VENUS-F in thiswork. MCNP(X) calculations lead to a value of βeff=731 pcm. This value was determined before theconstruction of VENUS-F (see [Uyttenhove et al., 2011a], Table 1) and confirmed by calculationswith the updated VENUS-F input file (see [Uyttenhove, 2012]) after commissioning of the reactor.Recently, experimental results confirmed calculations: βeff=731 ± 12 pcm [Doligez et al., 2015].
64

3.1. The VENUS-F Subcritical ‘Reference’ State
uncertainty on the delayed neutron parameters (βi and λi ) is by far the dominantterm in the final uncertainty of the reactivity estimate (see [Lecouey et al., 2015b]).
3.1.3 The MSM Experiment to obtain the VENUS-F SC1 Configuration
The Modified Source Multiplication (MSM) method (see § 2.5.2) relates the reacti-vity level of two subcritical states via the detector count rates of both states. Inthis case, the reactivity level of the slightly subcritical reactor (described above) isknown via the rod drop experiment in the critical CR0 configuration.
Starting from this slight subcritical state, the 4 central assemblies are removedfrom the VENUS-F core and replaced by the GENEPI-3C beam line. In this way,the VENUS-F SC1 configuration is obtained (93 FAs, with the control rods stillat 479.3 mm), shown in Fig. 3.2. The reactivity measurement techniques will betested on this configuration in the next sections of this chapter.
An Am-Be neutron source in the reflector of the VENUS-F reactor is used torelate the detector count rates in the slightly subcritical state and the SC1 configu-ration to their reactivity levels. SCFs should be applied to the count rates to linkthem to the SC1 reactivity level. In [Lecouey et al., 2015b], the SCFs are calculatedby means of detailed MCNP calculations with a detailed VENUS-F model [Uyt-tenhove and Steckmeyer, 2014]. By doing this, the variation in reactivity levels ofthe different detectors disappears, and the average absolute value of 5.28 ± 0.13 $is found as ‘reference’ subcriticality level for the SC1 configuration. A thoroughsensitivity analysis (mainly related to MCNP calculation models and detectormodels) shows the accuracy of the SCF (see [Lecouey et al., 2015b]). From thisstate, other subcriticality levels can be derived again via the MSM method, e.g.for the SC1 state with control rods up and down (see [Lecouey, 2014; Lecoueyet al., 2015a]).
3.1.4 Discussion
This section provides the derivation of a ‘reference’ subcritical level of the VENUS-F SC1 configuration, starting from the critical state. We call this a ‘reference’level, as the reactivity values obtained by the selected subcriticality measurementtechniques can be compared to this level, obtained via an alternative methodology.This approach is only applicable to modular zero-power ADS like VENUS-F, i.e.installations which allows an easy installation of the accelerator beam line, to gofrom critical to subcritical mode.
65

3. Validation by Experimental Results from Subcriticality Measurements
SR2
SR1 SR6
SR5
SR3 SR4
CR1
CR2
PEAR
CFUL659
CFUL658
RS10075
RS10074
CFUM21-668 RS10071
CFUF34
CFUM21-667
CFUL653
RS10072
Figure 3.2: Set-up of the VENUS-F SC1 configuration (93 FAs) at middle height withassociated detector locations (orange - fuel, blue - lead, grey - stainless steel, white - air orvacuum (in the central beam line), SR - safety rod, CR - control rod, PEAR - experimentalPEllet Absorber Rod). The yellow star indicates the position of the external Am-Be source.
One should, however, take into account the spatial dependence of the MSMmethod. Therefore, this ‘reference’ subcritical level is also subject to calculatedSCFs. Moreover, the uncertainty on the delayed neutron parameters of the roddrop technique is dominating the final uncertainty of the SC1 subcriticality level.
Thanks to the use of probabilistic code calculations, using detailed reactormodels, the SCFs for the MSM method are accurately calculated at the detectorlocations. In the following sections, however, the spatial behaviour of the candi-date reactivity measurement techniques will be tested throughout the completeVENUS-F reactor. Instead of calculating precisely SCFs at the detector locations,this work will focus on the physics of the SCFs in order to determine detectortypes and locations for ADS operation.
66

3.2. Subcriticality Monitoring during Start-up
3.2 Subcriticality Monitoring during Start-up
In this section, experimental results are presented from the selected VENUS-Fstart-up monitoring techniques. As defined in § 1.3.8, the Pulsed Neutron Source(PNS) technique and the Integrated Source Jerk (ISJ) technique are candidates tomeasure the reactivity during start-up, i.e. at Cold Zero Power (CZP) until 1 % ofnominal power.
The experimental results confirm the understanding of SCFs for both tech-niques, and show their usefulness in a zero-power ADS. SCFs are simulated forthe complete VENUS-F core and compared to experimental results at differentdetector locations. The understanding of the spatial behaviour is assessed bymodal analysis, and detector types and positions for robust reactivity monitoringduring start-up are investigated.
3.2.1 Pulsed Neutron Source and Integrated Source Jerk Experimentsin VENUS-F Subcritical Configurations
PNS (see § 1.3.1) and ISJ (see § 1.3.2) experiment results are analysed for twoVENUS-F configurations with different subcriticality levels: SC1 and SC4. Theirlayouts are presented in Fig. 3.2 and Fig. 3.3. The characteristics of the detectorsin these configurations are described in Table 3.1.
The ‘reference’ subcriticality levels for both SC1 and SC4 can be obtained via thealternative pathway (i.e. the rod drop and MSM experiments) as described in §3.1. For SC1,??ρref
??=5.06± 0.13 $, i.e. 3653 pcm (with CRs at 600mm, see [Lecouey
et al., 2015b; Lecouey, 2014]) is obtained in this way. For SC4,??ρref
??= 17.70 ± 0.13$, i.e. 12779 pcm is obtained via precise MCNP calculations [Uyttenhove andSteckmeyer, 2014].
For the PNS experiments, (quasi) Dirac pulses are given every 500 µs in thecentre of the core. The GENEPI-3C accelerator provides pulses of 1 µs with about20 mA peak current. This corresponds to an injection of about 106 neutrons perpulse. After stabilisation of the delayed neutron levels, the experiment is repeatedto obtain good statistics on the area method results. For the ISJ experiments, thecontinuous GENEPI-3C beam is interrupted and the decay of the neutron chainsin the reactor is followed.
The available experimental reactivity values (from [Marie et al., 2013; Kochetkovet al., 2014; Kochetkov, 2014]) are given in Fig. 3.4 for both the PNS area method
67

3. Validation by Experimental Results from Subcriticality Measurements
SR2
SR1 SR6
SR5
SR3 SR4
CR1
CR2
PEAR
CFUL659
CFUL658
RS10075
RS10074
CFUM21-668 RS10071
CFUF34
CFUM21-667
CFUL653
RS10072
Figure 3.3: Set-up of the VENUS-F SC4 configuration (64 FAs) at middle height withassociated detector locations (orange - fuel, blue - lead, grey - stainless steel, white - air orvacuum (in the central beam line), SR - safety rod, CR - control rod, PEAR - experimentalPEllet Absorber Rod).
and the ISJ method for each detector. For the SC4 core, the experimental reactivityvalues and SCFs are shown in Fig. 3.5 for the ISJ method for each detector.
In order to understand the spatial corrections needed for both subcritical states,the experimental PNS area and ISJ reactivity values are compared to the ‘reference’reactivity levels, according to the SCF definitions (2.17) and (2.35). The relatedSCFs, to be applied to the measurement values, are shown in Fig. 3.4 and Fig. 3.8for the SC1 core, and in Fig. 3.5 for the SC4 core.
Except for the CFUF34 detector for the PNS SC1 experiment, both SCFarea andSCFISJ are smaller than unity in all detector positions, which indicates a safe un-derestimation of the absolute reactivity by both methods for almost all detectors.E.g. for the CFUL658 detector for the PNS SC1 experiment, SCFarea=0.883 cor-responds to??ρ??=3226 pcm, an underestimation of the absolute reactivity value by
68

3.2. Subcriticality Monitoring during Start-up
SR2
SR1 SR6
SR5
SR3 SR4
CR1
CR2
PEAR
PNS area: = 4.74 ± 0.02, SCF = 0.937 ± 0.024 ISJ: = 4.86 ± 0.14, SCF = 0.962 ± 0.036 SJ: = 4.748 ± 0.002, SCF = 0.938 ± 0.024
PNS area: = 4.47 ± 0.05, SCF = 0.883 ± 0.025 ISJ: = 4.86 ± 0.14, SCF = 0.960 ± 0.036 SJ: = 3.636 ± 0.001, SCF = 0.719 ± 0.018
PNS area: = 4.75 ± 0.02, SCF = 0.939 ± 0.025 ISJ: = 4.89 ± 0.16, SCF = 0.966 ± 0.040 SJ: = 4.451 ± 0.004, SCF = 0.880 ± 0.023
PNS area: = 4.84 ± 0.02, SCF = 0.957 ± 0.025 ISJ: = 4.85 ± 0.15, SCF = 0.957 ± 0.039 SJ: = 4.812 ± 0.004, SCF = 0.951 ± 0.024
PNS area: = 4.87 ± 0.04, SCF = 0.962 ± 0.026 ISJ: NA SJ: = 4.83 ± 0.01, SCF = 0.955 ± 0.025
PNS area: = 5.08 ± 0.08, SCF = 1.004 ± 0.030 ISJ: = 4.81 ± 0.69, SCF = 0.950 ± 0.138 SJ: = 5.11 ± 0.02, SCF = 1.010 ± 0.026
PNS area: = 4.81 ± 0.01, SCF = 0.951 ± 0.025 ISJ: = 4.90 ± 0.15, SCF = 0.969 ± 0.039 SJ: = 4.790 ± 0.004, SCF = 0.947 ± 0.024
PNS area: = 4.81 ± 0.03, SCF = 0.951 ± 0.025 ISJ: NA SJ: = 4.84 ± 0.01, SCF = 0.957 ± 0.025
PNS area: = 4.60 ± 0.04, SCF = 0.909 ± 0.024 ISJ: = 4.86 ± 0.14, SCF = 0.960 ± 0.036 SJ: = 4.033 ± 0.001, SCF = 0.797 ± 0.020
PNS area: = 4.80 ± 0.02, SCF = 0.949 ± 0.025 ISJ: = 4.83 ± 0.17, SCF = 0.954 ± 0.041 SJ: = 4.791 ± 0.004, SCF = 0.947 ± 0.024
1
2
3
4
5 6
7
8
9
10
Figure 3.4: Absolute reactivities (in $) and SCFs (and their absolute uncertainty) for theSC1 VENUS-F configuration (with CRs at 600 mm) at different detector locations obtainedby the PNS area, the ISJ and the SJ method.
??ρref
??=5.06 ± 0.13 $. Detectors 9 and 10 werenot available (NA) when the ISJ experiments were performed on SC1. From [Marie et al.,2013; Kochetkov, 2014; Kochetkov et al., 2014; Chevret et al., 2014].
427 pcm.
For the ISJ method, only results from detectors in the outer reflector are avai-lable for interpretation. The result for the detector in the fuel shows a too highuncertainty, due to the low detector count rates. The experiment can be per-formed only once, as the ADS is shut down, and therefore difficult to reproduce.In particular for the SC4 configuration, the results of the ISJ technique show atoo high uncertainty (because of low count rates) to draw any conclusions aboutspatial dependence.
The applicability of the ISJ method on power ADS will thus depend on fluxlevel, subcriticality level and detector type. As the uncertainty on the PNS methodcan be reduced by performing longer measurements, in theory, every level ofsubcriticality can be measured with a sufficient degree of accuracy.
69

3. Validation by Experimental Results from Subcriticality Measurements
SR2
SR1 SR6
SR5
SR3 SR4
CR1
CR2
PEAR
ISJ: = 15.30 ± 0.55, SCF = 0.87 ± 0.04
ISJ: = 14.96 ± 0.58, SCF = 0.85 ± 0.04 ISJ: = 14.43 ± 7.31,
SCF = 0.82 ± 0.41
ISJ: = 15.06 ± 0.89, SCF = 0.85 ± 0.05
ISJ: = 14.89 ± 0.84, SCF = 0.84 ± 0.05
ISJ: = 15.20 ± 0.85, SCF = 0.86 ± 0.05
ISJ: = 14.73 ± 0.83, SCF = 0.83 ± 0.05
ISJ: = 14.91 ± 4.97, SCF = 0.84 ± 0.28
ISJ: = 14.91 ± 2.20, SCF = 0.84± 0.12
ISJ: = 14.46 ± 2.20, SCF = 0.82 ± 0.13
1
2
3
4
5 6
7
8
9
10
Figure 3.5: Absolute reactivities (in $) and SCFs (and their absolute uncertainty) for theSC4 VENUS-F configuration (with CRs at 600 mm) at different detector locations obtainedby the ISJ method.
??ρref
??= 17.70 ± 0.13 $. From [Kochetkov, 2014; Kochetkov et al., 2014].
3.2.2 Validation of Experiment Simulations
In this section PNS and ISJ experiments in VENUS-F are simulated using theDALTON diffusion code (see § 2.6). Appendix A presents the VENUS-F XYZ modelfor the DALTON code simulations, as well as the related 6 energy groups (repre-sentative for the VENUS-F spectrum and applied detectors).
In order to validate the SCFs for the area method (defined by eq. (2.17) and theISJ method (defined by eq. (2.35)), the incident is simulated via time-dependentcalculations. The result from the experiment evaluation (e.g. the area ratio) isscaled on the ‘reference’ keff , obtained via an eigenmode calculation. Thanks tothis approach, the SCF for both experiments is determined through the completereactor and evaluated by experimental results (for the VENUS-F SC1 configura-tion). For all simulations the detector cross section, Σd (E ) equals unity.
70

3.2. Subcriticality Monitoring during Start-up
PNS
For the PNS experiment simulations, a pulsed source of 1 µs is implemented inthe highest (i.e. the first) energy group of the VENUS-F model in DALTON (withbunker??ρref ,DALTON
??=3709 pcm, without bunker??ρref ,DALTON
??=4082 pcm, see App.A). Different pulse shapes are found throughout the reactor for the lowest energygroup (representative for the U-235 detectors), as shown in Fig. 3.6.
For the PNS method, special attention should be paid to thermalising effects.They considerably influence the pulse shapes and thus the experimental results,as U-235 detectors are used in the VENUS-F configurations for measurements (seeTable 3.1). The VENUS-F bunker (made from barite concrete) is such an element.It thermalises and reflects neutrons, increases the absolute reactivity of the reactor(by 371 pcm for the DALTON calculations), and has a significant broadening effecton the pulse shapes. Therefore, an appropriate pulse period should be chosen (forVENUS-F i.e. 500 µs), in order to let the prompt neutron decay disappear by theend of the pulse period. The effect of thermalising elements is slightly noticeablein the other energy groups and other detector positions, but less pronounced.
Figure 3.6: Simulated PNS responses in the lowest energy group (i.e. group 6) at differentlocations in the VENUS-F SC1 configurations across the X-axis at centre height (Y =Z=0).The flux level corresponds to a unit source strength implemented in the highest energygroup 1 during the first time step of 1 µs.
Fig. 3.7 shows the behaviour of the simulated SCF of the lowest energy group for
71

3. Validation by Experimental Results from Subcriticality Measurements
the area method through the complete VENUS-F reactor by 2D plots at differentheights above the centre of the core. The behaviour of the SCF is symmetrical tothe centre plane of the VENUS-F SC1 configuration. SCF > 1, an (unsafe) overesti-mation of the absolute reactivity level, is found inside a sphere of about 20 cmfrom the centre of the core. In the reflector, the reactivity is (safely) underestima-ted by 3-4 % (SCFarea=0.96-0.97),
??ρarea
?? is 111-148 pcm higher than??ρref
??= 3709pcm .
Figure 3.7: Simulated SCFarea for the lowest energy group (i.e. group 6) at differentheights in the VENUS-F SC1 configuration (with bunker): 0 cm (center plane), 20 cm(fuel), 39 cm (top reflector) and 59 cm (top reflector). The dashed line corresponds to theboundary of the 12x12 grid in which the assemblies are loaded, indicated in grey in Fig.3.2.
The simulated PNS area method results are slightly affected by the presence ofthe VENUS-F bunker. The top graph of Fig. 3.8 shows the experimental resultsand the difference in simulated SCF for the area method with and without bunkerin the middle plane of the VENUS-F reactor, across the X-axis. For the clarity of
72
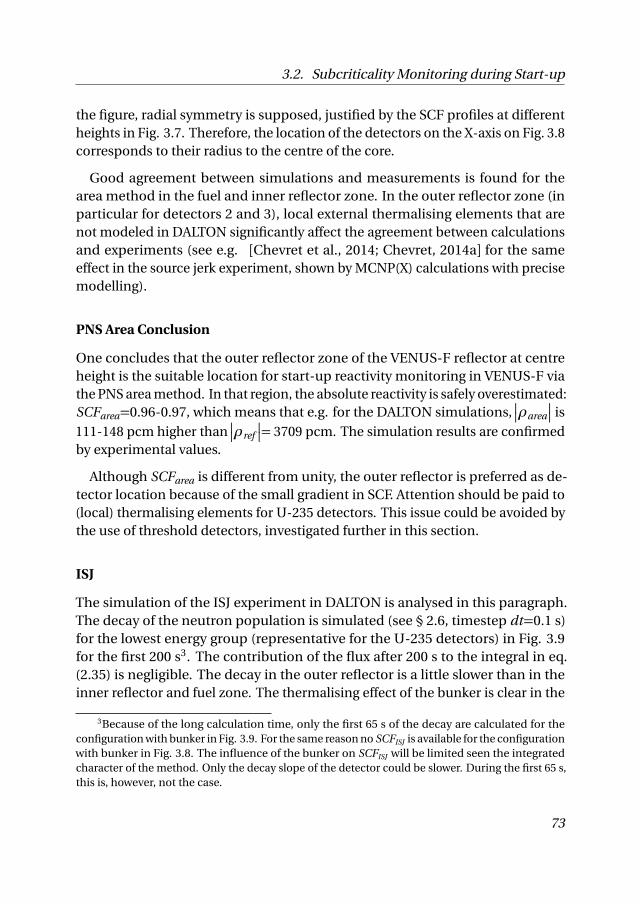
3.2. Subcriticality Monitoring during Start-up
the figure, radial symmetry is supposed, justified by the SCF profiles at differentheights in Fig. 3.7. Therefore, the location of the detectors on the X-axis on Fig. 3.8corresponds to their radius to the centre of the core.
Good agreement between simulations and measurements is found for thearea method in the fuel and inner reflector zone. In the outer reflector zone (inparticular for detectors 2 and 3), local external thermalising elements that arenot modeled in DALTON significantly affect the agreement between calculationsand experiments (see e.g. [Chevret et al., 2014; Chevret, 2014a] for the sameeffect in the source jerk experiment, shown by MCNP(X) calculations with precisemodelling).
PNS Area Conclusion
One concludes that the outer reflector zone of the VENUS-F reflector at centreheight is the suitable location for start-up reactivity monitoring in VENUS-F viathe PNS area method. In that region, the absolute reactivity is safely overestimated:SCFarea=0.96-0.97, which means that e.g. for the DALTON simulations,
??ρarea
?? is111-148 pcm higher than
??ρref
??= 3709 pcm. The simulation results are confirmedby experimental values.
Although SCFarea is different from unity, the outer reflector is preferred as de-tector location because of the small gradient in SCF. Attention should be paid to(local) thermalising elements for U-235 detectors. This issue could be avoided bythe use of threshold detectors, investigated further in this section.
ISJ
The simulation of the ISJ experiment in DALTON is analysed in this paragraph.The decay of the neutron population is simulated (see § 2.6, timestep dt=0.1 s)for the lowest energy group (representative for the U-235 detectors) in Fig. 3.9for the first 200 s3. The contribution of the flux after 200 s to the integral in eq.(2.35) is negligible. The decay in the outer reflector is a little slower than in theinner reflector and fuel zone. The thermalising effect of the bunker is clear in the
3Because of the long calculation time, only the first 65 s of the decay are calculated for theconfiguration with bunker in Fig. 3.9. For the same reason no SCFISJ is available for the configurationwith bunker in Fig. 3.8. The influence of the bunker on SCFISJ will be limited seen the integratedcharacter of the method. Only the decay slope of the detector could be slower. During the first 65 s,this is, however, not the case.
73

3. Validation by Experimental Results from Subcriticality Measurements
Figure 3.8: Simulated PNS (top) and ISJ (bottom) SCF (lines) and measurement results(dots) across the X-axis at centre height of the VENUS-F SC1 configuration (Y =Z=0). Asthe detector locations are not on the X-axis, the corresponding radius to the centre of thecore is shown. The vertical line indicates the core-reflector interface.
74

3.2. Subcriticality Monitoring during Start-up
outer reflector: a higher thermal flux component is found. The general slope ofthe decay, however, does not change significantly while taking into account theVENUS-F bunker.
Figure 3.9: Simulated ISJ responses in the lowest energy group (i.e. group 6) at differentlocations in the VENUS-F SC1 configuration across the X-axis at centre height (Y =Z=0).The flux profile corresponds to the decay of a unit source strength implemented in thehighest energy group 1, stopped at t=0 s.
Fig. 3.10 shows the simulated SCFISJ of the lowest energy group (defined byeq. (2.44)) for the ISJ method through the complete VENUS-F reactor, by 2Dplots at different heights above the centre of the core. The behaviour of SCFISJ issymmetrical to the centre plane of the VENUS-F SC1 configuration. SCFISJ > 1, an(unsafe) overestimation of the absolute reactivity level, is found inside a sphereof about 20 cm from the centre of the core. In the midplane, a symmetrical SCFprofile is found. In the reflector, the absolute reactivity is (safely) underestimatedby 2-3 %. SCF profiles similar to the PNS ones are found.
The experimental ISJ results are presented in the Fig. 3.8 bottom graph andcompared to the simulation results. For the clarity of the figure, radial symmetryis again supposed, justified by the SCF profiles at different heights in Fig. 3.10.Therefore, the location of the detectors on the X-axis on Fig. 3.8 corresponds totheir radius to the centre of the core. Good agreement between simulations andmeasurements is found for the ISJ method in the outer reflector zone. Unfortu-
75

3. Validation by Experimental Results from Subcriticality Measurements
Figure 3.10: Simulated ISJ SCF for the lowest energy group (i.e. group 6) at differentheights in the VENUS-F SC1 configuration: 0 cm (center of the core), 20 cm (fuel), 39 cm(top reflector) and 59 cm (top reflector). The dashed line corresponds to the boundary ofthe 12x12 grid in which the assemblies are loaded, indicated in grey in Fig. 3.2.
nately, this is the only zone where accurate measurement data are available.
ISJ Conclusion
The optimum zone for ISJ detector positioning is similar to the one of the PNSarea method. Again the outer reflector zone of the VENUS-F reflector at centreheight is the suitable location for start-up reactivity monitoring in VENUS-F viathe ISJ method. In that region, the absolute reactivity is safely underestimated.The simulation results in that region are confirmed by experimental values.
76

3.2. Subcriticality Monitoring during Start-up
Comparison between PNS area and ISJ method
The ISJ method shows the same spatial dependence trend as the PNS area methodfor the VENUS-F SC1 configuration. The PNS area method is however, due to itsnature, more sensitive than the ISJ method to local thermalising elements thataffect the detector results (see detectors 2 and 3 for the PNS area method in Fig.3.8). Precise calculations (as shown in [Chevret et al., 2014; Chevret, 2014a]) arerequired to improve the agreement between experiments and simulations forthese detectors. The issue of thermalising elements could be avoided by the useof threshold detectors, and will be checked in future experimental programmeson VENUS-F.
We conclude that although the spatial dependence of both methods is quasisimilar, the PNS area method is more robust: it is reproducible and independentof the delayed neutron constants. Therefore, the ISJ method will be excluded ascandidate for power ADS start-up reactivity monitoring in Chapter 4.
3.2.3 Modal Analysis Understanding of Spatial Correction Factors
In order to understand the behaviour of the SCF for the different experimentalmethods, modal analysis is applied in this thesis. For the PNS area method, SCFarea
obtained by modal analysis is presented in eq. (2.34). For the ISJ method, theSCFISJ obtained by modal analysis is presented in eq. (2.44). Again Σd (E )=1 issupposed for the analysis.
VENUS-F Eigenfunctions
As a first step, we have a look at the VENUS-F eigenfunctions. They are calcu-lated in DALTON and plotted for the VENUS-F SC1 configuration (with bunker)in Figures 3.11, 3.12 and 3.13 for the total flux. The total flux is the sum of theeigenfunctions for each energy group. The shape is similar for each group, e.g. forthe 9th mode in Fig. 3.14. For a simple symmetric 2-zone VENUS-F model with1 energy group cross sections (see Appendix A), the shape of the eigenfunctionsfollows a structured sequence of azimuthal and axial modes (as in Fig. 2.1), asshown in [Uyttenhove et al., 2012b]. In the VENUS-F case, the shapes of subse-quent modes are combinations of the ones in Fig. 2.1. The general behaviour ofthe modes, however, remains unchanged.
Most (power) ADS have the source in the centre of the core [Nifenecker et al.,2003]. Therefore, the fundamental mode is significantly amplified and contributes
77

3. Validation by Experimental Results from Subcriticality Measurements
Figure 3.11: XY (Z=0) and Z (X=Y =0) plots of the 1st to the 3rd eigenfunction of theVENUS-F model of the SC1 (with CRs out) configuration. The sum over the 6 energygroups of each mode is shown.
78

3.2. Subcriticality Monitoring during Start-up
Figure 3.12: XY (Z=0) and Z (X=Y =0) plots of the 4th to the 6th eigenfunction of theVENUS-F model of the SC1 (with CRs out) configuration. The sum over the 6 energygroups of each mode is shown.
79

3. Validation by Experimental Results from Subcriticality Measurements
Figure 3.13: XY (Z=0) and Z (X=Y =0) plots of the 7th to the 9th eigenfunction of theVENUS-F model of the SC1 (with CRs out) configuration. The sum over the 6 energygroups of each mode is shown.
80

3.2. Subcriticality Monitoring during Start-up
significantly to the full flux solution [Uyttenhove et al., 2014]. SCFs close to unitywill therefore be found in the central plane. This conclusion can also be retrievedfrom the analytical expression of the SCFs for the selected experimental tech-niques, in eq. (2.34),(2.44),(2.54) and (2.70). For this reason detector positioningexercises focus on the reactor centre plane, also in this work.
The first (fundamental) mode has no zero crossings and a maximum in thecentre of the core. The next modes (2-8) do not show maxima in the centre of thecore. The 9th mode is the first higher mode with a maximum in the centre of thecore, and has a zero crossing at a radius of about 25 cm from the centre of the coreat centre plane height. Higher modes show a more complicated shape. For thefirst 50 modes, only few modes have their maximum in the neighbourhood of thecentre of the core.
When looking into the different energy groups, one notices that the shape of amode does (almost) not change through the different energy groups, althoughthe amplitude of the mode varies per energy group. This is shown in Fig. 3.14,providing the 9th eigenfunction of each energy group for the VENUS-F SC1 confi-guration. The zero crossing remains for each energy group around 20-25 cm fromthe centre of the core at centre plane height.
Important modes for the VENUS-F ADS flux reconstruction
The full flux of the VENUS-F SC1 configuration with continuous source can bereconstructed by the summation of each amplified mode (see eq. (2.6) and §2.1.2). The full solution is in principle obtained with an infinite number of modes.In practice, most of the experimental techniques for the determination of ADSreactivities [Soule et al., 2004; Mellier, 2005] rely on point kinetics, in which onlythe first (fundamental) mode of the flux is taken into account.
For the VENUS-F ADS, having the neutron source in the centre of the subcriticalcore, much more than 100 modes are needed to reconstruct the full solutionaccurately (see Fig. 10 in [Uyttenhove et al., 2014]). Indeed only few of these 100modes have a maximum in the centre of the core, given the profile sequence ofthe modes in Fig. 2.1. The 9th mode contributes significantly to the full solution,being the first mode with a maximum in the centre of the core (different from thefundamental one), as shown in [Uyttenhove et al., 2014].
81

3. Validation by Experimental Results from Subcriticality Measurements
Figure 3.14: XY (Z=0) and Z (X=Y =0) plots of the 9th eigenfunction for each energygroup of the VENUS-F model of the SC1 (with CRs out) configuration, from the highest(top left) to the lowest (bottom right) energy level.
82

3.2. Subcriticality Monitoring during Start-up
Analysis of the SCF for the PNS area and ISJ technique
The modal analysis approach is interesting to understand the reactor physicsbehind important modes contributing to the SCFs for experimental techniques.In Fig. 3.15, the SCF for the PNS area method by modal analysis (see eq. (2.34)) isshown for the VENUS-F SC1 configuration for the lowest energy group.
One notices the important role of the 9th mode to SCFarea, which provides theshape of the SCF from this mode on. SCF remains unity along the X-axis for thefirst 8 modes: their amplification factors (see eq. (2.6)) are small. By taking intoaccount only 9 modes, SCFarea=1 is found at about 20-25 cm from the centre ofthe core (depending on the energy group), i.e. the zero crossing of the latter modefor the concerned energy group.
Other higher modes obtaining their maximum at the centre of the core arealso contributing significantly to the SCF shape. Also these modes have zerocrossings at a radius of about 20-25 cm from the centre of the core. Therefore, thelocation with correction factor equal to unity remains almost unchanged at abouta radius of 20-25 cm from the centre of the core with increasing number of modescontributing.
Moreover, the contribution of the higher modes to the SCF is reduced by thenumerator correction factor kn (1−k1)
k1(1−kn )and the denominator factor (kn (1−k1)
k1(1−kn ))2 in eq.
(2.34), as shown for the VENUS-F reactor in Fig. 3.16) for the first 100 modes.Nevertheless, these higher modes are required to approximate the simulated SCFprofile further away from the centre of the core, i.e. to adapt SCFarea to localperturbations (such as the VENUS-F control rods in this case).
For the ISJ method, almost the same conclusions from modal analysis as forthe PNS area method can be made, as expected in § 2.2.4 and eq. (2.44). Asfor SCFarea, the strongly amplified modes - i.e. the modes with a high Pn (0) -contribute significantly to the SCFISJ . The 9th mode is the first mode (differentfrom the fundamental one) with a high Pn (0) value.
Again, SCFISJ=1 is found at about 20-25 cm from the centre of the core (de-pending on the energy group), i.e. the zero crossing of the latter mode for theconcerned energy group. Also higher modes with a maximum in the centre of thecore exhibit a zero crossing at this location. Therefore, the same conclusions canbe made as for the PNS area method. This is confirmed by the simulation results,shown in Fig. 3.8 (bottom).
83

3. Validation by Experimental Results from Subcriticality Measurements
Figure 3.15: SCF for the PNS area method in the VENUS-F SC1 configuration along theX-axis (Y =Z=0), obtained by modal analysis and simulation. The vertical lines indicatethe core-reflector interface.
Conclusion for Modal Analysis
For ADS with the neutron source in the centre of the core, the 9th eigenmodeis contributing significantly to the full flux solution of ADS with a centre in thesource, as it is the first higher mode (i.e. different from the fundamental mode)with a maximum in the centre of the core. Even more important is the contributionof the 9th mode to SCFarea (and similar, to SCFISJ ), as the contribution of higher
modes to the SCFs is reduced (e.g. by kn (1−k1)k1(1−kn )
and (kn (1−k1)k1(1−kn )
)2 in eq. (2.34)).
Higher eigenmodes (i.e. higher than the 9th) with a maximum in the centre ofthe core show also a zero-crossing at about 20-25 cm from the centre of the core(depending on the energy group), i.e. the same location of the 9th eigenmode.Therefore, the boundary between SCF < 1 and SCF > 1 remains unchanged fromthe 9th eigenmode on (see Fig. 3.15), and can thus be determined by analysing thiseigenmode only for VENUS-F. This conclusion is evaluated for less homogeneousconfigurations in § 4.2.2 (for the MYRRHA power ADS).
84

3.2. Subcriticality Monitoring during Start-up
Figure 3.16: Evolution of the numerator and denominator k-factor of eq. (2.34) for theVENUS-F SC1 configuration for 100 modes.
3.2.4 Robustness Checks for the PNS Area Methods
In this section, two robustness checks for start-up reactivity monitoring are per-formed: the choice of detector type and the change in SCFarea during core loading.
Detector Type Choice
In § 3.2.1, the experimental PNS and ISJ results are shown for U-235 detectors onVENUS-F. The simulated SCFs are validated by experimental results in the lowestenergy group. In order to study the effect of the detector type, the SCF for thePNS area method is shown in Fig. 3.17 for each energy group of the VENUS-F SC1configuration model.
Due to the high energetic neutron source, the SCFarea is the highest in the firstenergy group for both methods. The shape of the 9th eigenfunction is similar forall energy groups (see Fig. 3.14), but the zero crossing radius of the mode differs.As a consequence, the position on the X-axis where SCFarea=1 shifts from 20 cmfor group 6 to 37 cm for group 1. The absolute reactivity level in the reflector isquasi independent on the neutron energy group. The same energy dependence isfound for SCFISJ .
85

3. Validation by Experimental Results from Subcriticality Measurements
It is important to notice that this model does not include local thermalisingelements, which are present around the VENUS-F reactor. As shown in Fig. 3.8,the PNS results are affected by these effects. One may assume that these elementsdo not perturb SCFarea for higher energy groups (e.g. threshold detectors). Thisstatement can only be evaluated by simulations of the PNS method in probabilisticcodes that can take into account local perturbations. That research falls out ofthe scope of this work.
As a conclusion, the choice of the outer reflector is reconfirmed for reactivitymonitoring during start-up. SCFarea<1 and does not differ from 0.96-0.97 depen-ding on the detector type. Threshold detectors could be more robust against localthermalising elements. This issue is studied more in detail in chapter 4 for powerADS.
Figure 3.17: Simulated SCFs for the PNS area method across the X-axis (Y =Z=0) in thecentre plane of the VENUS-F SC1 configuration for the different energy groups of themodel. The vertical line indicates the core-reflector interface.
Subcriticality Level
In this paragraph SCFarea is studied for the SC1 (see Fig. 3.2), SC4 (see Fig. 3.3),SC5 and SC6 (see Fig. 3.18) VENUS-F configurations. These states have differentsubcriticality levels, varying from keff=0.751 to keff=0.961, as indicated in Table
86

3.2. Subcriticality Monitoring during Start-up
3.2. Fuel assemblies are symmetrically placed around the middle of the VENUS-Fcore to obtain these configurations.
SR2
SR1 SR6
SR5
SR3 SR4
CR1
CR2
PEAR
Figure 3.18: Set-up of the VENUS-F subcritical SC5 and SC6 configuration at middleheight (orange - fuel, blue - lead, grey - stainless steel, SR - safety rod, CR - control rod,PEAR - experimental PEllet Absorber Rod). The shaded fuel assemblies should be replacedby lead assemblies in the SC5 configuration to obtain the SC6 state.
Fig. 3.19 shows the SCFs of the considered configurations along the X-axis ofthe VENUS-F reactor, for the thermal energy group (in case the same detectorsare used as for the SC1 experiments), as well as for the integrated flux. The sameSCF profiles are noticed for different subcriticality levels, although the SCFarea=1crossing is getting closer to the reactor centre (for the integrated flux) with de-creasing level of subcriticality. This effect originates from the difference in zerocrossing of the 9th eigenmode (see § 3.2.3).
For the SC4-SC6 configurations, SCFarea<1 everywhere in the reactor for thethermal detector. In general, the SCFs approach unity with increasing subcri-ticality level: the higher keff , the less (safety) margin in underestimation of the
87

3. Validation by Experimental Results from Subcriticality Measurements
Name keff Number of FAs Fig.
SC1 0.961 93 3.2SC4 0.885 64 3.3SC5 0.821 48 3.18SC6 0.751 38 3.18
Table 3.2: Calculated subcriticality levels, number of FAs (including the ones in theSRs) and description reference for the different VENUS-F configurations used in thesimulations for start-up reactivity monitoring.
Figure 3.19: Simulated SCFs for the PNS area method across the X-axis (Y =Z=0) in thecentre plane of the VENUS-F reactor for different subcritical configurations: SC1, SC4,SC5 and SC6. The vertical line indicates the core-reflector interface.
absolute reactivity level.
As a conclusion we notice a large variation in SCFarea in the outer reflector forthe different levels of subcriticality. A maximum (safe) underestimation of theabsolute reactivity level of 16 % is obtained by the thermal detector in the SC6configuration (i.e. 5305 pcm on an absolute level of 33156 pcm). The closer tocriticality, the smaller the underestimation. This overconservative effect shouldbe taken into account for ADS core loading procedures.
88

3.2. Subcriticality Monitoring during Start-up
3.2.5 Conclusion for Start-up Reactivity Monitoring
The two selected candidates for start-up reactivity monitoring, the PNS area andISJ method, are investigated in this section on VENUS-F. Simulations are modallyanalysed to understand the behaviour of the SCFs, and validated by experimentaldata.
The ISJ experimental count rates suffer from low statistics and the experimentis difficult to reproduce, which makes it not applicable for low flux machines(such as VENUS-F) or deep subcritical states. Also the uncertainty on the delayedneutron data influences the uncertainty of the ISJ results. From this viewpoint,the PNS area method is more robust than the ISJ method, and will be selected asstart-up reactivity monitoring method. Moreover, the experiment is reproducible,so statistics depend on the measurement time.
For the PNS area method, special attention should be paid to local thermalisingelements affecting the VENUS-F experimental results (in the reflector). Thisdisadvantage, however, is supposed to disappear when using threshold detectors.
The SCFs of the PNS area method and ISJ method are simulated by DALTONfor different configurations. Simulations are in agreement with the experimentalresults, except for 2 detectors in the outer reflector, where the PNS area resultsare influenced by local thermalising elements. The simulated SCF behaviour issimilar for both methods and confirmed by modal analysis.
The SCF for both methods equals unity around a radius varying from 20 to 25cm from the centre of the core, depending on the detector type. This distancecorresponds to the zero crossing of the first higher harmonics with a maximumin the centre of the core (i.e. the 9th mode). Studying the 9th eigenmode allowsthus to identify the boundary for a safe SCF.
A safe overestimation of the absolute reactivity level is found in the reflector (SCF< 1), whereas getting closer to the centre of the core, an (unsafe) underestimationof the reactivity is found. In the reflector, SCFarea=0.96-0.97, which means thate.g. for the DALTON simulations,
??ρarea
?? is 111-148 pcm higher than??ρref
??= 3709pcm. Therefore, the reflector zone is considered as the recommended locationfor detector positioning, moreover the SCF gradient is small in this zone (exceptfrom the thermalising elements in this zone when using thermal detectors).
When decreasing the subcriticality level during start-up, the (safe) overestima-tion of the reactivity level in the VENUS-F reflector decreases. The SCF, however,
89

3. Validation by Experimental Results from Subcriticality Measurements
stays smaller than unity. This conservative effect is the highest in the lowestenergy group, but also for the highest energy group, the SCF for the VENUS-F SC1configuration remains smaller than unity.
3.3 Subcriticality Monitoring during Operation
For a power ADS such as MYRRHA (see § 1.5.2), no (long) beam interruptionsare allowed during normal operation from the moment 1 % of nominal power isobtained. Therefore, the continuous Current-to-Flux (CTF) monitor is candidateto monitor (changes in) reactivity during operation of an ADS (see § 1.3.8).
By measuring the ratio of source neutrons to count rates from detectors in thereactor, the reactivity is monitored, according to equation (1.14). The evolutionof c , the CTF proportionality coefficient, needs to be investigated during ADSoperation, in order to identify the need for interim reactivity cross-checking (andre-calibration of c ).
Changes in reactivity in ADS can be global (e.g. burn-up) or local (e.g. controlrod ejection). As there is no significant burn-up of the VENUS-F fuel, a control rodvariation case study is made in this chapter in order to understand the monitoringof local perturbations. More CTF applications during normal ADS operation andincident conditions are studied for power ADS in § 4.3 and 4.4.
In this section, the case study will be validated by experimental data fromVENUS-F. Moreover, SCFs for this experiment will be simulated (withΣd (E )=1) forthe complete VENUS-F core, and assessed by modal analysis. Detector types andpositions for robust reactivity monitoring during this experiment are investigated.
3.3.1 Case Study Experimental Results - VENUS-F Control Rod WorthEstimation
For the rod worth experiment, the control rods CR1 and CR2 (with B4C poison)are introduced in the VENUS-F SC1 configuration (as shown in Fig. 3.2, describedin § 1.5.3), driven by a constant beam of about 400 µA (corresponding to a sourceof about 1010 n/s).
The source neutron monitoring on VENUS-F (for the CTF technique) is ex-plained in [Billebaud et al., 2010] and [Uyttenhove and Krasa, 2013]. Theseneutrons should be measured for the CTF monitoring on VENUS-F, rather than
90

3.3. Subcriticality Monitoring during Operation
the beam current. Indeed, due to target consumption, beam positioning etc., thenumber of neutrons produced per unit of current is not constant.
The source neutron monitoring is performed by registration of the α-particlescreated during the D-T fusion reaction in addition to the 14 MeV source neutron.Also the parasitic D-D reaction should be taken into account. During this reactionthere is a 50 % chance to make a 2-3 MeV neutron and a He-3 atom. The other halfof the reactions leads to a proton and a T atom. Therefore, the parasitic sourceneutrons are measured by measuring the protons. The parasitic source neutronshave a (slightly) different angular distribution, therefore the ratio of D-T neutronsto D-D neutrons should be constant in order to assure consistent CTF monitoring.
The study of the source neutron monitoring is ongoing. For the case studyperformed in this work, the runs are performed under constant source neutronproduction. The absolute source neutron production is not precisely known, butnot needed. More important is the need for a constant neutron source productionto avoid changes in the CTF proportionality coefficient c in eq. (1.14) due tochanging source neutron specifications.
The detectors in the reactor are shown in Table 3.1. The control rods are posi-tioned at 600 mm (completely out of the core) and at 0 mm (fully inserted). Thecount rates are measured in both positions with a sampling time of 1 s.
SCFCTF ,exp, defined in eq. (2.54), is determined by scaling the ratio of the detec-tor count rates in the two states to the ratio of the reference reactivities in bothstates. As reference (experimental) reactivity values, -5.06 ± 0.13 $ is taken for theSC1 configuration with CRs up, and -6.25 ± 0.13 $ for the SC1 configuration with
fully inserted CRs [Lecouey et al., 2015b; Lecouey, 2014]. Therefore,ρ′ref ,exp
ρref ,exp=1.24 ±
0.04.
The SCFCTF ,exp for the detectors in the VENUS-F reactor is shown in Fig. 3.20,
varying from 0.987 to 1.132. If SCFCTF ,exp < 1, thenρ′CTF ,exp
ρCTF ,exp<ρ′ref ,exp
ρref ,exp, and thus the
control rod worth is (safely) underestimated. E.g. for SCFCTF ,exp=0.987 (detector8), ρ′CTF ,exp=-6.19 ± 0.18 $, a safe underestimation of the true value of -6.25 ± 0.13
$4.
Close to the perturbation (detectors 7, and in less extent 2 and 3) the control
4The major part of the uncertainty on both reactivity values is due to the reference reactivityuncertainty, applied to determine both ρ′ref ,exp and ρ′CTF ,exp. This is a systematic error, therefore wecan make the conclusion about underestimation.
91
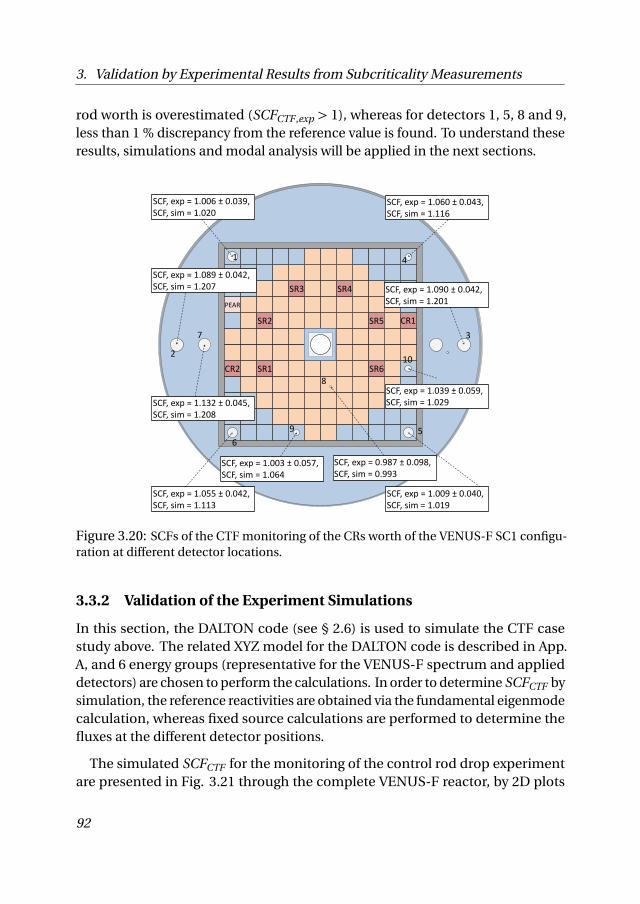
3. Validation by Experimental Results from Subcriticality Measurements
rod worth is overestimated (SCFCTF ,exp > 1), whereas for detectors 1, 5, 8 and 9,less than 1 % discrepancy from the reference value is found. To understand theseresults, simulations and modal analysis will be applied in the next sections.
SR2
SR1 SR6
SR5
SR3 SR4
CR1
CR2
PEAR
SCF, exp = 1.006 ± 0.039, SCF, sim = 1.020
SCF, exp = 1.089 ± 0.042, SCF, sim = 1.207 SCF, exp = 1.090 ± 0.042,
SCF, sim = 1.201
SCF, exp = 1.060 ± 0.043, SCF, sim = 1.116
SCF, exp = 1.009 ± 0.040, SCF, sim = 1.019
SCF, exp = 1.055 ± 0.042, SCF, sim = 1.113
SCF, exp = 1.132 ± 0.045, SCF, sim = 1.208
SCF, exp = 0.987 ± 0.098, SCF, sim = 0.993
SCF, exp = 1.003 ± 0.057, SCF, sim = 1.064
SCF, exp = 1.039 ± 0.059, SCF, sim = 1.029
1
2
3
4
5 6
7
8
9
10
Figure 3.20: SCFs of the CTF monitoring of the CRs worth of the VENUS-F SC1 configu-ration at different detector locations.
3.3.2 Validation of the Experiment Simulations
In this section, the DALTON code (see § 2.6) is used to simulate the CTF casestudy above. The related XYZ model for the DALTON code is described in App.A, and 6 energy groups (representative for the VENUS-F spectrum and applieddetectors) are chosen to perform the calculations. In order to determine SCFCTF bysimulation, the reference reactivities are obtained via the fundamental eigenmodecalculation, whereas fixed source calculations are performed to determine thefluxes at the different detector positions.
The simulated SCFCTF for the monitoring of the control rod drop experimentare presented in Fig. 3.21 through the complete VENUS-F reactor, by 2D plots
92

3.3. Subcriticality Monitoring during Operation
at different heights above the centre of the core. One notices almost everywhereinside the reactor SCFCTF > 1, i.e. an (unsafe) overestimation of the control rodworth. Only inside a quasi-sphere of 20 cm around the centre of the core, thecontrol rod worth is underestimated. Close to the perturbations (i.e. the controlrods) high values of SCFCTF are found. The effect of the VENUS-F bunker (see§ 3.2.2) on this experiment is not relevant, as two static states of the VENUS-Freactor are compared, with the same systematic error from the bunker.
When comparing the experimental results to the ones obtained by simulations(see also Fig. 3.20), one notices the same tendencies in SCFCTF . Absolute num-bers, however, differ significantly. The SCFs obtained by simulations turn out tobe systematically higher than the experimental values (except for detector 10),especially closer to the perturbation (detectors 2, 3, 6 and 7). This can be due tothe limitations of diffusion theory to model local perturbations. The experimentalcontrol rod worth is 861 ± 28 pcm, whereas DALTON only finds 802 pcm.
3.3.3 Interpretation by Modal Analysis
Modal analysis is applied to understand the behaviour of SCFCTF . The modalexpression for SCFCTF , provided by eq. (2.54), is shown in Fig. 3.22 and comparedto the simulation results for the lowest energy group. The interpretation is morecomplex for this experiment than for absolute reactivity measurement techniquessuch as the PNS area method, as two reactivity states are compared.
In the centre of the core, the modal SCFCTF is almost identical to the simulatedone for the case of one mode. This effect appears due to the small difference inamplification of the fundamental mode between the original and the perturbedstate to obtain the full flux (see eq. (2.6)), given the small change in keff betweenthe two states.
A slightly asymmetrical profile of SCFCTF is found at the core-reflector interface,because of the asymmetrical position of the control rods around the X-axis. Muchmore modes are needed to approach the simulated SCFCTF in that region, asmodes with local maxima at those zones will be amplified. These modes affectalso the SCFCTF in the centre of the core.
Being the first higher mode with a maximum in the centre of the core, the 9thmode is again important as lower order modes (high
ρ1ρn
) with centre in the core
are strongly amplified (high SnS1
). SCFCTF = 1 is found around the zero crossing ofthe 9th mode, which is almost identical for the original and perturbed state.
93

3. Validation by Experimental Results from Subcriticality Measurements
Figure 3.21: Simulated CTF SCF for the lowest energy group (i.e. group 6) at differentheights in the VENUS-F SC1 configuration: 0 cm (center of the core), 20 cm (fuel), 39 cm(top reflector) and 59 cm (top reflector). Contour lines are indicated from 0.95 to 1.2. Thedashed line corresponds to the boundary of the 12x12 grid in which the assemblies areloaded, indicated in grey in Fig. 3.2. The detector positions are indicated on the pictureat centre height.
3.3.4 Robustness Check on Energy Dependence
In § 3.3.2, SCFCTF ,exp results for the concerned case study are shown for U-235detectors available in the VENUS-F reactor. The experimental results are thereforevalidated by simulations in the lowest energy group. In order to study the effectof the detector type, the simulated SCFCTF is shown in Fig. 3.23 for each energygroup (as defined in Appendix A) of the VENUS-F SC1 model.
Due to the presence of the source neutrons in the first energy group, SCFCTF
is smaller for the first energy group in the centre of the core than for the otherenergy groups. Indeed, given the lower keff level in the perturbed state (indicated
94
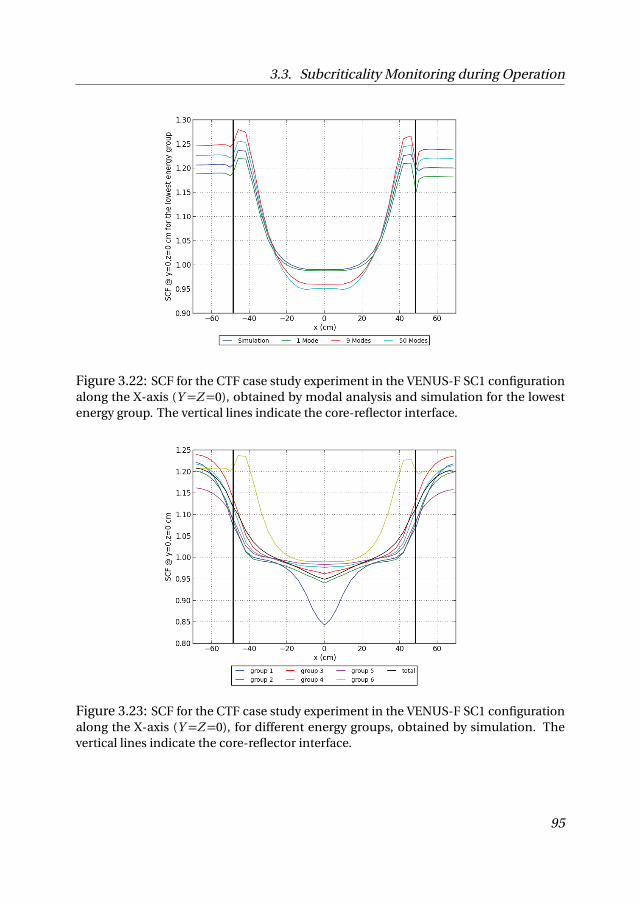
3.3. Subcriticality Monitoring during Operation
Figure 3.22: SCF for the CTF case study experiment in the VENUS-F SC1 configurationalong the X-axis (Y =Z=0), obtained by modal analysis and simulation for the lowestenergy group. The vertical lines indicate the core-reflector interface.
Figure 3.23: SCF for the CTF case study experiment in the VENUS-F SC1 configurationalong the X-axis (Y =Z=0), for different energy groups, obtained by simulation. Thevertical lines indicate the core-reflector interface.
95

3. Validation by Experimental Results from Subcriticality Measurements
with prime), the contribution of the source neutrons is more important in thisstate, leading to SCFCTF differing from unity for the highest energy groups in thecentre of the core.
The location where SCFCTF=1 shifts from 20 cm for group 6 to almost 40 cmfor group 1 on the X-axis. It is also important to notice the specific profile of thelowest energy group. This profile is due to local thermalising elements, such asthe VENUS-F control rods (at the core-reflector interface on the X-axis). One canassume that these effects will less affect the SCFs with increasing energy groups.Therefore, the higher energy groups seem more robust, showing smaller gradientsin SCFCTF . This statement can only be evaluated by simulations in detailed modelswith probabilistic codes, which falls out of the scope of this work.
3.3.5 Conclusion and Outlook
In this section, the control rod drop case study experiment in the VENUS-F SC1configuration is performed in order to understand the SCFCTF for reactivity moni-toring. For a decrease in reactivity (e.g. in this case a local rod drop), an (unsafe)overestimation of the decrease (SCFCTF > 1) is obtained in the reflector zone andclose to the perturbation. The SCFCTF for this experiment is close to unity inthe centre of the core. The U-235 detectors used in this experiment are moresensible for the concerned experiment because of the B4C in the control rods,which causes a broader zone with SCFCTF > 1.
Qualitative agreement is found between experimental results and simulations,although the DALTON diffusion code is not able to simulate SCFCTF for this ex-periment quantitatively correct. The simulations overestimate the experimentalresults. For accurate SCFCTF values, probabilistic transport codes are needed toassess local perturbations. Modal analysis enhances the understanding of theglobal behaviour of the SCFCTF through the subcritical reactor.
The final aim of the current-to-flux monitor is to track global and local per-turbations in the core, causing changes in reactivity, for operational and safetyreasons. Only one case study with a local perturbation is examined in this sec-tion. More research in this field is performed in the next chapter, where reactivitymonitoring will be assessed for a power ADS, with probabilistic codes. Therefore,in this chapter, no conclusions on reactivity monitoring are made.
96

3.4. Interim Reactivity Cross-Checking Techniques
3.4 Interim Reactivity Cross-Checking Techniques
During normal operation, an interim cross-checking of the CTF reactivity monitorcan be required, as explained in § 3.3. The (beam interruption) source jerk (SJ)technique (presented in § 1.3.2) is selected in § 1.3.8 as interim reactivity cross-checking technique. Thanks to experimental results from the VENUS-F ADS, thechoice of the beam interruption frequency and period is assessed in this chapter,simulated SCFs (as defined in eq. (2.61) withΣd (E )=1) are evaluated and analysed,and robust detector types and positions are determined.
3.4.1 Source Jerk Experiments in VENUS-F SubcriticalConfigurations
Several (beam interruption) SJ experiments are carried out in various VENUS-Fconfigurations with different subcriticality levels and varying core heterogeneity,as presented in [Chevret et al., 2014; Chevret, 2014b], in order to test the robustnessof this method. In this section, only the source jerk experiment results from thestandard SC1 configuration (see Fig. 3.2) are evaluated, as this is the standardstate at the foreseen operational keff level of an ADS. The detectors in this reactorare identical to the ones used for the PNS experiment (see Table 3.1).
For the SJ experiments described in this section, the continuous beam of 400 µAis interrupted for 2 ms every 25 ms (i.e. a frequency of 40 Hz), and corrected with astability factor to compensate for the instability of the beam after the interruption(see [Chevret et al., 2014]). Due to the low flux of the VENUS-F ADS, about 105
beam interruptions are needed to obtain sufficient statistics on the count rates.Similar to the PNS experiments from § 3.2, the alternative pathway as describedin § 3.1 provides a reference reactivity of -5.06 ± 0.13 $ [Lecouey et al., 2015b;Lecouey, 2014] (CRs at 600 mm). This reference level allows an evaluation ofSCFSJ , defined by eq. (2.61).
Experimental SCFSJ in the VENUS-F SC1 configuration, from [Chevret et al.,2014], are shown in Fig. 3.4, and compared to the PNS method results from § 3.2.Similar to the PNS method, the reference reactivity uncertainty is contributingsignificantly to the total uncertainty on the SJ results. The results obtained byboth techniques underestimate the absolute reactivity level (i.e. SCF < 1) in the(inner and outer) reflector zone, which is safe. For detector 8 inside the fuel, bothPNS and SJ results match the reference reactivity value. The SCFSJ for detector 2,3 and 7 are the smallest, due to global and local thermalising elements [Chevret,
97

3. Validation by Experimental Results from Subcriticality Measurements
2014a]. This effect is even stronger for the SJ technique than for the PNS areamethod.
The obtained experimental SCFSJ are successfully validated against preciseMCNP simulations in [Chevret et al., 2014]). This work aims to simulate andunderstand the spatial behaviour of the SJ technique through the complete sub-critical reactor. This analysis is performed in the next paragraph.
3.4.2 Validation of Experiment Simulations
In this section, the SJ experiment is again simulated with the DALTON diffusioncode (see § 2.6). The related XYZ model for the DALTON code is described inand App. A, and 6 energy groups (representative for the VENUS-F spectrumand applied detectors) are chosen to perform the calculations. For a consistentevaluation of the SCF, the experiment simulation results from DALTON are scaledon a reference keff obtained via an eigenmode calculation in DALTON, using thesame calculation model. Thanks to this approach, SCFSJ for this experiment isdetermined through the complete reactor, and evaluated by experimental resultsfrom the VENUS-F SC1 configuration.
For the SJ experiment simulation, the decay of the full flux in the first 500 µsafter beam stop is simulated. Different decay shapes are found throughout thereactor for the lowest energy group (representative for the U-235 detectors usedfor the VENUS-F experiments), as shown in Fig. 3.24 (with Σd (E )). For the SJexperiment the bunker has a clear influence on the decay shape of the lowestenergy flux in the outer reflector.
Similar to the PNS area method, thermalising elements (not modeled in DAL-TON) can affect the SJ evaluation method for VENUS-F. As shown in Fig. 3 of[Chevret et al., 2014], not all prompt neutron chains have died out in one de-tector in the outer reflector at the end of the beam interruption, affecting themeasurement results of the SJ technique (because of an erroneous determinationof n (1) in eq. (1.12)). Therefore, the use of threshold detectors (or a longer beaminterruption time) can help solving this issue.
Fig. 3.25 shows the behaviour of the simulated SCFSJ through the completeVENUS-F reactor (without bunker), by 2D plots at different heights above thecentre of the core. The behaviour of SCFSJ is almost symmetrical to the centreplane of the VENUS-F SC1 configuration. SCFSJ > 1, an (unsafe) overestimation ofthe subcriticality level, is found inside a sphere of about 20 cm from the centre of
98
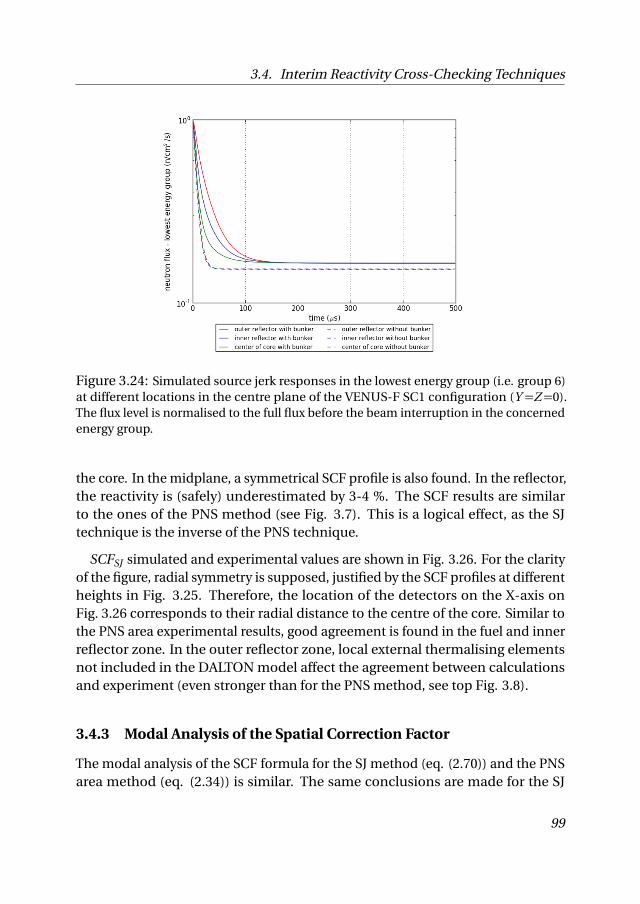
3.4. Interim Reactivity Cross-Checking Techniques
Figure 3.24: Simulated source jerk responses in the lowest energy group (i.e. group 6)at different locations in the centre plane of the VENUS-F SC1 configuration (Y =Z=0).The flux level is normalised to the full flux before the beam interruption in the concernedenergy group.
the core. In the midplane, a symmetrical SCF profile is also found. In the reflector,the reactivity is (safely) underestimated by 3-4 %. The SCF results are similarto the ones of the PNS method (see Fig. 3.7). This is a logical effect, as the SJtechnique is the inverse of the PNS technique.
SCFSJ simulated and experimental values are shown in Fig. 3.26. For the clarityof the figure, radial symmetry is supposed, justified by the SCF profiles at differentheights in Fig. 3.25. Therefore, the location of the detectors on the X-axis onFig. 3.26 corresponds to their radial distance to the centre of the core. Similar tothe PNS area experimental results, good agreement is found in the fuel and innerreflector zone. In the outer reflector zone, local external thermalising elementsnot included in the DALTON model affect the agreement between calculationsand experiment (even stronger than for the PNS method, see top Fig. 3.8).
3.4.3 Modal Analysis of the Spatial Correction Factor
The modal analysis of the SCF formula for the SJ method (eq. (2.70)) and the PNSarea method (eq. (2.34)) is similar. The same conclusions are made for the SJ
99

3. Validation by Experimental Results from Subcriticality Measurements
Figure 3.25: Simulated SJ SCF for the lowest energy group (i.e. group 6) at differentheights in the VENUS-F SC1 configuration: 0 cm (center of the core), 20 cm (fuel), 39 cm(top reflector) and 59 cm (top reflector). The dashed line corresponds to the boundary ofthe 12x12 grid in which the assemblies are loaded, indicated in grey in Fig. 3.2.
method as for the area method in § 3.2.3.
3.4.4 Conclusion and Outlook
The SJ method is investigated for interim reactivity cross-checking in this section.The beam interruption experiment is simulated, analysed and validated by expe-rimental data for the VENUS-F SC1 configuration. The spatial dependence forthis method is similar to one for the PNS method, which allows a fixed detectorpositioning for absolute reactivity measurements during start-up and operationof a zero-power ADS.
Again, a safe overestimation of the reactivity level is found in the reflector (SCFSJ
< 1). For the SJ experiments in the VENUS-F SC1 configuration, around 105 beam
100

3.5. Conclusion and Outlook
Figure 3.26: Simulated SJ SCF (line) and measurement results (dots) across the X-axis inthe centre plane of the VENUS-F SC1 configuration (Y =Z=0). As the detector locationsare not on the X-axis, the corresponding radius to the centre of the core is shown in thisfigure. The vertical line indicates the core-reflector interface.
interruptions are needed to obtain sufficient statistics on the reactivity level, whichtakes about 500 s. For a power ADS with a higher flux level, less beam interruptionscould be needed, but special attention should be paid to thermalising elements.This issue is discussed in § 4.3.5.
3.5 Conclusion and Outlook
In this chapter, the theoretical analysis from Chapter 2 of the spatial correctionfor the candidate reactivity measurement techniques is validated by experimentalresults from the VENUS-F zero-power facility. First, the results from a ‘reference’subcritical state are presented, obtained via an alternative methodology, whichallows the validation of the candidate subcriticality measurement techniques.
Concerning start-up of ADS, the PNS area method is selected, rather than theISJ method, which shows the same spatial dependence but with higher uncertain-ties. Thanks to the repetitive character of the PNS area method, better statisticsare gained at low flux levels or deep subcritical levels than for the ISJ method.Moreover, the uncertainty on the ISJ method always comprises the uncertainty
101

3. Validation by Experimental Results from Subcriticality Measurements
on the delayed neutron parameters.
Global agreement between experiments and simulations is found for the PNSarea method. The reflector zone is the recommended location for detector posi-tioning during VENUS-F start-up: a robust, safe overestimation (SCFarea < 1) isfound for the different subcriticality levels, and the gradient of SCFarea is small.For the VENUS-F SC1 configuration, the simulated SCFarea=0.96-0.97, thereforethe simulated??ρarea
?? is 111-148 pcm higher than??ρref
??= 3709 pcm. Modal analysisallows, via the study of the 9th eigenmode, the identification of the boundarybetween SCFarea > 1 and SCFarea < 1.
For interim cross-checking of the reactivity, the same spatial dependence isfound for the SJ technique as for the PNS area method, which allows the use ofthe same detector locations for start-up reactivity measurements as for interimreactivity cross-checking.
The SCF of both methods are sensitive to (local and global) thermalising ele-ments, not modelled in detail in the DALTON diffusion code models. For the SJtechnique, they imply a longer beam interruption time, which could cause unac-ceptable thermal stresses in power ADS. To avoid this issue, the use of thresholddetectors is recommended for these techniques.
ADS reactivity monitoring during operation is performed by means of theCurrent-to-Flux (CTF) technique. The CTF monitor aims to detect sudden changesin reactivity (due to local perturbations) for safety purposes, and the follow-upof burn-up, a global reactivity change, for operational purposes. Unfortunately,the DALTON diffusion code is not able to model quantitatively correctly the localreactivity changes. The trends in SCFCTF for monitoring local perturbations arehowever clear, and are investigated for the control rod drop case study experi-ment in the VENUS-F SC1 configuration. The control rod worth in the SC1 stateis (unsafely) overestimated in almost the complete reactor (SCFCTF > 1), except inthe centre of the core.
More insight into reactivity monitoring on ADS will be gained in the next chapter.Then the follow-up of burn-up in the core of a power ADS will be monitored, andlocal perturbations will be simulated, in order to identify and quantify incidentscenarios. This will be done by means of a probabilistic transport code, able toovercome the limitations of diffusion theory and deterministic codes.
102

4SUBCRITICALITY MONITORING
IN A POWER ADS
Everything should be made as simple as possible, but not one bit simpler.
Albert Einstein
Picture: The MYRRHA facility at the SCK•CEN site.
103

4. Subcriticality Monitoring in a Power ADS
MYRRHA is the major ongoing power ADS project in Europe. In this chapter,the MYRRHA reactor will serve as an example of a power ADS to develop a detec-tor positioning strategy for subcriticality monitoring. The development of thisstrategy is based on the theoretical understanding about the spatial dependenceof reactivity measurements in ADS from Chapter 2, applied to the selected subcri-ticality measurement techniques from § 1.3.8. As an outcome of this work, thesubcriticality monitoring conclusions from the zero-power VENUS-F ADS (see §3.5) are extended to MYRRHA.
First, the PNS technique is simulated as a start-up technique. Then, the Current-to-Flux (CTF) monitor is assessed as a relative monitoring technique during theoperational phases of an ADS. The need for recalibration by the source jerk interimcross-checking technique is discussed.
In order to investigate the robustness of the proposed detector positioning stra-tegy, the combination of detector types and signals is considered for the reactivitymonitoring methodology. Moreover, several hypothetical (reactivity) incident sce-narios are simulated to study how they can be detected by the reactivity monitor.
4.1 Selected MYRRHA Subcritical Cores for Reactivity
Monitoring
4.1.1 MYRRHA Cores
The general concept of the MYRRHA ADS is presented in § 1.5, as well as a generalfuel assembly design. A detailed description and motivation for the design ofthe MYRRHA subcritical cores is given in Chapter 12 of [Sarotto, 2012] and in[Malambu and Stankovskiy, 2012]. In this section two typical subcritical MYRRHA-FASTEF cores are presented, used to investigate subcriticality monitoring.
The MYRRHA Beginning-Of-Life Core
The Beginning-Of-Life (BOL) core is the first core that will be loaded after con-struction of the MYRRHA facility. The core inventory is shown in Fig. 4.1. 58 freshfuel assemblies with 30 wt. % enriched Pu (including 1.65 wt. % Am) are loaded,in order to obtain a keff value approximating 0.96 (this value is motivated in §1.6.1). The core is completed by the spallation target in the central position, 6satellite In-Pile Sections (IPS) to host experiments, 6 control rods, 38 LBE dummyassemblies and 42 YZrO reflector assemblies at the core boundary.
104

4.1. Selected MYRRHA Subcritical Cores for Reactivity Monitoring
spallation target
fuel assembly
IPS
Pb-Bi reflector dummy assembly
control rod
YZrO reflector assembly
Figure 4.1: MYRRHA-FASTEF subcritical BOL core at middle height [Malambu andStankovskiy, 2012; Sarotto, 2012].
The first MYRRHA core (BOL) has a calculated keff=0.965 [Malambu and Stankovskiy,2012; Sarotto, 2012], decreasing towards keff=0.948 after 90 days of irradiation (i.e.the cycle duration). After the first cycle, new fuel assemblies will be added stepby step, in order to obtain an equilibrium core with a fixed reactivity decreaseof about 1500 pcm during the cycle. The evolution of keff in the transition fromthe BOL to the equilibrium Beginning-Of-Cycle (BOC) core is shown in Fig. 4.2.About 7 cycles are needed to obtain equilibrium conditions.
The MYRRHA Subcritical Equilibrium Core
The MYRRHA subcritical equilibrium core is presented in Fig. 4.3. The core con-sists of 72 fuel assemblies, arranged in 6 concentric zones of fuel with differentburn-up levels. The equilibrium core has a calculated keff=0.967 at BOC, decrea-sing until 0.952 at EOC (End of Cycle). At the end of the cycle, 6 new assembliesare loaded in the second zone. The other zones are reshuffled according to theschedule presented in Fig. 4.4, and the fuel assemblies of zone 5 are discharged.
105

4. Subcriticality Monitoring in a Power ADS
Figure 4.2: Simulated time-evolution of keff from BOL to BOC (from [Sarotto et al., 2013]).
x
x
spallation target
fuel assembly zone 1
fuel assembly zone 2
fuel assembly zone 3
fuel assembly zone 4
fuel assembly zone 5
fuel assembly zone 6
IPS
Pb-Bi reflector dummy assembly
control rod
YZrO reflector assembly
Figure 4.3: MYRRHA-FASTEF subcritical BOC core at middle height [Malambu andStankovskiy, 2012; Sarotto, 2012]. The assemblies indicated by a cross are used in § 4.4for incident scenario studies.
106

4.1. Selected MYRRHA Subcritical Cores for Reactivity Monitoring
Figure 4.4: Reshuffling scheme of the MYRRHA-FASTEF subcritical equilibrium core.
4.1.2 Case Studies during Normal Operation
In this chapter, the selected subcriticality monitoring techniques from § 1.3.8 aretested for specific power ADS characteristics on the MYRRHA cores. First the PNSarea method will be checked as start-up monitoring technique on the Cold ZeroPower (CZP) core, i.e. the MYRRHA BOL core from Fig. 4.1 at room temperature.
Beyond the CZP state, no long beam interruptions are allowed any more duringnormal ADS operation. Only a few long beam interruptions are allowed perMYRRHA cycle, because they cause considerable thermal stresses in the structuralmaterials. The reactivity will be monitored by the Current-to-Flux (CTF) monitor,eventually combined with short beam interruptions for reactivity recalibration. Inthis work, the need for this recalibration is investigated between three importantstates in ADS operation:
• during heating up of the core from CZP to Hot Full Power (HFP) on the BOLcore (temperature feedback)
• during the reaching of the equilibrium core, i.e. between the BOL and theBOC core (core enlargement)
• during burn-up of an equilibrium core, i.e. between the BOC and EOCequilibrium core (core composition and thus spectrum change)
107

4. Subcriticality Monitoring in a Power ADS
4.1.3 Calculational Tools and Methods
Two numerical codes are used for the simulation of the selected reactivity mea-surement techniques for MYRRHA. The DALTON code (see § 2.6.1) is used for themodelling of the PNS area method (see § 2.6.2) for start-up reactivity monitoring
of the MYRRHA core (see § 4.2). Considering the time-dependent character ofthe simulations, the use of deterministic codes is recommended to reduce calcu-lational costs. Moreover, as there is only one type of fuel assembly loaded in thecore, the analysed MYRRHA BOL core is considered homogeneous (apart from theIPS). This allows the use of a diffusion code to understand the spatial dependenceof this experimental technique.
For the reactivity monitoring during operation (see § 4.3 and further sections),static simulations are performed to investigate the CTF monitor. Therefore, pre-cise Monte Carlo calculations are performed using MCNP(X) [MCNP Team, 2005;Pelowitz, 2011]. Flux or fission rates in a fixed source subcritical core will be simu-lated and compared to a reference keff value. Moreover, a mesh superimposedon the geometry (TMESH card) allows the 3D interpretation of the SCF for thedifferent CTF experiment simulations.
4.2 Subcriticality Monitoring during Start-up
In Chapter 3 the different candidate reactivity monitoring techniques are testedon the VENUS-F ADS. The PNS area method is selected for start-up reactivitymonitoring, rather than the ISJ method (see § 3.2.5). The reflector zone turnedout to be a suitable detector location (see § 4.6), given the conservative SCF value(SCFarea < 1) and small spatial gradient of SCFarea in this region. In this sectionthe same method will be tested on the MYRRHA BOL core (at CZP) in order toevaluate these conclusions for a power ADS.
4.2.1 Pulse Shapes
Similar to VENUS-F (see § 3.2.2) the PNS technique is simulated in DALTON byintroduction of neutron pulses (of 1 µs in the highest neutron energy group) inthe centre of the MYRRHA BOL core (see Fig. 4.1). The XYZ DALTON model of theMYRRHA BOL core (keff=0.97205) is described in App. B, as well as the 6 energygroups structure (representative for the MYRRHA spectrum) to perform the calcu-lations. At steady state, i.e. after build-up of the delayed neutron contribution, thepulse shapes found in the MYRRHA core are shown in Fig. 4.5 at several locations,
108

4.2. Subcriticality Monitoring during Start-up
for the highest (group 1, representative for threshold detectors) and the lowestenergy group (group 6, representative for thermal detectors).
The outer reflector is in this case located outside the MYRRHA core barrel,whereas the inner reflector corresponds to the Pb-Bi and YZrO reflector assemblies(see Fig. 4.1). The centre core location is in the middle of the fuel zone, not at anIPS position.
Compared to the VENUS-F pulse shapes from Fig. 3.6 without bunker, theMYRRHA PNS experiments will need about a 100 µs period (i.e. the time untilthe prompt neutron chains from the pulse have decayed), twice as long as forVENUS-F. The delayed neutron level of the thermal energy group (indicated bythe dashed line) does not vary in the MYRRHA core, whereas this level increasesfurther away from the centre of the core for the VENUS-F pulse shapes. Withouttaking into account influencing (thermalising) elements outside the reactor, thedetector type influence on the PNS pulse shape is slightly smaller for the MYRRHAcore than for the VENUS core. The presence of the IPS does not affect the PNSpulse shapes in the core.
Figure 4.5: Simulated PNS responses for different neutron energies at different loca-tions along the X-axis (Y =Z=0 cm) in the MYRRHA BOL core (at CZP). The flux levelcorresponds to a unit source strength implemented in the highest energy group duringthe first time step of 1 µs.
109

4. Subcriticality Monitoring in a Power ADS
4.2.2 Spatial Correction Factors
The simulated SCF for the area method is shown for the detectors that monitorthe six energy groups of the MYRRHA BOL core model (see App. A) in Fig. 4.6at centre height. The choice of the centre height for detector positioning forstart-up reactivity monitoring is motivated by modal analysis in § 2.2.2. Althoughthe MYRRHA spallation neutron source is not a point source, the modelling as apoint source in the centre core is an acceptable approximation for simulations[Malambu and Stankovskiy, 2012], which motivates the choice of the centre planefor detector positioning.
The behaviour of SCFarea for the MYRRHA BOL core is similar to the one of theVENUS-F SC1 core (presented in Fig. 3.7 for the lowest energy group). Insidea sphere in the centre of the core with radius 25 cm, SCFarea > 1. Outside thissphere, the absolute reactivity value is (safely) underestimated (SCFarea < 11). Forhigher energy groups, one notices a local decrease in SCF (still smaller than unity)around the IPS locations.
For all energy groups, SCFarea shows a small gradient in the outer reflector,varying from 0.96-0.97 for the highest energy group up to 0.97-0.99 for the lo-west energy group. Therefore, with thermal detectors, the absolute reactivity isunderestimated by 3 % at maximum, i.e. 86 pcm on a value of 2875 pcm.
Similar to VENUS-F (see § 3.2.3), the profile of the MYRRHA SCFarea for thePNS experiment can be explained by modal analysis. The typical shapes of theMYRRHA eigenfunctions are similar to the ones of VENUS-F. Also the zero cros-sings of the 9th eigenfunction (see Fig. 4.7) are for the MYRRHA core at aboutthe same radius from the centre of the core than for the VENUS-F core for thedifferent energy groups. This is due to the similar radial dimensions for fuel andreflector of the considered VENUS-F and MYRRHA cores.
4.2.3 Recommendations for Subcriticality Monitoring duringStart-up
Based on PNS experiment simulations for the MYRRHA power ADS, we confirmthe conclusions from the zero-power VENUS-F experiment in § 3.2.5 for start-up
1For absolute measurement techniques (such as the area method), SCF<1 indicates an un-derestimation of the true absolute reactivity level. Indeed, as defined in eq. (2.17), SCFarea=
ρareaρref
.
If SCFarea<1,??ρarea
??<??ρref
??, therefore via the area method, a keff value higher than the true one ismeasured, which is a safe approach.
110

4.2. Subcriticality Monitoring during Start-up
reactivity monitoring. The reflector is the appropriate zone for detector positio-ning during start-up. In that region, the gradient of the SCF for the area methodis small and SCFarea remains smaller than unity (a safe underestimation of theabsolute reactivity level) during core loading. Thermal detectors are most suitablefor the reactivity measurements (if no thermalising elements are present), as theirSCFarea is closest to (but smaller than) unity.
For the MYRRHA core, we can add that local perturbations in the fuel zone (suchas IPS) do not influence the global profile of the SCF for the PNS area method.The first higher eigenmode with a maximum in the core remains a considerablecontributor to the full flux profile, and its zero crossing remains the boundarybetween SCFarea smaller or bigger than unity.
111

4. Subcriticality Monitoring in a Power ADS
Figure 4.6: Simulated SCFarea for highest (i.e. group 1, top left) to the lowest (i.e. group 6,bottom right) energy group in the MYRRHA BOL core at centre height. The black circleindicates the MYRRHA core barrel.
112

4.2. Subcriticality Monitoring during Start-up
Figure 4.7: XY (z=0) plots of the 9th eigenfunction for each energy group of the MYRRHAmodel of the BOL core, from the highest (top left) to the lowest (bottom right) energylevel. The black circle indicates the MYRRHA core barrel.
113

4. Subcriticality Monitoring in a Power ADS
4.3 On-line Subcriticality Monitoring during Normal
Operation
4.3.1 Aim and Method
In this section the evolution of the SCF of the CTF monitor is assessed duringnormal operation. Therefore, SCFCTF is studied for the three phenomena duringnormal operation, presented in § 4.1.2: temperature feedback, core enlargementand core burn-up.
For each operational stage, the SCFCTF is examined for 3600 sampling pointsin a 100x100 cm2 square in the centre plane of the MYRRHA core, as shown inthe next figures. For an ADS with source in the centre of the core, the midplaneis most suitable having the lowest SCFCTF (see Chapter 2, in particular § 2.3.2).Due to the high computational time, it is difficult to obtain SCF values with anacceptable uncertainty (smaller than 1 %) outside this square area. Deterministic(mode) calculations show however the constant SCF value in the outer reflector ifno perturbation occurs in that region.
All reference reactivity values as well as CTF fission rates are obtained via MC-NPX calculations (see § 4.1.3), using the MYRRHA-FASTEF model from [Stankovskiyand Malambu, 2011] presented in [Malambu and Stankovskiy, 2012].
As detector signals can be combined for reactivity monitoring, 5 zones of de-tector locations are identified: the outer reflector (outside the core barrel, 64samples), the inner reflector (inside the core barrel, 64 samples), the completereflector (i.e. with the core barrel region, 256 samples), the core (i.e. without thespallation target zone, 256 samples) and the total reactor (i.e. core and completereflector, 1024 samples).
This exercise is performed with as much as possible detector locations, inorder to define the SCF boundaries via the minimum and maximum values, andto estimate the variance of the SCFs per zone. In reality, a limited number ofpositions are available for monitoring because of practical and technologicalconstraints. Therefore, in-core instrumentation will become difficult to install inthe MYRRHA core [Vermeeren, 2015].
At the writing of this thesis, the detector type and operation mode for theMYRRHA reactor are not yet defined. Most probably, fission chambers will bechosen, seen their flexibility in mass, operation mode and spectrum [Vermeeren,
114

4.3. On-line Subcriticality Monitoring during Normal Operation
2015]. Therefore, the reactivity monitoring is simulated in this section for a ther-mal (U-235) and a threshold (Np-237) detector, to investigate the influence of thedetector spectrum on the SCFCTF .
4.3.2 From Cold Zero Power to Hot Full Power at Beginning Of Life
As a first step the CTF is assessed for the monitoring of the temperature feedbackeffect during start-up, which causes a decrease on keff level. Suppose the referencereactivity level is obtained (at room temperature) via the PNS technique (see§ 4.2), by applying the proper SCF for the PNS technique. From this level thereference proportionality coefficient c of the CTF technique can be obtained ateach position in the reactor via eq. (1.14).
The SCFCTF2 to be applied on c is shown in Fig. 4.8 for the 2 detector types at
centre height, supposing??ρCTF
??=??ρref
??=2875 ± 5 pcm (calibrated) and???ρ′ref
???=3696
± 5 pcm. The prime state concerns the new HFP reactivity level at the MYRRHAoperating temperatures (see [Malambu and Stankovskiy, 2012]). Without recal-ibrating c , SCF varies between 0.95 and 1.03 for the U-235 detector, and frombelow 0.9 to 1.03 for the Np-237 detector in the centre plane of the core.
Table 4.1 shows SCFCTF ,av for this case study for different detector types andzones defined in § 4.3.1. The threshold detectors provide (unsafe) overestimationsof SCFCTF ,av by 1.1 % at maximum, whereas the thermal detectors overestimateup to 2.2 %.
By monitoring with threshold detectors only in the core, the reactivity monito-ring is almost correct (SCFCTF ,av=0.999) with a 0.011 standard deviation on theSCF value. This location will be excluded however as a candidate monitoring zone,due to practical constraints [Vermeeren, 2015]. Therefore, the (inner) reflectorzone will be chosen. In this region SCFCTF ,av=1.011 for threshold detectors, whichmeans an unsafe overestimation of the absolute reactivity decrease by 41± 7 pcm.On the reference reactivity of 3696 ± 5 pcm in the prime state, this means an errorof 1.1 %.
The temperature feedback effect would not be noticed at locations whereρCTF
ρ′CTF=1, i.e. at locations where SCFCTF ,av=
ρref
ρ′ref, being 1.344. This will nowhere
be the case.
2SCFCTF is defined in eq. (2.48). SCFCTF > 1 indicates in this case an unsafe overestimation ofthe new absolute reactivity value, SCFCTF < 1 a safe underestimation.
115

4. Subcriticality Monitoring in a Power ADS
Figure 4.8: SCFCTF for the MYRRHA BOL core temperature feedback at centre height,for a U-235 (top) and Np-237 detector (bottom). The maximum relative uncertainty onSCFCTF is 1 %. The black circle indicates the MYRRHA core barrel.
116

4.3. On-line Subcriticality Monitoring during Normal Operation
Reactor Zone U-235???ρ′CTF ,av
??? SCFCTF ,av σ max min
outer reflector 3770 1.020 0.004 1.031 1.012inner reflector 3777 1.022 0.004 1.029 1.013total reflector 3774 1.021 0.004 1.031 1.008
core 3751 1.015 0.011 1.029 0.985total reactor 3774 1.021 0.007 1.034 0.985
Np-237???ρ′CTF ,av
??? SCFCTF ,av σ max min
outer reflector 3737 1.011 0.007 1.029 0.994inner reflector 3737 1.011 0.003 1.016 1.002total reflector 3737 1.011 0.005 1.029 0.994
core 3692 0.999 0.011 1.011 0.954total reactor 3729 1.008 0.008 1.029 0.954
Table 4.1: Overview of SCFCTF between the CZP core (??ρref
??=2875 ± 5 pcm) and the HFP
BOL core (???ρ′ref
???=3696 ± 5 pcm) in the centre plane of the MYRRHA core for a U-235
(thermal) and Np-237 (threshold) detector. For the different reactor zones, the averageSCF and its standard deviation σ is given, as well as the minimum and maximum SCFvalue.
4.3.3 From Beginning Of Life to Begining Of Cycle
Before reaching the MYRRHA equilibrium core (from Fig. 4.3), different coreswith increasing amount of fuel assemblies (and increasing fuel burn-up) areloaded. The evolution of keff for these cores is shown in Fig. 4.2. The monito-ring of the increase in keff between the first (BOL, calibrated e.g. via source jerk,??ρCTF
??=??ρref
??=3696 ± 5 pcm) and last (BOC,???ρ′ref
???=3193 ± 5 pcm) core at power,
before reaching equilibrium, is evaluated by SCFCTF in Fig. 4.9 for both thermal(U-235) and threshold (Np-237) detectors.
In this case, a different behaviour is noticed between thermal and thresholddetectors. Whereas the U-235 detectors unsafely overestimate the increase in keff
(SCFCTF ,av > 1, up to 1.612 in the core), the Np-237 detectors show SCFCTF ,av lowerand higher than unity in the different reactor zones.
Table 4.2 shows the average SCFCTF for different detector types and zones. The
117

4. Subcriticality Monitoring in a Power ADS
average of the set of threshold detectors in the outer reflector provides the re-activity level correctly (SCFCTF ,av=0.991), although the difference between theminimum and maximum SCF is considerable. At locations with SCFCTF=
ρref
ρ′ref=1.16
(e.g. in the core with a thermal detector), the change in reactivity is not detected.
Figure 4.9: SCFCTF from the MYRRHA BOL to BOC core, at centre height, for aU-235 (top) and a Np-237 (bottom) detector. The maximum relative uncertaintyon SCFCTF is 1 %. The black circle indicates the MYRRHA core barrel.
118

4.3. On-line Subcriticality Monitoring during Normal Operation
Reactor Zone U-235???ρ′CTF ,av
??? SCFCTF ,av σ max min
outer reflector 3397 1.064 0.007 1.082 1.047inner reflector 3487 1.092 0.024 1.177 1.069total reflector 3429 1.074 0.017 1.177 1.047
core 3864 1.210 0.148 1.612 1.082total reactor 3605 1.129 0.103 1.612 1.047
Np-237???ρ′CTF ,av
??? SCFCTF ,av σ max min
outer reflector 3164 0.991 0.017 1.031 0.954inner reflector 2944 0.922 0.030 0.983 0.860total reflector 3081 0.965 0.036 1.042 0.860
core 3238 1.014 0.131 1.192 0.761total reactor 3129 0.980 0.085 1.192 0.761
Table 4.2: Overview of SCFCTF between the BOL core (??ρref
??=3696 ± 5 pcm) and the
BOC equilibrium core (???ρ′ref
???=3193 ± 5 pcm) in the centre plane of the MYRRHA core,
for a U-235 (thermal) and Np-237 (threshold) detector. For the different reactor zones,the average SCFCTF and its standard deviation σ is given, as well as the minimum andmaximum SCF value.
4.3.4 Monitoring the burn-up of an equilibrium cycle
During a MYRRHA equilibrium cycle, the reactivity decreases from??ρref
??=3193
± 5 pcm (BOC) to???ρ′ref
???=4987 ± 5 pcm (EOC). The impact on SCFCTF is shown in
Fig. 4.10 for the two different detector types at centre height.
Although the reactivity variation is considerably higher in this case than be-tween the BOL and BOC cores (in § 4.3.3), SCFCTF slightly smaller than unity (asafe approach) is found, except close to the centre of the core.
119

4. Subcriticality Monitoring in a Power ADS
Figure 4.10: SCFCTF between BOC and EOC of the MYRRHA equilibrium core, in theMYRRHA centre plane, for a U-235 (top) and a Np-237 (bottom) detector. The maximumrelative uncertainty on SCFCTF is 1 %. The black circle indicates the MYRRHA core barrel.
Table 4.3 shows SCFCTF in different zones of the MYRRHA core with differenttypes of detectors. One notices a similar behaviour of both detectors in the diffe-rent regions of the reactor. The average SCFCTF varies between 0.971 and 0.982 fora U-235 detector, and between 0.981 and 0.989 for a Np-237 detector. A noticeable
120

4.3. On-line Subcriticality Monitoring during Normal Operation
difference between the reactor core and the reflector can be found, due to thehigher gradient of SCFCTF in the centre of the core. Therefore, for both detectors,the smallest standard deviation for SCFCTF can be found in the (inner) reflector(σ=0.004).
For this case, threshold detectors in the inner reflector are the optimal choice,as they safely underestimate the decrease in absolute reactivity by 55 pcm.
Reactor Zone U-235???ρ′CTF ,av
??? SCFCTF ,av σ max min
outer reflector 4892 0.981 0.005 0.990 0.966inner reflector 4897 0.982 0.003 0.991 0.973total reflector 4897 0.982 0.004 0.994 0.966
core 4842 0.971 0.011 0.983 0.929total reactor 4882 0.979 0.008 0.998 0.929
Np-237???ρ′CTF ,av
??? SCFCTF ,av σ max min
outer reflector 4912 0.985 0.008 1.003 0.969inner reflector 4932 0.989 0.003 0.998 0.983total reflector 4922 0.987 0.006 1.004 0.969
core 4892 0.981 0.018 0.996 0.896total reactor 4922 0.987 0.010 1.004 0.896
Table 4.3: Overview of the SCFCTF for burn-up monitoring between BOC (??ρref
??=3193 ± 5
pcm) and EOC (???ρ′ref
???=4987 ± 5 pcm) in the centre plane of the MYRRHA core for a U-235
(thermal) and Np-237 (threshold) detector. For the different reactor zones, the averageSCFCTF and its standard deviationσ is given, as well as the minimum and maximum SCFvalue.
4.3.5 Role of the Interim Cross-checking of the Absolute ReactivityLevel
At the time of writing of this thesis, the MYRRHA accelerator beam interruptiontime and frequency still need to be specified. If a short beam interruption couldbe repeated on the continuous MYRRHA beam, the source jerk method (see §1.3.2) is a candidate for interim cross checking. This method allows the operatorto obtain an absolute reactivity value (in dollars). The applicability of this methodon a power ADS depends however on several issues.
121

4. Subcriticality Monitoring in a Power ADS
At first, the maximum allowable beam interruption time needs to be defined.This time is limited by the maximum allowable thermal stresses in the core andstructural materials. As the beam for the source jerk method behaves inversely tothe PNS method, we can conclude that for the actual MYRRHA model (definedin App. B), a beam interruption time of 200 µs could be sufficient (see Fig. 4.6).This model however does not take into account the thermalising elements out-side the core, which can considerably influence the beam interruption time (seethe bunker effect in VENUS-F, Fig. 3.6). This effect could be reduced by usingthreshold detectors.
Secondly, the time for the beam to restore to its initial level plays a role. Thebeam should be stable again after interruption before a next beam interruptioncan be performed. This stabilisation time determines the source jerk period, i.e.the beam interruption time and the time to restore the beam to its original stablelevel.
Thirdly, the frequency of the beam interruption is under study. Depending onthe number of beam interruptions needed for sufficient statistics, this parameterdetermines the time needed for an interim reactivity cross-check. The measure-ment time will, seen the nature of the method, always be significantly longer thanthe time needed to measure the current-to-flux ratio.
Finally, the required measurement time for acceptable accuracy depends alsoon the type and position of the detector, and its efficiency. Therefore, the relatedconclusions from VENUS-F on the required measurement time for the SJ method(see § 3.4.4) cannot directly be extrapolated to MYRRHA.
The spatial dependence of the source jerk method (see § 2.4.2) is similar to thePNS area method, developed in § 4.2.2 for the MYRRHA BOL core. Also for othercores (e.g. the BOC core), one expects the same behaviour of SCFarea, and thusalso for SCFSJ .
One concludes that at this time, it is too early to draw conclusions about theimportance of the source jerk method for absolute reactivity cross-checking. Itis in any case useful to estimate SCFCTF not only during normal operation, butalso in incident conditions. Although specific instrumentation is foreseen todetect incidents, it is useful to know how the reactivity monitor reacts on differentincident scenarios. This question is studied in the next section.
122

4.4. Robustness of the Reactivity Monitoring against Incident Scenarios
4.4 Robustness of the Reactivity Monitoring against
Incident Scenarios
In this section, the ability of the CTF monitor to detect and identify incidents ina power ADS is checked. From a safety point of view, the maximum operationalsubcriticality level is limited by the maximum positive reactivity insertion duringincidents (see § 1.6.1) in order to avoid criticality and large power excursionsthrough source multiplication. The role of reactivity monitoring in incident con-ditions is therefore different for power ADS than for critical power reactors: inaddition to other instrumentation, the CTF monitor could help to detect abnormalsituations, and to understand the response of detectors to an incident scenario.
In order to understand the behaviour of the CTF monitor during incident sce-narios, three classes of incident scenarios are studied: a local perturbation in thereflector (see § 4.4.1), a local perturbation in the core (see § 4.4.2) and a globalperturbation without reactivity change (see § 4.4.3). All scenarios are applied onthe MYRRHA EOC core (
??ρref
??=4987 ± 5 pcm, determined by MCNPX criticalitycalculations) as example.
4.4.1 Control Rod Expulsion
One of the incident scenarios studied for the MYRRHA core is the control rodexpulsion. In normal operation, the MYRRHA control rods are latched below thecore. When the control system fails, the control rod is propelled by buoyancyforces upwards completely through the core until the upper plenum, as it is lighterthan LBE.
As a first study, the effect of one expulsed control rod (indicated by a cross inFig. 4.3) is studied here. This incident scenario (e.g. in the EOC core) correspondsto a positive reactivity insertion∆ρref of 81 ± 7 pcm.
The measured change in reactivity∆ρCTF for this incident is shown in Fig. 4.11for a thermal and threshold detector at centre height. Both detectors show thesame behaviour, i.e. an unsafe underestimation of the reactivity increase (SCFCTF
> 1) in the core, a (safe) overestimation of the reactivity increase (SCFCTF < 1) closeto the perturbation in the outer reflector, and an (unsafe) underestimation of thereactivity increase (SCFCTF > 1) far away from the perturbation in the reflector.
The effect of combining detector signals is shown in Table 4.4. For each detec-tion zone, the average reactivity change is calculated. All zones provide with both
123

4. Subcriticality Monitoring in a Power ADS
detector types a good monitoring of the reactivity insertion, i.e. maximum of 42pcm error on??ρref
??=4987 pcm (i.e. 0.9 %). The incident in the outer reflector canbe identified by a larger spread in outer reflector SCFCTF values for both detectors.Close to the perturbation, SCFCTF is significantly smaller than unity.
Figure 4.11: Measured change in reactivity ∆ρCTF after control rod expulsion in theMYRRHA equilibrium core at EOL, at centre height, for a U-235 (top) and a Np-237(bottom) detector. The maximum relative uncertainty on∆ρCTF is 1 %. The black circleindicates the MYRRHA core barrel.
124

4.4. Robustness of the Reactivity Monitoring against Incident Scenarios
Reactor Zone U-235 Np-237
outer reflector +76 +81inner reflector +66 +61total reflector +71 +66
core +42 +42total reactor +61 +56
Table 4.4: Overview of the average reactivity increase∆ρCTF ,av in the different reactorzones for the monitoring of a CR expulsion (∆ρref=+81 ± 7 pcm) in the centre plane ofthe MYRRHA EOC core for a U-235 (thermal) and Np-237 (threshold) detector.
4.4.2 IPS Sensitivity
In order to study a case of a positive reactivity insertion in the centre of theMYRRHA core, the IPS indicated by a cross in Fig. 4.3 is replaced by LBE in theequilibrium core at EOC. This incident scenario (e.g. in the EOC core) correspondsto a positive reactivity insertion∆ρref of 161 ± 7 pcm.
The related measured change in reactivity∆ρCTF for this incident is shown inFig. 4.12 for a thermal and a threshold detector at centre height. Only close to theperturbation a considerable overestimation of the reactivity increase is measured.
The combination of signals leads for both detector types to an acceptable mo-nitoring of the reactivity change, presented in Table 4.5. The incident can beidentified by a contradictory behaviour of thermal and threshold detector closeto the perturbation.
125

4. Subcriticality Monitoring in a Power ADS
Figure 4.12: Measured change in reactivity∆ρCTF after a positive reactivity insertion inthe MYRRHA equilibrium core at EOL, at centre height, for a U-235 (top) and a Np-237(bottom) detector. The maximum relative uncertainty on∆ρCTF is 1 %. The black circleindicates the MYRRHA core barrel.
126

4.4. Robustness of the Reactivity Monitoring against Incident Scenarios
Reactor Zone U-235 Np-237
outer reflector +151 +166inner reflector +166 +161total reflector +161 +166
core +151 +166total reactor +161 +166
Table 4.5: Measured change in average reactivity∆ρCTF ,av in the different reactor zonesfor the monitoring of an ADS source height increase (∆ρref=0 pcm) in the centre plane ofthe MYRRHA EOC core for a U-235 (thermal) and Np-237 (threshold) detector.
4.4.3 Source Height Variation
Not only reactivity variations need to be interpreted correctly by the CTF monitor.Also incident scenarios without reactivity changes need to be identified. In thisparagraph the influence of a source height increase of 5 cm (e.g. after beamwindow break, see [Keyers, 2010]) is studied for the MYRRHA EOC core.
The influence of this incident on the estimated reactivity is shown in Fig. 4.13 forboth a thermal and a threshold detector at centre height. This incident is charac-terised by a homogeneous small increase of the measured reactivity through thecomplete core (except close to the spallation source), also shown by the averagevalues∆ρCTF ,av in the different reactor zones in Table 4.6.
127

4. Subcriticality Monitoring in a Power ADS
Figure 4.13: ∆ρCTF after a source height increase in the MYRRHA equilibrium core atEOL, at centre height, for a U-235 (top) and a Np-237 (bottom) detector. The maximumrelative uncertainty on the ∆ρCTF is 1 %. The black circle indicates the MYRRHA corebarrel.
128

4.5. Discussion
Reactor Zone U-235 Np-237
outer reflector +35 +50inner reflector +55 +60total reflector +45 +55
core +60 +65total reactor +55 +60
Table 4.6: Overview of∆ρCTF ,av for monitoring a source height variation in the centreplane of the MYRRHA EOC core (∆ρref=0) for a U-235 (thermal) and Np-237 (threshold)detector.
4.5 Discussion
A combination of relative reactivity monitoring via the CTF monitor and abso-lute measurements via the SJ method is investigated in this thesis for reactivitymonitoring during operation of an ADS. For the MYRRHA ADS, the feasibility ofreproducible stable short accelerator beam interruptions is still under discussiontoday. Therefore, in this chapter the accuracy of the CTF monitor is checkedduring different stages of operation without recalibration to determine the bound-aries of the measurement accuracy.
For the MYRRHA ADS, the CTF monitor provides good reactivity estimates(without recalibration) by intelligent detector positioning. Indeed, for the differentphases of operation, (average) SCFCTF close to unity can be found, when detectorsare simulated in the complete centre plane of the MYRRHA core. In reality, theinstalled number of detectors will be limited by practical constraints and therequired accuracy of the measurement.
To deal with the limitation in number of detectors in a conservative way, theextreme SCF value in the considered detection zone is applied as a boundary.For the three stages considered for normal operation, this is SCFCTF=0.860 (fora threshold detector in the outer reflector core enlargement case, see Table 4.2),indicating an absolute estimated reactivity value of 2746 pcm instead of 3193 pcm,i.e. 447 pcm error in monitoring. Therefore, 500 pcm could be a suitable order ofmagnitude for the accuracy of the CTF monitoring in the MYRRHA core duringADS operation without any recalibration, independent of the detector type.
This first estimation of the accuracy of the CTF monitor shows the methodologyto follow, but needs of course to be finetuned. If possible, the accuracy value could
129

4. Subcriticality Monitoring in a Power ADS
be reduced by interim cross-checking of the absolute reactivity value. Moreover,once the detailed MYRRHA core design is available, this work can be performedin detail, and the evolution of the estimated reactivity during operation can besimulated with additional intermediate steps.
The identification and quantification of reactivity incidents in § 4.4 are morecomplicated than the normal reactivity monitoring presented in § 4.3. In thiswork, three types of incident scenarios are studied to show the reaction of thereactivity monitor to each of them. We conclude that thanks to a combinationof detector signals at different locations, one is able to identify each of thesescenarios.
In reality, too much detectors are required to identify (and quantify) each in-cident scenario (only 3 typical scenarios are studied here). Moreover, specificinstrumentation is foreseen to detect the considered types of incidents. Thisexercise shows however the behaviour of the CTF monitor of each of the typesof incidents. If needed, detectors could be installed in such a way to identify aspecific type of incident, complementary to other instrumentation.
4.6 Conclusion
In this chapter the reactivity monitoring is investigated for the operation of apower ADS. Different positions and types of detectors are investigated to set-up a monitoring tool for the MYRRHA ADS. In order to assure robust reactivitymonitoring, the combination of detector signals in a specific reactor zone isrecommended.
For the start-up of MYRRHA at CZP (keff=0.97205), the same conclusions can bedrawn as for the zero power VENUS-F ADS. The outer reflector in the centre planeof the reactor is the appropriate zone for detector positioning given the smallspatial gradient in the SCF. In this region the absolute reactivity level (in pcm) is(safely) underestimated by maximum 3 % (i.e. 86 pcm on a reference absolutereactivity of 2875 pcm), using thermal detectors. Using threshold detectors, SCFscloser to unity are found, indicating a lower (but still safe) underestimation of theabsolute reactivity level. The use of threshold detectors is however recommended,as it avoids the issue of thermalising elements (see Chapter 3).
For the reactivity monitoring during operation, the use of both thermal andthreshold detectors is studied in different zones of the reactor. During the three
130

4.6. Conclusion
phases of operation of a power ADS, the detector recommendations are shown inTable 4.7, excluding the core as detector location zone for practical reasons. Usingthe appropriate detector type in the inner or outer reflector zone, the (absolute)reactivity can be correctly monitored or the SCFCTF is slightly (safely) smaller thanunity, except for the temperature feedback case. During temperature increase, thereactivity decrease is unsafely overestimated by 1.1 % (i.e. 41 pcm on a referencelevel of 3737 pcm).
Operation Phase??ρref
?????ρ′ref
??? Detectors Positioning??ρ′CTF
?? SCFCTF (σ)
Temperature feedback 2875 3696 THR Inner refl. 3737 1.011 (0.003)Core enlargement 3696 3193 THR Outer refl. 3164 0.991 (0.017)
Fuel burn-up 3161 4987 THR Inner refl. 4932 0.989 (0.004)
Table 4.7: Overview of the detector type and positioning choice for optimum reactivity (ρin pcm) monitoring of the MYRRHA full-power ADS during different phases of operation.??ρref
?? is the calibrated absolute reactivity at the beginning of the phase,???ρ′ref
??? and??ρ′CTF
??
are respectively the true and the CTF reactivity at the end of the phase. THR = Thresholddetector, TH = Thermal detector. All detectors are foreseen to be positioned in the centreplane of the core.
If no SJ reactivity cross-checking can be applied, as a first approach, a conser-vative boundary of 500 pcm is proposed on the measured CTF reactivity duringoperation without correction. This value is derived from the maximum SCF valuefound in the MYRRHA reflector, during operation. To improve the accuracy ofthe measurement, a set of detectors is recommended in the reflector region. Thenumber of detectors will however be determined by practical constraints.
The importance of the CTF monitor accuracy within the monitoring systemwill depend on the role of the Source Jerk (SJ) (absolute re-calibration) techniquespecifications. More information about the accelerator beam is required in orderto estimate the required time for a precise absolute reactivity re-estimation. Thespatial dependence of the SJ method is similar to the PNS area method.
Complementary to normal operation, the CTF monitor could help to detect andlocate incidents. For that purpose three types of incident scenarios are studied: alocal perturbation in the reflector, a local perturbation in the core (both leading toa reactivity increase) and the monitoring of an incident without reactivity change.The way in which these incidents can be detected and quantified is shown in
131

4. Subcriticality Monitoring in a Power ADS
Table 4.8.
In reality, a considerable set of detectors will be required at different locationsin the reactor to identify (and quantify) the different incident scenarios. Therefore,other instrumentation is installed. This exercise could however help to understandthe behaviour of the reactivity monitoring tool on incident scenarios. Moreover,if needed, a detector could be installed at a specific location to identify one typeof incident (e.g. as a back-up in case other instrumentation fails).
Incident ∆ρref Detectors Identification ∆ρCTF
CR expulsion +81 THR/TH Close to pert. +81IPS ejection +161 THR Close to pert. +161
Window break 0 TH/THR Global change +35
Table 4.8: Overview of the detector type, identification zone, and detector positioning foroptimum reactivity variation (ρ in pcm) monitoring of incident scenarios in the MYRRHApower ADS EOC core (
??ρ??=4987 pcm). THR = Threshold detector, TH = Thermal detector.
All detectors are foreseen to be positioned in the centre plane of the core. Incidents canbe identified close to the perturbation or globally in the core.
132

5CONCLUSIONS AND RECOMMENDATIONS
This thesis provides a methodology and set-up of a robust reactivity monitoringtool for Accelerator-Driven Systems (ADS), in order to guarantee a safe margin tocriticality. The robustness of the reactivity monitoring tool is defined in differentfields: the choice of the measurement techniques, the evaluation methods toderive the reactivity from experimental data and the detector type and positioning.
Major achievements in this work are the analytical development of SpatialCorrection Factors (SCFs), to be applied on the reactivity value obtained via pointkinetics evaluation methods. Thanks to modal analysis, one is able to understandthe behaviour of SCFs in a subcritical core and identify robust detector positions.
Modal analysis and experiment simulations are compared to experimentalvalues from the VENUS-F ADS. The outcome of this work provides valuable infor-mation to set up detector positioning rules for zero-power ADS. Moreover, as afinal step, an extrapolation towards a power ADS is made, in order to study theeffect of specific full-power issues (such as temperature feedback and burn-up)on reactivity monitoring.
5.1 Conclusions
The Choice of Static Evaluations of the Selected Measurement Techniques
Based on an evaluation of the existing measurement techniques and experiencefeedback from the previous European project MUSE, a combination of differentexperimental techniques is proposed for ADS reactivity monitoring during all
133

5. Conclusions and Recommendations
stages of operation. The Pulsed Neutron Source (PNS) is selected as absolutereactivity measurement technique for the start-up phase (i.e. from core loadinguntil 1 % of full power). The Current-to-Flux (CTF) relative reactivity monitoris the candidate for reactivity monitoring during operation (i.e. from 1 % offull power on, no long beam interruptions allowed). As the CTF monitor canonly detect changes in reactivity, the short Source Jerk (SJ) interim cross-checkingtechnique is included in the reactivity monitor. This proposal is successfully testedon the VENUS-F zero-power ADS during the GUINEVERE and FREYA EuropeanFramework Programmes.
To derive the reactivity value from the experimental results, static evaluationmethods are used in this work: the area method for start-up, the static CTF methodduring operation and the static SJ method for interim cross-checking of the ADSreactivity. These methods are supposed to be more robust, as they do not dependon the knowledge of kinetic parameters (e.g. the neutron generation time).
The interpretation of the experimental results from VENUS-F using these me-thods is succesfully validated for the first experimental campaigns on VENUS-F.Thanks to a reference VENUS-F critical core, the experimental results can becompared to a subcriticality level obtained by an alternative methodology (i.e. acombination of the rod drop and Modified Source Multiplication (MSM) method).Moreover, an extrapolation exercise on the MYRRHA power ADS is performed bysimulations in order to investigate the performance of the monitoring methodo-logy, taking into account specific power effects.
Modal Analysis of the SCFs for Robust Detector Locations
The evaluation methods proposed in this thesis are based on point kinetics andneed to be corrected with SCFs to obtain the correct reactivity value. Static modalanalysis is applied in this work to derive analytical expressions of SCFs for the se-lected experimental techniques. The DALTON diffusion code is extended to bothsimulate the selected experimental techniques and perform the modal analysisof subcritical cores.
The first higher eigenmode with a maximum in the centre of the core is impor-tant for the modal analysis to study the detector positioning of ADS with sourcein the centre of the core. In the VENUS-F and MYRRHA ADS, this is the 9th mode,showing one zero crossing at about 20-25 cm from the centre of the core. Thismode has a considerable contribution to the total flux of typical ADS core designs,
134

5.1. Conclusions
and also to the SCF of the different selected evaluation methods. Moreover, otherhigher modes with a maximum in the centre of the core (with more zero crossings)have the same zero crossing location as the 9th mode.
For absolute reactivity measurements, the location without any spatial cor-rection (SCF=1) is located at the zero-crossing of the 9th mode. Indeed, at thisposition, the contribution to the SCF of modes with a high contribution to thefull flux (and SCF) is eliminated, and the relative contribution of the fundamentalmode to the total flux increases. The zero crossing position of this mode identifiesthe boundary between a SCF< 1 (a safe underestimation of the absolute reactivityvalue) and SCF > 1 (an unsafe overestimation of the absolute reactivity value).
Robust detector locations for absolute reactivity measurement techniques arenot necessarily locations with SCF=1 for the different experimental methods. Abetter criterion is the spatial gradient of the SCF. Therefore, we will look for zoneswith a low gradient in SCF, and with SCF < 1, preferably close to unity if one wantsto avoid to calculate correction factors. Moreover, for the relative CTF monitor,the small shift of the zero crossing of the 9th mode between two states can causehigh spatial gradients of SCFCTF close to the zero crossing location of this mode.As a consequence, this location is not robust for relative reactivity monitoring.
As a general rule, all proposed detector positions are in the same plane as theADS source, i.e. (close to or) at the centre height of the core. At this height, theSCFs are closest to unity.
Reactivity Monitoring Tool Specifications for ADS Start-up
For the start-up phase of an ADS , the reflector zone is the recommended zonefor detector locations. During core loading, SCFarea is significantly smaller thanunity (i.e. a safe underestimation of the absolute reactivity value), rising withincreasing subcriticality level. As SCFarea=0.96-0.97, the absolute reactivity levelin the VENUS-F SC1 core (
??ρ??=3709 pcm, a typical subcriticality level for ADS
operation) is safely underestimated by 111-148 pcm.
Experimental results from VENUS-F show a clear influence of local thermalisingelements (in this case the VENUS-F bunker) on the profile of SCFarea. This issuecan be avoided by the use of threshold detectors, but no experimental resultswith this type of detector are available yet.
Moreover, thermalising elements extend the required pulse period for the area
135

5. Conclusions and Recommendations
method. Typical values for the area method are between 200 and 500 µs. Periodsup to 1 ms are needed to reach the delayed neutron level for the area method,if thermalising elements are present. This increases the measurement time forgood statistics, in particular for zero-power ADS or at deep subcritical states.
For the MYRRHA ADS, the same conclusions are found, with similar SCFarea
values for the (outer) reflector.
Reactivity Monitoring Specifications for ADS Operation
The reactivity monitoring tool for an ADS during operation comprises the relativeCTF monitor and the SJ interim cross-checking method. Depending on the beaminterruption capability of a full power ADS accelerator, interim cross-checking ofthe absolute reactivity level is possible via the SJ method. The CTF monitor canbe recalibrated using this information.
MYRRHA is used as a case study for the static CTF monitor, taking into accountthe power ADS reactivity monitoring during normal operation. Three stages ofoperation are identified: the monitoring of the temperature feedback duringheating of the core, the core enlargement during the first MYRRHA cores, and themonitoring of the burn-up of the MYRRHA equilibrium core.
Based on deviations from unity of SCFCTF ,av, the core is the optimum locationto monitor temperature feedback, whereas the reflector is the optimum locationfor core enlargement and burn-up monitoring. SCFCTF ,av values between 0.989and 0.999 are found, with standard deviationσ=0.005-0.017. This corresponds todeviations of the measured reactivity from the real value of maximum 0.9 % forthe three stages of operation.
For technical reasons, it will be difficult to install detectors inside the MYRRHAcore. If for all stages of operation the reflector zone is chosen for CTF monito-ring, one should take into account a positive SCFCTF = 1.011 (σ=0.005) for themonitoring of temperature feedback, i.e. an unsafe overestimation by 41 pcm ofthe absolute reactivity increase of 821 pcm (i.e. 1.1 % on the HFP reactivity).
The variance σ on SCFCTF ,av is calculated supposing a number of detectorscorresponding to the mesh grid in the simulations (e.g. 64 for the outer reflector).In reality, the number of detectors will depend on the required accuracy of thereactivity monitoring tool and the reliability of the detectors. Using a limitednumber of detectors, it is recommended to take the most extreme SCFCTF value
136

5.2. Recommendations
in the reflector as a boundary for the CTF reactivity without recalibration. Thisvalue is 0.860 (threshold detector in the outer reflector core enlargement case,see Table 4.2), indicating an absolute reactivity value of 2746 pcm instead of 3193pcm, i.e. 447 pcm error in monitoring. Therefore, 500 pcm could be a suitableorder of magnitude for the accuracy of the CTF monitoring in the MYRRHA coreduring ADS operation without any recalibration, independent of the detectortype. The use of threshold detectors is however recommended to avoid the effectof thermalising elements.
The combination of many detector signals will be needed for the identificationof reactivity incidents in MYRRHA. Specific (more straightforward) instrumenta-tion is foreseen to identify the different incident scenarios. In case of a specificincident that needs follow-up by the reactivity monitoring tool, a dedicated de-tector can be installed, e.g. close to the perturbation.
Finally, the spatial dependence of the static SJ interim cross-checking methodis similar to the PNS area start-up monitoring method, and the outer reflectoris thus the preferred location. The beam interruption time at power needs to beminimised to reduce thermal stresses in the ADS. This is an additional motivationfor the use of threshold detectors, similar to the PNS area method.
5.2 Recommendations
Required Accuracy of the Reactivity Monitoring Tool
The ADS reactivity monitoring tool will have different final specifications de-pending on the safety function it fullfills. If the safety function of the reactivitymonitoring tool is related to normal operation, the number of detectors deter-mines the accuracy of the measurement. If many detectors are installed, one isalso able to identify different incidents by studying the response of each detector(group) to the simulated incident. For the latter purpose, it is obvious that other(more straightforward) detection systems will be installed.
Another question related to the measurement accuracy concerns the use ofthe SCFs for the different methods used for reactivity monitoring. Will they beapplied as an envelope to determine the uncertainty margin to be applied on thenon-corrected reactivity value, or will they be calculated and applied on the non-corrected value? In the latter case an uncertainty on the calculational tools andmodels will be taken into account. These licensing questions need to be clarified
137

5. Conclusions and Recommendations
before making conclusions about the accuracy of the reactivity measurement tool.The higher the accuracy, the higher the allowed operational keff level, which isbeneficial for the operational cost of the ADS.
Importance of the Interim Cross-Checking Technique
At the time of writing, it is not yet clear if (and how frequent) the acceleratorbeam of a power ADS can be interrupted to perform the static SJ evaluation of theabsolute reactivity level. An important factor is also the beam restoration time, i.e.the time the beam needs to restabilise at its original level. This time determinesthe period of the interruptions.
The performance of the static SJ method determines the importance of theCTF monitor. If short beam interruptions can be continuously performed witha reasonable period of interruption, absolute reactivity measurement are oftenavailable during operation of the ADS. The availability depends on the number ofrepetitions to achieve satisfying precision on the non-corrected reactivity value.The importance of the CTF monitor decreases if frequent recalibrations of theCTF monitor can be performed on-line. The safety function of the CTF monitoris in that case limited to the quick detection of abnormal events. Needless to saythat also the SJ interim cross-checking method is subject to its own SCFs.
Additional Measurements on VENUS-F
As an outcome of this work, several conclusions are drawn from simulations onVENUS-F, which can be validated with additional measurements on VENUS-F thatare currently ongoing or planned. At first, measurements with threshold detectorscan be performed to check the sensitivity of the SCFs to thermalising elements.Also measurements at different subcriticality levels are foreseen to check thestart-up reactivity monitoring approach. A sound validation of simulations isindispensable for the licensing of the reactivity monitoring tool.
Secondly, different aspects proper to power ADS need special attention, andare envisaged for (representative) experiments in VENUS-F: inhomogenities suchas IPS, core enlargement exercises, and the simulation of burn-up. Finally, thesimulations in this work are performed using a general MYRRHA design, and twotypes of detectors. Specific calculations should be performed with the final designof the ADS, taking into account the selected detector design. Special attentionshould be paid to new design changes that can affect the behaviour of the SCFs.
138

ATHE VENUS-F MODELS IN DALTON
This appendix describes the calculational models of the VENUS-F core used inthe DALTON diffusion code, which is presented in § 2.6.1. Both the geometry de-scription as well as the methodology to generate the cross sections are discussed.
A.1 Geometry Description
Two models of VENUS-F are made in order to perform modal analysis and experi-ment simulations with the DALTON code. The first (basic) model comprises thereactor only, as described in § 1.5.3. The second model extends the first one withthe (approximately modelled) VENUS-F barite bunker surrounding the reactor.The model is not accurate, but represents the main elements that determine theVENUS-F reactor physics parameters (for subcriticality monitoring).
Because of the square geometry of the VENUS-F assemblies, a cartesian (XYZ)model structure is applied. Therefore a square lead reflector outside the 12x12grid is applied in this approximated model equivalent (i.e. with a similar averageouter reflector thickness) to the cylindrical outer reflector. The vacuum in thebeam line is not modelled, and the 4 central assemblies are completely filled bylead reflector. The number of cells is chosen in such a way to obtain at least 3 cellsper fuel assembly along the X and Y axis. The number of cells is limited to allowtime-dependent calculations with DALTON in a reasonable calculational time.The basic model therefore consists of 75645 (41x41x45) cells, the extended modelof 557685 (81x81x85) cells.
The structure of the VENUS-F geometry in DALTON is shown in Fig. A.1 for the
139

A. The VENUS-F Models in DALTON
extended model. A detail zoom on the core at different heights is shown in Fig.A.2.
140
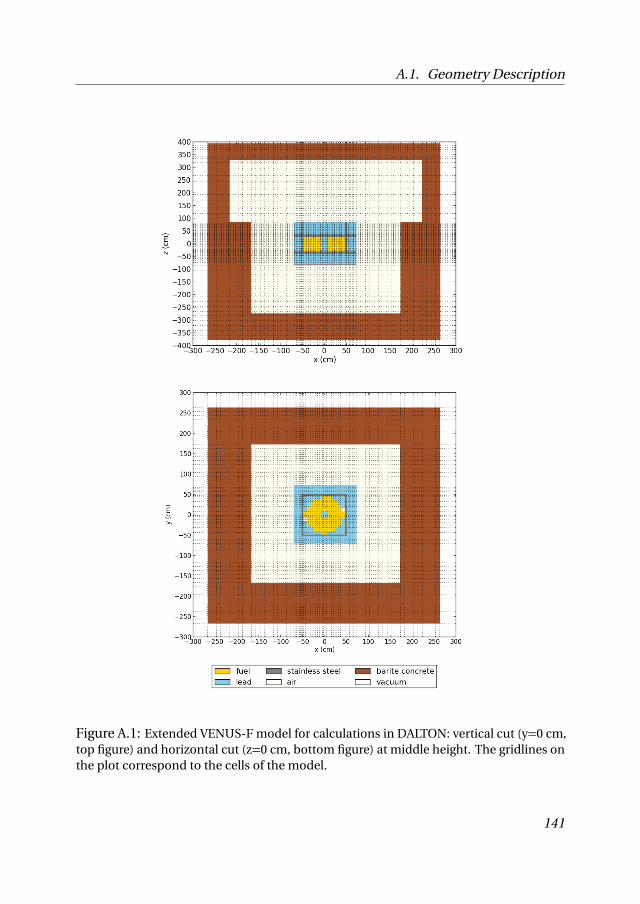
A.1. Geometry Description
Figure A.1: Extended VENUS-F model for calculations in DALTON: vertical cut (y=0 cm,top figure) and horizontal cut (z=0 cm, bottom figure) at middle height. The gridlines onthe plot correspond to the cells of the model.
141

A. The VENUS-F Models in DALTON
Figure A.2: VENUS-F Reactor model for calculations in DALTON: horizontal cuts at z=-39cm (bottom reflector, top figure), at middle height z=0 cm (reactor core, middle figure)and at z=39 cm (top reflector, bottom figure). The gridlines on the plot correspond to thecells of the model.
142

A.2. Cross Section Generation
A.2 Cross Section Generation
The cross sections of VENUS-F used for DALTON calculations are determinedsimilar to the ones used for VENUS-F simulations with other deterministic codes(e.g. [Bianchini et al., 2010]). The ECCO module of ERANOS [Rimpault, 2002] isused. For DALTON a condensation into 6 energy groups is performed, in order toreduce the calculational time (for time dependent calculations in particular).
The structure of the 6 energy groups is shown in Table A.1. The choice of theboundaries is made based on the analysis of the neutron energy spectrum inVENUS-F [Uyttenhove et al., 2011a] (which is similar in critical mode to thesubcritical mode spectrum [Krasa et al., 2014]). Sensitivity checks were carriedout on the group boundaries, and comparison with experimental keff values (forthe CR0 and SC1 cores) are in good agreement with experimental values (see TableA.2). Also by probabilistic MCNP calculations [Uyttenhove and Steckmeyer, 2014]similar results are obtained, e.g. for the VENUS-F bunker effect on the reactivity.
Energy Group Range
1 E > 1 MeV2 497.8 keV < E ≤ 1 MeV3 111.1 keV < E ≤ 497.8 keV4 55.2 keV < E ≤ 111.1 keV5 9.12 keV < E ≤ 55.2 keV6 E ≤ 9.12 keV
Table A.1: Boundaries of the 6 neutron energy groups for the VENUS-F calculation inDALTON.
model with bunker model without bunker experiment (i.e. with bunker)
CR0 1.00467 1.00150 1SC1 0.96424 0.96078 0.964 ± 0.001 [Lecouey et al., 2015b]
Table A.2: Comparison of the keff results for the VENUS-F CR0 and SC1 cores: DALTONcalculations versus experiments. The SC1 core has the control rods positioned out of thecore, i.e. at 600 mm.
143

A. The VENUS-F Models in DALTON
144

BTHE MYRRHA MODEL IN DALTON
This appendix describes the calculational model of the VENUS-F MYRRHA usedin the DALTON diffusion code, which is presented in § 2.6.1. Both the geom-etry description as well as the methodology to generate the cross sections arediscussed.
B.1 Geometry Description
A simplified model of MYRRHA is made in order to perform modal analysis andexperiment simulations with the DALTON code. The MYRRHA core consists ofhexagonal assemblies (see e.g. Fig. 4.1). In DALTON an equivalent XYZ model isset up. In order to guarantee a correct reactor modelling, the different hexagonalrings in the core are transferred to rectangular rings in DALTON, assuring thesame corresponding volume per ring.
Per ring the proportion of different types of assemblies is maintained. E.g. forthe first ring in the MYRRHA Beginning Of Life (BOL) core in Fig. 4.1, half theassemblies is fuel and the other half is In-Pile Sections. In DALTON a rectangularring is created with the same volume as the first ring. Half the volume is taken byfuel and the other half by IPS. The vacuum in the beam line is modelled as air.
The number of cells is chosen in such a way to obtain at least 3 cells per fuelassembly along the X and Y axis. The number of cells is limited to allow time-dependent calculations with DALTON in a reasonable calculational time. Themodel therefore consists of 220932 (57x57x68) cells.
145

B. The MYRRHA Model in DALTON
The structure of the MYRRHA geometry in DALTON is shown via a vertical cut(y=0 cm) in Fig. B.1. The reactor modelling at different heights is shown in Fig.B.2.
Figure B.1: Vertical cut (y=0 cm) through the MYRRHA model. The gridlines on the plotcorrespond to the cells of the model.
146

B.2. Cross Section Generation
Figure B.2: Horizontal cut at different heights through the MYRRHA model for calcula-tions in DALTON: z=-58 cm (top figure), z=0 cm(middle figure) and z=39 cm (bottomfigure). The gridlines on the plot correspond to the cells of the model.
B.2 Cross Section Generation
The cross sections of MYRRHA used for DALTON calculations are calculated simi-lar to the ones used for MYRRHA determistic calculations in [Sarotto et al., 2013].The ECCO module of ERANOS [Rimpault, 2002] is used. Similar homogenisationof the reactor materials is used as presented in [Sarotto, 2012].
147

B. The MYRRHA Model in DALTON
For DALTON a condensation into 6 energy groups is performed, in order toreduce the calculational time (for time dependent calculations in particular). Thestructure of the 6 energy groups is made similarly to VENUS, as shown in TableA.1, seen the consistency in neutron spectra between VENUS-F and MYRRHA(see [Krasa, 2013]).
Sensitivity checks are carried out on the group boundaries, and comparisonwith probabilistic MCNP calculations is done for the MYRRHA BOL core. Whereasfor the MYRRHA BOL core, keff=0.95375 is found, MCNP (v1.4 of the MYRRHAinput file, see [Stankovskiy and Malambu, 2011]) provides keff=0.96436.
148

CLIST OF ABBREVIATIONS
ADONIS Accelerator Driven Operated New Irradiation SystemADS Accelerator-Driven System
BARC Bhaba Atomic Research CentreBOC Beginning-Of-CycleBOL Beginning-Of-LifeBWR Boiling Water ReactorCAS Chinese Academy of ScienceCDT Central Design TeamCIAE Chinese Institute of Atomic Energy
CLEAR China LEad Alloy cooled ReactorCPSD Cross Power Spectral Density
CR Control RodCTF Current-To-FluxCZP Cold Zero PowerEFIT European Fast Industrial TransmuterEOC End-Of-Cycle
ESFRI European Strategy Forum on Research InfrastructureFA Fuel Assembly
FASTEF FAst Spectrum Transmutation Experimental FacilityFEED Front End Engineering Design
149

C. List of Abbreviations
FR Fast ReactorFREYA Fast Reactor Experiments for hYbrid Applications
GUINEVERE Generator of Uninterrupted Intense NEutrons at the VEnus REactorHFP Hot Full PowerHLM Heavy Liquid MetalIPS In-Pile SectionISJ Integrated Source Jerk
KIPT Kharkov Institute of Physics and TechnologyLBE Lead-Bismuth EutecticMA Minor Actinides
MCNP Monte Carlo N-ParticleMIRT MYRRHA International Review TeamMOX Mixed OXideMSM Modified Source MultiplicationMTA Material Testing Accelerator
MUSE MUltiplication avec Source ExterneMYRRHA Multi-purpose hYbrid Research Reactor for High-tech Applications
NEA Nuclear Energy AgencyPE PolyEthylene
PEAR PEllet Absorber RodPNS Pulsed Neutron SourceSCF Spatial Correction Factor
SCK•CEN StudieCentrum voor Kernenergie - Centre d’étude de l’Energie NucléaireSJ Source Jerk
SNETP Sustainable Nuclear Energy Technology PlatformSR Safety RodTH THermal (detector)
THR THReshold (detector)
150

References
REFERENCES
S. Andriamonje, A. Angelopoulos, A. Apostolakis, F. Attale, L. Brillard, S. Buono,J. Calero, F Carminati, F . Casagrande, P. Cennini, S. Charalambous, R. DelMoral, C . Eleftheriadis, E . Gallego, J. Galvez, L. Garcia-Tabares, C. Geles,I. Goulas, A . Giorni, E. Gonzalez, M. Hussonnois, J. Jaren, R. Klapisch, P. Kokkas,F . Lemeilleur, G . Lindecker, A . Liolios, J.M. Loiseaux, C. Lopez, A. Lorente,M. Macri, J.M. Martinez-Val, H. Nifenecker, J. Oropesa, P. Pavlopoulos, J.A. Pin-ston, J-P. Revol, C. Roche, C. Rubbia, J .A. Rubio, K. Sakelariou, L . Sakelliou, F .Saldana, F . Schussler, J. Tarnarit, D. Trubert, J.B. Viano, S. Vieira, S. Vlachos,Xuan Li, and G. Zarris. Experimental determination of the energy generated innuclear cascades by a high energy beam. Phys. Lett. B, 348:697–709, 1995.
B. Ariën. Determination of the required anti-reactivity margin for the referencecore 1.4 of MYRRHA for both critical and subcritical operation. Technical Report3583712, SCK-CEN, 2014.
H. Arnould, C.A. Bompas, R. Del Moral, V. Lacoste, V. Vlachoudis, J. Aleixandre,J. Bueno, E. Cerro, O. Gonzalez, J. Tamarit, S. Andriamonje, D. Brozzi, S. Buono,F. Carminati, F. Casagrande, P. Cennini, J.I. Collar, L. Dumps, C. Geles, I. Goulas,R. Fernandez, Y. Kadi, R. Klapisch, J. Oropesa, A. Placci, J.-P. Revol, C. Rubbia,J.A. Rubio, F. Saldana, M. Embid, J. Galvez, C. Lopez, E. Perez-Enciso, M. Poza,C. Sirvent, S. Vieira, A. Abanades, J. Garcia, J.M. Martinez-Val, M. Perlado, E. Gon-zalez, M. Hussonnois, C. Le Naour, D. Trubert, E. Belle, A. Giorni, D. Heuer, J.M.Loiseaux, O. Meplan, H. Nifenecker, F. Schussler, J.B. Viano, A. Angelopoulos,A. Apostolakis, P. Karaiskos, L. Sakelliou, P. Kokkas, P. Pavlopoulos, C. Elefthe-riadis, G. Kitis, I. Papadopoulos, E. Savvidis, A. Tzima, K. Zioutas, S. Diez, andA. Perez-Navarro. Experimental verification of neutron phenomenology inlead and transmutation by adiabatic resonance crossing in accelerator drivensystems. Phys. Lett. B, 458:167–180, 1999.
151

References
C. Artioli, X. Chen, F. Gabrielli, G. Glinatsis, P. Liu, W. Maschek, C. Petrovich,A. Rineiski, M. Sarotto, and M. Schikorr. Minor Actinide Transmutation in ADS:the EFIT Core Design. In International Conference of the Physics of Reactors,
Nuclear Power: A Sustainable Resource (PHYSOR’08), Interlaken, Switzerland,2008.
H. Aït Abderrahim and P. Baeten. MYRRHA: a Multi-purpose hYbrid ResearchReactor for High-tech Applications. In Proceedings of PHYSOR2012 - Advances
in Reactor Physics - Knoxville (TN), USA, April 15-20, 2012, 2012.
H. Aït Abderrahim, A. Al Mazouzi, B. Arien, P. Baeten, D. De Bruyn, M. Dierckx,J. Heyse, E. Malambu, K. Rosseel, P. Schuurmans, V. Sobolev, G. Van den Eynde,S. Van Dyck, K. Van Tichelen, and M. Verwerft. MYRRHA Technical Description(for the OECD MYRRHA Review Team). Technical report, SCK•CEN, 2008.
H. Aït Abderrahim, P. Baeten, D. De Bruyn, and R. Fernandez. MYRRHA - A Multi-purpose Fast Spectrum Research Reactor. Energy Conversion and Management,63:4–10, 2012.
P. Baeten. Heuristic derivation of the Rossi-alpha formula for a pulsed neutronsource. Annals of Nuclear Energy, 31/1:43–53, 2003.
P. Baeten, R. Brissot, Y. Rugama, A. Billebaud, C. Le Brun, E. Liatard, J. Vollaire,and C. Destouches. Analytical Investigation and Experimental Application ofthe Source Modulation Technique to measure
ρβeff
. Progress in Nuclear Energy,48:550–558, 2006.
P. Baeten, H. Aït Abderrahim, G. Bergmans, J. Heyse, D. Maes, B. Verboomen, F. Ver-meersch, G. Vittiglio, G. Ban, M. Baylac, A. Billebaud, D. Bondoux, J. Bouvier, J.-M. De Conto, P. Dessagne, G. Gaudiot, J.-M. Gautier, D. Grondin, G. Heitz, M. Ker-veno, B. Laune, F.-R. Lecolley, J.-L. Lecouey, D. Marchand, N. Marie, Y. Merrer,R. Micoud, M. Planet, D. Reynet, C. Ruescas, J.-C. Steckmeyer, G. Granget,F. Mellier, G. Rimpault, and T. Aoust. The GUINEVERE Project at the VENUS Fa-cility. In Proceedings of the International Conference on the PHYSics Of Reactors
(PHYSOR2008), Interlaken, Switzerland, 2008.
L.H. Baetslé. Application of Partitioning/Transmutation of Radioactive Materialsin Radioactive Waste Management. In Workshop on Hybrid Nuclear Systems for
Energy Production, Utilisation of Actinides and Transmutation of Long-lived
Radioactive Waste, Trieste, September 3-7, 2001.
152

References
G.A. Bartholomew and P.R. Tunnicliffe. The AECL Study for an Intense NeutronGenerator. Technical Report Report No. AECL-2600, Atomic Energy of CanadaLimited, 1966.
M. Baylac, H. Aït Abderrahim, P. Baeten, P.-B. Bard, A. Billebaud, G. Bergmans,P. Boge, D. Bondoux, J. Bouvier, T. Cabanel, Y. Carcagno, G. Dargaud, J.-M. DeConto, P. Desrues, E. Froidefond, G. Gaudiot, J.-M. Gautier, Y. Gómez, G. Granget,G. Heitz, M. Heusch, B. Laune, D. Marchand, F. Mellier, Y. Merrer, R. Micoud,E. Perbet, M. Planet, P. Poussot, D. Reynet, C. Ruescas, D. Tourrès, D. Vande-plassche, F. Vermeesch, and G. Vittiglio. The GENEPI-3C Accelerator for theGUINEVERE Project. In Proceedings of International Topical Meeting on Nuclear
Research Applications and Utilization of Accelerators, Vienna, May 4-8, 2010.
V. Becares and J. Blazquez. Detector dead time determination and optimal countrate for a detector near a spallation source or a subcritical mulitplying system.Science and Technology of Nuclear Installations, 2012, 2012.
V. Becares, D. Villamarin, M. Fernandez-Ordonez, E.M. Gonzalez-Romero, C. Berg-lof, V. Bournos, Y. Fokov, S. Mazanik, and I. Serafimovich. Validation of ADSreactivity monitoring techniques in the Yalina-Booster subcritical assembly.Annals of Nuclear Energy, 53:331–341, 2013.
G.I. Bell and S. Glasstone. Nuclear Reactor Theory. Van Nostrand Reinhold Com-pany, 1970.
G.I. Bell and S. Glasstone. Nuclear Reactor Theory. Robert E. Krieger PublishingCompany, Malabar, Florida, 1985.
C. Berglof, M. Fernandez-Ordonez, D. Villamarin, V. Becares, E.M. Gonzalez-Romero, V. Bournos, and J.-L. Munoz-Cobo. Auto-correlation and variance-to-mean measurements in a subcritical core obeying multiple alpha-modes.Annals of Nuclear Energy, 38:194–202, 2011.
F. Bianchi, C. Artioli, K.W. Burn, G. Gherardi, S. Monti, L. Mansani, L. Cinotti,D. Struwe, M. Schikorr, W. Maschek, H. Aït Abderrahim, D. De Bruyn, andG. Rimpault. Status and Trend of Core Design Activities for Heavy Metal CooledAccelerator-Driven Systems. Energy Conversion and Management, 47(17):2698–2709, 2006.
G. Bianchini, M. Carta, F. Pisacane, M. Frisoni, and V. Peluso. Set-up of a Deter-ministic Model for the Analysis of the GUINEVERE Experience. In Proceedings
153
References
of the International Conference on the PHYSics Of Reactors (PHYSOR2010) -
Advances in Reactor Physics to Power the Nuclear Renaissance, Pittsburgh, Penn-
sylvania, USA, May 9-14, 2010.
A. Billebaud, R. Brissot, C. Le Brun, E. Liatard, and J. Vollaire. Prompt multiplica-tion factor measurements in subcritical systems: from MUSE experiment to ademonstrator ADS. Progress in Nuclear Energy, 49:142–160, 2009.
A. Billebaud, J.-L. Lecouey, G.Ban, S.Chabod, F.-R. Lecolley, N.Marie, H.-E.Thyébault, and J.-C.Steckmeyer. GENEPI-3C Neutron Source Monitoring.Technical Report GUI-SPE-2.2-0001-LPSC, v.1, CNRS, 2010.
P. Blaise, F. Mellier, and P. Fougeras. Application of the Modified Source Multi-plication (MSM) Technique to Subcritical Reactivity Worth Measurements inThermal and Fast Reactor Systems. IEEE Transactions on Nuclear Science, 58(3):1166–1176, 2011.
B. Boer, D. Lathouwers, M. Ding, and J.-L. Kloosterman. Coupled Neutro-nics/Thermal Hydraulics Calculations for High Temperature Reactors withthe DALTON-THERMIX Code Systems. In Proceedings of the International
Conference on the PHYSics Of Reactors (PHYSOR2008), Interlaken, Switzerland,2008.
B. Boer, D. Lathouwers, J.-L. Kloosterman, T.H.J.J. van der Hagen, and G. Strydom.Validation of the DALTON-THERMIX Code System with Transient Analysis ofthe HTR-10 and Application to the PBMR. Nuclear Technology, 170(2):306–321,2010.
Brookhaven National Laboratory. An introduction to PHENIX,www.phenix.bnl.gov, 2013.
Y. Cao and J.C. Lee. Spatial Corrections for Pulsed-Neutron Reactivity Measure-ments. Nuclear Science and Engineering, 165:270–282, 2010.
M. Carta and A. D’Angelo. Subcriticality-Level Evaluation in Accelerator-DrivenSystems by Harmonic Modulation of the External Source. Nuclear Science and
Engineering, 133:282–292, 1999.
S. Chabod, A. Billebaud, F.-R. Lecolley, J.-L. Lecouey, G. Lehaut, N. Marie, G. Ban,X. Doligez, A. Kochetkov, P. Baeten, A. Krasa, W. Uyttenhove, G. Vittiglio, and
154

References
J. Wagemans. Reactivity measurements at GUINEVERE facility using the in-tegral kp method. In International Conference on the PHYSics Of Reactors
(PHYSOR2014), Kyoto, Japan, 2014.
N. Chauvin, S. Bejaoui, J.-M. Beonnerot, F. Delaga, G. Martin, V. Bouineau, M. Pel-letier, and L. Buiron. Minor Actinide Fuels for Fast Reactor: Qualification. InHeraeus Seminar, Bad Honeff, Germany, December 5-8, 2011.
T. Chevret. Private e-mail communication, october 13, 2014a.
T. Chevret. Reactivity measurement using beam interruption experiments: in-fluence of the reactor surroundings and latest results. In FREYA WP1 Meeting,
Grenoble (France), October 30-31, 2014b.
T. Chevret, J.-L. Lecouey, N. Marie, F.-R. Lecolley, G. Lehaut, G. Ban, A. Billebaud,S. Chabod, X. Doligez, A. Kochetkov, P. Baeten, W. Uyttenhove, G. Vittiglio,J. Wagemans, F. Mellier, V. Bécares, and D. Villamarin. Reactivity Measurementof the Lead Fast Subcritical VENUS-F Reactor using Beam Interruption Experi-ments. In Proceedings of the International Conference on the PHYSics Of Reactors
(PHYSOR2014), Kyoto, Japan, 2014.
D. De Bruyn and R. Fernandez. The Fast-spectrum Transmutation ExperimentalFacility FASTEF: Main Design Achievements (Part 1: Core & Primary System)within the FP7-CDT Project of the European Commission. In ICAPP12, Chicago,
USA, June 24-28,, 2012.
S.B. Degweker, P. Satyamurthy, P.K. Nema, and P. Singh. Program of Developmentof Accelerator-Driven Systems in India. In Technical Meeting on the Use of
Low-Enriched Uranium in Accelerator-Driven Systems, IAEA, Vienna, February
4-8, 2013.
X. Doligez, A. Billebaud, S. Chabod, T. Chevret, D. Fourmentel, A. Krasa, A. Ko-chetkov, F.-R. Lecolley, J.-L. Lecouey, G. Lehaut, N. Marie-Nourry, F. Mellier,G. Vittiglio, and J. Wagemans. Effective delayed neutron fraction measurementin the critical VENUS-F reactor using noise techniques. In Proceedings of the
Int. Conf. on Advancements in Nuclear Instrumentation, Measurement Methods
and their Applications: ANIMMA, Lisbon, Portugal, April 20-25, 2015.
J. J. Duderstadt and L. J. Hamilton. Nuclear Reactor Analysis. John Wiley and Sons,1976.
155

References
S. Dulla, P. Ravetto, M.M. Rostagno, G. Bianchini, M. Carta, and A. D’Angelo. SomeFeatures of Spatial Neutron Kinetics for Multiplying Systems. Nuclear Science
and Engineering, 149:88–100, 2005.
S. Dulla, P. Picca, P. Ravetto, D. Tomatis, and M. Carta. Integral Parameters inSource-driven Systems. Progress in Nuclear Energy, 53:32–40, 2011.
S. Dulla, M. Nervo, P. Ravetto, G. Mila, S. Argirò, S. Beolè, M. Masera, G. Bianchini,M. Carta, V. Fabrizio, V. Peluso, F. Gabrielli, A. Rineiski, A. Kochetkov, P. Baeten,W. Uyttenhove, G. Vittiglio, and J. Wagemans. Interpretation of ExperimentalMeasurements on the SC-1 Configuration of the VENUS-F Core. In Proceedings
of the International Conference on the PHYSics Of Reactors (PHYSOR2014), Kyoto,
Japan, 2014.
ESFRI. Strategy Report on Research Infrastructures, Roadmap 2010. Techni-cal Report ISBN 978-92-79-16828-4, European Strategy Forum on ResearchInfrastructures, European Commission, 2010.
A. Gandini and M. Salvatores. The Physics of Subcritical Multiplying Systems.Journal of Nuclear Science and Technology, 6:673–686, 2002.
E. Garelis and J.L. Russell. Theory of Pulsed Neutron Source Measurements.Nuclear Science and Engineering, 16:263–270, 1963.
Y. Gohar. National and International Accelerator-Driven System Activities forNuclear Energy. In Project X Collaboration Meeting, Lawrence Berkeley National
Laboratory, April 10-12, 2012.
Y. Gohar and D. L. Smith. YALINA Facility: A Sub-Critical Accelerator-DrivenSystem (ADS) for Nuclear-Energy Research Facility Description and an Overviewof the Research Program (1997-2008). Technical Report ANL-10/05, ArgonneNational Laboratory, 2010.
W. Gudowski. Accelerator-driven Transmutation Projects. The Importance ofNuclear Physics Research for Waste Transmutation. Nuclear Physics A, 654:436–457, 1999.
IAEA. Advanced reactor technology options for utilization and transmutation ofactinides in spent nuclear fuel. IAEA-TECDOC-1626 ISBN 978-92-0-109309-7,International Atomic Energy Agency, 2009a.
156

References
IAEA. Status of Minor Actinide Fuel Development. Number NF-T-4.6. InternationalAtomic Energy Agency, Nuclear Energy Series, 2009b.
J.A. Thie. Reactor Noise. Rowman and Littlefield, 1963.
C. Jammes, B. Geslot, and G. Imel. Advantage of the Area Ratio Pulsed NeutronSource Technique for ADS Reactivity Calibration. Nuclear Instruments and
Methods in Physics Research A, 562:778–784, 2006.
Y. Kadi and J.P. Revol. Design of an Accelerator-Driven System for the Destruction
of Nuclear Waste, volume 12 of ICTP Lecture Notes Series, pages 88–132. 2002.
S. Keyers. Considerations for the Design of a Spallation Target Window - FromWindowless Loop to Loopless Window. Technical Report I-185, SCK•CEN, 2010.
J.L. Kloosterman, Y. Rugama, M. Szieberth, and C. Destouches. Measurementand calculation of control rod worths in MASURCA. In Proceedings of the
International Conference on the PHYSics Of Reactors (PHYSOR2002), Seoul,
Korea, 2002.
J. Knebel. Integrated Project EUROTRANS: EUROpean research programme forthe TRANSmutation of high level nuclear waste in an accelerator driven system(Contract FI6W-CT-2004-516520). In Proceedings FISA, Luxemburg, March
13-16, 2006.
A. Kochetkov. Fast Reactor Experiments for hYbrid Applications (FREYA), Euro-pean Commission 7th Framework Programme Project 269665. Technical report,2010.
A. Kochetkov. Source Jerk Integral Method - WP1 Summary Results. In FREYA
WP1 Meeting, Grenoble (France), October 30-31, 2014.
A. Kochetkov, P. Baeten, A. Billebaud, S. Chabod, X. Doligez, F.-R. Lecolley, J.-L.Lecouey, G. Lehaut, N. Marie, H.-E. Thyébault, W. Uyttenhove, J. Wagemans,G. Ban, P. Dessagne, M. Kerveno, and L. Mercatali. Current Progress and FuturePlans of the FREYA Project. In Technology and Components of Accelerator-
Driven Systems TCADS, Second International Workshop, Nantes, France, 21-23
May, 2013.
A. Kochetkov, P. Baeten, W. Uyttenhove, G. Vittiglio, J. Wagemans, A. Bilebaud,S. Chabod, J.-L. Lecouey, G. Ban, F.-R. Lecolley, N. Marie, G. Lehaut, X. Doligez,
157
References
and F. Mellier. An alternative source jerk method implementation for the sub-criticality estimation of the VENUS-F subcritical core in the FREYA project.In Proceedings of the International Conference on the PHYSics Of Reactors
(PHYSOR2014), Kyoto, Japan, September 28 - October 3, 2014.
A. Krasa. New candidate configurations of MYRRHA-like VENUS-F cores. InFREYA WP2 technical meeting, Brussels, Belgium, November 13, 2013.
A. Krasa, A. Kochetkov, P. Baeten, W. Uyttenhove, G. Vittiglio, and J. Wagemans.Axial traverses in CR0, SC1 with long and short thimble. In FREYA WP1 technical
meeting, Grenoble, France, October 30-31, 2014.
KUCA. The Kyoto University Critical Assembly, http://www.rri.kyoto-u.ac.jp/CAD/english/, 2013.
J.-L. Lecouey. Recommended value for ρ(SC1) and related business. In FREYA
WP1 Meeting, Grenoble (France), October 30-31, 2014.
J.-L. Lecouey, A. Kochetkov, A. Krasa, P. Baeten, V. Bécares, A. Billebaud, S. Chabod,T. Chevret, X. Doligez, F.-R. Lecolley, G. Lehaut, N. Marie, F. Mellier, W. Uytten-hove, D. Villamarin, G. Vittiglio, and J. Wagemans. Monte Carlo MSM CorrectionFactors for Control Rod Worth Estimates in Subcritical and Near-critical FastNeutron Reactors. In ICAPP 2015, Nice, France, May 3-6, 2015a.
J.-L. Lecouey, N. Marie, G. Ban, A. Billebaud, S. Chabod, A. Kochetkov, F.-R. Lecol-ley, G. Lehaut, F. Mellier, H.-E. Thyébault, W. Uyttenhove, C. Van Grieken, andG. Vittiglio. Estimate of the Reactivity of the VENUS-F Subcritical Configurationusing a Monte Carlo MSM Method. Annals of Nuclear Energy, 83:65–75, 2015b.
R.B. Lehoucq, D.C. Sorensen, and C. Yang. ARPACK Users’ Guide, Solution of Large-
Scale Eigenvalue Problems by Implicitly Restarted Arnoldi Methods. Society ofIndustrial and Applied Mathematics, Philadelphia, 1998.
E. Malambu and A. Stankovskiy. Proposals for MYRRHA core configurations with30 at% (Pu-Am)-enriched MOX fuel. Technical Report I-260, SCK•CEN, 2012.
L. Mansani, C. Artioli, M. Schikorr, G. Rimpault, C. Angulo, and D. De Bruyn. Thedesigns of an experimental ADS facility (XT-ADS) and of a European IndustrialTransmutation Demonstrator (EFIT). In OECD, editor, Proceedings of the Con-
ference on Technology and Components of Accelerator-Driven Systems (TCADS),number ISBN 978-92-64-11727-3, 2011.
158

References
N. Marie, G. Lehaut, J.-L. Lecouey, A. Billebaud, S. Chabod, X. Doligez, F.-R. Lecol-ley, A. Kochetkov, W. Uyttenhove, G. Vittiglio, J. Wagemans, F. Mellier, G. Ban, H.-E. Thyébault, and D. Villamarin. Reactivity Monitoring Using the Area Methodfor the Subcritical VENUS-F Core within the Framework of the FREYA Project.In Technology and Components of Accelerator-Driven Systems (TCADS), Second
International Workshop, Nantes, France, May 21-23, 2013.
MCNP Team. MCNP 5.1.40 RSICC Release Notes. Technical Report LA-UR-05-8617, Los Alamos National Laboratory, November 2005.
F. Mellier. The MUSE Experiments for Subcritical Neutronics Validation. FinalReport Deliverable 8, FP5 MUSE Project, FIKW-CT-2000-0063, CEA Cadarache,2005.
L. Mercatali, A. Serikov, P. Baeten, W. Uyttenhove, A. Lafuente, and P. Teles. DesignStudy of a Fast Spectrum Zero-power Reactor dedicated to Source-driven Sub-critical Experiments. Energy Conversion and Management, 51:1818–1825, 2010.
NEA. Accelerator-Driven Systems (ADS) and Fast Reactors (FR) in AdvancedNuclear Fuel Cycles. Technical Report 3109, Nuclear Energy Agency, 2003.
H. Nifenecker, S. David, J.-M. Loiseaux, and O. Meplan. Basics of Accelerator-driven Subcritical Reactors. Nuclear Instruments and Methods in Physics Re-
search A, 463:428–467, 2001.
H. Nifenecker, O. Meplan, and S. David. Accelerator Driven Subcritical Reactors.Number ISBN 0-7503-0743-9. Institute of Physics Publishing Ltd, 2003.
OECD/NEA. Independent Evaluation of the MYRRHA Project. Technical ReportISBN 978-92-64-99114-9, NEA no. 6881, The OECD Nuclear Energy Agency,2009.
K.O. Ott and R.J. Neuhold. Introductory Nuclear Reactor Dynamics. AmericanNuclear Society, 1985.
A. Pautz and A. Birkhofer. DORT-TD: A Transient Neutron Transport Code withFully Implicit Time Integration. Nuclear Science and Engineering, 145:299–319,2003.
D.B. Pelowitz. MCNPX 2.7.A Extensions. Technical Report LA-UR-08-07182, LosAlamos National Laboratory, 2008.
159

References
D.B. Pelowitz. MCNPX 2.7.0 Extensions. Technical Report LA-UR-11-02295, LosAlamos National Laboratory, 2011.
F. Perdu, J.-M. Loiseaux, A. Billebaud, R. Brissot, D. Heuer, C. Lebrun, E. Liatard,O. Meplan, E. Merle, H. Nifenecker, and J. Vollaire. Prompt reactivity determi-nation in a subcritical assembly through the response to a dirac pulse. Progress
in Nuclear Energy, 42:107–120, 2003.
C.-M. Persson, P. Seltborg, A. Ahlander, W. Gudowki, T. Stummer, H. Kiyavitskaya,V. Bournos, Y. Fokov, I. Serafimovich, and S. Chigrinov. Analysis of ReactivityDetermination Methods in the Subcritical Experiment YALINA. Nuclear Instru-
ments and Methods in Physics Research A, 554:374–383, 2005.
C.H. Pyeon. Status of Research and Development of Accelerator-Driven Systemsand Nuclear Transmutation Technology in Asian Countries. Technical ReportISSN 1349-7960, Research Reactor Institute, Kyoto University, 2013.
G. Rimpault. The ERANOS code and data system for fast reactor neutronic analy-ses. In Proc. PHYSOR 2002, Seoul, South-Korea, 2002.
C. Rubbia, J.A. Rubio, S. Buono, F. Carminati, N. Fiétier, J. Galvez, C. Gelès, Y. Kadi,R. Klapisch, P. Mandrillon, J.-P. Revol, and Ch. Roche. Conceptual Designof a Fast Neutron Operated High Power Energy Amplifier. Technical ReportCERN/AT/95-44 (ET), CERN, 1995.
M. Salvatores, I. Slessarev, and M. Uematsu. A Global Physics Approach to Trans-mutation of Radioactive Nuclei. Nuclear Science and Engineering, 116:1–18,1994.
P. Saracco, S. Dulla, and P. Ravetto. On the spectrum of the multigroup diffusionequations. Progress in Nuclear Energy, 59:86–95, 2012.
M. Sarotto. Critical Core Design of MYRRHA-FASTEF: Refinement of ShutdownSystems and Neutronic Characterisation of the Equilibrium Sub-Cycle Core.CDT Task 2.2 REP007-2011, ENEA, 2011.
M. Sarotto. FASTEF design changes to operate in critical mode. CDT/FASTEFDeliverable 2.2, ENEA, 2012.
M. Sarotto, D. Castelliti, R. Fernandez, D. Lamberts, E. Malambu, A. Stankovskiy,W. Jaeger, M. Ottolini, F. Martin-Fuertes, L. Sabathé, L. Mansani, and P. Baeten.
160

References
The MYRRHA-FASTEF cores design for critical and sub-critical operationalmodes (EU FP7 Design Team Project). Nuclear Engineering and Design, 265:184–200, 2013.
B.E. Simmons and J.S. King. A Pulsed Neutron Technique for Reactivity Determi-nation. Nuclear Science and Engineering, 3:595–608, 1958.
N.G. Sjöstrand. Measurements on a Subcritical Reactor using a Pulsed NeutronSource. Arkiv för Fysik, 11, 13, 1956.
SNETP. Strategic Research and Innovation Agenda. Technical report, SustainableNuclear Energy Technology Platform, www.snetp.eu, 2013.
V. Sobolev, B. Boer, M. Verwerft, S. Keijers, W. Lowet, R. Fernandez, and A. Woaye-Hune. Preliminary Design and Specifications for MYRRHA Driver Fuel.SCK•CEN Technical Report R-5151, SCK•CEN, 2011a.
V. Sobolev, W. Uyttenhove, R. Thetford, and W. Maschek. Prognosis and Compari-son of Composite CERCER and CERMET Fuels dedicated to Transmutation ofTRU in an EFIT ADS. Journal of Nuclear Materials, 414:257–264, 2011b.
R. Soule, W. Assal, P. Chaussonnet, C. Destouches, C. Domergue, C. Jammes, J.-M.Laurens, J.-F. Lebrat, F. Mellier, G. Perret, G. Rimpault, H. Servière, G. Imel,G.M. Thomas, D. Villamarin, E. Gonzalez-Romero, M. Plaschy, R. Chawla, J.-L.Kloosterman, Y. Rugama, A. Billebaud, R. Brissot, D. Heuer, M. Kerveno, C. LeBrun, E. Liatard, J.-M. Loiseaux, O. Méplan, E. Merle, F. Perdu, J. Vollaire, andP. Baeten. Neutronic Studies in Support of Accelerator-Driven Systems: theMUSE Experiments in the MASURCA Facility. Nuclear Science and Engineering,148:124–152, 2004.
A. Stankovskiy and E. Malambu. Myrrha bol reference core (v1.4, september 30,2011). MCNPX Input File, September 2011.
R.E. Uhrig. Random Noise Techniques in Nuclear Reactor Systems. Ronald Press,1956.
W. Uyttenhove. VENUS-F Re-Evaluation of 4 Typical Cores for the EnvelopeParameters. Technical report, SCK•CEN, July 5 2012.
W. Uyttenhove. GUINEVERE: Experimental Programme - C/E Analysis of theVENUS-F Critical Core Characterisation Experiments. Technical Report R-5425,SCK•CEN, 2013.
161

References
W. Uyttenhove and A. Krasa. Status of the Analysis of Current-to-Flux MonitorData. In FREYA WP1 Data Analysis Meeting, October 1-2, CNRS Caen, France,2013.
W. Uyttenhove and J.-C. Steckmeyer. VENUS-F MCNP(X) Input File, Version 8,February 2014.
W. Uyttenhove and G. Van den Eynde. Physics of Subcritical Systems: Transpo-sition towards a Full-scale ADS. In Atelier GEDEPEON, Paris, France, July 5-6,2012.
W. Uyttenhove, P. Baeten, and A. Kochetkov. GUINEVERE: Experimental Pro-gramme - Description of the VENUS-F Reactor for Neutronics Calculations.Technical Report R-4914, SCK•CEN, December 2009.
W. Uyttenhove, P. Baeten, G. Van den Eynde, A. Kochetkov, D. Lathouwers, andM. Carta. The Neutronic Design of a Critical Lead Reflected Zero-power Re-ference Core for On-line Subcriticality Measurements in Accelerator-DrivenSystems. Annals of Nuclear Energy, 38:1519–1526, 2011a.
W. Uyttenhove, V. Sobolev, and W. Maschek. Optimisation of Composite MetallicFuel for Minor Actinide Transmutation in an Accelerator-Driven System. Journal
of Nuclear Materials, 416:291–299, 2011b.
W. Uyttenhove, P. Baeten, G. Ban, A. Billebaud, S. Chabod, P. Dessagne, M. Kerveno,A. Kochetkov, F.-R. Lecolley, J.-L. Lecouey, N. Marie, F. Mellier, J.-C. Steckmeyer,H.-E. Thyébault, G. Vittiglio, and J. Wagemans. Experimental Results fromthe VENUS-F Critical Reference State for the GUINEVERE Accelerator DrivenSystem Project. IEEE Transactions on Nuclear Science, 59(6):pp. 3194–3200,2012a.
W. Uyttenhove, G. Van den Eynde, P. Baeten, A. Kochetkov, G. Vittiglio, J. Wagemans,D. Lathouwers, J.-L. Kloosterman, T.J.H.H. van der Hagen, F. Wols, A. Billebaud,S. Chabod, H.-E. Thyébault, J.-L. Lecouey, G. Ban, F.-R. Lecolley, N. Marie, J.-C. Steckmeyer, P. Dessagne, M. Kerveno, and F. Mellier. Detector Positioningfor the Initial Subcriticality Level Determination in Accelerator-Driven Sys-tems. In Proceedings of the International Conference on the PHYSics Of Reactors
(PHYSOR2012), Knoxville (TN), USA, April 15-20, 2012b.
W. Uyttenhove, D. Lathouwers, J.-L. Kloosterman, T.H.J.J. van der Hagen, G. Vanden Eynde, and P. Baeten. Methodology for Modal Analysis at Pulsed Neutron
162

References
Source Experiments in Accelerator-Driven Systems. Annals of Nuclear Energy,72:286–297, 2014.
C.M. Van Atta. A brief history of the MTA Project. In ERDA Information Meeting
on Accelerator Breeding, January 19-29, 1977.
G. Van den Eynde. XT-ADS Core Neutronics & Cycle Analysis. IP EUROTRANSDeliverable D1.34 & D1.35, SCK•CEN, March 2009.
G. Van den Eynde, H. Aït Abderrahim, and D. De Bruyn. Progress of the MYRRHAADS Project in Belgium. In OECD-NEA Exchange Meeting, Prague, September
25-27, 2012.
G. Van den Eynde, E. Malambu, A. Stankovskiy, R. Fernandez, and P. Baeten.An Updated Core Design for the Multi-purpose Irradiation Facility MYRRHA.In Proceedings of the International Conference on the PHYSics Of Reactors
(PHYSOR2014), Kyoto, Japan, 2014.
R. G. Vassylkov, V. I. Goldanskii, B. A. Pimenov, Yu. N. Pokotilovskii, and L. V.Chistyakov. Neutron multiplication in uranium bombarded with 300-660 MeVprotons. Sovjet Atomic Energy, 44(4):377–383, 1978.
G. Verdu, D. Ginestar, V. Vidal, and J.-L. Munoz-Cobo. 3D λ-Modes of the Neutron-Diffusion Equation. Annals of Nuclear Energy, 21 (7):405–421, 1994.
L. Vermeeren. Personal communication. e-mail, May 2015.
163

References
164

Summary
This thesis provides a methodology and set-up of a reactivity monitoring toolfor Accelerator-Driven Systems (ADS). The reactivity monitoring tool should gua-rantee the operation of an ADS at a safe margin from criticality. Robustness isassured in different aspects of the monitoring tool: the choice of the measurementtechniques, the evaluation methods to derive the reactivity from experimentaldata, and the detector type and positioning.
In the first chapter of the work, the experience from previous research pro-grammes (mainly MUSE and YALINA) is used to select appropriate experimentaltechniques for reactivity monitoring. A combination of three techniques is as-sessed to monitor reactivity: The Pulsed Neutron Source (PNS) technique (withthe Integrated Source Jerk (ISJ) method as alternative) for start-up (until 1 % ofnominal power) and the Current-to-Flux (CTF) combined with the Source Jerk(SJ) technique during ADS operation.
Static evaluation methods are used to derive the reactivity from the experimen-tal value: the area method for start-up, the static CTF method during operation,and the static SJ method for the interim cross-checking of the ADS reactivity.These are more robust than dynamic evaluation techniques, as they do not de-pend on the knowledge of kinetic parameters. In the second chapter of this thesis,the spatial correction factors (SCFs) are defined that need to be applied on thereactivity values obtained by point kinetics. Via modal analysis, the SCFs arederived analytically for the selected evaluation methods.
Extensions are made to the existing DALTON diffusion code in order to performmodal analysis and time-dependent experiment simulations. In this way modalanalysis helps to understand the behaviour of the simulated SCFs of the completesubcritical core.
In the third chapter the proposed reactivity monitoring methods are tested onthe zero-power VENUS-F ADS. Thanks to the modular core, VENUS-F can operatein both critical and subcritical mode. The experimental reactivity results cantherefore be compared to a value obtained by an alternative methodology, startingfrom a critical core. The experimental results confirm the modal analysis andexperiment simulations. For both absolute reactivity measurement techniques(PNS area method and SJ method) SCF < 1, i.e. a safe overestimation of theabsolute reactivity value, is found outside a sphere at the centre of the core with a
165

Summary
radius of about 20 to 25 cm, depending on the energy group. The SCF=1 locationcorresponds to the zero crossing of the first eigenfunction (different from thefundamental one) with a zero crossing outside the centre of the core.
The outer reflector is chosen as robust location for the detectors during start-upand interim cross-checking reactivity monitoring during operation, as in this zoneSCF < 1 with a small spatial gradient. For the VENUS-F first subcritical core SC1,SCFarea=SCFSJ=0.96-0.97 (depending on the detector type), which correspondsto an overestimation of
??ρ??=3709 pcm by 111-148 pcm. Special attention should
be paid to (local) thermalising elements, considerably influencing the SCF. Thisissue could be solved by the use of threshold detectors.
Finally, reactivity monitoring during operation in the MYRRHA ADS is studiedin order to take into account the full-power aspects of reactivity monitoring. Forthe start-up reactivity monitoring and interim reactivity cross-checking MYRRHAbehaves similar to VENUS concerning the SCFs for the evaluation methods. The(outer) reflector is therefore the recommended detector zone, preferably usingthreshold fission chambers as instrumentation.
For the simulation of reactivity monitoring during operation, MCNP is usedas appropriate simulation tool to deal with the MYRRHA core inhomogeneities.The relative CTF monitor is evaluated between three stages of operation: thetemperature feedback during core start-up (from 1 % nominal power on), thecore enlargement during the first MYRRHA cores, and the burn-up during theMYRRHA equilibrium core.
Again, the MYRRHA outer reflector turns out to be a suitable detector loca-tion for reactivity monitoring also during operation, independent of the detectortype. A safe (under)estimation of the absolute reactivity decrease is obtained forall stages of operation, except for the temperature feedback case. For practicalreasons, only a limited number of detectors will be installed in the reflector. There-fore, a conservative boundary value of 500 pcm could be appropriate to take intoaccount the locations with extreme SCFs, in case no re-calibration of the relativeCTF monitor via the SJ method is possible.
As a conclusion, it is possible to measure the reactivity in an ADS by combiningdifferent experimental techniques. The accuracy of the reactivity monitor will de-pend on the safety function it has to fulfill and the related licensing requirements.If it is possible to perform short (in the order of hundreds of µs) reproducibleaccelerator beam interruptions with a stable beam restoration, the absolute re-
166

activity during operation can be determined via the SJ cross checking technique.In that case, the accuracy of the reactivity monitoring tool can be improved. Thehigher the accuracy, the higher the operational keff level, which is beneficial forthe operational cost of an ADS.
167

Summary
168

Samenvatting
Dit proefschrift levert een methodologie en het ontwerp van een systeem om dereactiviteit van een Accelerator-Driven System (ADS) te monitoren. Dit systeemmoet de veilige werking van een ADS garanderen, met een veilige marge omkritikaliteit te vermijden. De robuustheid van het systeem wordt verzekerd opverschillende vlakken: de keuze van de meettechnieken, de evaluatiemethodesom de reactiviteitswaarde af te leiden uit experimentele data, het type detectorenen hun locatie.
In het eerste hoofdstuk van het proefschrift wordt de ervaringsterugkoppelingvan voorgaande onderzoeksprojecten (hoofdzakelijk de MUSE en YALINA pro-jecten) gebruikt om geschikte experimentele technieken te selecteren voor reactivi-teitsmonitoring. Een combinatie van drie technieken is hiervoor onderzocht: degepulste neutronenbron (PNS) techniek (met de Integrated Source Jerk (ISJ) tech-niek als alternatief) voor de opstart (tot 1 % van het nominaal vermogen), en deCurrent-To-Flux (CTF) techniek gecombineerd met de Source Jerk (SJ) techniektijdens de werking van het ADS.
Om de reactiviteit af te leiden uit de experimentele data worden statische eva-luatiemethodes gebruikt: de oppervlaktemethode voor opstart, de statische CTFmethode tijdens bedrijf, en de statische SJ methode voor het tussentijds contro-leren van de reactiviteit van het ADS. Deze methodes zijn meer robuust dan dy-namische methodes, aangezien ze niet afhangen van de kennis van de kinetischeparameters. In het tweede hoofdstuk van dit proefschrift worden de ruimtelijkecorrectiefactoren (SCFs) gedefinieerd die worden toegepast op de reactiviteits-waarden verkregen via de puntkinetiek. Via modale analyse worden de SCFs voorde geselecteerde evaluatiemethodes analytisch afgeleid.
De reeds bestaande DALTON code werd uitgebreid om modale analyse en tijds-afhankelijke simulaties van experimenten uit te voeren. Zo kan modale analysehelpen om het gedrag van de gesimuleerde SCFs te begrijpen in de volledigesubkritische kern.
In het derde hoofdstuk worden de voorgestelde methodes voor reactiviteits-monitoring getest op het nulvermogen VENUS-F ADS. Dankzij de modulaire kernkan VENUS-F in zowel kritische als subkritische toestand bedreven worden. Daar-door kunnen de experimentele reactiviteitswaarden vergeleken worden met eenwaarde verkregen via een alternatieve methodologie, die vertrekt van een kritische
169

Samenvatting
kern. De experimentele waarden bevestigen de modale analyse en de simulatievan de experimenten. Voor beide methodes (PNS en SJ) die een absolute waardevan de reactiviteit opleveren wordt SCF < 1 (dit is een veilige overschatting vande absolute reactiviteitswaarde) verkregen buiten een bol in het centrum van dekern met een straal van 20-25 cm, afhankelijk van de energiegroep. De locatiewaar SCF=1 komt overeen met de nuldoorgang van de eerste eigenfunctie meteen nuldoorgang die niet in het centrum van de kern ligt (en verschillend van defundamentele eigenfunctie).
De buitenste reflector wordt gekozen als robuuste detectorlocatie tijdens opstarten voor de tussentijdse reactiviteitscontrole tijdens bedrijf, aangezien in deze zonede SCF< 1 met een kleine ruimtelijke gradiënt. Voor de eerste subkritische VENUS-F kern SC1, is SCFarea=SCFSJ=0.96-0.97 (afhankelijk van het type detector), watovereenkomt met een overschatting van
??ρ??=3709 pcm met 111-148 pcm. Speciale
aandacht dient te worden besteed aan (lokale) thermaliserende elementen die deSCF aanzienlijk kunnen beïnvloeden. Deze kwestie kan opgelost worden doorhet gebruik van detectoren met een drempelwaarde.
Tot slot wordt de reactiviteitsmonitoring tijdens bedrijf van het MYRRHA ADSbestudeerd, om de aspecten met betrekking tot vol vermogen in rekening tebrengen bij reactiviteitsmonitoring. Voor de opstart en de tussentijdse reactivi-teitscontrole gedraagt MYRRHA zich zoals VENUS met betrekking tot de SCFs vande evaluatiemethodes. Daarom is de (buitenste) reflector de aangewezen zonevoor de detectoren. Er worden bij voorkeur splijtingskamers met een drempel-waarde als instrumentatie gebruikt.
Voor de simulatie van de reactiviteitsmonitoring tijdens uitbating is MCNPgebruikt als simulatiecode, om de sterk inhomogene MYRRHA kern te modelleren.De relatieve CTF reactiveitsmonitoring wordt geëvalueerd tijdens drie fases inbedrijf: de temperatuursterugkoppeling tijdens opstart (vanaf 1 % nominaalvermogen), de kernvergroting tijdens de eerste MYRRHA kernen en de opbrandtijdens de MYRRHA equilibrium kern.
Opnieuw blijkt de buitenste reflector de aangewezen locatie voor de detectorenvoor reactiviteitsmonitoring, ook tijdens bedrijf, onafhankelijk van het detec-tortype. Een veilige (onder)schatting van de daling van het absolute reactiviteits-niveau wordt voor alle uitbatingsfases verkregen, behalve voor de temperatuurs-terugkoppeling. Omwille van praktische redenen worden maar een beperkt aantaldetectoren in de reflector geïnstalleerd. Daarom zou een conservatieve grens-waarde van 500 pcm geschikt kunnen zijn om rekening te houden met locaties
170

met extreme SCFs, in het geval geen hercalibratie van de relatieve CTF reactivi-teitscontrole mogelijk is via de SJ methode.
Het blijkt mogelijk om de reactiviteit van een ADS te meten door verschillendeexperimentele technieken te combineren. De vereiste nauwkeurigheid van dereactiviteitsmonitoring hangt af van de veiligheidsfunctie van het systeem en vangerelateerde vereisten om een uitbatingslicentie te verkrijgen. Als het mogelijkis om korte (in de orde van honderden µs) repetitieve onderbrekingen van dedeeltjesbundel van de accelerator uit te voeren met een stabiel herstel van debundel, kan de absolute reactiviteit bepaald worden door tussentijdse controlevia de SJ techniek. In dat geval kan de nauwkeurigheid van het reactiviteitsmoni-toringsysteem verbeterd worden. Hoe hoger de nauwkeurigheid, hoe hoger hetkeff niveau tijdens bedrijf, wat voordelig is voor de exploitatiekost van een ADS.
171

Samenvatting
172

Acknowledgements
Core
This thesis is realised thanks to the support of many people. First of all, I would liketo thank Tim van der Hagen, the promotor of this work. Thanks to his constructivefundamental analysis mode during our monthly meetings, he was the efficientcore manager of this work. Even after becoming dean of the Faculty of AppliedSciences, he continued to devote the necessary time to the management of thisPhD work.
Secondly, the support of my copromotor Danny Lathouwers is invaluable. Hefocused my research scope into a strong (beam) line, and accelerated the dailymanagement of this work by his computational and theoretical reactor physicsknowledge. Finally, Jan-Leen Kloosterman provided the required coupling of bothtools into a successful system by his all-round management, technical and moralsupport.
Back to the basics, the drivers of this work are at SCK•CEN, who I am grateful.They offered me the (financial) possibility to make a PhD in combination with a‘normal’ job. Hamid Aït Abderrahim’s mind created so many research questionsin our institute, and Peter Baeten translated one of them into a precise PhD topic.It is a privilege to validate in this work theoretical calculations and simulationswith unique experimental results.
An important acknowledgement goes to Gert Van den Eynde, my daily managerat SCK•CEN. Gert was a real mentor of this PhD. He reconciled the daily projectwork with the fundamental PhD research. He created the work environment tocombine a PhD with the day-to-day job and patiently provided a continuoussupport.
Support
Thanks to the fruitful collaboration between TUDelft and SCK•CEN, my work wassupported by many interesting and warm people in the field.
From TUDelft side, thanks go to Hugo van Dam and Eduard Hoogenboom forthe interesting discussions, to the PhD and Postdoc colleagues for all kinds ofsupport (Bart, Gertjan, Frank, Luca, Zoltan, Jozsef, Jurriaan, Valentina, Matteo,Denis, Sara, Aldo, Karo, Dimitrios), to the administrative support by Ine and Thea,
173

Acknowledgements
and to the other members of the NERA team (Martin, Peter, Dick, Norbert, ...) forall-round support.
At SCK•CEN, I am grateful for the support of my colleagues from the NuclearSystem Physics group: Simon, Bart, Luca, Nadia, Edouard, Alexey, Alberto, Bau-doin, Radu, David, Guy, Simone, Francesco, Dario, Diego, Tewfik, Camilla, Margotand Carine. Also the Research Reactor Operation group and the GUINEVERE andFREYA project teams helped me for this work via the experimental results.
SCK•CEN is a unique research institute where personal development is en-couraged, thanks to the group of warm colleagues. Many of them supportedme: colleagues from the train, administrative staff, the SCK•CEN Academy, thecommunication department and many more.
The outside world
Last but not least, I would like to thank my parents, family and friends for theircontinuous support in my life. They know what they mean to me without expla-nation.
Thank you!
174

List of Publications
Journal Publications
Main Author
• W. Uyttenhove, D. Lathouwers, J.-L. Kloosterman, T.H.J.J. van der Hagen, G. Vanden Eynde, and P. Baeten. Methodology for Modal Analysis at Pulsed NeutronSource Experiments in Accelerator-Driven Systems. Annals of Nuclear Energy, 72:286–297, 2014.
• W. Uyttenhove, P. Baeten, G. Ban, A. Billebaud, S. Chabod, P. Dessagne, M. Kerveno,A. Kochetkov, F.-R. Lecolley, J.-L. Lecouey, N. Marie, F. Mellier, J.-C. Steckmeyer, H.-E.Thyébault, G. Vittiglio, and J. Wagemans. Experimental Results from the VENUS-FCritical Reference State for the GUINEVERE Accelerator Driven System Project.IEEE Transactions on Nuclear Science, 59(6):pp. 3194–3200, Invited Lecture atANIMMA2011, Gent, Belgium, 2012.
• W. Uyttenhove, P. Baeten, G. Van den Eynde, A. Kochetkov, D. Lathouwers, andM. Carta. The Neutronic Design of a Critical Lead Reflected Zero-power Refe-rence Core for On-line Subcriticality Measurements in Accelerator-Driven Systems.Annals of Nuclear Energy, 38:1519–1526, 2011.
• W. Uyttenhove, V. Sobolev, and W. Maschek. Optimisation of Composite MetallicFuel for Minor Actinide Transmutation in an Accelerator-Driven System. Journalof Nuclear Materials, 416:291–299, 2011.
Co-Author
• J.-L. Lecouey, N. Marie, G. Ban, A. Billebaud, S. Chabod, A. Kochetkov, F.-R. Lecolley,G. Lehaut, F. Mellier, H.-E. Thyébault, W. Uyttenhove, C. Van Grieken, and G. Vit-tiglio. Estimate of the Reactivity of the VENUS-F Subcritical Configuration using aMonte Carlo MSM Method. Annals of Nuclear Energy, 83:65–75, 2015.
• H. Imawoto, A. Stankovskiy, and W. Uyttenhove. Sensitivity and uncertainty analy-sis of the VENUS-F critical core. Energy Procedia, 71:33–41, 2015.
• V. Sobolev, W. Uyttenhove, R. Thetford, and W. Maschek. Prognosis and Comparisonof Composite CERCER and CERMET Fuels dedicated to Transmutation of TRU inan EFIT ADS. Journal of Nuclear Materials, 414:257–264, 2011.
• L. Mercatali, A. Serikov, P. Baeten, W. Uyttenhove, A. Lafuente, and P. Teles. DesignStudy of a Fast Spectrum Zero-power Reactor dedicated to Source-driven Sub-critical Experiments. Energy Conversion and Management, 51:1818–1825, 2010.Oral Presentation at ICENES, Ericeira, Portugal June 29-July 3, 2009.
175

List of Publications
Publications from Oral Presentations at International Conferences
Main Author
• W. Uyttenhove, P. Baeten, A. Kochetkov, G. Vittiglio, J. Wagemans, D. Lathouwers,J.-L. Kloosterman, T.H.J.J. van der Hagen, A. Billebaud, S. Chabod, F. Mellier, J.-L.Lecouey, F.-R. Lecolley, G. Lehaut, N. Marie, X. Doligez, M. Carta, V. Bécares, andD. Villamarin. Static Modal Analysis of the Current-to-Flux Subcriticality Monitorfor Accelerator-Driven Systems. In Proceedings of the International Conference onthe PHYSics Of Reactors (PHYSOR2014), Kyoto, Japan, 2014. Best Paper Award.
• W. Uyttenhove, P. Baeten, D. Lathouwers, J.-L. Kloosterman, A. Kochetkov, A. Krasa,G. Van den Eynde, T.H.J.J. van der Hagen, G. Vittiglio, and J. Wagemans. ReactivityMonitoring in Accelerator-Driven Systems. In International Youth Nuclear Congress(IYNC), Burgos, Spain, July 6-12,, 2014.
• W. Uyttenhove. Past and Future Activities on the VENUS Facility. In TechnicalMeeting on Collaborative Work on Accelerator Driven Systems (ADS) and Use ofLow-Enriched Uranium (LEU) in ADS, IAEA, Vienna, 4-7 February, 2013.
• W. Uyttenhove, G. Van den Eynde, P. Baeten, A. Kochetkov, G. Vittiglio, J. Wagemans,D. Lathouwers, J.-L. Kloosterman, T.J.H.H. van der Hagen, F. Wols, A. Billebaud,S. Chabod, H.-E. Thyébault, J.-L. Lecouey, G. Ban, F.-R. Lecolley, N. Marie, J.-C.Steckmeyer, P. Dessagne, M. Kerveno, and F. Mellier. Detector Positioning for theInitial Subcriticality Level Determination in Accelerator-Driven Systems. In Pro-ceedings of the International Conference on the PHYSics Of Reactors (PHYSOR2012),Knoxville (TN), USA, April 15-20, 2012.
• W. Uyttenhove and G. Van den Eynde. Physics of Subcritical Systems: Transpositiontowards a Full-scale ADS.In Atelier GEDEPEON, Paris, France, July 5-6, 2012.
• W. Uyttenhove and M. Carta. Challenges and Opportunities for modelling anAccelerator-Driven System with ERANOS. In 2nd ERANOS Users’ Workshop , Aix-en-Provence, France, October 19-21, 2009.
Co-Author
• J.-L. Lecouey, A. Kochetkov, A. Krasa, P. Baeten, V. Bécares, A. Billebaud, S. Chabod,T. Chevret, X. Doligez, F.-R. Lecolley, G. Lehaut, N. Marie, F. Mellier, W. Uyttenhove,D. Villamarin, G. Vittiglio, and J. Wagemans. Monte Carlo MSM Correction Factorsfor Control Rod Worth Estimates in Subcritical and Near-critical Fast NeutronReactors. In ICAPP 2015, Nice, France, May 3-6, 2015.
• G. Lehaut, J.-L. Lecouey, N. Marie, P. Baeten, V. Becares, A. Billebaud, S. Chabod,T. Chevret, X. Doligez, A. Kochetkov, A. Krasa, F.-R. Lecolley, F. Mellier, W. Uytten-hove, D. Villamarin, G. Vittiglio, and J. Wagemans. Study of Space-Energy Effects
176

in a Subcritical Reactor within a Time-dependent Multi-group 1-dimensional Dif-fusion Approach. In ICAPP 2015, Nice, France, May 3-6, 2015.
• A. Kochetkov, V. Becares, G. Bianchini, M. Carta, X. Doligez, V. Fabrizio, A. Krasa,A. Krasa, G. Lehaut, and W. Uyttenhove. Control Rod Worth Measurements in aFast Neutron VENUS-F Critical Core. In ICAPP 2015, Nice, France, May 3-6, 2015.
• A. Krasa, P. Baeten, A. Kochetkov, W. Uyttenhove, G. Vittiglio, J. Wagemans, L. Mer-catali, G. Bianchini, M. Carta, V. Fabrizio, and V. Peluso. The FREYA Project atVENUS-F - The Next Step Towards MYRRHA. In Advancements in Nuclear In-strumentation Measurement Methods and their Applications (ANIMMA), Lisbon,Portugal, April 20-24, 2015.
• A. Kochetkov, P. Baeten, W. Uyttenhove, G. Vittiglio, J. Wagemans, A. Billebaud,S. Chabod, X. Doligez, F.R. Lecolley, J.L. Lecouey, G. Lehaut, N. Marie, G. Ban, andF. Mellier. VENUS-F Zero Power Experiments to Support ADS and LFR Designs. InThird International Scientific and Technical Conference about Innovative Designsand Technologies of Nuclear Power, ISTC NIKIET, Moscow, Russia, October 7-10,2014.
• T. Chevret, J.-L. Lecouey, N. Marie, F.-R. Lecolley, G. Lehaut, G. Ban, A. Billebaud,S. Chabod, X. Doligez, A. Kochetkov, P. Baeten, W. Uyttenhove, G. Vittiglio, J. Wage-mans, F. Mellier, V. Bécares, and D. Villamarin. Reactivity Measurement of the LeadFast Subcritical VENUS-F Reactor using Beam Interruption Experiments. In Pro-ceedings of the International Conference on the PHYSics Of Reactors (PHYSOR2014),Kyoto, Japan, 2014.
• S. Chabod, A. Billebaud, F.-R. Lecolley, J.-L. Lecouey, G. Lehaut, N. Marie, G. Ban,X. Doligez, A. Kochetkov, P. Baeten, A. Krasa, W. Uyttenhove, G. Vittiglio, and J. Wage-mans. Reactivity measurements at GUINEVERE facility using the integral kp
method. In International Conference on the PHYSics Of Reactors (PHYSOR2014),Kyoto, Japan, 2014.
• V. Becares, D. Villamarin, E.M. Gonzalez-Romero, A. Kochetkov, P. Baeten, W. Uyt-tenhove, G. Vittiglio, J. Wagemans, A. Billebaud, S. Chabod, J.-L. Lecouey, F.-R.Lecolley, G. Lehaut, N. Marie, X. Doligez, and F. Mellier. Monte Carlo Assessmentof Spatial and Energy Effects in the VENUS-F Subcritical Configurations and Appli-cation for Reactivity Determination. In International Conference on the PHYSics OfReactors (PHYSOR2014), Kyoto, Japan, 2014.
• S. Dulla, M. Nervo, P. Ravetto, G. Mila, S. Argirò, S. Beolè, M. Masera, G. Bianchini,M. Carta, V. Fabrizio, V. Peluso, F. Gabrielli, A. Rineiski, A. Kochetkov, P. Baeten,W. Uyttenhove, G. Vittiglio, and J. Wagemans. Interpretation of ExperimentalMeasurements on the SC-1 Configuration of the VENUS-F Core. In Proceedingsof the International Conference on the PHYSics Of Reactors (PHYSOR2014), Kyoto,Japan, 2014.
177

List of Publications
• A. Kochetkov, P. Baeten, W. Uyttenhove, G. Vittiglio, J. Wagemans, A. Bilebaud,S. Chabod, J.-L. Lecouey, G. Ban, F.-R. Lecolley, N. Marie, G. Lehaut, X. Doligez, andF. Mellier. An alternative source jerk method implementation for the subcriticalityestimation of the VENUS-F subcritical core in the FREYA project. In Proceedingsof the International Conference on the PHYSics Of Reactors (PHYSOR2014), Kyoto,Japan, September 28 - October 3, 2014.
• A. Krasa, A. Kochetkov, P. Baeten, W. Uyttenhove, G. Vittiglio, and J. Wagemans.Experimental Investigation of the Axial Neutron Flux Distribution in an Accelerator-Driven System. In International Youth Nuclear Congress (IYNC), Burgos, Spain, July6-12, 2014.
• A. Kochetkov, G. Vittiglio, J. Wagemans, W. Uyttenhove, A. Krasa, and J. Hernandez.The Lead-Based VENUS-F Facility: Status of the FREYA Project. In InternationalSymposium on Reactor Dosimetry (ISRD), Aix-en-Provence, France, May 18-23, 2014.
• L. Mercatali, X. Doligez, A. Kochetkov, G. Vittiglio, W. Uyttenhove, G. Bianchini,M. Carta, V. Peluso, A. Gandini, and V. Fabrizio. Optimization Studies for a MYRRHA-like Mock-up Configuration in the VENUS-F Facility. In International TopicalMeeting on Nuclear Applications of Accelerators (AccApp), Bruges, Belgium, August5-8, 2013.
• N. Marie, G. Lehaut, J.-L. Lecouey, A. Billebaud, S. Chabod, X. Doligez, F.-R. Lecolley,A. Kochetkov, W. Uyttenhove, G. Vittiglio, J. Wagemans, F. Mellier, G. Ban, H.-E.Thyébault, and D. Villamarin. Reactivity Monitoring Using the Area Method for theSubcritical VENUS-F Core within the Framework of the FREYA Project. In Techno-logy and Components of Accelerator-Driven Systems (TCADS), Second InternationalWorkshop, Nantes, France, May 21-23, 2013.
• S. Chabod, X. Doligez, G. Lehaut, A. Billebaud, J.-L. Lecouey, F.-R. Lecolley, N. Marie,A. Kochetkov, W. Uyttenhove, G. Vittiglio, J. Wagemans, F. Mellier, G. Ban, H.-E. Thyébault, and D. Villamarin. Analysis of Prompt Decay Experiments forADS Reactivity Monitoring at VENUS-F Facility. In Technology and Componentsof Accelerator-Driven Systems (TCADS), Second International Workshop, Nantes,France, May 21-23, 2013.
• A. Kochetkov, P. Baeten, A. Billebaud, S. Chabod, X. Doligez, F.-R. Lecolley, J.-L.Lecouey, G. Lehaut, N. Marie, H.-E. Thyébault, W. Uyttenhove, J. Wagemans, G. Ban,P. Dessagne, M. Kerveno, and L. Mercatali. Current Progress and Future Plans ofthe FREYA Project. In Technology and Components of Accelerator-Driven SystemsTCADS, Second International Workshop, Nantes, France, 21-23 May, 2013.
• H.-E. Thyebault, P. Baeten, A. Billebaud, S. Chabod, A. Kochetkov, F.-R. Lecolley,J.-L. Lecouey, G. Lehaut, N. Marie, F. Mellier, W. Uyttenhove, G. Vittiglio, J. Wage-mans, G. Ban, P. Dessagne, M. Kerveno, and J.-C. Steckmeyer. The GUINEVEREExperiment: First PNS Measurements in a Lead Moderated Sub-Critical Fast Core.In ICAPP, Chicago, USA, June 24-28, 2012.
178

• A. Kochetkov, P. Baeten, A. Billebaud, S. Chabod, F.-R. Lecolley, J.-L. Lecouey,N. Marie, F. Mellier, H.-E. Thyébault, G. Vittiglio, W. Uyttenhove, J. Wagemans,G. Ban, P. Dessagne, M. Kerveno, and J.-C. Steckmeyer. The GUINEVERE Projectat VENUS-F Facility: Critical Core Configuration. In GLOBAL, Nagoya, Japan,September 4-9, 2011.
• P. Baeten, H. Aït Abderrahim, G. Bergmans, A. Kochetkov, W. Uyttenhove, D. Vande-plassche, F. Vermeersch, G. Vittiglio, G. Ban, M. Baylac, A. Billebaud, D. Bondoux,J. Bouvier, S. Chabod, J.M. de Conto, P. Dessagne, G. Gaudiot, J.M. Gautier, G. Heitz,M. Kerveno, B. Launé, F.R. Lecolley, J.-L. Lecouey, N. Marie, Y. Merrer, A. Nuttin,D. Reynet, J.-C. Steckmeyer, and F. Mellier. The GUINEVERE project at the VENUS-F facility. In European Nuclear Conference (ENC), Barcelona, Spain, May 30 - June2, 2010.
• L. Mercatali, P. Baeten, A. Kochetkov, W. Uyttenhove, and G. Vittiglio. The GUINE-VERE Experiments at the VENUS Facility: Status and Perspectives. In EuropeanNuclear Conference (ENC), Barcelona, Spain, May 30 - June 2, 2010.
• A. Billebaud, P. Baeten, H. Aït Abderrahim, G. Ban, M. Baylac, G. Bergmans, D. Bon-doux, J. Boouvier, S. Chabod, J.-M. De Conto, P. Dessagne, G. Gaudiot, J.-M. Gau-tier, G. Granget, G. Heitz, M. Kerveno, A. Kochetkov, B. Laune, F.-R. Lecolley, J.-L.Lecouey, N. Marie, F. Mellier, Y. Merrer, A. Nuttin, D. Reynet, J.-C. Steckmeyer,W. Uyttenhove, D. Vandeplassche, F. Vermeersch, and G. Vittiglio. The GUINE-VERE Project for Accelerator-Driven System Physics. In GLOBAL, Paris, France,September 6-11, 2009.
179

List of Publications
180

Curriculum Vitae
Wim Uyttenhove (1980, Ghent, Belgium) is a mechanical and nuclear engineer fromGhent University.
In 2005, he started his professional career as a safety engineer at AVN (AssociationVinçotte Nuclear), the Belgian nuclear safety inspection body at that time. He performedsafety analyses and assisted resident inspectors in the Belgian nuclear power plants ofDoel and Tihange.
From 2008 to 2015, he worked as a research and licensing engineer for advanced nuclearsystems at SCK•CEN, the Belgian nuclear research centre. He was in charge of the coredesign, licensing, and commissioning of the VENUS-F installation, a unique accelerator-driven system.
From 2010 onwards, Wim has been a professional trainer of nuclear engineering tojunior engineers, senior management, reactor operators, and master students in industryand academia.
In October 2015, Wim launched The Binding Energy. The company offers strategicengineering and communication services, focusing on companies dealing with risks, oractive in the energy sector. Wim is passionate about transparent communication and acommon sense safety approach.
181