REACTIVE BLENDING APPROACH TO MODIFY SPIN COATED …
44
Helsinki University of Technology Department of Electrical and Communications Engineering Laboratory of Electronics Production Technology Espoo 2004 HUT-EPT-10 REACTIVE BLENDING APPROACH TO MODIFY SPIN COATED EPOXY FILM Markus P.K. Turunen Tomi Laurila Kimmo Solehmainen and Jorma K. Kivilahti TEKNILLINEN KORKEAKOULU TEKNISKA HÖGSKOLAN HELSINKI UNIVERSITY OF TECHNOLOGY TECHNISCHE UNIVERSITÄT HELSINKI UNIVERSITE DE TECHNOLOGIE D´HELSINKI Reprinted from Electronics Production Technology Publication Series, HUT-EPT-10, ISSN 1457-0440, ISBN 951-22-7036-6, Copyright 2004, with permission from authors.
Transcript of REACTIVE BLENDING APPROACH TO MODIFY SPIN COATED …

Helsinki University of Technology Department of Electrical and Communications Engineering Laboratory of Electronics Production TechnologyEspoo 2004 HUT-EPT-10
REACTIVE BLENDING APPROACH TO MODIFY SPINCOATED EPOXY FILM Markus P.K. Turunen Tomi Laurila Kimmo Solehmainen and Jorma K.Kivilahti
TEKNILLINEN KORKEAKOULU TEKNISKA HÖGSKOLAN HELSINKI UNIVERSITY OF TECHNOLOGY TECHNISCHE UNIVERSITÄT HELSINKI
UNIVERSITE DE TECHNOLOGIE D´HELSINKI
Reprinted from Electronics Production Technology Publication Series, HUT-EPT-10, ISSN1457-0440, ISBN 951-22-7036-6, Copyright 2004, with permission from authors.

Distributor:Helsinki University of Technology Laboratory of Electronics Production Technology P.O. Box 3000 FIN-02015 HUT Tel. +358-9-451 4989 Fax +358-9-451 5776 Email: [email protected]
ISBN 951-22-7036-6 ISSN 1457-0440
Otamedia Oy Espoo 2004

Contents
PREFACE 4
ABSTRACT OF THE REPORT 5
Part I
Synthesis and characterization of star-shaped poly( -caprolactone)
1. INTRODUCTION 7
2. MATERIALS AND METHODS 8
2.1 Materials 8 2.2 Preparation of network precursors 8 2.3 Preparation of reactive blending solutions 9 2.4 Coating and crosslinking procedure 9 2.5 Characterization 9
3. RESULTS AND DISCUSSION 11
3.1 Polymerization of hydroxyl end-functional oligomers 11 3.2 Substitution of hydroxyl end-groups by succinic anhydride 13 3.3 Reactive blending of epoxy with end-functionalized oligomer 14 3.4 Thermomechanical properties 15 3.5 SEM examination of fracture surfaces of films 16 3.6 Surface free energy – contact angle measurements 17 3.7 Cell culture 18
4. CONCLUSIONS 19
Acknowledgements 19
References 20
1

Part II
Crosslinking kinetics
1. INTRODUCTION 23
2. MATERIALS AND METHODS 24
2.1 Materials 24 2.2 Characterization methods 24 2.3 Model-free kinetic analysis 24
3. RESULTS AND DISCUSSION 26
3.1 Acid-catalyzed ring-opening polymerization of the epoxy 26 3.2 Imidazole-catalyzed PCL2-SA reaction with epoxy 28 3.3 The dual-catalyzed reaction 29 3.4 Verification of crosslinking conditions 30
4. CONCLUSIONS 31
References 32
2
Part III
Determination of Tg by spectrophotometry
1. INTRODUCTION 34
2. EXPERIMENTAL 35
2.1 Materials 35 2.2 Preparation of spin coated films 35 2.3 Scanning electron microscopy 35 2.4 Optical characterization 35 2.5 Determination of refractive index 35 2.6 Determination of film thickness 36 2.7 Method to determinate thermal properties 36
3. RESULTS AND DISCUSSION 37
3.1 Glass transition temperature and film thickness 38 3.2 Determination of thermal expansion 40
4. CONCLUSIONS 41
References 42
3
PREFACE
Electronic packaging is a multidisciplinary task requiring engineering skills oriented toelectrical, mechanical, thermal, metallurgical, and chemical design together with a mastery of manufacturing, interconnections, and reliability. With the growing importance of electronic packaging in the manufacturing of advanced devices, a better understanding of the interfacial compatibility of materials is becoming more and more crucial. Dissimilar materials are needed to establish highly miniaturized electronic packages and several critical interfaces are inevitable. Good interfacial adhesion of dissimilar materials requires chemical, physical, and mechanicalcompatibility, which cannot be achieved without modification of bulk and surface properties of the materials. This report, which comprises three different but closely related studies, describes thefundamental understanding and practices necessary for achieving epoxy-derived materials withenhanced properties. A reactive blending approach was employed and thorough characterization of the blends was made by multidisciplinary experimental methods.
As new technologies emerge, it becomes increasingly clear that polymeric materials will befound at nearly all levels of the electronics manufacturing. Polymers have many chemical, physical, and mechanical properties that recommend them for the manufacture of components, packages, and functional assemblies. Polymers are also cost-effective, lightweight, tailorable, and easilyprocessable in comparison to metals and ceramics. Epoxies are increasingly being used in electronics, but their applicability is often limited by their inherent brittleness. A number of approaches have been reported for overcoming the brittle behavior; one of these approaches is the reactive blending of epoxy with oligomeric network precursors such as described here. Reactiveblending, although it is an effective way to modify the bulk and surface properties of a polymersimultaneously, depends on a well-controlled crosslinking reaction, which determines the resultingnetwork structure.
The use of polymers as films in electronic devices has created technological interest in the study of thin films (in microelectronics) and thick films (in PWB level and optical waveguides). During the exposure of operational electronic devices to changing environments, for example,interfacial stresses arise from various origins, including the mismatch in thermomechanicalproperties. A means to characterize selected thermal properties of films in-situ by non-destructive methods is thus of great interest.
With the trend to miniaturized electronics continuing, interfacial compatibility requires special emphasis. Here, to improve the interfacial compatibility, we undertook to improve epoxy-derived materials and in particular their thermal, mechanical, and optical properties. In future, interfacial compatibility will also cover interactions between synthetic materials and living tissue, andbiocompatibility evaluations will become important in the materials science. Biocompatibilityassessment is touched on in this report but restricted to a preliminary study carried out withendothelial cells and an investigation of their spreading on pristine and modified materials. Theinformation obtained in the course of this research thus also demonstrates our interest in the manufacturing of bioadaptive devices.
4

ABSTRACT OF THE REPORT
Epoxies find wide use in electronics manufacturing, but their applicability is often limited by their inherent brittleness. In this study, epoxy resin, SU8, was modified through reactive blending to enhance both its surface and bulk properties. For the purpose, novel star-shaped poly( -caprolactone) (PCL) oligomers were synthesized and functionalized to enable crosslinking reactionbetween epoxy and oligomer. Thorough characterization of the oligomers confirmed that their structure could be tailored in a controlled manner by adjustment of the ratio of initiator tomonomer(s) in the feed. Effective modification of the epoxy with the oligomer demands that a high degree of crosslinking be achieved. To ensure this, a dual-catalyzed crosslinking reaction was utilized and investigated by the model-free reaction kinetics evaluation method. The crosslinking conditions were optimized to allow the incorporation of a large amount of oligomer into the epoxy while minimizing the reaction induced phase separation. The modified material was then used to prepare films in the thickness range of a few micrometers. Thermal properties of such films aredifficult to determine but need to be known for the assessment of interfacial compatibility.Spectrophotometry with a temperature option was employed in a novel way to provide informationabout the thermal properties of films. The thermal properties were inferred from the opticalcharacterization data. When the aim of the manufacturing is bioadaptive devices, especially in implanted devices, the properties of surfaces and biocompatibility become important. Contact anglemeasurements were carried out to follow the effect of reactive blending on the surface free energyof the films, and it was discovered that the hydrophobicity is slightly increased. The morphology of seeded endothelial cells indicated biocompatibility.
5
Part I
Synthesis and characterization of star-shaped poly( -caprolactone)
Markus P.K. Turunen*, Tomi Laurila, and Jorma K. Kivilahti
Laboratory of Electronics Production TechnologyDepartment of Electrical and Communications Engineering
Helsinki University of TechnologyP.O. Box 3000
FIN-02015 HUT Finland
* Corresponding authorTel: +358 9 451 4989Fax: +358 9 451 5776
E-mail: [email protected]
6

1. INTRODUCTION
Epoxies are extensively used in the manufacture of electronic devices due to their excellent adhesive properties, suitable mechanical strength and dielectric properties, light weight, and low cost. Use of photodefinable epoxies for high aspect ratio patterning has enabled many innovative applications including micro fluidic components, lab-on-a-chip instruments, miniaturizedmicromotors, and scanning micro probes besides the conventional uses of epoxies such as coatings and films.1-9 Previously, we have studied the manufacture of integrated optical waveguides and highly miniaturized build-up modules using SU8 and other epoxies and rigid printed wiring boards (PWB) as substrates.10-13 The ever-increasing packaging density creates strict demands on the reliability of miniaturized interconnections, in particular, and interfacial compatibility and adhesionhave become important issues.1,12-14
Surface modifications have provided good interfacial adhesion between polymers and metallizations,12,15-18 allowing reliable manufacture of the complex modules frequently encounteredin microelectromechanical systems (MEMS)19,20 and highly miniaturized electronics.21,22 Although interfacial adhesion of epoxies can be effectively enhanced through various modifications, their usein flexible assemblies continues to be limited by their intrinsic brittleness.23 Today, flexible PWBsare increasingly being used in high-density applications such as smart cards, hearing aids, displaysand portable electronics.24 However, the use of epoxies in flexible assemblies demands adequate modification of their thermomechanical properties.
Blending of brittle epoxies with a phase-separating polymer is a common approach to the toughening of epoxies. Most of the modifiers are liquid rubbers, the carboxyl-terminated copolymerof acrylonitrile and butadiene (CTBN) being especial widely used.25,26 CTBN reacts with the epoxy matrix to provide effective toughening. However, there are some serious drawbacks to CTBN. Itsunsaturated double bonds offer sites for oxidative as well as thermal degradation. Moreover, traces of carcinogenic acrylonitrile may persist, preventing the use of CTBN in biomaterials.27,28 Several studies have described the use of non-reactive phase-separating thermoplastic polymermodifiers.26,27,29-32 Unfortunately, toughening by non-reactive blending has too often been at theexpense of elastic modulus and thermal properties. In contrast to this, controlled crosslinking between the blending polymer and the brittle resin has been reported to result in a tough network without the adverse effects.33,34
In earlier paper,35 we described the synthesis and crosslinking of star-shaped poly( -caprolactone). Others have reported that highly branched polymers effectively flexibilize inherentlybrittle epoxies.36,37 The objective of the present work was to find out if a star-shaped poly( -caprolactone) could be tailor-made and functionalized to enable crosslinking with SU8 epoxy resin. With this target in mind, we synthesized four-armed -caprolactone based oligomers and end-functionalized them with carboxylic acid groups. In part I of this series of three papers, we describe the synthesis of the oligomers, their reactive blending with SU8 epoxy, and selected surface and bulk properties of spin coated films. One of the properties studied was the compatibility of the blend film with endothelial cells. In part II we will report the crosslinking kinetics of the dual-catalyzed crosslinking reaction, and in part III we will introduce a novel method to determine the glass transition temperature of polymer films.
7
2. MATERIALS AND METHODS
2.1 Materials
Oligomers were synthesized from -caprolactone monomer (CL; Solvay) in the presence of Sn(II)2-ethylhexanoate (SnOct2; Sigma) catalyst and polyglycerol-3 (PGL; Solvay) initiator.According to the manufacturer the PGL contained five hydroxyl groups. CL was dried overmolecular sieves and the other materials were used as received. Succinic anhydride (SA; Fluka) was used in the end-functionalization. The epoxy resin was SU8 (Shell) containing eight functional groups per monomer ( nM = 7000 g/mol) and it was diluted into a 50:50 (w/w) solution in -butyrolactone. Imidazole (Fluka) was used as crosslinking catalyst (0.06 wt.-% of the solid content of the reaction mixture) in the carboxylic acid reaction with epoxy. Triarylsulfoniumhexafluoroantimonate salt solution (50% wt.-% salt in polypropylene carbonate; Aldrich) was added(2.5 wt.-% of the epoxy content) as an acid catalyst precursor that decomposed to cations upon exposure to ultraviolet light ( =365nm, 17 mW/cm2 for 30 s) and catalyzed the ring-opening crosslinking reaction of the residual epoxy groups.
2.2 Preparation of network precursors
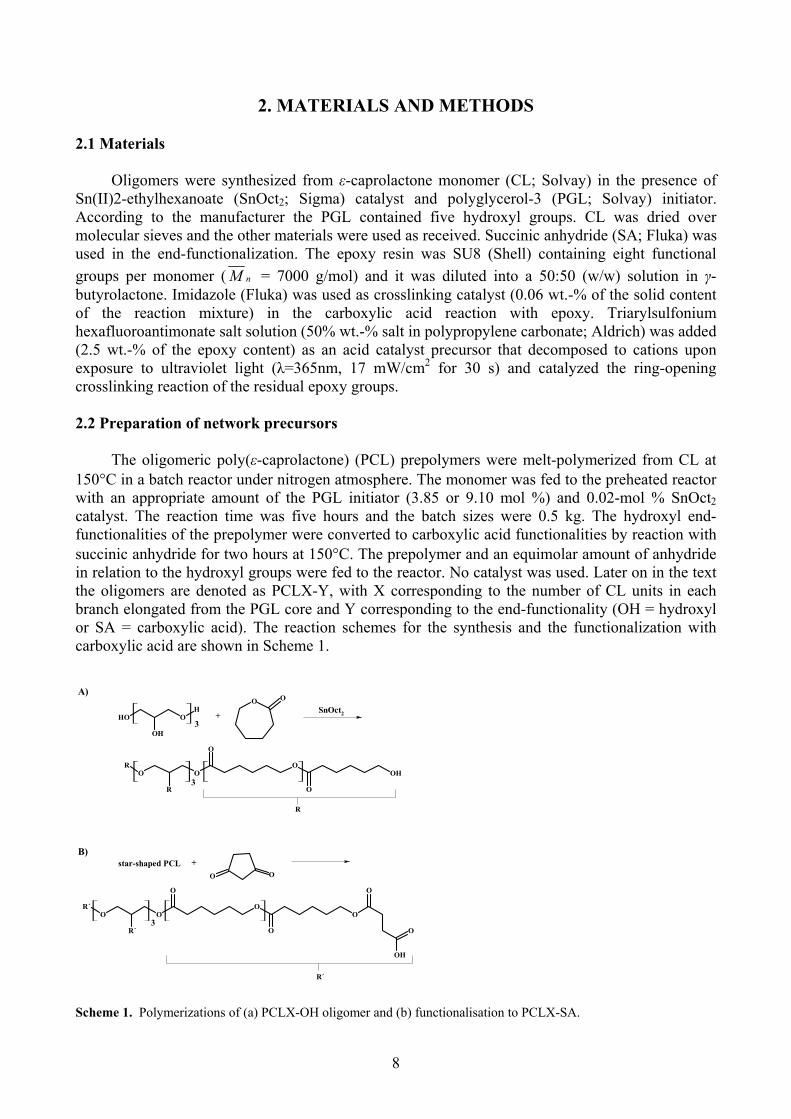
The oligomeric poly( -caprolactone) (PCL) prepolymers were melt-polymerized from CL at150 C in a batch reactor under nitrogen atmosphere. The monomer was fed to the preheated reactor with an appropriate amount of the PGL initiator (3.85 or 9.10 mol %) and 0.02-mol % SnOct2catalyst. The reaction time was five hours and the batch sizes were 0.5 kg. The hydroxyl end-functionalities of the prepolymer were converted to carboxylic acid functionalities by reaction with succinic anhydride for two hours at 150 C. The prepolymer and an equimolar amount of anhydridein relation to the hydroxyl groups were fed to the reactor. No catalyst was used. Later on in the text the oligomers are denoted as PCLX-Y, with X corresponding to the number of CL units in each branch elongated from the PGL core and Y corresponding to the end-functionality (OH = hydroxyl or SA = carboxylic acid). The reaction schemes for the synthesis and the functionalization with carboxylic acid are shown in Scheme 1.
OH OH
OH3
O O
+SnOct2
OOR
R
O
O
O
OH3
R
star-shaped PCL +
O O
OOR´
R´
O
O
O
O
O
O
OH
R´
3
A)
B)
Scheme 1. Polymerizations of (a) PCLX-OH oligomer and (b) functionalisation to PCLX-SA.
8

2.3 Preparation of reactive blending solutions
The PCLX-SA oligomers were mixed into the epoxy solution in 0:100, 5:95, 10:90, 20:80, 30:70, and 40:60 ratios by weight of the solids, i.e. oligomer and epoxy, respectively. Thecrosslinking catalyst(s) (imidazole and triarylsulfonium hexafluoroantimonate salt solution) were then added. The use of a dual-catalyzed mixture was needed to achieve a high degree of crosslinking because there was an excess of epoxy groups in relation to the carboxylic acid groupsof the oligomers. The crosslinking reactions of the dual-catalyzed solution are shown in Scheme 2.
R1
OH
O O
R2 R1
O
O
OH
R2
imidazole catalyst / bake
1. reaction+
O
R2
O
R2
+
acid catalyst + UV light / bake
2. reaction
R2
Polymer network
O
R2
O Polymer network
Scheme 2. Reactions of the dual-catalyzed crosslinking of PCLX-SA and epoxy.
2.4 Coating and crosslinking procedure
A solution of the network precursors (PCLX-SA oligomer and epoxy resin) and the solvent was spin coated on a silicon wafer at a speed of 2000 rpm for 30 s. A film thickness of 10 to 20 mwas formed depending on the viscosity of the solution, which was not constant because of the different molecular weights of the oligomers. The solvent was evaporated during the first bake at 90 °C for 30 minutes. Simultaneously the PCLX-SA reacted with the epoxy groups. After the first bake, the coatings were exposed to ultraviolet light, which released the acid catalyst from the photoinitiator. The cationic ring-opening crosslinking of the residual epoxy groups was catalyzed in the second bake, which occurred at 180 °C for 60 minutes in a convective oven. The preparation of the coatings was carried out in a clean room (class 1000) to avoid surface contamination.
2.5 Characterization
The 1H NMR spectra were recorded on a Varian XL-300 NMR spectrometer working at 300.032 MHz. The samples were dissolved in CDCl3 in 10-mm NMR tubes at room temperature.The sample concentration was about 1% by weight for proton. Proton decoupled 13C NMR spectra were obtained with the Varian XL-300 NMR spectrometer working at 75.452 MHz. The sample concentrations in 10-mm tubes were 10% by weight in CDCl3.
The number-averaged molecular weight ( nM ), weight-averaged molecular weight ( wM ), and molecular weight distribution (MWD) were determined by room temperature size exclusionchromatography (SEC) (Waters System Interface module, Waters 510 HPLC Pump, Waters 410 Differential Refractometer, Waters 700 Satellite Wisp, and four PL gel columns: 104, 105, 103, and 100 Å connected in series). Monodisperse polystyrene standards were used for primary calibration. Chloroform (Riedel-de Haën; stabilized with 1% ethanol) was used as solvent and eluent. Theinjected volume was 200 µl and the flow rate was 1 ml min-1.
9

Differential scanning calorimeter (DSC) measurements were carried out on a Mettler Toledo Star DSC821 in the temperature range -100–100°C for the oligomers and 100–210°C for the crosslinked samples, both at a heating and cooling rate of 10°C/min. The glass transition (Tg) and melting (Tm) temperatures of the oligomers were recorded during the second heating period. Theresidual reactivity and the Tg of the crosslinked samples were observed from the first heating scan, during which the epoxy groups are expected to reach complete conversion.
Dynamic mechanical analysis (DMA) was performed on a Perkin-Elmer 7 Series instrument.Samples of size 2 10 ~0.5 mm3 were investigated in flexural mode (three-point bending) under atemperature ramp of 4 C/min at a fixed frequency of 1 Hz. The measurements were carried out over a temperature range of -50–250 C. The reported glass transition temperatures correspond to the maximum of the loss angle (tan ) and the slope of the storage modulus (E’).
Scanning electron microscopy (SEM) examinations of the cross-sections of fractured polymercoatings were carried out to obtain information about the fracture mechanism of the reactively blended epoxy films and to observe morphology. An initial crack was prepared with a diamond pen on the back of a sample, i.e. on the silicon wafer, after which a sharp bending force was applied manually to break the sample. The specimens were sputter-deposited with chromium with an EmiTech turbo sputter-coater K575-X. All the specimens were examined with a Jeol field emissionscanning electron microscope (JSM-6335F) operated at 5 kV.
The contact angles of sessile drops of distilled water, diiodomethane, and formamide on thecoating surfaces were measured with an Advanced Surface Technology Inc. goniometer equipped with a VCA 2500XE video contact angle system. For each sample, the contact angle value is the average of eight measurements recorded from different locations on the sample with a standard deviation of 1-3º. Surface free energy ( S) of the solid surface was calculated from the contact angles using a geometric mean model.38,39 The geometric mean model was selected from models found in the literature38-44 on the basis of our earlier evaluation of the various models13 and the ongoing debate about models.13,45-48 The volume of the liquid drop was 0.1 µl. The surface freeenergy ( S) in the model is assumed to be the sum of dispersion ( S
d) and polar ( Sp) components.
The dispersive (d) and polar (p) components for the surface tensions ( LV) of the probing liquids adopted here are LV = 72.8 mJ/m2, LV
d = 21.8 mJ/m2, LVp = 51.0 mJ/m2 for distilled water; LV =
50.8 mJ/m2, LVd = 48.5 mJ/m2, LV
p =2.3 mJ/m2 for diiodomethane; and LV = 58.2 mJ/m2, LVd =
39.5 mJ/m2, LVp =18.7 mJ/m2 for formamide.49
Human pulmonary artery endothelial cells (HPAE) were obtained from PromoCell(Heidelberg, Germany) and were cultured from passage 4 to passages 13-14 in defined endothelial cell growth medium-2 (PromoCell). The cells were then split once a week using 0.1% trypsin.Trypsin was inhibited by trypsin-neutralizing solution (TNS, PromoCell). For the experiment the cells were seeded on pristine surface and on surfaces treated with fetal calf serum (FCS) and fixed after both four- and 24-hour cultures.
Fixations were carried out with 0.1 M sodium cacodylate buffered 2.5% (w/v) glutaraldehyde(pH 7.2, EM-grade) for one hour at +4 C. After fixation the samples were washed three times with the same buffer. After dehydration in the series of solutions with increasing amount of ethanol in water and finally twice in 100% ethanol, hexamethyldisilazane (HMDS) was used to preserve theoriginal morphology of the cells.50,51 The samples were mounted on aluminum stubs with silverglue. Chromium was used as coating metal and the sputter coating was done in an EmiTech turbo
10
sputter coater K575-X. All specimens were examined under a Jeol field emission scanning electron microscope JSM-6335F at 5 or 15 kV.
3. RESULTS AND DISCUSSION
The synthesis of crosslinkable poly( -caprolactone) consisted of two steps (Scheme 1). First, CL-based star-shaped oligomers were polymerized. In the second step, the hydroxyl groups of the oligomers were converted to carboxylic acid end-functionalities by reaction with succinic anhydride. Reactive blends were prepared from the carboxylic acid functionalized oligomers and epoxy, and thin polymer films were laid on silicon substrates by spin coating. Finally, the filmswere crosslinked with the use of the dual catalyst (Scheme 2). Below we report the synthesis of the functionalized oligomers, the reactive blending, and selected surface and bulk characteristics of the crosslinked polymer blends.
3.1 Polymerization of hydroxyl end-functional oligomers
The use of multi-hydroxyl functionalized PGL initiator in ring-opening polymerization (ROP) of CL enables the preparation of star-shaped oligomers.35 The molecular weight of the oligomervaried with the ratio of PGL to CL in the feed (Table 1). Since the amount of the SnOct2 catalystwas very low in relation to the OH groups in the PGL initiator ([SnOct2]/[OH]) = ~0.001-0.002 mol mol-1), the SnOct2 must have acted as a catalyst rather than as an initiator in this ROP, which follows a coordination-insertion mechanism as has been pointed out by Dong et al.52 using comparable reaction conditions. The role of SnOct2 as a catalyst is in agreement with the general understanding that alteration of the PGL/CL ratio can be used to tailor the molecular weight of theoligomers. 1H NMR study showed the conversion of the -caprolactone to be close to 100%, because there was no peak for the CL monomer (-CH2-COO-) at 2.63 ppm. The average number of CL units in each arm can be determined by end-group analysis, which can be adequately done for oligomers by NMR. It is to be noted that, for a multi-arm structure, end-group analysis yieldsaverage arm length and not absolute length. From the low concentration of SnOct2, we assume that the arms start to grow one after the other as the catalyst becomes available for the PGL hydroxyl groups. The growing branches probably create steric hindrance over some of the initiator’s hydroxylgroups, which in turn decreases the branching below the amount expected on the basis of thestructure of the initiator. In addition, on the basis of the roles of catalyst and initiator noted above, it is likely that the arms are of different length. This being the case, the end-group analysis yields only an average degree of branching and an average chain length of the branches.
The number of arms of the star-shaped oligomers was determined by 13C NMR analysis.Although the 1H NMR spectra are more sensitive they cannot be used for quantitative analysisbecause some peaks of the PGL initiator overlapped the region of interest. By way of example, the 13C NMR spectrum of the PCL5-OH oligomer is shown in Fig. 1(a). For this oligomer, the average number of CL units per arm was calculated to be 6.1. The calculation was based on the integrated resonances at 173.5 ppm and 173.3 ppm, assigned to carbons “6” and “12” respectively, in Fig. 1(a). It was expected that if all five hydroxyl groups of the PGL initiate the polymerization reaction of CL the number of CL units per arm would be 5.0. Thus, the measured and predicted number of CL units per arm did not match. The number of the CL units (96.15 mol-%) per PGL unit (3.85 mol-%) in the feed was 25, which suggests the presence of four arms (25/6.1 = 4.1), on average, for the oligomer. In summary, only four hydroxyl groups of the five available in the initiator were capable of initiating the ROP reaction. This is in agreement with earlier studies carried out with 8-
11

functional initiator and -caprolactone (6/8 OH groups reacted)35 and with 6-functional initiator andlactide (4/6 OH groups reacted).53
35 30 25ppm
173.6 173.5 173.4 173.3 173.2ppm
5.131.00
70 65 60ppm
OH
O
O
O
O Polym
12
34
576
1211
10
98
n
6
12
1
7
2
5
11
810
4
9
3
(A)
35 30 25ppm
70 65 60ppm
177 176 175 174 173 172 171ppm
OH
O
O
O
O
O
O
O Polym
n
13
14
15 16 17
13
14,
1516
17
(B)
Figure 1. 13C NMR spectra for (a) PCL5-OH and (b) end-functionalized PCL5-SA oligomers.
DSC analysis of the star-shaped PCL oligomers was carried out to obtain information about their structure. The PGL initiator was amorphous, but the incorporation of CL arms resulted in a semicrystalline structure (Table 1). Oligomers PCL2-OH and PCL5-OH both exhibited two meltingendotherms. Multiple melting endotherms are generally observed for branched polymers,54-56
although the reason for this is not clear. We propose that the star-shaped oligomers exhibit arms of different length, each with a different ability to form crystalline domains during solidification. Asdiscussed above, the formation of arms of different length is likely for star-shaped oligomersprepared in the presence of low concentration of SnOct2. Previously,35 it was shown that as the proportion of CL increases, i.e., the molecular weight increases, the thermal properties of star-shaped oligomers approach those reported57 for linear high-molecular-weight PCL (Tg = -60°C, Tm= 60°C). This tendency was observed here too and the thermal properties of the 4-armed oligomerswere similar to those reported35 for the 6-armed oligomers of comparable molecular weight.
SEC was used to follow the influence of the PGL/CL ratio on molecular weight. As expected,the molecular weight could be tailored with the amount of PGL (Table 1). The ROP of CL yielded oligomers with controlled structure and with narrow MWD in the range of 1.2 to 1.3. We note,however, that the SEC instrument was calibrated with narrow polystyrene standards, so that the
12

SEC results were affected not only by the size of the molecule but also by the structure. The valuesobtained by SEC thus differed slightly from the theoretical nM values. A trend of decreased nMwith increased amount of PGL could nevertheless be seen. In addition, the SEC curves of the oligomers were symmetrical and unimodal, and no traces of unreacted -caprolactone were detected. Hence, the tailoring of the oligomer structure was controlled and the conversion was high according to both NMR and SEC analyses.
Table 1. Properties of the PCLX-OH and end-functionalized PCLX-SA oligomers.
a The number refers to the theoretical amount of CL units per arm.
Oligomera,bDSC
Tg ( C) Tm ( C)SEC
wM (g mol-1) nM (g mol-1) MWDTheoretical
cnM (g mol-1)
PGL -42 - n.d. n.d. n.d. 240
PCL2-OH -59 6, 19 2780 2220 1.3 1360
PCL5-OH -60 33, 40 6260 5290 1.2 3040
PGL-SA 1 - n.d. n.d. n.d. 740
PCL2-SA -41 - 6250 4110 1.5 1860
PCL5-SA -44 30, 37 20300 8060 2.5 3540
b SA refers to succinic anhydride. c Calculated as [CL]/[PGL] x M(CL) + M(PGL) + 5 x M(SA). n.d. = not determined because of insolubility in the eluent.
Molecular weight analysis of highly branched polymers is difficult and few methods give "absolute" values. In the case of highly controllable polymerizations such as ROP, the measuredvalue should coincide with the theoretical nM . It is reported58 that SEC gives a higher nM value than multi-angle laser light scattering (MALLS), which is considered to be an accurate methodresulting in “absolute” value for nM . In addition, SEC analysis of linear polymers result in highermolecular weight value than the analysis of branched polymer with similar molecular weight. Thisis because branched polymers assume a more tightly packed structure than their linear counterparts,which are used in the calibration of SEC and assume a random coil structure. The nM value for the four-armed oligomers that we obtained by SEC was higher than the theoretical nM calculated from the feed ratio. We attribute this to the significant difference in the hydrophilicity of the core molecule and the CL arms, which causes the oligomers (PCLX-OH) to assume a spatially star-shaped rather than a tightly packed structure in the SEC analysis.
3.2 Carboxylic acid functionalization
The oligomers' hydroxyl end-groups were converted to carboxylic acid groups by reaction with succinic anhydride. The degree of functionalization was high according to NMR analysis (compareFig. 1a and 1b). The peaks in the 13C NMR spectrum for the end-group carbons of the oligomer(CH2-CH2-OH) assigned as “1” and “2” in Fig. 1a disappeared as a result of the functionalization. The exchange of the terminal groups was verified by 1H NMR analysis. The carboxylic acid group caused a peak at 2.64 ppm, which originated from the protons attached to the two carbon atoms in
13

the new end-group, assigned as “7” and “8” in Fig. 2b. Measurement of the peak intensity madepossible a quantitative analysis of the degree of functionalization. Disappearance of the hydroxyl end-group peak at 3.58 ppm and the value of the end-group/CL ratio (SA/CL) led us to concludethat functionalization of oligomers reacted with succinic anhydride was complete. The SA/CL ratiowas 1/6, in agreement with the 13C NMR results. The detailed chemical structure characterization of the functionalized oligomer, based on the 1H/13C NMR analyses, is shown in Figs. 1b and 2b. Theglass transition temperature increased with the carboxylic acid functionalization probably owing to the increase in intermolecular hydrogen bonding. The amorphous nature of the PCL2 oligomerincreased after the functionalization and the melting endotherms disappeared (Table 1). PCL5 oligomer, however, which had longer CL segments, continued to exhibit double meltingendotherms.
4.0 3.5 3.0 2.5 2.0 1.5 1.0ppm
5.913.07 2.982.941.00
4.0 3.5 3.0 2.5 2.0 1.5 1.0ppm
2.03 1.031.000.94 0.19
O
O
O
O
OPolym
O
O
OH
1
2 3, 5
4
6
7
7, 8
8
OH
O
O
O
OPolym
1
2
3
4
5
6
A)
B)
Figure 2. 1H NMR spectra for (a) PCL5-OH and (b) end-functionalized PCL5-SA oligomers.
3.3 Reactive blending of epoxy with end-functionalized oligomer
We anticipated that the synthesized four-armed oligomer could be used to effectively toughen the inherently brittle SU8 epoxy. In addition, we expected that the use of a flexible core molecule,PGL, as initiator rather than pentaerythritol, which has previously been used as an initiator forpolylactide polymerization,59 would enhance the plasticization effect. The end-functionalization enabled reaction between the oligomer and the epoxy resin, which has been reported to reduce thephase separation while giving rise to toughening.33,34 Reaction induced phase separation may,however, still occur during the crosslinking of a two-component reaction mixture because thesolubility of the components decreases as a function of the increasing molecular weight of the network.60-62
DSC provided first-hand information about the crosslinked networks. According to the DSC analyses, the crosslinked epoxy exhibited a Tg around 180°C, and the blends with 10 wt.-% of PCL0-SA, PCL2-SA, and PCL5-SA had Tgs of about 130°C, 160°C, and 60°C, respectively. Asexpected, the Tg of the reactively blended epoxies was slightly lower than that of the
14
homogeneously crosslinked epoxy, though the Tg of the blend prepared with PCL2-SA was still fairly high. A high Tg is considered beneficial for many applications in electronics. Both the size of the macromolecule, and the proportion of the oligomer affected the Tg. The crosslinking kinetics will be studied in detail in Part II63 and the other effects on Tg in Part III.64 Some of the samplesexhibited two Tgs, indicating inadequate incorporation of PCLX-SA into the network. The second Tg was weak and broad, however, which means that the degree of PCLX-SA incorporation into the network must have been considerable. Also the primary Tg appeared as a weak peak. Dynamicmechanical analysis was accordingly employed to obtain more information about the networkstructure.
3.4 Thermomechanical properties
Dynamic mechanical analysis (DMA) has been used to detect two-phase structures in polymerblends providing at the same time thermomechanical information.65 Here, we investigated the network structure of the crosslinked epoxy and the effect of the type and amount of the oligomer on the thermomechanical properties of the reactively blended epoxies.
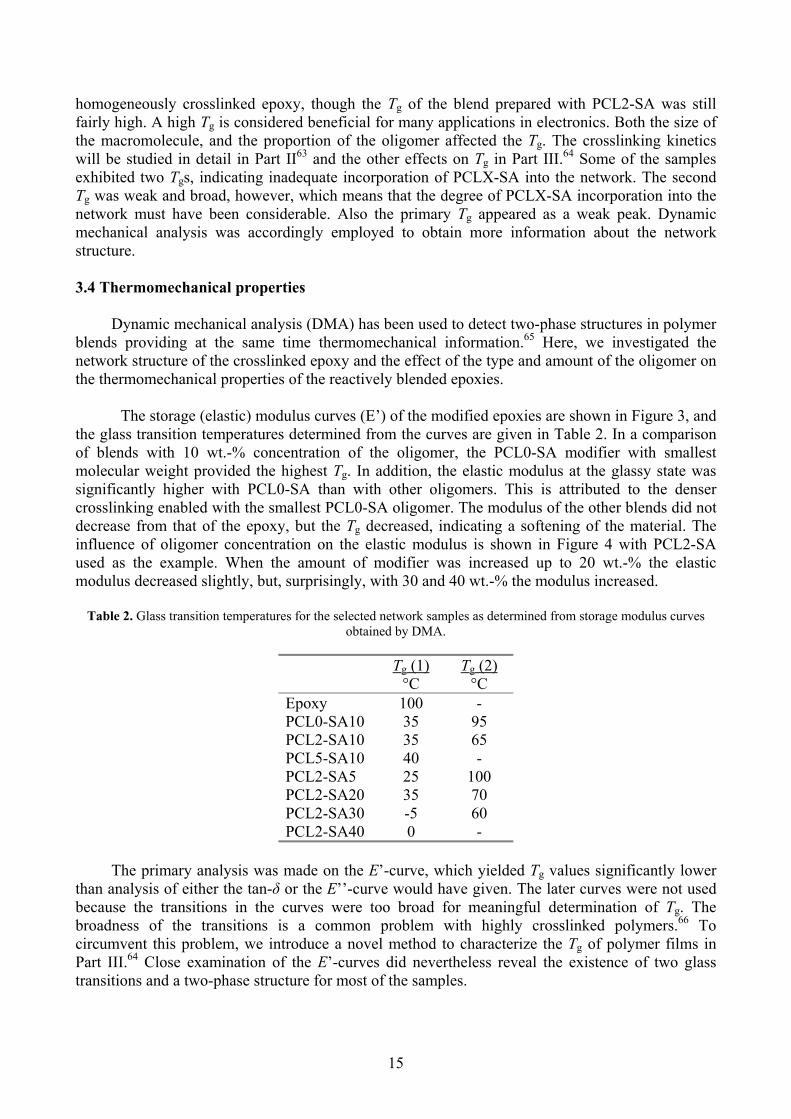
The storage (elastic) modulus curves (E’) of the modified epoxies are shown in Figure 3, and the glass transition temperatures determined from the curves are given in Table 2. In a comparisonof blends with 10 wt.-% concentration of the oligomer, the PCL0-SA modifier with smallestmolecular weight provided the highest Tg. In addition, the elastic modulus at the glassy state was significantly higher with PCL0-SA than with other oligomers. This is attributed to the densercrosslinking enabled with the smallest PCL0-SA oligomer. The modulus of the other blends did not decrease from that of the epoxy, but the Tg decreased, indicating a softening of the material. Theinfluence of oligomer concentration on the elastic modulus is shown in Figure 4 with PCL2-SA used as the example. When the amount of modifier was increased up to 20 wt.-% the elastic modulus decreased slightly, but, surprisingly, with 30 and 40 wt.-% the modulus increased.
Table 2. Glass transition temperatures for the selected network samples as determined from storage modulus curvesobtained by DMA.
Tg (1)°C
Tg (2)°C
Epoxy 100 -PCL0-SA10 35 95PCL2-SA10 35 65PCL5-SA10 40 -PCL2-SA5 25 100PCL2-SA20 35 70PCL2-SA30 -5 60PCL2-SA40 0 -
The primary analysis was made on the E’-curve, which yielded Tg values significantly lower than analysis of either the tan- or the E’’-curve would have given. The later curves were not used because the transitions in the curves were too broad for meaningful determination of Tg. Thebroadness of the transitions is a common problem with highly crosslinked polymers.66 Tocircumvent this problem, we introduce a novel method to characterize the Tg of polymer films in Part III.64 Close examination of the E’-curves did nevertheless reveal the existence of two glass transitions and a two-phase structure for most of the samples.
15
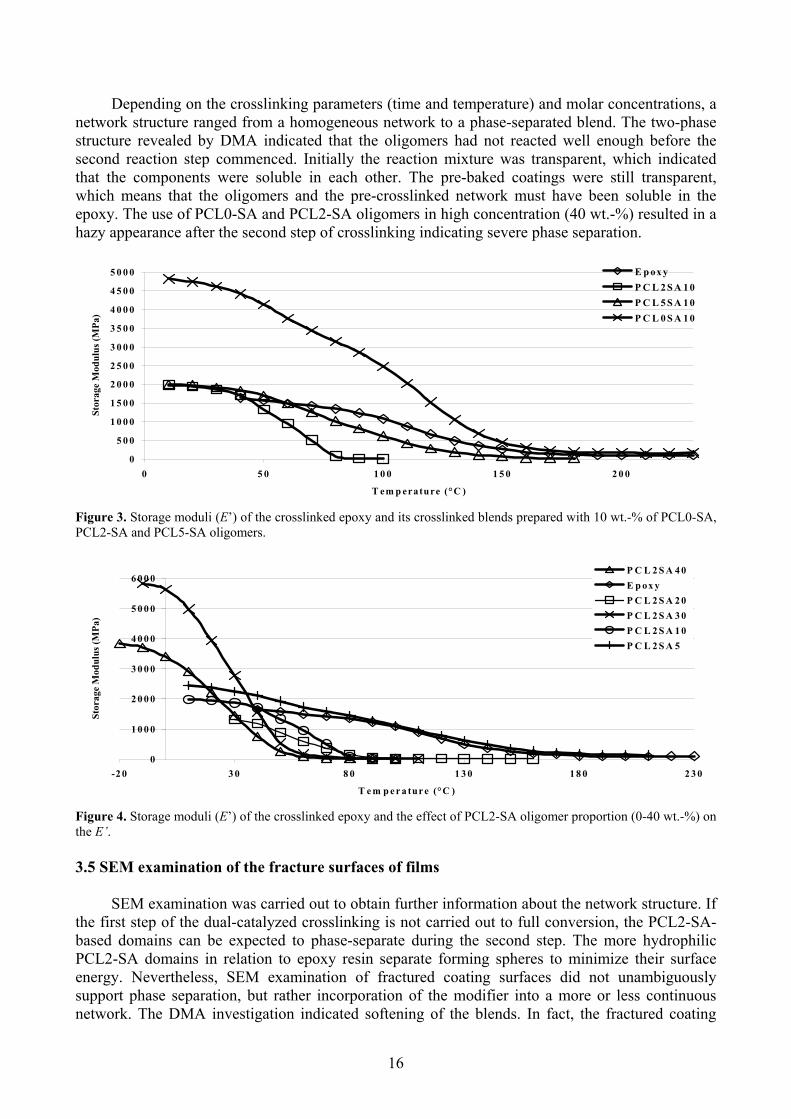
Depending on the crosslinking parameters (time and temperature) and molar concentrations, a network structure ranged from a homogeneous network to a phase-separated blend. The two-phase structure revealed by DMA indicated that the oligomers had not reacted well enough before the second reaction step commenced. Initially the reaction mixture was transparent, which indicated that the components were soluble in each other. The pre-baked coatings were still transparent, which means that the oligomers and the pre-crosslinked network must have been soluble in theepoxy. The use of PCL0-SA and PCL2-SA oligomers in high concentration (40 wt.-%) resulted in a hazy appearance after the second step of crosslinking indicating severe phase separation.
igure 3. Storage moduli (E’) of the crosslinked epoxy and its crosslinked blends prepared with 10 wt.-% of PCL0-SA,
e E’.
nformation about the network structure. If e first step of the dual-catalyzed crosslinking is not carried out to full conversion, the PCL2-SA-
based
0
5 0 0
1 0 0 0
1 5 0 0
2 0 0 0
2 5 0 0
3 0 0 0
3 5 0 0
4 0 0 0
4 5 0 0
5 0 0 0
0 5 0 1 0 0 1 5 0 2 0 0
T em p erature (°C )
Stor
age
Mod
ulus
(M
Pa)
E p ox y
P C L 2 S A 1 0
P C L 5 S A 1 0
P C L 0 S A 1 0
FPCL2-SA and PCL5-SA oligomers.
0
1 0 0 0
2 0 0 0
3 0 0 0
4 0 0 0
5 0 0 0
6 0 0 0
-2 0 3 0 8 0 1 3 0 1 8 0 2 3 0
T e m p e r a tur e (°C )
Stor
age
Mod
ulus
(M
Pa)
P C L 2 S A 4 0
E p ox y
P C L 2 S A 2 0
P C L 2 S A 3 0
P C L 2 S A 1 0
P C L 2 S A 5
Figure 4. Storage moduli (E’) of the crosslinked epoxy and the effect of PCL2-SA oligomer proportion (0-40 wt.-%) on th
3.5 SEM examination of the fracture surfaces of films
SEM examination was carried out to obtain further ith
domains can be expected to phase-separate during the second step. The more hydrophilic PCL2-SA domains in relation to epoxy resin separate forming spheres to minimize their surfaceenergy. Nevertheless, SEM examination of fractured coating surfaces did not unambiguouslysupport phase separation, but rather incorporation of the modifier into a more or less continuousnetwork. The DMA investigation indicated softening of the blends. In fact, the fractured coating
16

surfaces showed that a brittle fracture occurs when the homogeneous epoxy (Fig. 5a) is broken anda more ductile fracture appears as the content of oligomer is increased (Fig. 5b). Further evidencefor successful toughening by reactive blending was obtained from DMA analyses (see above). In particular, a comparison of the loss modulus curves showed that significantly more energy is dissipated in deformation of the PCL2-SA modified blend than in deformation of the brittle homogeneous epoxy.
Epoxy Si A) E/PCL2-SA(40%) SiB)
Figure 5. Comparison of the fractured surfaces of (a) the epoxy and (b) blend film (40 wt.-% of PCL2-SA in thepoxy).
face free energy – contact angle measurements
e manufacturing of bioadaptive devices. he degree of hydrophilicity of the surface has a particular influence on biocompatibility and cell
sprea
oligomer made up of 11 CL units is about 40° and it increases with the number of CL units. The four-armed PCL2-SA oligomer has 10 CL units
e
3.6 Sur
The properties of surfaces are of key importance in thT
ding. Contact angle measurements made with deionized water, diiodomethane (DIM), and formamide (FA) were carried out on the crosslinked coatings. The surface free energies and thehydrophobic ( d
sv) and hydrophilic ( psv) components were calculated from the contact angles by the
geometric mean model (see Table 3 for the results). The division into the above-mentionedcomponents allows a discussion of the hydrophilicity/hydrophobicity evolution of the surface. Allthe coatings were fairly hydrophobic. The blend with 30% PCL2-SA by weight was the mosthydrophobic with polarity (Xp = p
sv/ sv) of only 1%. However, the development of the water contact angles, and the hydrophobicity, was not directly proportional to the amount of added oligomer. The coatings with 20 and 40 wt.-% of the PCL2-SA had lower contact angles with water than the other coatings, indicating more hydrophilicity.
The contact angle with water for a linear PCL diol67
and could be expected to exhibit similar or perhaps slightly smaller contact angle with water than that reported for the PCL diol, since it has a relatively large hydrophilic core (the PGL initiator) and carboxylic acid end-groups capable of forming hydrogen bonds. Assuming that thecontact angle between water and the end-functionalized oligomer is roughly half that for the cured epoxy (80.4°), we expected that the contact angle for the epoxy would decrease with incorporation of the oligomer, resulting in increased hydrophilic character. However, the crosslinking reactions affect the chemistry of the incorporated network precursors,13 and the final surface properties were not simply a sum of the surface properties of the incorporated molecules.
17
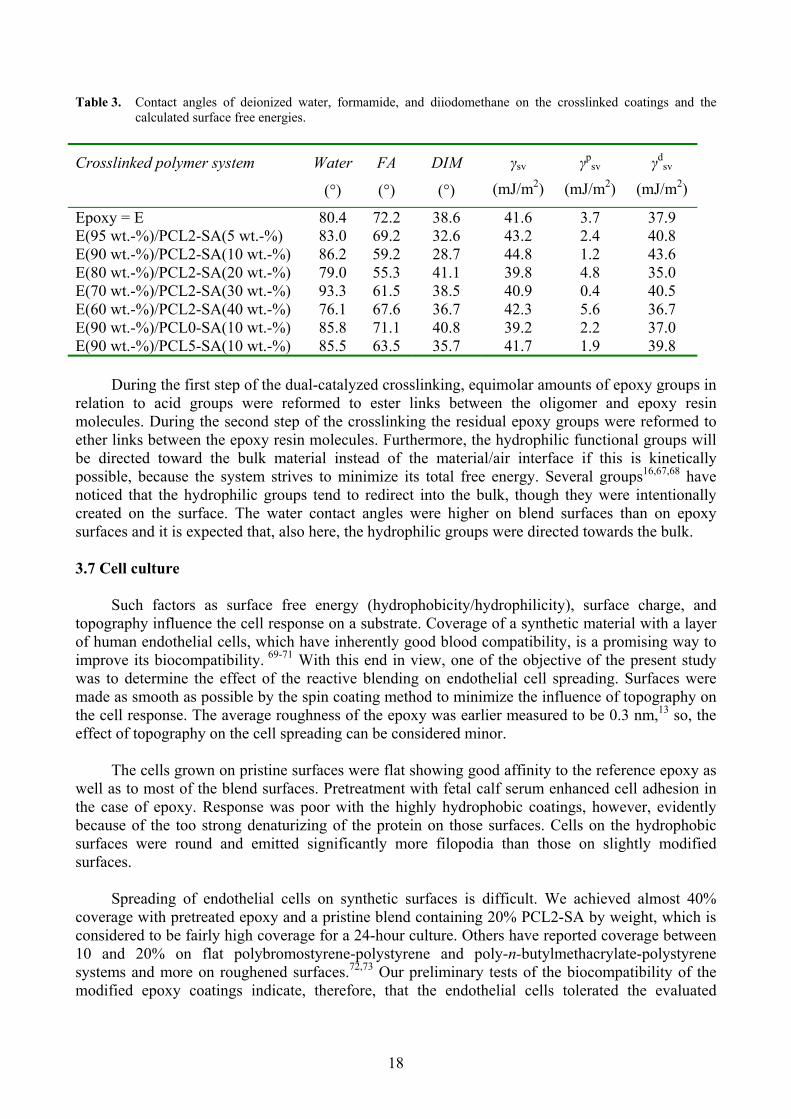
Table 3. Contact angles of deionized water, formamide, and diiodomethane on the crosslinked coatings and thecalculated surface free energies.
Crosslinked polymer system Water
( )
FA
( )
DIM
( )sv
(mJ/m2)
psv
(mJ/m2)
dsv
(mJ/m2)
Epoxy = E 80.4 72.2 38.6 41.6 3.7 37.9E(95 wt.-%)/PCL2-SA(5 wt.-%) 83.0 69.2 32.6 43.2 2.4 40.8E(90 wt.-%)/PCL2-SA(10 wt.-%) 86.2 59.2 28.7 44.8 1.2 43.6E(80 wt.-%)/PCL2-SA(20 wt.-%) 79.0 55.3 41.1 39.8 4.8 35.0E(70 wt.-%)/PCL2-SA(30 wt.-%) 93.3 61.5 38.5 40.9 0.4 40.5E(60 wt.-%)/PCL2-SA(40 wt.-%) 76.1 67.6 36.7 42.3 5.6 36.7E(90 wt.-%)/PCL0-SA(10 wt.-%) 85.8 71.1 40.8 39.2 2.2 37.0E(90 wt.-%)/PCL5-SA(10 wt.-%) 85.5 63.5 35.7 41.7 1.9 39.8
During the first step of the dual-catalyzed crosslinking, equimolar amounts of epoxy groups in relation to acid groups were reformed to ester links between the oligomer and epoxy resin molecules. During the second step of the crosslinking the residual epoxy groups were reformed to ether links between the epoxy resin molecules. Furthermore, the hydrophilic functional groups willbe directed toward the bulk material instead of the material/air interface if this is kineticallypossible, because the system strives to minimize its total free energy. Several groups16,67,68 have noticed that the hydrophilic groups tend to redirect into the bulk, though they were intentionally created on the surface. The water contact angles were higher on blend surfaces than on epoxy surfaces and it is expected that, also here, the hydrophilic groups were directed towards the bulk.
3.7 Cell culture
Such factors as surface free energy (hydrophobicity/hydrophilicity), surface charge, andtopography influence the cell response on a substrate. Coverage of a synthetic material with a layer of human endothelial cells, which have inherently good blood compatibility, is a promising way to improve its biocompatibility. 69-71 With this end in view, one of the objective of the present study was to determine the effect of the reactive blending on endothelial cell spreading. Surfaces weremade as smooth as possible by the spin coating method to minimize the influence of topography on the cell response. The average roughness of the epoxy was earlier measured to be 0.3 nm,13 so, theeffect of topography on the cell spreading can be considered minor.
The cells grown on pristine surfaces were flat showing good affinity to the reference epoxy as well as to most of the blend surfaces. Pretreatment with fetal calf serum enhanced cell adhesion in the case of epoxy. Response was poor with the highly hydrophobic coatings, however, evidently because of the too strong denaturizing of the protein on those surfaces. Cells on the hydrophobic surfaces were round and emitted significantly more filopodia than those on slightly modifiedsurfaces.
Spreading of endothelial cells on synthetic surfaces is difficult. We achieved almost 40%coverage with pretreated epoxy and a pristine blend containing 20% PCL2-SA by weight, which isconsidered to be fairly high coverage for a 24-hour culture. Others have reported coverage between 10 and 20% on flat polybromostyrene-polystyrene and poly-n-butylmethacrylate-polystyrenesystems and more on roughened surfaces.72,73 Our preliminary tests of the biocompatibility of the modified epoxy coatings indicate, therefore, that the endothelial cells tolerated the evaluated
18

materials well. Additional biocompatibility testing will be required to gain a better understanding of in the vicinity of living tissubehavior e if implantation of such materials is to be considered.
4. CONCLUSIONS
rmed -caprolactone (CL ed mer e syn ed an d-fun lizedble ve ing the y resin. The ring-opening enc po ero tor ( d 9.1 %) an II)2-lig s w yd end- , wh ere
s d the ion on st horough characterization of uc ou ailo a co ed ma by ch g theth . A de f cros ng is ired fo ctiveol r. T iev dequa rossli netwo dual-
catalyzed reaction scheme was employed in which the oligomer was first incorporated into the epox
atodification of the surface properties makes the use in devices converging on biointerfaces a
Ackn
Four-a ) bas oligo s wer thesiz d en ctionawith succinic anhydride to ena reacti blend with epoxpolymerization of CL in the pres e of lyglyc l initia 3.9 an mol d Sn(ethylhexanoate catalyst yielded o omer ith h roxyl groups ich w completelyconverted to carboxylic acid group uring funct alizati age. Tthe oligomers showed that their str ture c ld be t red in ntroll nner anginratio of initiator to monomer(s) in e feed high gree o slinki requ r effemodification of the epoxy with the igome o ach e an a tely c nked rk, a
y matrix in the imidazole-catalyzed reaction. A second step was used to complete thecrosslinking and this was carried out in the acid-catalyzed ring-opening polymerization of theresidual epoxies. Application of the PCL2-SA oligomer to the epoxy resulted in a noticeableincrease in toughness according to combined microscopy and thermal investigations, while the Tgwas decreased only slightly. Despite the reactivity between the oligomer and the epoxy, DSC and DMA analyses indicated some reaction-induced phase separation. This could not be verified by SEM examination of the fracture surfaces of the blends, however. The blending increased surfacehydrophobicity and did not affect significantly the inherently advantageous spreading of endothelial cells. The results showed that the use of toughened SU8 with flexible PWBs is possible, and thmfeasible option.
owledgments
The authors express their gratitude to Dr. Kari Lounatmaa for the help in the cell fixation and SEM investigation and Dr. Ismo Virtanen for the cell cultures.
19

References
1 rown, W. D. Advanced electronic packaging: with emphasis on multichip modules; IEEE Press: Piscataway,999.
2 ricka, L. J. Clin Chim Acta 2001, 303 Griese, E. IEEE Trans Adv Packag 20
Lee, K. Y.; LaBianca, N.; Rishton, S. A.; Zolgharnain, S.; Gelorme, J. D.; Shaw, J.; Chang, T. H. P. J Vac Sci
Stieglitz, T.; Scholz, O.; Haberer, W.; Beutel, H. IEEE Trans Adv Packag 2001, 24(3), 366. 2 Kujala, A.; Tuominen, R.; Kivilahti, J. K. Solderless interconnection and packaging technique for embedded
1–4 June 1999; In 49th Electronic Component Technology Conference: San Diego, USA.. J. J Mater Sci 2002, 37, 4793.
4
6 Bartlet, P.; Pascault, J. P.; Sautereau, H. J Appl Polym Sci 1985, 30, 2955.27 Ratna, D. Polymer 2001, 42, 4209.28 Okamoto, Y. Polym Eng Sci 1983, 23, 222.29 Chen, J.-L.; Chang, F.-C. Macromolecules 1999, 32, 5348.30 Bucknall, C. B.; Partridge, I. K. Polymer 1983, 24, 639.31 Varley, R. J.; Hodgkin, J. H.; Simon, G. P. Polymer 2001, 42, 3847.32 Wu, S. J.; Lin, T. K.; Shyu, S. S. J Appl Polym Sci 2000, 75, 26.33 Punchaipetch, P.; Ambrogi, V.; Giamberini, M.; Brostow, W.; Carfagna, C.; D'Souza, N. A. Polymer 2002, 43,
839.34 Raghava, R. S. J Polym Sci Pol Phys, 1987, 25, 1017.35 Turunen, M. P. K.; Tuominen, J.; Korhonen, H.; Seppälä, J.V. Polym Int 2002, 51, 92.36 Boogh, L.; Petterson, B.; Månson, J.-A. E. Polymer 1999, 40, 2249.37 Ratna, D.; Simon, G. P. Polymer 2001, 42, 8833.38 Owens, D. K.; Wendt, R. C. J Appl Polym Sci 1969, 13, 1741.39 Kaelble, D. H.; Uy, K. C. J Adhes 1970, 2, 50.40 Fox, H. W.; Zisman, W. A. J. J Colloid Sci 1950, 5, 514.41 Kwok, D. Y.; Neumann, A. W. Colloids Surf A 2000, 161, 31.42 Fowkes, F. M. J Phys Chem 1963, 67, 2538.43 Wu, S. J Polym Sci Pol Phys 1971, 34,19.44 van Oss, C. J.; Chaudhury, M. K.; Good, R. J. Chem Rev 1988, 88, 927.45 Makkonen, L. Langmuir 2000, 16, 7669.46 Morrison, I. D. Langmuir 1991, 7(8), 1833.47 Della Volpe, C.; Maniglio, D.; Brugnara, M.; Siboni, S.; Morra, M. J Colloid Interf Sci 2004, 271(2), 434.
B1K 7, 219.
01, 24, 375.4
Technol B 1995, 3012.5 Lorenz, H.; Despont, M.; Fahrni, N.; Brugger, J.; Vettiger, P.; Renaud, P. Sensor Actuat A-Phys 1998, 64(1), 33.6 Becker, H.; Locascio, L. E. Talanta 2002, 56, 267.7 Genolet, G.; Despont, M.; Vettiger, P.; Anselmetti, D.; de Rooij, N. F. J Vac Sci Technol B 2000, 18(2), 617.8 Weigl, B. H.; Bardell, L. D.; Cabrera, C. R. Adv Drug Deliv Rev 2003, 55, 2003, 349.9 Krawczyk, S. Phys Stat Sol C 2003, 3, 998.10 Immonen, M.; Karppinen, M.; Kivilahti, J. K. Fabrication and characterization of optical waveguides embedded
on printed wiring boards, 21-23 Oct. 2003; In 3rd International IEEE Conference on Polymers and Adhesives inMicroelectronics and Photonics: Montreux, Switzerland.
11 Turunen, M. P. K.; Immonen, M.; Kivilahti, J. K. Evaluation of the environmental reliability of polymerwaveguides fabricated on printed wiring board, 21-23 Oct. 2003; In 3rd International IEEE Conference onPolymers and Adhesives in Microelectronics and Photonics: Montreux, Switzerland.
12 Ge, J.; Kivilahti, J. K. J Appl Phys 2002, 92, 3007.13 Turunen, M. P. K.; Laurila, T.; Kivilahti, J. K. J Polym Sci Pol Phys 2002, 40, 2137.14 Turunen, M. P. K.; Marjamäki, P.; Paajanen, M.; Lahtinen, J.; Kivilahti, J. K. Microelectron Reliab 2004, 44,
993.15 Siau, S.; Vervaet, A.; Schacht, E.; van Calster, A. J Electrochem Soc 2004, 151(2) C133.16 Ge. J.; Turunen, M. P. K.; Kivilahti, J. K. Thin Solid Films 2003, 440(1-2), 198.17 Ge, J.; Turunen, M. P. K.; Kusevic, M.; Kivilahti, J. K. J Mater Res 2003, 18, 2697.18 Ge, J.; Turunen, M. P. K.; Kivilahti, J. K. J Polym Sci Pol Phys 2003, 41, 623.19 Romig, A. D. Jr; Dugger, M. T.; McWhorter, P. J. Acta Mater 2003, 51(19) 5837-5866.20 Lee, M.-W.; Jo, S.-B.; Lee, K.-C.; Kim, K.-W.; Park, S.-G.; Lee, S.-G.; Lee, E.-H.; Beom-Hoan, O. Thin Solid
Films 2004, 447-448 (30), 615.21 Meyer, J.-U.;2
active components,3 Feng, R.; Farris, R2
2 Palm, P.; Määtänen, J.; De Maquill, Y.; Picault, A.; Vanfleteren, J.; Vandecasteele, B. Microelectronics Reliab 2003, 43, 445.
25 Kim, B. S.; Chiba, T.; Inoue, T. Polymer 1995, 36, 67.2
20

48 Siboni, S.; Della Volpe, C.; Maniglio, D.; Bru id Interf Sci 2004, 271(2), 454.9 Ma, K.; Chung, T. S.; Good, R. J. J Polym Sci Pol Phys 1998, 36, 2327.
py, 1994, 60-61, 13-15. June. SCANDEM-94: Kuopio, Finland,
60
63
g approach to modify spin
C. Polymer 2001, 42,
3,
gnara, M. J Collo450 Leikas-Lazányi, P.; Lounatmaa, K. Comparison of drying methods for scanning electron microscopy of
biological specimens. In: Tammi R, Sorvari R, editors. Extended Abstracts of the 46th Annual Meeting of theScandinavian Society for Electron Microsco1994.
51 Nation, J. L. Stain Technology 1983, 58, 347.52 Dong, C.-M.; Qiu, K.-Y.; Gu, Z.-W.; Feng, X.-D. Polymer 2001, 42, 6891.53 Korhonen, H.; Helminen, A.; Seppälä, J. V. Polymer 2001, 42, 7541.
omolecules 1999, 32, 6386.54 Tasaka, F.; Miyazaki, H.; Ohya, Y.; Ouchi, T. Macr55 Li, Y.; Kissel, T. Polymer 1998, 39, 4421.56 Arvanitoyannis, I.; Nakayama, A.; Kawasaki, N.; Yamamoto, N. Polymer 1995, 36, 2947.
lä, J. V. J Appl Polym Sci 1996, 59, 1281.57 Hiljanen-Vainio, M.; Karjalainen, T.; Seppä58 Minaki, N.; Kanki, K.; Masuda, T. Polymer 2003, 44, 2303.59 Helminen, A.; Korhonen, H.; Seppälä, J. V. J Appl Pol Sci 2002, 86, 3616.
Kim, B. S.; Chiba, T.; Inoue, T. Polymer 1995, 36, 67.61 Ishii, Y.; Ryan, A. J.; Clarke, N. Polymer 2003, 44, 3641.62 Chen, J.-L.; Chang, F.-C. Polymer 2001, 42, 2193.
Turunen, M. P. K.; Laurila, T.; Kivilahti, J. K. Reactive blending approach to modify spin coated epoxy film:olym Sci 2004.Part II. Crosslinking kinetics, Submitted to J Appl P
64 Turunen, M. P. K.; Laurila, T.; Solehmainen, K.; Kivilahti, J. K. Reactive blendincoated epoxy film: Part III. Determination of Tg by spectrophotometry, Submitted to J Appl Polym Sci 2004.
65 Menard, K. P. Dynamic Mechanical Analysis: A Practical Introduction; CRC Press: Boca Raton, 1999.66 Nabeth, B.; Gerard, J. F.; Pascault, J. P. J Appl Polym Sci 1996, 60, 2113.
; Tonelli,67 Toselli, M.; Messori, M.; Bongiovanni, R.; Malucelli, G.; Priola, A.; Pilati, F.1771.
1.68 Mayers, D. Surfaces, interfaces, and colloids; VCH Publishers: New York, 19969 Klee, D.; Höcker, H. Adv Polym Sci 2000, 149, 1. 70 Griffith, L. G. Acta Mater 2000, 48, 263.71 Pierschbacher, M. D.; Ruoslahti, E. Nature 1984, 309, 30.72 Lin, H. B.; Garcia-Echeverria, C.; Asakura, S.; Sun, W.; Mosher, D. F.; Cooper, S. L. Biomaterials 1992, 1
905.73 Buttiglieri, S.; Pasqui, D.; Migliori, M.; Johnstone, H.; Affrossman, S.; Sereni, L.; Wratten, M. L.; Barbucci, R.;
.Tetta, C.; Camussi, G. Biomaterials 2003, 24, 2731
21

Part II
sslinking kinetics
.K. Turunen*, Tomi Laurila, and Jorma K. Kivilahti
ox 30005 HUT
* Corresponding authorTel: +358 9 451 4989Fax: +358 9 451 5776
E-mail: [email protected]
Cro
Markus P
Laboratory of Electronics Production TechnologyDepartment of Electrical and Communications Engineering
Helsinki University of TechnologyP.O. B
FIN-0201Finland
22

1. INTRODUCTION
Epoxy resin-derived materials are extensively used in electronics manufacturing. An unfortunate characteristic of epoxy resins, however, is the rigidity of the crosslinked network, whichlimits their applicability. As a means to overcome this problem, the modification of the mechanicaproperties of epoxies has been extensively investigated.1-3 Typically, reactive rubbers or thermoplastics are incorporated into the epoxy matrix. Depending on the degree of chemicalinteraction between the resin and the modifier polymer, reaction-induced phase separation mayoccur and alter the network structure significantly, with effect on the thermomechanical pro14 The modified material can be studied by means such as dynamic mechanical analysis, differentialscanning calorimetry, and scanning electron microscopy.1,3,4 However, tnetwork during crosslinking, the kinetics of the reaction need to be studied as well.
Both isothermal and nonisothermal methods have been used for the analysis of reaction kinetics. As well, relatively simple models havreactions are complex. For example, a number of chemiccrosslinking of a thermosetting resin, as the mahighly crosslinked solid. These changes undergone in multi-stepcalculation of activation energy a complex problem. Indeed, activation energies and prefactors can be determined only for simple systems. In addition to the probable changmechanism during the crosslinking, the rate of solid-state reactions is affected by factors smass transport of the reactants and the vitrification of reacting species.15-20
The complexity of a reaction can be taken into account by using two-step mhowever, the model-fitting approaches are not very effective in describing the crosslinking of epoxies.22 Vyazovkin,23 starting from the isoconversional methods introduced by Friedmann,24
Ozawa,21 and Flynn and Wall,25 has proposed an alternative approach that allows the apparent activation energy to be determined as a function of the extent of conversion and/or temperaturewithout assuming a particular form of the reaction model. Assuming a simple superposition of theindividual reactions of a multi-step mechanism, one obtains the conversion-dependent apparentactivation energies. It is also assumed that all reactants have been converted into a product with fullconversion ( = 1) at the end of the reaction. In addition, the process must not involvesimultaneously exothermic and endothermic reactions or competing reactions, and it should not be partially diffusion controlled. With these boundary conditions taken into account, the advantages of the model-free analysis, i.e. simplicity and the avoidance of the erroneous choice of a kinetic model,can be put to work. Despite the evident advantages of the model-free analysis, there is an ongoing debate about the theoretical justification.26-31 Nevertheless, it is gaining acceptance as the thermalanalysis community actively debates the best way to determine the reaction kinetics of complex systems.16,17,26-31
In the present study, we examine the reaction kinetics of a dual-catalyzed mixture of an epoxy and our previously synthesized4 oligomer, utilizing the model-free kinetic approach. The focus is on the bulk material because of the limitations of the conventional DSC method.32 In the Part III5 of this series we will introduce a novel method to determine the glass transition temperature of a spin coated polymer film which will overcome these limitations.
l
perties.6-
o understand the evolving
e been employed to simulate reactions. Often theal and physical changes occur during the
terial is transformed from a viscous liquid to a reactions make the accurate
-exponentiales in reaction
uch as
odels.21 In general,
23

2. MATERIALS AND METHODS
2.1 M
2.2 C
oups can be assumed.
2.3 M
aterials
The -caprolactone-based and carboxylic acid end-functionalized oligomer (PCL2-SA) that was synthesized in Part I4 was mixed with epoxy resin (SU8; Shell) in a grinding mortar. The ratio of oligomer to epoxy was 20:80 by weight. Imidazole (0.06 wt.-% of the solid content; Fluka) or triarylsulfonium hexafluoroantimonate (TH) (2.5 wt.-% of the epoxy content; Aldrich) or both together were added as catalyst. The TH was provided as a salt in polypropylene carbonate in ratio50:50 by weight. Imidazole catalyzes the reaction between carboxylic acid and epoxy groups, and the TH salt acts as an acid-catalyst precursor that decomposes to cations upon ultraviolet light exposure, and catalyzes the ring-opening polymerization of residual epoxies.
haracterization methods
Differential scanning calorimetry (DSC) measurements were carried out on a Mettler Toledo Star DSC821 in the temperature range of 80–240°C used for the kinetic analysis, at heating rates of 2, 5, 10, and 20°C/min. The degree of crosslinking evaluated from the results of the kinetic study was compared to the results obtained by thermal analysis for the samples crosslinked according to a predefined baking program. The residual reactivity and the glass transition temperature (Tg) weredetermined from the first heating scan that was recorded in the temperature range of -50–240°C at a heating rate of 10 C/min, during which complete conversion of the epoxy gr
odel-free kinetic analysis
Differential scanning calorimetry (DSC) was used to obtain information about the reaction rate. With very few exceptions the rate of a reaction increases with temperature. The relationbetween the rate constant, k, and temperature, T, was first proposed by Arrhenius:
k = Ae -E/RT. (1)
The constant A is called the pre-exponential factor, E is the activation energy and R is the gas constant. Kinetic analysis of an epoxy crosslinking reaction, i.e. a cure, is usually based on themeasurement of heat flow by DSC, which is proportional to both overall heat release and cure rate according to Eq. 2: 33
)()( fTkQdtdQ
dtdQ
curecure , (2)
where dQ/dt is the heat flow, t is the time, Qcure is the total heat released when an uncured sample is brought to complete cure, d /dt is the cure rate, is the extent of a monomer conversion to a crosslinked network, k(T) is the Arrhenius rate constant, and f( ) is the reaction model. The extentof cure, , is determined by integrating the heat flow curve. The temperature dependence of the rate constant is introduced by replacing k(T) with the Arrhenius equation, which gives
)()(fAe
dtd RT
E
. (3)
24
The pre-exponential factor, itionally determined fromothermal experiments converting Eq. 3 to its logarithmic form, Eq. 4, to solve for A and E:
A, and the activation energy, E, are tradis
RTAk
303.2logg 1010 . (4)
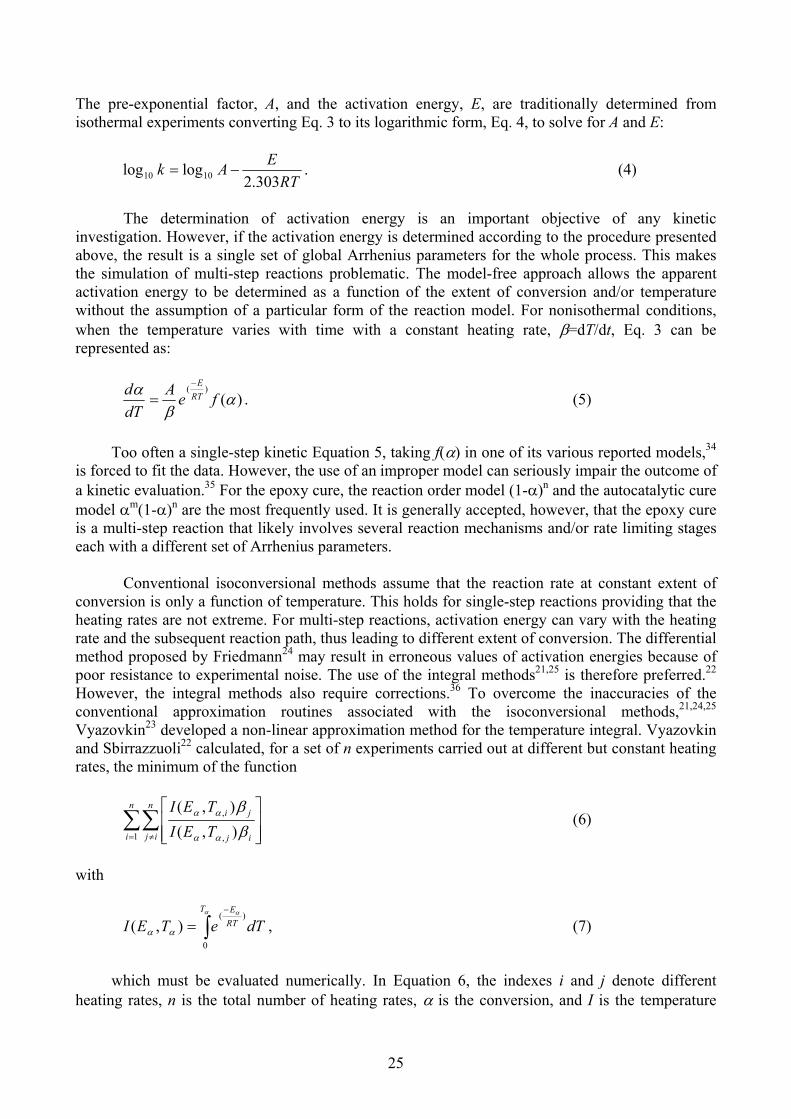
The determination of activation energy is an important objective of any kineticinvestigation. However, if the activation energy is determined according to the procedure presentedabove, the result is a single set of global Arrhenius parameters for the whole process. This makes the simulation of multi-step reactions problematic. The model-free approach allows the apparentactivation energy to be determined as a function of the extent of conversion and/or temperaturewithout the assumption of a particular form of the reaction model. For non
E
isothermal conditions,hen the temperature varies with time with a constant heating rate, =dT/dt, Eq. 3 can be
lo
wrepresented as:
)()(feA
dTd RT
E
. (5)
Too often a single-step kinetic Equation 5, taking f( ) in one of its various reported models,34
is forced to fit the data. However, the use of an improper model can seriously impair the outcome of a kinetic evaluation.35 For the epoxy cure, the reaction order model (1- )n and the autocatalytic cure
m nodel (1- ) are the most frequently used. It is generally accepted, however, that the epoxy cure involves several reaction mechanisms and/or rate limiting stages
each with a different set of Arrhenius parameters.
roviding that the heating rates are not extreme. For multi-step reactions, activation energy can vary with the heatingrate an differentialmethod proposed by Friedmann may result in erroneous values of activation energies because of
d a non-linear approximation method for the temperature integral. Vyazovkin nd Sbirrazzuoli calculated, for a set of n experiments carried out at different but constant heating
inimum of the function
mis a multi-step reaction that likely
Conventional isoconversional methods assume that the reaction rate at constant extent ofconversion is only a function of temperature. This holds for single-step reactions p
d the subsequent reaction path, thus leading to different extent of conversion. The24
poor resistance to experimental noise. The use of the integral methods21,25 is therefore preferred.22
However, the integral methods also require corrections.36 To overcome the inaccuracies of the conventional approximation routines associated with the isoconversional methods,21,24,25
Vyazovkin23 develope22a
rates, the m
n njiTEI , ),(
i ij ijTEI1 , ),( (6)
with
T E)(
RT dTeTEI0
),( , (7)
which must be evaluated numerically. In Equation 6, the indexes i and j denote different n is the total number of heating rates, is the conversion, and I is the temperatureheating rates,
25
integral. According to this empirical method, the activation energy can be evaluated at any given value of for multi-step kinetics. Although the exact physical foundation of the above approach istill under debate, its application has produced viable results.
3. RESULTS AND DISCUSSION
reaction was 127.1 J/g. The acid-catalyzed reaction started at about 125 C and theaction enthalpy was 176.5 J/g. The dual-catalyzed reaction started at about 80 C. It can be
ed that one of the catalysts has synergistic eus at the present momen rosslinking
tudies cannot be considered as simply additive. Moreover, the reaction enthalpies for the separate act
ng. The kinetic study was perform
control, the middle part (II) to the transport of matter, and the igh conversion tail (III) that shoots up to the structural control. In regime I, the activation energy eclines steeply (in particula ed since theonversion is temperature de ersion thusorresponds to increasing temperature and more thermal activation is brought to enhance the motion
reactive species. In regime II, there is enough thermal activation for the reaction and the massort controls the reaction. In regime III, no thermal activation is sufficient for the reaction to
roceed in the network because the reactive species are structurally bound.
ed ring-opening polymeriz
s
The crosslinking reaction under investigation involves two successive reactions: (1)imidazole-catalyzed reaction between PCL2-SA and the epoxy and (2) acid-catalyzed ring-openingetherification of the residual epoxy groups. The two reactions were examined separately beforeanalysis of the dual-catalyzed mixture.
According to the DSC analysis, the imidazole-catalyzed reaction started near 100 C and theenthalpy of thereassum ffect on the other but their exact role is not clearto t. In other words, the information obtained from the separate csre ions cannot be determined from an analysis of the dual-catalyzed mixture because partialoverlapping of the reactions exists with fast thermal scans. We note, too, that the total heat releasedin the reaction sequence is less than what one might expect from the data of the individual reactions. Thus, the activation energy value(s) provided by the model-free kinetic analysis were considered to be apparent rather than absolute. The kinetic information obtained from the model-free analysis is used as an approximation for the overall reaction sequence, which can be used, with caution, in determining the process conditions needed to obtain a “fully” cured coati
ed with only one oligomer, PCL2-SA, and one PCL2-SA/epoxy blend (20:80 ratio by weight), which means that the information obtained must again be applied with caution in interpreting the kinetics of blends with the other oligomers (PCL0-SA and PCL5-SA) synthesized in Part I and the kinetics of blends with different ratios of reactants.
The results of the model-free analyses are shown in Figure 1 for the acid-catalyzedcrosslinking of the epoxy, in Figure 2 for the imidazole-catalyzed crosslinking of the PCL2-SA withepoxy, and in Figure 3 for the dual-catalyzed crosslinking of the mixture. In the separate reactions,the apparent activation energy for the crosslinking falls into three regimes as the reaction evolves.These regimes are assumed to represent a change in the physical limiting factor of the reaction,while the actual reaction mechanism remains the same. It is proposed that the regime of lowconversion (I) is due to the reactionhd r in the imidazole-catalyzed reaction), as would be expectc pendent. The apparent activation energy at increasing convcof theranspt
p
3.1 Acid-catalyz ation of the epoxy
Results of the kinetic analysis of acid-catalyzed crosslinking of epoxy are shown in Figure 1.In the conversion range of about 0-5%, the crosslinking process is expected to be reactioncontrolled; in the region of 5-90% the mass transport becomes limiting. As the reaction proceeds
26
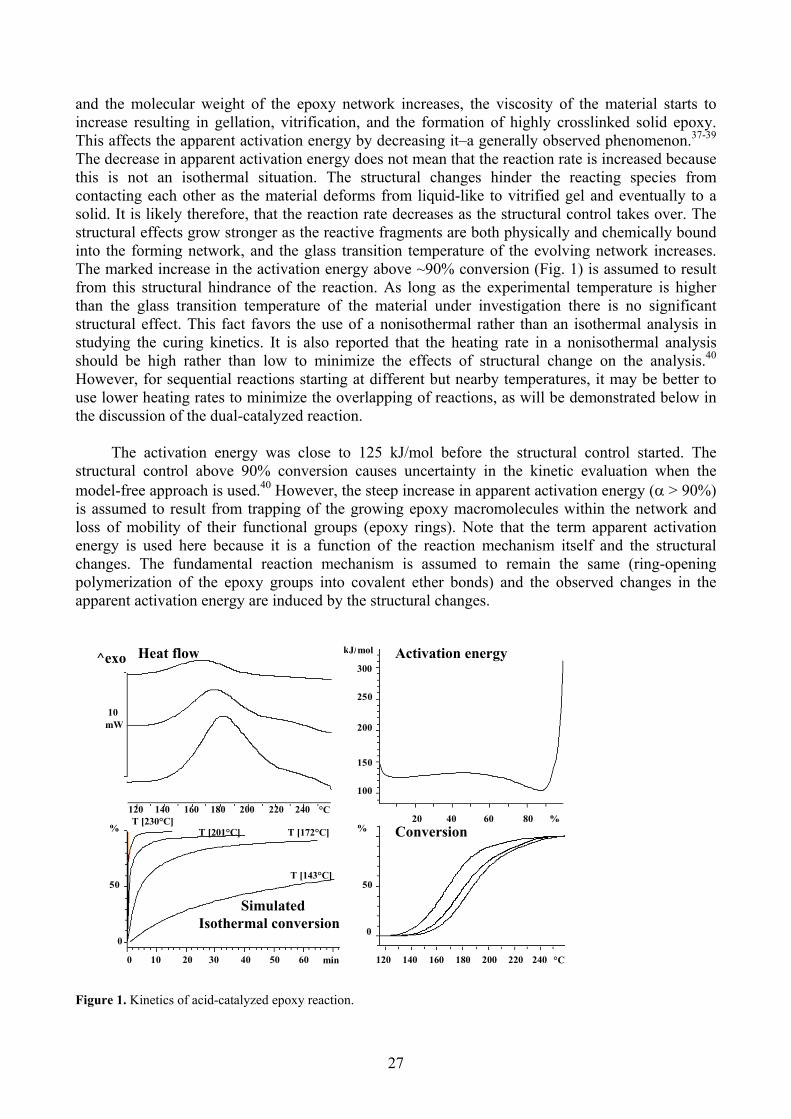
and the molecular weight of the epoxy network increases, the viscosity of the material starts toincrease resulting in gellation, vitrification, and the formation of highly crosslinked solid epoxy.This affects the apparent activation energy by decreasing it–a 37-39generally observed phenomenon.The decrease in apparent activation energy does not mean that the reaction rate is increased because this is not an isothermal situation. The structural changes hinder the reacting species fromcontacting each other as the m gel and eventually to asolid. It is likely therefore, that the reaction rate struc
than the glass transition temperature of the material under investigation there is no significant struc
aterial deforms from liquid-like to vitrifieddecreases as the structural control takes over. The
tural effects grow stronger as the reactive fragments are both physically and chemically bound into the forming network, and the glass transition temperature of the evolving network increases.The marked increase in the activation energy above ~90% conversion (Fig. 1) is assumed to result from this structural hindrance of the reaction. As long as the experimental temperature is higher
tural effect. This fact favors the use of a nonisothermal rather than an isothermal analysis in studying the curing kinetics. It is also reported that the heating rate in a nonisothermal analysis should be high rather than low to minimize the effects of structural change on the analysis.40
However, for sequential reactions starting at different but nearby temperatures, it may be better to use lower heating rates to minimize the overlapping of reactions, as will be demonstrated below in the discussion of the dual-catalyzed reaction.
The activation energy was close to 125 kJ/mol before the structural control started. The structural control above 90% conversion causes uncertainty in the kinetic evaluation when the model-free approach is used.40 However, the steep increase in apparent activation energy ( > 90%) is assumed to result from trapping of the growing epoxy macromolecules within the network and loss of mobility of their functional groups (epoxy rings). Note that the term apparent activation energy is used here because it is a function of the reaction mechanism itself and the structuralchanges. The fundamental reaction mechanism is assumed to remain the same (ring-opening polymerization of the epoxy groups into covalent ether bonds) and the observed changes in the apparent activation energy are induced by the structural changes.
Conversion
Heat flow Activation energy
T [230°C]
T [143°C]
120 140 160 180 200 220 240 °C20 40 60 80 %
Figure 1. Kinetics of acid-catalyzed epoxy reaction.
Isothermal conversion
kJ/mol
300
250
200
150
100
50 50
10mW
% %T [201°C] T [172°C]
xo
Simulated
120 140 160 180 200 220 240 °C0 10 20 30 40 50 60 min
00
^e
27
Dunne et al.41 proposed that the residuals of the photo-initiator they employed in their study decompose into acids that catalyze the reaction at temperatures above 180 C. This results in a second enthalpy release from the continuing reaction of the epoxy rings. For a sample that was not exposed to ultraviolet light, we also noticed a reaction at around 190 C, which is assumed to start because of thermal decomposition of the remains of triarylsulfonium hexafluoroantimonate catalystprecursor. This would explain the appearance of a shoulder on the heat flow curve during the epoxy cure (see Fig. 1).
3.2 Imidazole-catalyzed PCL2-SA reaction with epoxy
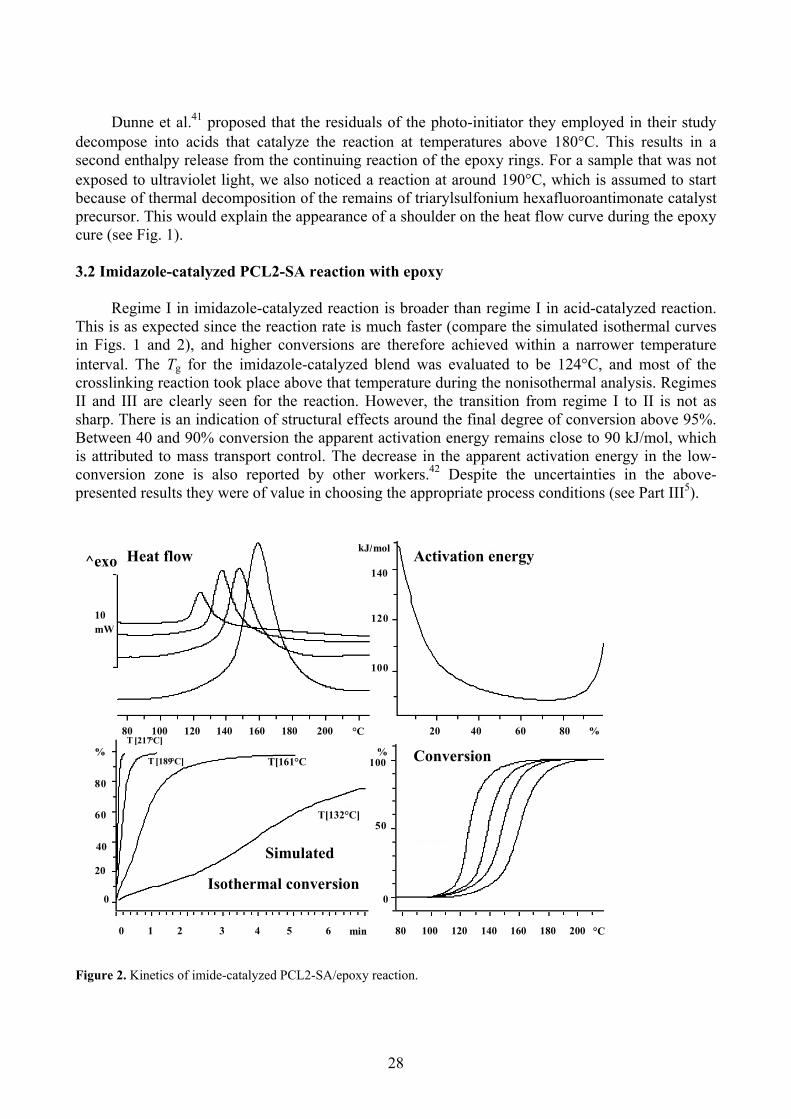
Regime I in imidazole-catalyzed reaction is broader than regime I in acid-catalyzed reaction. This is as expected since the reaction rate is much faster (compare the simulated isothermal curves in Figs. 1 and 2), and higher conversions are therefore achieved within a narrower temperatureinterval. The Tg for the imidazole-catalyzed blend was evaluated to be 124 C, and most of thecrosslinking reaction took place above that temperature during the nonisothermal analysis. Regimes II and III are clearly seen for the reaction. However, the transition from regime I to II is not as sharp. There is an indication of structural effects around the final degree of conversion above 95%.Between 40 and 90% conversion the apparent activation energy remains close to 90 kJ/mol, which is att
gure 2. Kinetics of imide-catalyzed PCL2-SA/epoxy reaction.
ributed to mass transport control. The decrease in the apparent activation energy in the low-conversion zone is also reported by other workers.42 Despite the uncertainties in the above-presented results they were of value in choosing the appropriate process conditions (see Part III5).
Activation energyHeat flow140
Conversion
Isothermal conversion
T [217°C]
T [189°C] T[161°C
T[132°C]
0 1 2 3 4 5 6 min 80 100 120 140 160 180 200 °C
20 40 60 80 %80 100 120 140 160 180 200 °C
10mW
120
100
80
kJ/mol^exo
%
40
20
0
100
60
%
0
50
Simulated
Fi
28
3.3 The dual-catalyzed reaction
is we mean that the PCL2-SA may not be entirely incorporated into the network through chemical bonding but rather physically entrapped. In fact, the apparent activation energy
gative, which indicates that increase in temp e reaction rate at the expense of the rate of the acid-catalyzed reaction. Weconcl
rheating rates (<2 /min) be used for enhanced separation of the successive reactions. The model-freeisoconversional approach helped us to control the complex reactions of the blend cure, but thereactions are too complex for a complete kinetic understanding by this approach.
igure 3. Kinetics of the dual-catalyzed PCL2SA10/epoxy reaction.
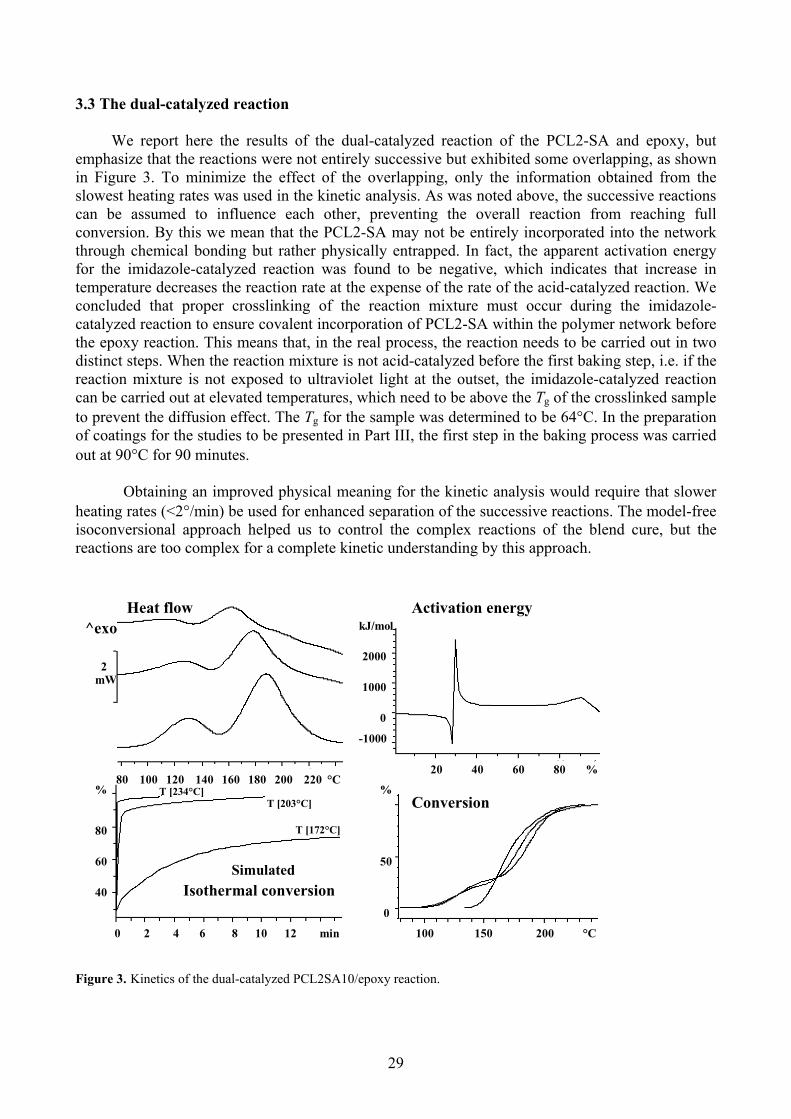
We report here the results of the dual-catalyzed reaction of the PCL2-SA and epoxy, but emphasize that the reactions were not entirely successive but exhibited some overlapping, as shown in Figure 3. To minimize the effect of the overlapping, only the information obtained from theslowest heating rates was used in the kinetic analysis. As was noted above, the successive reactionscan be assumed to influence each other, preventing the overall reaction from reaching fullconversion. By th
for the imidazole-catalyzed reaction was found to be neerature decreases thuded that proper crosslinking of the reaction mixture must occur during the imidazole-
catalyzed reaction to ensure covalent incorporation of PCL2-SA within the polymer network beforethe epoxy reaction. This means that, in the real process, the reaction needs to be carried out in two distinct steps. When the reaction mixture is not acid-catalyzed before the first baking step, i.e. if thereaction mixture is not exposed to ultraviolet light at the outset, the imidazole-catalyzed reaction can be carried out at elevated temperatures, which need to be above the Tg of the crosslinked sample to prevent the diffusion effect. The Tg for the sample was determined to be 64 C. In the preparation of coatings for the studies to be presented in Part III, the first step in the baking process was carried out at 90 C for 90 minutes.
Obtaining an improved physical meaning for the kinetic analysis would require that slowe
Conversion
Isothermal conversion
Heat flow Activation energy
0 2 4 6 8 10 12 min
80 100 120 140 160 180 200 220 °C20 40 60 80 %
100 150 200 °C
T [234°C]T [203°C]
T [172°C]
% %
kJ/mol
2mW
-1000
0
1000
2000
80
60
40
50
0
^exo
Simulated
F
29
3.4 Verification of crosslinking conditions
ause the cured film swelled in acetone. However, the simulatedothermal conversion curves show that at 90°C baking, 90% conversion is achieved at 80 minutes
for the
this way showedat the epoxy did indeed react to the full conversion, since no residual reactivity was detected. The
total heat of reaction for the epoxy crosslinking when no oligomer was incorporated was 176.5 J/g. With use of the dual-catalyst system without exposure of the blend to ultraviolet light, only the reaction enthalpy for the reaction between PCL2-SA and epoxy was detected. From this we inferred that the acid catalyst remained inactive until the exposure and effected only the reaction of epoxy groups.
Combination of the imidazole-catalyzed pre-crosslinking with the cationic ring-opening reaction of the residual epoxies in the dual-catalyzed two-step baking process resulted in the formation of solvent resistant coatings. The blends showed some residual reactivity, however. The reaction enthalpy was attributed to the continuing reaction of residual epoxies and the conversion of the overall reaction was determined to be 96% (6.5 J/g / 176.5 J/g) assuming that the first reactionhad reached full conversion. The simulated isothermal conversion curves were in agreement in suggesting that a one-step bake for 60 minutes at 180 C is not sufficient to provide the fullconversion. On the basis of the DSC analysis of the PCL2-SA/epoxy that showed only minorresidual reactivity after crosslinking in the two-step baking process, and on the basis of the kinetic analysis, it is inferred that full conversion could be achieved with the proposed prolonged baking of 90 minutes. We note that with incomplete reaction between the oligomer and epoxy during dual-catalyzed crosslinking there is a strong tendency for a reaction-induced phase separation. This is because the molecular weight of the network increases rapidly when the pre-bake is followed by UV light activation of the cationic ring-opening catalyst and the second polymerization of the
sidual epoxy groups at elevated temperature. Indeed, both the dynamic mechanical and the DSC nalyses carried out in Part I suggested a phase separation. However, where a second Tg was
strong chemical interaction between the
To determine whether the results of the kinetic analysis were in agreement with the thermalproperties of the crosslinked samples, a thermal analysis of the networks was carried out by DSC.Glass transition temperatures and the existence of residual reactivity were examined. The mostimportant thermal properties are presented in Table 1 along with the swelling results. Lack of residual reactivity and increased Tg did not ensure solvent resistance as was shown with some of the coatings. We note that a given reaction can reach its full conversion, i.e. the full degree of crosslinking, in the blends of different stoichiometric amounts of the reactants, but the density of the crosslinking may be insufficient so that the loosely incorporated chains do not prevent solvent penetration into the network.
In the absence of the catalysts, the reaction mixture did not show any reaction judging from the intactness of the Tg and the lack of any released heat of reaction. In the presence of imidazole,the PCL2-SA oligomer reacted with epoxy and reached full conversion in a single-step crosslinkingbake carried out at 180 C for 60 min. This was also demonstrated by the model-free kineticanalysis, as shown in the simulated isothermal conversion curves (Fig. 2). The pre-bake condition (90 C for 30 min), in contrast, resulted in two residual reaction enthalpies. Either way, in thepresence of only the imidazole catalyst the PCL2-SA/epoxy mixture did not provide adequatedensity of networking becis
imidazole-catalyzed reaction.
According to the simulation (see Fig. 1), the acid-catalyzed epoxy reaches almost full conversion during a 60-minute bake at 180 C. DSC analysis of a sample baked inth
readetected, it was weak and broad, which indicated a fairlyhases and thus negligible phase separation.p
30

Table 1. DSC and swelling results for the crosslinked PCL2-SA/epoxy coatings.
Polymer systemA,B
Imidazole Photo-
initiator
Tg1
(°C)
Tg2
(°C)
Residual reaction (°C)
during thermal scan
Swelling in
acetoneE
Epoxy resin No No 38 - No Yes
Epoxy/PCL2-SA10 No No 39 - No Yes
Epoxy/PCL2-SA10 Yes No 124 - No Yes
Epoxy/PCL2-SA10 Yes Yes 162 (59) Slightly (180-220) No
Epoxy/PCL0-SA10 Yes Yes 131 (66) No No
Epoxy/PCL5-SA10 Yes Yes 57 - No No
EpoxyC No Yes 131 - Significantly (140-220) No
EpoxyD No Yes 180 - No NoA The number after PCL refers to the number of theoretical CL units per branch of the polymer, SA refers to thesuccinic acid functional end-group and 10 refers to the weight percent of modified polymer in the epoxy.B Crosslinking was carried out at 180 °C for 60 minutes.1,2 Refer to the glass transition temperatures of the crosslinked mixture that were detected during the heating scan (-50 –220 °C).C Crosslinked at 90 °C for 30 minutes.D Crossl ked at 180 °C for 60 minutes.E The cr
igomer was analyzed by a model-free kinetic method. The results obtained from separateinvestigations of the two reactions helped in determining the proper conditions for crosslinking.Unde
inosslinked coatings were immersed in acetone for 30 minutes and scratched with a wooden spatula. If the coating
was removed or deformed by the spatula “Yes” was entered to indicate poor chemical resistance.
4. CONCLUSIONS
The reaction kinetics of the dual-catalyzed reactive blending of brittle epoxy with flexible four-armed ol
rstanding of the crosslinking process enabled minimization of the reaction-induced phase separation while maximizing the amount of incorporated oligomer. The reaction was complex, however, and the reaction mechanism as well as the physical controlling factor changed during thedual-catalyzed reaction. The apparent activation energy of the reaction was observed to fall into three regimes as a function of conversion. It is proposed that regime I represents reaction control, the middle part (the regime II) the mass transport, and the high conversion tail (the regime III) thestructural control. The results of thermal analysis of the crosslinked samples were in agreement with the results of the kinetic analysis and on the basis of the results the overall crosslinking process could be optimized to realize good-quality films.
31

References
1 Hertzberg, R. W. Def fracture mechanics of eng ing
dhesion and adhesive nd l apm 87.. C.; Grubb, D.T mer mic py; C an an all: London, 19M. P. K.; Laur ; Kivilaht K. Re e ble ng approach to fy spin coated epo :
nd char zation of haped ( -caprolactone), Submit J Appl Polym Sc.; Laur ; Kivilaht K. Re e ble ng approach to fy spin coated epo :ation o transiti pera f po er films by sp hotometer, Submit J
004.lt, J. P. u, H. l Pol i 1 , 292001, ., F.-C. olecul , 32 .
ridge ymer , 24, 63gkin, J mon, G. ymer , 42, 47.
, S. J.; Lin, T. K.; Shy . J Appl Sci 75, 2nchaipetch, P.; Ambro ; Giamb .; B W arf mer 2 3,
aghava, R. S.: J Polym Sci Polym Phy , 25,
omen, R.; Sempere, J.; Burnham, A.; Opfermann, J.; Strey, R.;
lek, J.; Mitsuhashi, T. Thermochimica Acta 2000, 355, 125.9, 35, 1267.
Sci 1973, 13(1), 59.
22 Vyazovkin, S.; Sbirrazzuoli, N. Macromol Chem Phys 1999, 200(10), 2294.23 Vyazovkin, S. J Comput Chem 1997, 18, 393.24 Friedmann, H. J Polym Sci 1963, C6, 183.25 Flynn, J. H., Wall, L. A. J Res Nat Bur26 lynn, J. H. J Thermal Anal 1998, 34,
3, 87, 433.40 Opfermann, J. R.; Kaiserberger, E.; Flammersheim, H. J. Thermochim Acta 2002, 391, 119.41 Dunne, R. C.; Sitaraman, S. K.; Luo, S.; Rao, Y.; Wong, C. P.; Estes, W. E.; Gonzalez, C. G.; Coburn, J. C. J
Appl Polym Sci 2000, 78, 430.42 Nabeth, B.; Gerard, J. F.; Pascault, J. P. J Appl Polym Sci 1996, 60, 2113.
ormation and ineer
ogy; Ch
materials; John Wiley & Sons:
an and Hall: New York, 19
New York,1989.
2 Kinloch, A. J. A s: science a techno3 Sawyer, L4 Turunen,
. Polyila, T.
roscoi, J.
hapmactiv
d Hndi
96.modi xy film
Part I: Synthesis a5 Turunen, M. P. K
acteriila, T.
star-si, J.
polyactiv
ted tomodi
i 2004.xy filmndi
Part III: DeterminAppl Polym Sci 2
f glass on tem ture o lym ectrop ted to
6 Bartlet, P.; Pascau7 Ratna, D. Polymer
; Sauterea42, 4209
J App ym Sc 985, 30 55.
9 Chen, J.-L.; Chang Macrom es 1999 , 534810 Bucknall, C. B.; Part11 Varley, R. J.; Hod
, I. K. Pol. H.; Si
1983 P. Pol
9.2001 38
12 Wu13 Pu
u, S. Sgi, V.
Polymerini, M
2000,rostow,
6..; C agna, C.; D'Souza, N. A. Poly 002, 4
839.14 R s 1987 1017.15 Castellan, G. W. Physical chemistry; Addison-Wesley: London, 1971.16 Galwey, A. K. Thermochimica Acta 2004, 413, 139.17 Brown, M. E.; Maciejewski, M.; Vyazovkin, S.; N
Anderson, H. L.; Kemmler, A.; Keuleers, R.; Janssens, J.; Desseyn, H. O.; Li, C.-R.; Tang, T. B.; Roduit, B.; Ma
18 Ninan, K. N. J Thermal Anal 19819 Kamal, M. R.; Sourour, S. Polym Eng 20 Yousefi, A.; Lafleur, P. G.; Gauvin, R. Polym Composite 1997, 18(2), 157.21 Ozawa, T. Bull Chem Soc Jap 1965, 38, 1881.
Standards 1996, 70A, 487.367.F
27 Brown, M. E. J Thermal Anal, 1997, 49,17.28 Maciejewski, M.; Reller, A. Thermochim Acta 1987, 110, 145.29 Sewry, J. D.; Brown, M. E. Thermochim Acta 2002, 390, 217.30 Opfermann, J. R.; Flammersheim, H.-J. Thermochim Acta 2003, 397, 1.31 Vyazovkin, S. Thermochim Acta 2003, 397, 269.32 Efremov, M. Y.; Olson, E. A.; Zhang, M.; Allen L. H. Thermochim Acta 2003, 403, 37.33 Sbirrazzuoli, N.; Vyazovkin, S. Thermochim Acta 2002, 388, 289. 34 Zhou, D.; Schmitt, E. A.; Zhang, G. G. Z.; Law, D.; Wight, C. A.; Vyazovkin, S.; Grant, D. J. W. J Pharm Sci
2003, 92, 1367.35 Vyazovkin, S.; Wight, C. A. Thermochim acta 1999, 340-341, 53. 36 Flynn, J. H. J Therm Anal 1983, 27, 95.37 Punchaipecth, P.; Ambrogi, V.; Giamberini, M.; Brostow, W.; Carfagna, C.; Souza, N. A. Polymer 2001, 42,
2067.38 Sbirrazuoli, N.; Vyazovkin, S.; Mitilelu, A.; Sladic, C.; Vincent, L. Macromol Chem Phys 2003, 204, 1815.39 He, G.; Riedl, B.; Ait-Kadi, A. J Appl Polym Sci 200
32

Tg by spectrophotometry
nen2, Tomi Laurila,1 and Jorma K. Kivilahti1
artment of Electrical and Communications EngineeringHelsinki University of Technology
P.O. Box 3000
2 VTT Information TechnologyMicroelectronics
P.O. Box 1208FIN-02044 VTT
Finland
* Corresponding authorTel: +358 9 451 4989Fax: +358 9 451 5776
E-mail: [email protected]
Part III
Determination of
Markus P.K. Turunen*,1, Kimmo Solehmai
1 Laboratory of Electronics Production TechnologyDep
FIN-02015 HUT Finland
33
1. INTRODUCTION
The polymeric films applied in electronics and optoelectronics frequently appear in the thickness range of a few micrometers and study of thick film coatings is thus of technologicainterest. One property that has been extensively studied with a variety of polymer films is the glasstransition temperature (Tg).1-4 A method to characterize simultaneously thickness, and selected thermal and optical properties of polymeric films in-situ by a non-destructive method would be ofgreat use.
When temperature increases and crosses tis enhanced particularly in amorphous domains, creating a significant increase in the free volume of the polymer.5 The increase in free volume underlies the many changes in properties that are associated with the glass transition (Tg). Calorimetry is the preferred measurement technique forglass transition studies sinUnfortunately, conventional differential scanning calorimetry (DSC) instruments are of only limiteduse for studies of thin films; samples are so thmeasurement is typically beyond the limits of comethods have been reported for measuring the Tg of thin films, increflectivity,8-10 interferometry,11 Brillouin light scattering,12 and positron annihilatknowledge the use of a spectrophotometer to determine the thermal properties has not been reported.
The surface structure of a polymer differs significantly from the bulk structurethat the thermal properties in the vicinity of an interface differ from those of the bulkof interfacial interactions determines the structure near the interface. The higher the orderingstructure the less mobile are the chains and, reportedly the Tg increases.11,14
interfacial interaction decreases upon moving away from the interface, theeventually reaches a value characteristic for the bulk of the material.10,12,15 Theinterfacial interactions is heavily affected by the polymer chemistry, and no general thickness can be given at which the thermal analysis results in the bulk Tg rather than the film Tg. Reports in the literature2,6-8,11,13,14,16 suggest that films thicker than 100 nm usually represent bulk properties. Itshould be added that the Tg value measured for a film is an average of the Tg values at the outmostsurface layer and in the bulk. Hence, it is mandatory to report the exact thickness of the analyzed film along with the thermal properties.
Our ultimate goal was to develop an epoxy-derived material with toughened mechanicalproperties and suitable refractive index for use in optical waveguides. In pursuit of this goal we utilized a commercial epoxy, which was in need of modification because of its intrinsic brittleness.We synthesized a four-armed oligomer and blended it reactively with the epoxy (Part I17). Thecrosslinking kinetics of the blend was then studied to understand the evolution of the network (PartII18). Our aim in this third part is to show that a spectrophotometer equipped with a temperatureoption can be used to determine the glass transition temperatures of polymer films in the thicknessrange of a few micrometers. With this method we should more easily be able to characterize filmsbecause the measurement is carried out non-destructively, the construction of the instrument issimple, and independent values for refractive index and film thickness are provided simultaneously.
l
he glass transition zone of a polymer, chain mobility
ce it yields values for the thermodynamic properties of a material.
in thanventional DSC instruments.1 A variety of other
t the required level of sensitivity for the
luding ellipsome 6,7try, X-rayion13. To our
, which means. The amount
of the As the effect of T increases andgmagnitude of the
34
2. EXPERIMENTAL
2.1 M
he epoxy solution (SU8) was composed of epoxy resin (Epikote-157; Shell) and -butyrolactone (Aldrich) solvent. The solvent was added in different amounts to adjust the viscosity of the
min at 90 °C, then for 90 minutes at 160 °C in a convective oven) was carefully chosen to ensure good film quality, i.e. minimized phase separation17,18 and film stress19. All coatings were prepar
2.4 Optical characterization
established; the details of the method can be found in.20 Briefly, reflectance spectra were collected from the sample from normal and 70 angles of incidence and the absolute reflectance spectrum was obtained by comparing the sample spectra with a previously measured reference spectrum. Weused a silicon wafer, which has well known optical characteristics, as the reference. In addition to the reference, the determination of optical constants demands material modeling software, which is
aterials
The PCLX-SA oligomers17 were mixed into the epoxy solution in 0:100, 10:90, 20:80, 30:70, and 40:60 ratios by weight of the solids, and imidazole (0.06 wt.-% of the solid content) andtriarylsulfonium hexafluoroantimonate salt (2.5 wt.-% of the epoxy content) were added ascatalysts. T
material, which enabled the control of film thickness in spin coating.
2.2 Preparation of spin coated films
The solution was spin coated on a polished silicon wafer substrate (4 inches in diameter) at a speed of 2500-3500 rpm for 30 s. Optimum film thickness (6 m) in respect of the measurementwas obtained by adjusting the spinning speed and tailoring the viscosity of the solution with the solvent. After the coating, the samples were pre-baked at 90 °C for 90 min to remove the solventand, simultaneously, the reaction between carboxylic acid and epoxy commenced. This pre-bake condition was selected on the basis of the findings in Parts I and II. The pre-cured coating was then exposed to ultraviolet light (365 nm, 17 mW cm-2) for 40 s. The two-step crosslinking bake process(first for 90
ed in a clean room to avoid surface contamination.
2.3 Scanning electron microscopy
Scanning electron microscopy (SEM) examinations were used in the study of filmmorphology. Cross-sectional investigation of fractured films was performed. In the samplepreparation, an initial crack was prepared on the silicon wafer side of the sample with a diamond pen, after which a sharp bending force was applied manually to break the sample. The specimenswere sputter-deposited with chromium with an EmiTech turbo sputter-coater K575-X. All thespecimens were examined under a Jeol field emission scanning electron microscope (JSM-6335F) operated at 5 kV.
A FilmTek 4000 fiber-optic based spectrophotometer from Scientific Computing International was used in the optical characterization. The reflectance spectra were collected in the 450–1650 nm wavelength ( ) range from normal and oblique (70°) angles of incidence. The FilmTek tool includes a heating chuck, which enables measurements at temperatures up to 200°C. Thetemperature range employed was 25–200°C and the heating rate was 1 C/min.
2.5 Determination of refractive index
The use of spectrophotometry to determine refractive indexes by the two-angle method is well
35

used to generate a simulated reflectanc of a predetermined layer structure (if ultiple films are present) and material models. The material models are dispersion formulas
cribing the variation in the refractive index of the material as a function of the avelength within the measured wavelength range.20 Here, the Cauchy model21,22 was used as the
dispe
imums at wavelengthsthat are obtained from Eq. 1,
e spectrum on the basis20m
capable of desw
rsion model for the polymeric films. A regression on the unknown model parameters was thenperformed to minimize the error function of the experimental and simulated reflectance spectra.
2.6 Determination of film thickness
The reflectance spectrum obtained for a given material exhibits max
m(max) nd )cos(2 (1)
where m = 1, 2, 3, …, n is the refractive index of the film, d is the thickness of the film, and is theangle between the normal of the film and the ray of light reflected from the film. Taking thewavelengths at two maxima, and subtracting one from the other using Eq. 1, yields Eq. 2 for thefilm thickness (d),
)cos()(2 '0
0
i
i
ni
d (2)
where i = the number of complete cycles from 0 to i, the two wavelength peaks that define the icycles. For two adjacent maximums i is 1. If n is known, the determination of thickness is straig
he thermal properties of the polymer film, the glass transition temperature (Tg) and the out-al expansion (CTE), were determined from the obtained thermal
dependence of the refractive index and film thickness, respectively. Beaucage et al.24 used ellips
of two linear parts, divided the curve
d performed a linear fit for each part. The residuals wereit. Temperatures were scanned and the sum of the residuals
as c
htforward.23 In the present study, however, a new material was characterized and for the simultaneous determination of d and n the above mentioned dispersion formulas had to beemployed.21,22 With the two-angle measurement, the film thickness and refractive index could bedetermined independently20.
2.7 Method to determinate thermal properties
Tof-plane coefficient of therm
ometry with a temperature option to obtain the refractive index and thickness as a function of temperature, and used the change in slope of the n-T and t-T curves to determine the Tg of apolystyrene film. In a similar way, we used the independently measured n-T and t-T curves to provide the Tg of the supported films. A Matlab code was composed to enable automaticcalculation of the point of change in the slope. At this point the fit, composedwas expected to give the minimum error of the experimental data. The programinto two parts at a given temperature anollected to determine the error of the fc
w alculated at each point of temperature. The point at which the change in slope appeared was taken as the glass transition temperature of the film. The point itself was the minimized sum of the residuals of the linear fit. The coefficient of out-of-plane thermal expansion (CTE) for the films,derived from the temperature dependence of the film thickness, was calculated both below andabove the Tg.
36
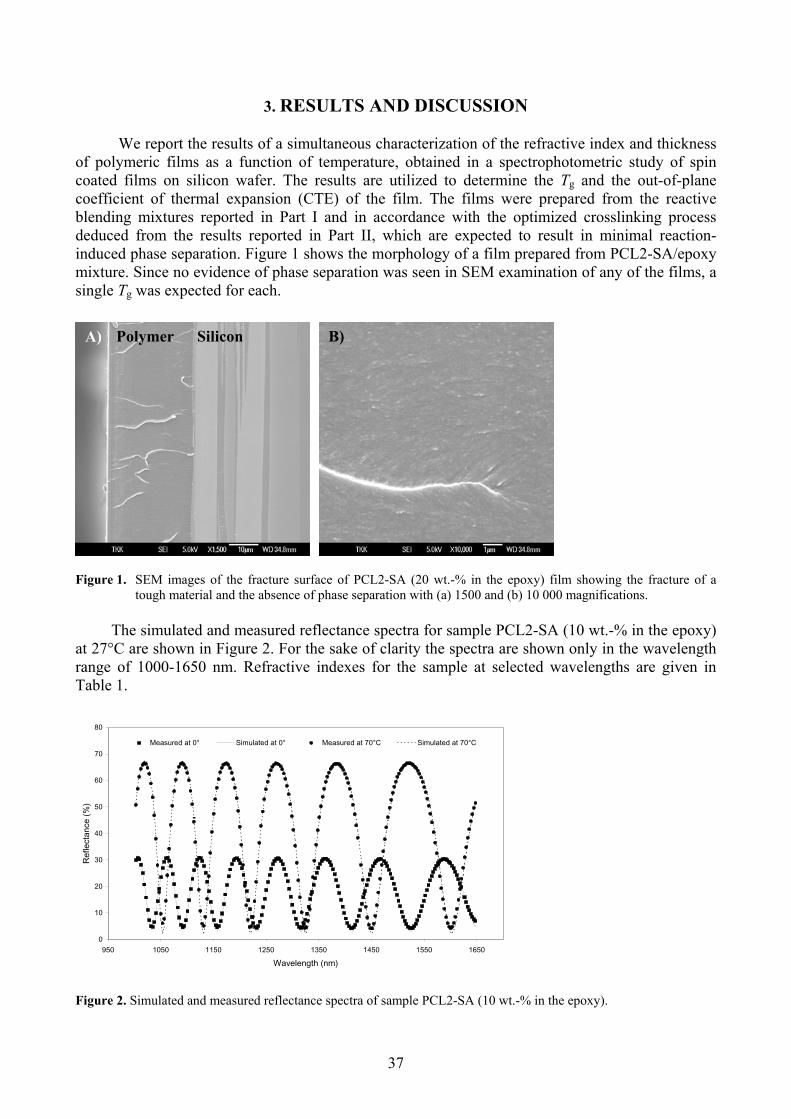
3. RESULTS AND DISCUSSION
We report the results of a simultaneous characterization of the refractive index and thickness of polymeric films as a function of temperature, obtained in a spectrophotometric study of spincoated films on silicon wafer. The results are utilized to determine the Tg and the out-of-planecoefficient of thermal expansion (CTE) of the film. The films were prepared from the reactivelending mixtures reported in Part I and in accordance with the optimized crosslinking process
Part II, which are expected to result in minimal reaction-induced phase separation. Figure 1 shows the morphology of a film prepared from PCL2-SA/epoxy mixtu
h.
le PCL2-SA (10 wt.-% in the epoxy) wn only in the wavelength
the sample at selected wavelengths are given in
Figure 2. Simulated and measured reflectance spectra of sample PCL2-SA (10 wt.-% in the epoxy).
bdeduced from the results reported in
re. Since no evidence of phase separation was seen in SEM examination of any of the films, a single Tg was expected for eac
A) B)Polymer
Figure 1. SEM images of the fracture surface of PCL2-SA (20 wt.-% in the epoxy) film showing the fracture of atough material and the absence of phase separation with (a) 1500 and (b) 10 000 magnifications.
The simulated and measured reflectance spectra for sampat 27°C are shown in Figure 2. For the sake of clarity the spectra are shorange of 1000-1650 nm. Refractive indexes for
able 1.
Silicon
T
0
10
20
30
40
50
60
70
80
950 1050 1150 1250 1350 1450 1550 1650
Wavelength (nm)
Ref
lect
ance
(%
)
Measured at 0° Simulated at 0° Measured at 70°C Simulated at 70°C
37
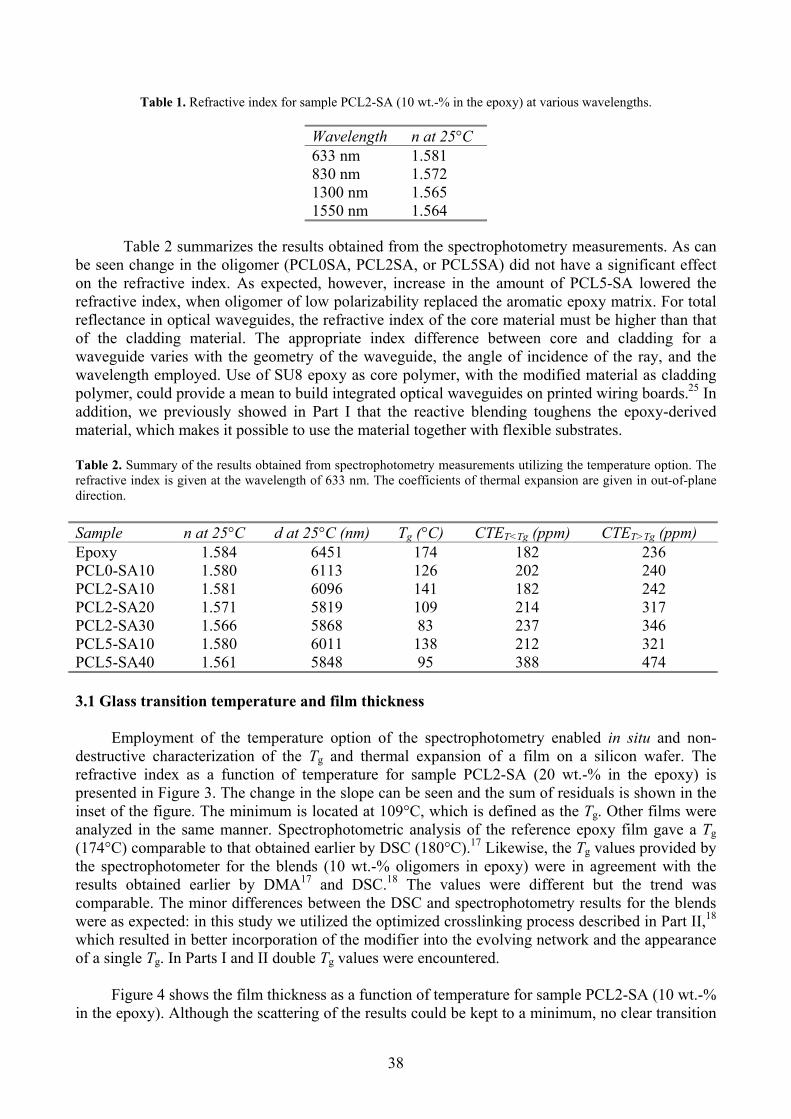
Table 1. Refractive ind various wavelengths.ex for sample PCL2-SA (10 wt.-% in the epoxy) at
Wavelength n at 25°C 633 nm 1.581830 nm 1.5721300 nm 1.5651550 nm 1.564
Table 2 summarizes the results obtained from the spectrophotometry measurements. As can be seen change in the oligomer (PCL0SA, PCL2SA, or PCL5SA) did not have a significant effecton the refractive index. As expected, however, increase in the amount of PCL5-SA lowered the
fractive index, when oligomer of low polarizabilirereflectance in optical waveguides,
ty replaced the aromatic epoxy matrix. For total the refractive index of the core material must be higher than that
o e The appropriate index difference between core and cladding for a waveguide varies with the geometry of the waveguide, the angle of incidence of the ray, and the wavelength employed. Use of SU8 epoxy as core polymer, with the modified material as cladding polymer, could provide a mean to build integrated optical waveguides on printed wiring boards.25 In addition, we previously showed in Part I that the reactive blending toughens the epoxy-derived material, which makes it possible to use the material together with flexible substrates.
Table 2. Summary of the results obtained from spectrophotometry measurements utilizing the temperature option. Therefractive index is given at the wavelength of 633 nm. The coefficients of thermal expansion are given in out-of-planedirection.
Sample n at 25°C d at 25°C (nm) Tg (°C) CTET<Tg (ppm) CTET>Tg (ppm)
f th cladding material.
Epoxy 1.584 6451 174 182 236PCL0-SA10 1.580 6113 126 202 240PCL2-SA10 1.581 6096 141 182 242
20 1.571 5819 109 214 317PP
CL2-SACL2-SA30 1.566 5868 83 237 346
PCL5-SA10 1.580 6011 138 212 321PCL5-SA40 1.561 5848 95 388 474
3.1 Glass transition temperature and film thickness
Employment of the temperature option of the spectrophotometry enabled in situ and non-destructive characterization of the Tg and thermal expansion of a film on a silicon wafer. Therefractive index as a function of temperature for sample PCL2-SA (20 wt.-% in the epoxy) is presented in Figure 3. The change in the slope can be seen and the sum of residuals is shown in the inset of the figure. The minimum is located at 109°C, which is defined as the Tg. Other films were analyzed in the same manner. Spectrophotometric analysis of the reference epoxy film gave a Tg(174°C) comparable to that obtained earlier by DSC (180°C).17 Likewise, the Tg values provided by the spectrophotometer for the blends (10 wt.-% oligomers in epoxy) were in agreement with theresults obtained earlier by DMA17 and DSC.18 The values were different but the trend wascomparable. The minor differences between the DSC and spectrophotometry results for the blendswere as expected: in this study we utilized the optimized crosslinking process described in Part II,18
which resulted in better incorporation of the modifier into the evolving network and the appearance of a single Tg. In Parts I and II double Tg values were encountered.
2-SA (10 wt.-%lear transition
Figure 4 shows the film thickness as a function of temperature for sample PCLin the epoxy). Although the scattering of the results could be kept to a minimum, no c
38
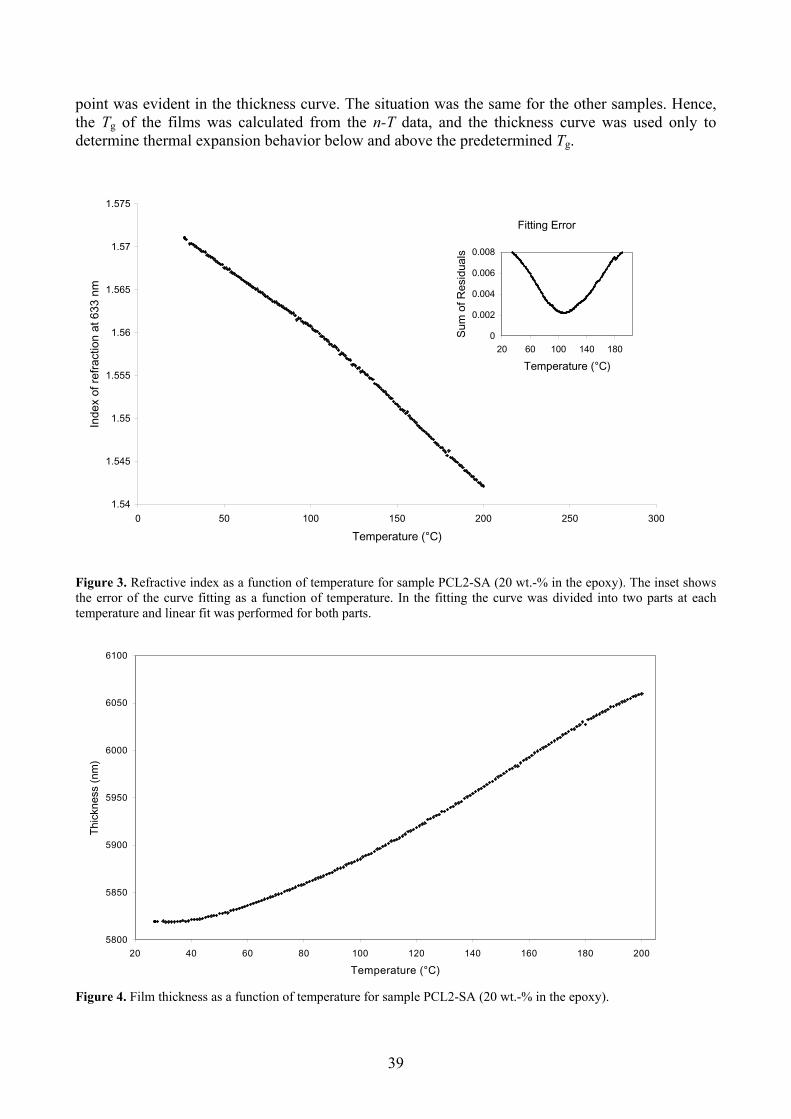
point was . Hence,the T the films was calculated from the n-T data, and the thickness curve was used only todetermine thermal expansion behavio ab determined Tg.
function of ture for sam CL2-SA (20 in the epoxy). T t showscurve a function erature. In ting the curv divided into two at eachlinear erformed fo arts.
Figur
evident in the thickness curve. The situation was the same for the other samplesg of
r below and ove the pre
Figure 3. Refractive index as a tempera ple P wt.-% he insethe error of thetemperature and
fitting asfit was p
of tempr both p
the fit e was parts
e 4. Film thickness as a function of temperature for sample PCL2-SA (20 wt.-% in the epoxy).
1.54
1.545
1.55
1.555
1.56
1.565
57
Inde
x of
ref
ract
ion
at 6
33 n
m
1.
1.575
0 50 100 150 200 250 300
pera
Fitting Error
0
0.002
0.004
0.006
0.008
20 60 100 140 180
Temperature (°C)
Sum
of R
esid
uals
Tem ture (°C)
6100
6050
5800
5850
5900
5950
6000
20 40 60 80 100 120 140 160 180 200
Temperature (°C)
Thi
ckne
ss (
nm)
39

3.2 Determination of thermal expansion
Calculations of the coefficient of thermal expansion (CTE) are based on the measuredchange in the thickness of the film. In the temperature range of 130-160°C, the CTET<Tg, i.e. below the Tg, was calculated to be 182 ppm/°C in the out-of-plane direction and 135 ppm/°C in the in-plane direction for reference material that was a crosslinked SU8 epoxy film. The calculation of thein-plane coefficient of thermal expansion (CTE1) is based on linear elastic theory and the assumption that the material is transversely isotropic.7 Then, with use of the determined out-of-plane coefficient of thermal expansion (CTE2), the CTE1 can be calculated from equation 3:
CTE1 = -0.5 (CTE2 - CTEv) (3)
where the value for the volumetric CTEv below Tg was obtained from the literature for the SU8.26
The linear elastic theory is assumed to be valid for highly crosslinked epoxy in the glassy state. The CTET>Tg value, i.e. above the Tg, was calculated only for the out-of-plane direction (236 ppm/°C)and the temperature range for the calculation of CTET>Tg was 180-188 C. The analyzed film cannotbe considered to be free of process-induced stresses. Stress is formed at the interface of silicon andepoxy during the high-temperature crosslinking bake (at 180 C). At elevated temperature, theinitially liquid-like epoxy converts to rigid and reacts with the silicon substrate, developing an adhesion to it. During the cooling down to room temperature, however, higher CTE of the epoxy than of silicon (13 C/ppm) causes in-plane stress, reportedly at a level of about 6 MPa.27 Although the material is expected to be isotropic when appearing as a free standing film or as a very thick coating on a substrate that exhibits comparable thermal behavior, in-plane stress is likely to causebehavior that is far from isotropic. The CTE values determined in this study do not, therefore,represent bulk values but the actual properties of a particular film with known thermal processing
istory.
ter they were subjected to a thermal cycling ( T = 75°C). Feng and Farris26 report a CTE value of 87ppm/°C based on a thermal-mechanical analyzer (TMA). They determined the Tg ( 220°C) from the tan- curve obtained from DMA26 and showed later19 that the Tg of SU8 is highly dependent on the crosslinking conditions, assuming any value between 50 and 238°C. It is clear that the achieved density of the network also affects the thermalexpansion behavior. It is mandatory, therefore, to report the exact crosslinking conditions when describing the thermal properties of thermosets.
The out-of-plane CTEs for the other materials are given in Table 2. No significant differences in the CTE values are observed between the epoxy and the modified polymers with low concentration of the modifier, but increase in the level of incorporated modifier increases the CTE values significantly. This is reasonable since the modifier has a four-armed structure with flexible -caprolactone-based side chains, which can be expected to assume low packing density and enhanced mobility in comparison with the rigid reference epoxy.
Closer examination of the thickness-temperature curves revealed that they were composed of four parts. The two large linear parts that appeared around the Tg were used in the CTE calculations.In addition to the linear parts, there were low and high-temperature tails. For a reason not entirelyclear to us, the high-temperature tail is systematically curved downward above 190 C. The low temperature tail is presumed to result from the relief of process-induced in-plane stress as the
h
The in-plane CTET<Tg determined here for the epoxy was higher than values presented in theliterature. Lorenz28 determined a CTE value of 52 ppm/°C by measuring the bow response of a 20-
m-thick coating layer on Al and Si substrates af
40
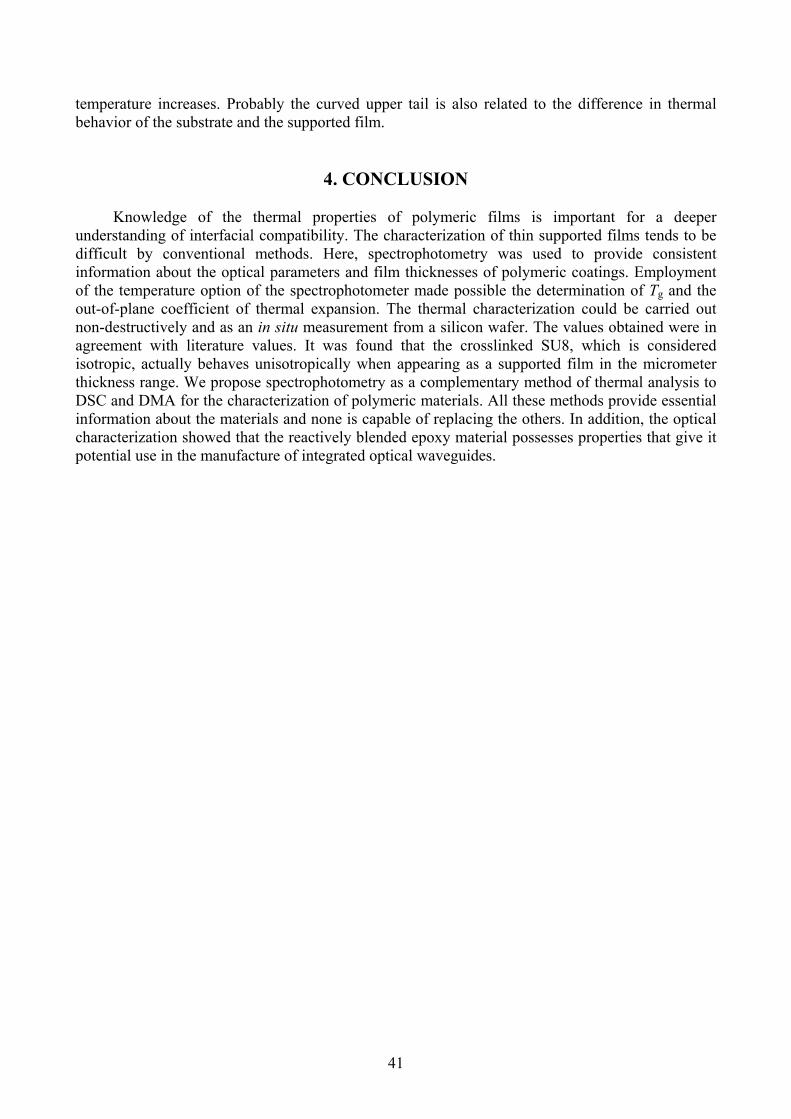
temperature increases. Probably the curved upper tail is also related to the difference in thermalbehavior of the substrate and the supported film.
4. CONCLUSION
Knowledge of the thermal properties of polymeric films is important for a deeper understanding of interfacial compatibility. The characterization of thin supported films tends to bedifficult by conventional methods. Here, spectrophotometry was used to provide consistent information about the optical parameters and film thicknesses of polymeric coatings. Employmentof the temperature option of the spectrophotometer made possible the determination of Tg and the out-of-plane coefficient of thermal expansion. The thermal characterization could be carried outnon-destructively and as an in situ measurement from a silicon wafer. The values obtained were inagreement with literature values. It was found that the crosslinked SU8, which is considered isotropic, actually behaves unisotropically when appearing as a supported film in the micrometerthickness range. We propose spectrophotometry as a complementary method of thermal analysis to DSC and DMA for the characterization of polymeric materials. All these methods provide essential information about the materials and none is capable of replacing the others. In addition, the optical characterization showed that the reactively blended epoxy material possesses properties that give it potential use in the manufacture of integrated optical waveguides.
41

References
E
0 van1 R2 Forrest, J. A.; Dalnoki-Veress, K.; Stevens, J. R.; Dutcher, J. R. Phys Rev Lett 1996, 77, 2002.
rinted wiring boards, 21-23 Oct. 2003; In 3rd International IEEE Conference on Polymers and Adhesives inMicroelectronics and Photonics: Montreux, Switzerland.
6
1 fremov, M. Y.; Olson, E.A.; Zhang, M.; Allen, L. H. Thermochimica Acta 2003, 403, 37.2 Zhou, H.; Kim, H. K.; Shi, F. G.; Zhao, B.; Yota, J. Microelectr J 2002, 33, 221.3 Dinelli, F.; Buenviaje, C.; Overney, R. M. Thin Solid Films 2001, 396, 138.4 Jiang, X.; Yang, C. Z.; Tanaka, K.; Takahara, A.; Kajiyama, T. Phys Lett A 2001, 281, 363.5 Bower, D. I. An introduction to polymer physics; Cambridge University Press: Cambridge, 2002.6 Barradas, N. P.; Keddie, J. L.; Sackin, R. Phys Rew E 1999, 59(5), 6138.7 Kahle, O.; Wielsch, U.; Metzner, H.; Bauer, J.; Uhlig, C.; Zawatzki, C.; Thin Solid Films 1998, 313-314, 803.8 See, Y. K.; Cha, J.; Chang, T.; Ree, M. Langmuir 2000, 16, 2351.
Reiter, G. Macromolecules 1994, 27, 3046.91 Zanten, J. H.; Wallace, W. E.; Wu, W.-I. Phys Rev Lett 1996, 53 R, 2053. 1 aptis, I.; Diakoumakos, C. D. Microelectron Eng 2002, 61-62, 829.113 Zhang, J.; Zhang, R.; Chen, H.; Li, Y.; Wu, Y. C.; Suzuki, R.; Sandreckski, T. C.; Ohdaira, T.; Jean, Y. C. Radiat
Phys Chem 2003, 68, 535.14 Grohens, Y.; Brogly, M.; Labbe, C.; David, M. O.; Schultz, J. Langmuir 1998, 14, 2929.15 Lovejeet, S.; Ludovice, P. J.; Henderson, C. L. Thin Solid Films 2004, 449, 231.16 Fukao, K.; Miyamoto, Y. Europhys Lett 1999, 46, 649.17 Turunen, M. P. K.; Laurila, T.; Kivilahti, J. K. Reactive blending approach to modify spin coated epoxy film:
Part I: Synthesis and characterization of star-shaped poly( -caprolactone), Submitted to J Appl Polym Sci 2004.18 Turunen, M. P. K.; Laurila, T.; Kivilahti, J. K. Reactive blending approach to modify spin coated epoxy film:
Part II: Crosslinking kinetics, Submitted to J Appl Polym Sci 2004.19 Feng, R.; Farris, R. J. J Micromech Microeng 2003, 13, 80.20 US Patent 5,999,267 (December 1999).21 Jelison, G. E.; Modine, F. A. Appl Phys Lett 1996, 69(3), 371.22 Jelison, G. E.; Modine, F. A. Appl Phys Lett 1996, 69(14), 2137.23 Schroder, D. K. Semiconductor materials and device characterization; John Wiley & Sons: New York, 1998.24 Beaucage, G.; Composto, R.; Stein, R. S. J Polym Sci Pol Phys 1993, 31, 319.25 Immonen, M.; Karppinen, M.; Kivilahti, J. K. Fabrication and characterization of optical waveguides embedded
on p
2 Feng, R.; Farris, R. J. J Mater Sci 2002, 37, 4793.27 Lange, J.; Toll, S.; Månson, J.-A. E. Polymer 1995, 36, 3135.28 Lorenz, H.; Laudon, M.; Renauld, P. Microelectron Eng 1998, 41/42, 371.
42