![Bancassurance & Irda Act[1]](https://static.fdocuments.in/doc/165x107/577d22621a28ab4e1e973e5c/bancassurance-irda-act1.jpg)
Reaching Out to the Client - Policyholder 2012 Journal.pdf · threadbare by Mr. Avinash Singaraju...
100
January 2012 Volume X, No. 1 ’Ë◊Ê ÁflÁŸÿÊ◊∑§ •ı⁄U Áfl∑§Ê‚ ¬˝ÊÁœ∑§⁄UáÊ Reaching Out to the Client - Ensuring Widest Spread
Transcript of Reaching Out to the Client - Policyholder 2012 Journal.pdf · threadbare by Mr. Avinash Singaraju...

January 2012
Volume X, No. 1
’Ë◊Ê ÁflÁŸÿÊ◊∑§ •ı⁄U Áfl∑§Ê‚ ¬˝ÊÁœ∑§⁄UáÊ
Reaching Out to the Client- Ensuring Widest Spread
Editorial Board
Editor
J. Hari NarayanR. K. NairS.V. MonyS.B. Mathur
Vepa KamesamAshvin Parekh
U. Jawaharlal
Printed by G. Venugopala Krishna and
published by J. Hari Narayan on behalf of
Insurance Regulatory and Development Authority.Editor: U. JawaharlalPrinted at Vamsi Art Printers Pvt. Ltd.(with design inputs from Efforts)11-6-872, Red Hills, Lakdikapul, Hyderabad.and published from
Parishram Bhavan, 3 FloorBasheer BaghHyderabad - 500 004Phone: +91-40-23381100Fax: +91-40-66823334e-mail: [email protected]
R. Chandrasekaran
rd
© 2010 Insurance Regulatory and Development Authority.Please reproduce with due permission.Unless explicitly stated, the information and views published inthis Journal may not be construed as those of the InsuranceRegulatory and Development Authority.
January 2012
Volume X, No. 1
’Ë◊Ê ÁflÁŸÿÊ◊∑§ •ı⁄U Áfl∑§Ê‚ ¬˝ÊÁœ∑§⁄UáÊ
Reaching Out to the Client- Ensuring Widest Spread

In the pre-liberalized regime, intermediation in
insurance was synonymous with the agent; and
whatever was required to be done in the area of
insurance marketing or servicing, it used to devolve
upon the agent. The agency channel thus has
developed deep and strong roots in the Indian
insurance industry. The need for spreading the
message of insurance in the remote parts of the
country was greatly fulfilled by the agent; and thus the
insurance agent came to be recognised as the
indispensable link between the rural masses and the
insurers who remained largely limited to urban centres.
Although the basic tenets of poverty alleviation
programmes introduced in the seventies and eighties
emphasized the need for taking financial services to
the door-step of the downtrodden, it would still be
ambitious to have expected the insurance business to
be on par with banking. All the same, the public sector
insurers still contributed a great deal in widening the
business network to as remote corners as possible; and
the agent played a key role in accomplishing this task.
The priorities of insurers in the face of privatization
were, however, different and a need arose for reaching
the maximum number of people – the accessibility of
their dwelling notwithstanding. While opening offices
in the more inaccessible areas would without doubt be
unviable, it has come to be accepted that no one should
be denied the benefits of insurance merely for the
reasons of inaccessibility. Banks, especially the public
sector banks, have spread their tentacles all over the
country and banking has come to be within the easy
reach of the vast majority. The network and reach of
these banks has thus begun to be accepted as a good
source of widening the insurance network.
Bancassurance in this respect has a huge role to play in
not only identifying the targets of various classes of
insurance but also in extending various services to the
needy.
Similarly, in the domain of corporate clientele, the role
for the insurers ends not merely with offering insurance
products to the customers. Taking a holistic view of all
the perils that a corporate entity confronts, identify the
plausible solutions and design a wholesome risk
management package is the need of the industry
presently. In order to achieve this, there is a serious
need for a highly literate broker that is totally
conversant with the emerging risks and the suggested
solutions. The brokers' channel delivers a great deal of
value in more developed markets; and it is hoped that it
is not long before it is emulated in the Indian insurance
domain.
'Importance of Insurance Distribution' is the focus of
this issue of the Journal. In order that insurance receives
its due importance, it is essential that the entire range
of services to the policyholder is rendered efficiently.
'Policyholder Services' will be the focus of the next issue
of the Journal.
From the

Statistics - Life Insurance04
18Vantage Point
U. Jawaharlal
41
06In the Air
Intermediation in Insurance
Driving Microinsurance
Need for Pro-active Participation
Picture Perfect
Trailblazers in Distribution
Abhishek Bondia
Anand Pejawar
Avinash Singaraju
Rohan Sachdev
Rajender Sud
48Round up
49Statistical Supplement (Monthly)
47
inside
19
22
28
31
35EÁ™ EÁt™y N˛y \ø∫o “{ EÁ™ §y™Á
\Tz㸠NÏ˛™Á∫
Statistics - Non-Life Insurance

from the editor
As a nation, we have been obsessed
with improving our literacy levels.
It gives us great pleasure that the
country has registered a considerable
growth over a certain period of time,
notwithstanding the fact that genuine,
core literacy has not made much progress.
The percentage growth observed only
indicates that there has been an increase
in the number of people who can write
their own names, or any other parameter
equivalent of that. While it serves the
purpose of keeping a track of the illiterate
masses leaning towards acquiring literacy
skills, it does not really add up to a
genuine growth of education in the
society.
If that is the trend noticed in acquisition of
general levels of education, it is much less
in the domain of financial services. It is
unfortunate, in a way, that a large section
of the highly literate intellectuals also
evince a serious lack of interest in the
domain of financial services thereby
necessitating a certain and important role
for intermediation. Thanks to the
essentiality of banking services as also the
proactive role adopted by the regulator
for the last several decades, we can boast
of a reasonably high level of awareness in
the banking services which is not matched
by that of the other financial services –
much less in insurance. Intermediation in
insurance has thus acquired a great
importance to ensure that the insured
population as also the insured assets
come close to a level matching with those
of the other comparable economies.
Further, it also puts a great onus on the
intermediaries to ensure that they play
their role to assist the service seeker in
identifying and acquiring solutions that
genuinely serve his/her interests. If one
looks at the large number of contract
withdrawals and the complaints
associated with being sold the wrong
product, one doubts whether such a
totally customer oriented service is being
accomplished. Irrespective of the
segment to which we cater, as also the
distribution channel through which we
are serving; such indiscretions should be
arrested at the earliest opportunity in
order that we march ahead with gusto
and positive energy.
'Intermediation in Insurance' is the focus
of this issue of the once again. We
have earlier commented that a debate on
which is the best channel would
eventually lead us nowhere; and as an
endorsement of the statement, we have
articles narrating the importance of
different channels of distribution. We
open the debate with an article by
Mr.Abhishek Bondia, a practitioner
himself, which talks about the huge
advantages the insurance industry
acquires through the Brokers channel. In
the next article, Mr. Anand Pejawar
Journal
discusses the huge impact made by the
Bancassurance channel in the Indian
insurance domain and what can be
foreseen in the not-too-distant future in a
country where a huge chunk of the
population is still essentially rural. There is
always a scope for improvement in
operational efficiency; and this fact is laid
threadbare by Mr. Avinash Singaraju in his
article on the methods being followed in
Bancassurance.
'The Bancassurance channel has made a
huge difference to insurance business in
various European countries and there is
no reason why the Indian insurance
industry cannot emulate such a
performance' argues Mr. Rohan Sachdev
in the next article. The one word that is
often associated with the agency channel,
especially in the Indian insurance
business, is 'ubiquitous' and why not?
Mr. Rajender Sud has lots of reasons to
justify the role that is played so diligently
by the Agent in furthering the cause of life
insurance promotion in its true sense.
In order that any industry makes steady
progress, it is very essential that the
services rendered to the customer are
w h o l e s o m e a n d t r u s t w o r t h y .
'Policyholder Services in Insurance' will be
the focus of the next issue of the Journal.
U. Jawaharlal
Going Great Guns- Efficiency in Distribution
The Journal wishes all its readers a Happy and Prosperous New Year 2012.

Repo
rt C
ard:
LIFE
No.o
flive
scov
ered
unde
rGro
upSc
hem
esSl No
.In
sure
rPr
emiu
mu/
w(
inCr
ores
)`
No.o
fPol
icies
/Sch
emes
Nove
mbe
r,11
Upto
Nove
mbe
r,11
Upto
Nove
mbe
r,10
Nove
mbe
r,11
Upto
Nove
mbe
r,11
Upto
Nove
mbe
r,10
Nove
mbe
r,11
Upto
Nove
mbe
r,11
Upto
Nove
mbe
r,10
Firs
t Ye
ar P
rem
ium
of
Life
Ins
urer
s fo
r th
e Pe
riod
ende
d No
vem
ber,
2011
1In
divi
dual
Sin
gle
Pre
miu
m27
.43
229.
5347
9.76
3036
2560
362
731
Indi
vidu
alN
on-S
ingl
eP
rem
ium
97.4
765
9.57
1162
.73
7572
156
4990
8853
61G
roup
Sin
gle
Pre
miu
m33
.75
162.
8710
7.35
1156
3934
541
1578
7685
562
Gro
upN
on-S
ingl
eP
rem
ium
46.0
728
1.20
283.
1271
566
1052
7456
3163
7730
816
2621
87
2In
divi
dual
Sin
gle
Pre
miu
m1.
1313
.43
5.17
125
1475
849
Indi
vidu
alN
on-S
ingl
eP
rem
ium
40.4
832
7.27
354.
4316
951
1393
2314
9851
Gro
upS
ingl
eP
rem
ium
0.08
1.41
5.66
00
018
291
1082
Gro
upN
on-S
ingl
eP
rem
ium
0.00
0.00
0.21
00
00
013
8
3In
divi
dual
Sin
gle
Pre
miu
m38
.37
175.
5029
3.26
3949
2234
041
424
Indi
vidu
alN
on-S
ingl
eP
rem
ium
83.5
460
0.37
1384
.27
8027
959
2513
1270
714
Gro
upS
ingl
eP
rem
ium
1.99
24.0
321
.03
2813
914
715
974
7510
2749
0634
Gro
upN
on-S
ingl
eP
rem
ium
8.77
120.
7592
.44
1414
910
410
907
1812
7910
9646
4In
divi
dual
Sin
gle
Pre
miu
m91
.70
811.
0974
7.65
6777
6360
571
968
Indi
vidu
alN
on-S
ingl
eP
rem
ium
118.
4490
7.89
1724
.05
5574
740
7562
4382
22G
roup
Sin
gle
Pre
miu
m80
.95
1352
.89
1179
.50
1698
8020
297
1352
4323
5438
Gro
upN
on-S
ingl
eP
rem
ium
14.9
499
.75
273.
3711
9537
9494
154
9671
4686
04
5In
divi
dual
Sin
gle
Pre
miu
m11
.87
92.2
012
4.64
706
7000
1555
4In
divi
dual
Non
-Sin
gle
Pre
miu
m45
.26
384.
2355
4.01
2037
517
7698
3561
43G
roup
Sin
gle
Pre
miu
m7.
1341
.57
21.4
60
59
1316
582
934
4314
8G
roup
Non
-Sin
gle
Pre
miu
m6.
1186
.27
83.7
66
6249
1992
533
5547
2847
78
6In
divi
dual
Sin
gle
Pre
miu
m13
.29
140.
3015
4.25
1396
1891
411
7246
Indi
vidu
alN
on-S
ingl
eP
rem
ium
214.
0514
16.8
917
48.8
350
225
3379
6837
3799
Gro
upS
ingl
eP
rem
ium
3.71
316.
044.
3630
224
127
4601
158
3542
1598
42G
roup
Non
-Sin
gle
Pre
miu
m6.
8216
2.85
242.
702
932
549
2412
2289
22
7In
divi
dual
Sin
gle
Pre
miu
m17
.49
178.
7170
8.11
926
1126
442
637
Indi
vidu
alN
on-S
ingl
eP
rem
ium
295.
6914
88.6
325
89.9
370
226
6996
4178
4133
Gro
upS
ingl
eP
rem
ium
35.6
735
9.49
153.
2916
116
103
1133
1912
1809
514
6476
0G
roup
Non
-Sin
gle
Pre
miu
m69
.66
601.
9460
1.49
221
3114
237
4642
8041
0094
8In
divi
dual
Sin
gle
Pre
miu
m3.
8855
.82
12.3
299
1208
2677
4In
divi
dual
Non
-Sin
gle
Pre
miu
m81
.09
672.
4510
42.6
767
871
5093
9771
2527
Gro
upS
ingl
eP
rem
ium
0.20
2.85
3.81
01
268
597
860
Gro
upN
on-S
ingl
eP
rem
ium
40.4
329
4.67
235.
4832
191
152
3530
251
6422
5787
31
9In
divi
dual
Sin
gle
Pre
miu
m1.
5523
.99
18.5
514
947
6012
60In
divi
dual
Non
-Sin
gle
Pre
miu
m30
.83
242.
7235
3.88
1230
385
775
1205
07G
roup
Sin
gle
Pre
miu
m0.
070.
580.
360
02
237
2111
2139
Gro
upN
on-S
ingl
eP
rem
ium
2.79
110.
2034
.83
768
97-1
0151
1-6
1817
115
2824
2
10In
divi
dual
Sin
gle
Pre
miu
m19
.56
160.
7530
.24
914
9102
3169
Indi
vidu
alN
on-S
ingl
eP
rem
ium
29.6
721
2.86
470.
1213
250
9259
616
2472
Gro
upS
ingl
eP
rem
ium
10.7
075
.36
68.0
45
343
1641
3671
1301
3167
68G
roup
Non
-Sin
gle
Pre
miu
m11
.00
102.
3284
.12
5142
846
462
457
9957
4210
7328
2
11In
divi
dual
Sin
gle
Pre
miu
m19
.40
143.
2513
4.36
5255
310
30In
divi
dual
Non
-Sin
gle
Pre
miu
m99
.69
843.
1210
46.8
638
623
3365
7952
0033
Gro
upS
ingl
eP
rem
ium
11.7
462
.95
20.1
60
1426
4534
3826
711
6715
7G
roup
Non
-Sin
gle
Pre
miu
m1.
3032
.82
55.6
044
615
517
-122
731
2170
445
5146
497
12In
divi
dual
Sin
gle
Pre
miu
m18
.39
104.
0970
.99
1659
8286
9764
Indi
vidu
alN
on-S
ingl
eP
rem
ium
28.5
921
1.72
294.
5993
1484
983
9846
4G
roup
Sin
gle
Pre
miu
m0.
425.
598.
020
23
910
1090
254
67G
roup
Non
-Sin
gle
Pre
miu
m4.
6810
0.67
23.9
923
337
208
7213
287
4757
1542
604
Baj
ajA
llian
z
ING
Vys
ya
Rel
ian
ceL
ife
SB
I Lif
e
Tata
AIG
HD
FC
Sta
nd
ard
ICIC
IPru
den
tial
Bir
laS
un
life
Avi
va
Ko
tak
Mah
ind
raO
ldM
utu
al
Max
New
Yo
rk
Met
Lif
e
ird
ajo
urn
al J
an
ua
ry2
01
2
4
statistics life insurance

Not
e:1.
Cum
ulat
ive
prem
ium
/No.
ofpo
licie
sup
toth
em
onth
isne
tofc
ance
llatio
nsw
hich
may
occu
rdu
ring
the
free
look
perio
d.2.
Com
pile
don
the
basi
sof
data
subm
itted
byth
eIn
sura
nce
com
pani
es
13In
divi
dual
Sin
gle
Pre
miu
m1.
2611
.12
22.5
927
824
6851
42In
divi
dual
Non
-Sin
gle
Pre
miu
m3.
2320
.99
27.8
047
6229
298
3224
6G
roup
Sin
gle
Pre
miu
m0.
000.
000.
000
00
00
0G
roup
Non
-Sin
gle
Pre
miu
m0.
000.
000.
000
00
00
0
14In
divi
dual
Sin
gle
Pre
miu
m11
.05
116.
5517
9.15
1456
1457
320
806
Indi
vidu
alN
on-S
ingl
eP
rem
ium
11.2
774
.41
115.
3488
8863
277
5224
2G
roup
Sin
gle
Pre
miu
m4.
7646
.47
45.0
70
00
1999
219
1962
1923
74G
roup
Non
-Sin
gle
Pre
miu
m1.
535.
443.
544
195
7152
228
4714
3747
81
15In
divi
dual
Sin
gle
Pre
miu
m0.
050.
773.
484
134
2648
Indi
vidu
alN
on-S
ingl
eP
rem
ium
12.0
810
2.40
219.
4068
7761
706
9618
8G
roup
Sin
gle
Pre
miu
m1.
8017
.05
12.4
40
13
655
6038
6960
Gro
upN
on-S
ingl
eP
rem
ium
0.00
0.00
0.00
00
00
00
16In
divi
dual
Sin
gle
Pre
miu
m3.
5520
.23
8.07
529
3017
851
Indi
vidu
alN
on-S
ingl
eP
rem
ium
16.4
114
4.86
212.
9311
441
8664
020
0158
Gro
upS
ingl
eP
rem
ium
0.02
0.22
0.10
01
17
5322
41G
roup
Non
-Sin
gle
Pre
miu
m1.
4314
.92
19.3
022
9158
7459
7577
420
0035
7
17In
divi
dual
Sin
gle
Pre
miu
m6.
3564
.77
92.2
351
242
7810
747
Indi
vidu
alN
on-S
ingl
eP
rem
ium
13.8
097
.50
165.
7752
4138
841
5701
3G
roup
Sin
gle
Pre
miu
m0.
000.
000.
000
00
00
0G
roup
Non
-Sin
gle
Pre
miu
m1.
3710
.43
3.24
116
1311
241
2741
9646
7707
18In
divi
dual
Sin
gle
Pre
miu
m0.
000.
065.
430
125
5In
divi
dual
Non
-Sin
gle
Pre
miu
m30
.53
294.
5942
3.44
4745
4197
265
840
Gro
upS
ingl
eP
rem
ium
0.35
2.74
12.8
50
12
107
836
7506
Gro
upN
on-S
ingl
eP
rem
ium
0.97
129.
045.
003
112
4101
7098
012
5
19In
divi
dual
Sin
gle
Pre
miu
m0.
2011
.72
4.24
6572
539
3In
divi
dual
Non
-Sin
gle
Pre
miu
m15
.39
101.
9512
0.35
7707
4057
242
014
Gro
upS
ingl
eP
rem
ium
0.02
0.38
0.37
00
139
719
866
Gro
upN
on-S
ingl
eP
rem
ium
0.00
0.00
0.00
00
00
00
20In
divi
dual
Sin
gle
Pre
miu
m0.
867.
920.
8011
391
911
0In
divi
dual
Non
-Sin
gle
Pre
miu
m7.
0646
.61
43.9
355
8734
313
2020
5G
roup
Sin
gle
Pre
miu
m0.
000.
000.
000
00
00
0G
roup
Non
-Sin
gle
Pre
miu
m0.
000.
000.
000
00
00
0
21In
divi
dual
Sin
gle
Pre
miu
m43
.91
197.
3215
3.04
2880
1355
610
175
Indi
vidu
alN
on-S
ingl
eP
rem
ium
21.4
513
3.74
119.
9910
852
6949
241
102
Gro
upS
ingl
eP
rem
ium
5.08
37.2
429
.78
00
025
9315
477
1665
2G
roup
Non
-Sin
gle
Pre
miu
m95
.11
104.
2013
.21
928
3891
367
1674
4914
2830
22In
divi
dual
Sin
gle
Pre
miu
m15
.73
159.
8912
9.92
1239
1284
696
86In
divi
dual
Non
-Sin
gle
Pre
miu
m10
.06
65.7
716
8.17
5182
3247
959
327
Gro
upS
ingl
eP
rem
ium
2.96
18.2
25.
040
27
2696
1589
043
18G
roup
Non
-Sin
gle
Pre
miu
m27
.47
112.
770.
594
358
1320
423
8658
4370
6
23In
divi
dual
Sin
gle
Pre
miu
m0.
000.
090
2In
divi
dual
Non
-Sin
gle
Pre
miu
m0.
831.
9955
913
07G
roup
Sin
gle
Pre
miu
m0.
000.
080
10
7G
roup
Non
-Sin
gle
Pre
miu
m0.
000.
000
00
0
24In
divi
dual
Sin
gle
Pre
miu
m81
5.92
7068
.81
2028
6.62
1204
9311
1822
233
3631
9In
divi
dual
Non
-Sin
gle
Pre
miu
m22
60.8
614
122.
4013
594.
8827
4137
917
1773
3816
0041
34G
roup
Sin
gle
Pre
miu
m11
78.5
817
664.
4713
410.
6417
5012
370
1384
617
7439
113
4666
9723
7482
25G
roup
Non
-Sin
gle
Pre
miu
m24
4.63
6903
.30
8221
.34
432
3519
466
1053
767
4760
843
7770
59
Sah
ara
Lif
e
Sh
rira
mL
ife
Bh
arti
Axa
Lif
e
Fu
ture
Gen
eral
i Lif
e
IDB
I Fed
eral
Can
ara
HS
BC
OB
CL
ife
Aeg
on
Rel
igar
e
DL
FP
ram
eric
a
Sta
rU
nio
nD
ai-i
chi
Ind
iaF
irst
Ed
elw
eiss
Toki
o
Pri
vate
Tota
lIn
div
idu
alS
ing
leP
rem
ium
347.
0227
19.0
933
78.2
626
864
2266
2945
5219
Ind
ivid
ual
No
n-S
ing
leP
rem
ium
1306
.92
9052
.55
1434
3.47
5827
2645
2892
265
3856
1G
rou
pS
ing
leP
rem
ium
201.
3725
28.0
216
98.6
810
669
555
543
9299
3923
168
4203
774
Gro
up
No
n-S
ing
leP
rem
ium
340.
4423
70.2
220
55.9
930
627
4128
6710
3073
312
9614
6330
6632
31
LIC
Gra
nd
Tota
lIn
div
idu
alS
ing
leP
rem
ium
1162
.94
9787
.90
2366
4.87
1473
5713
4485
137
9153
8In
div
idu
alN
on
-Sin
gle
Pre
miu
m35
67.7
823
174.
9627
938.
3533
2410
521
7062
6022
5426
95G
rou
pS
ing
leP
rem
ium
1379
.95
2019
2.49
1510
9.33
1856
1306
514
401
2213
690
1738
9865
2795
1999
Gro
up
No
n-S
ing
leP
rem
ium
585.
0792
73.5
210
277.
3373
862
6033
3320
8450
017
7223
0631
4402
90
ird
ajo
urn
alJ
an
ua
ry2
01
2
5

ird
ajo
urn
al J
an
ua
ry2
01
2
6
in the air
Order
Order of Insurance Regulatory and
Development Authority
on Dismantling the Indian Motor Third
party Pool
Dismantling of existing Indian Motor
Third party Pool
In exercise of the powers vested under
Section 14 (2) of the IRDA Act, 1999, the
Authority issues the following order
reforming the Indian Motor Third Party
Pool System. The Authority hereby orders
the dismantling of the existing Indian
Motor Third Party Pool with effect from
31.3.2012.
The existing Indian Motor Third Party Pool
shall be dismantled in the Following
manner:
I. The dismantling or the motor third
party pool shall be done on clean-cut
basis.
ii. The pool shall not be subject to run-
off.
iii. The general insurers who have issued
the policy shall also be responsible for
servicing them and settling the claims
as and when they arise.
iv. The total liabilities of the motor third
party insurance policies shall be
calculated as ordered by the Authority
separately.
v. These liabilities shall also be signed off
by all the general insurers.
vi. Based on the actuarial calculations
each general insurer shall submit the
details of the calculations to the pool
administrator who shall verify the
same.
vii. The pool adminis t rator af ter
verifying shall allocate the amounts to
be transferred by insurer to other
insurers the net balances after due
process of reconciliation.
viii. Following such agreement, it shall be
the responsibility of the insurer to
service and settle the claims under the
motor third party insurance policy to
the satisfaction of the claimant.
ix. The process of clean cut following
committee:
a. Member (Non-Life)- Chairman
b. Head of Department (Non-Life) -
Member Convenor
c. Head of Department (Actuarial) –
Member
d. Appointed Actuary of the Indian
Motor Third Party Insurance pool –
Member
e. Pool Administrator – Member
f. Sec re ta ry Genera l , Genera l
Insurance Council – Member
g. Auditor Appointed by the Authority
– Member
X. The pool administrator shall get of the
members of the Third Party pool
Accounts of the members of the India
motor Third party Insurance pool
audited by a chartered accountant
firm approved by the Authority
expedi t ious ly not la ter than
30/6/2012
Sd/-
Chairman
(J. Hari Narayan)
IRDA/NL/ORD/MPL/276/12/2011 Date: 23.12.2011
OrderIRDA/NL/ORD/MPL/277/12/2011 Date: 23.12.2011
Order of Insurance Regulatory and
Development Authority on Reforming
the Indian Motor Third Party Pool
In exercise of the powers vested under
Section 14 (2) of the IRDA Act, 1999, the
Authority issues the following order
reforming the Indian Motor Third Party
Pool System. The Authority hereby creates
a declined risk pool for Act only
Commercial Vehicle Third Party Insurance
with effect from 1.4.2012.
The Authority has constituted Indian
Motor Third Party Pool in the year 2007 by
Preamble
its order dated 03S/IRDA/Motor-TP/Dec-
06 dated 4th December, 2006 with an
objective of ensuring free availability of
third party motor liability policies of the
commercial vehicle owners. During the
year 2010-11, the Authority has reviewed
the performance of the pool through a

ird
ajo
urn
alJ
an
ua
ry2
01
2
7
series of studies on the management, the
financial aspects and the valuation of the
liabilities of the pool by the pool
admin is t ra tor and the member
companies. The Authority constituted
Technical Committee on Commercial third
Party Liability Cover vide its order no IRDA/
NL/ORD/IMPL/12/2010 dated 17th
December, 2010 to review the current
arrangement of motor third party liability
pool, to examine the possibility and
modalities to, be adopted for creating
declined pool of commercial vehicles to
ensure the availability of third party
liability cover to all commercial vehicles, to
examine the possibility to provide third
party liability cover to the driver in
addition to the vehicles. Further three
sub- committees were formed to go into
each of issues. The sub-committee
headed by Mr K.P Sarma, Consultant
Actuary submitted the report which
highlighted clear under-reserving and
data inadequacies.
In view of the alarming increase in the
liabilities of the pool, inadequate
provisioning by the member companies
and due to the inefficient management of
the pool by the administrator, "the
Authority appointed Government
Actuary's Department from UK to candent
the peer review of the report of the
appointed actuary of the Pool. The review
report states that given the significant
data issues a precise estimate of the pool
liability entails great uncertainty and also
corresponding impact on the selection of
loss development factors.
The Authority met the CMD's of the Public
Sec tor Companies and made a
presentation on the results of the motor
third party pool on 9th December, 2011.
The Authority followed this with
communication dated 5th December,
2011 to the Secretary General, General
Insurance Council seeking their views on
the proposed declined risk pool.
Simultaneously the Authority also
addressed a communication dated
December, 5th December, 2011, to the
Transporters Association seeking their
views an the proposed declined risk
commercial vehicle pool. The Chairman,
IRDA met the CEO's of the general
insurance companies on 15th December,
2011 to discuss the concerns of the
general insurers an the proposed
mechanism. Arising out of this meeting
the Chairman, IRDA constituted a
committee vide its order no. IRDA/Admn/
ORD/MISC/273/12/2011 dated 15th
December, 2011 to evolve consensus on
the operational mechanism. The
committee met on 21st December, 2011
and submitted its report to the Authority
on 21st December, 2011.
Thus the independent review conducted
by the Authority through various agencies
has revealed that the current framework
of the pool is severely affecting the
financial viability of the general insurance
sector due to alarming capital depletion in
the sector. The analysis of the data also
revealed huge inefficiencies in claim
settlement by the companies reflected in
the average claim ratio. Which differed by
as much as 100%. This has a direct
bearing an the policyholders interest as
inefficient management will result in
higher premium for commercial vehicle
owners. The Authority after having
examined the current framework of the
pool and its financial management is
satisfied that the pool in its farm is eroding
the interests of the policyholders and is
also causing financial distress to the
general insurance companies. In order to
ensure that the sector grows in a healthy
fashion and the policyholders interest is
protected, the Authority makes the
fallowing order setting up a declined risks
pool for third party commercial vehicle
motor insurance with effect from
1.4.2012.
The purpose of creating the Indian Motor
Third Party Declined Risk Insurance Pool
for Commercial vehicles (Act only
Insurances) is as follows:
(i) Equitable and fair sharing by all
insurers
(ii) No. supply side constraints
(iii) Simple to administer
(iv) To bring claims management
efficiency
(a) The declined risk pool shall apply to
commercial vehicles for standalone
third party liability insurance (Act. only
insurance). No comprehensive motor
insurance Policy or part thereof shall
be ceded to the pool.
(b) Miscellaneous and special class of
vehicles falling under class code 23 of
the erstwhile All India motor Tariff
shall also be excluded from the scope
of the pool
(a) All existing general insurers and every
newly registered general insurer
automatically shall be admitted as
member of the Indian Motor Third
Party Declined Risk Insurance pool
(Declined Risk Pool)
(b) Specialist insurers not licensed for
Framework for Indian Motor Third
Party Declined Risk Insurance pool for
Commercial vehicles (Act only
Insurance)
1 Purpose
2 Applicability
3. Membership
ird
ajo
urn
al J
an
ua
ry2
01
2
8
in the air
insurance business shall not be
members of the declined risk pool.
The cessions to the General Insurance
Corpora shall be in accordance with the
obligatory cession which currently stands
at 10%
General Insurance Corporation shall act as
the pool administrator of the Declined
Risk Pool
(a) The pool administrator shall maintain
accounts, premiums and liabilities as
per The statutory requirements and
file all returns as per the regulatory
requirements
(b) The pool administrator shall prepare
and submit half yearly and annually
audited accounts for the declined risk
pool and also appointed actuary's
annual report
(c) The pool administrator shall conduct
periodical inspections of the member
companies to assess their efficiency in
settlement of claims and also verify
the quarterly statements in respect of
the pool business.
(d) Any member of the system shall be
entitled to inspect the accounts and
valuations of the system with in 15
days.
(a) The insurer shall be responsible to
deduct tax on payments where
required and remit tax deducted at
source to the appropriate Authorities.
(b) Automated transaction level data
(data upload) shall continue to flow as
4. Participation in Indian Motor Third
Party Declined Risk Insurance Pool
5. Declined Risk Pool Administrator
6. Role and Administrator
7. Role and responsibilities of the
companies peel member companies
at present, from the companies to the
pool administrator. However data
shall be sent not later than last day of
the following month.
(c) The Appointed Actuary of the general
insurer is to confirm in his annual
report, the incorporation of an pool
liabilities, including revisions, in the
company's accounts.
(d) The underwriting insurer shall be the
lead insurer for all purposes including
claims servicing.
(a) The premium shall be reviewed
annually based on the formula
notified by the Authority in its order
dated 15th April, 2011
(b) The premium for declined risk pool
shall be determined in accordance
with the actuarial principles which
shall be used by all the insurers and
shall be notified by the Authority from
time to time
(c) The appointed actuary shall analyse
and submit to the Authority the claims
frequency, claims costs, expense
inflation investment, etc considering
the long tail of business and classify
the rates for each classification like
standard risks, sub-standard risks etc.
at least on an annual basis and review
all the loadings allowed for in the
premium determination.
(d) An agency commission or brokerage
not more than 1% shall be paid for
th i rd par ty motor insurance
commercial vehicles.
(e) No ceding commission in respect of
the business ceded to the declined risk
pool shall be paid.
(f) GIC as administrator shall be paid a fee
8 Declined Risk Peel Mechanisms
on actual cost basis.
(a) It shall be obligatory on part general
insurers to segregate funds on
account of the declined risk pool
business in their accounts & invest
them according to IRDA’s Investment
Regulations
(b) The transfer of funds between the
insurers shall be thorough the
declined risk pool mechanism on net
basis
(c) The general Insurers shall submit
quarterly statements in respect of
declined risk pool & investment of
funds shall be confirmed by the
statutory auditors in annual accounts
of the company.
(d) The business transacted by insurance
companies on account of declined risk
pool & investment of funds shall be
confirmed by the statutory auditors in
annual accounts of the company.
(a) A prospect wishing to take motor third
party insurance (Act only) policy shall
approach any underwriting his risk.
(b) The general insurer shall accept the
risk and underwrite to its own account
based on the company’s underwriting
guidelines or cede the came to the
declined risk pool account in
accordance with the underwriting
manual filed with the Authority and
cleared by it as per the file & use
guidelines.
(c) At no instance shall the insurer refuse
to write the risk.
(d) Any refusal shall be seen as a violation
of the Insurance Act, 1938 and shall
invite penalty as per of the Act.
9 Accounts & Audit
10 Proposal for third party insurance
risks for commercial
11 Parameter for ceding the proposals

ird
ajo
urn
alJ
an
ua
ry2
01
2
9
to the declined risk pool
(a) Each company will have its own
underwriting manual having the
underwr i t ing parameters for
accepting or ceding the risk to the
pool, which shall be filed with the
Authority.
(b) Any business which does not fill within
the underwriting parameters of the
insurer shall be ceded to the pool.
(c) The ceding insurers shall retain 20%
of the individual risk to his net account
(after obligatory cessions) and cede
the balance to the declined pool.
(d) The retention of the risk or the
cessions to the pool shall be strictly as
per the filed underwriting manual of
each company financial year.
(e) The underwriting manual of the
company shall be filed every year with
the Authority before 31st January of
the forthcoming financial year.
(f) H o w e v e r t h e u n d e r w r i t i n g
parameters based on which the
company shall accept or cede risk the
pool shall be limited to i) age of the
vehicle; ii) geographical parameters
based on the registration of the
vehicle and iii) type of vehicle based
on the tonnage for Goods Carrying
Vehicles and passenger seating
capacity for Passenger carrying
vehicles; iv) Such other parameters
which Authority may decide from
time to time.
(g) Every company shall get the cessions
to the pool audited by its statutory
auditor who will certify compliance to
the underwriting guidelines filed with
the Authority
(h) The cessions to the pool shall also be
audited by the pool auditors.
(i) The codes and sub codes necessary to
capture this information shall be
standardized to facilitate effective
monitoring and data transfer to the
pool.
Premium for motor third party insurance
for commercials vehicles shall be same
whether underwritten to its net account
or ceded to the declined risk pool.
(a) Every insurer shall underwrite
(excluding reinsurance) a minimum
percentage of standalone (Act only)
commercial vehicle motor third party
insurance which shall be in proportion
to the sum of fifty percent of the
company's percentage share in total
gross premium and fifty percent of the
total motor premium of the industry
in the current year.
(b) The amount of standalone (Act only)
commercial vehicle motor third party
Insurance premium to be fulfilled by
every insurer in the current year shall
be arrived at by multiplying such
percentage as derived in 13 (a) with
the total amount of standalone (Act
only) commercial vehicle motor third
party insurance premium in the in the
current year.
(c) The fulfillment or shortfall of the
mandatory obligations as prescribed
in 13 b) above shall be determined
based on actual premium written on
the net account the insurer and
premium retained with respect to the
business ceded to the declined pool.
(d) T h e d e c l i n e d p o o l s h a l l b e
extinguished at the end of every
underwriting year on a clean cut basis,
by transferring the risks at par to the
12 Premium rates for motor third party
declined risk pool
13 Manner of calculat ing the
obligations:
members who have fulfilled their
mandatory obligations. Such transfer
shall be in proportion of the shortfall
of each member company.
(e) The Authority constitutes a committee
headed by Chairman, General
Insurance Council, representatives of
GIC, public sector companies and 2
private sector methodology for
transfer of risks amongst general
insurers. The committee shall give its
repot to the Authority by 28th
February, 2012.
(f) The business ceded to the declined
risk pool shall be shared in the manner
given in Annexure “1”
The Appointed actuary of the general
insurer shal l be responsible for
determining provisions for liabilities for
motor third party insurance which is
written to company's account and cross-
checking that written to the declined risk
pool account.
Every general insurer shall appoint a
grievance redressal officer to look into the
grievances of the policyholder/ prospect/
customer on the non-availability of motor
third party insurance and shall submit a
report on monthly basis to the pool
administrator with a copy of the same to
the Authority outlining the steps taken by
the company to the regulations.
In order to ensure that general insurers
fulfill their motor third party Insurance
obligations, monthly reporting of
premiums and no. of vehicles insured
state-wise shall be furnished to the Pool
Administrator and Authority in the
attached format on a monthly basis and
any reports prescribed from time to time.
14 Appointed Actuary of the Company
15 A p p o i n t m e n t o f G r i e v a n c e
Redressal Officer
16. Reporting

ird
ajo
urn
al J
an
ua
ry2
01
2
10
in the air
Example of Sharing of business ceded to the declined risk pool
Total Act only Commercial Vehicle motor Third premium (excluding for Misc D class of vehicles) = Rs 100 crs
Motor share of 4 companies : A-10%; B-20%; C-30%; D-40%
A 10% 10 15 3 12 Nil
B 20% 20 22 4 18 2
C 30% 30 25 5 20 10
D 40% 40 38 8 30 10
Company Sum of fifty TP Mandatory Actual Done Given to Pool Net Retention Shortfall
percent of obligations
company's (Rs. in crores) (Rs. in crores) (Rs. in crores) (Rs. in crores) (Rs. in crores)
share in the
total gross
premium and
fifty percent
share in the
total motor
premium
Total 100% 100 100 20 80 22
Sd/-
Chairman
(J. Hari Narayan)
Sharing of Pool: A-Nil; B-20/22x2; C-20/22x10: D-20/22x10
CEOs of all Life InsurersIRDA/ACTL/CIR/ALM/005/01/2012 03.01.2012
To
1. Asset-liability management (ALM) is
the practice of managing a business so
that decisions and actions taken with
respect to assets and liabilities are
coordinated. ALM is relevant to, and critical
for, the sound management of the
finances of the insurers that invests to
meet its future cash flow needs and
capital requirements.
2. As Asset Liability Management plays a
CEOs of all Life Insurers
Re: Asset-liability management and
Stress testing
Part 1- Asset Liability Management
vital role in the sound management of the
insurance business, the Authority has
mandated all the life insurers to provide
the details of Asset Liability Management
activities undertaken by them in Chapter-
5. Risk Management of Appointed
Actuary's Annual Report. The framework
of ALM has also been discussed in the
Corporate Guidelines.
3. On thorough examination of the details
of ALM activities submitted by the life
insurers in the AAAR for the year ended
March 31, 2010, it appeared that these
details are incomplete and inconsistent.
As the mandate by the Authority was very
broad, each insurer had adopted their
own measures in reporting such details in
AAAR.
4. To bring consistency in ALM reporting
and to strengthen the ALM framework, the
following additional guidelines to the
existing framework are prescribed. The
guidelines shall be applicable to all life
insurers and shall come into effect from
1st April 2012.
5. Insurers shall have an ALM policy
approved by the Board of the insurer and
shall be submitted to the Authority within
90 days from the date of this circular. The

ird
ajo
urn
alJ
an
ua
ry2
01
2
11
Board shall approve the. insurer's ALM
policy, considering the asset-liability
relationships, the insurer's overall risk
tolerance, risk and return requirements,
so lvency pos i t ion and l iqu id i ty
requirements. The Board shall regularly
review such 'policy at the year end or at
6. Insurers shall have in place effective
procedures for monitoring and managing
their asset-liability positions to ensure
that their investment activities and asset
positions are appropriate to their liability,
risk profiles and their solvency positions.
The insurers shall confirm compliance to
this requirement within 90 days from the
date of this circular.
7. The ALM policy should, at the minimum,
enable the insurer to:
a. understand the risks they are exposed
to;.
b. develop ALM policies to manage them
effectively;
c. apply techniques appropriate for the
nature of their business, the risks they
undertake and specific local market
conditions; and
d. measure the interest rate risk, in
particular, faced by the insurers and
thereby improving the assessment of
the asset liability management
strategies of the
insurers.
8. The insurer shall examine all risks
requiring the coordination of its assets
and liabilities. The ALM framework shall
cover all the areas significant in terms of
their potential impact on economic value.
The economic value of asset or liability
cash flows, derived in such a way as to be
consistent with current market prices
where they are available, or using market-
consistent principles, methodologies or
parameters. These may include risks like:
a) Market Risk
i) interest rate risk (Including variations
in market credit spreads)
Ii) equity, real estate arid other asset
value risks
iii)currency risk
iv) related credit risk
b) Underwriting Risk
c) Liquidity Risk
9. The insurer shall develop and
Implement controls and reporting
procedures for its ALM policies that are
appropriate for its business and the risks
to which it is exposed. These shall be
monitored closely and reviewed regularly.
10. All life insurers shall submit the data
with respect to the assets and liabilities in
the format. (Table-ALM-Quarterly) as per
Annexure-1, on a quarterly basis within
45days from the end of each quarter,
starting from the quarter ending March
2012 (as already we are in December)
onwards and Table-ALM-Yearly on yearly
basis along with AAAR.
11. ‘Table-AlM-Quarterly’ data shall be
furnished for:
base discount rate (as per yield curve
available on the date of annual valuation)
applicable and, with such base discount
rate increased & decreased by 1 % and
2%.
Further to the above table, the ‘Tabie-AlM-
Yearly’ shall also contain the details about
the Impact on duration due to changes in
the following:
�
a) fall of 30% in Equity values, 100 basis
points fall in yield available on various
fixed interest securities, adverse
d e v i a t i o n o f 1 0 % i n
mortal i ty/morbidity, expenses ,
withdrawal/lapse rates and 25%
(increase and decreasing) in new
business volumes independently.
b) fall of 30% p.a. in Equity values, 100
basis points p.a. fall in yield available on
various fixed interest securities, annual
adverse deviation of 10% p.a. in
mortal i ty/morbidity, expenses ,
withdrawal/lapse rates and 25%
(increase and decreasing) in new
business, during three years from the
report date independently.
12. 'Table-ALM' data shall be furnished
separately for 'Life, 'Pension', 'General
Annuity' and 'Health' businesses. If
mathematical reserves of any line of
business as per latest annual valuation
results is less than 5% of the
mathematical reserves of the total
business, such line of business need not
be considered for ALM framework. Under
all the classes of businesses non-linked
and linked (non-unit part) business shall
be furnished separately.
13. Stress testing helps insurers to
ascertain the potential level of
vulnerability to different scenarios, to
manage their risks and maintain enough
financial resources to manage them.
Stress tests enable insurers to study the
quantitative impact of different scenarios
and its affect on the solvency of an insurer.
The stresses may be financial, operational,
legal, liquidity based or be related to any
other risk that might have an adverse
economic impact on the insurer.
14. Stress Testing being critical in the
management of risks and the financial
Part II- Stress testing

soundness of the insurers, Authority vide
C i rc u l a r N o : I R D A l A C T l l C I R l G E N /
045/03/2011, March 7, 2011, mandated
all the life Insurers to conduct scenario
and sensitivity testing as part of the
Actuarial Report and Abstract (from the
year ended March 31, 2011).
15. On thorough examination of the
requirements, it has been felt necessary to
prescribe minimum requirements for the
stress testing. In this regard, the Insurer
shall submit Annexure-ST (as prescribed
in the said circular) as per the risk factors
described in Annexure-2. The amount of
deviation in the risk factors may be
considered as per the risk profile of the
insurer. However, the insurer shall submit
the results of stress testing. with respect to
the scenarios based on the following
specific risk factors as stated below in
addition to the insurer specific risk factors.
i. Fall of 30% in Equity values, 100 basis
points fall in yield available on various
fixed interest securities, adverse
deviation of 10% in mortality/
morbidity, expenses, withdrawal/lapse
rates and 25% (increase and decrease)
i n n e w b u s i n e s s v o l u m e s
independently.
ii. Fall of 30% p.a. in Equity values, 1.0.0
basis points p.a. fall in yield available on
various fixed interest securities Annual
adverse deviation of 10% p.a. in
mortal i ty/morbidity, expenses ,
withdrawal/lapse rates and 25%
(increase and decrease) in new
business, during three years from the
report date independently.
16. Insurer's Board shall ensure timely
review of the issues emanating from
'Table-ALM' data and Annexure-ST and
take such corrective action as may be
necessary under intimation to the
Authority.
17. The Appointed Actuaries may follow
Actuarial Practice Standards issued by
Institute of Actuaries of India in this
regard if any.
The circular is issued under Section 14 of
IRDA Act, 1999.
Annexure-1
The amount of assets and liabilities in
each of the duration buckets as indicated
below should be furnished. Macaulay
duration should be used in this regard.
Class of business:
Unit Linked/Non-Linked Business:
As on:Table-ALM - Yearly
Macaulay
Duration
Base Scenario Assets in Rs. Liabilities in Rs Net Net, Hedged
(1/2/3/4/5) (000) (000)
Total
Under 1 year
1-2 years
2-3 years
3-5 years
5-7 years
7-10 years
10-15 years
15-20 years
20-25 years
Above 25 years
Table-ALM-Quarterly
Base Scenario Assets in Rs. Liabilities in Rs Net Cashflows
(1/2/3/4/5) (000) (000) (column 2-column3)
Total
Under 1 year
1-2 years
2-3 years
3-5 years
5-7 years
7-10 years
10-15 years
15-20 years
20-25 years
Above 25 years
ird
ajo
urn
al J
an
ua
ry2
01
2
12
in the air

ird
ajo
urn
alJ
an
ua
ry2
01
2
13
Notes:
Annexure-2
1. Discount rate used in arriving at
'Macaulay duration' of various classes of
assets and liabilities shall be furnished
separately. (Effective duration can be used
instead of Macaulay duration) (For liability
duration, whether the duration is to be
calculated on policy by policy basis or at
portfolio level)
2. Macaulay duration shall be computed
as below:
For cash flows ofC1, C2,............, Cn at times
t1, t2, tn respectively and with 'd' being
discount rate. Macaulay duration is:
3. ‘Table-ALM’ data shall be signed by, Chief
Executive Officer, Financial Officer and
Appointed Actuary.
List of 'Risk Factors' to be considered in
projecting financial and capital adequacy
positions over the one-year period
immediately following recent March 31.
1. Mortality/Morbidity: adverse deviation
in experience
2. Investment returns
(a) Yield curve
(i) Parallel yield curve shift
(ii) No change for duration less than 5
years, parallel shift for duration
more than 5 years , l inear
interpolation.
(iii) Parallel shift for duration less than
5 years, no change for duration
more than 5 years , l inear
n
Ci(1+d) ti-ti
i=1
n
Ci(1+d)-ti
i=1
interpolation
(iv) Change in credit spreads
(b) Equity market
(i) Equity crash - fall in all market by
market
(ii) Stock specific event risk - move in
each individual stock, by stock
3. Expenses: increase in expenses
4. Termination rates: adverse deviation in
experience
5. New business: fall in new business
6. The appointed actuary shall also include
shock scenarios to company's experience
in the next projection year arising from
changes in:
(a) reinsurance ceded;
(b) reserving basis;
(c) exercise rate of policy options;
(d) distribution to shareholders; and
(e) taxation.
7. The appointed actuary may also
consider any other factors that have
significant relevance to the insurer's
business.
List of 'Risk Factors' to be considered in
projecting financial and capital adequacy
positions over the three-year period
immediately following recent March 31.
1 . M o r t a l i t y / M o r b i d i t y : y e a r l y
deterioration in experience over the
projection period
2. Investment returns
(a) Yield curve:
(i) Parallel yearly yield curve shift
(ii) No change for duration less than 5
years, yearly parallel shift for
duration more than 5 years, linear
interpolation
(iii) Yearly parallel shift for duration
less than 5 years, no change for
duration more than 5 years, linear
interpolation
(iv) Change in credit spreads
(b) Equity market
(i) Equity dividend yield fall over the
projection period
(ii) Equity total returns deteriorate-
over the projection period
3. Expenses: Yearly deterioration in
experience over the projection period
4. Termination rates: Yearly deterioration
in experience over the projection period
5. New business: Yearly fall in new
business income over the projection
period
6. Where material, the appointed actuary
shal l a lso inc lude scenar ios on
deterioration of company's experience
over the projection period arising from
changes in:
(a) bonus scales;
(b) reinsurance ceded;
(c) reserving basis;
(d) exercise rate of policy options;
(e) distribution to shareholders; and
(f) taxation;
7. The appointed actuary may also
consider any other factors that have
significant relevance to the insurer's
business.
Sd/-
Chairman
(J. Hari Narayan)

ird
ajo
urn
al J
an
ua
ry2
01
2
14
in the air
CEOs of all Non-life Insurers and ReinsuresIRDA/ACTL/CIR/ALM/006/01/2012 03.01.2012
To
1. Asset-liability management (ALM) is the
practice of managing a business so that
decisions and actions taken with respect
to assets and liabilities are coordinated.
ALM is relevant to, and critical for, the
sound management of the finances of the
insurers that invests to meet its future
cash flow needs and capital requirements.
2. As Asset Liability Management plays a
vital role in the sound management of the
insurance business, Authority vide its
Circular No: IRDAlACT/CIRlMISC/081/
0512010, May 13, 2010, has mandated all
the non-life insurers to provide the details
of ALM activities undertaken by them
Section-11 on ‘Investments and ALM’ of
Financial Condition Report (FCR) and also
discussed the framework of ALM in its
guidelines on Corporate Governance. On
thorough examination of the details of
ALM activities submitted by the non-life
insurers in the FCR for the year ended
March 31, 2010, it appeared that these
details are incomplete and inconsistent.
As the mandate by the Authority was very
broad, each insurer had adopted their
own measures in reporting such details in
FCR. In this regard, the following
framework shall be put in place by the
insurers.
The guidelines shall be applicable to all
non-life insurers and reinsurers and shall
come into effect from1st April 2012.
CEOs of all Non-life Insurers and
Reinsures
Re: Asset-Liability management and
Stress testing
Part-I Asset Liability Management
I. Asset Liability Management:
3. Insurers shall have an ALM policy
approved by the Board of the insurer and
shall be submitted to the Authority within
90 days from the date of this circular. The
Board shall approve the Insurer's ALM
policy, considering the asset-liability
relationships, the insurer's overall risk
tolerance, risk and return requirements,
so lvency pos i t ion and l iqu id i ty
requirements. The Board shall regularly
review such policy at the year¬ end or at
more frequently, if required and submit to
the Authority any changes in the ALM
policy along with the FCR.
4. Insurers shall have in place effective
procedures for monitoring and managing
their asset-liability positions to ensure
that their investment activities and asset
positions are appropriate to their liability,
risk profiles and their solvency positions.
The insurers shall confirm compliance to
this requirement within 90 days from the
date of this circular.
5. The ALM policy shall, at the minimum,
enable the insurer to:
a. understand the risks they are exposed
to;
b. develop, ALM policies to manage
them effectively;
c. apply techniques appropriate for the
nature of their business, the risks they
undertake and specific/local market
conditions; and
d. measure the interest rate risk, in
particular, faced by the insurers and
thereby improving the assessment of
the asset liability management
strategies of the insurers.
6. The insurer shall examine all risks
requiring the coordination of its assets
and liabilities. The ALM framework shall
cover all the areas significant in terms of
their potential impact on economic value.
The economic value of asset or liability
cash flows, derived in such a way as to be
consistent with current market rices
where they are available, or using market-
consistent principles; methodologies or
parameters. These may include risks like:
i. Market Risk
a. interest rate risk (including variations
in market credit spreads)
b. equity, real estate and other asset-
value risks
c. currency risk
d. related credit risk
ii. Underwriting Risk
iii. Liquidity risk
7. The insurer shall develop and
implement controls and reporting
procedures for its ALM policies that are
appropriate for its business and the risks
to which it is exposed. These shall be
monitored closely and reviewed regularly.
8. All non-life insurers shall submit the
data with respect to, the assets and
liabilities in the format, Table-ALM-
Quarterly as per Annexure-1, on a
quarterly basis within 45 days from the
end of each quarter, starting from the
quarter ending March 2012 onwards.

ird
ajo
urn
alJ
an
ua
ry2
01
2
15
‘Table-ALM-Yearly’ shall be submitted
along with annual FCR.
9. ‘Table-ALM-Quarterly’ data shall be
furnished for:
a) Base discount rate, (as per yield curve
available on the date of annual valuation)
applicable and, with such base discount
rate increased & decreased by 1% and 2%
b) Further to the above details, the ‘Table-
ALM-Yearly’ shall contain the details of
impact on duration due to changes in the
following:
i) fall of 30% in Equity values, 100 basis
points fall in yield available on various
fixed interest securities, adverse deviation
of 10% in mortality/morbidity/claim rates
expenses, cancellation rates, renewal
rates and 50% (increase and decreasing)
in new business volumes independently.
ii) fall of 30% p.a. in Equity values, 100
basis points p.a. fall in yield available on
various fixed interest securities, annual
adverse deviation of 25% p.a. in
morta l i ty/morbid i ty/c la im rates ,
expenses, cancellation rates, renewal
rates and 25% (increase and decreasing)
in new business, during three years from
the report date independently.
10. Table-ALM data should be furnished
separately for ‘Fire’, 'Marine HII', Marine
Cargo, ‘Health’, ‘Motor-Third party’, ‘Motor-
Own damage’, ‘We/Employers’, ‘Liability’,
‘Public/Product Liability’; ‘Personal
Accident’, Engineering, and Misc classes of
businesses’. If the reserves held under any
line of business fall below 5% of total
reserves held at the recent annual
valuation of business, such line of
business need not be considered for the
preparation of above table.
Part 11- Stress testing
11. Stress testing helps insurers to
ascertain the potential level of
vulnerability to different scenarios, to
manage their risks and maintain enough
financial resources to manage them.
Stress tests enable insurers to study the
quantitative impact of different scenarios
and its affect on the solvency of an insurer.
The stresses may be financial, operational,
legal, liquidity based or be related to any
other risk that might have an adverse
economic impact on the insurer.
12. Stress Testing being critical in the
management of risks and the financial
soundness of the insurers, Authority vide
C i rcu la r No : IRDA lACT/C IR IMISC/
081/05J2010, May 13, 2010, has
mandated all the non-life insurers to
conduct stress testing and provide the
details in Chapter 14 of the Financia1
Condition Report (FCR).
13. On thorough examination of the
requirements, it has been felt necessary to
prescribe minimum requirements for the
stress testing. In this regard, the Insurer
shall submit Format-ST-NL (Annexure-2 to
this circular) as per the risk factors
described in Annexure-3. The amount of
deviation in the risk factors may be
considered as per the risk profile of the
insurer. However, the insurer shall submit
the results of stress testing with respect to
the scenarios based on the following
specific risk factors as stated below In
addition to the insurer specific deviations
in the risk factors described in Annexure-3.
a. Fall of 30% in Equity values. 100 basis
points fall in yield available on various
fixed interest securities, adverse deviation
of 50% in mortality/morbidity/claim
rates, expenses, cancellation rates,
renewal rates and 50% (increase and
decrease) in new business volumes
independently.
b. Fall of 30% p.a. in Equity values, 100
basis points p.a. fall in yield available on
various fixed interest securities Annual
adverse deviation of 25% p.a. in
morta l i ty/morbid i ty/c la im rates ,
expenses, withdrawal/lapse rates and
25% (increase and decrease) in new
business, during three years from the
report date independently.
14. Insurer's Board shall ensure timely
review of the issues emanating from
‘Table-ALM’ data and Format-ST-NL and
take such corrective action as may be
necessary under intimation to the
Authority.
15. The Appointed Actuaries may follow
Actuaria1 Practice Standards issued by
Institute of Actuaries of India in this
regard if any.
The circular is issued under Section 14 of
IRDA Act, 1999.
The amount of assets and liabilities in
each of the duration buckets as indicated
below should be furnished. Macaulay
duration should be used in this regard:
1. Discount rate used in arriving at
'Macaulay duration' of various classes of
assets and liabilities shall be furnished
separately.
2. Macaulay duration shall be computed
as below:
For cash flows of C1, C2, …….. Cn at times t1,
t2…….., tn respectively and with ‘d’
being discount rate, Macaulay duration is:
Annexure-1
Notes:
n
Ci(1+d) ti-ti
i=1
n
Ci(1+d)-ti
i=1

ird
ajo
urn
al J
an
ua
ry2
01
2
16
in the air
3. ‘Table-ALM’ data shall be signed by, Chief
Executive Officer, Chief Financial Officer
and Appointed Actuary,
List of ‘Risk Factors’ to be considered in
projecting financial and capital adequacy
positions over the one-year period
Immediately following .recent March 31.
1. Mortality/Morbidity/Claim rates:
adverse deviation in experience
2. Investment returns
(a) Yield curve
(i) Parallel yield curve shift
(ii) No change for duration less than 5
years, parallel shift for duration more than
5 years, linear interpolation
(iii) Parallel shift for duration less than 5
years, no change for duration more than 5
years, linear interpolation
(iv) Change in credit spreads
(b) Equity market
(i) Equity crash - fall in all market, by
market
(ii) Stock specific event risk - move in each
individual stock, by stock
3. Expenses: increase in expenses
4. Renewal rates: adverse deviation in
experience
5. New business: fall in new business
6. The appointed actuary shall also include
shock scenarios to company's experience
in the next projection year arising from
changes in:
(a) reinsurance ceded;
(b) reserving basis;
(c) exercise rate of policy options;
(d) distribution to shareholders; and
(e) taxation.
Annexure-3
As on:Table-ALM - Yearly
Macaulay
Duration
Base Scenario Assets in Rs. Liabilities in Rs Net Net, Hedged
(1/2/3/4/5) (000) (000)
Total
Under 1 year
1-2 years
2-3 years
3-5 years
5-7 years
7-10 years
10-15 years
15-20 years
20-25 years
Above 25 years
Table-ALM-Quarterly
Base Scenario Assets in Rs. Liabilities in Rs Net Cashflows
(1/2/3/4/5) (000) (000) (column 2-column3)
Total
Under 1 year
1-2 years
2-3 years
3-5 years
5-7 years
7-10 years
10-15 years
15-20 years
20-25 years
Above 25 years
Format-ST-NL
Scenario Value of Value of Value of Available Required Solvency
Parameters Assets Liabilities Solvency Solvency Ratio
Margin Margin
i
ii
Annexure-2

ird
ajo
urn
alJ
an
ua
ry2
01
2
17
7. The appointed actuary may also
consider any other factors that have
significant relevance to the insurer's
business.
List of ‘Risk Factors’ to be considered in
projecting financial and capital adequacy
positions over the three year period
immediately following recent March 31.
1. Mortality/Morbidity/Claim rates: yearly
deterioration in experience over the
projection period
2. Investment returns
(a) Yield curve:
(i) Parallel yearly yield curve shift
(ii) No change for duration less than 5
years, yearly parallel shift for duration
more than 5 years, linear interpolation
(iii) Yearly parallel shift for duration less
than 5 years, no change for duration more
than 5 years, linear interpolation
(iv) Change in credit spreads
(b) Equity market
(i) Equity dividend yield fall over the
projection period
(ii) Equity total returns deteriorate over
the projection period
3. Expenses: Yearly deterioration in
experience over the projection
4. Renewal rates: Yearly deterioration in
experience over the projection period
5. New business: Yearly fall in new
business income over the projection
period
6. Where material, the appointed actuary
shal l a lso inc lude scenar ios on
deterioration of company's experience
over the projection period arising from
changes in:
(a) reinsurance ceded:
(b) reserving basis;
(c) exercise rate of policy options;
(d) distribution to shareholders; and
(e) taxation;
7. The appointed actuary may also
consider any other factors that have
significant relevance to the insurer's
business.
Sd/-
Chairman
(J. Hari Narayan)
The 14 Global Conference of Actuaries (GCA) is being held jointly by the Institute of Actuaries of
India (IAI) and International Actuarial Association (IAA) between 19th and 21st February, 2012
at Mumbai. The focus of the conference would be “Meeting the Challenges of Change”.
This year’s conference would cover a whole gamut of topics which would be discussed and
debated by eminent global personalities from the world of insurance, education and
consulting. The inaugural Keynote Address on 20th February would be delivered by Mr. J. Hari
Narayan, Chairman, IRDA.
The conference would provide an effective platform for discussing the emerging global
scenario and the role of the actuarial profession.
th
14 Global Conference of Actuariesth
Dates:
19th - 21st February, 2012.
Venue:
Renaissance Mumbai Convention Centre,
Mumbai.

Are You Being Served?
'When a service is expected to be delivered, the provider should consider the rationale behind the
need for such a service. Mere fulfilment of a process does not help the cause and would eventually
lead to the detriment of the service provider in the long run' comments U. Jawaharlal.
ird
ajo
urn
al J
an
ua
ry2
01
2
18
vantage point
In the modern times, the way a service
is rendered to a client has come to be
seen as a more important factor than
the efficacy of the product itself. With the
emphasis that the global players are
putting on delivering the best services to
their clientele across all sectors, there is a
certain percolation of the effect – among
all the countries as also among all the
domains. The net result, accordingly, is
that we have had the occasion to witness
a tremendous growth in what is termed
collectively as 'customer service'.
Rendering the service in true spirit and not
merely going about the formality
religiously is the crux of the matter. The
regulators and supervisors world over
have also added their bit to the initiative
by defining various aspects associated
with rendering efficient customer service.
There have been several attempts in even
quantifying the ability of a service
provider in rendering various services.
'Turn Around Time' (TATs) in the domain of
financial services is an example of such
quantification, although it was originally
meant to be a measuring factor for the
efficacy of a computer programme. The
fact that it has provided various
supervisors the ease of assessing the
quality of services rendered by an
organization speaks volumes about its
usefulness. In India, banks were the first to
adopt the standards in the domain of
financial services; and somewhere along
the line, the other financial service
operators have emulated the example set
by them. If not anything else, the initiative
is bound to inculcate some discipline into
the working methods of organizations;
and to that extent it certainly increases
their efficiency.
In the domain of insurance, there is no
limit to the types of services that can be
rendered to the policyholders – especially
in light of the long-term nature of life
insurance business and the renewability
associated with the non-life insurance
contracts. However, there may be
occasions when the policyholder is not
even aware of the various formalities
associated with fulfilling some of these
functions. It is in this regard that the
proactive stance to be adopted by the
insurers in delivering the services to the
policyholder would define the level of
efficiency. Further, it would also be a
matter of great success for the insurers if
they ensure that the distributor
associated with each of the contracts
enlightens the policyholder about his or
her rights and obligations. Training the
distributors exhaustively with regard to
the services to be rendered to the
policyholders should take the priority in
the managerial functions.
'Policyholders' Services in Insurance' will
be the focus of the next issue of the
. Let us look forward to an
interesting collection of articles.
Journal
‘Policyholders’ Services in Insurance’in the next issue...

ird
ajo
urn
alJ
an
ua
ry2
01
2
19
issue focus
Intermediation in Insurance
The push nature of insurance sales:
In India, insurance is considered a
push sale product. This is not good
because when an insurer or intermediary
pushes a product, there is little choice that
is given to customers; and quite often,
over-commitments are made. The high
degree of sales push is evident from the
fact that in most cases it is the insurer's
employee or agents, who approach the
customer to sell the product. A large
proportion of urban India would have
received cold calls/SMS to sell insurance
products to them. As a result of such
market practices, more than 80% of all
non-life insurance transactions in India
are intermediated by the insurer itself or
its agents (the equivalent number in the
US is less than 40%). This indicates that in
India it is mostly the insurance company
that chooses its customers rather than the
other way round.
In an ideal situation you would want the
intermediary to make the customer aware
of the concept of different product lines
and then, based on a customer's unique
profile and needs, find the most suitable
insurer and product. However, the focus
of many intermediaries today is to
convince the customer about the benefits
of a particular product of a specific insurer.
As a result there are several cases of mis-
selling reported. In summary, this “push-
based” marketing approach has earned
the industry a poor reputation.
IRDA's guidelines have raised the
standard of selling but there is more to be
done:
IRDA has introduced several guidelines to
raise the standard of selling. This includes
the distance marketing guidelines
introduced earlier this year, the minimum
performance standards for agents, a
revamping of the training curriculum and
most recently the web aggregator
Abhishek Bondia suggests that in view of the several advantages that the Brokers’ channel brings to
the industry, there should be better ways of incentivizing it - in pursuit of overall higher standards.
- The Role of a Broker
In an ideal situation
you would want the
intermediary to make
the customer aware of
the concept of
different product lines
and then, based on a
customer's unique
profile and needs, find
the most suitable
insurer and product.
guidelines. A requirement such as
recording the solicitation conversation
over the phone forces the intermediary to
adequately train its staff and abstain from
malpractices. Despite such prudent
initiatives, the industry has a long way to
go. Some of the problems are structural.
Customers are often not provided the
option of choosing the best coverage for
themselves because of the prevalent
distribution framework in the country.
Two such examples are discussed below.
Take car insurance. Before one gets
delivery of the car, one must buy
insurance. Here is a situation when the
customer actively wants to buy a product
but runs short on choices. Almost all car
dealers have a tie-up with a particular
insurance company – often the key criteria
in choosing an insurance company is the
payment to the dealer rather than the
customer prices. In any case the insurance
cost is a small fraction of the car's
purchase price. When the customer
completes all the paper formalities, a
small portion of the bill gets directed to
the insurance sold by the dealer. Since the
tariff system was abolished by IRDA, the
cost of OD cover in motor has come down
significantly. If customers had access to
more than one insurer at the time of
purchase, free market competition would
have ensured a lower premium for the

ird
ajo
urn
al J
an
ua
ry2
01
2
20
issue focus
customer. Unfortunately in a majority of
the cases this does not happen.
A s i m i l a r s i t u a t i o n a r i s e s i n
bancassurance. Banks have unparalleled
access and trust of the customer.
Customers have a huge dependence on
banks primarily because of trade credit,
which is a key determinant of success of
the business. Because of this financial
dependence, a large proportion of
customers rely on their banker's advice to
choose the best insurance. However
banks are tied to only one life and one
non-life insurance company. This hinders
the bank's ability to provide choice and
holistic advice to its customers. Banks are
restricted to the service and commercial
proposition offered by a single insurer.
Apart from the manner in which
insurance is sold, the other challenge in
the industry is the type of product sold.
Invariably most salaried staff would have
some form of insurance. However these
are largely investment related products.
Consider this statistic: the non-life
insurance (which is largely risk cover for
health and assets) penetration is as low as
0.6% compared to developed countries
which have a penetration of 3-5%. This
indicates a lack of focus of the
intermediaries on pure risk cover.
:
Therefore, the need of the hour is to
further develop the independent broking
channel. Currently this channel is
underdeveloped. The UK is an excellent
example of how significant the broking
channel can be. London Economics
prepared a report in March 2011 that
reported that over 70% of general
insurance business was distributed
through brokers. In India, the equivalent
number is less than 10%. India has been
able to attract nine out of the top ten
global insurance companies, however not
even three out of the top ten global
The Broker channel in India is
considerably underdeveloped
brokers are appropriately invested in the
market. In the overseas markets, large
brokers are bigger in size and scale than
many insurers. There are several
international broking networks that exist
but have nominal presence in India –
Uniba Partners, WBNglobal, Wells Fargo
international brokers are examples of well
recognized networks with just a token
presence in India.
Establishing a robust broker channel has
three distinctive benefits for customers –
choice, expertise and customer servicing.
Each of these is elaborated below:
There are about 50 insurance companies
and as a result hundreds of product
options. Unfortunately the benefit of this
market diversity never reaches the
customers if they purchase insurance
through agents. Brokers by definition are
not tied to any one insurer and have a bias
to present as many options as possible to
clients.
Also, brokers have a unique advantage as
they can combine the life, non-life and
health insurance requirements of a client.
A robust broker channel has several
benefits for customers:
Choice
This allows brokers to work with relatively
smaller companies in a profitable manner.
Individual insurers and agents would not
have the same economies of scale in
serving small clients.
Another advantage is that a broker is not
constrained by the boundaries of General,
Health and Life insurance. Take the
example of Personal Accident covers.
These are offered as standalone products
by general insurers and riders by life
companies. A broker can look across all
these companies to pick the right option.
Health insurance is similar. Today Health
insurance is offered by the general
insurance, stand-alone health and life
insurance companies . There are
differences in offerings of these
companies. For example, most Health
insurance products offered by life
companies are fixed benefit, long-term
plans. This has the advantage of being
multi-year long term plans but the fixed
benefit may not fully cover the medical
expenses. A broker can explain the
nuances of these different product types
to a client and pick the most relevant
options.
Brokers are constantly exposed to people
and product offerings of different
companies. Brokers participate in training
programmes conducted by different
companies. A few brokers are part of
international broking networks. This puts
brokers in a unique position to
unders tand marke t t rends and
developments. A good broker will harness
this information to create deep market
expertise.
Such expertise has three main benefits.
First, brokers educate clients about
product options and then push insurers
hard to develop the appropriate products.
The result is a steady improvement in
product quality. Second, brokers can
express a client's case in a language that
Expertise
Take the example of
Personal Accident
covers. These are
offered as standalone
products by general
insurers and riders by
life companies. A
broker can look across
all these companies to
pick the right option.

ird
ajo
urn
alJ
an
ua
ry2
01
2
21
insurers understand. Quite often clients
are at sea when faced with all the
technicalities of insurance. Brokers bridge
this gap. Finally, the expertise is vital in
effectively managing the client's risk,
particularly in volatile times.
In developed markets such as the US and
UK, brokers attract the best and brightest
entrepreneurial talent. People who have
spent years in the industry take up the
broking profession because it provides the
highest level of customer service and
satisfaction. Entrepreneurs find that the
broking route provides them with
excel lent opportunit ies to serve
customers in an unbiased manner.
Because of the privileged customer–
broker relationship, the broker has to
build customer servicing capability. In fact
the ability of a broker to retain a client,
quite often depends upon its servicing
strengths. When an insurance claim is
made it is the broker who is always the
customer's champion and pushes the
insurer towards timely and appropriate
claim payment. No insurer or agent can
play this role adequately because of the
inherent conflict of interest between the
claimant and the insurance company.
Brokers offer several benefits to the
regulator as well. The strong customer
focus of a broker is an obvious benefit.
Moreover, primarily because of their deep
expertise, brokers can be a very effective
route to collate consumer feedback on its
guidelines and regulations. Brokers go
Customer Servicing:
The Regulator and Industry also benefit
from a strong broker network
through a rigorous screening process by
the regulator. Fly-by-night operators are
effectively screened out. Therefore, a
robust broking channel will result in fewer
customer grievances and mis-selling
issues. Last but not the least; brokers are
very effective in reducing the cost of
distribution. The experience in several
countries has been that intermediation
costs reduce as the broking channel
b e c o m e s b e t t e r e s t a b l i s h e d .
The most startling example of the impact
of broking is from the UK market where it
is estimated that broking accounts for 1%
of the UK GDP. If that were to happen in
India then broking would be larger than
the entire general insurance sector as it
exists today!
The role of the regulator in developing
the broking channel:
The IRDA has a significant role to play in
strengthening the broker's role in
industry. First, it should attract high
quality talent and capital in the channel.
The quality of the players will be the
f o r e m o s t d e t e r m i n a n t o f t h e
development of the channel. Second,
IRDA should incentivize focus on pure
protection solutions. The low ticket size of
pure protection plans and the current
commission structure results in small
absolute earnings for the channel. In the
backdrop of low consumer awareness, the
cost of acquiring a customer is high, hence
the current compensation does not
provide an economic rationale for
intermediaries to focus on such pure risk
products. Finally, in its developmental
role, IRDA can educate customers on the
advantages, roles and responsibilities of a
broker.
We are still in the early years of the
industry's growth in India. The best is yet
to come. We expect that over time the
market will mature and the broking
channel will develop with considerable
depth and robustness.
The author is Business Head –
Corporate, SecureNow Insurance
Brokers Pvt. Ltd.
Last but not the least;
brokers are very
effective in reducing
the cost of
distribution. The
experience in several
countries has been
that intermediation
costs reduce as the
broking channel
becomes better
established.

ird
ajo
urn
al J
an
ua
ry2
01
2
22
issue focus
Driving Microinsurance
Anand Pejawar opines that taking into account the low awareness levels of the rural masses, and
the large tie-ups that PSU banks have created over a period of time; Bancassurance offers an
excellent opportunity for the insurers to exploit the untapped potential.
- Through Bancassurance
“ aggressively looking at rural India for high growth rates. Several research reports state that
by 2020 India is poised to have largest youth population in the world and as we all know,
much of it will be from the rural hinterland of India.The real source of marketing promise
is not wealthy few in the developing
world, or even the emerging middle
income consumers. It is the billion of
aspiring poor who are joining the market
economy for the first time”.C.K.Prahlad
Rural India is the next ‘big’ opportunity.
Indian rura l market const i tutes
approximately 72% of total Indian
population even as of date. This is spread
across approx through 638,635 villages
across the states and union territories of
India. More than half of the Indian
population residing in these areas
hasseasonal income while the other part
of the population draws irregular income.
Majority of rural population is involved in
farming sector either directly or indirectly
(farming, marginal farming, and marginal
land labourers etc) and the balance of the
large population comprises of skilled
labourers; artisans which includes
carpenters, masons etc; and small scale
shop owners etc.
Non-agrisector like infrastructure
(construction, electricity, gas and water
supply), rural health services, education,
tourism, transport, communication etc.
are all exhibiting high growth rates.
Financial services providers like banks,
mutual funds, Life & Non-Life insurers,
card distributors, chit funds are
Looking at the spending pattern in Rural India, there is an immense scope for financial
services, including insurance services.
Research report of Oliver Wayman - 2008
Under 1515-6465+Total
Population Demographics
1400
1200
1000
800
600
400
200
02000 2005 2010 2015 2020
Po
pu
lati
on
(In
mil
lio
ns)
Healthcare &Personal care
Others1%
1%
7%
5%
6%45%
20%
10%
Communication
Education5%
Entertainment
Transportation
Housing
Food
Financial Services

ird
ajo
urn
alJ
an
ua
ry2
01
2
23
Distribution of Wealthy Households by Segments (2007)
14,000,000
12,000,000
10,000,000
8,000,000
6,000,000
4,000,000
2,000,000
0Ultra HNW Super HNW HNW Super
AffluentMass Affluent Mass Market
6,000 20,000 130,000 200,000800,000
No
.of
Ho
use
ho
lds
12,000,000
Traditionally, the banks (especially the PSU
banks) have been providing all the
financial security and stability to the rural
Spending pattern in India
Financial penetration in Rural India
Rural India is getting a large construction of mask market wealth.
Research report of Oliver Wayman - 2008
Though some of the data would be dated
the pattern is the same which we can see
today. This is a good indicator of what is
the current state of affairs in rural India. All
the above data clearly proves that the
higher need penetrated rural market
offers tremendous growth protection for
insurance companies both Life & Non-Life.
But to achieve the same, there is a need to:
a) Develop a cost effective financially
viable and sustainable distribution
channel with adequate regulatory
control mechanism;
b) Client awareness and confidence in
the product including the channel
through which it is distributed.
India. The loyalty factor of the rural
population in this segment is very high.
When we think of distributing of financial
products like Micro Insurance, which have
a long tenure (5 to 20 years) with low
premiums and which require continuous
and regular follow up in terms of
collections and servicing, the bank is an
excellent channel that can give financial
stability, viability, consistency; and provide
services by leveraging its trust and brand
equity with its customers.
The inherent strength of the bank can do
wonder in this channel as :
a) Banks, especially the PSU
banks, have the reach (approximately
37% of total bank branch operates in
rural area and are classified as rural
branches by Reserve Bank of India
(RBI). Another 23.66% of the branches
operate in th i s Semi Urban
demarcated areas in India by RBI.
b) Almost
95% of these branches operating in
Rural and Semi Urban India are
pertaining to PSU banks. They have
Reach:
Brand Equity and stability:
Penetration of Financial Services in India, 2007
1200
1000
800
600
400
200
0
Inm
illi
on
s
Total Populationof India
Total No of Bank A/Csin India
Total No of ActiveDemat A/Cs in India
Total No of Life/HealthInsurance Policies Issued
35000
30000
25000
20000
15000
10000
5000
0
31676
19213
1669315212
2009
32528
20771
1817116298
Rural Semi-Urban Urban Metropolitan
2010
Source: RBI Report 2010 - 11

ird
ajo
urn
al J
an
ua
ry2
01
2
24
issue focus
strong brand equity and stability
which infuses tremendous confidence
in the rural population.
C) Due to its very
nature of being PSU bank branches
which have entered rural India with a
social obligation of meeting the
financial inclusion objective, the
customer loyalty is very high. They
also disburse a lot of Govt. sponsored
programmes to this population which
requires this population to physically
visit the bank branches.
As these bank branches
operated in limited geography and
environment where usually population
does not exceed 10,000 the bank branch
officials are fully aware of the customer's
needs, both financial and protection
needs, as such this helps tremendously in
understanding the customer “needs” and
meet the same.
Very nature of
microinsurance means to offer protection
to low/irregular income household
Customer loyalty:
Knowledge of customers financial and
protection need:
Micro- Insurance:
against specific perils. This protection is in
exchange of affordable premium, which is
based on the likelihood and the cost of the
risk involved.
The cover so
provided should reduce the exposure and
multiple risks; soften the impact of natural
calamities and disasters; and provide an
Purpose of Microinsurance:
overall economic and psychological
security to the population.
We have
all seen tremendous synergy between
banking industry and life insurance
industry, the same synergy could further
percolate down to the rural India
population as a perfect combination
model of providing “one stop financial
solution” to the rural population, which
needs the most.
Today, many of the PSU
banks have promoted their own
insurance company (Life & Non Life) or
have tied up with some insurance
company as a corporate agent.
In addition to their own branch network
these PSU Banks also have another approx
15,723 branches of Regional Rural Banks
(RRB) jointly sponsored by various State
Governments, NABARD and these public
sector banks. These RRBs operate in
specific geographical areas and cater to
the specific rural population with
Insurance & Banking Synergy:
Possible route of distribution of
Microinsurance products through
bancassurance:
Due to its very nature
of being PSU bank
branches which have
entered rural India
with a social
obligation of meeting
the financial inclusion
objective, the
customer loyalty is
very high.
Details Strength Weakness
Commercial PSU &Private Banks
55 Commercial BanksWith around 22,000
rural branchesQuality resources
Lack of reach; focuson large accounts
Regional Rural Banks
117 RRBs, with15,000 branches
across 516 districtsand close to
62 million clients
Reach and relevantclientele
Quality of resourcesis an issue
Cooperative Banks111,777 SCBs across
Rural AreasGranularity
Very fragmentedstructure; Smallerclient base; poorresource quality
Bank Category

ird
ajo
urn
alJ
an
ua
ry2
01
2
25
specifically designed products in
agriculture and micro financing arena.
These rural bank branches of PSU banks
and RRBs are a wonderful vehicle for
distribution of Microinsurance products to
its customers giving tremendous benefits
and wing-to-wing customer service,
which is of prime importance in Micro
insurance.
In a typical Micro insurance product
(where the sum assured (SA) is between
`5000 and`50000), the premiums are
relatively very low as most of these
products are pure term or term with
return of premium. Some insurers also
offer products which are on Endowment
and Money Back platform in the market,
which also fall under the categorization of
Microinsurance. Here the premiums are
higher than that of term with the return of
premium and may not suit the
requirement of the targeted population
When such products are offered to
customers in rural India, it is only the trust
factor in the bank branches which is
leveraged to extend protection needs to
the customer. Taking these products to
the door-step of the customer, servicing
the same year after year, ensuring
collection of renewal premium and
targeting a simplified claims process is the
Taking these products
to the door-step of the
customer, servicing
the same year after
year, ensuring
collection of renewal
premium and
targeting a simplified
claims process is the
key to success in
distribution of such
products.
key to success in distribution of such
products.
A large number of PSU bank branches are
themselves hugely involved in the
formation Self Help Groups (SHGs) which is
a huge community that could be catered
through Micro Insurance products. In such
cases banks become an aggregator of
such SHGs, who in many cases are also
involved in lending towards the activity of
these SHG.
Challenges in distribution of Mirco
Insurance products: As is the case with any
other insurance product, even in Micro
insurance there are huge challenges that
are seen in the development and
distribution of such products:
a) Due to the very nature
of low premium products, it may not
be physically viable for insurance
companies to have their own offices to
cater to this population in rural India.
As such alternative distribution
mechanism, which has long term
perspective and well set regulated
Infrastructure:
Percent with Bank
Agricultural wage labour
Wage labour - non-agiiculture
Own account worker
Street vendor
Other self employed workers
Shopkeeper
Self employed in primaryProduction
Part time eamer
21,295
31,676
33,100
37,300
59,687
60,078
64,507
100,044
Agricultural wage labour
Wage labour - non-agiiculture
Own account worker
Street vendor
Other self employed workers
Shopkeeper
Self employed in primaryProduction
Part time eamer
14
25
25
39
45
49
50
67
Average Annual Income

ird
ajo
urn
al J
an
ua
ry2
01
2
26
issue focus
systems and procedures in place to
manage premium collection and
servicing is required.
b) Establishing
medical network in this area is another
challenge which then restricts the
development of certain types of
products, which could be offered to
rural population, which might
necessitate medical examination,
either pre or post issuance.
c) Manpower: The quality of manpower
available in rural India is low on
knowledge and capabi l i ty for
distribution of these products.
Secondly, rural markets are not a
preferred location for employment of
today's youth.
d) This is another limiting
factor and the challenge in servicing.
The technology factor is a huge
hindrance in remote underwriting and
printing of policy document.
e) Lack of
correctness of mortality data available
and veracity of lapsation data is
another huge challenge in this
segment.
f) Low awareness of life
insurance itself and specially its
products (the term, and term with
return of premium) is a huge challenge
in the segment. Low literacy rate,
misguiding products or channels of
distribution (multi level marketing
where people have lost money) have
created negative feeling towards such
products.
g) Mis-selling of
Medical Network:
Technology:
Actuarial Limitation:
Awareness:
Fraud management:
products and in the absence of a
structured collection mechanism,
misappropr iat ion of premium
collection is another challenge faced by
insurance company.
h) Logist ic barr iers in
conducting training programs in rural
area especially in the local language is
another challenge that needs to be
taken care of.
i) With the kind of
population in rural India, with
seasonal/irregular income, the design
of the products is a huge challenge.
The company has to ensure least
transaction cost, the factors in
difficulties in controlling moral
hazards, achieving minimum levels of
sales in spite of limited data and skills
for actuarial analysis and reinsurance is
a challenge.
From the research indices available and
the kind of movement banks (specially
Training:
Product Design:
PSU banks) have taken upto run the Govt.
s p o n s o r e d f i n a n c i a l i n c l u s i o n
programme, it has been observed in most
of the categor ies of customers
(depending on their Income levels, where
the annual income falls between `20,000
to `100,000)they have been banking with
some bank or the other. In such a scenario,
it is very easy to develop and design
specific product using the knowledge and
expertise of the banker in respect of their
customers and bring them into main
stream of insurance protection. This can
also been seen from the table given
below.
It is win-win situation for all the
stakeholders the customer, the bank and
the insurer in such a tie up.
a) Simple, affordable,
customer friendly products are made
available through the banking channel
which takes care of presale, sale and
post sale services. This becomes
extremely convenient for customer
specifically in the rural market.
b) An excel lent
opportunity for cross selling or
upselling comes in very handy for
customer retention and getting a
larger pie of its wallet. Also becomes an
excellent tool to earn non - interest
income in rural market where such
opportunities are very limited.
c) Helps to utilize the large
branch network of the bank to help
penetrate deeper into rural pocket in
the most cost efficient manner and
leveraging on the strength and brand
equity of the bank.
For the Customer:
For the Bank:
For insurer:
Simple, affordable,
customer friendly
products are made
available through the
banking channel
which takes care of
presale, sale and post
sale services.

ird
ajo
urn
alJ
an
ua
ry2
01
2
27
Technology Integration:
Simple Product:
Communication:
To help enable reach and provide post sale
services. Almost all banks are today
operating on core operating system. With
t h i s te c h n o l o g i ca l u p g ra d a t i o n
happening in banks, the insurer can
achieve perfect integration of the two IT
systems to provide the best of class service
and ensure efficient and regular collection
of renewals and also help in claims
settlement. It has been observed that
wherever banks and insurance companies
have been in a position to integrate their
IT systems, the penetration in the rural
markets have been deeper, collection of
renewals year after year have been better
and claims settlement has been faster and
efficient which is to the benefit of the
customer.
Strategy which would be most effective to
reach the desired target group is to have:
a)
Easy to understand
Easy to sell
Easy to administer
b)
All brochures, leaflets including
proposal forms to be in local
language.
�
�
�
�
No hidden charges or small lettering
which could confuse the rural
population
Plain, simple and easy to understand
communication.
c)
The process of pre sale, sale and post
sale have to be simple and efficient.
IT system in the bank should support
processing with seamless integration
with insurer's IT system.
d)
The premium charges on these
products have to be affordable to the
targeted population.
They should be structured in the
manner which should take care of
seasonality/ irregular incomes.
e)
Most important and critical aspects of
sale.
Needs to adequately educate the
sales force.
Equip them with necessary sales tolls
to help reach the customer.
�
�
�
�
�
�
�
�
�
Integrated process:
Affordable :
Reaching End Customer:
Untapped target for Microinsurance:
There is a huge population who are
categorised as belonging to Below
Poverty Line (BPL). The population, which
is today covered under the MNEREGA
scheme. Most of their payments happen
through the banking system and is a
perfect example of how this population
which needs the protection the most is
totally neglected. Apart from this we also
have large Self Help Groups(SHG)
operating in rural market, large
unorganized sector, daily wagers and
small organized group like weavers,
fishermen, toddy tapper, farm laborer
artisans etc., that can be tapped through
the sale of Micro insurance products
through the large Bancassurance channel.
The author is Executive Director, SBI Life
Insurance Co. Ltd.

ird
ajo
urn
al J
an
ua
ry2
01
2
28
issue focus
Need for Pro-active Participation
Avinash Singaraju observes that the core business of bankers and insurers being vastly different
from each other, they should strike a balance between the two if the Bancassurance channel is to
make good and sensible progress.
- Bancassurance
The complexity of the Indian
financial sector is growing rapidly.
The banking system continues to be
the most dominant segment of the sector,
and the country's financial stability has
been traditionally attributed to the
functioning of this segment. However, in
the more recent past, the other
constituent segment of the financial
sector viz., insurance is receiving due
attention for its contribution to the
financial stability of the economy as a
whole.
Infact, banking and insurance are two
different businesses, which pose different
stability concerns. Banks enjoy a special
position in the financial system that is
derived from their core activity in the
transmission of monetary policy, the
payment system and the reallocation of
savings to investments. The insurance
companies on the other hand act as a
conduit for households and firms to
transfer risks to entities that are better
suited to handle them. In this way,
projects are undertaken that might
otherwise be non-existent, and this
contributes to economic growth.
Insurance companies, like banks, mobilise
funds from households and firms; and
invest part of them in the non-financial
sectors of the economy. Thus the
interconnection between the two
segments from the perspective of
financial stability is leading to increased
interlinking between the two and the
traditional segmental borders becoming
blurred. This is clearly evident with
increasing number of banks entering the
insurance business and the enthusiasm of
insurance companies to empanel the
banks as their corporate agents to
transact business. A new channel
“Bancassurance” has thus emerged and is
growing more rapidly than all the other
channels of insurance marketing with
both insurance companies and banks
getting eager to exploit the large
database available with them.
In India, ever since espousing of financial
reforms following the recommendations
of Naras imham Committee , the
contemporary financial landscape has
been reshaped. Banks, in particular, strode
into several new areas and started
offering innovative products, viz.,
merchant banking, lease and term
finance, capital market/equity market
related activities, hire purchase, real estate
finance and so on. Thus, present-day
banks have become far more diversified
than ever before. Therefore, their entering
into insurance business is only a natural
corollary and is fully justified too as
'insurance' is another financial product
required by the bank customers.
Bancassurance, i.e., banc + assurance,
refers to banks selling the insurance
products. The term first appeared in
France in 1980, to define the sale of
insurance products through banks'
distribution channels (SCOR 2003). This
term is extremely familiar among the
European countries as banks selling
insurance products in most of these
countries are a common feature. Banks
The insurance
companies act as a
conduit for
households and firms
to transfer risks to
entities that are better
suited to handle them.
In this way, projects
are undertaken that
might otherwise be
non-existent, and this
contributes to
economic growth.

ird
ajo
urn
alJ
an
ua
ry2
01
2
29
are beingused as an effective alternate
channel to distribute insurance products
either as 'stand-alone insurance products'
or 'add-ons to the bank products' by way
of combining the insurance with typical
banking products/services. According to
IRDA, 'bancassurance 'refers to banks
acting as corporate agents for insurers to
distribute insurance products. Literature
on bancassurance does not differentiate if
the bancassurance refers to selling of life
insurance products or non-life insurance
p r o d u c t s . A c c o r d i n g l y , h e r e
'bancassurance' is defined to mean banks
dealing in insurance products of both life
and non-life type in any forms. Quite
reverse of the concept of bancassurance,
there is also a concept known as 'assure
banking' which refers to the provision and
distribution of financial and banking
services by insurance companies.
However, this concept is not popular and is
out of scope of the present discussion.
As far as banking sector's infrastructure is
concerned, only a few countries could
match with India for having largest
banking network in terms of bank
branches spreading almost throughout
the length and breadth of the country.
This is a direct outcome of the then
prevailing deliberate policy thrust
towards branch expansion. At end-March
2006, there were as many as 284
scheduled banks, of which 88 were
commercial banks and 196 were Regional
Rural Banks (RRBs). There were as many as
70,324 bank offices, of which, nearly 70%
of the branches were located in rural and
semi urban areas and the remaining
around 30% were in urban and
metropolitan areas. The number has only
gone up from then on. On the other hand,
the low penetration of the existing
insurance business is by and large
concentrated in and around the towns,
cities and metros and still a vast majority
of rural areas and even people in urban
unorganised sector are to be covered. It is
this contrasting situation that assimilates
the two systems by way of 'bancassurance
strategy' to reap the benefits of synergy.
This is an opportune time for both
banking and the insurance sectors to
come closer and forge an alliance for their
mutual benefit.
The concept of Bancassurance in the
Indian context runs practically on the
Referral model wherein the bank only
provides the leads to the insurance
company and does not get fully involved
in policy servicing. It is the insurer who is
responsible for policy servicing and the
bank is only an intermediary. In practice
however, there are a few areas where the
conflict of interest crops up occasionally
between the two partners viz., the banks
and the insurers that get addressed
provisionally but need a permanent and
mutually acceptable solution for all times
to come. A few of such sensitive issues
have been addressed in the forthcoming
paragraphs.
The banks play a dominant role in the
bancassurance model as they are the
prime distribution channel. The insurer is
many a times left to the mercy of the
sourcing channel i.e., the bank, thanks to
the cut throat competition in the
insurance domain and the difficulty of
obtaining profitable premium in the open
market. Since the premium income is
more or less assured from the bank and
that the claims experience is favourable in
general, the insurers often bend to the
demands of the banks even at the cost of
their own risk management philosophy.
Primarily with respect to acceptance of
risk, the insurers are often compelled to
accept their otherwise non-preferred risks
so as to protect their relation with the
bank.
With specific reference to the non-life
segment, banks opt for encouraging
insurance coverage to the assets they
fund so that the financial interest of the
bank is protected upon the occurrence of
any unforeseen event causing damage to
the property. Thus the bankers ensure that
all their loan accounts are protected by
insurance coverage. The valuation of the
asset thus gets governed by the quantum
of sanctioned loan and not the
reinstatement value or the market value
as the case may be. This becomes a gross
violation of “Principle of Average” and
subsequently affects the claim settlement
too.
A small example can be cited to explain
this process. A bank which advances a loan
for a residential occupancy gets an
insurance cover, typically a Fire policy for
the entire loan value to protect its interest.
However, it should be noted that the value
of the loan sanctioned includes the land
value in addition to the construction cost
whereas insurance cover restricts itself to
the construction cost. Thus, even in the
case of a total loss, the customer ends up
getting the value of construction cost and
not the full sum insured even though the
premium has been paid for the total value.
Another dimension to this aspect is that
the loan is not sanctioned to the full extent
of the property value but maximum to an
extent of 80% in general. In a different
scenario, for a customer who approaches
Primarily with respect
to acceptance of risk,
the insurers are often
compelled to accept
their otherwise non-
preferred risks so as to
protect their relation
with the bank.

ird
ajo
urn
al J
an
ua
ry2
01
2
30
issue focus
the bank for a part loan to augment his
monetary requirements above his
financial capacities, the bank again gets
insured the property only to the tune of
the sanctioned loan amount. This leads to
gross under insurance and it should be
noted that even the bank's financial
interest may be in jeopardy at the time of
a major loss incidence.
It should be noted that most of the clients
unless they have a dedicated risk
management system in place, are
unaware of the consequences of such
deviations in the valuation of their assets
and the insurers seldom get an
opportunity to convince either the bank or
the client as the latter are too pre-
occupied with their core activities.
Though the banks have started
participating actively in insurance
business only in the recent past, they have
been referring their leads to various
insurers for quite some time and there is a
laid down procedure for this process.
Many a times, mostly with respect to
industrial establishments, the loans are
dispersed in instalments or as and when
the client raises the request. However, the
existing process of getting insured the
loan disbursed does not accommodate
the facility for passing an endorsement to
include the enhanced sum insured or
inclusion of new assets in the existing
policies. Thus many policies are issued in a
piece meal manner for the same risk
facility only adding to the confusion at the
time of loss.
Another area of concern is the
determination of policy conditions which
is seldom taken care of in referral
bancassurance model. It is this area where
the insurer uses his intelligence to protect
himself. Increasing of applicable policy
excess, inclusion of voluntary excess,
exclusion of certain coverages are a few
areas which may go against the interest of
the client and the financial interest of the
bank itself if such terms are not clearly
enlisted. Since the volumes are rather high
and the average ticket size remains very
small, it is impractical to verify each and
every issued policy but a general
agreement upon predetermined
conditions applicable for various classes
of risks can be agreed upon by the banker
and the insurer right from the beginning
so as to address this issue amicably.
As the discussion continues, there can be
listed many such instances which need to
be addressed proactively by both the
bankers and the insurers so as to transact
the business of insurance in a fair and just
manner.
The bankers for whom selling insurance is
only an additional job, should spare more
time and provide proper and complete
information to insurer as it is ultimately
the reputation of the bank that is at stake
and the bank is only trying to add value to
its customer service by offering relevant
insurance coverages. A product with
wrong valuations, improper conditions
and lacking vital coverages only adds to
the sore experience of the client in case of
any adverse happening implying moving
away from the bank as well.
The insurers being professionals in this
domain should go the extra mile in
educating not only the concerned bank
officials at the operating level but also the
clients so that they get more involved in
the process of getting the apt coverages
with all correct parameters as a measure
to ensure prudent risk transfer thus
catering to the needs of the client as well
as covering the complete financial interest
of the bank.
To sum up, it can be said that
bancassurance model has a long way to
go in the progress of insurance business in
India and the active and prudent
involvement of both the banker and the
insurer would surely add to customer
delight and increased reputation to both
the parties. Also, since there are more
companies coming up in this particular
form of tie-ups between banks and the
insurers, providing the proper and
satisfactory service to the client remains
paramount to succeed in this ever
challenging environment. Course
correction at this nascent stage would
help to avoid the many troubles which can
crop up as the market becomes more
complex.
Though the banks
have started
participating actively
in insurance business
only in the recent
past, they have been
referring their leads to
various insurers for
quite some time and
there is a laid down
procedure for this
process.
The author is Underwriting Manager -
Corporate & SME, SBI General Insurance
Co. Ltd. The views expressed in the
article are his own.

Picture Perfect
Bancassurance: Change is the only
constant
Banking in India has a long and rich
history. Global economic history indicates
that it was trade with India for its primary
produce that created the major global
banks of the late 19th and early 20th
century. The nation that was the causal
factor of global banking is, even as of
today, struggling to achieve a respectable
level of financial inclusion for its citizens.
While the banking regulator is seeking
punitive regulations and enforcement to
improve the penetration, it has been
averse to increasing competition in rural
banking (relaxing bank licensing norms
for exclusive rural banking organizations).
This however, is another debate for a
different audience.
Internationally, it was probably the fabled
concept of the “Man from Prudential”
from the mid 19th century which,
seemingly, evoked the concept that
agency was considered as the core
distribution channel. For a considerably
long period of time, this remained the
case. While banking increasingly became
the ‘financial house physician’ of the
classes, the concept of agency as the
primary channel for insuring the masses,
remained. Over time the masses became
as important for a healthy banking system
and regulatory recognition of this fact too,
allowed the bankers to channel insurance
products.
To look at the banker’s relationship with
their customers, the stages can fairly be
divided into two, the wealth accumulation
and the wealth consumption stages. The
bank’s profits from the customer would
cont inue to r ise in the wealth
accumulation stage and drop down in the
wealth consumption phase. The financial
services profits however, would continue
to linger and reduce only gradually as
shown in the figure below.
Rohan Sachdev throws light on the strengths of the Bancassurance channel operating in more
developed markets that can set a trend for the Indian insurance market in the years to come.
- The International Bancassurance Experience
While banking
increasingly became
the ‘financial house
physician’ of the
classes, the concept of
agency as the primary
channel for insuring
the masses, remained.
Figure 1: BFSI profits and Customer Life Stage
Advice Continuum
Wealth Accumulation Wealth Consumption
Life & Pensions
Personal Loan
Margin Lending
Investments
Risk Ins
Home Loan
Savings
General Ins
FinancialServicesProfits
TraditionalBank Profits
PR
OFI
TP
ERA
NN
UM
Annuities
Equity Release
Income Drawdown
Inheritance Planning
AGE 45
ird
ajo
urn
alJ
an
ua
ry2
01
2
31

ird
ajo
urn
al J
an
ua
ry2
01
2
32
issue focus
Since IRDA opened up Bancassurance and
corporate agent channel for insurance
distribution, the segment has stayed at
the forefront of sales and distribution for
the private life insurers. With a wide
presence through its branch network,
Bancassurance provided the basic launch
pad for insurance products. The banks
have found this instrument a steady
source of fee income from retail clients,
especially the mass and mass affluent
segments. The insurers found a way to
take on the monopoly of the sole public
player with sizeable distribution.
The insurance regulator’s focus on
intermediation of insurance products and
s p e c i f i c r e c o m m e n d a t i o n s o n
Bancassurance makes us take a focused
look at Bancassurance models. Given that
the public player has little or insignificant
presence in Bancassurance and corporate
agency segment, the proposed new
regulations could further fragment the
private players, most of whom play a
second fiddle to the public sector giant if
not just maintaining a toehold.
Looking at these global models would
give us some insights into the progress of
Bancassurance the world over and help us
paint the canvas of the shape of things to
come. The focus would be on the
developed and the emerging markets.
Study of underdeveloped markets would
not assist the decision making and
strategic thinking for practitioners in
Indian Insurance.
It would be appropriate to consider
Europe as a shape of things to come, given
their centrist approach to economic
planning, rather than the American (US)
model. On the developing market front,
we would consider emerging and large
economies of Asia Pacific and Latin
America (including Brazil). The reason for
exclusion of Africa from our study is the
relative underdevelopment. Africa can
provide deep insights, but those would be
in segments that need not necessarily be
currently relevant to the Indian Insurance
practitioner.
The kaleidoscope: What we see
Largely, Bancassurance can be split into
three models: viz., Distributor (A bank
which sells the products), Partner (Bank
with a JV agreement with insurer) and
Owner (A bank which sets up insurance
subsidiary).
These segments of Bancassurance can be
classified further with the level of
integration between the banker and the
insurer on the customer life cycle. This
integration could be as basic as passing on
the lead to the insurer or could extend to
closing the sale and data entry as well as
providing post sale services to the
customer. A rudimentary product for basic
‘distributor’ would be the MRTA (Mortgage
Reducing Term assurance) which holds
ease of sale by the banker: The key issue is
the explanation to the customer in simple
terms on the product’s purpose and
concept. Other easy to sell products like
single premium wealth plan which can be
explained in the same manner as a long
term fixed deposit at a bank would also be
featured through such a segment of
Bancassurance model.
Deeper integration can enable the
banking force to be trained on more
complex products and use the electronic
tools to sell as well as collect premium and
make data entry on the policy proposal.
The ease of introduction of the products
and the scalability of sales are the primary
considerations while opting for the
“Partner” or “Owner” model where costs
and start-up time could be higher for both
the banks and the insurers, but offer
considerable control.
It was in the early 70s that lenders in
France came up with the idea to bypass
the middlemen to provide loan protection
i n s u ra n ce fo r t h e i r c u s to m e r s .
What started then was in the early 80s
taken up in Spain in a big fashion with
banks buying insurers. Until quite some
time, it was a financial decision with banks
not legally permitted to sell insurance
until 1991.
E u r o p e n o w h a s t h e h i g h e s t
Bancassurance penetrat ion rate
anywhere in the world, with the share of
distribution accounting for more than
50% of the premiums in many of its
markets.
The latest figures indicate that across
Europe, brokers with 32% market share
and Bancassurance with 30% market
share lead the agency at 26% by a narrow
margin. The remaining share belonged to
direct sales. Life insurers in the medium
term would move away from agency to
direct sales. Regulatory changes are
expected not just to impact the agency
sales, but also impact Bancassurance.
Country-wise, UK, Netherlands, Germany
and Greece are below the 50% mark in
terms of Bancassurance contribution to
the premiums. Portugal, Spain, France,
Belgium, Netherlands, Norway, Italy and
Finland are al l countries where
Bancassurance contributes more than
50% of the premiums.
In terms of the models, there seems to be
a north-south divide. Germany, UK and
Netherlands have the ‘distribution’ mode
with banks acting as a commission paid
distributor. Italy, Spain and Portugal with
high Bancassurance penetration run the
‘partnership’ model of joint ventures. The
‘ownership ’ model of insurance
Shape of things to come: The European
experience
Looking at these
global models would
give us some insights
into the progress of
Bancassurance the
world over and help
us paint the canvas of
the shape of things to
come.

ird
ajo
urn
alJ
an
ua
ry2
01
2
33
subsidiaries is more popular in France and
Belgium.
Basel III norms may lead to some banks
opting to sell insurance from multiple
partners to make effective use of capital.
Local and Euro level efforts to reduce or
ban product bundling of insurance and
bank products is also expected to impact
the Bancassurance sales. Some of these
c h a l l e n g e s m a y c o m p e l t h e
commoditization of certain product
categories increasingly pushing sales
through internet channels.
Before we step into the truly emerging
markets, it would be worthwhile for us to
make a note of two Asia Pacific markets
that are relatively mature even if they are
not quite sizeable to the rest of the
comparators: viz., Hong Kong and
Australia. Bancassurance has been a
successful strategy in Hong Kong with four
organizations including a Hong Kong
/ L o n d o n b a s e d g l o b a l b a n ke r
commanding a large share of the market.
Australia is not too different with four of
the biggest banking corporations
garnering 43% of the share of premiums.
In other mature markets like Singapore,
Bancassurance commands lower levels of
27%.
In the emerging markets of Asia Pacific,
the regional regulators are expected to be
influenced more by the actions in Europe
rather than in the United States. So the
path adopted between the IFRS and
Solvency II seems more specific to the
regulator within the specified country.
However, at an overall level, it would be
interesting to see how US reporting
obligations would approach areas of
significant divergence.
These capital requirements, along with
high growth make players in these
markets seek more capital, be it for
organic expansion or for mergers and
acquisitions of players unable to keep up
with the changing rules of the game.
However, it needs to be considered that
Sunrise in the emerging economies:
Look to the East
except for China where the foreign players
have insignificant share of the market, the
foreign partner would hardly accept a
withdrawal from a major growth market.
(China’s foreign Life insurers hold less than
2% of the market, India has a 26% cap on
the FDI, Thailand has increased it to 49% ,
Malaysia has it at 70%, Indonesia: 80%
and Philippines and Vietnam at 100% ).
Although China represented a 44%
growth in Bancassurance premiums in FY
2010, this stood comparatively better
than agency at 17% and short of the
phenomenal growth showed in the
internet insurance space. The figures for
Malaysia and Thailand come at a low 45%
and 30%. In Indonesia, the premium
collected from Bancassurance would be in
the range of 44%.
The players who remain in these
emerging markets are expected to bet
significantly on leveraging the IT practices
of developed (especially) European
models to enable insurance penetration
The players who
remain in these
emerging markets are
expected to bet
significantly on
leveraging the IT
practices of developed
(especially) European
models to enable
insurance penetration
piggy-backing on the
penetration of mobile
banking and other
technologically
enabled financial
solutions.
piggy-backing on the penetration of
mobile banking and other technologically
enabled financial solutions.
In China, the premium is generated
primarily from the four urban centers of
Beijing, Shanghai, Guangzhou and
Shenzhen, which contribute to more than
50% of the premiums. However, rapid
urbanization indicates that insurers
would focus on the tier 2 and 3 cities
which are expected to urbanize sooner.
Bancassurance contributes to 30% of the
premiums, though the regulator, China
Insurance Regulatory Commission (CIRC)
is expected to promote alternate
distribution channels like internet and
t e l e m a r k e t i n g , e v e n t h o u g h
Bancassurance has nearly 30% market
share. This is also supported by the fact
that there are over 100,000+ bank
branches and post offices selling
insurance products.
Some of the growth boosters for
Bancassurance is the potential for future
partnership / ownership model due to the
actions of the banking regulator CBRC; and
CIRC in 2009 - since the precedence over
five major Chinese banks have invested in
insurance companies and a major private
insurer has invested in a bank.
The significant Latin American markets for
foreign insurers are Brazil, Argentina,
Mexico, Venezuela and Chile. The region’s
insurance penetration is in the range of 2
to 4%.
Though Brazil holds the largest insurance
market population in Latin America (with
nearly 50% of premium collection for the
region), its 200 million population is much
smaller than that of India or China.
Liberalization has been a recent event in
Brazil and foreign insurers are a recent
phenomenon, even if they have already
managed to capture a good 20% of the
market. As compared to India or China,
Brazil has a large middle class population
at 50% of its population (as defined by the
Carnival of colours: Emerging markets
of the Americas

ird
ajo
urn
al J
an
ua
ry2
01
2
34
issue focus
annual income between 600 and 2,500
dollars earned per month).
Its chief similarity to China is that
Bancassurance plays a predominant role
in distribution with nearly 80% of
premiums coming from it. This is also due
to the fact that insurers are not allowed to
sell insurance directly. Major banks in
Brazil operate in the insurance markets
through fully owned subsidiaries.
However, it has been slow to be
responsive to the lower economic strata's
insurance needs. Given the rising
influence of the bankers on the citizenry
which is increasingly involved with it,
Bancassurance in Brazil should be able to
deliver Life insurance and pensions and
further penetrate the market.
Bancassurance is quite mature with a high
degree of integration between the banks’
and the insurance companies’ processes
and systems, with bank staff involved not
just in sales, but also in sales force
automation, simulator and calculator
usage, premium collection, data entry etc.
The products sold through the banks are
designed for simplicity to increase the
ease of training for the bank staff. Bank’s
fee income earned through commissions
is bolstered by persistency related
bonuses.
Trailing Brazil at a distant second is the
Mexican market with similar 2-3%
penetration of life insurance. Mexico
garners nearly 20% of the premiums of
the five major Latin American insurance
economies. Though economic growth in
Mexico has been directly impacted by the
global slowdown, Mexican economy has
shown relative stability. This and the
impetus on retirement savings is expected
to keep the Mexican markets on the
growth trajectory.
Bancassurance is the predominant
channel, especially for pensions and life
insurance and other channels like
independent brokers, direct marketing
offer significant premiums. Similarity with
the Indian market is that both life &
g e n e ra l i n s u ra n ce p l a y e r s c a n
manufacture health and accident policies.
In addition, Mexican GI and LI players both
cover group life policies.
Chile comes in at the third spot with 7%
co n t r i b u t i o n to t h e p re m i u m s .
Bancassurance is not a significant
contributor in this country which has a
higher penetration level at 6-7%. Life
insurance premiums come largely from
direct sales and independent agents.
Argentina rakes in 4% of the premiums,
and has a penetration at 3-4% in line with
most Latin American markets. Although
Bancassurance exists, its contribution is
not as significant as independent agents
and brokerage firms which deliver 75% of
the premiums. The high degree of
competition in this segment results in
high policyholder turnover. Insurers
reduce prices and increase commissions
to retain the customers impacting the
underwriting results and profitability.
However, the predominant factor in
Argentina is the government and the
country risk. In 2008, the market was
shrunk in one swell foop with the
Government nationalizing the pension
fund assets to protect them from risky
investments. This sharply reduced the size
of the life and pensions market.
Incredible India: Lessons learnt
Globally, the most difficult part of
insurance is the ability to reach the retail
customer in a cost effective manner. The
underlying assumption that an insurable
person would be financially included
implies that the bank network would have
reached the person to offer basic banking
services. It is logical to hence assume that
increase in insurance penetration, in a
cost effective fashion, will be through the
Bancassurance route at least for the basic
products.
This puts in a need for seamless sales and
service offering to the customer. The
Bancassurance products need to tailor to
the customer segmentation of the banks
(rather than the segmentation of the
insurer) and demand simplicity of product
concept and purpose (even for complex
back end structures).
Fragmented approach to Bancassurance
by any banker would be of disservice to
the customer. This would imply inherent
complications in the bank staff’s ability to
understand the products; execute the
processes required as well as use
appropriate sales and service tools. The
resulting proposition to the customer
would be as obscure as the banker’s
understanding of the offerings.
Sole dependency on the banks as the
channel of growth would inherently
increase the market risk for insurers until
sufficient customer base is gained. Apart
from the banks, corporate agencies
provide a sufficient scale for insurance
penetration, albeit not as large. Direct
channels would be cost effectively run
only by sizeable insurance player with an
integrated customer view. The more
complex product offerings would be
easier sold through direct channels by the
insurer. For the rest, a cost conscious
variable agency and brokerage channels
remain the options of presence and the
internet market as the nascent channel.
Major banks in Brazil
operate in the
insurance markets
through fully owned
subsidiaries. However,
it has been slow to be
responsive to the
lower economic
strata's insurance
needs.
The author is Partner & Leader
Insurance, National Leader - Actuarial
Services, Ernst & Young.

ird
ajo
urn
alJ
an
ua
ry2
01
2
35
Trailblazers in Distribution
Assurance from agents:
Why an agent is indispensable -
Insurance
has been always a ‘matter of
solicitation’, even though many
people would like to believe that it is a
matter of persuasion. The life insurance
market in India is undergoing a lot of
changes that may eventually lead to how
consumers will purchase life insurance.
Today, insurers use various distribution
channels, and even though some people
would love to hate them for their
persistent follow-ups, agents are the most
preferred source for buying life insurance
policies.
In India, agency sales accounts for 85 per
cent of new business premiums. In a
customer-centric industry like life
insurance, it is a business imperative to
constantly enhance the customer
experience to ensure retention and to
build loyalty. The first point of contact for
the customer is the agent and hence the
guide to the customer for providing sound
solution.
Low financial literacy and poor access to
financial services in India pose a problem
in penetration of the right kinds of life
insurance products - more in terms of the
• They usual ly enjoy personal
credibility with customers.
• They provide various pre-sales and
post sales services to customers.
• Due to personal contact, agents can
provide valuable feedback about the
need and expectation of consumers.
This helps insurers to develop new
products.
Customers struggle with various elements
of the decision process when buying life
insurance - the most difficult decisions
being:
• Determining whether they are
getting their money’s worth
• Understanding the policy details
• Determining what type to buy
• Deciding how much to buy.
Agents help in all these decisions through
various well researched tools provided by
life insurers. Agents play a very important
role in selling various policies to
prospective customers. He is that
person who acts as a mediator
right mix of savings and protection. This is
combined with the fact that consumers
lack understanding of the true purpose of
life insurance. Consumers are not clued in
about their life stage needs, and the
product solutions suitable for such needs.
The merits of agent advisors are:
Rajender Sud emphasises that in view of the low awareness levels in the Indian domain, there is
need for a lot of personal advice at the time of selling a policy to a prospect and insists that it is the
agent who is best-equipped to deliver the goods.
- The Agency Channel
In a customer-centric
industry like life
insurance, it is a
business imperative to
constantly enhance
the customer
experience to ensure
retention and to build
loyalty.

ird
ajo
urn
al J
an
ua
ry2
01
2
36
issue focus
between the life insurer and the
policyholder. With the market flooded
with life insurance products of various
companies that are almost similar,
customers are bound to be confused.
It is the agent who opens the knots of
confusion from the customer’s mind
and suggests the most suitable plan
after analysing customer needs and
financial state.
Each family has its unique set of
financial issues. That is why, it is
important to share with the agent
about the familys needs, aspirations
and current state of financial affairs
Individuals in the market for life
insurance are much more likely to
purchase life cover if through the need
analysis an agent is able to
recommend the amount of protection
cover required by the individual
What an agent can do after he gains
the knowledge about the customer
need
The agent will work with
the customer to identify and prioritise
his life stage objectives
Based on need-based analysis the
agent will be able to offer life
insurance products that will help the
customer achieve his long term
savings and protection goal
Strategies need to be adjusted
:
:
.
:
,
.
;
:
.
.
Analyze and review needs of the
customer
Offer services to achieve that goal
Monitor progress provide ongoing
service as customer needs and
situation change over time
periodically as your life changes The
agent will work with the customer
over the years to help you to be on
track with your changing needs
A research by LIMRA has shown that
consumers prefer to buy life insurance
face-to-face Life insurance buyers
who meet face to face with the agents
are the most likely to buy about 7
out of 10
On the other hand, life insurance
buyers who use only the Internet
while buying a product and never
meet with anyone are the least likely
to buy after the transaction - only 36
percent bought Those consumers who
started shopping on the Internet and
then met with an agent advisor were
1 5 times more likely to buy than
those who only bought products
online
.
.
.
,
.
.
.
.
It is expected that
the customer is
candid with the
agent advisor after
all he is not a mind
reader At the same
time the customer
should be able to
ask questions and
get detailed
explanation of
everything the agent
says
;
.
,
.
Not surprisingly, 41 percent of
consumers said life triggers - getting
married, buying a home or planning
for children’s future or experiencing
the death of a relative or close friend -
were the reason they began to buy life
insurance. If the agent already has
enough information about the
customer, he will automatically know
about the changed scenario and
suggest correct insurance policies
But many consumers will initiate the
process on their own One quarter of
life insurance buyers consider buying
life insurance products because an
agent initiated contact or suggested
the need for life insurance
Should customers understand life
insurance better to address the issue?
Mis-selling, whether it is a life
insurance policy or any other product
has a lot to do with the awareness of
the customer while purchasing a given
product and the quality of
communication between the
manufacturer of the product and its
eventual buyer It is this aspect of
communication that needs to be
addressed vigorously to ensure that
customers purchase a product that
truly meets their requirements
It is expected that the customer is
candid with the agent advisor after
all he is not a mind reader At the
same time the customer should be
able to ask questions and get detailed
explanation of everything the agent
says
.
.
.
Agents and Mis-selling:
,
.
.
;
.
,
.

ird
ajo
urn
alJ
an
ua
ry2
01
2
37
Insurers should adopt measures that
will increase the awareness of
customer on insurance so that they
are able to take informed decisions
This can help achieve a drastic
reduction in the number of insurance
related controversies
IRDA has made it mandatory for
agents to attain persistency of 50
from this year The benefit of the rule
is that high persistency can only be
attained by an agent through reduced
mis-selling of insurance products and
improved services In many cases
the policyholder decides to discontinue
the policy as it does not serve the
purpose for which it was bought
With the new guidelines agents will
be forced to suggest products
according to the customers needs It
will also improve the quality of advice
to customers
Life insurers have also started focusing
on Life Time Value of customers and
train their agents accordingly
Researches reveal that every individual
buys 6-7 policies during the life time
and it is much easier to sell to an
existing customer Agents need to
understand the negative implications
of mis-selling
It is easy to get advice from anyone
on anything. But it is the quality of
advice that is important. The main
reason for dis-satisfaction among
insurance buying customers is that
they are not completely convinced
about what they have bought.
.
-
.
%
.
. ,
.
,
.
.
.
.
.
The Ideal advisor - Quality of advice
Advising individuals on a variety of
financial needs can be a tough ask It
requires the agent to first identify
specific needs of the individual - that
are unique and then design solutions
that help meet these needs The
needs can be linked to the life-stage
and lifestyle of the person For
instance a young professional who
has recently married will require life
protection at a minimum to protect his
loss of income and to cover his
exposure toward any housing loan that
he may have taken On the contrary
a senior manager in an organization
may be looking for wealth
accumulation and retirement planning
having already taken care of his basic
life insurance requirements Similarly,
for an affluent businessman, insurance
can help save taxes and provide an
investment avenue
Life insurance is an intangible product
and hence it is important for the
.
,
.
.
,
. ,
.
.
Life insurance is an
intangible product
and hence it is
important for the
agent to be able to
provide comfort with
pre and post sales
service. A quality
financial advice can
help customers in
many ways.
agent to be able to provide comfort
with pre and post sales service. A
quality financial advice can help
customers in many ways. The agent
gives advice to the customer based on
• Understanding the life stage needs of
the customer
• A realistic picture of the customers
financial future or risks
• Information on how to manage the
risks
• Information that will help the
customer consider the financial
options
However, there cannot be a one package
that suits all. Each customer will have
different needs, even if they have some
common factors. Hence, each parameter,
such as age, dependents, background,
and family has to be measured before
giving any advice to the customer.
Insurers can develop tools that can be
used to measure a customer profile by
feeding in some basic data. This will
enable the agent advisor to understand
and offer products that will fit the
customer.
The main constituents for quality of advice
are:
If the customer has
more than one need, it is important to
highlight and advice on all their needs.
Asses the customer’s affordability and
explain the potential results.
It is important to
understand the risk taking ability of the
family and accordingly recommend either
a ULIP or traditional product.
Need based advice:
Risk Profiling:

ird
ajo
urn
al J
an
ua
ry2
01
2
38
issue focus
The author is Director and Head,
Agency Distribution, Max New York Life
Insurance Co Ltd.
Changed circumstances:
Regulator’s role in agency distribution
Agent and Training
The needs of
the customer change with each of his life
stages. The agent has to ensure that the
customer is aware of the facts and
recommend products based on the
changes in the customers life.
The regulatory changes that have been
implemented in the past two years
included ULIPs regulation that brought in
a price control taking flexibility away from
life insurers. This influenced distributors’
commission. In fact, India has now the
lowest commission rates for agent
advisors. It is imperative for agents to be
motivated as they are the faces of life
insurance companies and provide vast
reach. In order to build a career-agency
model, adequate compensation is critical.
The regulator (IRDA) has also tightened
the performance criteria for agents in its
effort to improve the persistency ratio in
the industry. The agents have to ensure
that the average annual persistency ratio
should be 50 per cent. Though good for
the industry in the long run, this poses a
challenge for many agents in the interim.
Another big challenge is attracting
committed and quality talent to the
industry. It is important to have good
quality sales managers and agent
advisors to ensure need-based selling and
right-selling. This will require behavioural
change in agent advisors so that products
are not mis-sold. Life insurers need to
impart training to advisors to address this
challenge.
An agent represents the 'principal' - the
insurance company before the customers.
He is the face of the organization and the
customer reposes immense trust on the
agent in a variety of ways. The customer
expects the agent to suggest him
solutions that help him meet his financial
goals that are due sometime in future.
This in turn, expects the agent to make a
conscious and diligent attempt to
understand the needs of the customers in
a unique and differentiated manner.
Further, the customer expects the agent to
know the details of the products and
solutions that he is recommending in
relation to other equivalent options
available in the market. Since insurance
products and solutions are designed to be
of long tenure - 10 years and longer - the
customer expects regular advice from his
agent to manage his portfolio of
insurance in the best possible manner.
This would entail regular (at least once
every year) portfolio review and
suggestions to augment the current
portfolio in relation to his family situation
and life stage needs. An agent who stays
in regular touch with his customer -
reminds him of the need to continue the
policy by paying the renewal premiums -
contributes in a significant way to ensure
retention of the customer. This is critically
important for the benefit of all three
entities - the customer, the agent and the
life insurance company. Preparing the
agent to do an effective job at all customer
interfacing opportunities mentioned
above requires regular training and
practice to develop the necessary skills.
Therefore, it is extremely desirable that
the agent is trained properly and can
address the needs of his customers over a
long period of time.
The process of educating people, on
protecting the future of the people they
love, is ongoing and our belief is that by
training our sales force to sell insurance in
a need based, ethical manner, holds the
key.
By training agents, insurers not only
guarantee proper advice for customers,
they also generate employment by means
o f a g e n t e m p l o y m e n t . Yo u ’ v e
undoubtedly heard the saying “A little
knowledge can be a dangerous thing,”
and in my experience, that’s often true. A
trained agent advisor helps the insurer in
building brand image among customers
for long term and in turn secures their
own future.
The customer expects
the agent to know the
details of the products
and solutions that he
is recommending in
relation to other
equivalent options
available in the
market.
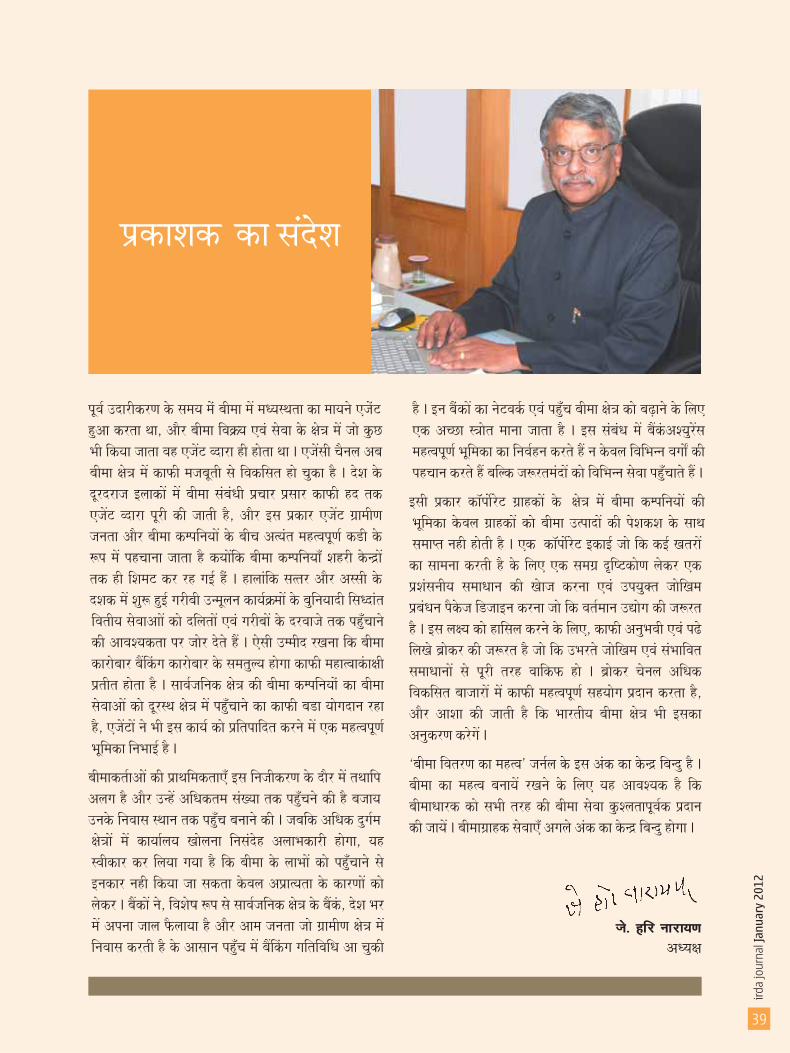


ird
ajo
urn
alJ
an
ua
ry2
01
2
47
statistics non-life insurance
Report Card: GeneralGROSS PREMIUM UNDERWRITTEN FOR AND UPTO THE MONTH OF NOVEMBER, 2011
INSURERNOVEMBER APRIL-NOVEMBER
2011-12 2010-11* 2010-11*2011-12
GROWTH OVER THECORRESPONDINGPREVIOUS YEAR
Note Compiled on the basis of data submitted by the Insurance companies* Figures revised by insurance companies
( in Crores)M
Royal Sundaram 114.10 98.29 954.97 738.45 29.32
Tata-AIG 131.79 87.19 1118.41 793.45 40.96
Reliance General 129.50 125.02 1146.45 1075.05 6.64
IFFCO-Tokio 145.49 132.31 1292.22 1184.77 9.07
ICICI-lombard 440.29 270.81 3394.95 2814.45 20.63
Bajaj Allianz 246.13 213.71 2121.64 1867.11 13.63
HDFC ERGO General 144.53 95.56 1187.65 835.78 42.10
Cholamandalam 120.06 82.86 902.51 646.71 39.55
Future Generali 73.11 39.25 601.14 388.37 54.78
Universal Sompo 43.59 20.75 252.00 188.23 33.88
Shriram General 108.40 67.75 742.15 453.23 63.75
Bharti AXA General 70.77 43.87 530.22 340.49 55.72
Raheja QBE 2.10 0.68 13.90 5.34 160.30
SBI General 16.55 1.38 133.57 11.81 1031.22
L&T General 11.32 1.01 84.53 1.71 4839.19
Star Health & Allied Insurance 38.21 8.36 806.96 789.31 2.24
Apollo MUNICH 21.90 21.15 212.13 124.36 70.58
Max BUPA 6.94 1.94 60.05 12.48 381.34
New India 572.32 486.10 5546.40 4674.77 18.65
National 582.06 476.08 4835.77 3802.11 27.19
United India 642.91 508.22 5160.04 4045.65 27.55
Oriental 407.08 378.33 3926.46 3446.06 13.94
ECGC 87.42 72.53 615.18 559.36 9.98
AIC 156.31 111.93 1720.91 1248.02 37.89
PRIVATE TOTAL 1864.80 1311.90 15555.47 12271.10 26.77
PUBLIC TOTAL 2448.10 2033.20 21804.76 17775.98 22.66
GRAND TOTAL 4312.90 3345.10 37360.23 30047.07 24.34
Pre
miu
m(
InC
rore
s)M
50000
45000
40000
35000
30000
25000
20000
15000
10000
5000
0
Month
Premium underwritten by non-life insurersfor the month of November, 2011
* Compiled on the basis of data submitted by the Insurance companies
April May June July August September October TotalNovember
2010-112011-12

Insurance Institute of India conducted a Seminar on ‘Economic Capital Requirement & Financial
Condition Reporting’ (ECR+FCR) on 16th Dec. 2011 at Mumbai. Consequent to IRDA’s announcement of
norms on Economic Capital Requirement (ECR) and Financial Condition Reporting (FCR), the subjects
have been engaging the attention of Indian life and non-life insurers alike. During the last few
months, insurers have been in the process of empowering their professionals in actuarial, finance,
reporting and underwriting streams with the requisite knowledge and skills for complying with the
new norms. The norms being relatively new, gaps do exist at conceptual and implementation levels.
The need for clarity in understanding, uniformity in interpretation and hassle-free implementation
has been voiced by many insurers; and hence the relevance of the seminar.
Mr Liyaquat Khan, President Institute of
Actuaries of India delivering the inaugural
address. Also seen in the picture are: (L to R)
Mr P.K. Rath, Director College of Insurance; Mr
Sharad Shrivastava, Secretary General,
Insurance Institute of India; Mr A.R. Sekar,
(Officiating Chairman) Director and FA, New
India Assurance Co Ltd.; and Mr
S.Venkataraman, Company Secretary, United
India Insurance Co Ltd.
Panel Discussionbeing kicked off by
Dr George E Thomas, Associate
Professor (Non-Life), Insurance Institute
of India. Other participants in the panel
discussion are (L to R): Mr P.K. Rath;
Mr A.R. Sekar; Dr Rajesh Dalmia,
Associate Director, Ernst and Young;
Mr S.Venkataraman; and Mr K.S.
Gopalakrishnan, Appointed Actuary &
CFO, Aegon Religare Life Insurance
Co.Ltd.
ird
ajo
urn
al J
an
ua
ry2
01
2
48
round up

ird
ajo
urn
alJ
an
ua
ry2
01
2
Statistical Supplement(Monthly - October, 2011)

ird
ajo
urn
al J
an
ua
ry2
01
2non-life insurance
Total Premium u/wTotal No. of
Policies IssuedAccretions during
the month (premium)Sum Assured
For themonth
Up tothe month
For themonth
Up tothe month
For themonth
Up tothe month
For themonth
Up tothe month
BUSINESS FIGURES:
50
Name of the Insurer: Bajaj Allianz General Insurance Company Limited
2371.19 18433.81 26883 227733 1098.64 2710.98 47935424.00 286311258.00
1272.55 15722.83 29573 210010 -973.61 1223.91 10147011.00 222881940.00
688.56 5178.06 11971 96715 95.35 761.66 6892134.00 59866593.00
593.21 4416.39 14308 99014 21.38 561.91 8546725.00 90276668.00
7.35 58.42 12 75 -6.25 -273.34 189277.00 1483158.00
13.60 331.76 38 232 -21.69 -29.27 148817.00 2442129.00
695.91 5236.48 11983 96790 89.09 488.32 7081411.00 61349751.00
606.81 4748.15 14346 99246 -0.31 532.64 8695542.00 92718797.00
410.38 1565.64 23 204 -170.46 -266.55 2303984.00 21489335.00
580.85 1832.19 35 188 381.89 -248.39 6600959.00 27505890.00
664.76 6561.41 1087 9477 -35.44 955.57 9086329.00 91109165.00
700.20 5605.85 1310 9454 -69.96 -143.39 15398626.00 110833513.00
13129.18 79927.17 342665 2330470 1103.38 6544.19 862368.00 5756377.00
12025.80 73382.97 351651 2309801 3064.88 16154.84 810515.00 5321616.00
4445.39 29699.50 344424 2346062 843.07 5570.45
3602.31 24129.05 356727 2350539 314.39 1996.23
17574.57 109626.67 344424 2346062 1946.46 12114.64 862368.00 5756377.00
15628.11 97512.03 356727 2350539 3379.26 18151.06 810515.00 5321616.00
205.30 1769.71 1397 12677 8.43 355.13 40647.00 312208.00
196.88 1414.58 1591 11858 80.99 409.62 29316.00 197868.00
5.96 44.43 9 141 0.77 4.52 10620.00 272989.00
5.19 39.90 11 91 1.38 2.50 13335.00 103234.00
66.19 989.89 55 388 -21.24 221.73 46071.00 466175.00
87.43 768.15 41 303 45.01 192.77 33965.00 353722.00
245.21 5117.62 260 2056 -0.18 671.11 208469.00 1868661.00
245.39 4446.51 277 1988 21.97 1679.11 196942.00 1532531.00
522.66 7921.64 1721 15262 -12.23 1252.50 305807.00 2920033.00
534.89 6669.14 1920 14240 149.35 2283.99 273558.00 2187355.00
387.78 3117.23 5493 44255 -3.15 43.74 1676243.00 13844226.00
390.93 3073.49 6469 54271 31.33 -289.64 1849548.00 29527548.00
2175.85 20063.73 62476 455256 354.82 4845.56 3615720.00 23692091.00
1821.02 15218.17 86353 551309 -130.87 190.32 2023448.00 16931587.00
525.07 4260.91 43455 351204 105.34 501.08 1344010.00 7433612.00
419.73 3759.82 40024 329714 82.97 241.30 41867.00 765420.00
2700.91 24324.63 105931 806460 460.16 5346.65 4959730.00 31125703.00
2240.76 18977.99 126377 881023 -47.90 431.62 2065315.00 17697007.00
0.00 0.00 0 0 0.00 0.00 0.00 0.00
0.00 0.00 0 0 0.00 0.00 0.00 0.00
115.08 660.35 13 114 68.67 -608.79 315804.00 2731745.00
46.41 1269.14 25 144 -196.92 96.46 399945.00 2105413.00
1346.80 10103.62 42921 362839 -19.35 174.46 2138831.00 39235813.00
1366.16 9929.16 53209 361517 254.88 1068.06 2184174.00 66854984.00
26790.05 187551.48 540479 3909196 3422.39 22211.53 76665931.00 555873406.00
23367.66 165339.96 589991 3980632 2908.01 23106.32 48425193.00 577634063.00
* Wherever applicable
LINE OF BUSINESS
Fire
Previous year
Marine Cargo
Previous year
Marine Hull (IncludingOnshore & Offshore oil energy)
Previous year
Marine (Total)
Previous year (Total)
Aviation
Previous year
Engineering
Previous year
Motor Own Damage
Previous year
Motor Third party
Previous year
Motor (Total)
Previous year (Total)
Workmen's compensation /Employer's liability
Previous year
Public Liability
Previous year
Product Liability
Previous year
Other Liability Covers
Previous year
Liability (Total)
Previous year (Total)
Personal Accident
Previous year
Medical Insurance
Previous year
Overseas Medical Insurance
Previous year
Health (Total)
Previous year (Total)
Crop Insurance
Previous year
Previous year
Credit Guarantee
All Other Miscellaneous
Previous year
Grand Total
Previous year (Total)
50

ird
ajo
urn
alJ
an
ua
ry2
01
2
No. of Lives coveredin Social Sector
Amount of Premiumu/w in Social Sector
No. of Policiesin Rural Areas
For themonth
For themonth
For themonth
Up tothe month
For themonth
FOR AND UP TO THE MONTH OF OCTOBER, 2011
Amount of Premiumu/w in Rural Areas
No. ofLives covered *
Up tothe month
Up tothe month
Up tothe month
For themonth
Up tothe month
(Premium in Lakhs)M
51
51
70.14 955.52 2176 18876 0.00 0.00 0.00 0.00
116.94 1233.30 4145 28586 0.00 0.00 0.00 0.00
13.64 292.57 582 6077 0.00 0.00 0.00 0.00
12.92 131.58 551 4685 0.00 0.00 0.00 0.00
0.00 0.00 0 0 0.00 0.00 0.00 0.00
0.00 0.00 0 0 0.00 0.00 0.00 0.00
13.64 292.57 582 6077 0.00 0.00 0 0 0 0
12.92 131.58 551 4685 0.00 0.00 0 0 0 0
0.00 0.00 0 0 0.00 0.00 0.00 0.00
0.00 0.00 0 0 0.00 0.00 0.00 0.00
78.77 598.95 93 1052 0.00 0.00 0.00 0.00
109.00 887.13 194 1553 0.00 0.00 0.00 0.00
803.31 6621.32 3190 122155 0.00 0.00 0.00 0.00
78.86 609.83 2616 17315 0.00 0.00 0.00 0.00
322.56 2708.20 25292 101385 0.00 0.00 0.00 0.00
1263.48 8148.99 33972 228222 0.00 0.00 0.00 0.00
1125.87 9329.52 25292 122155 0.00 0.00 0 0 0 0
1342.34 8758.81 33972 228222 0.00 0.00 0 0 0 0
29.76 241.93 200 1815 0.00 0.00 0.00 0.00
27.00 233.93 309 2056 0.00 0.00 0.00 0.00
0.00 0.00 0 0 0.00 0.00 0.00 0.00
0.00 0.00 0 0 0.00 0.00 0.00 0.00
0.00 0.00 0 0 0.00 0.00 0.00 0.00
0.00 0.00 0 0 0.00 0.00 0.00 0.00
3.51 210.64 6 2571 0.00 0.00 0.00 0.00
1.55 147.31 13 68 0.00 0.00 0.00 0.00
33.27 452.57 206 4386 0.00 0.00 0 0 0 0
28.55 381.24 322 2124 0.00 0.00 0 0 0 0
34.98 367.58 3843 32825 5.60 25.46 9784.00 54656.00
13.77 523.45 665 18400 2.85 12.94 9500.00 43710.00
91.05 807.18 1657 15124 0.00 0.00 0.00 0.00 60087.00 696107.00
53.23 508.24 1342 11766 0.00 0.00 0.00 0.00 64603.00 539904.00
0.00 0.00 0 0 0.00 0.00 0.00 0.00 0.00 0.00
0.00 0.00 0 0 0.00 0.00 0.00 0.00 0.00 0.00
91.05 807.18 1657 15124 0.00 0.00 0 0 60087 696107
53.23 508.24 1342 11766 0.00 0.00 0 0 64603 539904
0.00 0.00 0 0 0.00 0.00 0.00 0.00
0.00 0.00 0 0 0.00 0.00 0.00 0.00
0.00 0.00 0 0 0.00 0.00 0.00 0.00
0.00 0.00 0 0 0.00 0.00 0.00 0.00
283.72 2167.76 8374 76856 0.00 0.00 0.00 0.00
310.00 1827.37 14932 84369 0.00 0.00 0.00 0.00
1731.44 14971.65 42223 277351 5.60 25.46 9784 54656 60087 696107
1986.75 14251.13 56123 379705 2.85 12.94 9500 43710 64603 539904

ird
ajo
urn
al J
an
ua
ry2
01
2non-life insurance
* Wherever applicable
LINE OF BUSINESS
Fire
Previous year
Marine Cargo
Previous year
Total Premium u/wTotal No. of
Policies IssuedAccretions during
the month (premium)Sum Assured
For themonth
Up tothe month
For themonth
Up tothe month
For themonth
Up tothe month
For themonth
Up tothe month
Marine Hull (IncludingOnshore & Offshore oil energy)
Previous year
Marine (Total)
Previous year (Total)
Aviation
Previous year
Engineering
Previous year
Motor Own Damage
Previous year
Motor Third party
Previous year
Motor (Total)
Previous year (Total)
Workmen's compensation /Employer's liability
Previous year
Public Liability
Previous year
Product Liability
Previous year
Other Liability Covers
Previous year
Liability (Total)
Previous year (Total)
Personal Accident
Previous year
Medical Insurance
Previous year
Overseas Medical Insurance
Previous year
Health (Total)
Previous year (Total)
Crop Insurance
Previous year
Previous year
Credit Guarantee
All Other Miscellaneous
Previous year
Grand Total
Previous year (Total)
BUSINESS FIGURES:
Name of the Insurer: Bharti Axa General Insurance Company Limited
52
189.77 3039.44 1762 10050 189.77 2849.67 362470.99 6292283.24
156.28 2559.45 2169 10108 156.28 2403.17 12808859.51 51217470.48
142.01 1146.66 194 1331 142.01 1004.64 226287.69 2161104.80
66.78 712.45 222 1331 66.78 645.67 4834726.27 19433951.37
142.01 1146.66 194 1331 142.01 1004.64 226287.69 2161104.80
66.78 712.45 222 1331 66.78 645.67 4834726.27 19433951.37
96.35 723.82 115 770 96.35 627.47 91113.70 570323.83
69.51 724.92 152 997 69.51 655.41 11826319.39 31013632.80
4117.68 22142.02 58143 321669 4117.68 18024.34 231008.20 1293196.37
2486.08 16428.96 42671 274956 2486.08 13942.88 2452362.39 8921500.28
1334.72 7919.89 58143 321669 1334.72 6585.18
747.55 4828.93 42671 274956 747.55 4081.38
5452.39 30061.91 58143 321669 5452.39 24609.52 231008.20 1293196.37
3233.63 21257.89 42671 274956 3233.63 18024.25 2452362.39 8921500.28
11.51 100 36 323 11.51 88.51 1049.21 16826
11.03 80.40 49 557 11.03 69.37 37132.33 149753.69
0.00 0 0.00 0.00
0.00 0 0.00 0.00
0.00 0 0.00 0.00
0.00 0 0.00 0.00
12.37 145 8 88 12.37 132.83 2124.72 52245
7.19 47.34 14 90 7.19 40.15 60613.84 258801.65
23.89 245.23 44 411 23.89 221.34 3173.93 69070.66
18.22 127.74 63 647 18.22 109.52 97746.17 408555.34
156.29 1410.45 622 7187 156.29 1254.16 288471.49 3234318.95
74.06 1031.88 1812 10282 74.06 957.82 17247661.96 69603480.27
1159.87 8810.46 803 10505 1159.87 7650.59 4728.69 35118.85
258.71 2988.54 1705 11236 258.71 2729.83 58588.66 218501.02
1159.87 8810.46 803 10505 1159.87 7650.59 4728.69 35118.85
258.71 2988.54 1705 11236 258.71 2729.83 58588.66 218501.02
109.01 506.67 1165 9183 109.01 454.80 143430.42 584005.03
48.69 259.73 2028 8241 48.69 211.04 942892.54 3625393.78
7329.58 45944.63 62848 361106 7329.58 38672.19 1350685.10 14239421.73
3925.88 29662.58 50822 317798 3925.88 25736.70 50269156.89 184442485.33
52

ird
ajo
urn
alJ
an
ua
ry2
01
2
No. of Lives coveredin Social Sector
Amount of Premiumu/w in Social Sector
No. of Policiesin Rural Areas
For themonth
For themonth
For themonth
Up tothe month
For themonth
FOR AND UP TO THE MONTH OF OCTOBER, 2011
Amount of Premiumu/w in Rural Areas
No. ofLives covered *
Up tothe month
Up tothe month
Up tothe month
For themonth
Up tothe month
(Premium in Lakhs)M
53
23.58 84.63 14908 21572
0.22 16
0.23 0.97 200 215
0.23 0.97 200 215 0.00 0.00 0 0 0 0
0.00 0.00 0 0 0.00 0.00 0 0 0 0
2.44 11.98 376 419
203.71 912.83 14679 30262
10.31 200.06 79 4193
0.00 339.58 0 0
11.64
203.71 1252.41 14679 30262 0.00 0.00 0 0 0 0
10.31 211.70 79 4193 0.00 0.00 0 0 0 0
0.05 2 0 9
0.00 0.23 0 2
0.05 2.19 0 11 0.00 0.00 0 0 0 0
0.00 0.00 0 0 0.00 0.00 0 0 0 0
0.00 183.34 0 587 0.00 11.89 0 45715
0.77 34.13 2 89
0.00 44.17 0 389
8.86 24 0.00 0.00 0.00 0.00
0.00 44.17 0 389 0.00 0.00 0 0 0 0
0.00 8.86 0 24 0.00 0.00 0 0 0 0
0.00 43.88 0 6406
1.54 3 75
230.01 1623.56 30163 59861 0.00 11.89 0 45715 0 0
11.08 256.45 84 4397 0.00 0.00 0 0 0 0
53

ird
ajo
urn
al J
an
ua
ry2
01
2non-life insurance
* Wherever applicable
LINE OF BUSINESS
Fire
Previous year
Marine Cargo
Previous year
Total Premium u/wTotal No. of
Policies IssuedAccretions during
the month (premium)Sum Assured
For themonth
Up tothe month
For themonth
Up tothe month
For themonth
Up tothe month
For themonth
Up tothe month
Marine Hull (IncludingOnshore & Offshore oil energy)
Previous year
Marine (Total)
Previous year (Total)
Aviation
Previous year
Engineering
Previous year
Motor Own Damage
Previous year
Motor Third party
Previous year
Motor (Total)
Previous year (Total)
Workmen's compensation /Employer's liability
Previous year
Public Liability
Previous year
Product Liability
Previous year
Other Liability Covers
Previous year
Liability (Total)
Previous year (Total)
Personal Accident
Previous year
Medical Insurance
Previous year
Overseas Medical Insurance
Previous year
Health (Total)
Previous year (Total)
Crop Insurance
Previous year
Previous year
Credit Guarantee
All Other Miscellaneous
Previous year
Grand Total
Previous year (Total)
BUSINESS FIGURES:
Name of the Insurer: Cholamandalam Ms General Insurance Company Limited
54
399.5 4,477.4 8,035 83,016 247.1 779.9 590,175 4,960,918
152.4 3,697.4 3,413 45,493 (24.6) (75.3) 160,540 8,926,852
477.0 2,875.1 734 5,055 130.3 387.2 6,925,826 27,636,704
346.8 2,487.9 1,196 5,396 (37.5) (52.3) 1,930,530 13,346,524
- - - - (1.1) - 0
- 1.1 - - (6.0) (98.4) - 104
477.0 2,875.1 734 5,055 130.3 386.1 6,925,826 27,636,704
346.8 2,489.0 1,196 5,396 (43.5) (150.8) 1,930,530 13,346,628
- - - - - - -
- - - - - - - -
233.1 1,481.2 745 5,646 11.7 74.5 130,675 2,513,618
221.4 1,406.6 704 4,929 65.2 7.2 161,764 1,755,677
3,843.0 29,885.0 59,334 432,106 (89.0) 6,355.4 263,205 1,873,612
3,932.0 23,529.6 70,672 406,780 298.9 3,674.9 286,683 1,589,295
3,221.8 19,593.4 59,544 433,397 1,496.2 9,267.5 - -
1,725.6 10,325.9 - - 1,253.9 4,810.3 - -
7,064.8 49,478.4 59,544 433,397 1,407.2 15,622.9 263,205 1,873,612
5,657.6 33,855.5 70,672 406,780 1,552.8 8,485.2 286,683 1,589,295
0.9 139.1 366 2,168 (50.7) (183.2) 5,531 51,139
51.6 322.3 107 720 14.1 47.3 7,910 48,210
120.9 823.0 41 768 110.5 416.4 12,264 126,152
10.5 406.6 584 2,294 (229.2) (255.2) 4,747 184,002
- - - - - - -
- - - - - - - -
- - - - - - -
- - - - - - - -
121.8 962.1 407 2,936 59.8 233.3 17,795 177,291
62.1 728.9 691 3,014 (215.1) (207.9) 12,657 232,212
368.7 2,630.8 1,314 11,333 89.5 654.2 341,162 2,124,080
279.3 1,976.5 3,366 14,913 76.2 256.2 300,694 2,255,452
2,981.7 14,869.1 2,463 13,912 1,189.8 4,488.9 139,367 697,779
1,791.9 10,380.1 3,484 16,795 1,022.2 532.3 121,920 562,937
- - - - - - -
- - - - - - - -
2,981.7 14,869.1 2,463 13,912 1,189.8 4,488.9 139,367 697,779
1,791.9 10,380.1 3,484 16,795 1,022.2 532.3 121,920 562,937
- - - - - - -
- - - - - - - -
- - - - - - -
- - - - - - - -
133.3 1,470.5 5,326 43,530 (224.7) (379.7) 770,197 2,962,320
358.0 1,850.2 15,080 62,033 192.6 (227.7) 265,196 2,619,615
11,779.9 78,244.4 78,568 598,825 2,910.5 21,860.2 9,178,401 42,946,323
8,869.4 56,384.3 98,606 559,353 2,625.9 8,619.3 3,239,983 31,288,668
54

ird
ajo
urn
alJ
an
ua
ry2
01
2
No. of Lives coveredin Social Sector
Amount of Premiumu/w in Social Sector
No. of Policiesin Rural Areas
For themonth
For themonth
For themonth
Up tothe month
For themonth
FOR AND UP TO THE MONTH OF OCTOBER, 2011
Amount of Premiumu/w in Rural Areas
No. ofLives covered *
Up tothe month
Up tothe month
Up tothe month
For themonth
Up tothe month
(Premium in Lakhs)M
55
0.6 7.0 22 802 312.2 3,003.7
0.4 0.4 - - 247 701 - -
- - - - - - -
- - - - - - - -
- - - - - - -
- - - - - - - -
- - - - - - - -
- - - - - - - -
- - - - - - - -
- - - - - - - -
17.3 19.7 1 17 80.3 503.4 -
- - - - 55.0 151.4 - -
329.4 1,946.2 7,440 45,028 - - - -
247 1,384 6,173 17,467 - - - -
161.6 998.2 7,454 45,188 - - - -
- - - - - - - -
491.0 2,944.4 7,454 45,188 - - - -
246.6 1,384.5 6,173 17,467 - - - -
- - - - - - - -
- - - - - - - -
- - - - - - - -
- - - - - - - -
- - - - - - - -
- - - - - - - -
- - - - - - - -
- - - - - - - -
- - - - - - - -
- - - - - - - -
- - - - - - -
- - - - - - - -
2,703.3 10,487.8 20 87 1,716,969 6,836,226
- - 57 57 1,415.6 6,223.7 836,403 3,862,752
- - - - - - - -
- - - - - - - -
2,703.3 10,487.8 20 87 - - 1,716,969 6,836,226
- - 57 57 1,415.6 6,223.7 836,403 3,862,752
- - - - - - - -
- - - - - - - -
- - - - - - - -
- - - - - - - -
29.2 216.3 1,370 10,254 30.2 343.3 -
21.7 68.9 4,889 4,889 73 224 - -
3,241.3 13,675.3 8,867 56,348 422.6 3,850.4 1,716,969 6,836,226 - -
268.6 1,453.7 11,119 22,413 1,790.4 7,300.4 836,403 3,862,752 - -
55

ird
ajo
urn
al J
an
ua
ry2
01
2non-life insurance
* Wherever applicable
LINE OF BUSINESS
Fire
Previous year
Marine Cargo
Previous year
Total Premium u/wTotal No. of
Policies IssuedAccretions during
the month (premium)Sum Assured
For themonth
Up tothe month
For themonth
Up tothe month
For themonth
Up tothe month
For themonth
Up tothe month
Marine Hull (IncludingOnshore & Offshore oil energy)
Previous year
Marine (Total)
Previous year (Total)
Aviation
Previous year
Engineering
Previous year
Motor Own Damage
Previous year
Motor Third party
Previous year
Motor (Total)
Previous year (Total)
Workmen's compensation /Employer's liability
Previous year
Public Liability
Previous year
Product Liability
Previous year
Other Liability Covers
Previous year
Liability (Total)
Previous year (Total)
Personal Accident
Previous year
Medical Insurance
Previous year
Overseas Medical Insurance
Previous year
Health (Total)
Previous year (Total)
Crop Insurance
Previous year
Previous year
Credit Guarantee
All Other Miscellaneous
Previous year
Grand Total
Previous year (Total)
BUSINESS FIGURES:
56
Name of the Insurer: Future General India Insurance Company Limited
555.43 6259.35 1808 13399 120.89 1595.17 1409159.29 6987559.09
434.54 4664.19 1048 6725 244.11 2611.10 705214.62 2463208.42
356.19 2411.50 620 4990 96.33 513.57 722283.27 3397083.24
259.86 1897.92 5989 27958 73.04 993.09 668875.58 3483462.74
0.00 0.00 0 0 0.00 0.00 0.00 0.00
0.00 0.00 0 0 0.00 0.00 0.00 0.00
356.19 2411.50 620 4990 96.33 513.57 722283.27 3397083.24
259.86 1897.92 5989 27958 73.04 993.09 668875.58 3483462.74
0.00 0.00 0 0 0.00 0.00 0.00 0.00
0.00 0.00 0 0 0.00 0.00 0.00 0.00
203.95 1556.60 374 3008 -57.90 91.62 148687.17 804443.31
261.84 1464.99 365 1941 112.77 702.57 177869.48 605220.89
3150.30 19320.16 49851 320413 1134.89 6879.07 191625.55 1175631.47
2015.42 12441.09 38321 268864 746.42 4777.03 183758.70 765453.68
1538.43 10079.59 32 297 785.36 5269.62
753.06 4809.97 38321 268864 249.39 1805.93
4688.73 29399.75 49851 320413 1920.25 12148.69 191625.55 1175631.47
2768.48 17251.06 38321 268864 995.81 6582.96 183758.70 765453.68
80.29 701.24 433 3331 24.68 366.01 16913.10 94596.83
55.61 335.23 349 2117 28 169 4880.35 30520.16
0.00 0.00 0.00 0.00
0.00 0.00 0 0 0 -2 0.00 0.00
70.52 615.26 87 695 13.05 189.53 21711.16 125331.46
57.48 425.74 71 552 32 179 7699.84 81040.21
0.00 0.00 0 0 0.00 0.00 0.00 0.00
0.00 0.00 0 0 0.00 0.00
150.81 1316.51 520 4026 37.72 555.54 38624.26 219928.29
113.09 760.97 420 2669 60.67 346.58 12580.19 111560.37
188.01 2819.03 4130 29560 10.57 998.82 322964.26 6502371.14
177.44 1820.21 2998 23071 63.03 992.92 209642.75 5704098.61
383.78 6545.86 1211 9789 -305.29 1260.01 9304.15 59413.95
689.07 5285.85 942 6470 484.07 2168.83 11141.24 40655.41
64.92 648.51 4323 39044 9.09 88.90 5915.40 57033.83
55.83 559.61 4437 34839 7.33 202.66 6245.10 50982.47
448.70 7194.37 5534 48833 -296.20 1348.91 15219.55 116447.78
744.90 5845.47 5379 41309 491.40 2371.49 17386.34 91637.87
0.00 0.00 0 0 0.00 0.00 0.00 0.00
0.00 0.00 0 0 0.00 0.00 0.00 0.00
0.00 0.00 0 0 0.00 0.00 0.00 0.00
0.00 0.00 0 0 0.00 0.00 0.00 0.00
234.78 1846.03 1962 15884 77.40 638.82 225970.90 1540830.66
157.38 1207.21 2438 21935 85.19 627.89 132600.94 1002693.79
6826.61 52803.14 64799 440113 1909.08 17891.13 3074534.26 20744294.99
4917.53 34912.01 56958 394472 2126.01 15228.60 2107928.60 14227336.37
56

ird
ajo
urn
alJ
an
ua
ry2
01
2
No. of Lives coveredin Social Sector
Amount of Premiumu/w in Social Sector
No. of Policiesin Rural Areas
For themonth
For themonth
For themonth
Up tothe month
For themonth
FOR AND UP TO THE MONTH OF OCTOBER, 2011
Amount of Premiumu/w in Rural Areas
No. ofLives covered *
Up tothe month
Up tothe month
Up tothe month
For themonth
Up tothe month
(Premium in Lakhs)M
57
2.92 389.96 178 1522
38.52 327.34 71 684
85.90 311.59 47 338
67.61 226.69 510 2283
85.90 311.59 47 338 0.00 0.00 0 0
67.61 226.69 510 2283 0.00 0.00 0 0
39.83 163.43 29 249
18.59 97.85 35 147
300.59 1,896.65 4425 30729
168.36 949.34 3239 23716
179.22 1,089.12
72.16 429.77 6436
479.81 2,985.77 4425 30729 0.00 0.00 0 0
240.52 1,379.11 3239 23716 0.00 0.00 0 0
10.55 74.66 18 175
33.00 54
8.06 27.24 3 12
9.05 36.83 18 90
18.61 101.91 21 187 0.00 0.00 0 0
9.05 69.83 18 144 0.00 0.00 0 0
8.88 81.52 231 1872 33.02 215000
1.98 34.12 144 882 5.20 95367
45.94 159.90 61 531 13121 18292
2.82 72.89 48 315 11515 179096
3.48 29.94 199 1835
2.64 16.28 213 993
49.42 189.84 260 2366 0.00 0.00 0 0 13121 18292
5.46 89.17 261 1308 0.00 0.00 0 0 11515 179096
68.22 288.27 945 6666
26.20 232.20 925 14857
753.58 4512.27 6136 43929 0.00 33.02 0 215000 13121 18292
407.93 2456.31 5203 44021 0.00 5.20 0 95367 11515 179096
57

ird
ajo
urn
al J
an
ua
ry2
01
2non-life insurance
* Wherever applicable
LINE OF BUSINESS
Fire
Previous year
Marine Cargo
Previous year
Total Premium u/wTotal No. of
Policies IssuedAccretions during
the month (premium)Sum Assured
For themonth
Up tothe month
For themonth
Up tothe month
For themonth
Up tothe month
For themonth
Up tothe month
Marine Hull (IncludingOnshore & Offshore oil energy)
Previous year
Marine (Total)
Previous year (Total)
Aviation
Previous year
Engineering
Previous year
Motor Own Damage
Previous year
Motor Third party
Previous year
Motor (Total)
Previous year (Total)
Workmen's compensation /Employer's liability
Previous year
Public Liability
Previous year
Product Liability
Previous year
Other Liability Covers
Previous year
Liability (Total)
Previous year (Total)
Personal Accident
Previous year
Medical Insurance
Previous year
Overseas Medical Insurance
Previous year
Health (Total)
Previous year (Total)
Crop Insurance
Previous year
Previous year
Credit Guarantee
All Other Miscellaneous
Previous year
Grand Total
Previous year (Total)
BUSINESS FIGURES:
Name of the Insurer: HDFC ERGO General Insurance Company Limited
58
1,808.41 18,298.93 3,949 27,245 438.69 5,450.37 13,300,867 48,555,631
1,369.71 12,848.56 2,737 18,781 113.35 5,458.79 3,799,189 27,025,693
442.14 2,670.65 274 1,376 118.10 1,041.69 1,188,030 10,114,947
324.04 1,628.96 169 1,058 120.67 885.08 1,477,211 5,826,957
71.24 1,279.84 17 254 (0.42) 623.02 2,244 180,578
71.66 656.83 7 230 (156.30) (31.86) 1,383 148,051
513.38 3,950.50 291 1,630 117.68 1,664.71 1,190,274 10,295,525
395.70 2,285.79 176 1,288 (35.63) 853.22 1,478,593 5,975,008
531.29 1,654.08 9 31 265.41 (1,073.78) 152,829 1,660,039
265.88 2,727.86 4 21 (264.65) 1,784.30 9,345 1,230,714
428.14 4,456.54 476 2,467 26.44 1,301.06 309,566 2,378,722
401.71 3,155.47 337 1,690 87.10 1,608.81 262,511 3,163,747
3,871.27 22,408.12 53,376 325,948 1,241.96 6,868.91 255,857 1,499,290
2,629.31 15,539.21 42,566 244,856 906.94 5,965.13 175,787 1,032,367
1,876.36 11,803.00 86,833 572,970 835.79 5,864.85
1,040.57 5,938.15 58,080 325,784 373.10 1,476.65
5,747.63 34,211.12 86,833 572,970 2,077.75 12,733.76 255,857 1,499,290
3,669.88 21,477.37 58,080 325,784 1,280.05 7,441.77 175,787 1,032,367
21.46 286.51 60 382 1.56 126.40 4,844 310,716
19.90 160.10 30 236 0.65 56.66 25,187 163,182
5.00 164.00 8 137 (6.37) 15.18 5,667 (327,274)
11.37 148.82 6 95 5.71 92.46 427,958 491,390
40.31 208.82 3 22 25.84 56.61 1,228 18,141
14.47 152.21 2 21 7.64 130.59 2,150 42,666
459.09 5,410.21 91 741 190.61 929.16 (1,318,647) 1,337,495
268.48 4,481.05 89 581 (69.67) 451.15 89,312 970,525
525.85 6,069.53 162 1,282 211.63 1,127.34 (1,306,908) 1,339,078
314.22 4,942.19 127 933 (55.66) 730.84 544,606 1,667,764
1,548.95 10,117.74 92,326 614,464 224.40 3,066.05 592,924 9,739,506
1,324.55 7,051.69 99,808 493,854 482.19 4,341.50 370,535 1,277,034
2,523.50 22,704.04 35,372 241,687 (769.34) 4,407.02 131,619 876,815
3,292.84 18,297.02 31,072 173,903 141.05 3,090.81 94,478 629,034
197.84 1,002.53 714 4,564 136.15 503.70 93,593 7,396,393
61.69 498.83 447 3,832 9.64 132.39 1,292,029 7,282,164
2,721.34 23,706.57 36,086 246,251 (633.19) 4,910.72 225,213 8,273,208
3,354.54 18,795.85 31,519 177,735 150.68 3,223.20 1,386,507 7,911,198
- - - - -
- - - - - - - -
- - - - -
- - - - - - - -
135.26 1,847.11 200 1,032 91.80 1,110.00 132,780 2,223,627
43.46 737.11 1,930 12,072 (692.04) (3,608.75) 89,689 680,190
13,960.25 104,312.12 220,332 1,467,372 2,820.60 30,290.23 14,853,402 85,964,626
11,139.66 74,021.89 194,718 1,032,158 1,065.39 21,833.68 8,116,763 49,963,715
58

ird
ajo
urn
alJ
an
ua
ry2
01
2
No. of Lives coveredin Social Sector
Amount of Premiumu/w in Social Sector
No. of Policiesin Rural Areas
For themonth
For themonth
For themonth
Up tothe month
For themonth
FOR AND UP TO THE MONTH OF OCTOBER, 2011
Amount of Premiumu/w in Rural Areas
No. ofLives covered *
Up tothe month
Up tothe month
Up tothe month
For themonth
Up tothe month
(Premium in Lakhs)M
59
25.33 717.62 249 1,462 - -
22.51 701.90 183 1,299 - - - -
(8.56) 59.75 20 134 - -
90.46 171.68 13 78 - - - -
0.16 8.09 1 2 - - -
0.07 0.22 1 22 - - - -
(8.40) 67.85 21 136 - - - - - -
90.53 171.91 14 100 - - - - - -
- - - - - -
- - - - - - - -
62.31 259.99 49 273 - -
45.54 179.94 31 207 - - - -
364.33 2,187.41 5,158 32,367 - -
237.65 1,364.66 4,467 24,181 - - - -
235.92 1,555.11 10,213 74,726 - -
118.37 713.05 7,431 39,192 - - - -
600.24 3,742.52 10,213 74,726 - - - - - -
356.03 2,077.71 7,431 39,192 - - - - - -
0.29 8.39 - 17 - -
1.27 11.55 1 19 - - - -
- 0.42 - 1 - -
- 35.84 - 2 - - - -
- - - - - -
15.25 18.51 3 3 - - - -
8.50 108.85 3 21 - -
1.90 222.83 1 23 - - - -
8.79 117.66 3 39 - - - - - -
18.42 288.73 5 47 - - - - - -
128.04 797.11 7,805 54,599 - 62.29 - 130,833
108.87 565.29 13,978 55,933 - - - -
83.00 1,468.63 1,590 12,394 - 7.81 - 5,683 80,794 747,650
302.92 2,829.31 1,477 8,574 - 58.13 (7,059) 53,279 32,441 576,071
0.51 15.44 25 129 - - - - 11,151 88,390
3.40 10.30 12 94 - - - - 11,776 124,359
83.52 1,484.07 1,615 12,523 - 7.81 - 5,683 91,945 836,040
306.32 2,839.61 1,489 8,668 - 58.13 (7,059) 53,279 44,217 700,430
- - - - - -
- - - - - - - -
- - - - - -
- - - - - - - -
102.47 1,369.61 5 43 - -
8.01 36.68 898 3,575 - - - -
1,002.28 8,556.42 19,960 143,801 - 70.10 - 136,516 91,945 836,040
956.23 6,861.76 24,029 109,021 - 58.13 (7,059) 53,279 44,217 700,430
59

ird
ajo
urn
al J
an
ua
ry2
01
2non-life insurance
* Wherever applicable
LINE OF BUSINESS
Fire
Previous year
Marine Cargo
Previous year
Total Premium u/wTotal No. of
Policies IssuedAccretions during
the month (premium)Sum Assured
For themonth
Up tothe month
For themonth
Up tothe month
For themonth
Up tothe month
For themonth
Up tothe month
Marine Hull (IncludingOnshore & Offshore oil energy)
Previous year
Marine (Total)
Previous year (Total)
Aviation
Previous year
Engineering
Previous year
Motor Own Damage
Previous year
Motor Third party
Previous year
Motor (Total)
Previous year (Total)
Workmen's compensation /Employer's liability
Previous year
Public Liability
Previous year
Product Liability
Previous year
Other Liability Covers
Previous year
Liability (Total)
Previous year (Total)
Personal Accident
Previous year
Medical Insurance
Previous year
Overseas Medical Insurance
Previous year
Health (Total)
Previous year (Total)
Crop Insurance
Previous year
Previous year
Credit Guarantee
All Other Miscellaneous
Previous year
Grand Total
Previous year (Total)
BUSINESS FIGURES:
Name of the Insurer: ICICI Lombard General Insurance Company Limited
60
1,146.31 24,159.91 1,924 14,468 (1,655.92) 1,574.28 15,409,825 53,674,592
2,802.24 22,585.62 2,080 14,604 810.14 1,128.44 7,761,459 41,250,115
757.29 7,970.67 1,160 7,810 (114.73) 1,513.34 2,252,432 31,000,006
872.02 6,457.32 1,088 5,858 520.05 1,370.10 2,094,114 23,968,945
672.89 4,494.10 11 90 (414.31) 833.69 206,294 948,848
1,087.20 3,660.41 31 346 258.70 (471.73) 283,100 1,988,271
1430.18 12464.77 1171 7900 -529.04 2347.04 2458725.90 31948854.08
1959.22 10117.74 1119 6204 778.75 898.37 2377214.06 25957215.92
1,905.90 8,741.86 7 107 (2,070.29) 970.28 491,181 3,215,568
3,976.20 7,771.58 16 106 3,602.68 3,706.38 1,604,749 12,445,846
1,071.50 10,770.07 540 4,289 (436.11) 1,103.18 747,263 6,463,064
1,507.61 9,666.89 730 3,966 291.21 (734.21) 1,212,034 7,949,056
13,760.58 78,276.70 544,814 2,921,217 3,493.65 17,044.05 1,813,703 10,330,144
10,266.93 61,232.65 407,303 2,214,500 320.22 8,549.42 1,854,893 8,489,824
5,680.30 32,874.41 551,468 2,968,478 2,050.35 9,922.99
3,629.94 22,951.42 414,706 2,279,698 (168.44) 6.95
19440.87 111151.11 551468 2968478 5544.00 26967.03 1813703.41 10330144.48
13896.87 84184.07 414706 2279698 151.78 8556.37 1854892.67 8489823.76
292.96 1,663.06 535 4,131 28.91 530.91 30,963 228,677
264.05 1,132.15 506 3,250 138.66 448.74 36,520 162,419
1.31 32.79 6 83 (0.98) (10.93) 3,000 47,199
2.29 43.72 6 90 (0.83) 3.06 4,000 17,602
1.18 149.87 3 36 (1.55) (10.86) 324 33,574
2.72 160.73 4 40 1.17 11.76 770 31,912
261.69 5,442.64 129 1,153 (6.60) (79.66) 88,496 3,817,020
268.28 5,522.29 119 1,027 (551.76) (281.21) 76,171 1,050,309
557.13 7288.35 673 5403 19.79 429.46 122782.92 4126469.88
537.35 6858.89 635 4407 -412.76 182.35 117461.20 1262242.32
1,016.39 7,940.69 78,468 350,935 38.96 1,890.38 1,292,629 19,251,664
977.43 6,050.31 44,695 173,199 502.44 579.21 1,805,757 14,100,681
13,956.05 86,875.51 31,977 209,816 1,955.96 3,525.01 574,494 3,858,783
12,000.09 83,350.50 23,252 163,831 3,927.66 37,474.34 778,754 6,904,306
402.64 4,306.93 54,366 326,037 25.49 83.18 1,146,912 8,450,925
377.15 4,223.76 35,007 281,728 47.01 286.94 936,062.32 7,282,652
14358.69 91182.44 86343 535853 1981.45 3608.19 1721406.76 12309707.21
12377.24 87574.25 58259 445559 3974.67 37761.27 1714816.24 14186957.71
- 0.00 - - - 0.00 - -
0.00 0.00 - - 0.00 0.00 - -
242.27 1,032.55 4 26 (43.63) (449.62) 5,812 30,501
285.89 1,482.18 4 30 (84.87) (344.97) 4,886 37,580
2,044.48 20,734.23 5,982 43,675 (1,443.05) 2,661.79 4,886,553 9,679,743
3,487.52 18,072.45 9,524 71,311 1,910.99 11,178.32 4,014,256 20,267,257
43213.73 295465.99 726580 3931134 1406.16 41102.01 28949880.60 151030308.20
41807.57 254363.98 531768 2999084 11525.01 62911.54 22467525.51 145946775.92
60

ird
ajo
urn
alJ
an
ua
ry2
01
2
No. of Lives coveredin Social Sector
Amount of Premiumu/w in Social Sector
No. of Policiesin Rural Areas
For themonth
For themonth
For themonth
Up tothe month
For themonth
FOR AND UP TO THE MONTH OF OCTOBER, 2011
Amount of Premiumu/w in Rural Areas
No. ofLives covered *
Up tothe month
Up tothe month
Up tothe month
For themonth
Up tothe month
(Premium in Lakhs)M
61
- 0.00 - - - 0.00 - -
0.00 0.00 - - 0.00 0.00 - -
- 0.00 - - - 0.00 - -
0.00 0.00 - - 0.00 0.00 - -
- 0.00 - - - 0.00 - -
0.00 0.00 - - 0.00 0.00 - -
0.00 0.00 0 0 0.00 0.00 0 0 0 0
0.00 0.00 0 0 0.00 0.00 0 0 0 0
- 0.00 - - - 0.00 - -
0.00 0.00 - - 0.00 0.00 - -
(0.00) 0.84 1 14 - 0.00 - -
0.00 4.74 - 33 0.00 0.00 - -
1394.86 7,696.24 - - - 0.00 - -
1,403.80 6,679.50 - - 0.00 0.00 - -
986.14 5,539.55 34,881 202,092 - 0.00 - -
603.57 3,729.79 35,830 199,508 0.00 0.00 - -
2381.00 13235.78 34881 202092 0.00 0.00 0 0 0 0
2007.37 10409.30 35830 199508 0.00 0.00 0 0 0 0
0.00 0.00 - - - 0.00 - -
0.00 0.00 - - 0.00 0.00 - -
- 0.00 - - - 0.00 - -
0.00 0.00 - - 0.00 0.00 - -
- 0.00 - - - 0.00 - -
0.00 0.00 - - 0.00 0.00 - -
- 121.62 - - - 0.00 - -
0.00 781.18 - - 0.00 0.00 - -
0.00 121.62 0 0 0.00 0.00 0 0 0 0
0.00 781.18 0 0 0.00 0.00 0 0 0 0
0.00 0.00 - - - 5.30 - 58,502
0.00 0.00 - - 0.00 0.00 - -
3441.11 24,056.03 285 1,928 0.00 279.01 - 128,461 1,929,023 12,951,415
2,130.99 26,101.39 375 2,847 116.56 626.67 36,149 213,768 - 14,589,541
6.50 60.50 192 1,489 - 0.00 - - 54,366 326,037
5.64 126.22 255 3,217 0.00 0.00 - - 35,007 281,728
3447.61 24116.53 477 3417 0.00 279.01 0 128461 1983389 13277452
2136.63 26227.62 630 6064 116.56 626.67 36149 213768 35007 14871269
- - - - - - - -
- - - - - - - -
- - - - - - - -
- - - - - - - -
724 10,033 324 1,430 - - - -
2 32 42 458 - - - -
6552.77 47507.77 35683 206953 0.00 284.32 0 186963 1983389 13277452
4146.21 37455.07 36502 206063 116.56 626.67 36149 213768 35007 14871269
61

ird
ajo
urn
al J
an
ua
ry2
01
2non-life insurance
* Wherever applicable
LINE OF BUSINESS
Fire
Previous year
Marine Cargo
Previous year
Total Premium u/wTotal No. of
Policies IssuedAccretions during
the month (premium)Sum Assured
For themonth
Up tothe month
For themonth
Up tothe month
For themonth
Up tothe month
For themonth
Up tothe month
Marine Hull (IncludingOnshore & Offshore oil energy)
Previous year
Marine (Total)
Previous year (Total)
Aviation
Previous year
Engineering
Previous year
Motor Own Damage
Previous year
Motor Third party
Previous year
Motor (Total)
Previous year (Total)
Workmen's compensation /Employer's liability
Previous year
Public Liability
Previous year
Product Liability
Previous year
Other Liability Covers
Previous year
Liability (Total)
Previous year (Total)
Personal Accident
Previous year
Medical Insurance
Previous year
Overseas Medical Insurance
Previous year
Health (Total)
Previous year (Total)
Crop Insurance
Previous year
Previous year
Credit Guarantee
All Other Miscellaneous
Previous year
Grand Total
Previous year (Total)
BUSINESS FIGURES:
Name of the Insurer: Iffco Tokio General Insurance Company Limited
62
869.74 15558.78 5104 46372 -143.16 869.74 1576582.05 18006309.34
725.32 15727.07 6110 51212 -345.03 725.32 3836888.83 83195115.93
1141.62 6356.65 618 5800 377.21 1141.62 1884691.18 10006742.69
807.60 5387.21 977 6841 95.93 807.60 5860565.50 39093578.63
57.51 1893.68 22 205 -21.82 57.51 749108.90 21259972.36
615.76 3361.24 68 258 330.37 615.76 3995677.07 21811303.67
1199.12 8250.33 640 6005 355.40 1199.12 2633800.08 31266715.05
1423.36 8748.45 1045 7099 426.30 1423.36 9856242.57 60904882.30
139.85 1305.38 16 220 -47.68 139.85 1825160.90 9695890.45
132.96 2554.42 28 198 -108.49 132.96 879006.57 16887292.81
448.37 3602.13 288 2770 -18.19 448.37 33051.39 280068.23
418.06 3600.41 498 3284 -101.74 418.06 34517.29 297271.07
6139.85 38510.50 293806 2050008 669.86 6139.85 36387422.05 230953686.32
5669.30 34993.63 318229 2019611 490.65 5669.30 230708.52 1424044.39
3032.71 19965.94 1047 22106 180.59 3032.71
2449.42 15513.07 5713 31934 178.83 2449.42
9172.56 58476.43 293806 2050008 850.46 9172.56 36387422.05 230953686.32
8118.71 50506.70 318229 2019611 669.48 8118.71 230708.52 1424044.39
82.11 782.73 762 6390 -39.70 82.11 53563.25 472749.22
119 711 810 5602 9 119.01 7419 44342
19.53 510.17 15 109 -45.15 19.53 4478.75 115934.16
19 564 5 104 -69 19.09 90765 2682751
3.82 90.89 4 89 -6.40 3.82 1829.45 42366.76
8 139 19 100 4 7.55 4095 75329
78.35 1495.38 131 1520 -139.41 78.35 7710.49 582563.53
112 2771 166 1780 -78 111.78 108121 2680042
183.82 2879.17 912 8108 -230.66 183.82 67581.94 1213613.66
257.43 4185.22 1000 7586 -134.52 257.43 210400.69 5482464.06
242.39 1684.90 1581 15899 40.64 242.39 6371972.09 40570067.60
188.11 1535.55 3520 26504 -74.66 188.11 403292.29 3292172.07
706.17 9997.11 1563 18261 -54.82 706.17 8204.41 73385.81
3232.49 11213.25 2581 17807 2204.65 3232.49 136399.84 473159.74
24.27 188.55 4137 26597 -3.61 24.27 537661.08 3290314.37
20.91 158.92 3522 18448 -0.51 20.91 3479.30 26441.51
730.44 10185.66 5700 44858 -58.43 730.44 545865.48 3363700.18
3253.41 11372.17 6103 36255 2204.14 3253.41 139879.14 499601.24
917.94 12730.18 10808 61002 -2283.78 917.94 50778141.05 563097817.89
998.85 7016.50 6215 51020 192.52 998.85 741583.99 5209320.33
13904.22 114672.97 318855 2235242 -1535.40 13904.22 100219577.04 898447868.71
15516.20 105246.48 342748 2202769 2727.99 15516.20 16332519.89 177192164.20
62

ird
ajo
urn
alJ
an
ua
ry2
01
2
No. of Lives coveredin Social Sector
Amount of Premiumu/w in Social Sector
No. of Policiesin Rural Areas
For themonth
For themonth
For themonth
Up tothe month
For themonth
FOR AND UP TO THE MONTH OF OCTOBER, 2011
Amount of Premiumu/w in Rural Areas
No. ofLives covered *
Up tothe month
Up tothe month
Up tothe month
For themonth
Up tothe month
(Premium in Lakhs)M
63
21.13 544.50 864 10078
18.94 193.52 599 5747
0.00 0.00 0 0
0.00 0.00 0 0
0.00 0.00 0 0 0.00 0.00 0 0
0.00 0.00 0 0 0.00 0.00 0 0
0.33 47.58 4 88
0.68 29.36 14 131
524.18 4780.20 19393 251596
430.35 3686.22 17607 210623
301.97 2731.72 0 0
176.63 1747.50 0 0
826.15 7511.92 19393 251596 0.00 0.00 0 0
606.98 5433.72 17607 210623 0.00 0.00 0 0
0 27 0 186
0 8 3 104
0 6 1 16
0 2 0 6
0 0 0 0
0 0 0 0
0 3 4 80
0 1 5 92
0.13 35.75 5 282 0.00 0.00 0 0
0.36 11.41 8 202 0.00 0.00 0 0
143.10 642.47 167 2642 8.43 36.06 168553 719963
104.72 669.80 1675 9617 5.56 39.23 110418 755881
2.62 3385.32 46 852 0.00 362.10 0 183332
1685.40 5599.06 26 251
0.00 0.00 0 0
0.00 0.00 0 0
2.62 3385.32 46 852 0.00 362.10 0 183332 0 0
1685.40 5599.06 26 251 0.00 0.00 0 0 0 0
78.42 5398.00 3957 24874 13.39 2915.27 215 246744
43.63 848.19 1406 14784 0.55 316.30 1038 50517
1071.88 17565.54 24436 290412 21.82 3313.43 168768 1150039 0 0
2460.71 12785.06 21335 241355 6.11 355.53 111456 806398 0 0
63

ird
ajo
urn
al J
an
ua
ry2
01
2non-life insurance
* Wherever applicable
LINE OF BUSINESS
Fire
Previous year
Marine Cargo
Previous year
Total Premium u/wTotal No. of
Policies IssuedAccretions during
the month (premium)Sum Assured
For themonth
Up tothe month
For themonth
Up tothe month
For themonth
Up tothe month
For themonth
Up tothe month
Marine Hull (IncludingOnshore & Offshore oil energy)
Previous year
Marine (Total)
Previous year (Total)
Aviation
Previous year
Engineering
Previous year
Motor Own Damage
Previous year
Motor Third party
Previous year
Motor (Total)
Previous year (Total)
Workmen's compensation /Employer's liability
Previous year
Public Liability
Previous year
Product Liability
Previous year
Other Liability Covers
Previous year
Liability (Total)
Previous year (Total)
Personal Accident
Previous year
Medical Insurance
Previous year
Overseas Medical Insurance
Previous year
Health (Total)
Previous year (Total)
Crop Insurance
Previous year
Previous year
Credit Guarantee
All Other Miscellaneous
Previous year
Grand Total
Previous year (Total)
BUSINESS FIGURES:
Name of the Insurer: National Insurance Company Limited
64
3827.13 40746.70 35150 303875 -724.08 6235.35 33429307 334015393
4551.21 34511.35 40091 310166 1920.64 8046.15 130106840 1268198267
1280.55 9909.57 9456 78456 85.45 1385.21 3100729 44900214
1195.10 8524.36 7421 53839 319.82 1149.68 1006560545 1060674831
435.54 7683.50 203 1571 -89.53 2845.70 368270 129617097
525.07 4837.80 206 1545 -975.93 -1789.69 548215 105782952
1716.09 17593.07 9659 80027 -4.09 4230.90 3468999 174517311
1720.17 13362.16 7627 55384 -656.11 -639.99 1007108760 1166457783
584.79 2709.20 14 103 554.38 1294.97 1011440736 1027621081
30.41 1414.23 19 161 -95.03 -1388.27 80606 2723771
1503.06 14624.57 2363 20712 -127.21 3454.56 4968008 51486725
1630.27 11170.01 2242 17834 525.80 3031.33 3237305 1023059959
20762.43 119717.42 421312 2782347 6339.18 22622.29 593524 4003204
14423.25 97095.13 384270 2459932 1304.78 8281.51 505479 3292260
13958.23 88218.06 582842 4106282 4886.62 25718.76 591715 3996282
9071.61 62499.30 545574 3638474 709.56 5278.17 504221 3285734
34720.66 207935.48 582842 4106282 11225.80 48341.05 1185239 7999486
23494.86 159594.43 545574 3638474 2014.34 13559.68 1009699 6577994
448.33 3546.90 3900 30980 124.23 922.37 32907 292418
324.10 2624.53 3642 28909 32.81 576.98 20810 216397
5.73 51.13 59 490 0.59 6.22 0 51071
5.14 44.91 50 566 1.43 5.74 3020 16040
22.58 263.94 7 71 -6.30 106.31 19927 162424
28.88 157.63 11 73 16.71 -9.05 31132 161497
118.28 1129.98 476 3584 33.16 219.89 63022 1122342
85.12 910.09 407 2977 44.33 300.39 38704 522327
594.92 4991.95 4442 35125 151.67 1254.80 115855 1628254
443.24 3737.16 4110 32525 95.29 874.06 93666 916261
874.67 7487.48 24050 203154 -605.40 469.20 1394687 22904430
1480.07 7018.28 26117 201983 803.61 1971.41 9022685 52411970
11635.06 103509.94 88810 743735 -351.80 23140.60 112854611 147014946
11986.86 80369.34 90173 681979 5406.78 30832.67 2789872 220763681
32.60 408.77 1482 13009 -3.98 -44.63 0 5743
36.58 453.40 1499 14654 -2.18 2.96 0 1531
11667.66 103918.71 90292 756744 -355.78 23095.97 112854611 147020689
12023.44 80822.74 91672 696633 5404.59 30835.63 2789872 220765212
0.00 0.00 0 0 0.00 -21.96 0 0
0.00 21.96 0 4 0.00 0.74 0 1975
2838.02 25363.84 66207 539707 -49.31 4413.16 4310523 129108003
2887.33 20950.68 82668 604934 658.73 3935.76 27255543 147543360
58327.00 425371.00 815019 6045729 10065.98 92768.00 1173167965 1896301373
48261.00 332603.00 800120 5558098 10671.86 60226.50 1180704977 3888656553
64

ird
ajo
urn
alJ
an
ua
ry2
01
2
No. of Lives coveredin Social Sector
Amount of Premiumu/w in Social Sector
No. of Policiesin Rural Areas
For themonth
For themonth
For themonth
Up tothe month
For themonth
FOR AND UP TO THE MONTH OF OCTOBER, 2011
Amount of Premiumu/w in Rural Areas
No. ofLives covered *
Up tothe month
Up tothe month
Up tothe month
For themonth
Up tothe month
(Premium in Lakhs)M
65
263.35 3656.38 5368 46955 296.63 4105.76 0 0 0 0
350.70 3674.37 6826 47971 357.95 4055.21 0 0 0 0
80.39 518.33 396 3729 183.69 911.47 0 0 0 0
79.21 413.97 377 2764 111.99 574.32 0 0 0 0
9.84 114.60 35 380 6.85 201.80 0 0 0 0
23.04 132.39 49 485 17.09 131.31 0 0 0 0
90.23 632.93 431 4109 190.54 1113.27 0 0 0 0
102.25 546.36 426 3249 129.08 705.62 0 0 0 0
0.00 0.00 0 0 0 0
0.00 2.50 0 0 0 0
104.41 1132.82 312 2474 173.34 1815.32 0 0 0 0
62.19 750.28 293 2261 104.74 1176.15 0 0 0 0
1325.84 8425.01 81053 509504 676.89 4070.81 0 0 0 0
1071.64 6606.11 66537 410308 531.26 3487.67 0 0 0 0
1598.99 10944.74 113329 768413 721.68 4774.62 0 0 0 0
1026.18 6662.47 96145 613860 451.97 3184.96 0 0 0 0
2924.83 19369.75 113329 768413 1398.56 8845.43 0 0 0 0
2097.83 13268.58 96145 613860 983.23 6672.63 0 0 0 0
48.42 413.00 705 5237 48.76 348.87 0 0 0 0
34.60 282.99 655 5068 35.59 241.34 0 0 0 0
0.03 2.48 1 33 0.10 2.60 0 0 0 0
0.08 0.77 11 44 0.06 2.09 0 0 0 0
0.00 5.93 0 2 5.79 11.18 0 0 0 0
0.00 5.93 0 2 7.36 12.32 0 0 0 0
2.49 15.59 28 152 29.07 103.77 0 0 0 0
2.54 14.10 24 145 8.00 76.23 0 0 0 0
50.95 436.99 734 5424 83.72 466.42 0 0 0 0
37.23 303.78 690 5259 51.00 331.99 0 0 0 0
41.66 310.73 3280 29627 33.47 522.13 8561 95057 144008 1216315
38.73 323.17 3724 28938 40.98 639.90 12605 114605 144080 1161812
354.39 4190.60 8826 65260 748.86 8860.34 26905 217339 250427 2069221
881.11 5123.93 9359 67163 1848.69 10365.82 27093 203154 306756 1958187
0.86 14.24 36 472 1521 13318
1.26 16.00 95 537 1558 15153
355.26 4204.83 8862 65732 748.86 8860.34 26905 217339 251948 2082539
882.38 5139.92 9454 67700 1848.69 10365.82 27093 203154 308314 1973340
0.00 0.00 0 0 0.00 0.00 0 0 0 0
0.00 0.00 0 0 0.00 0.00 0 0 0 0
367.12 3549.21 18844 143894 201.22 1674.35 11153 66370 30948 381884
376.75 2986.79 24297 166990 185.15 1798.15 10874 63828 48649 414137
4197.81 33293.64 151160 1066628 3126.34 27403.02 46619 378766 426904 3680738
3948.06 26993.25 141855 936228 3700.82 25747.97 50572 381587 501043 3549289
65

ird
ajo
urn
al J
an
ua
ry2
01
2non-life insurance
* Wherever applicable
LINE OF BUSINESS
Fire
Previous year
Marine Cargo
Previous year
Total Premium u/wTotal No. of
Policies IssuedAccretions during
the month (premium)Sum Assured
For themonth
Up tothe month
For themonth
Up tothe month
For themonth
Up tothe month
For themonth
Up tothe month
Marine Hull (IncludingOnshore & Offshore oil energy)
Previous year
Marine (Total)
Previous year (Total)
Aviation
Previous year
Engineering
Previous year
Motor Own Damage
Previous year
Motor Third party
Previous year
Motor (Total)
Previous year (Total)
Workmen's compensation /Employer's liability
Previous year
Public Liability
Previous year
Product Liability
Previous year
Other Liability Covers
Previous year
Liability (Total)
Previous year (Total)
Personal Accident
Previous year
Medical Insurance
Previous year
Overseas Medical Insurance
Previous year
Health (Total)
Previous year (Total)
Crop Insurance
Previous year
Previous year
Credit Guarantee
All Other Miscellaneous
Previous year
Grand Total
Previous year (Total)
BUSINESS FIGURES:
Name of the Insurer: Raheja QBE General Insurance Company Limited
66
24.87 138.14 1 38 24.87 138.14 41243.53 315011.28
0.82 78.78 3 59 0.82 78.78 2213.94 95881.23
0.17 0.71 1 13 0.17 0.71 2200.57 5681.05
0.00 2.44 23 0.00 2.44 0.00 2860.02
0.17 0.71 1 13 0.17 0.71 2200.57 5681.05
0.00 2.44 0 23 0.00 2.44 0.00 2860.02
0.21 10.17 2 24 0.21 10.17 262.74 14310.50
18.48 21.66 10 18 18.48 21.66 11497.34 15420.08
1.77 10.65 14 96 1.77 10.65 221.26 1241.48
0.91 7.47 10 83 0.91 7.47 130.51 1187.16
0.65 7.24 35 643 0.65 7.24 0.00 0.00
0.08 1.74 43 0.08 1.74
2.42 17.89 35 643 2.42 17.89 221.26 1241.48
0.99 9.20 10 83 0.99 9.20 130.51 1187.16
1.20 8.42 11 23 1.20 8.42 86.88 2341.39
0.00 3.15 2 0.00 3.15 550.00
0.62 2.16 1 3 0.62 2.16 500.00 1500
0.62 2.16 1 3 0.62 2.16 500.00 2500
91.24 741.27 25 160 91.24 741.27 30890.00 216910
33.82 326.31 15 56 33.82 326.31 23235 135226
93.06 751.85 37 186 93.06 751.85 31476.88 220751.73
34.43 331.62 16 61 34.43 331.62 23734.81 138276.02
0.72 16.17 17 33 0.72 16.17 1882.00 38178.00
0.97 20.07 1 17 0.97 20.07 508.50 36804.50
0.00 0.00 0 0 0.00 0.00 0.00 0.00
0.00 0.00 0 0 0.00 0.00 0.00 0.00
83 244.72 7 31 83.45 244.72 3523 41493.42
0.00 1.86 0 28 0.00 1.86 0.00 1443.14
204.90 1179.65 100 968 204.90 1179.65 80810.04 636667.47
55.69 465.63 40 289 55.69 465.63 38085.09 291872.15
66

ird
ajo
urn
alJ
an
ua
ry2
01
2
No. of Lives coveredin Social Sector
Amount of Premiumu/w in Social Sector
No. of Policiesin Rural Areas
For themonth
For themonth
For themonth
Up tothe month
For themonth
FOR AND UP TO THE MONTH OF OCTOBER, 2011
Amount of Premiumu/w in Rural Areas
No. ofLives covered *
Up tothe month
Up tothe month
Up tothe month
For themonth
Up tothe month
(Premium in Lakhs)M
67
22.63 22.63 1 1 0.00 0.00 0.00 0.00
0.00 0.00 0 0 0.00 0.00 0.00 0.00
0.00 0.00 0 0 0.00 0.00 0.00 0.00
0.00 0.00 0 0 0.00 0.00 0.00 0.00
0.00 0.00 0 0 0.00 0.00 0 0
0.00 0.00 0 0 0.00 0.00 0 0
0.00 2.21 0 5 0.00 0.00 0.00 0.00
0.00 0.00 0 0 0.00 0.00 0.00 0.00
0.00 4.14 0 610 0.00 0.00 0.00 0.00
0.00 0.00 0 0 0.00 0.00 0.00 0.00
0.29 0.29 35 35 0.00 0.00 0.00 0.00
0.00 0.00 0 0 0.00 0.00 0.00 0.00
0.29 4.43 35 610 0.00 0.00 0 0
0.00 0.00 0 0 0.00 0.00 0 0
0 0 0 0 0 0 0 0
0 0 0 0 0 0 0 0
0.00 0.00 0 0 0.00 0.00 0.00 0.00
0.00 0.00 0 0 0.00 0.00 0.00 0.00
0.00 0.00 0 0 0.00 0.00 0.00 0.00
0.00 0.00 0 0 0.00 0.00 0.00 0.00
0.00 0.00 0 0 0.00 0.00 0 0
0.00 0.00 0 0 0.00 0.00 0 0
0.04 0.04 16 16 0.70 9.83 578 5062
0.08 0.22 0 0 0.00 0.00 0 0
0.00 0.00 0 0 0.00 0.00 0 0
0.00 0.00 0 0 0.00 0.00 0 0
0.00 0.00 0 0 0.00 0.00 0 0
0.00 0.00 0 0 0.00 0.00 0 0
22.96 29.31 52 632 0.70 9.83 578 5062
0.08 0.22 0 0 0.00 0.00 0 0
67

ird
ajo
urn
al J
an
ua
ry2
01
2non-life insurance
* Wherever applicable
LINE OF BUSINESS
Fire
Previous year
Marine Cargo
Previous year
Total Premium u/wTotal No. of
Policies IssuedAccretions during
the month (premium)Sum Assured
For themonth
Up tothe month
For themonth
Up tothe month
For themonth
Up tothe month
For themonth
Up tothe month
Marine Hull (IncludingOnshore & Offshore oil energy)
Previous year
Marine (Total)
Previous year (Total)
Aviation
Previous year
Engineering
Previous year
Motor Own Damage
Previous year
Motor Third party
Previous year
Motor (Total)
Previous year (Total)
Workmen's compensation /Employer's liability
Previous year
Public Liability
Previous year
Product Liability
Previous year
Other Liability Covers
Previous year
Liability (Total)
Previous year (Total)
Personal Accident
Previous year
Medical Insurance
Previous year
Overseas Medical Insurance
Previous year
Health (Total)
Previous year (Total)
Crop Insurance
Previous year
Previous year
Credit Guarantee
All Other Miscellaneous
Previous year
Grand Total
Previous year (Total)
BUSINESS FIGURES:
Name of the Insurer: Reliance General Insurance Company Limited
68
908.96 7461.03 2328 22106 447.06 920.29 1565222.43 11029339.97
461.90 6540.74 2168 23639 34.90 -2317.45 574382.85 8735606.91
127.90 2695.48 1516 15446 -68.51 1128.10 299565.25 5877831.50
196.41 1567.38 2036 14091 -32.57 -418.49 659983.28 4030518.18
0.00 55.86 0 4 -166.58 -599.85 0.00 -2333.98
166.58 655.71 4 10 122.43 251.29 67594.57 243984.96
127.90 2751.34 1516 15450 -235.09 528.25 299565.25 5875497.52
362.99 2223.09 2040 14101 89.86 -167.20 727577.85 4274503.14
50.31 195.82 2 28 -12.41 -4235.03 270058.35 367707.75
62.72 4430.85 2 32 52.14 2941.24 31032.61 214184.74
854.01 6071.24 214 2565 296.64 3397.52 1437343.53 4811354.22
557.37 2673.72 166 2827 201.26 -2295.58 320596.23 3269706.33
4978.73 40535.00 111162 912586 -1773.25 2255.01 307179.41 2584119.90
6751.98 38279.98 139901 771329 -2086.54 -18122.31 423360.19 2418238.31
3073.69 24545.11 112821 931136 118.13 6666.90
2955.56 17878.21 142807 928079 -912.38 -7449.83
8052.42 65080.10 112821 931136 -1655.12 8921.91 307179.41 2584119.90
9707.54 56158.19 142807 928079 -2998.92 -25572.14 423360.19 2418238.31
35.74 335.65 112 1145 -23.83 -51.12 5264.94 35286.62
59.57 386.77 128 1700 41.64 -121.02 6420.28 37362.26
2.24 72.91 44 466 -0.17 -9.95 2291.17 52110.69
2.41 82.86 13 243 -1.76 -31.42 2746.80 162138.45
0.95 7.50 1 9 0.95 -3.32 1000.00 3360.00
0.00 10.82 0 9 -4.37 -40.41 0.00 2325.00
202.12 1100.61 291 3704 198.04 272.88 40776.24 377089.49
4.08 827.73 -219 3787 -5.72 85.47 3962.86 277664.80
241.05 1516.67 448 5324 174.99 208.50 49332.35 467846.80
66.06 1308.18 -78 5739 29.79 -107.38 13129.94 479490.51
356.10 1828.59 995 14878 -10.71 -1408.17 1833743.11 5064050.10
366.81 3236.76 5113 34874 -151.13 -145.34 1630774.92 6468963.64
1119.77 11906.35 7052 54465 -1784.92 -1789.54 65895.29 531679.50
2904.69 13695.89 6356 136780 1053.73 1268.42 34148.61 383693.22
285.25 2207.80 61561 404620 -42.39 -182.05 2068619.12 15463911.96
327.64 2389.85 61450 420003 54.16 285.24 2228619.44 14455692.75
1405.02 14114.15 68613 459085 -1827.31 -1971.59 2134514.41 15995591.46
3232.33 16085.74 67806 556783 1107.89 1553.66 2262768.05 14839385.97
0 0 0 0 0.00 0.00 0.00 0.00
0.00 0.00 0 0 0.00 0.00 0.00 0.00
0 0 0 0 0.00 0.00 0
0.00 0.00 0 0 0.00 0.00 0.00 0.00
272.72 2676.13 3243 29740 89.88 331.00 2478471.04 5879073.01
182.84 2345.13 3196 38512 128.39 -77.61 266195.59 5312324.27
12268.49 101695.07 190180 1480312 -2732.07 6692.68 10375429.88 52074580.74
15000.56 95002.40 223220 1604586 -1505.82 -26187.80 6249818.23 46012403.82
68

ird
ajo
urn
alJ
an
ua
ry2
01
2
No. of Lives coveredin Social Sector
Amount of Premiumu/w in Social Sector
No. of Policiesin Rural Areas
For themonth
For themonth
For themonth
Up tothe month
For themonth
FOR AND UP TO THE MONTH OF OCTOBER, 2011
Amount of Premiumu/w in Rural Areas
No. ofLives covered *
Up tothe month
Up tothe month
Up tothe month
For themonth
Up tothe month
(Premium in Lakhs)M
69
14.12 733.07 206 2514 0.00 0.00 0.00 0.00
0.66 330.85 21 758
41.01 185.98 98 1115 0.00 0.00 0.00 0.00
0.00 21.85 0 78
0.00 0.00 0 0 0.00 0.00 0.00 0.00
0.00 0.30 0 1
41.01 185.98 98 1115 0.00 0.00 0 0 0 0
0.00 22.15 0 79 0.00 0.00 0 0 0 0
0.00 0.00 0 0 0.00 0.00 0.00 0.00
0.00 0.00 0 0
61.93 390.05 24 360 0.00 0.00 0.00 0.00
0.16 62.46 1 127
452.75 3854.38 11139 92514 0.00 0.00 0.00 0.00
920.16 3519.95 9966 65372
343.05 2567.35 146 1554 0.00 0.00 0.00 0.00
309.93 1690.78 10121 27428
795.81 6421.73 11139 92514 0.00 0.00 0 0 0 0
1230.09 5210.73 10121 65372 0.00 0.00 0 0 0 0
1.19 84.67 8 113 0.00 0.00 0.00 0.00
-1.69 10.01 0 49
0.00 9.98 2 49 0.00 0.00 0.00 0.00
0.00 1.09 0 3
0.00 0.17 0 1 0.00 0.00 0.00 0.00
0.00 0.27 0 1
0.53 13.85 43 832 0.00 0.00 0.00 0.00
0.00 0.98 0 104
1.73 108.67 53 995 0.00 0.00 0 0 0 0
-1.69 12.35 0 157 0.00 0.00 0 0 0 0
1.48 60.36 41 658 0.00 0.00 0.00 0.00
0.23 42.29 51 3397 43.84 127.79 99407.00 462211.00
82.72 1154.62 250 4563 0.00 0.00 0.00 0.00 99178 1651683
6.96 1109.44 88 1874
25.30 192.81 5657 37991 0.00 0.00 0.00 0.00 10710 85253
3.94 103.81 0 27763
108.02 1347.43 5907 42554 0.00 0.00 0 0 109888 1736936
10.90 1213.25 88 29637 0.00 0.00 0 0 0 0
0.00 0.00 0 0 0.00 0.00 0.00 0.00
0.00 0.00 0 0
0 0 0 0 0 0
0.00 0.00 0 0
14.31 518.24 747 5560 12.59 147.12 12625.00 363238.00
3.94 66.81 209 3159 3.15 52.45 246.00 6088.00
1038.42 9765.53 18215 146270 12.59 147.12 12625 363238 109888 1736936
1244.29 6960.88 10491 102686 46.99 180.24 99653 468299 0 0
69

ird
ajo
urn
al J
an
ua
ry2
01
2non-life insurance
* Wherever applicable
LINE OF BUSINESS
Fire
Previous year
Marine Cargo
Previous year
Total Premium u/wTotal No. of
Policies IssuedAccretions during
the month (premium)Sum Assured
For themonth
Up tothe month
For themonth
Up tothe month
For themonth
Up tothe month
For themonth
Up tothe month
Marine Hull (IncludingOnshore & Offshore oil energy)
Previous year
Marine (Total)
Previous year (Total)
Aviation
Previous year
Engineering
Previous year
Motor Own Damage
Previous year
Motor Third party
Previous year
Motor (Total)
Previous year (Total)
Workmen's compensation /Employer's liability
Previous year
Public Liability
Previous year
Product Liability
Previous year
Other Liability Covers
Previous year
Liability (Total)
Previous year (Total)
Personal Accident
Previous year
Medical Insurance
Previous year
Overseas Medical Insurance
Previous year
Health (Total)
Previous year (Total)
Crop Insurance
Previous year
Previous year
Credit Guarantee
All Other Miscellaneous
Previous year
Grand Total
Previous year (Total)
BUSINESS FIGURES:
Name of the Insurer: Royal Sundaram Alliance Insurance Company Limited
70
319.41 3333.07 1873 16243 -31.60 -7.64 468558.64 5954350.24
351.01 3340.72 1903 19434 35.55 525.50 412689.54 5238178.23
239.45 1409.08 2293 18800 150.94 34.94 461542.09 3840082.51
88.51 1374.14 1627 20007 -105.96 66.88 205638.38 3493242.33
0.00 0.00 0 0 0.00 0.00 0.00 0.00
0.00 0.00 0 0 -2.04 -6.60 0.00 0.00
239.45 1409.08 2293 18800 150.94 34.94 461542.09 3840082.51
88.51 1374.14 1627 20007 -108.00 60.27 205638.38 3493242.33
0.00
0.00
263.76 2167.82 97 692 -125.85 64.52 54597.54 426920.58
389.60 2103.30 110 914 64.20 -173.80 227399.66 895485.59
7340.70 42817.20 93110 578296 1901.22 9720.02 355683.48 2257506.72
5439.48 33097.18 76095 461461 913.45 6255.65 277962.23 1758598.65
2417.02 14522.12 546 3698 1126.34 5705.30
1290.68 8816.82 402 3150 -27.25 954.06
9757.72 57339.32 93110 578296 3027.56 15425.32 355683.48 2257506.72
6730.16 41914.00 76095 461461 886.19 7209.71 277962.23 1758598.65
23.10 150.08 41 369 4.22 -0.63 2495.95 20864.95
18.88 150.71 38 299 -2.06 -163.12 4607.15 16874.90
291.73 671.07 39 260 -187.00 -31.07 35920.80 132170.38
478.73 702.14 31 246 421.29 477.71 27136.28 107092.01
135.86 171.85 11 33 87.02 6.56 15836.64 38963.89
48.85 165.29 6 36 -1.51 -85.19 9117.29 36748.39
450.70 992.99 91 662 -95.77 -25.14 54253.38 191999.23
546.46 1018.13 75 581 417.72 229.40 40860.72 160715.30
277.89 2118.42 7518 65461 -48.20 -80.63 2014980.10 14955208.21
326.09 2199.05 4834 41313 114.75 473.70 2330170.69 15286401.69
1294.14 14665.51 21435 153577 -415.90 4501.26 1302956.46 13405107.71
1710.04 10164.25 15568 129773 735.01 3165.52 100689.07 973257.78
1294.14 14665.51 21435 153577 -415.90 4501.26 1302956.46 13405107.71
1710.04 10164.25 15568 129773 735.01 3165.52 100689.07 973257.78
211.70 2060.47 780 5318 106.26 158.46 40165.20 695349.92
105.44 1902.01 44961 323248 -34.48 558.81 161311.56 10481464.78
12814.77 84086.68 127197 839049 2567.45 20071.08 4752736.89 41726525.12
10247.32 64015.61 145173 996731 2110.94 12049.12 3756721.85 38287344.35
70

ird
ajo
urn
alJ
an
ua
ry2
01
2
No. of Lives coveredin Social Sector
Amount of Premiumu/w in Social Sector
No. of Policiesin Rural Areas
For themonth
For themonth
For themonth
Up tothe month
For themonth
FOR AND UP TO THE MONTH OF OCTOBER, 2011
Amount of Premiumu/w in Rural Areas
No. ofLives covered *
Up tothe month
Up tothe month
Up tothe month
For themonth
Up tothe month
(Premium in Lakhs)M
71
2.36 29.28 143 1546
9.56 64.33 316 2232
0.00 0.00 0 0
0.00 0.00 0 0
0.00 0.00 0 0 0.00 0.00 0 0
0.00 0.00 0 0 0.00 0.00 0 0
0.21 2.78 1 20
0.61 5.86 3 23
398.66 2683.52 6161 31370
700.84 2701.06 7282 29635
398.66 2683.52 6161 31370 0.00 0.00 0 0
700.84 2701.06 7282 29635 0.00 0.00 0 0
0.00 0.00 0 0 0.00 0.00 0 0
0.00 0.00 0 0 0.00 0.00 0 0
12.03 106.28 3301 28555 0.32 1.69 1048.00 6184.00
60.59 410.55 39655 259555 2.94 7.11 9913.00 21844.00
548.14 8018.06 6243 42026 362.74 2389.65 90504.00 593173.00 355020.00 2315794.00
475.48 3468.95 10427 88493 282.37 1812.49 78489.00 499756.00 37581.00 342169.00
548.14 8018.06 6243 42026 362.74 2389.65 90504 593173 355020 2315794
475.48 3468.95 10427 88493 282.37 1812.49 78489 499756 37581 342169
230.76 1263.71 3286 18235 0.00 0.00 0.00 0.00
161.51 988.36 2361 14502 0.00 0.00 0.00 0.00
1192.15 12103.64 19135 121752 363.05 2391.34 91552 599357 355020 2315794
1408.59 7639.10 60044 394440 285.31 1819.59 88402 521600 37581 342169
71

ird
ajo
urn
al J
an
ua
ry2
01
2non-life insurance
* Wherever applicable
LINE OF BUSINESS
Fire
Previous year
Marine Cargo
Previous year
Total Premium u/wTotal No. of
Policies IssuedAccretions during
the month (premium)Sum Assured
For themonth
Up tothe month
For themonth
Up tothe month
For themonth
Up tothe month
For themonth
Up tothe month
Marine Hull (IncludingOnshore & Offshore oil energy)
Previous year
Marine (Total)
Previous year (Total)
Aviation
Previous year
Engineering
Previous year
Motor Own Damage
Previous year
Motor Third party
Previous year
Motor (Total)
Previous year (Total)
Workmen's compensation /Employer's liability
Previous year
Public Liability
Previous year
Product Liability
Previous year
Other Liability Covers
Previous year
Liability (Total)
Previous year (Total)
Personal Accident
Previous year
Medical Insurance
Previous year
Overseas Medical Insurance
Previous year
Health (Total)
Previous year (Total)
Crop Insurance
Previous year
Previous year
Credit Guarantee
All Other Miscellaneous
Previous year
Grand Total
Previous year (Total)
BUSINESS FIGURES:
Name of the Insurer: SBI General Insurance Company Limited
72
1328.63 7498.93 17081 87696 1243.45 7290.18 640510.35 4447480.66
85.18 208.75 327 476 85.18 208.75 74764.17 274000.22
17.97 71.57 8 47 17.97 71.57 120474.49 245040.22
0.00 0.00 0 0 0.00 0.00 0.00 0.00
0.00 0.00 0 0 0.00 0.00 0.00 0.00
0.00 0.00 0 0 0.00 0.00 0.00 0.00
17.97 71.57 8 47 17.97 71.57 120474.49 245040.22
0.00 0.00 0 0 0.00 0.00 0.00 0.00
617.92 1600.63 26 66 0.00 1274.85 146402.52 333384.81
178.17 325.78 12 26 178.17 325.78 32.42 84152.97
33.74 382.06 86 556 -5.55 342.77 66795.15 342237.41
39.29 39.29 2 2 39.29 39.29 8223.35 8223.35
200.83 653.84 3052 10158 200.83 653.84 9727.02 21913.58
0.00 0 0 0.00 0.00 0.00 0.00
34.88 114.38 0 0 17.59 26.13
0.00 0.00 0 0 0.00 0.00
235.71 768.22 3052 10158 218.42 679.97 9727.02 21913.58
0.00 0.00 0 0 0.00 0.00 0.00 0.00
0.00 0.00 0 0 0.00 0.00 0.00 0.00
0.00 0.00 0 0 0.00 0.00 0.00 0.00
0.00 0.00 0 0 0.00 0.00 0.00 0.00
0.00 0.00 0 0 0.00 0.00 0.00 0.00
0.00 0.00 0 0 0.00 0.00 0.00 0.00
0.00 0.00 0 0 0.00 0.00 0.00 0.00
0.00 0.00 0 0 0.00 0.00 0.00 0.00
0.00 0.00 0 0 0.00 0.00 0.00 0.00
0.00 0.00 0 0 0.00 0.00 0.00 0.00
0.00 0.00 0 0 0.00 0.00 0.00 0.00
0.00 566.39 0 9 -10.87 110.66 0.00 5788192.00
10.87 455.73 1 3 10.87 455.73 1143.17 39698.71
32.08 248.21 10 27 32.08 248.21 2011.77 8028.98
0.00 0.00 0 0 0.00 0.00 0.00 0.00
0.00 0.00 0 0 0.00 0.00 0.00 0.00
0.00 0.00 0 0 0.00 0.00 0.00 0.00
32.08 248.21 10 27 32.08 248.21 2011.77 8028.98
0.00 0.00 0 0 0.00 0.00 0.00 0.00
0.00 0.00 0 0 0.00 0.00 0.00 0.00
0.00 0.00 0 0 0.00 0.00 0.00 0.00
0.00 0.00 0 0 0.00 0.00 0.00 0.00
0.00 0.00 0 0 0.00 0.00 0.00 0.00
43.95 566.25 1765 5829 41.29 553.18 120473.20 1891755.84
2.66 13.07 28 63 2.66 13.07 11728.21 174041.55
2310.01 11702.26 22028 104388 1536.79 10571.39 1106394.48 13078033.50
316.17 1042.62 370 570 316.17 1042.62 95891.32 580116.80
72

ird
ajo
urn
alJ
an
ua
ry2
01
2
No. of Lives coveredin Social Sector
Amount of Premiumu/w in Social Sector
No. of Policiesin Rural Areas
For themonth
For themonth
For themonth
Up tothe month
For themonth
FOR AND UP TO THE MONTH OF OCTOBER, 2011
Amount of Premiumu/w in Rural Areas
No. ofLives covered *
Up tothe month
Up tothe month
Up tothe month
For themonth
Up tothe month
(Premium in Lakhs)M
73
73.72 964.15 1377 11763 0.00 0.00 0 0
0.00 0.00 0 0 0.00 0.00 0 0
0.00 0.00 0 0 0.00 0.00 0 0
0.00 0.00 0 0 0.00 0.00 0 0
0.00 0.00 0 0 0.00 0.00 0 0
0.00 0.00 0 0 0.00 0.00 0 0
0.00 0.00 0 0 0.00 0.00 0 0
0.00 0.00 0 0 0.00 0.00 0 0
0.00 0.00 0 0 0.00 0.00 0 0
0.00 0.00 0 0 0.00 0.00 0 0
2.46 48.88 18 152 0.00 0.00 0 0
0.00 0.00 0 0 0.00 0.00 0 0
46.51 107.04 746 1768 0.00 0.00 0 0
0.00 0.00 0 0 0.00 0.00 0 0
8.19 19.02 0 0 0.00 0.00 0 0
0.00 0.00 0 0 0.00 0.00 0 0
54.70 126.06 746 1768 0.00 0.00 0 0
0.00 0.00 0 0 0.00 0.00 0 0
0.00 0.00 0 0 0.00 0.00 0 0
0.00 0.00 0 0 0.00 0.00 0 0
0.00 0.00 0 0 0.00 0.00 0 0
0.00 0.00 0 0 0.00 0.00 0 0
0.00 0.00 0 0 0.00 0.00 0 0
0.00 0.00 0 0 0.00 0.00 0 0
0.00 0.00 0 0 0.00 0.00 0 0
0.00 0.00 0 0 0.00 0.00 0 0
0.00 0.00 0 0 0.00 0.00 0 0
0.00 0.00 0 0 0.00 0.00 0 0
0.00 0.00 0 0 0.00 0.00 0 0
0.00 0.00 0 0 0.00 0.00 0 0
0.00 0.00 0 0 0.00 0.00 0 0 633.00 47015.00
0.00 0.00 0 0 0.00 0.00 0 0 0.00 0.00
0.00 0.00 0 0 0.00 0.00 0 0 0.00 0.00
0.00 0.00 0 0 0.00 0.00 0 0 0.00 0.00
0.00 0.00 0 0 0.00 0.00 0 0 633 47015
0.00 0.00 0 0 0.00 0.00 0 0 0 0
0.00 0.00 0 0 0.00 0.00 0 0
0.00 0.00 0 0 0.00 0.00 0 0
0.00 0.00 0 0 0.00 0.00 0 0
0.00 0.00 0 0 0.00 0.00 0 0
9.18 31.59 487 1156 0.00 0.00 0 0
0.00 0.00 0 0 0.00 0.00 0 0
140.06 1170.68 2628 14839 0.00 0.00 0 0 633 47015
0.00 0.00 0 0 0.00 0.00 0 0 0 0
73

ird
ajo
urn
al J
an
ua
ry2
01
2non-life insurance
* Wherever applicable
LINE OF BUSINESS
Fire
Previous year
Marine Cargo
Previous year
Total Premium u/wTotal No. of
Policies IssuedAccretions during
the month (premium)Sum Assured
For themonth
Up tothe month
For themonth
Up tothe month
For themonth
Up tothe month
For themonth
Up tothe month
Marine Hull (IncludingOnshore & Offshore oil energy)
Previous year
Marine (Total)
Previous year (Total)
Aviation
Previous year
Engineering
Previous year
Motor Own Damage
Previous year
Motor Third party
Previous year
Motor (Total)
Previous year (Total)
Workmen's compensation /Employer's liability
Previous year
Public Liability
Previous year
Product Liability
Previous year
Other Liability Covers
Previous year
Liability (Total)
Previous year (Total)
Personal Accident
Previous year
Medical Insurance
Previous year
Overseas Medical Insurance
Previous year
Health (Total)
Previous year (Total)
Crop Insurance
Previous year
Previous year
Credit Guarantee
All Other Miscellaneous
Previous year
Grand Total
Previous year (Total)
BUSINESS FIGURES:
Name of the Insurer: Shriram General Insurance Company Limited
74
32.23 424.04 95 1109 -8.20 226.14 108203.65 1004072.39
40.43 197.90 90 625 15.23 120.63 75259.76 289906.45
1.27 108.63 90 701 -0.73 94.37 1583.59 317330.76
2.00 14.26 55 225 2.00 14.26 1976.13 14818.22
0.00 0.00 0 0 0.00 0.00 0.00 0.00
0.00 0.00 0 0 0.00 0.00 0.00 0.00
1.27 108.63 90 701 -0.73 94.37 1583.59 317330.76
0.00 0.00 0 0 0.00 0.00 0.00 0.00
0.00 0.00 0 0 0.00 0.00 0.00 0.00
0.00 0.00 0 0 0.00 0.00 0.00 0.00
37.17 200.40 42 387 23.64 99.58 22427.99 91645.48
13.53 100.82 39 178 0.72 62.30 12648.70 88567.15
4611.43 26878.94 143038 857176 1013.63 6956.33 470643.18 2735369.96
3597.80 19922.61 104505 519483 1867.39 11521.22 275083.54 1542792.30
6376.48 35351.61 143089 858126 3191.48 17145.53 0.00 0.00
3185.00 18206.08 105790 592086 1367.83 9457.52 0.00 0.00
10987.91 62230.56 143089 858126 4205.11 24101.87 470643.18 2735369.96
6782.80 17150.24 105790 592086 3235.22 15129.86 0.00 0.00
1.61 19.43 24 150 0.59 5.92 56.62 389.40
1.02 13.51 8 64 0.78 4.56 68.04 172.75
0.00 0.00 0 0 0.00 0.00 0.00 0.00
0.00 0.00 0 0 0.00 0.00 0.00 0.00
0.00 0.00 0 0 0.00 0.00 0.00 0.00
0.00 0.00 0 0 0.00 0.00 0.00 0.00
11.09 20.62 12 63 10.60 6.37 11034.00 16816.91
0.49 14.25 3 47 0.43 13.22 157.00 9556.31
12.70 40.05 36 213 11.19 12.29 11090.62 17206.31
1.51 9.98 11 47 -0.47 8.12 0.00 386.04
122.74 161.72 350 5024 111.83 105.58 169960.81 197715.72
10.91 56.14 1435 9219 -59.42 -51.28 5459.09 50494.69
0.00 0.00 0 0 0.00 0.00 0.00 0.00
0.00 0.00 0 0 0.00 0.00 0.00 0.00
0.00 0.00 0 0 0.00 0.00 0.00 0.00
0.00 0.00 0 0 0.00 0.00 0.00 0.00
0.00 0.00 0 0 0.00 0.00 0.00 0.00
0.00 0.00 0 0 0.00 0.00 0.00 0.00
0.00 0.00 0 0 0.00 0.00 0.00 0.00
0.00 0.00 0 0 0.00 0.00 0.00 0.00
0.00 0.00 0 0 0.00 0.00 0.00 0.00
0.00 0.00 0 0 0.00 0.00 0.00 0.00
17.06 210.31 91 959 13.27 187.97 511100.27 1117391.56
3.79 22.34 96 812 1.70 3.60 6761.29 44506.57
11211.08 63375.72 143793 866519 4356.11 24827.81 1295010.12 5480732.19
6852.97 17537.42 107461 602967 3192.98 15273.23 100128.84 473860.90
74

ird
ajo
urn
alJ
an
ua
ry2
01
2
No. of Lives coveredin Social Sector
Amount of Premiumu/w in Social Sector
No. of Policiesin Rural Areas
For themonth
For themonth
For themonth
Up tothe month
For themonth
FOR AND UP TO THE MONTH OF OCTOBER, 2011
Amount of Premiumu/w in Rural Areas
No. ofLives covered *
Up tothe month
Up tothe month
Up tothe month
For themonth
Up tothe month
(Premium in Lakhs)M
75
0.00 0.00 0 0 0.00 0.00 0 0
0.00 0.00 0 0 0.00 0.00 0 0
0.00 0.00 0 0 0.00 0.00 0 0
0.00 0.00 0 0 0.00 0.00 0 0
0.00 0.00 0 0 0.00 0.00 0 0
0.00 0.00 0 0 0.00 0.00 0 0
0.00 0.00 0 0 0.00 0.00 0 0
0.00 0.00 0 0 0.00 0.00 0 0
0.00 0.00 0 0 0.00 0.00 0 0
0.00 0.00 0 0 0.00 0.00 0 0
0.00 0.00 0 0 0.00 0.00 0 0
0.00 0.00 0 0 0.00 0.00 0 0
267.17 1601.46 10704 60585 0.00 0.00 0 0
223.04 1143.30 6629 33200 0.00 0.00 0 0
301.49 1722.67 10711 60626 0.00 0.00 0 0
160.47 877.74 6654 33466 0.00 0.00 0 0
568.66 3324.13 10711 60626 0.00 0.00 0 0
383.51 2021.04 6654 33466 0.00 0.00 0 0
0.00 0.00 0 0 0.00 0.00 0 0
0.00 0.00 0 0 0.00 0.00 0 0
0.00 0.00 0 0 0.00 0.00 0 0
0.00 0.00 0 0 0.00 0.00 0 0
0.00 0.00 0 0 0.00 0.00 0 0
0.00 0.00 0 0 0.00 0.00 0 0
0.00 0.00 0 0 0.00 0.00 0 0
0.00 0.00 0 0 0.00 0.00 0 0
0.00 0.00 0 0 0.00 0.00 0 0
0.00 0.00 0 0 0.00 0.00 0 0
0.00 0.00 0 0 0.00 0.00 0 0
0.00 0.00 0 0 0.00 0.00 0 0
0.00 0.00 0 0 0.00 0.00 0 0 0 0
0.00 0.00 0 0 0.00 0.00 0 0 0 0
0.00 0.00 0 0 0.00 0.00 0 0 0 0
0.00 0.00 0 0 0.00 0.00 0 0 0 0
0.00 0.00 0 0 0.00 0.00 0 0 0 0
0.00 0.00 0 0 0.00 0.00 0 0 0 0
0.00 0.00 0 0 0.00 0.00 0 0
0.00 0.00 0 0 0.00 0.00 0 0
0.00 0.00 0 0 0.00 0.00 0 0
0.00 0.00 0 0 0.00 0.00 0 0
0.00 0.00 0 0 0.00 0.00 0 0
0.00 0.00 0 0 0.00 0.00 0 0
568.66 3324.13 10711 60626 0.00 0.00 0.00 0.00 0.00 0.00
383.51 2021.04 6654 33466 0.00 0.00 0.00 0.00 0.00 0.00
75

ird
ajo
urn
al J
an
ua
ry2
01
2non-life insurance
* Wherever applicable
LINE OF BUSINESS
Fire
Previous year
Marine Cargo
Previous year
Total Premium u/wTotal No. of
Policies IssuedAccretions during
the month (premium)Sum Assured
For themonth
Up tothe month
For themonth
Up tothe month
For themonth
Up tothe month
For themonth
Up tothe month
Marine Hull (IncludingOnshore & Offshore oil energy)
Previous year
Marine (Total)
Previous year (Total)
Aviation
Previous year
Engineering
Previous year
Motor Own Damage
Previous year
Motor Third party
Previous year
Motor (Total)
Previous year (Total)
Workmen's compensation /Employer's liability
Previous year
Public Liability
Previous year
Product Liability
Previous year
Other Liability Covers
Previous year
Liability (Total)
Previous year (Total)
Personal Accident
Previous year
Medical Insurance
Previous year
Overseas Medical Insurance
Previous year
Health (Total)
Previous year (Total)
Crop Insurance
Previous year
Previous year
Credit Guarantee
All Other Miscellaneous
Previous year
Grand Total
Previous year (Total)
BUSINESS FIGURES:
Name of the Insurer: Tata AIG General Insurance Company Limited
76
1,486 15,933 21,727 124,293 - 6,239,345 76,740,911
805 13,856 9,391 72,632 - - 4,270,957 101,315,991
1,770 11,579 2,644 16,421 - 408,100 2,786,354
1,316 9,163 3,226 12,050 - - 403,863 6,801,189
- - - - - - -
- - - - - - - -
1,770 11,579 2,644 16,421 - - 408,100 2,786,354
1,316 9,163 3,226 12,050 - - 403,863 6,801,189
- - - - - -
- - - - - - - -
37 3,588 105 724 - 1,738,087 8,202,849
260 2,899 110 545 - - 834,976 9,634,447
5,818 34,497 137,396 852,322 - 292,910 1,853,514
3,358 17,599 74,116 419,970 - - 182,542 1,008,957
1,002 5,996 137,396 750,583 - -
548 3,003 74,116 419,970 - - - -
6,820 40,493 137,396 852,322 - - 292,910 1,853,514
3,906 20,602 74,116 419,970 - - 182,542 1,008,957
85 893 21 200 - 36,313 306,322
76 594 20 132 - - 48,346 175,240
225 1,704 33 315 - 168,812 4,060,490
176 1,915 45 349 - - 1,410,602 2,790,195
31 461 9 77 - 45,645 996,515
29 359 8 119 - - 264,513 7,035,558
777 6,976 595 4,548 - 170,118 1,999,054
463 5,108 535 3,848 - - 165,713 2,106,876
1,119 10,033 658 5,140 - - 420,888 7,362,380
744 7,977 608 4,448 - - 1,889,173 12,107,869
868 7,478 10,628 70,561 - 971,234 6,500,805
974 7,587 7,243 56,451 - - 611,721 5,230,191
179 883 - 30 - 65,663 65,663
21 1,250 - - - - - -
634 6,497 28,784 246,838 - 3,778,988 29,529,047
701 5,933 29,816 208,989 - - 3,610,073 24,119,778
813 7,380 28,784 246,868 - - 3,844,651 29,594,710
722 7,183 29,816 208,989 - - 3,610,073 24,119,778
- - - - - - -
- - - - - - - -
- - - - - - -
- - - - - - - -
327 2,179 6,514 49,756 - 7,065 73,629
266 1,359 9,639 28,323 - - 11,488 59,789
13,239 98,661 208,456 1,366,085 - - 13,922,279 133,115,153
8,992 70,626 134,149 803,408 - - 11,814,792 160,278,210
76

ird
ajo
urn
alJ
an
ua
ry2
01
2
No. of Lives coveredin Social Sector
Amount of Premiumu/w in Social Sector
No. of Policiesin Rural Areas
For themonth
For themonth
For themonth
Up tothe month
For themonth
FOR AND UP TO THE MONTH OF OCTOBER, 2011
Amount of Premiumu/w in Rural Areas
No. ofLives covered *
Up tothe month
Up tothe month
Up tothe month
For themonth
Up tothe month
(Premium in Lakhs)M
77
74 1,189 437 2,192 - -
20 645 60 480 - - - -
109 1,350 108 915 - -
52 563 73 352 - - - -
- - - - - -
- - - - - - - -
109 1,350 108 915 - - - - - -
52 563 73 352 - - - - - -
- - - - - -
- - - - - - - -
3 204 3 41 - -
3 52 1 13 - - - -
1,062 5,788 30,061 174,701 - -
223 1,240 5,266 31,383 - - - -
- - - - - -
- - - - - - - -
1,062 5,788 30,061 174,701 - - - - - -
223 1,240 5,266 31,383 - - - - - -
8 35 1 14 - -
1 6 1 5 - - - -
38 463 76 545 - -
10 250 14 147 - - - -
- - - - - -
- - - - - - - -
- - - - - -
- - - - - - - -
46 498 77 559 - - - - - -
11 256 15 152 - - - - - -
64 636 2,188 16,099
131 418 698 4,999 - 2 - 13,143
179 883 - 30 179 883 130,369 658,216
- - - - - - - -
- 4 1 207 - -
21 1,266 65 603 - - - -
179 887 1 237 179 883 130,369 658,216 - -
21 1,266 65 603 - - - - - -
- - - - - -
- - - - - - - -
- - - - - -
- - - - - - - -
168 1,088 6,894 50,750 - -
78 422 6,165 21,808 - - - -
1,705 11,640 39,769 245,494 179 883 130,369 658,216 - -
540 4,862 12,343 59,790 - 2 - 13,143 - -
77

ird
ajo
urn
al J
an
ua
ry2
01
2non-life insurance
* Wherever applicable
LINE OF BUSINESS
Fire
Previous year
Marine Cargo
Previous year
Total Premium u/wTotal No. of
Policies IssuedAccretions during
the month (premium)Sum Assured
For themonth
Up tothe month
For themonth
Up tothe month
For themonth
Up tothe month
For themonth
Up tothe month
Marine Hull (IncludingOnshore & Offshore oil energy)
Previous year
Marine (Total)
Previous year (Total)
Aviation
Previous year
Engineering
Previous year
Motor Own Damage
Previous year
Motor Third party
Previous year
Motor (Total)
Previous year (Total)
Workmen's compensation /Employer's liability
Previous year
Public Liability
Previous year
Product Liability
Previous year
Other Liability Covers
Previous year
Liability (Total)
Previous year (Total)
Personal Accident
Previous year
Medical Insurance
Previous year
Overseas Medical Insurance
Previous year
Health (Total)
Previous year (Total)
Crop Insurance
Previous year
Previous year
Credit Guarantee
All Other Miscellaneous
Previous year
Grand Total
Previous year (Total)
BUSINESS FIGURES:
Name of the Insurer: The New India Assurance Company Limited
78
5444.56 72575.63 47445 437762 -1528.83 2231.46 853675463.90 1078951922.09
6973.39 70344.17 57259 535656 38155139.01 722902709.32
1934.46 15913.50 24678 154205 -64.36 727.96 19143950.00 73329351.10
1998.82 15185.54 26123 171245 12867502.35 73362470.31
5536.46 19393.71 975 4877 3440.16 3694.32 3001416.17 18668284.32
2096.30 15699.39 851 6856 2983094.83 19165508.71
7470.92 35307.21 25653 159082 3375.80 4422.28 22145366.17 91997635.42
4095.12 30884.93 26974 178101 15850597.18 92527979.02
1482.40 7375.17 93 508 388.02 3041.63 24134882.38 90299404.85
1094.38 4333.54 149 500 166437.98 8589426.56
3416.55 22594.32 15688 76927 -552.51 4064.76 18840632.17 75970688.12
3969.06 18529.56 4508 39784 49264175.45 274210926.17
13827.62 85167.35 570694 3411945 1518.57 11981.93 5893893.91 34708846.37
12309.05 73185.42 372507 2969665 -5845167.03 17607886.40
11810.76 77667.36 649263 3609813 4343.76 25483.55
7467.00 52183.81 310421 2334351
25638.38 162834.71 649263 3609813 5862.33 37465.48 5893893.91 34708846.37
19776.05 125369.23 310421 2334351 -5845167.03 17607886.40
399.94 3034.90 -8875 33469 -156.06 -29.10 59408.60 3180044.38
556.00 3064.00 499 41681 128813.00 625090.00
28.31 192.06 10 558 10.31 146.06 2744.04 20472.90
18.00 46.00 405 631 -3843322.00 526899.00
173.78 287.90 12 58 153.78 -48.10 767.65 3019.98
20.00 336.00 42 125 -13190.00 235366.00
703.53 9600.83 7788 47637 188.53 3662.83 609840.23 1460330.96
515.00 5938.00 3986 32907 3165980.00 4282554.00
1305.56 13115.69 -1065 81722 196.56 146986.08 672760.52 4663868.22
1109.00 9384.00 4932 75344 -561719.00 5669909.00
1021.95 9235.62 15398 315181 -117.55 1846.22 -2890624.21 31035413.62
1139.50 7389.40 40251 329077 -141115.24 54238754.47
12364.79 142256.83 151016 853941 -1048.49 18398.67 14943754.72 115604002.98
13413.28 123858.16 102122 728474 18636209.88 407744005.10
144.18 695.52 1946 18088 69.36 -202.92 35409.18 149906.82
74.82 898.44 3088 37397 28192.82 206897.97
12508.97 142952.35 152962 872029 -979.13 146986.08 14979163.90 115753909.80
13488.10 124756.60 105210 765871 18664402.70 407950903.07
0.00 0.00 0 0 0.00 0.00 0.00 0.00
0.00 0.00 0 0 0.00 0.00
0.00 0.55 0 15 0.03 -2.17 0.00 3.05
-0.03 2.72 0 53 0.00 6.25
2867.88 31417.15 194918 626186 -51.28 3544.13 177348862.55 538142395.90
2919.16 27873.02 182163 820735 -13880848.63 205483659.89
61157.17 497408.40 1100355 6179225 6593.44 78541.23 1114800401.29 2061524087.44
54563.73 418867.17 731867 5079472 101671902.42 1789182160.15
78

ird
ajo
urn
alJ
an
ua
ry2
01
2
No. of Lives coveredin Social Sector
Amount of Premiumu/w in Social Sector
No. of Policiesin Rural Areas
For themonth
For themonth
For themonth
Up tothe month
For themonth
FOR AND UP TO THE MONTH OF OCTOBER, 2011
Amount of Premiumu/w in Rural Areas
No. ofLives covered *
Up tothe month
Up tothe month
Up tothe month
For themonth
Up tothe month
(Premium in Lakhs)M
79
1435.43 6259.97 9690 54333 750.89 2121.53
254.85 2805.07 6848 53277 238.69 2378.88
225.70 1392.47 2047 7563 288.56 498.29
73.34 574.52 661 5532 74.45 454.21
22.11 124.88 75 268 1.20 8.22
1.65 21.89 21 168 5.56 50.14
247.81 1517.35 2122 7831 289.76 506.51 0 0
74.99 596.41 682 5700 80.01 504.35 0 0
49.64 62.60 0 1 0.00 0.00 0 0
0.00 0.00 0 0 0.00 0.00 0 0
326.46 1235.51 2496 7805 785.41 1298.23 0 0
68.07 591.18 188 2583 50.16 511.05 0 0
6029.70 20733.55 94862 393887 1453.68 4352.72 36998 70031
650.64 3933.53 19649 205265 467.25 3477.21 2014 14669
5359.72 19488.63 72761 361396 958.51 3976.26 16619 74876
313.99 2689.79 15525 166419 296.41 2274.02 3398 10651
11389.42 40222.18 72761 361396 2412.19 8328.98 53617 144907
964.63 6623.32 15525 166419 763.66 5751.23 5412 25320
171.44 663.20 788 3276 69.66 269.54 1856 12901
54.00 350.00 665 3120 50.00 247.00 1022 11958
0.15 0.42 1 3 -0.14 0.00 0 0
-1.00 0.00 -3 7 0.00 11.00 0 0
3.26 15.21 1 7 0.00 0.76 0 0
0.00 18.00 0 4 0.00 37.00 0 0
346.01 1232.18 3361 10834 224.81 417.19 261 5421
129.00 311.00 564 3516 29.00 137.00 1 623
520.86 1911.01 4151 14120 294.33 687.49 2117 18322
182.00 679.00 1226 6647 79.00 432.00 1023 12581
217.80 766.52 6046 36265 -29.72 448.07 37286 409813
54.66 400.39 -250 24121 60.70 416.47 26151 212875
1399.63 5786.02 10612 58691 1394.59 5290.23 140701 2554139 50495426 55344116
901.29 5107.76 3963 88313 702.37 4065.78 684304 2181804 622057 3984950
4.83 26.29 92 1313 22.66 24.59 -4283 5303 -3803 13412
21.42 81.99 402 1911 12.86 72.76 781 5259 1880 29219
1404.46 5812.31 10704 60004 1417.25 5314.82 136418 2559442 50491623 55357528
922.71 5189.75 4365 90224 715.23 4138.54 685085 2187063 623937 4014169
0.00 0.00 0 0 0.00 0.00 0 0
0.00 0.00 0 0 0.00 0.00 0 0
0.00 0.00 0 0 0.00 0.00 0 0
0.00 0.00 0 0 0.00 0.00 0 0
500.61 7161.76 27963 153616 317.29 1846.89 38664 3194489
1102.43 6244.49 23002 174857 316.56 1710.83 1539 96893
16092.49 64949.21 135933 695371 6237.40 20552.52 268102 6326973
3624.34 23129.61 51586 523828 2304.01 15843.35 719210 2534732
79

ird
ajo
urn
al J
an
ua
ry2
01
2non-life insurance
* Wherever applicable
LINE OF BUSINESS
Fire
Previous year
Marine Cargo
Previous year
Total Premium u/wTotal No. of
Policies IssuedAccretions during
the month (premium)Sum Assured
For themonth
Up tothe month
For themonth
Up tothe month
For themonth
Up tothe month
For themonth
Up tothe month
Marine Hull (IncludingOnshore & Offshore oil energy)
Previous year
Marine (Total)
Previous year (Total)
Aviation
Previous year
Engineering
Previous year
Motor Own Damage
Previous year
Motor Third party
Previous year
Motor (Total)
Previous year (Total)
Workmen's compensation /Employer's liability
Previous year
Public Liability
Previous year
Product Liability
Previous year
Other Liability Covers
Previous year
Liability (Total)
Previous year (Total)
Personal Accident
Previous year
Medical Insurance
Previous year
Overseas Medical Insurance
Previous year
Health (Total)
Previous year (Total)
Crop Insurance
Previous year
Previous year
Credit Guarantee
All Other Miscellaneous
Previous year
Grand Total
Previous year (Total)
BUSINESS FIGURES:
Name of the Insurer: The Oriental Insurance Company Limited
80
5216.66 51599.03 34520 293887 942.70 7324.10 10919614.12 113669612.98
4273.96 44274.93 40977 305555
2442.16 16473.27 12992 102562 69.01 2895.77 6172226.90 52203595.21
2373.15 13577.50 14162 105495
897.86 13073.76 445 3091 -436.70 -592.12 113457.77 9397024.65
1334.56 13665.88 403 3004
3340.02 29547.03 13437 105653 -367.69 2303.65 6285684.67 61600619.86
3707.71 27243.38 14565 108499
1083.83 4846.37 19 246 849.63 1308.58 35142.68 3746696.52
234.20 3537.79 42 228
2526.24 17385.40 2829 23344 1027.27 1318.41 1288805.74 13883068.18
1498.97 16066.99 3323 24334
9424.17 57850.80 462517 3065014 1261.61 3834.38 584303.94 3807837.10
8162.56 54016.42 439386 2901230
9433.32 61421.58 601563 4169178 2887.40 16575.28 0.00 0.00
6545.92 44846.30 593709 4007501
18857.49 119272.38 601563 4169178 4149.01 20409.66 584303.94 3807837.10
14708.48 98862.72 593709 4007501
449.85 4426.79 4316 36910 0.76 425.56 7249.71 68904.15
449.09 4001.23 4869 36158
3.45 60.36 42 263 -0.72 -0.01 62561.89 9426851.95
4.17 60.37 26 50
7.97 291.15 6 71 -14.18 -17.22 84364.36 1032645.35
22.15 308.37 15 89
196.49 1914.60 2179 19605 -48.06 210.58 2662257.57 12499681.19
244.55 1704.02 2244 17268
657.76 6692.90 6543 56849 -62.20 618.91 2816433.53 23028082.64
719.96 6073.99 7154 53565
743.89 10177.57 65431 537723 -276.51 1837.53 1408636.23 25898163.83
1020.40 8340.04 79679 612589
8331.49 73831.18 63618 519167 -4381.69 1955.16 294468.75 3370911.43
12713.18 71876.02 63860 481828
36.10 489.51 1311 14323 -4.22 -25.08 120597.73 1408032.80
40.32 514.59 1546 15522
8367.59 74320.69 64929 533490 -4385.91 1930.08 415066.48 4778944.23
12753.50 72390.61 65406 497350
0.00 0.00 0 0 0.00 0.00 0.00 0.00
0.00 0.00 0 0
0.00 0.00 0 0 0.00 0.00 0.00 0.00
0.00 0.00 0 0
4302.10 38096.63 61515 519059 275.49 8114.08 3952549.33 51680916.74
4026.61 29982.55 85376 630689
45095.58 351938.00 850786 6239429 2151.79 45165.00 27706236.72 302093942.08
42943.79 306773.00 890231 6240310 0.00 0.00
80

ird
ajo
urn
alJ
an
ua
ry2
01
2
No. of Lives coveredin Social Sector
Amount of Premiumu/w in Social Sector
No. of Policiesin Rural Areas
For themonth
For themonth
For themonth
Up tothe month
For themonth
FOR AND UP TO THE MONTH OF OCTOBER, 2011
Amount of Premiumu/w in Rural Areas
No. ofLives covered *
Up tothe month
Up tothe month
Up tothe month
For themonth
Up tothe month
(Premium in Lakhs)M
81
371.95 3090.00 6267 53094 0.00 0.00 0 0 0 0
291.18 2158.64 7092 51132 1314.68 14173.94 0 0 0 0
162.93 592.84 602 4893 0.00 0.00 0 0 0 0
63.14 484.28 810 4866 356.07 3182.92 0 0 0 0
10.66 782.99 217 1084 0.00 0.00 0 0 0 0
15.83 84.29 218 1218 305.90 1845.69 0 0 0 0
173.59 1375.83 819 5977 0.00 0.00 0 0 0 0
78.97 568.57 1028 6084 661.97 5028.61 0 0 0 0
0.00 0.00 0 0 0.00 0.00 0 0 0 0
0.00 0.00 0 0 0.00 0.00 0 0 0 0
112.79 737.18 352 3285 0.00 0.00 0 0 0 0
88.46 630.56 492 3304 400.04 3175.03 0 0 0 0
1719.86 10891.37 85936 559320 0.00 0.00 0 0 0 0
1457.82 9379.49 76867 491429 2376.88 15729.28 0 0 0 0
1878.54 12810.56 115851 796871 0.00 0.00 156054 1632813 741 10012027
1256.38 8441.32 104778 693674 1816.99 12627.14 345168 2403857 1061404 6233969
3598.40 23701.93 115851 796871 0.00 0.00 156054 1632813 741 10012027
2714.20 17820.81 104778 693674 4193.87 28356.42 345168 2403857 1061404 6233969
64.17 591.14 717 6136 128.43 1151.16 0 7917 0 52988
51.69 500.98 781 6116 130.33 1051.36 114438 116907 114876 617821
0.09 3.25 2 13 0.00 0.00 0 0 0 0
0.41 2.79 3 14 1.46 12.52 0 0 0 0
0.00 0.76 0 2 0.00 0.00 0 0 0 0
0.01 9.13 0 4 1.17 75.27 0 0 0 0
12.46 141.18 146 1720 0.00 0.00 0 0 0 0
16.74 122.30 169 1415 95.03 754.94 150 976 1806 5034
76.72 736.33 865 7871 128.43 1151.16 0 7917 0 52988
68.85 635.20 953 7549 227.99 1894.09 114588 117883 116682 622855
63.91 788.27 14144 112670 216.07 2043.19 114588 320529 297524 622891
74.87 756.58 17121 135682 350.44 2659.35 916692 1106999 965595 3363882
235.06 2063.14 4387 33105 1587.47 13776.75 917813 1109328 116 308993
195.81 1513.45 4216 28832 1770.47 12177.17 1828810 2057498 2548235 4394715
0.74 15.41 31 449 0.00 0.00 0 0 0 0
1.94 17.53 45 448 11.20 137.06 36 846 188 4725
235.80 2078.55 4418 33554 1587.47 13776.75 917813 1109328 116 308993
197.75 1530.98 4261 29280 1781.67 12314.23 1828846 2058344 2548423 4399440
0.00 0.00 0 0 0.00 0.00 0 0 0 0
0.00 0.00 0 0 0.00 0.00 0 0 0 0
0.00 0.00 0 0 0.00 0.00 0 0 0 0
0.00 0.00 0 0 0.00 0.00 0 0 0 0
824.39 11032.49 19784 170015 678.63 9690.68 1939 536097 2086 1554857
824.39 7897.49 28283 194916 1056.29 7419.00 363197 567147 547562 4643570
5457.55 43540.58 162500 1183337 2610.60 26661.78 1190394 3606684 300467 12551756
4338.67 31998.83 164008 1121621 9986.95 75020.67 3568491 6254230 5239666 19263716
81

ird
ajo
urn
al J
an
ua
ry2
01
2non-life insurance
* Wherever applicable
LINE OF BUSINESS
Fire
Previous year
Marine Cargo
Previous year
Total Premium u/wTotal No. of
Policies IssuedAccretions during
the month (premium)Sum Assured
For themonth
Up tothe month
For themonth
Up tothe month
For themonth
Up tothe month
For themonth
Up tothe month
Marine Hull (IncludingOnshore & Offshore oil energy)
Previous year
Marine (Total)
Previous year (Total)
Aviation
Previous year
Engineering
Previous year
Motor Own Damage
Previous year
Motor Third party
Previous year
Motor (Total)
Previous year (Total)
Workmen's compensation /Employer's liability
Previous year
Public Liability
Previous year
Product Liability
Previous year
Other Liability Covers
Previous year
Liability (Total)
Previous year (Total)
Personal Accident
Previous year
Medical Insurance
Previous year
Overseas Medical Insurance
Previous year
Health (Total)
Previous year (Total)
Crop Insurance
Previous year
Previous year
Credit Guarantee
All Other Miscellaneous
Previous year
Grand Total
Previous year (Total)
BUSINESS FIGURES:
Name of the Insurer: United India Insurance Company Limited
82
8594.00 58302.00 89360 545642 2376.00 8965.00 13739408 93208633
6218.00 49337.00 84492 514178 1086.36 11497.01 9940847 78948574
1917.00 19284.00 19773 201744 129.00 3069.00 4065748 40899258
1788.00 16215.00 21594 190984 354.84 -584.36 3792153 34398257
1832.00 13404.00 1298 15977 423.00 2236.00 658993 4821583
1409.00 11168.00 1302 13838 592.04 2464.26 506835 4014941
3749.00 32688.00 21071 217721 552.00 5305.00 4724740 45720840
3197.00 27383.00 22896 204822 946.88 1879.90 4298987 38413198
121.00 512.00 53 489 36.00 91.00 18155 76819
85.00 421.00 50 470 -57.66 67.24 12753 63166
2937.00 27511.00 13657 83114 9.00 5522.00 1265948 11858190
2928.00 21989.00 18049 78993 621.32 6671.57 1262069 9484337
11998.00 74367.00 515618 3546682 2781.00 12908.00 1702453 10552283
9217.00 61459.00 449920 3057776 49.15 10946.68 1307843 8720706
11966.00 78536.00 801628 5874631 3392.00 25226.00 0
8574.00 53310.00 721184 4978058 2125.40 19620.96 0 0
23964.00 152903.00 801628 5874631 6173.00 38134.00 1702453 10552283
17791.00 114769.00 721184 4978058 2174.55 30567.64 1307843 8720706
1163.72 3995.94 7387 49505 313.14 601.61 0
850.58 3394.33 8039 46803 453.95 520.86 0 0
549.77 1066.69 484 4527 170.00 252.13 93181 180795
379.77 814.56 573 4012 389.70 326.04 64368 141771
388.60 709.46 136 1144 212.31 231.93 77318 141158
176.29 477.53 158 1135 163.43 210.12 35076 95015
1035.58 2208.91 1519 15068 249.22 346.33 315063 672035
786.36 1862.58 1768 13767 534.84 372.75 239241 566670
3137.67 7981.00 9526 70244 944.67 1432.00 485562 993988
2193.00 6549.00 10538 65717 1541.92 1429.77 338684 803455
1811.00 8182.00 38191 338756 1110.00 1690.00 5963119 26941054
701.00 6492.00 37131 334760 76.90 633.42 2308199 21377622
14786.69 118634.78 81705 939104 3900.29 29989.44 2042565 16387660
10886.40 88645.34 76997 834292 2497.82 26162.38 1503797 12245057
981.31 6770.22 3516 73324 88.71 1055.56 288706 1991828
892.60 5714.67 2446 76497 59.60 1093.85 262607 1681345
15768.00 125405.00 85220 1012427 3989.00 31045.00 2331271 18379488
11779.00 94360.00 79443 910790 2557.42 27256.22 1766404 13926402
0.00 0.00 0 0 0.00 0.00 0
0.00 0.00 0 0 -0.14 -0.39 0 0
0.00 0.00 0 0 0.00 0.00 0
0.00 0.00 0 0 -1.76 -16.63 0 0
1595.33 38230.00 143716 1241992 -2374.67 5787.00 307533 7369638
3970.00 32443.00 161944 1136795 -285.00 -9934.27 765301 6254049
61677.00 451714.00 1202422 9385016 12815.00 97971.00 30538188.56 215100932.72
48862.00 353743.00 1135727 8224583 8660.79 70051.47 22001087.84 177991508.52
82

ird
ajo
urn
alJ
an
ua
ry2
01
2
No. of Lives coveredin Social Sector
Amount of Premiumu/w in Social Sector
No. of Policiesin Rural Areas
For themonth
For themonth
For themonth
Up tothe month
For themonth
FOR AND UP TO THE MONTH OF OCTOBER, 2011
Amount of Premiumu/w in Rural Areas
No. ofLives covered *
Up tothe month
Up tothe month
Up tothe month
For themonth
Up tothe month
(Premium in Lakhs)M
83
1073.22 4109.36 8263 74508 0.00 0.00 0 0
961.86 3947.85 7253 72448 0.00 0.00 0 0
209.53 623.31 948 14240 0.00 0.00 0 0
145.12 492.30 832 13475 0.00 0.00 0 0
9.77 66.28 199 1273 0.00 0.00 0 0
8.64 50.49 178 1222 0.00 0.00 0 0
219.30 689.60 1147 15512 0.00 0.00 0 0
153.76 542.79 1010 14697 0.00 0.00 0 0
0.00 0.00 0 0 0.00 0.00 0 0
0.00 0.00 0 0 0.00 0.00 0 0
631.94 1568.13 5416 11790 0.00 0.00 0 0
554.20 1407.66 4248 9007 0.00 0.00 0 0
5214.41 16299.61 65477 474449 0.00 0.00 0 0
5119.70 14289.55 54278 419786 0.00 0.00 0 0
3696.15 14721.08 95288 751707 0.00 0.00 0 0
3068.56 11093.34 86767 660767 0.00 0.00 0 0
8910.56 31020.69 95288 751707 0.00 0.00 0 0
8188.26 25382.88 86767 660767 0.00 0.00 0 0
33.43 324.69 451 5552 21.49 150.63 272 570
29.84 246.66 406 4604 19.23 112.39 231 448
2.00 32.75 38 617 0.00 0.00 0 0
1.18 27.97 35 546 0.00 0.00 0 0
0.62 3.67 12 33 0.00 0.00 0 0
0.58 2.74 11 29 0.00 0.00 0 0
6.61 102.83 89 1341 0.00 7.78 0 0
5.78 73.29 83 1108 0.00 5.71 0 0
42.66 463.93 590 7543 21.49 158.41 272 571
37.38 350.66 535 6287 19.23 118.10 231 448
3112.35 4647.49 9771 35484 135.87 2080.11 13555 362957
2996.50 4340.15 8455 31738 48.80 2436.33 24813 110570
4118.42 8803.05 3749 98500 2778.57 13237.40 1142509 17590301 844081 18086339
2051.26 5042.61 7322 72868 579.61 6914.45 843233 4769506 324185 1664818
18.88 165.09 129 2759 0.00 0.00 0 0 843 114713
49.25 248.27 295 3416 0.00 5.94 7762 8125 2577 9759
4137.30 8968.14 3878 101259 2778.57 13237.40 1142509 17590301 844924 18201052
2100.51 5290.89 7617 76284 579.61 6920.40 850995 4777631 326762 1674577
0.00 0.00 0 0 0.00 0.00 0 0
0.00 0.00 0 0 0.00 0.00 7736 7736
0.00 0.00 0 0 0.00 0.00 0 0
0.00 0.00 0 0 0.00 0.00 0 0
3008.84 10323.15 38177 246125 417.25 6175.27 9348 134681
2431.90 10324.79 37748 247587 380.69 4537.81 6929 155437
21136.17 61790.48 162530.11 1243928.84 3353.18 21651.19 1165684 18088509 844924.00 18201052.00
17424.38 51587.67 153633.96 1118814.69 1028.33 14012.64 890704 5051822 326762.00 1674577.00
83

ird
ajo
urn
al J
an
ua
ry2
01
2non-life insurance
* Wherever applicable
LINE OF BUSINESS
Fire
Previous year
Marine Cargo
Previous year
Total Premium u/wTotal No. of
Policies IssuedAccretions during
the month (premium)Sum Assured
For themonth
Up tothe month
For themonth
Up tothe month
For themonth
Up tothe month
For themonth
Up tothe month
Marine Hull (IncludingOnshore & Offshore oil energy)
Previous year
Marine (Total)
Previous year (Total)
Aviation
Previous year
Engineering
Previous year
Motor Own Damage
Previous year
Motor Third party
Previous year
Motor (Total)
Previous year (Total)
Workmen's compensation /Employer's liability
Previous year
Public Liability
Previous year
Product Liability
Previous year
Other Liability Covers
Previous year
Liability (Total)
Previous year (Total)
Personal Accident
Previous year
Medical Insurance
Previous year
Overseas Medical Insurance
Previous year
Health (Total)
Previous year (Total)
Crop Insurance
Previous year
Previous year
Credit Guarantee
All Other Miscellaneous
Previous year
Grand Total
Previous year (Total)
BUSINESS FIGURES:
Name of the Insurer: Universal Sompo General Insurance Company Limited
84
314.14 4026.79 5036 60806 -212.38 1058.11 380136.44 5344859.57
526.52 2968.68 6571 53570 265.07 928.75 320911.05 3556282.11
34.89 529.47 106 1051 -8.85 208.86 605416.20 4408771.81
43.74 320.62 97 733 -25.99 57.87 418457.86 2347370.35
0.00 0.00 0 0 0.00 0.00 0.00 0.00
0.00 0.00 0 0 0.00 0.00 0.00 0.00
34.89 529.47 106 1051 -8.85 208.86 605416.20 4408771.81
43.74 320.62 97 733 -25.99 57.87 418457.86 2347370.35
0.00 0.00 0 0 0.00 0.00 0.00 0.00
0.00 0.00 0 0 0.00 0.00 0.00 0.00
71.30 522.08 80 854 51.19 193.98 53255.39 446393.70
20.11 328.11 93 591 14.41 101.72 25519.41 175345.52
1342.18 8448.62 35469 226966 477.10 969.13 66560.46 422188.59
865.09 7479.49 28742 263535 397.23 5507.98 57779.04 489649.23
335.56 2165.39 0 0 119.27 -32.51
216.28 2197.90 0 0 131.28 1961.31
1677.74 10614.01 35469 226966 596.37 936.62 66560.46 422188.59
1081.37 9677.39 28742 263535 528.51 7469.29 57779.04 489649.23
8.42 110 47 627 -5.13 59.52 1530 19858
13.55 50.82 72 416 12.68 27.74 1488.87 5073.24
0.15 6.72 1 14 0.15 2.45 450 6486
0.00 4.27 0 4 -0.03 -1.74 0.00 5900.00
0.60 8.99 1 6 0.60 8.99 50.00 1993.75
0.00 0.00 0 0 0.00 0.00 0.00 0.00
2 48 7 87 1.86 15.74 1406 13779
0 32 1 30 -1 21 1 34179
11.04 173.64 56 734 -2.52 86.71 3435.59 42115.89
13.56 86.93 73 450 12.02 46.98 1489.87 45151.82
11.88 340.84 323 4434 -0.91 97.01 47254.67 4129045.18
12.79 243.83 724 3537 11.43 -449.50 46322.89 1744424.40
250.84 2090.48 2243 21679 153.92 815.92 8417.90 107264.76
96.92 1274.56 2239 15250 8.67 432.90 5259.11 78761.76
1.01 6.47 202 411 1.01 6.47 72020.68 140175.53
0.00 0.00 0 0 0.00 0.00 0.00 0.00
251.85 2096.95 2445 22090 154.93 822.39 80438.58 247440.29
96.92 1274.56 2239 15250 8.67 432.90 5259.11 78761.76
0.00 0.00 0 0 0.00 0.00 0.00 0.00
0.00 0.00 0 0 0.00 0.00 0.00 0.00
0.00 0.00 0 0 0.00 0.00 0.00 0.00
0.00 0.00 0 0 0.00 0.00 0.00 0.00
242.27 2537.08 8055 94361 4.05 688.89 127594.79 1590491.84
238.22 1848.19 9693 80331 25.92 259.69 121835.02 994110.10
2615.10 20840.86 51570 411296 581.88 4092.56 1364092.12 16631306.87
2033.22 16748.30 48232 417997 840.03 8847.69 997574.24 9431095.28
84

ird
ajo
urn
alJ
an
ua
ry2
01
2
No. of Lives coveredin Social Sector
Amount of Premiumu/w in Social Sector
No. of Policiesin Rural Areas
For themonth
For themonth
For themonth
Up tothe month
For themonth
FOR AND UP TO THE MONTH OF OCTOBER, 2011
Amount of Premiumu/w in Rural Areas
No. ofLives covered *
Up tothe month
Up tothe month
Up tothe month
For themonth
Up tothe month
(Premium in Lakhs)M
85
0.00 0.00 0 0 0.00 0.00 0.00 0.00
0.00 0.00 0 0 0.00 0.00 0.00 0.00
0.00 0.00 0 0 0.00 0.00 0.00 0.00
0.00 0.00 0 0 0.00 0.00 0.00 0.00
0.00 0.00 0 0 0.00 0.00 0.00 0.00
0.00 0.00 0 0 0.00 0.00 0.00 0.00
0.00 0.00 0 0 0.00 0.00 0 0
0.00 0.00 0 0 0.00 0.00 0 0
0.00 0.00 0 0 0.00 0.00 0.00 0.00
0.00 0.00 0 0 0.00 0.00 0.00 0.00
0.00 0.00 0 0 0.00 0.00 0.00 0.00
0.00 0.00 0 0 0.00 0.00 0.00 0.00
0.00 0.00 0 0 0.00 0.00 0.00 0.00
0.00 0.00 0 0 0.00 0.00 0.00 0.00
0.00 0.00 0 0 0.00 0.00 0.00 0.00
0.00 0.00 0 0 0.00 0.00 0.00 0.00
0.00 0.00 0 0 0.00 0.00 0 0
0.00 0.00 0 0 0.00 0.00 0 0
0 0 0 0 0 0 0 0
0 0 0 0 0 0 0 0
0 0 0 0 0 0 0 0
0.00 0.00 0 0 0 0 0 0
0.00 0.00 0 0 0 0 0 0
0.00 0.00 0 0 0 0 0 0
0 0 0 0 0 0 0 0
0 0 0 0 0 0 0 0
0.00 0.00 0 0 0.00 0.00 0 0
0.00 0.00 0 0 0.00 0.00 0 0
0.00 0.00 0 0 0.00 0.00 0 0
0.00 0.00 0 0 0.00 0.00 0 0
0.00 0.00 0 0 0.00 0.00 0 0 0 0
0.00 0.00 0 0 0.00 0.00 0 0 0 0
0.00 0.00 0 0 0.00 0.00 0 0 0 0
0.00 0.00 0 0 0.00 0.00 0 0 0 0
0.00 0.00 0 0 0.00 0.00 0 0 0 0
0.00 0.00 0 0 0.00 0.00 0 0 0 0
0.00 0.00 0 0 0 0 0 0
0.00 0.00 0 0 0 0 0 0
0.00 0.00 0 0 0 0 0 0
0.00 0.00 0 0 0 0 0 0
87.83 1018.00 3183 37461 0 0.00 0 0
100.15 787.96 3760 29664 0 0.00 0 0
87.83 1018.00 3183 37461 0.00 0.00 0 0 0 0
100.15 787.96 3760 29664 0.00 0.00 0 0 0 0
85

ird
ajo
urn
al J
an
ua
ry2
01
2non-life insurance
* Wherever applicable
LINE OF BUSINESS
Fire
Previous year
Marine Cargo
Previous year
Total Premium u/wTotal No. of
Policies IssuedAccretions during
the month (premium)Sum Assured
For themonth
Up tothe month
For themonth
Up tothe month
For themonth
Up tothe month
For themonth
Up tothe month
Marine Hull (IncludingOnshore & Offshore oil energy)
Previous year
Marine (Total)
Previous year (Total)
Aviation
Previous year
Engineering
Previous year
Motor Own Damage
Previous year
Motor Third party
Previous year
Motor (Total)
Previous year (Total)
Workmen's compensation /Employer's liability
Previous year
Public Liability
Previous year
Product Liability
Previous year
Other Liability Covers
Previous year
Liability (Total)
Previous year (Total)
Personal Accident
Previous year
Medical Insurance
Previous year
Overseas Medical Insurance
Previous year
Health (Total)
Previous year (Total)
Crop Insurance
Previous year
Previous year
Credit Guarantee
All Other Miscellaneous
Previous year
Grand Total
Previous year (Total)
BUSINESS FIGURES:
Name of the Insurer: Agriculture Insurance Company of India Limited
86
10515.97 156458.98 80867 366847 -7740.39 42927.28 595610.96 3453530.81
18256.36 113531.70 106964 372567 -3505.50 16142.58 677250.94 3030595.37
10515.97 156458.98 80867 366847 -7740.39 42927.28 595610.96 3453530.81
18256.36 113531.70 106964 372567 -3505.50 16142.58 677250.94 3030595.37
86

ird
ajo
urn
alJ
an
ua
ry2
01
2
No. of Lives coveredin Social Sector
Amount of Premiumu/w in Social Sector
No. of Policiesin Rural Areas
For themonth
For themonth
For themonth
Up tothe month
For themonth
FOR AND UP TO THE MONTH OF OCTOBER, 2011
Amount of Premiumu/w in Rural Areas
No. ofLives covered *
Up tothe month
Up tothe month
Up tothe month
For themonth
Up tothe month
(Premium in Lakhs)M
87
10515.97 156458.98 80867 366847 NA NA NA NA 1642082 15122538
18256.36 113531.70 106964 372567 NA NA NA NA 1796520 13433348
10515.97 156458.98 80867 366847 NA NA NA NA 1642082 15122538
18256.36 113531.70 106964 372567 NA NA NA NA 1796520 13433348
87

ird
ajo
urn
al J
an
ua
ry2
01
2non-life insurance
* Wherever applicable
LINE OF BUSINESS
Fire
Previous year
Marine Cargo
Previous year
Total Premium u/wTotal No. of
Policies IssuedAccretions during
the month (premium)Sum Assured
For themonth
Up tothe month
For themonth
Up tothe month
For themonth
Up tothe month
For themonth
Up tothe month
Marine Hull (IncludingOnshore & Offshore oil energy)
Previous year
Marine (Total)
Previous year (Total)
Aviation
Previous year
Engineering
Previous year
Motor Own Damage
Previous year
Motor Third party
Previous year
Motor (Total)
Previous year (Total)
Workmen's compensation /Employer's liability
Previous year
Public Liability
Previous year
Product Liability
Previous year
Other Liability Covers
Previous year
Liability (Total)
Previous year (Total)
Personal Accident
Previous year
Medical Insurance
Previous year
Overseas Medical Insurance
Previous year
Health (Total)
Previous year (Total)
Crop Insurance
Previous year
Previous year
Credit Guarantee
All Other Miscellaneous
Previous year
Grand Total
Previous year (Total)
BUSINESS FIGURES:
Name of the Insurer: Apollo Munich Health Insurance Company Limited
88
0.00 0.00 0 0 0.00 0.00 0.00 0.00
0.00 0.00 0 0 0.00 0.00 0.00 0.00
0.00 0.00 0 0 0.00 0.00 0.00 0.00
0.00 0.00 0 0 0.00 0.00 0.00 0.00
0.00 0.00 0 0 0.00 0.00 0.00 0.00
0.00 0.00 0 0 0.00 0.00 0.00 0.00
99.87 510.50 2230 17492 99.87 510.50 42050.00 273024.38
90.30 355.75 3233 17967 90.30 355.75 36364.75 202704.63
3283.92 17725.70 14427 103878 3283.92 17725.70 54414.37 371599.18
1397.43 9302.56 13119 68508 1397.43 9302.56 68156.56 347248.42
40.98 339.83 1325 14594 40.98 339.83 230719.50 1629769.24
31.18 312.79 1511 13821 31.18 312.79 211452.01 1318775.43
3324.91 18065.54 15752 118472 3324.91 18065.54 285133.87 2001368.41
1428.60 9615.35 14630 82329 1428.60 9615.35 279608.57 1666023.84
96.38 446.70 0 2 96.38 446.70 399235.00 2035565.00
54.44 349.94 0 2 54.44 349.94 270640.00 1610485.00
3521.16 19022.74 17982 135966 3521.16 19022.74 726418.87 4309957.79
1573.34 10321.05 17863 100298 1573.34 10321.05 586613.32 3479213.47
88

ird
ajo
urn
alJ
an
ua
ry2
01
2
No. of Lives coveredin Social Sector
Amount of Premiumu/w in Social Sector
No. of Policiesin Rural Areas
For themonth
For themonth
For themonth
Up tothe month
For themonth
FOR AND UP TO THE MONTH OF OCTOBER, 2011
Amount of Premiumu/w in Rural Areas
No. ofLives covered *
Up tothe month
Up tothe month
Up tothe month
For themonth
Up tothe month
(Premium in Lakhs)M
89
0.00 0.00 0 0 0.00 0.00 0 0
0.00 0.00 0 0 0.00 0.00 0 0
0.00 0.00 0 0 0.00 0.00 0 0
0.00 0.00 0 0 0.00 0.00 0 0
0.00 0.00 0 0 0.00 0.00 0 0
0.00 0.00 0 0 0.00 0.00 0 0
5.03 37.04 365 3968 0 0.08 0 751
6.05 11.51 905 9223 0 2.83 71 9167
252.63 1842.49 15548 148570 30 192.08 7371 47933 74581 714522
128.21 678.66 3751 27338 0.00 45.85 0 9689 42777 306672
1877 19704
2247 18201
252.63 1842.49 15548 148570 29.54 192.08 7371 47933 76458 734226
128.21 678.66 3751 27338 0.00 45.85 0 9689 45024 324873
257.66 1879.53 15913 152538 29.54 192.16 7371 48684 76458 734226
134.26 690.17 4656 36561 0.11 48.69 71 18856 45024 324873
89

ird
ajo
urn
al J
an
ua
ry2
01
2non-life insurance
* Wherever applicable
LINE OF BUSINESS
Fire
Previous year
Marine Cargo
Previous year
Total Premium u/wTotal No. of
Policies IssuedAccretions during
the month (premium)Sum Assured
For themonth
Up tothe month
For themonth
Up tothe month
For themonth
Up tothe month
For themonth
Up tothe month
Marine Hull (IncludingOnshore & Offshore oil energy)
Previous year
Marine (Total)
Previous year (Total)
Aviation
Previous year
Engineering
Previous year
Motor Own Damage
Previous year
Motor Third party
Previous year
Motor (Total)
Previous year (Total)
Workmen's compensation /Employer's liability
Previous year
Public Liability
Previous year
Product Liability
Previous year
Other Liability Covers
Previous year
Liability (Total)
Previous year (Total)
Personal Accident
Previous year
Medical Insurance
Previous year
Overseas Medical Insurance
Previous year
Health (Total)
Previous year (Total)
Crop Insurance
Previous year
Previous year
Credit Guarantee
All Other Miscellaneous
Previous year
Grand Total
Previous year (Total)
BUSINESS FIGURES:
Name of the Insurer: Export Credit Guarantee Corporation of India Limited
90
0.00 0.00 0 0 0.00 0.00 0.00 0.00
0.00 0.00 0 0 0.00 0.00 0.00 0.00
0.00 0.00 0 0 0.00 0.00 0.00 0.00
0.00 0.00 0 0 0.00 0.00 0.00 0.00
0.00 0.00 0 0 0.00 0.00 0.00 0.00
0.00 0.00 0 0 0.00 0.00 0.00 0.00
0.00 0.00 0 0 0.00 0.00 0.00 0.00
0.00 0.00 0 0 0.00 0.00 0.00 0.00
7312 52776 808 6764 148 4093 322708 2467001
7163 48683 988 7262 523 3005 298653 2678813
7311.78 52775.80 808 6764 148.42 4093.07 322707.97 2467001.33
7163.36 48682.73 988 7262 523.36 3004.73 298653.07 2678813.37
90

ird
ajo
urn
alJ
an
ua
ry2
01
2
No. of Lives coveredin Social Sector
Amount of Premiumu/w in Social Sector
No. of Policiesin Rural Areas
For themonth
For themonth
For themonth
Up tothe month
For themonth
FOR AND UP TO THE MONTH OF OCTOBER, 2011
Amount of Premiumu/w in Rural Areas
No. ofLives covered *
Up tothe month
Up tothe month
Up tothe month
For themonth
Up tothe month
(Premium in Lakhs)M
91
0.00 0.00 0 0 0.00 0.00 0 0
0.00 0.00 0 0 0.00 0.00 0 0
0.00 0.00 0 0 0.00 0.00 0 0
0.00 0.00 0 0 0.00 0.00 0 0
0.00 0.00 0 0 0.00 0.00 0 0
0.00 0.00 0 0 0.00 0.00 0 0
0.00 0.00 0 0 0.00 0.00 0 0
0.00 0.00 0 0 0.00 0.00 0 0
0 0 0 0 0 0 0 0
0 0 0 0 0 0 0 0
0.00 0.00 0 0 0.00 0.00 0 0
0.00 0.00 0 0 0.00 0.00 0 0
91

ird
ajo
urn
al J
an
ua
ry2
01
2non-life insurance
* Wherever applicable
LINE OF BUSINESS
Fire
Previous year
Marine Cargo
Previous year
Total Premium u/wTotal No. of
Policies IssuedAccretions during
the month (premium)Sum Assured
For themonth
Up tothe month
For themonth
Up tothe month
For themonth
Up tothe month
For themonth
Up tothe month
Marine Hull (IncludingOnshore & Offshore oil energy)
Previous year
Marine (Total)
Previous year (Total)
Aviation
Previous year
Engineering
Previous year
Motor Own Damage
Previous year
Motor Third party
Previous year
Motor (Total)
Previous year (Total)
Workmen's compensation /Employer's liability
Previous year
Public Liability
Previous year
Product Liability
Previous year
Other Liability Covers
Previous year
Liability (Total)
Previous year (Total)
Personal Accident
Previous year
Medical Insurance
Previous year
Overseas Medical Insurance
Previous year
Health (Total)
Previous year (Total)
Crop Insurance
Previous year
Previous year
Credit Guarantee
All Other Miscellaneous
Previous year
Grand Total
Previous year (Total)
BUSINESS FIGURES:
Name of the Insurer: Max Bupa Health Insurance Company Limited
92
0.00 0.00 0 0 0.00 0.00 0.00 0.00
0.00 0.00 0 0 0.00 0.00 0.00 0.00
0.00 0.00 0 0 0.00 0.00 0.00 0.00
0.00 0.00 0 0 0.00 0.00 0.00 0.00
0.00 0.00 0 0 0.00 0.00 0.00 0.00
0.00 0.00 0 0 0.00 0.00 0.00 0.00
647.89062 5311.63249 5273 32839 640.88386 4197.02704 35369.1 208568.5
241.05 1059.84 2753 12182 234.58 1053.37 9782.50 42015.00
647.89 5311.63 5273 32839 640.88 4197.03 35369.10 208568.50
241.05 1059.84 2753 12182 234.58 1053.37 9782.50 42015.00
647.89 5311.63 5273 32839 640.88 4197.03 35369.10 208568.50
241.05 1059.84 2753 12182 234.58 1053.37 9782.50 42015.00
92

ird
ajo
urn
alJ
an
ua
ry2
01
2
No. of Lives coveredin Social Sector
Amount of Premiumu/w in Social Sector
No. of Policiesin Rural Areas
For themonth
For themonth
For themonth
Up tothe month
For themonth
FOR AND UP TO THE MONTH OF OCTOBER, 2011
Amount of Premiumu/w in Rural Areas
No. ofLives covered *
Up tothe month
Up tothe month
Up tothe month
For themonth
Up tothe month
(Premium in Lakhs)M
93
0.00 0.00 0 0 0.00 0.00 0 0
0.00 0.00 0 0 0.00 0.00 0 0
0.00 0.00 0 0 0.00 0.00 0 0
0.00 0.00 0 0 0.00 0.00 0 0
0.00 0.00 0 0 0.00 0.00 0 0
0.00 0.00 0 0 0.00 0.00 0 0
5.75478 37.76004 68 423 3.18626 11.23938 44 2443 11654 78947
13.63 14.47 89 196 0.00 0.00 0 0 4197 18843
5.75 37.76 68 423 3.19 11.24 44 2443 11654 78947
13.63 14.47 89 196 0.00 0.00 0 0 4197 18843
5.75 37.76 68 423 3.19 11.24 44 2443 11654 78947
13.63 14.47 89 196 0.00 0.00 0 0 4197 18843
93

ird
ajo
urn
al J
an
ua
ry2
01
2non-life insurance
* Wherever applicable
LINE OF BUSINESS
Fire
Previous year
Marine Cargo
Previous year
Total Premium u/wTotal No. of
Policies IssuedAccretions during
the month (premium)Sum Assured
For themonth
Up tothe month
For themonth
Up tothe month
For themonth
Up tothe month
For themonth
Up tothe month
Marine Hull (IncludingOnshore & Offshore oil energy)
Previous year
Marine (Total)
Previous year (Total)
Aviation
Previous year
Engineering
Previous year
Motor Own Damage
Previous year
Motor Third party
Previous year
Motor (Total)
Previous year (Total)
Workmen's compensation /Employer's liability
Previous year
Public Liability
Previous year
Product Liability
Previous year
Other Liability Covers
Previous year
Liability (Total)
Previous year (Total)
Personal Accident
Previous year
Medical Insurance
Previous year
Overseas Medical Insurance
Previous year
Health (Total)
Previous year (Total)
Crop Insurance
Previous year
Previous year
Credit Guarantee
All Other Miscellaneous
Previous year
Grand Total
Previous year (Total)
BUSINESS FIGURES:
Name of the Insurer: Star Health and Allied Insurance Company Limited
94
0 0 0.00 0.00
0.00 0.00 0 0 0.00 0.00 0.00 0.00
0.00 0.00 0 0 0.00 0.00 0.00 0.00
0 0
0.00 0.00 0 0 0.00 0.00 0.00 0.00
0.00 0.00 0 0 0.00 0.00 0.00 0.00
0.00 0.00 0 0 0.00 0.00 0.00 0.00
0.00 0.00 0 0 0.00 0.00 0.00 0.00
163.53 804.93 10058 72985 76.48 93.53 170529.72 1284384.72
87.05 711.40 10537 73359 31.23 330.78 147491.74 959800.38
16053.31 74959.91 76506 568016 -3669.72 -1386.48 253908.85 24591303.00
19723.03 76346.39 70668 430750 248.09 14450.44 180797.70 22770097.95
67.38 845.47 2865 28830 0.46 64.47 343175.29 3139218.37
66.92 781.00 2500 25988 11.73 273.36 299124.00 2508338.39
16120.69 75805.38 79371 596846 -3669.26 -1322.01 597084.14 27730521.37
19789.95 77127.39 73168 456738 259.82 14723.80 479921.70 25278436.34
39.82 264.62 14210 94874 6.78 8.48 142100 948740.00
33.04 256.14 11752 91069 -7.89 25.76 117520.00 910690.00
16324.04 76874.93 103639 764705 -3586.00 -1220.00 909713.86 29963646.09
19910.04 78094.93 95457 621166 283.16 15080.34 744933.44 27148926.72
94

ird
ajo
urn
alJ
an
ua
ry2
01
2
No. of Lives coveredin Social Sector
Amount of Premiumu/w in Social Sector
No. of Policiesin Rural Areas
For themonth
For themonth
For themonth
Up tothe month
For themonth
FOR AND UP TO THE MONTH OF OCTOBER, 2011
Amount of Premiumu/w in Rural Areas
No. ofLives covered *
Up tothe month
Up tothe month
Up tothe month
For themonth
Up tothe month
(Premium in Lakhs)M
95
0.00 0.00 0 0 0.00 0.00 0 0 0 0
0.00 0.00 0 0 0.00 0.00 0 0 0 0
0.00 0.00 0 0 0.00 0.00 0 0 0 0
0.00 0.00 0 0 0.00 0.00 0 0 0 0
0.00 0.00 0 0 0.00 0.00 0 0 0 0
0.00 0.00 0 0 0.00 0.00 0 0 0 0
126.04 543.32 4715 31457.00 9.78 141.62 6137 61590
34.37 266.24 4131 31287.00 29.29 233.79 17262 163873
10182.84 41739.28 25642 192474.00 4566.26 23898.48 19812 15868723 89886 52965506.00
12253.36 28617.43 24611 148686.00 7072.75 45911.58 37590 8697731 4407070 57324284.00
13.66 147.39 409 4851.00 20.00 352.03 851 12591 2865 28814.00
11.91 164.61 374 4598.00 34.56 358.36 1482 12659 2735 26218.00
10196.50 41886.67 26051 197325 4586.26 24250.51 20663 15881314 92751 52994320
12265.27 28782.04 24985 153284 7107.31 46269.94 39072 8710390 4409805 57350502
0.00 0.00 0
0.00 108.50 38574
10322.54 42429.99 30766 228782 4596.04 24392.13 26800 15942904 92751 52994320
12299.64 29048.28 29116 184571 7136.60 46612.23 56334 8912837 4409805 57350502
95

ird
ajo
urn
al J
an
ua
ry2
01
2non-life insurance
www.irda.gov.in
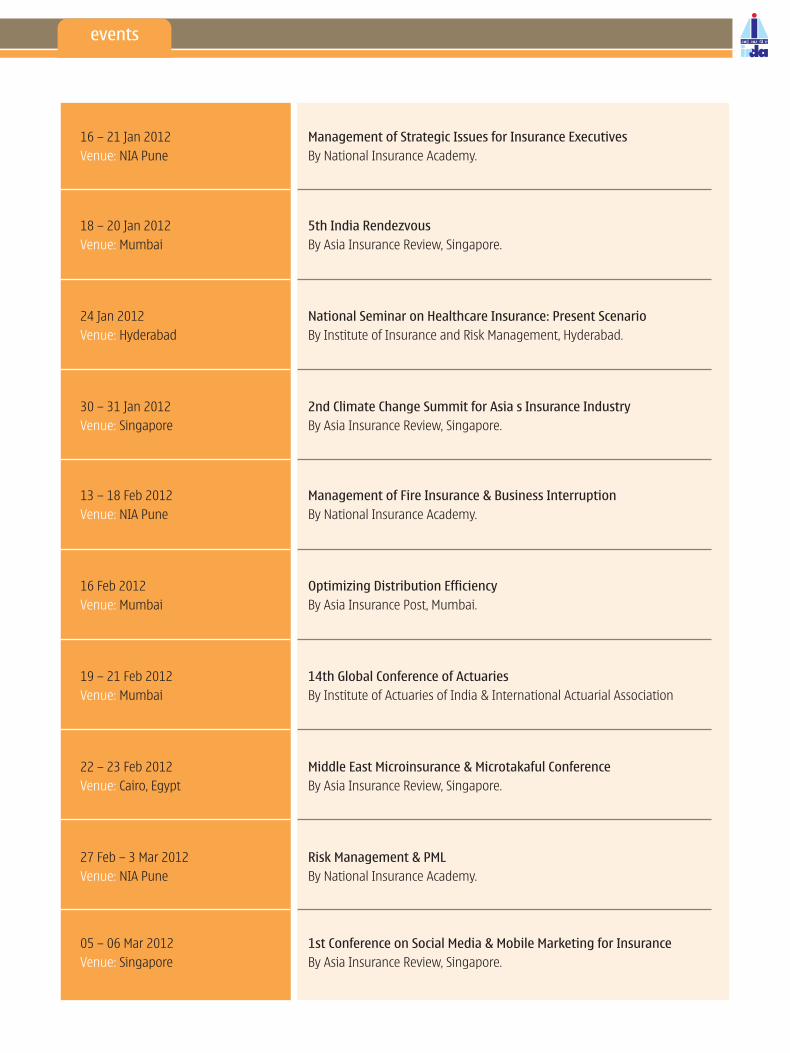
16 – 21 Jan 2012
NIA Pune By National Insurance Academy.
18 – 20 Jan 2012
Mumbai By Asia Insurance Review, Singapore.
24 Jan 2012
Hyderabad By Institute of Insurance and Risk Management, Hyderabad.
30 – 31 Jan 2012
Singapore By Asia Insurance Review, Singapore.
13 – 18 Feb 2012
NIA Pune By National Insurance Academy.
16 Feb 2012
Mumbai By Asia Insurance Post, Mumbai.
19 – 21 Feb 2012
Mumbai By Institute of Actuaries of India & International Actuarial Association
22 – 23 Feb 2012
Cairo, Egypt By Asia Insurance Review, Singapore.
27 Feb – 3 Mar 2012
NIA Pune By National Insurance Academy.
05 – 06 Mar 2012
Singapore By Asia Insurance Review, Singapore.
Management of Strategic Issues for Insurance Executives
5th India Rendezvous
National Seminar on Healthcare Insurance: Present Scenario
2nd Climate Change Summit for Asia s Insurance Industry
Management of Fire Insurance & Business Interruption
Optimizing Distribution Efficiency
14th Global Conference of Actuaries
Middle East Microinsurance & Microtakaful Conference
Risk Management & PML
1st Conference on Social Media & Mobile Marketing for Insurance
Venue:
Venue:
Venue:
Venue:
Venue:
Venue:
Venue:
Venue:
Venue:
Venue:
events

The recent financial crisis underscored that even financially strong insurance groups and
conglomerates may suffer significant distress and become globally systemically important
when they expand significantly into non-insurance activities.
We will go beyond the traditional approach of ensuring transparency at point of sale to
intervening by stopping products being sold that we judge cannot be sold safely.
It might be possible to argue that in a system of mandatory retirement savings where
members have no choice not to be part of the system, the funds and regulators have an even
greater obligation to ensure that confidence in the system is maintained.
We believe it is crucial for us to sort out issues to be tackled that have been highlighted through
our post-disaster response to date. Following that, we need to enhance preparedness for the
probable occurrence of large-scale disasters, as well as to promote the market penetration of
general insurance including Earthquake Insurance.
The Asian growth story remains intact. It is not a foregone conclusion, many things can go
wrong, but the odds are that emerging Asia will remain the fastest growing region in the world.
After de-tariffing, the premium has come down to a level where questions arise about the
health of insurance firms. If the trend does not abate, then the firms will be in trouble.
Mr. Peter Braumüller
Mr. Clive Adamson
Mr. Ross Jones
Mr. Shuzo Sumi
Mr Ravi Menon
Mr. J. Hari Narayan
Chairman of the IAIS Financial Stability Committee
Director of Supervision, FSA, UK
Deputy Chairman, Australian Prudential Regulation Authority
Chairman, General Insurance Association of Japan
Managing Director, Monetary Authority of Singapore
Chairman, Insurance Regulatory & Development Authority, India
RNI No: APBIL/2002/9589
view point
If undelivered please return to:
IRDA, Parishram Bhavan, 3 Floor, Basheer Bagh, Hyderabad - 500 004. Ph: +91-40-23381100rd