Re-thinking the Carbon Reduction Value of Corn...
4
An Ethanol Across America White Paper Winter 2015 Re-thinking the Carbon Reduction Value of Corn Ethanol Fuel It has been seven years since Argonne National Labs (ANL), as part of the Energy Security and Independence Act requirements, first determined the Life Cycle Carbon Intensity of mid-west corn ethanol fuel. ANL, using their Greenhouse gases, Regulated Emissions, and Energy use in Transportation (GREET) model determined that Mid-West average corn ethanol fuel had a CI score of 98 grams CO 2 eq. emissions per mega joule of energy production. In the subsequent years, ANL has provided several updates to this greenhouse gas accounting that have significantly reduced the CI of corn ethanol fuel. However, low carbon fuel market regulators, such as the U.S. EPA and the California Air Resource Board (CARB) have yet to acknowledge these improvements and update their models with this new science. Because fossil fuel CI is trending higher and corn ethanol fuel CI is trending lower, failure to account for and acknowledge these trends erodes public support for biofuels and unfairly penalizes biofuels in low carbon fuel markets. Conversely, recognizing these new realities would provide us with a home grown advanced biofuel that meets a range of health and public policy objectives. Continued Ron Alverson For the past 40 years, Ron, a farmer, has raised corn and soybeans near Chester, South Dakota. Mr. Alverson was a founding member (1987) and past president of the South Dakota Corn Grower’s Association, and past board member of the National Corn Grower’s Association. Ron was also a founder and is a current board member of Lake Area Corn Processors LLC (Dakota Ethanol), a 60 million gallon per year ethanol production plant at Wentworth, SD, where he is involved with low carbon pathway applications for low carbon fuel markets. He also currently serves as President of the American Coalition for Ethanol’s Board of Directors and is a member of the South Dakota State University Foundation Board of Trustees. Ron holds a BS degree in Agronomy/Soil Science from South Dakota State University. Midwest Average Corn Ethanol Fuel Carbon Intensity Even though ANL has issued several updates to GREET, CARB Scientists continue to use ANL’s GREET 1.8b model (2008) to determine midwest avg. corn ethanol fuel CI. Chart below lists the measurement/modeling points and GHG emissions from corn ethanol fuel. Carbon Intensity Modeling of Transportation Fuels Using the GREET model, ANL and regulators such as CARB and the U.S. EPA, have determined the CI of all current and potentially significant transportation fuels used in the U.S. In 2013, California used Corn and Sugar Cane ethanol (62%), Biodiesel (27%), and Natural Gas (9%) for their Low Carbon Fuel Standard (LCFS) compliance.
Transcript of Re-thinking the Carbon Reduction Value of Corn...
An Ethanol Across America White Paper Winter 2015
Re-thinking the Carbon Reduction Value of Corn Ethanol Fuel
It has been seven years since Argonne National Labs (ANL), as part of the Energy Security and Independence Act requirements, first determined the Life Cycle Carbon Intensity of mid-west corn ethanol fuel. ANL, using their Greenhouse gases, Regulated Emissions, and Energy use in Transportation (GREET) model determined that Mid-West average corn ethanol fuel had a CI score of 98 grams CO2 eq. emissions per mega joule of energy production. In the subsequent years, ANL has provided several updates to this greenhouse gas accounting that have significantly reduced the CI of corn ethanol fuel. However, low carbon fuel market regulators, such as the U.S. EPA and the California Air Resource Board (CARB) have yet to acknowledge these improvements and update their models with this new science. Because fossil fuel CI is trending higher and corn ethanol fuel CI is trending lower, failure to account for and acknowledge these trends erodes public support for biofuels and unfairly penalizes biofuels in low carbon fuel markets. Conversely, recognizing these new realities would provide us with a home grown advanced biofuel that meets a range of health and public policy objectives.
Continued
Ron Alverson
For the past 40 years, Ron, a farmer, has raised corn and soybeans near Chester, South Dakota. Mr. Alverson was a founding member (1987) and past president of the South Dakota Corn Grower’s Association, and past board member of the National Corn Grower’s Association. Ron was also a founder and is a current board member of Lake Area Corn Processors LLC (Dakota Ethanol), a 60 million gallon per year ethanol production plant at Wentworth, SD, where he is involved with low carbon pathway applications for low carbon fuel markets. He also currently serves as President of the American Coalition for Ethanol’s Board of Directors and is a member of the South Dakota State University Foundation Board of Trustees. Ron holds a BS degree in Agronomy/Soil Science from South Dakota State University.
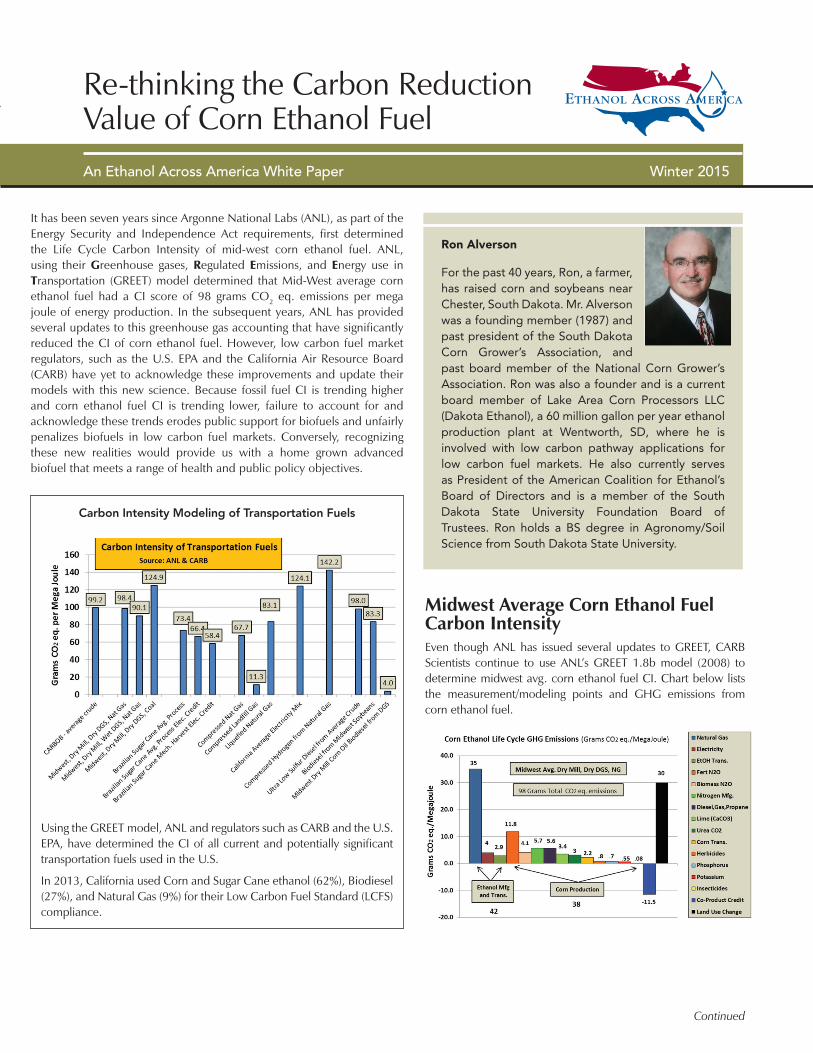
Midwest Average Corn Ethanol Fuel Carbon IntensityEven though ANL has issued several updates to GREET, CARB Scientists continue to use ANL’s GREET 1.8b model (2008) to determine midwest avg. corn ethanol fuel CI. Chart below lists the measurement/modeling points and GHG emissions from corn ethanol fuel.
Carbon Intensity Modeling of Transportation Fuels
Using the GREET model, ANL and regulators such as CARB and the U.S. EPA, have determined the CI of all current and potentially significant transportation fuels used in the U.S.
In 2013, California used Corn and Sugar Cane ethanol (62%), Biodiesel (27%), and Natural Gas (9%) for their Low Carbon Fuel Standard (LCFS) compliance.
2 Ethanol Across America | www.ethanolacrossamerica.net
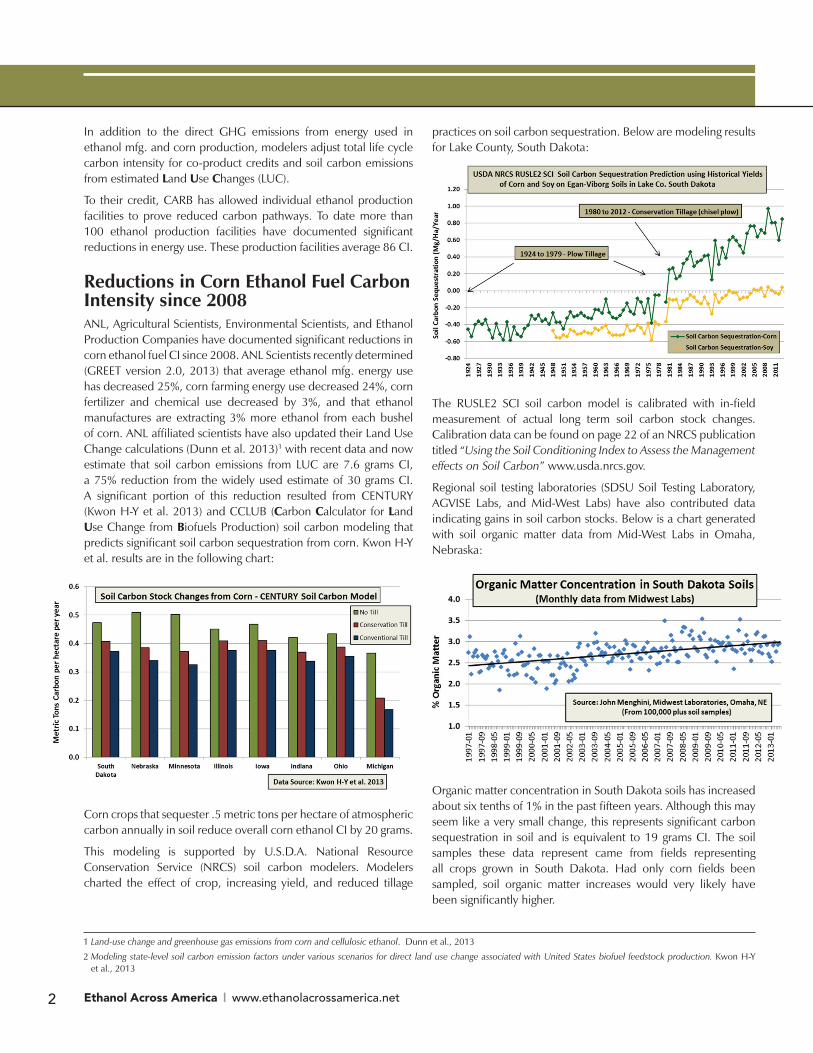
practices on soil carbon sequestration. Below are modeling results for Lake County, South Dakota:
The RUSLE2 SCI soil carbon model is calibrated with in-field measurement of actual long term soil carbon stock changes. Calibration data can be found on page 22 of an NRCS publication titled “Using the Soil Conditioning Index to Assess the Management effects on Soil Carbon” www.usda.nrcs.gov.
Regional soil testing laboratories (SDSU Soil Testing Laboratory, AGVISE Labs, and Mid-West Labs) have also contributed data indicating gains in soil carbon stocks. Below is a chart generated with soil organic matter data from Mid-West Labs in Omaha, Nebraska:
Organic matter concentration in South Dakota soils has increased about six tenths of 1% in the past fifteen years. Although this may seem like a very small change, this represents significant carbon sequestration in soil and is equivalent to 19 grams CI. The soil samples these data represent came from fields representing all crops grown in South Dakota. Had only corn fields been sampled, soil organic matter increases would very likely have been significantly higher.
In addition to the direct GHG emissions from energy used in ethanol mfg. and corn production, modelers adjust total life cycle carbon intensity for co-product credits and soil carbon emissions from estimated Land Use Changes (LUC).
To their credit, CARB has allowed individual ethanol production facilities to prove reduced carbon pathways. To date more than 100 ethanol production facilities have documented significant reductions in energy use. These production facilities average 86 CI.
Reductions in Corn Ethanol Fuel Carbon Intensity since 2008ANL, Agricultural Scientists, Environmental Scientists, and Ethanol Production Companies have documented significant reductions in corn ethanol fuel CI since 2008. ANL Scientists recently determined (GREET version 2.0, 2013) that average ethanol mfg. energy use has decreased 25%, corn farming energy use decreased 24%, corn fertilizer and chemical use decreased by 3%, and that ethanol manufactures are extracting 3% more ethanol from each bushel of corn. ANL affiliated scientists have also updated their Land Use Change calculations (Dunn et al. 2013)1 with recent data and now estimate that soil carbon emissions from LUC are 7.6 grams CI, a 75% reduction from the widely used estimate of 30 grams CI. A significant portion of this reduction resulted from CENTURY (Kwon H-Y et al. 2013) and CCLUB (Carbon Calculator for Land Use Change from Biofuels Production) soil carbon modeling that predicts significant soil carbon sequestration from corn. Kwon H-Y et al. results are in the following chart:
Corn crops that sequester .5 metric tons per hectare of atmospheric carbon annually in soil reduce overall corn ethanol CI by 20 grams.
This modeling is supported by U.S.D.A. National Resource Conservation Service (NRCS) soil carbon modelers. Modelers charted the effect of crop, increasing yield, and reduced tillage
1 Land-use change and greenhouse gas emissions from corn and cellulosic ethanol. Dunn et al., 2013
2 Modeling state-level soil carbon emission factors under various scenarios for direct land use change associated with United States biofuel feedstock production. Kwon H-Y et al., 2013

3 Ethanol Across America | www.ethanolacrossamerica.net
scientists have estimated N to N2O conversion rates across the U.S. Midwest. See following map.
Dr. David Clay, along with a team of SDSU soil scientists (Clay et al. 2012)3 merged soil carbon modeling with soil testing lab data to produce a paper titled “Corn Yields and No-tillage Affects Carbon Sequestration and Carbon Footprints”
Of equal or greater impact on Land Use Change calculations, is the recently completed work (Babcock and Iqbal., 2014)4 that tested first generation LUC model assumptions. These scientists have determined that little or no forest land has been converted to cropland in the U.S. as a result of biofuel production. Since 43% of the 30 CI LUC emission penalty is from estimated U.S. forest conversions, LUC is overestimated by more than 13 grams CI. As these and more data are accumulated it appears likely that corn ethanol fuel will eventually receive a LUC emission credit. Indeed, U.S.D.A. Agriculture Research Service Scientists (Follet et al., 2012)5 have documented annual soil (full rooting profile) carbon sequestration in no-till corn exceeding .9 tons per year. This amount of atmospheric carbon sequestration in soil is equivalent to 80 grams CI! (http://www.ars.usda.gov/is/AR/archive/feb14/soil0214.htm)
Corn Production N2O EmissionsSoil and crop scientists are also re-examining assumptions made in GHG models regarding Nitrous Oxide (N2O) emissions from Nitrogen (N) fertilizer use and biomass N in corn production. N2O is by far the largest component of corn production GHG emissions and comprise approximately 50% of all corn production CI.
Current N2O emission calculations assume that about 1.5% of applied N fertilizer is converted to N2O. But corn farmers are responding to market signals (N fertilizer prices are up 3–4X over the past 15 years) and have rapidly adopted precision application technology and employed Enhanced Efficiency Fertilizers (EEFs) in order to reduce N application rates, increase N use efficiency and reduce N losses to the air and water. Reviews of Scientific Literature indicate that these actions can reduce N2O emissions by up to 50%. N losses and N2O emissions are also greatly impacted by precipitation. Higher rainfall areas have higher N losses and N2O emissions. European Soil and Environmental Scientists (Lesschen et al., 2012),6 have developed a “precipitation adjustment factor” to estimate N induced N2O emissions. These scientists calibrated this factor based on a global review of 352 N2O emission measurements from fields. Using the Lesschen et al. “precipitation adjustment factor”
3 Corn Yields and No-Tillage affects Carbon Sequestration and Carbon Footprints. Clay et al., 2012.
4 Using Recent Land Use Changes to Validate Land Use Change Models. Bruce A. Babcock and Zabid Iqbal, 2014.
5 Soil Carbon Sequestration by Switch grass and No-Till Maize Grown for Bioenergy. Follet et al., 2014.
6 Differentiation of nitrous oxide emission factors for agricultural soils. Lesschen et al., 2011.
7 Supporting Information For Well-to-Wheels Energy Use and Greenhouse Gas Emissions of Ethanol from Corn, Sugarcane, and Cellulosic Biomass for U.S. Use. Wang et al., 2012.
Precipitation adjusted Fertilizer N-to-N2O Conversion Rates
As an example, average N2O emissions from corn produced in Eastern Nebraska are expected to be only 50% of Central Illinois grown corn based on differences in precipitation.
Given the geographic location of U.S. corn ethanol production, these data suggest that using a uniform N-to-N2O conversion rate across the U.S. Corn Belt does not properly account for the actual N2O emissions from U.S. corn used for ethanol. A weighted average (ethanol production by precipitation zone) indicates a 10% reduction in Mid-West average N2O emissions is warranted using this approach. This work is supported by a comparison of the Wang et al. 20127 field measurements of N2O and the Wang et al. data adjusted with the Lesschen et al. precipitation factor. See chart on the following page. N2O emissions increase when annual precipitation increases.
The GREET model also assumes that the N in corn residues has the same N-to-N2O conversion rate as fertilizer N. This assumption is not in agreement with Scientific Literature. Research indicates that the N-to-N2O conversion rate of the N in corn residues is only 20% of fertilizer N conversion rates. Corn residues have a very high carbon to nitrogen ratio, and because of this, N is immobilized by bacteria as this high carbon residue is decomposed. Lesschen et al.6 discuss this research and support this reduced N-to-N2O emission factor for corn residue in their research paper. Since 25% (4 CI) of corn ethanol fuel N2O emissions are the result of corn biomass N, a 3 CI reduction is warranted.

Precision N management practices and increased use of enhanced efficiency N fertilizers have resulted in lower N2O emissions in corn fields. Acknowledging an ethanol plant location precipitation adjusted weighted average N-to-N2O conversion factor to determine Mid-West average, and recent science regarding N-to-N2O conversion factors of fertilizer N and corn biomass N is clearly more scientifically defensible modeling. Corn ethanol N2O emission factors in GHG models should be adjusted and N2O emissions should be reduced a minimum of 6 CI. When corn ethanol is produced in areas where precipitation is reasonably balanced with corn crop evapotranspiration, N2O emissions are likely less than 50% of the current Mid-West average.
Co-Product CreditFor use in the California LCFS, CARB modifies the GREET 1.8b model to reduce the co-product credit for distillers grains and assumes 1 lb. of distillers displaces only 1 lb. of corn in feed markets. Corn ethanol distillers grains are significantly more nutrient dense than corn, containing three times the protein, oil, minerals, and vitamins. None of these high value feed/food components are lost in the corn ethanol fermentation process. Peer reviewed University feeding trials have indicated that distillers grains displace 1.2 to 1.4 lbs of corn in cattle rations. ANL’s GREET 1.8b model assumes one pound of distillers grains displace the equivalent of 1.27 lbs. corn. The failure of CARB to acknowledge this science raises corn ethanol CI 2.5 grams in that low carbon fuel market.
When high corn starch diets are used in cattle feed lots and dairies, significant methane emissions occur (enteric fermentation). ANL
Ethanol Across America is a non-profit, non-partisan education campaign of the Clean Fuels Foundation and is sponsored by industry, government, and private interests. For more information, log on to
www.ethanolacrossamerica.net or contact Douglas A. Durante, Director.
This “Re-thinking the Carbon Reduction Value of Corn Ethanol Fuel” White Paper was produced and is distributed as part of a continuing series sponsored by the Ethanol Across America education campaign. Support for this paper was provided by the American Coalition for Ethanol, Dakota Ethanol, LLC, and the South Dakota Corn Utilization Council. Interested parties are
encouraged to submit papers or ideas to [email protected].
tabulates a CI credit for a reduction in enteric fermentation because distillers grains has replaced corn in cattle diets. CARB does not acknowledge this science, and has zeroed out this credit in the GREET 1.8b model. This raises corn ethanol CI 3.5 grams in California’s LCFS market.
Many dry mill corn ethanol plants have added an additional co-product, corn oil. Each acre of corn produces about 10 gallons. This provides a significant amount of energy in feed rations and or biodiesel markets. Modelers have not accounted for this additional co-product in the same manner as the distillers grain co-product (unlike distillers grains, no feed, food or energy credit has been accrued to the corn ethanol life cycle for corn oil). Rather, modelers have tabulated an exceedingly low life cycle CI for corn oil biodiesel because they have assigned no portion of the GHG emissions from corn production to the corn oil. This distorts the CI of corn oil biodiesel downward at the expense of corn ethanol fuel CI. Corn ethanol gets all the gasses and corn oil biodiesel gets all the glory.
Summary If greenhouse gas modeling of transportation fuels are to maintain integrity and achieve their desired outcome, it is essential that modeling is done consistently and that modeling assumptions are periodically reviewed and updated with the latest science. U.S. corn ethanol fuel production has experienced significant energy use and greenhouse gas emission reductions over the course of the last few years. Since 2008, innovation in energy use and conversion technology at ethanol production facilities, innovation in enhanced efficiency fertilizers and in corn production management, and improved accuracy of GHG modeling assumptions have reduced current corn ethanol fuel CI by more than 50%. The future is bright for corn ethanol blends to provide significant reductions in U.S. transportation fuel CI. Long term trends are biofuel’s friends…fossil fuel CIs are increasing and biofuel CIs are being reduced. Corn provides high per acre production of feed/food, high octane fuel, and low GHGs. The wait is over…the advanced biofuel of tomorrow has arrived!