RE: QUARTERLY REPORT · 10/31/2011 · RE: QUARTERLY REPORT ... pond design and costing as the...
19
31 October 2011 The Manager Company Announcements Office Australian Stock Exchange Via Online Electronic Lodgement Dear Sirs, RE: QUARTERLY REPORT Enclosed please find the Quarterly Report for the period ended 30 September 2011. Yours sincerely, CERRO RESOURCES NL Craig J McPherson Company Secretary For personal use only
Transcript of RE: QUARTERLY REPORT · 10/31/2011 · RE: QUARTERLY REPORT ... pond design and costing as the...
31 October 2011 The Manager Company Announcements Office Australian Stock Exchange Via Online Electronic Lodgement Dear Sirs, RE: QUARTERLY REPORT Enclosed please find the Quarterly Report for the period ended 30 September 2011. Yours sincerely, CERRO RESOURCES NL Craig J McPherson Company Secretary
For
per
sona
l use
onl
y

- 2 - QUARTERLY REPORT 30 SEPTEMBER 2011
QUARTERLY REPORT PERIOD ENDED 30 SEPTEMBER 2011
1. QUARTERLY HIGHLIGHTS Mexico
Cerro del Gallo gold/silver project
Final crushing and processing circuit design nears completion;
Greater recovery through HPGR confirmed;
BFS for heap leach continues and nears final inputs;
Namiquipa silver project
Encouraging drill results released for first 3 drill holes in August;
Second core rig added and program extended;
Further drilling results released post quarter end for a further 11 drill holes completed
during quarter:
o Zones of good grade mineralization detailed below (Tables 4 to 8) but including:
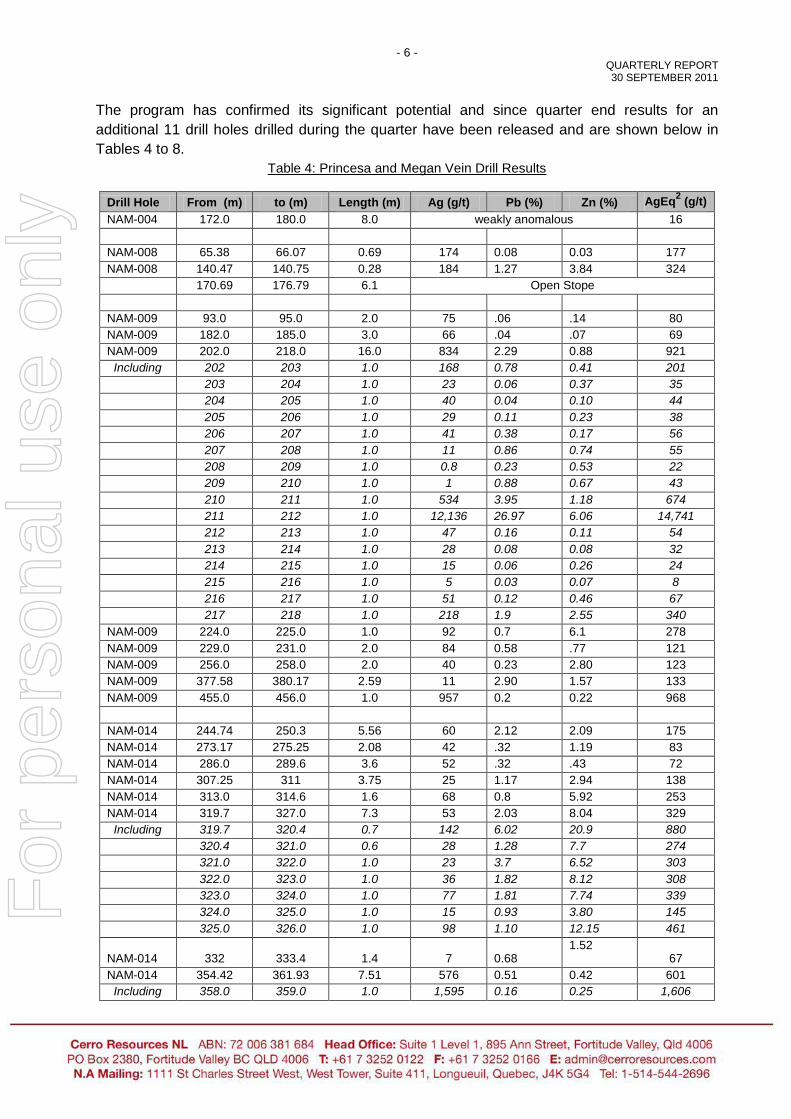
NAM-009: 16m @ 921g/t AgEq from 202m, including 1m @ 14,741g/t AgEq (12,136g/t Ag, 26.97% Pb and 6.06% Zn)*;
NAM-014: 7.5m @ 601g/t AgEq from 354.4m, including 1m @ 1,606g/t AgEq;
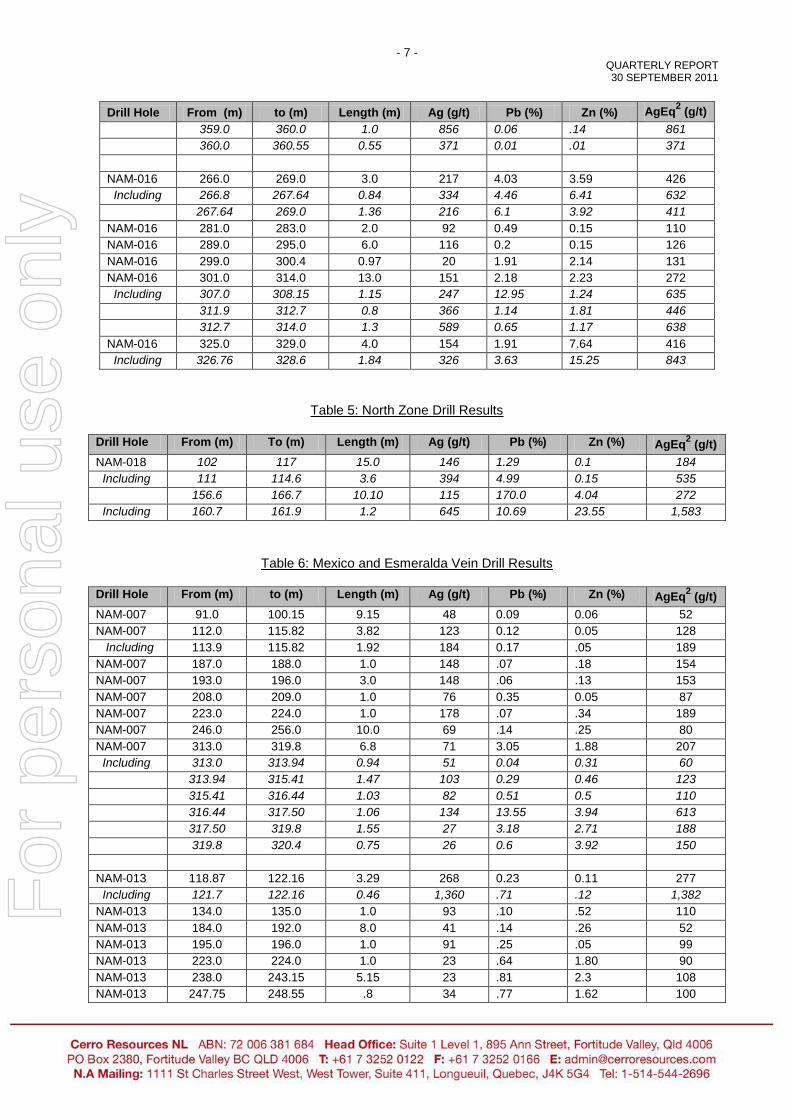
NAM-016: 13m @ 272g/t AgEq from 301m; o Potential extension to Princesa Vein identified - NAM-018: 15m @ 184g/t AgEq
from 102m, including 3.6m @ 535g/t AgEq and 10m @ 272g/t AgEq from 156.6m, including 1.2m @ 1,583g/t AgEq;
Espiritu Santo Jalisco acquisition
New project acquisition announced boosting precious metals focus in Mexico;
Potential for Au Ag discovery highlighted by historic rock chip sampling and mining in the
broader region;
Australia
Inferred resource announced for part project area at Mt Philp;
Drilling for resource over total strike length by year end;
2. CORPORATE
Management focused during the quarter on advancement of the Company‟s three projects:
Cerro del Gallo, Namiquipa and Mt Philp; advancement to acquisition of the new Espiritu Santo
Jalisco project; and completion of the statutory audit plus preparation and publication of the
annual report to stakeholders.
* Sample was re-assayed using four methods, including as a concentrate, at ALS in Vancouver and it should be noted that core
recovery was within fault zone with 50 to 70% core recovery.
For
per
sona
l use
onl
y
- 3 - QUARTERLY REPORT 30 SEPTEMBER 2011
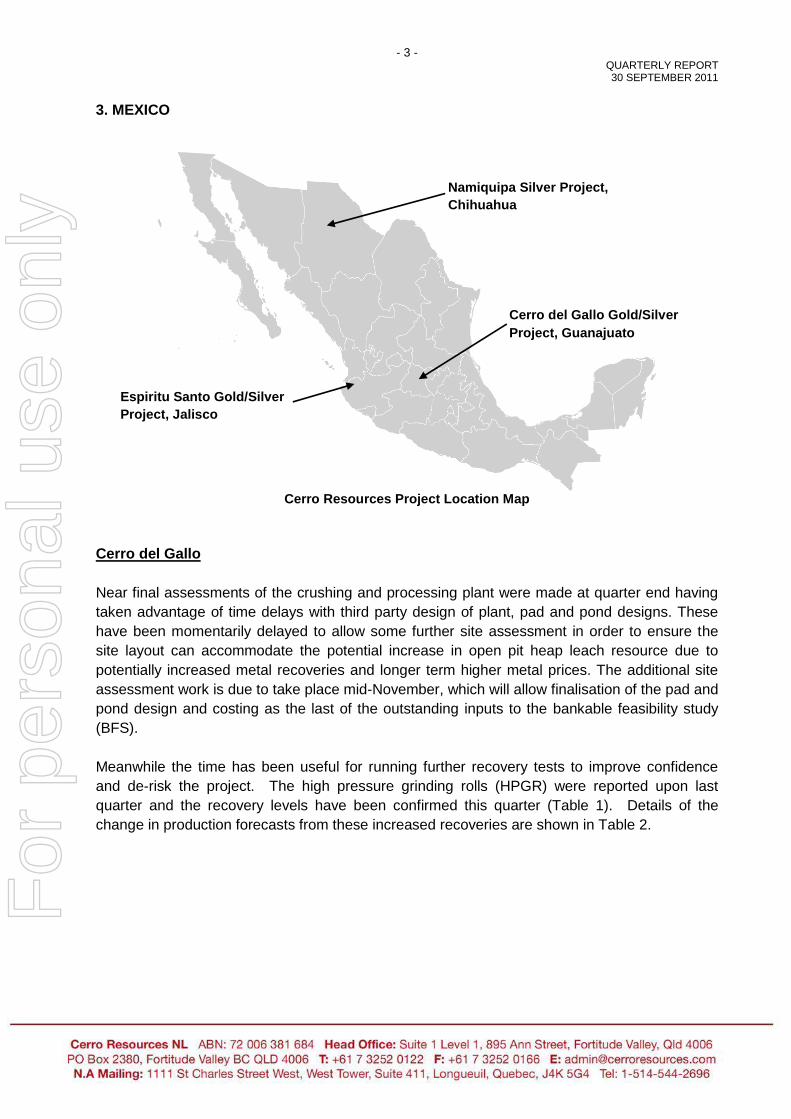
3. MEXICO
Cerro Resources Project Location Map
Cerro del Gallo
Near final assessments of the crushing and processing plant were made at quarter end having
taken advantage of time delays with third party design of plant, pad and pond designs. These
have been momentarily delayed to allow some further site assessment in order to ensure the
site layout can accommodate the potential increase in open pit heap leach resource due to
potentially increased metal recoveries and longer term higher metal prices. The additional site
assessment work is due to take place mid-November, which will allow finalisation of the pad and
pond design and costing as the last of the outstanding inputs to the bankable feasibility study
(BFS).
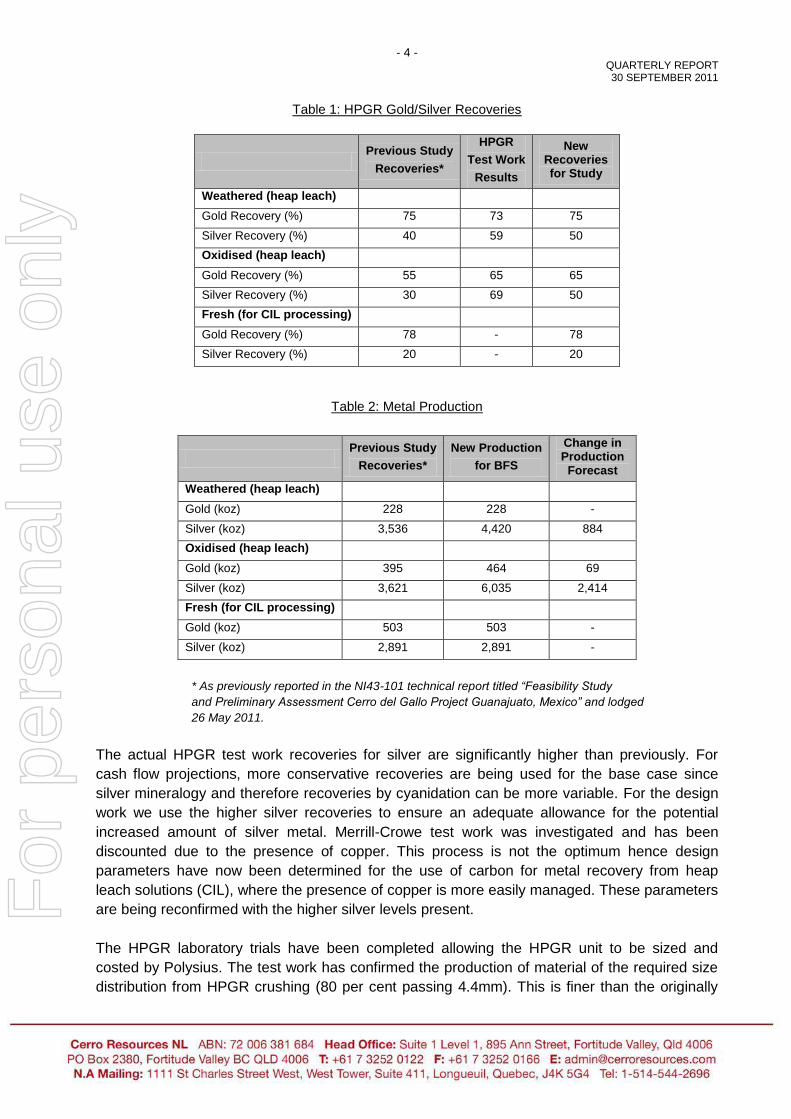
Meanwhile the time has been useful for running further recovery tests to improve confidence
and de-risk the project. The high pressure grinding rolls (HPGR) were reported upon last
quarter and the recovery levels have been confirmed this quarter (Table 1). Details of the
change in production forecasts from these increased recoveries are shown in Table 2.
Namiquipa Silver Project,
Chihuahua
Cerro del Gallo Gold/Silver
Project, Guanajuato
Espiritu Santo Gold/Silver
Project, Jalisco
For
per
sona
l use
onl
y
- 4 - QUARTERLY REPORT 30 SEPTEMBER 2011
Table 1: HPGR Gold/Silver Recoveries
Previous Study
Recoveries*
HPGR
Test Work
Results
New Recoveries for Study
Weathered (heap leach)
Gold Recovery (%) 75 73 75
Silver Recovery (%) 40 59 50
Oxidised (heap leach)
Gold Recovery (%) 55 65 65
Silver Recovery (%) 30 69 50
Fresh (for CIL processing)
Gold Recovery (%) 78 - 78
Silver Recovery (%) 20 - 20
Table 2: Metal Production
Previous Study
Recoveries*
New Production
for BFS
Change in Production
Forecast
Weathered (heap leach)
Gold (koz) 228 228 -
Silver (koz) 3,536 4,420 884
Oxidised (heap leach)
Gold (koz) 395 464 69
Silver (koz) 3,621 6,035 2,414
Fresh (for CIL processing)
Gold (koz) 503 503 -
Silver (koz) 2,891 2,891 -
* As previously reported in the NI43-101 technical report titled “Feasibility Study
and Preliminary Assessment Cerro del Gallo Project Guanajuato, Mexico” and lodged
26 May 2011.
The actual HPGR test work recoveries for silver are significantly higher than previously. For
cash flow projections, more conservative recoveries are being used for the base case since
silver mineralogy and therefore recoveries by cyanidation can be more variable. For the design
work we use the higher silver recoveries to ensure an adequate allowance for the potential
increased amount of silver metal. Merrill-Crowe test work was investigated and has been
discounted due to the presence of copper. This process is not the optimum hence design
parameters have now been determined for the use of carbon for metal recovery from heap
leach solutions (CIL), where the presence of copper is more easily managed. These parameters
are being reconfirmed with the higher silver levels present.
The HPGR laboratory trials have been completed allowing the HPGR unit to be sized and
costed by Polysius. The test work has confirmed the production of material of the required size
distribution from HPGR crushing (80 per cent passing 4.4mm). This is finer than the originally
For
per
sona
l use
onl
y
- 5 - QUARTERLY REPORT 30 SEPTEMBER 2011
targeted 6.3mm by conventional and will give greater confidence that recoveries achieved by
the column tests can be realised in practice. To ensure the heap leach will have the required
permeability with the fine crush size, further agglomeration test work using cement has been
completed and two additional column leach tests have commenced. The columns are 6 metres
high and are filled with the HPGR crushed material with the 80 per cent passing 4.4mm crush
size. These tests are confirmatory tests to provide additional support information for the BFS.
Namiquipa
Drilling commenced late May 2011 and at the end of June 8 holes for a total of 2,800m of
diamond core had been completed. During the September quarter a second drill rig was added
and a further 26 holes for a total of 9,300m of drilling was completed with very encouraging drill
intercepts.
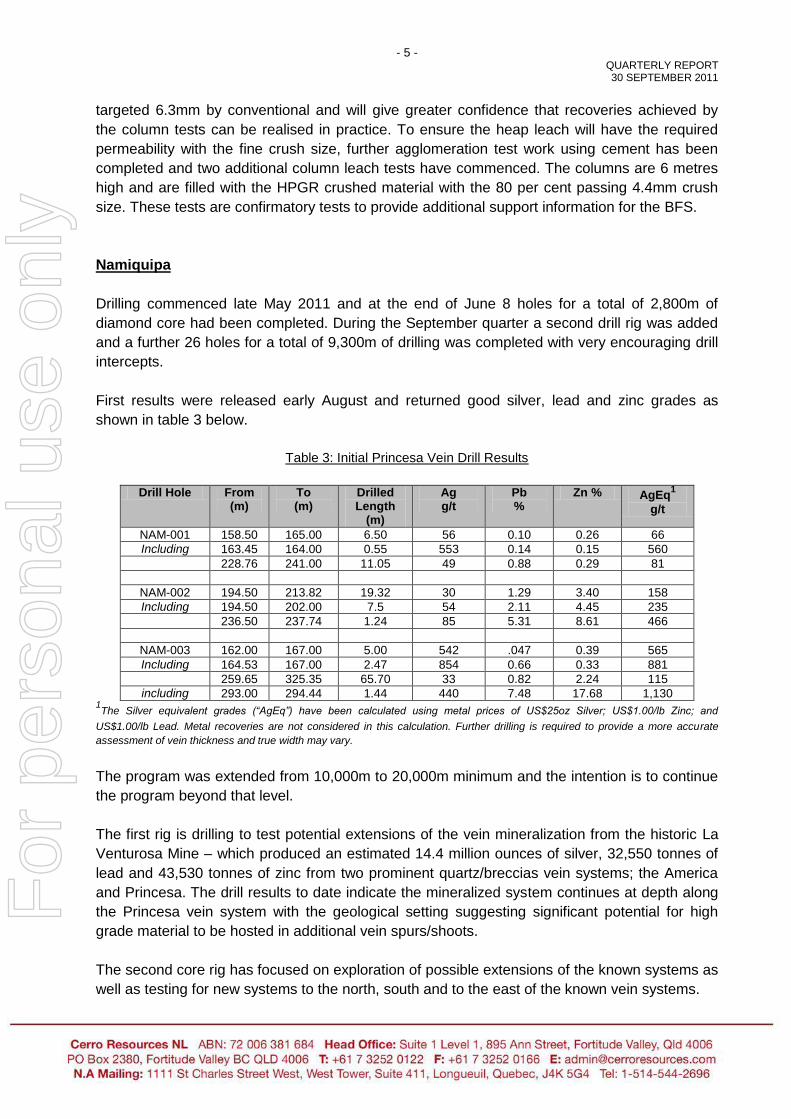
First results were released early August and returned good silver, lead and zinc grades as
shown in table 3 below.
Table 3: Initial Princesa Vein Drill Results
Drill Hole From (m)
To (m)
Drilled Length
(m)
Ag g/t
Pb %
Zn % AgEq1
g/t
NAM-001 158.50 165.00 6.50 56 0.10 0.26 66
Including 163.45 164.00 0.55 553 0.14 0.15 560
228.76 241.00 11.05 49 0.88 0.29 81
NAM-002 194.50 213.82 19.32 30 1.29 3.40 158
Including 194.50 202.00 7.5 54 2.11 4.45 235
236.50 237.74 1.24 85 5.31 8.61 466
NAM-003 162.00 167.00 5.00 542 .047 0.39 565
Including 164.53 167.00 2.47 854 0.66 0.33 881
259.65 325.35 65.70 33 0.82 2.24 115
including 293.00 294.44 1.44 440 7.48 17.68 1,130 1The Silver equivalent grades (“AgEq”) have been calculated using metal prices of US$25oz Silver; US$1.00/lb Zinc; and
US$1.00/lb Lead. Metal recoveries are not considered in this calculation. Further drilling is required to provide a more accurate
assessment of vein thickness and true width may vary.
The program was extended from 10,000m to 20,000m minimum and the intention is to continue
the program beyond that level.
The first rig is drilling to test potential extensions of the vein mineralization from the historic La
Venturosa Mine – which produced an estimated 14.4 million ounces of silver, 32,550 tonnes of
lead and 43,530 tonnes of zinc from two prominent quartz/breccias vein systems; the America
and Princesa. The drill results to date indicate the mineralized system continues at depth along
the Princesa vein system with the geological setting suggesting significant potential for high
grade material to be hosted in additional vein spurs/shoots.
The second core rig has focused on exploration of possible extensions of the known systems as
well as testing for new systems to the north, south and to the east of the known vein systems.
For
per
sona
l use
onl
y
- 6 - QUARTERLY REPORT 30 SEPTEMBER 2011
The program has confirmed its significant potential and since quarter end results for an
additional 11 drill holes drilled during the quarter have been released and are shown below in
Tables 4 to 8.
Table 4: Princesa and Megan Vein Drill Results
Drill Hole From (m) to (m) Length (m) Ag (g/t) Pb (%) Zn (%) AgEq2 (g/t)
NAM-004 172.0 180.0 8.0 weakly anomalous 16
NAM-008 65.38 66.07 0.69 174 0.08 0.03 177
NAM-008 140.47 140.75 0.28 184 1.27 3.84 324
170.69 176.79 6.1 Open Stope
NAM-009 93.0 95.0 2.0 75 .06 .14 80
NAM-009 182.0 185.0 3.0 66 .04 .07 69
NAM-009 202.0 218.0 16.0 834 2.29 0.88 921
Including 202 203 1.0 168 0.78 0.41 201
203 204 1.0 23 0.06 0.37 35
204 205 1.0 40 0.04 0.10 44
205 206 1.0 29 0.11 0.23 38
206 207 1.0 41 0.38 0.17 56
207 208 1.0 11 0.86 0.74 55
208 209 1.0 0.8 0.23 0.53 22
209 210 1.0 1 0.88 0.67 43
210 211 1.0 534 3.95 1.18 674
211 212 1.0 12,136 26.97 6.06 14,741
212 213 1.0 47 0.16 0.11 54
213 214 1.0 28 0.08 0.08 32
214 215 1.0 15 0.06 0.26 24
215 216 1.0 5 0.03 0.07 8
216 217 1.0 51 0.12 0.46 67
217 218 1.0 218 1.9 2.55 340
NAM-009 224.0 225.0 1.0 92 0.7 6.1 278
NAM-009 229.0 231.0 2.0 84 0.58 .77 121
NAM-009 256.0 258.0 2.0 40 0.23 2.80 123
NAM-009 377.58 380.17 2.59 11 2.90 1.57 133
NAM-009 455.0 456.0 1.0 957 0.2 0.22 968
NAM-014 244.74 250.3 5.56 60 2.12 2.09 175
NAM-014 273.17 275.25 2.08 42 .32 1.19 83
NAM-014 286.0 289.6 3.6 52 .32 .43 72
NAM-014 307.25 311 3.75 25 1.17 2.94 138
NAM-014 313.0 314.6 1.6 68 0.8 5.92 253
NAM-014 319.7 327.0 7.3 53 2.03 8.04 329
Including 319.7 320.4 0.7 142 6.02 20.9 880
320.4 321.0 0.6 28 1.28 7.7 274
321.0 322.0 1.0 23 3.7 6.52 303
322.0 323.0 1.0 36 1.82 8.12 308
323.0 324.0 1.0 77 1.81 7.74 339
324.0 325.0 1.0 15 0.93 3.80 145
325.0 326.0 1.0 98 1.10 12.15 461
NAM-014 332 333.4 1.4 7 0.68 1.52
67
NAM-014 354.42 361.93 7.51 576 0.51 0.42 601
Including 358.0 359.0 1.0 1,595 0.16 0.25 1,606
For
per
sona
l use
onl
y
- 7 - QUARTERLY REPORT 30 SEPTEMBER 2011
Drill Hole From (m) to (m) Length (m) Ag (g/t) Pb (%) Zn (%) AgEq2 (g/t)
359.0 360.0 1.0 856 0.06 .14 861
360.0 360.55 0.55 371 0.01 .01 371
NAM-016 266.0 269.0 3.0 217 4.03 3.59 426
Including 266.8 267.64 0.84 334 4.46 6.41 632
267.64 269.0 1.36 216 6.1 3.92 411
NAM-016 281.0 283.0 2.0 92 0.49 0.15 110
NAM-016 289.0 295.0 6.0 116 0.2 0.15 126
NAM-016 299.0 300.4 0.97 20 1.91 2.14 131
NAM-016 301.0 314.0 13.0 151 2.18 2.23 272
Including 307.0 308.15 1.15 247 12.95 1.24 635
311.9 312.7 0.8 366 1.14 1.81 446
312.7 314.0 1.3 589 0.65 1.17 638
NAM-016 325.0 329.0 4.0 154 1.91 7.64 416
Including 326.76 328.6 1.84 326 3.63 15.25 843
Table 5: North Zone Drill Results
Drill Hole From (m) To (m) Length (m) Ag (g/t) Pb (%) Zn (%) AgEq
2 (g/t)
NAM-018 102 117 15.0 146 1.29 0.1 184
Including 111 114.6 3.6 394 4.99 0.15 535
156.6 166.7 10.10 115 170.0 4.04 272
Including 160.7 161.9 1.2 645 10.69 23.55 1,583
Table 6: Mexico and Esmeralda Vein Drill Results
Drill Hole From (m) to (m) Length (m) Ag (g/t) Pb (%) Zn (%) AgEq
2 (g/t)
NAM-007 91.0 100.15 9.15 48 0.09 0.06 52
NAM-007 112.0 115.82 3.82 123 0.12 0.05 128
Including 113.9 115.82 1.92 184 0.17 .05 189
NAM-007 187.0 188.0 1.0 148 .07 .18 154
NAM-007 193.0 196.0 3.0 148 .06 .13 153
NAM-007 208.0 209.0 1.0 76 0.35 0.05 87
NAM-007 223.0 224.0 1.0 178 .07 .34 189
NAM-007 246.0 256.0 10.0 69 .14 .25 80
NAM-007 313.0 319.8 6.8 71 3.05 1.88 207
Including 313.0 313.94 0.94 51 0.04 0.31 60
313.94 315.41 1.47 103 0.29 0.46 123
315.41 316.44 1.03 82 0.51 0.5 110
316.44 317.50 1.06 134 13.55 3.94 613
317.50 319.8 1.55 27 3.18 2.71 188
319.8 320.4 0.75 26 0.6 3.92 150
NAM-013 118.87 122.16 3.29 268 0.23 0.11 277
Including 121.7 122.16 0.46 1,360 .71 .12 1,382
NAM-013 134.0 135.0 1.0 93 .10 .52 110
NAM-013 184.0 192.0 8.0 41 .14 .26 52
NAM-013 195.0 196.0 1.0 91 .25 .05 99
NAM-013 223.0 224.0 1.0 23 .64 1.80 90
NAM-013 238.0 243.15 5.15 23 .81 2.3 108
NAM-013 247.75 248.55 .8 34 .77 1.62 100
For
per
sona
l use
onl
y
- 8 - QUARTERLY REPORT 30 SEPTEMBER 2011
Drill Hole From (m) to (m) Length (m) Ag (g/t) Pb (%) Zn (%) AgEq2 (g/t)
NAM-013 249.45 249.8 .35 79 .62 1.33 132
NAM-013 259.0 264.0 5.0 268 .17 .24 279
Including 259.0 261.0 2.0 435 .39 .44 457
NAM-013 346.67 352.5 5.83 186 1.08 2.81 293
Including 351.48 352.5 1.02 998 2.47 6.61 1,246
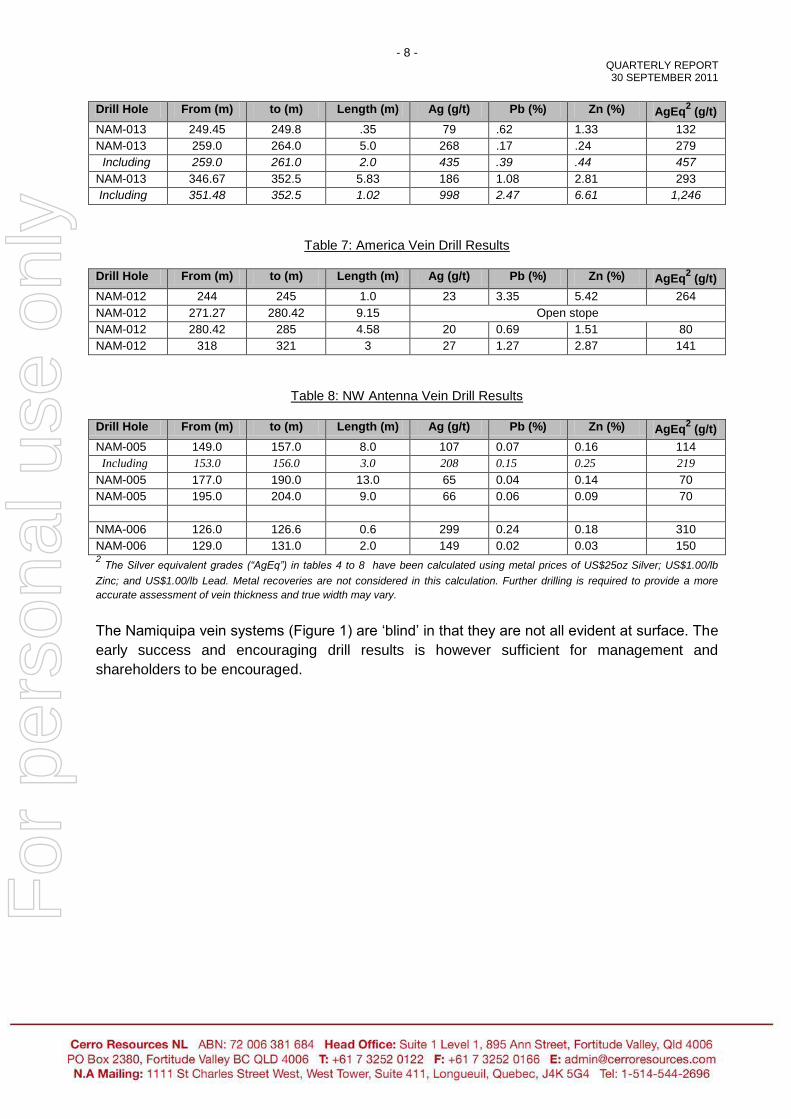
Table 7: America Vein Drill Results
Drill Hole From (m) to (m) Length (m) Ag (g/t) Pb (%) Zn (%) AgEq
2 (g/t)
NAM-012 244 245 1.0 23 3.35 5.42 264
NAM-012 271.27 280.42 9.15 Open stope
NAM-012 280.42 285 4.58 20 0.69 1.51 80
NAM-012 318 321 3 27 1.27 2.87 141
Table 8: NW Antenna Vein Drill Results
Drill Hole From (m) to (m) Length (m) Ag (g/t) Pb (%) Zn (%) AgEq
2 (g/t)
NAM-005 149.0 157.0 8.0 107 0.07 0.16 114
Including 153.0 156.0 3.0 208 0.15 0.25 219
NAM-005 177.0 190.0 13.0 65 0.04 0.14 70
NAM-005 195.0 204.0 9.0 66 0.06 0.09 70
NMA-006 126.0 126.6 0.6 299 0.24 0.18 310
NAM-006 129.0 131.0 2.0 149 0.02 0.03 150 2
The Silver equivalent grades (“AgEq”) in tables 4 to 8 have been calculated using metal prices of US$25oz Silver; US$1.00/lb
Zinc; and US$1.00/lb Lead. Metal recoveries are not considered in this calculation. Further drilling is required to provide a more
accurate assessment of vein thickness and true width may vary.
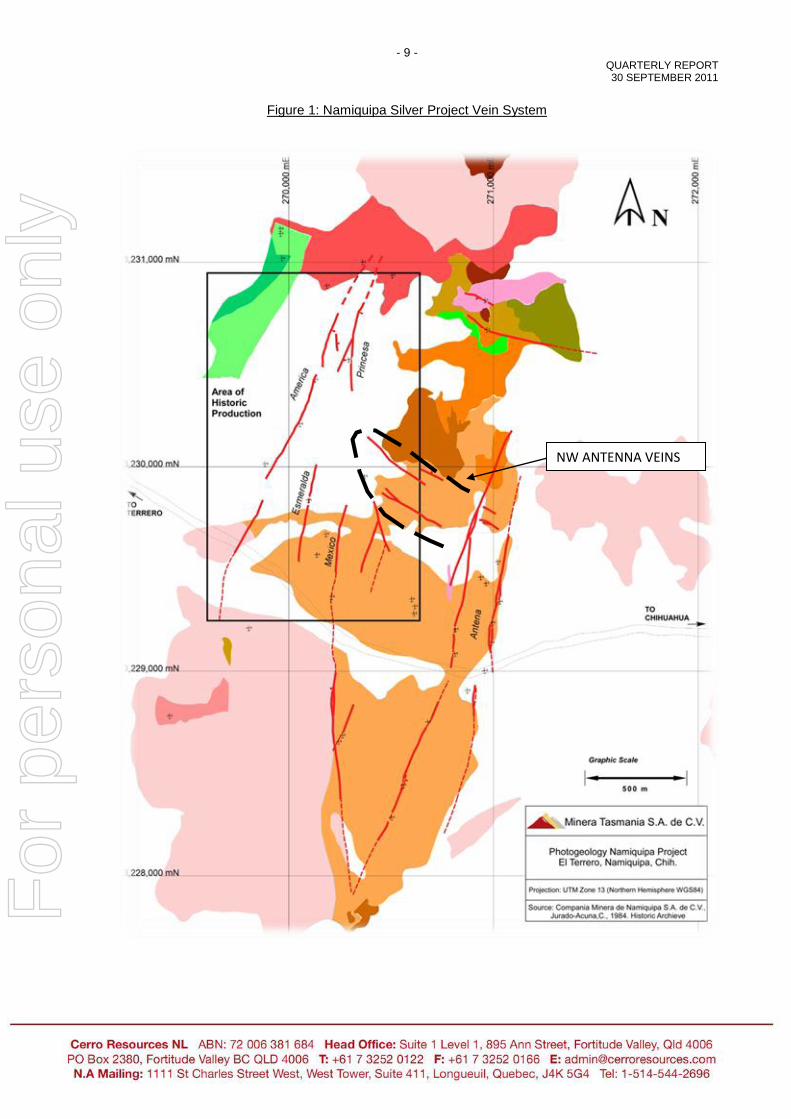
The Namiquipa vein systems (Figure 1) are „blind‟ in that they are not all evident at surface. The
early success and encouraging drill results is however sufficient for management and
shareholders to be encouraged.
For
per
sona
l use
onl
y
- 9 - QUARTERLY REPORT 30 SEPTEMBER 2011
Figure 1: Namiquipa Silver Project Vein System
NW ANTENNA VEINS
For
per
sona
l use
onl
y
- 10 - QUARTERLY REPORT 30 SEPTEMBER 2011
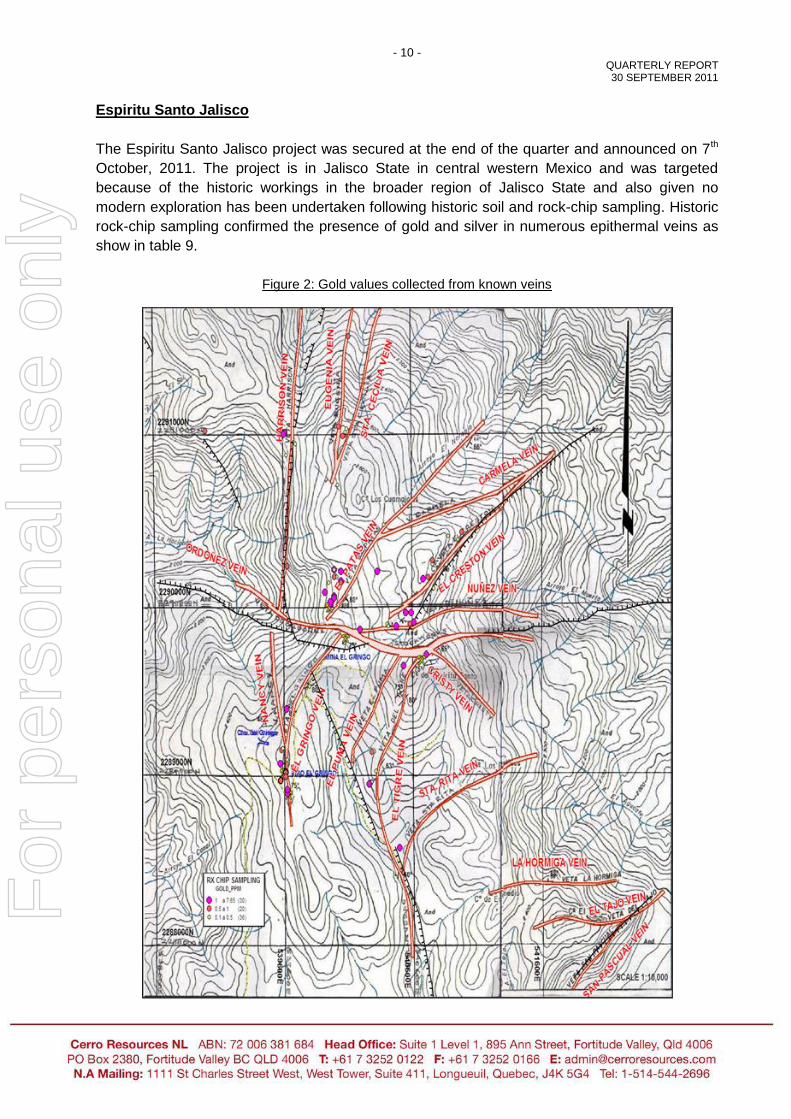
Espiritu Santo Jalisco
The Espiritu Santo Jalisco project was secured at the end of the quarter and announced on 7th
October, 2011. The project is in Jalisco State in central western Mexico and was targeted
because of the historic workings in the broader region of Jalisco State and also given no
modern exploration has been undertaken following historic soil and rock-chip sampling. Historic
rock-chip sampling confirmed the presence of gold and silver in numerous epithermal veins as
show in table 9.
Figure 2: Gold values collected from known veins
For
per
sona
l use
onl
y
- 11 - QUARTERLY REPORT 30 SEPTEMBER 2011
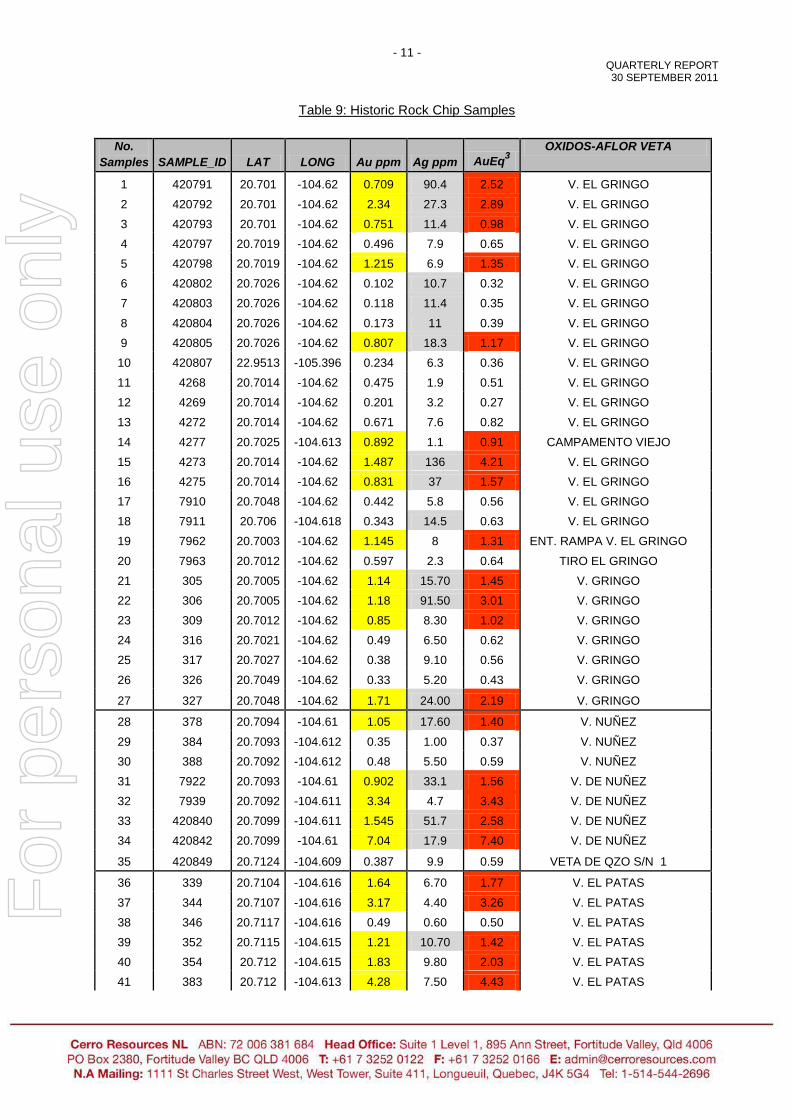
Table 9: Historic Rock Chip Samples
No.
Samples SAMPLE_ID LAT LONG Au ppm Ag ppm AuEq3
OXIDOS-AFLOR VETA
1 420791 20.701 -104.62 0.709 90.4 2.52 V. EL GRINGO
2 420792 20.701 -104.62 2.34 27.3 2.89 V. EL GRINGO
3 420793 20.701 -104.62 0.751 11.4 0.98 V. EL GRINGO
4 420797 20.7019 -104.62 0.496 7.9 0.65 V. EL GRINGO
5 420798 20.7019 -104.62 1.215 6.9 1.35 V. EL GRINGO
6 420802 20.7026 -104.62 0.102 10.7 0.32 V. EL GRINGO
7 420803 20.7026 -104.62 0.118 11.4 0.35 V. EL GRINGO
8 420804 20.7026 -104.62 0.173 11 0.39 V. EL GRINGO
9 420805 20.7026 -104.62 0.807 18.3 1.17 V. EL GRINGO
10 420807 22.9513 -105.396 0.234 6.3 0.36 V. EL GRINGO
11 4268 20.7014 -104.62 0.475 1.9 0.51 V. EL GRINGO
12 4269 20.7014 -104.62 0.201 3.2 0.27 V. EL GRINGO
13 4272 20.7014 -104.62 0.671 7.6 0.82 V. EL GRINGO
14 4277 20.7025 -104.613 0.892 1.1 0.91 CAMPAMENTO VIEJO
15 4273 20.7014 -104.62 1.487 136 4.21 V. EL GRINGO
16 4275 20.7014 -104.62 0.831 37 1.57 V. EL GRINGO
17 7910 20.7048 -104.62 0.442 5.8 0.56 V. EL GRINGO
18 7911 20.706 -104.618 0.343 14.5 0.63 V. EL GRINGO
19 7962 20.7003 -104.62 1.145 8 1.31 ENT. RAMPA V. EL GRINGO
20 7963 20.7012 -104.62 0.597 2.3 0.64 TIRO EL GRINGO
21 305 20.7005 -104.62 1.14 15.70 1.45 V. GRINGO
22 306 20.7005 -104.62 1.18 91.50 3.01 V. GRINGO
23 309 20.7012 -104.62 0.85 8.30 1.02 V. GRINGO
24 316 20.7021 -104.62 0.49 6.50 0.62 V. GRINGO
25 317 20.7027 -104.62 0.38 9.10 0.56 V. GRINGO
26 326 20.7049 -104.62 0.33 5.20 0.43 V. GRINGO
27 327 20.7048 -104.62 1.71 24.00 2.19 V. GRINGO
28 378 20.7094 -104.61 1.05 17.60 1.40 V. NUÑEZ
29 384 20.7093 -104.612 0.35 1.00 0.37 V. NUÑEZ
30 388 20.7092 -104.612 0.48 5.50 0.59 V. NUÑEZ
31 7922 20.7093 -104.61 0.902 33.1 1.56 V. DE NUÑEZ
32 7939 20.7092 -104.611 3.34 4.7 3.43 V. DE NUÑEZ
33 420840 20.7099 -104.611 1.545 51.7 2.58 V. DE NUÑEZ
34 420842 20.7099 -104.61 7.04 17.9 7.40 V. DE NUÑEZ
35 420849 20.7124 -104.609 0.387 9.9 0.59 VETA DE QZO S/N 1
36 339 20.7104 -104.616 1.64 6.70 1.77 V. EL PATAS
37 344 20.7107 -104.616 3.17 4.40 3.26 V. EL PATAS
38 346 20.7117 -104.616 0.49 0.60 0.50 V. EL PATAS
39 352 20.7115 -104.615 1.21 10.70 1.42 V. EL PATAS
40 354 20.712 -104.615 1.83 9.80 2.03 V. EL PATAS
41 383 20.712 -104.613 4.28 7.50 4.43 V. EL PATAS
For
per
sona
l use
onl
y
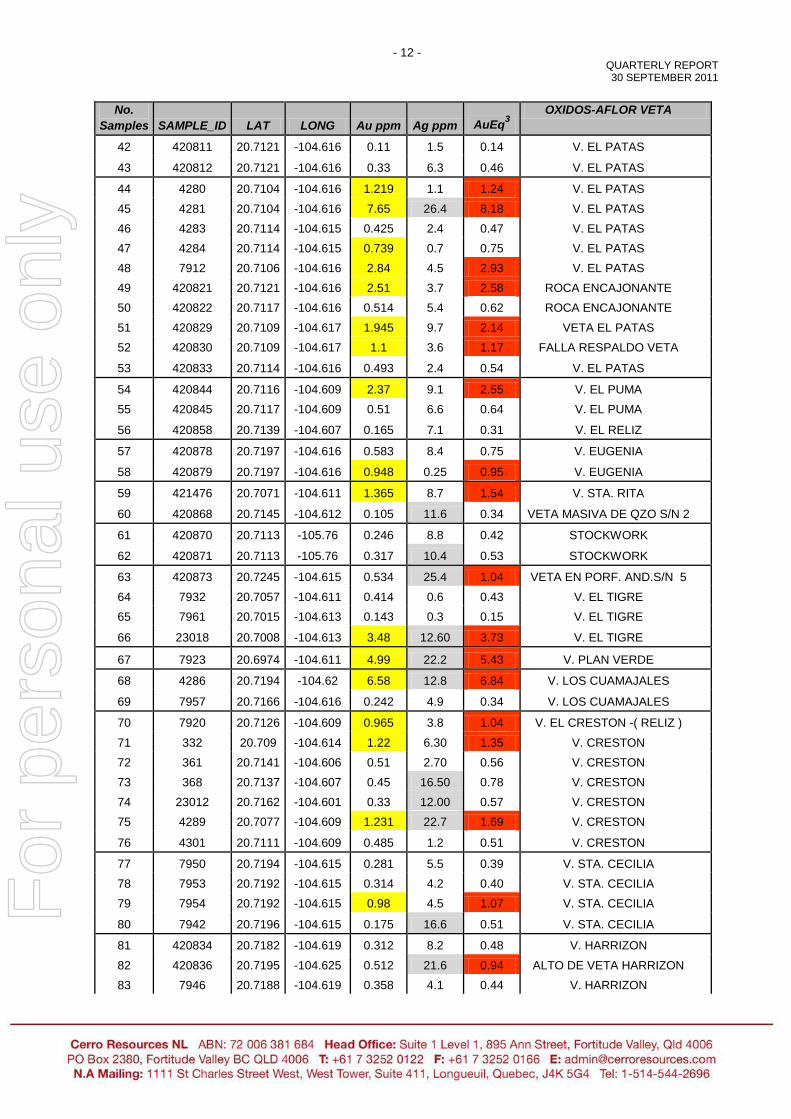
- 12 - QUARTERLY REPORT 30 SEPTEMBER 2011
No.
Samples SAMPLE_ID LAT LONG Au ppm Ag ppm AuEq3
OXIDOS-AFLOR VETA
42 420811 20.7121 -104.616 0.11 1.5 0.14 V. EL PATAS
43 420812 20.7121 -104.616 0.33 6.3 0.46 V. EL PATAS
44 4280 20.7104 -104.616 1.219 1.1 1.24 V. EL PATAS
45 4281 20.7104 -104.616 7.65 26.4 8.18 V. EL PATAS
46 4283 20.7114 -104.615 0.425 2.4 0.47 V. EL PATAS
47 4284 20.7114 -104.615 0.739 0.7 0.75 V. EL PATAS
48 7912 20.7106 -104.616 2.84 4.5 2.93 V. EL PATAS
49 420821 20.7121 -104.616 2.51 3.7 2.58 ROCA ENCAJONANTE
50 420822 20.7117 -104.616 0.514 5.4 0.62 ROCA ENCAJONANTE
51 420829 20.7109 -104.617 1.945 9.7 2.14 VETA EL PATAS
52 420830 20.7109 -104.617 1.1 3.6 1.17 FALLA RESPALDO VETA
53 420833 20.7114 -104.616 0.493 2.4 0.54 V. EL PATAS
54 420844 20.7116 -104.609 2.37 9.1 2.55 V. EL PUMA
55 420845 20.7117 -104.609 0.51 6.6 0.64 V. EL PUMA
56 420858 20.7139 -104.607 0.165 7.1 0.31 V. EL RELIZ
57 420878 20.7197 -104.616 0.583 8.4 0.75 V. EUGENIA
58 420879 20.7197 -104.616 0.948 0.25 0.95 V. EUGENIA
59 421476 20.7071 -104.611 1.365 8.7 1.54 V. STA. RITA
60 420868 20.7145 -104.612 0.105 11.6 0.34 VETA MASIVA DE QZO S/N 2
61 420870 20.7113 -105.76 0.246 8.8 0.42 STOCKWORK
62 420871 20.7113 -105.76 0.317 10.4 0.53 STOCKWORK
63 420873 20.7245 -104.615 0.534 25.4 1.04 VETA EN PORF. AND.S/N 5
64 7932 20.7057 -104.611 0.414 0.6 0.43 V. EL TIGRE
65 7961 20.7015 -104.613 0.143 0.3 0.15 V. EL TIGRE
66 23018 20.7008 -104.613 3.48 12.60 3.73 V. EL TIGRE
67 7923 20.6974 -104.611 4.99 22.2 5.43 V. PLAN VERDE
68 4286 20.7194 -104.62 6.58 12.8 6.84 V. LOS CUAMAJALES
69 7957 20.7166 -104.616 0.242 4.9 0.34 V. LOS CUAMAJALES
70 7920 20.7126 -104.609 0.965 3.8 1.04 V. EL CRESTON -( RELIZ )
71 332 20.709 -104.614 1.22 6.30 1.35 V. CRESTON
72 361 20.7141 -104.606 0.51 2.70 0.56 V. CRESTON
73 368 20.7137 -104.607 0.45 16.50 0.78 V. CRESTON
74 23012 20.7162 -104.601 0.33 12.00 0.57 V. CRESTON
75 4289 20.7077 -104.609 1.231 22.7 1.69 V. CRESTON
76 4301 20.7111 -104.609 0.485 1.2 0.51 V. CRESTON
77 7950 20.7194 -104.615 0.281 5.5 0.39 V. STA. CECILIA
78 7953 20.7192 -104.615 0.314 4.2 0.40 V. STA. CECILIA
79 7954 20.7192 -104.615 0.98 4.5 1.07 V. STA. CECILIA
80 7942 20.7196 -104.615 0.175 16.6 0.51 V. STA. CECILIA
81 420834 20.7182 -104.619 0.312 8.2 0.48 V. HARRIZON
82 420836 20.7195 -104.625 0.512 21.6 0.94 ALTO DE VETA HARRIZON
83 7946 20.7188 -104.619 0.358 4.1 0.44 V. HARRIZON
For
per
sona
l use
onl
y
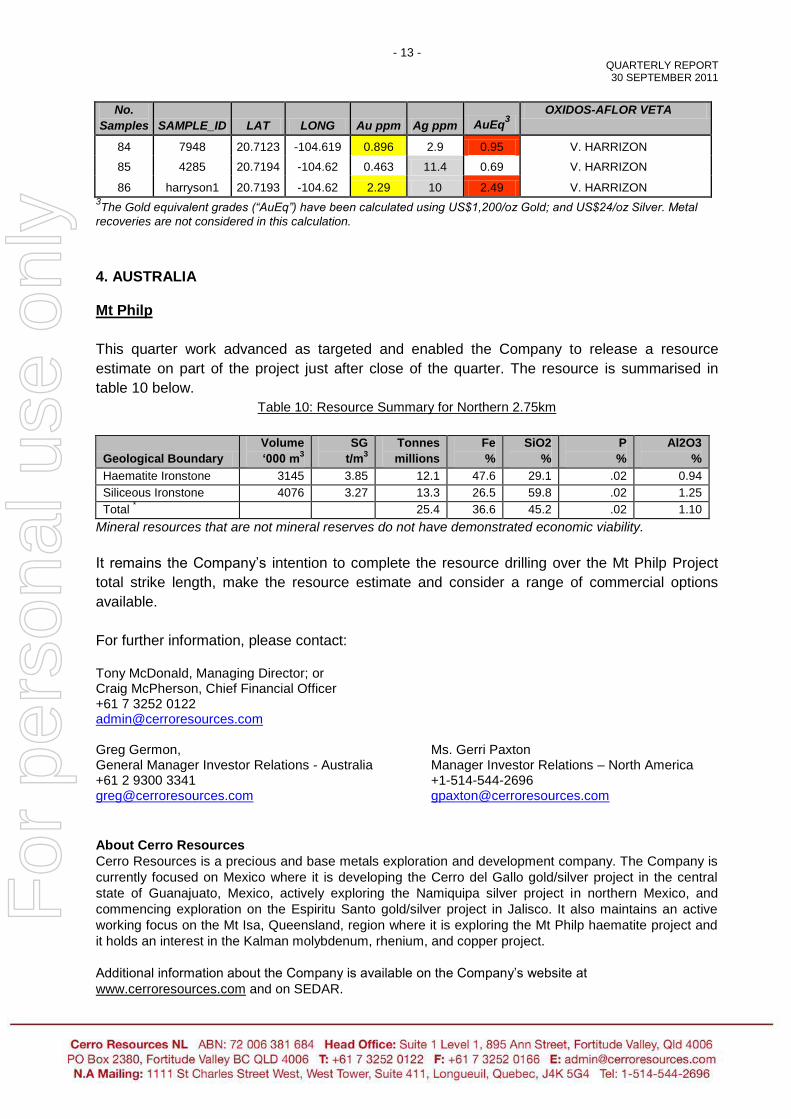
- 13 - QUARTERLY REPORT 30 SEPTEMBER 2011
No.
Samples SAMPLE_ID LAT LONG Au ppm Ag ppm AuEq3
OXIDOS-AFLOR VETA
84 7948 20.7123 -104.619 0.896 2.9 0.95 V. HARRIZON
85 4285 20.7194 -104.62 0.463 11.4 0.69 V. HARRIZON
86 harryson1 20.7193 -104.62 2.29 10 2.49 V. HARRIZON 3The Gold equivalent grades (“AuEq”) have been calculated using US$1,200/oz Gold; and US$24/oz Silver. Metal
recoveries are not considered in this calculation.
4. AUSTRALIA Mt Philp
This quarter work advanced as targeted and enabled the Company to release a resource
estimate on part of the project just after close of the quarter. The resource is summarised in
table 10 below.
Table 10: Resource Summary for Northern 2.75km
Geological Boundary
Volume
‘000 m3
SG
t/m3
Tonnes
millions
Fe
%
SiO2
%
P
%
Al2O3
%
Haematite Ironstone 3145 3.85 12.1 47.6 29.1 .02 0.94
Siliceous Ironstone 4076 3.27 13.3 26.5 59.8 .02 1.25
Total * 25.4 36.6 45.2 .02 1.10
Mineral resources that are not mineral reserves do not have demonstrated economic viability.
It remains the Company‟s intention to complete the resource drilling over the Mt Philp Project
total strike length, make the resource estimate and consider a range of commercial options
available.
For further information, please contact: Tony McDonald, Managing Director; or Craig McPherson, Chief Financial Officer +61 7 3252 0122 [email protected] Greg Germon, Ms. Gerri Paxton General Manager Investor Relations - Australia Manager Investor Relations – North America +61 2 9300 3341 +1-514-544-2696 [email protected] [email protected]
About Cerro Resources
Cerro Resources is a precious and base metals exploration and development company. The Company is
currently focused on Mexico where it is developing the Cerro del Gallo gold/silver project in the central
state of Guanajuato, Mexico, actively exploring the Namiquipa silver project in northern Mexico, and
commencing exploration on the Espiritu Santo gold/silver project in Jalisco. It also maintains an active
working focus on the Mt Isa, Queensland, region where it is exploring the Mt Philp haematite project and
it holds an interest in the Kalman molybdenum, rhenium, and copper project.
Additional information about the Company is available on the Company‟s website at
www.cerroresources.com and on SEDAR.
For
per
sona
l use
onl
y

- 14 - QUARTERLY REPORT 30 SEPTEMBER 2011
Competent Person/Qualified Person
The information in this report that relates to Exploration Results, Mineral Resources or Ore Reserves is based on information compiled by Mr John Skeet (as it relates to process related material), who is a Member of the Australasian Institute of Mining and Metallurgy; Mr Bill Fleshman (as it relates to the San Anton, Namiquipa, and Espiritu Santo Projects), who is a Fellow of the Australasian Institute of Mining and Metallurgy; and Mr Trevor Leahey (as it relates to the Mt Philp Project), who is a Member of the Australasian Institute of Mining and Metallurgy. Mr Skeet is the Chief Operating Officer of Cerro Resources NL. Mr Fleshman and Mr Leahey are consultant to Cerro Resources NL. They have sufficient experience, which is relevant to the style of mineralisation and type of deposit under consideration and to the activity which they are undertaking to qualify as a Competent Person as defined in the 2004 edition of the “Australasian Code for Reporting of Exploration Results, Mineral Resources and Ore Reserves” and “qualified persons” as this term is defined in Canadian National Instrument 43-101 (“NI 43-101”). Mr Skeet, Mr Fleshman and Mr Leahey consent to the inclusion in the report of the matters based on their information in the form and context in which it appears. Neither TSX Venture Exchange nor its Regulation Services Provider (as that term is defined in the
policies of the TSX Venture Exchange) accepts responsibility for the adequacy or accuracy of this
release.
Forward-Looking Information
This quarterly report contains "forward-looking information" under Canadian securities law. Any statement that express or involve discussions with respect to predictions, expectations, beliefs, plans, projections, objectives, assumptions or future events or performance (often, but not always, using words such as "expect", "anticipate", "believe", "plans", "estimate", "scheduling", “projected” or variations thereof or stating that certain actions, events or results "may", "could", "would", "might" or "will" be taken, occur or be achieved, or the negative of any of these terms and similar expressions) are not statements of historical fact and may be forward-looking information. Forward-looking information relates to, among other things: the results of exploration programs, the interpretation of such results, the potential of the projects, the planned continuation of a drilling program, the accuracy of mineral resource and mineral reserve estimates, the ability of the Company to finance its operations and capital expenditures, future financial and operating performance including estimates of the Company's revenues and capital expenditures and estimated production. Forward-looking information is subject to a variety of known and unknown risks, uncertainties and other factors that could cause actual events or results to differ from those reflected in the forward-looking information, including, without limitation, risks relating to: fluctuating commodity prices; calculation of resources, reserves and mineralization and precious and base metal recovery; interpretations and assumptions of mineral resource and mineral reserve estimates; exploration and development programs; feasibility and engineering reports; permits and licences; title to properties; recent market events and conditions; economic factors affecting the Company; timing, estimated amount, capital and operating expenditures and economic returns of future production; operations and political conditions; environmental risks; and risks and hazards of mining operations. This list is not exhaustive of the factors that may affect any of the Company's forward-looking information. Although the Company has attempted to identify important factors that could cause actual results to differ materially, there may be other factors that cause results not to be as anticipated, estimated, described or intended. The Company's forward-looking information is based on the assumptions, beliefs, expectations and opinions of management as of the date of this quarterly report, and other than as required by applicable securities laws, the Company does not assume any obligation to update forward-looking statements and information if circumstances or management's assumptions, beliefs, expectations or opinions should change, or changes occur in any other events affecting such statements or information. For the reasons set forth above, investors should not place undue reliance on forward-looking information.
For
per
sona
l use
onl
y
Appendix 5B Mining exploration entity quarterly report
+ See chapter 19 for defined terms. 30/9/2001 Appendix 5B Page 1
Rule 5.3
Appendix 5B
Mining exploration entity quarterly report Introduced 1/7/96. Origin: Appendix 8. Amended 1/7/97, 1/7/98, 30/9/2001, 01/06/10.
Name of entity
CERRO RESOURCES NL
ABN Quarter ended (“current quarter”)
72 006 381 684 30 SEPTEMBER 2011
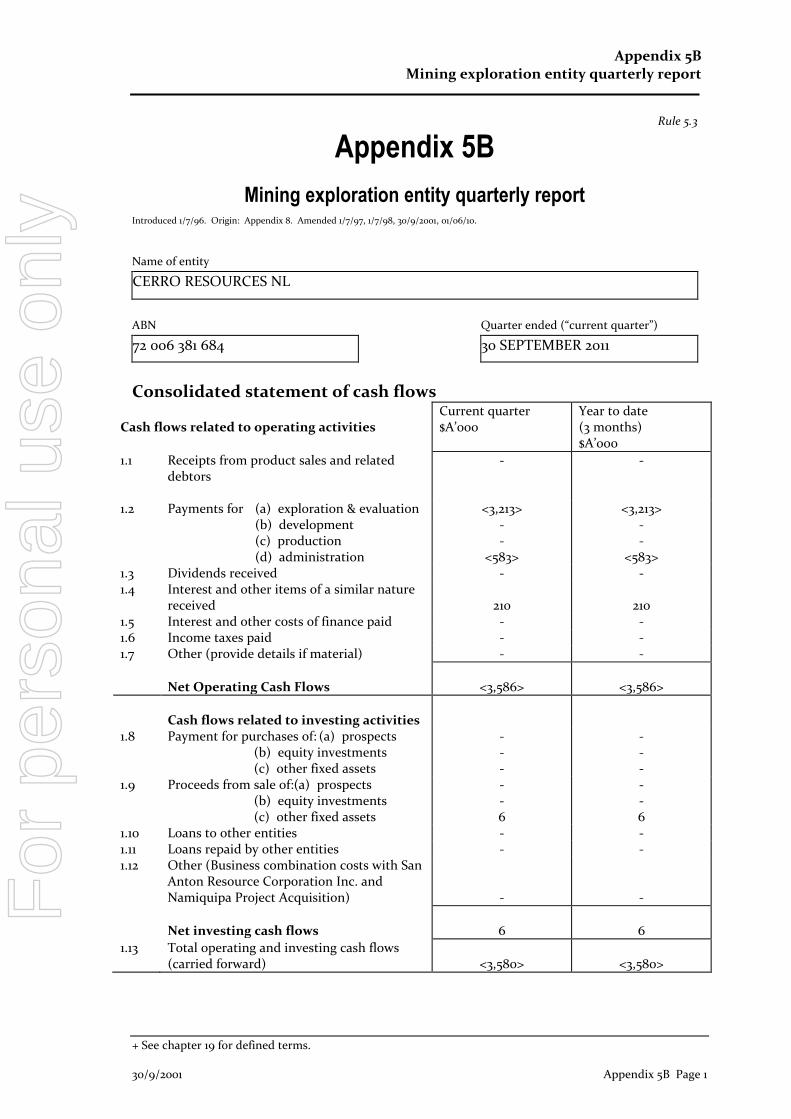
Consolidated statement of cash flows
Cash flows related to operating activities
Current quarter $A’000
Year to date (3 months) $A’000
1.1 Receipts from product sales and related debtors
- -
1.2 Payments for (a) exploration & evaluation (b) development (c) production (d) administration
<3,213> - -
<583>
<3,213> - -
<583> 1.3 Dividends received - - 1.4 Interest and other items of a similar nature
received
210
210 1.5 Interest and other costs of finance paid - - 1.6 Income taxes paid - - 1.7 Other (provide details if material) - -
Net Operating Cash Flows
<3,586>
<3,586>
Cash flows related to investing activities
1.8 Payment for purchases of: (a) prospects (b) equity investments (c) other fixed assets
- - -
- - -
1.9 Proceeds from sale of:(a) prospects (b) equity investments (c) other fixed assets
- - 6
- - 6
1.10 Loans to other entities - - 1.11 Loans repaid by other entities - - 1.12 Other (Business combination costs with San
Anton Resource Corporation Inc. and Namiquipa Project Acquisition)
-
-
Net investing cash flows
6
6
1.13 Total operating and investing cash flows (carried forward)
<3,580>
<3,580>
For
per
sona
l use
onl
y
Appendix 5B Mining exploration entity quarterly report
+ See chapter 19 for defined terms. Appendix 5B Page 2 30/9/2001
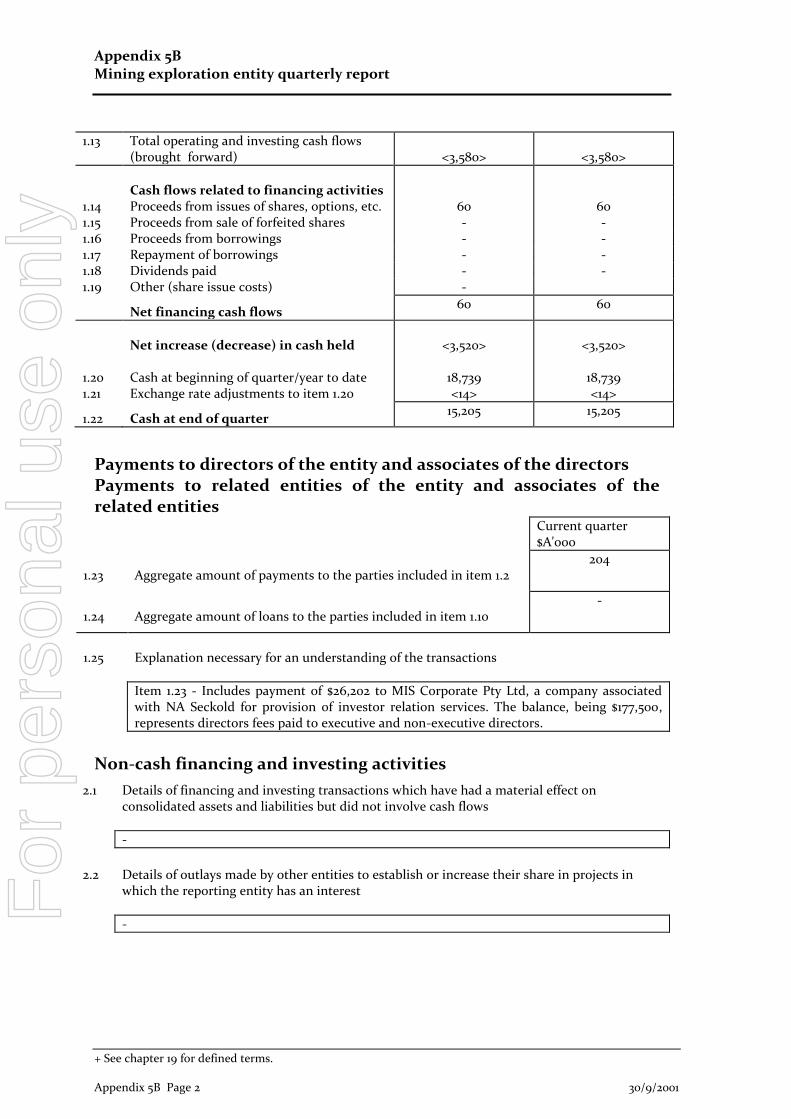
1.13 Total operating and investing cash flows
(brought forward)
<3,580>
<3,580>
Cash flows related to financing activities
1.14 Proceeds from issues of shares, options, etc. 60 60 1.15 Proceeds from sale of forfeited shares - - 1.16 Proceeds from borrowings - - 1.17 Repayment of borrowings - - 1.18 Dividends paid - - 1.19 Other (share issue costs) -
Net financing cash flows
60 60
Net increase (decrease) in cash held
<3,520>
<3,520>
1.20 Cash at beginning of quarter/year to date 18,739 18,739 1.21 Exchange rate adjustments to item 1.20 <14> <14>
1.22 Cash at end of quarter 15,205 15,205
Payments to directors of the entity and associates of the directors Payments to related entities of the entity and associates of the related entities
Current quarter $A'000
1.23
Aggregate amount of payments to the parties included in item 1.2
204
1.24
Aggregate amount of loans to the parties included in item 1.10
-
1.25
Explanation necessary for an understanding of the transactions
Item 1.23 - Includes payment of $26,202 to MIS Corporate Pty Ltd, a company associated with NA Seckold for provision of investor relation services. The balance, being $177,500, represents directors fees paid to executive and non-executive directors.
Non-cash financing and investing activities
2.1 Details of financing and investing transactions which have had a material effect on consolidated assets and liabilities but did not involve cash flows
-
2.2 Details of outlays made by other entities to establish or increase their share in projects in
which the reporting entity has an interest
-
For
per
sona
l use
onl
y
Appendix 5B Mining exploration entity quarterly report
+ See chapter 19 for defined terms. 30/9/2001 Appendix 5B Page 3
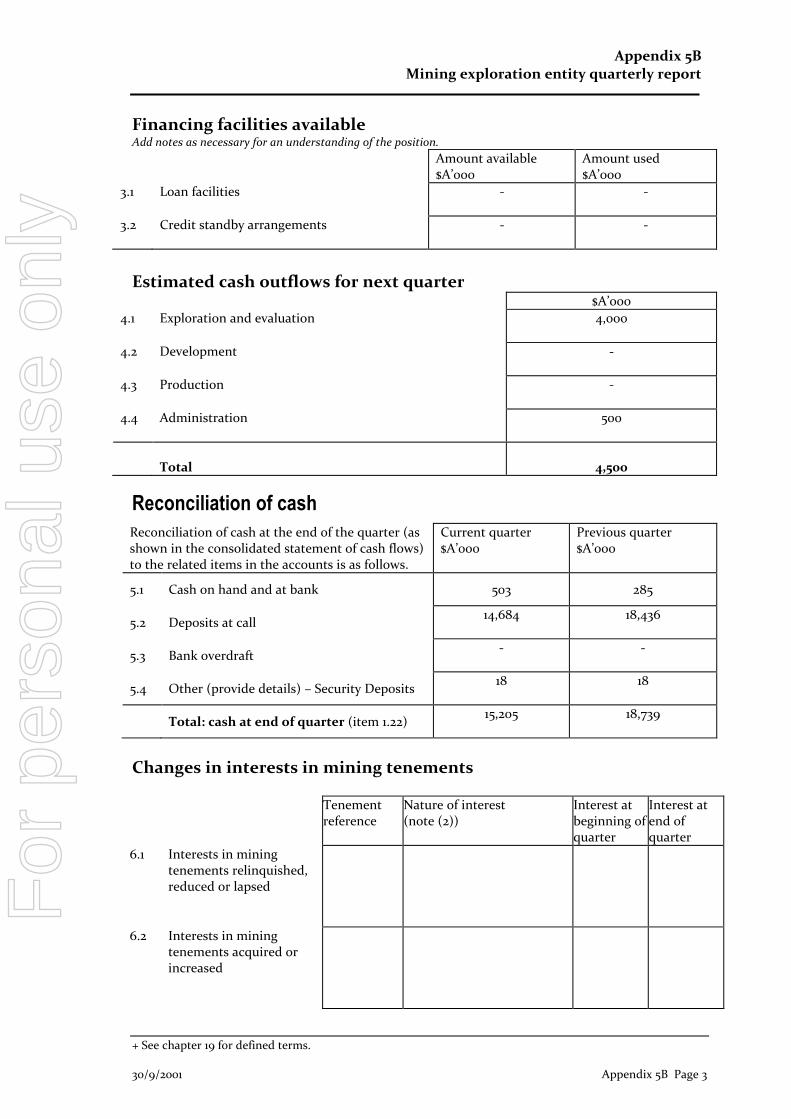
Financing facilities available Add notes as necessary for an understanding of the position.
Amount available $A’000
Amount used $A’000
3.1 Loan facilities
- -
3.2 Credit standby arrangements
- -
Estimated cash outflows for next quarter
$A’000
4.1 Exploration and evaluation
4,000
4.2 Development
-
4.3 Production
-
4.4 Administration
500
Total
4,500
Reconciliation of cash
Reconciliation of cash at the end of the quarter (as shown in the consolidated statement of cash flows) to the related items in the accounts is as follows.
Current quarter $A’000
Previous quarter $A’000
5.1 Cash on hand and at bank 503 285
5.2 Deposits at call 14,684 18,436
5.3 Bank overdraft - -
5.4 Other (provide details) – Security Deposits 18 18
Total: cash at end of quarter (item 1.22)
15,205 18,739
Changes in interests in mining tenements Tenement
reference Nature of interest (note (2))
Interest at beginning of quarter
Interest at end of quarter
6.1 Interests in mining tenements relinquished, reduced or lapsed
6.2 Interests in mining tenements acquired or increased
For
per
sona
l use
onl
y
Appendix 5B Mining exploration entity quarterly report
+ See chapter 19 for defined terms. Appendix 5B Page 4 30/9/2001
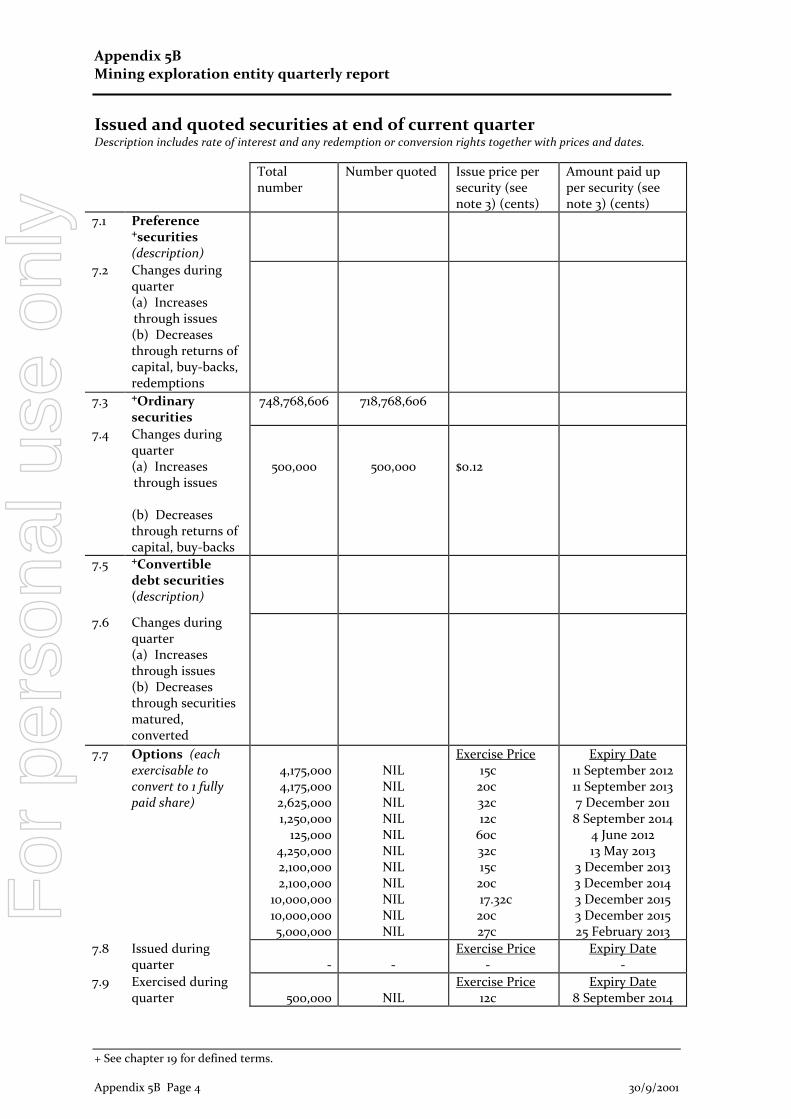
Issued and quoted securities at end of current quarter Description includes rate of interest and any redemption or conversion rights together with prices and dates.
Total number
Number quoted Issue price per security (see note 3) (cents)
Amount paid up per security (see note 3) (cents)
7.1 Preference +securities (description)
7.2 Changes during quarter (a) Increases through issues (b) Decreases through returns of capital, buy-backs, redemptions
7.3 +Ordinary securities
748,768,606 718,768,606
7.4 Changes during quarter (a) Increases through issues (b) Decreases through returns of capital, buy-backs
500,000
500,000
$0.12
7.5 +Convertible debt securities (description)
7.6 Changes during quarter (a) Increases through issues (b) Decreases through securities matured, converted
7.7 Options (each exercisable to convert to 1 fully paid share)
4,175,000 4,175,000 2,625,000 1,250,000
125,000 4,250,000 2,100,000 2,100,000
10,000,000 10,000,000 5,000,000
NIL NIL NIL NIL NIL NIL NIL NIL NIL NIL NIL
Exercise Price 15c 20c 32c 12c
60c 32c 15c 20c 17.32c 20c 27c
Expiry Date 11 September 2012 11 September 2013 7 December 2011 8 September 2014
4 June 2012 13 May 2013
3 December 2013 3 December 2014 3 December 2015 3 December 2015 25 February 2013
7.8 Issued during quarter
-
-
Exercise Price -
Expiry Date -
7.9 Exercised during quarter
500,000
NIL
Exercise Price 12c
Expiry Date 8 September 2014
For
per
sona
l use
onl
y
Appendix 5B Mining exploration entity quarterly report
+ See chapter 19 for defined terms. 30/9/2001 Appendix 5B Page 5
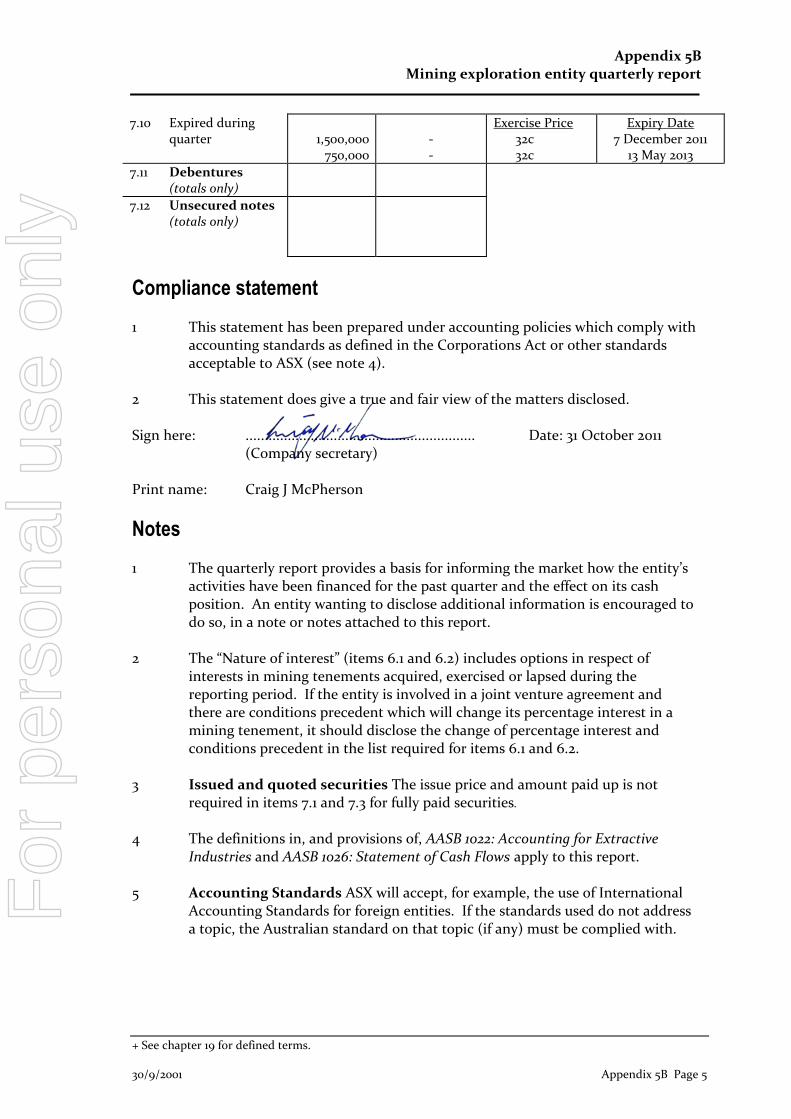
7.10 Expired during quarter
1,500,000
750,000
- -
Exercise Price 32c 32c
Expiry Date 7 December 2011
13 May 2013
7.11 Debentures (totals only)
7.12 Unsecured notes (totals only)
Compliance statement 1 This statement has been prepared under accounting policies which comply with
accounting standards as defined in the Corporations Act or other standards acceptable to ASX (see note 4).
2 This statement does give a true and fair view of the matters disclosed.
Sign here: ............................................................ Date: 31 October 2011
(Company secretary) Print name: Craig J McPherson
Notes 1 The quarterly report provides a basis for informing the market how the entity’s
activities have been financed for the past quarter and the effect on its cash position. An entity wanting to disclose additional information is encouraged to do so, in a note or notes attached to this report.
2 The “Nature of interest” (items 6.1 and 6.2) includes options in respect of
interests in mining tenements acquired, exercised or lapsed during the reporting period. If the entity is involved in a joint venture agreement and there are conditions precedent which will change its percentage interest in a mining tenement, it should disclose the change of percentage interest and conditions precedent in the list required for items 6.1 and 6.2.
3 Issued and quoted securities The issue price and amount paid up is not
required in items 7.1 and 7.3 for fully paid securities.
4 The definitions in, and provisions of, AASB 1022: Accounting for Extractive
Industries and AASB 1026: Statement of Cash Flows apply to this report. 5 Accounting Standards ASX will accept, for example, the use of International
Accounting Standards for foreign entities. If the standards used do not address a topic, the Australian standard on that topic (if any) must be complied with.
For
per
sona
l use
onl
y