Re-inventing Digital Advice ($ecure)
47
Robo-Advice and Beyond Behavioral Simulation Applied to Enhancing Decision Making December 2015
Transcript of Re-inventing Digital Advice ($ecure)
Robo-Advice and Beyond
Behavioral Simulation Applied to Enhancing Decision Making
December 2015

PwC
Agenda
2
• Our Perspective
• Background on Robo-Advice
• Overview of $ecureTM
• Value Proposition For Stakeholders
• Appendices
PwC
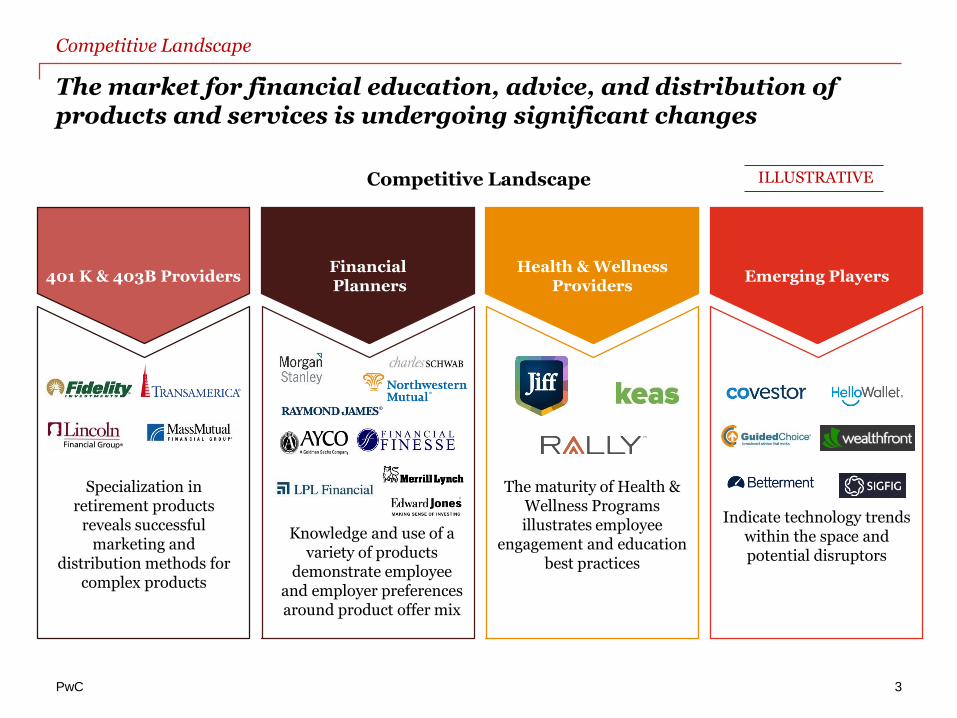
The market for financial education, advice, and distribution of products and services is undergoing significant changes
Competitive Landscape
401 K & 403B Providers
Specialization in retirement products
reveals successful marketing and
distribution methods for complex products
The maturity of Health & Wellness Programs illustrates employee
engagement and education best practices
Health & Wellness Providers
Indicate technology trends within the space and potential disruptors
Emerging Players
Knowledge and use of a variety of products
demonstrate employee and employer preferences around product offer mix
FinancialPlanners
ILLUSTRATIVE
3
Competitive Landscape
PwC
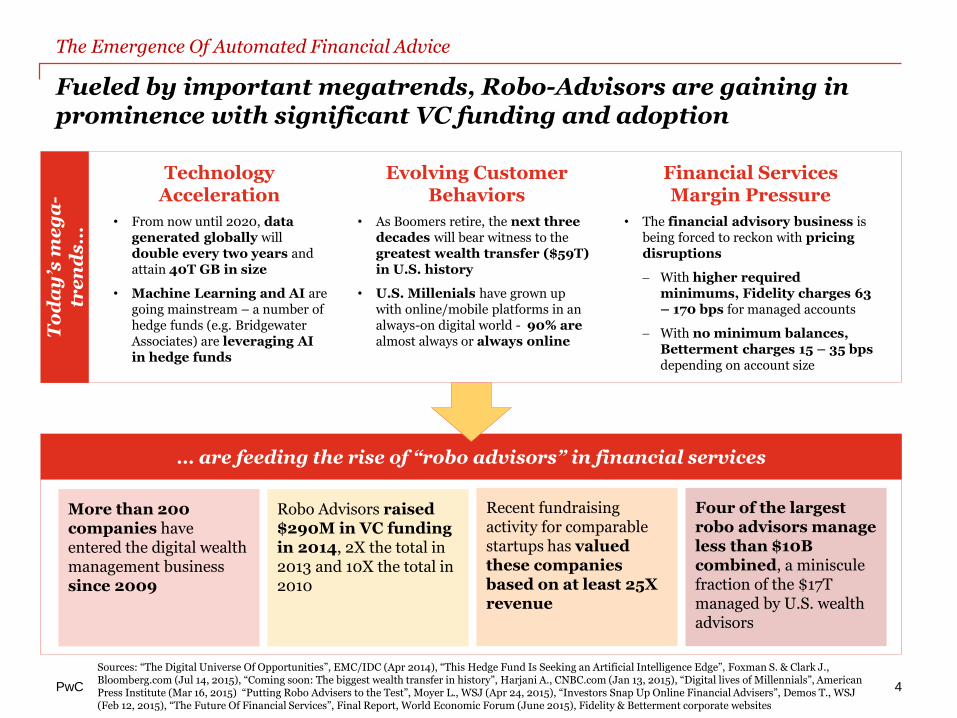
Fueled by important megatrends, Robo-Advisors are gaining in prominence with significant VC funding and adoption
4
The Emergence Of Automated Financial Advice
… are feeding the rise of “robo advisors” in financial services
To
da
y’s
me
ga
-tr
en
ds
… • From now until 2020, data
generated globally will double every two years and attain 40T GB in size
• Machine Learning and AI are going mainstream – a number of hedge funds (e.g. Bridgewater Associates) are leveraging AI in hedge funds
• As Boomers retire, the next three decades will bear witness to the greatest wealth transfer ($59T) in U.S. history
• U.S. Millenials have grown up with online/mobile platforms in an always-on digital world - 90% arealmost always or always online
• The financial advisory business is being forced to reckon with pricing disruptions
With higher required minimums, Fidelity charges 63 – 170 bps for managed accounts
With no minimum balances, Betterment charges 15 – 35 bps depending on account size
Technology Acceleration
Evolving Customer Behaviors
Financial Services Margin Pressure
More than 200 companies have entered the digital wealth management business since 2009
Robo Advisors raised $290M in VC funding in 2014, 2X the total in 2013 and 10X the total in 2010
Recent fundraising activity for comparable startups has valued these companies based on at least 25X revenue
Four of the largest robo advisors manage less than $10B combined, a miniscule fraction of the $17T managed by U.S. wealth advisors
Sources: “The Digital Universe Of Opportunities”, EMC/IDC (Apr 2014), “This Hedge Fund Is Seeking an Artificial Intelligence Edge”, Foxman S. & Clark J., Bloomberg.com (Jul 14, 2015), “Coming soon: The biggest wealth transfer in history”, Harjani A., CNBC.com (Jan 13, 2015), “Digital lives of Millennials”, American Press Institute (Mar 16, 2015) “Putting Robo Advisers to the Test”, Moyer L., WSJ (Apr 24, 2015), “Investors Snap Up Online Financial Advisers”, Demos T., WSJ (Feb 12, 2015), “The Future Of Financial Services”, Final Report, World Economic Forum (June 2015), Fidelity & Betterment corporate websites
PwC
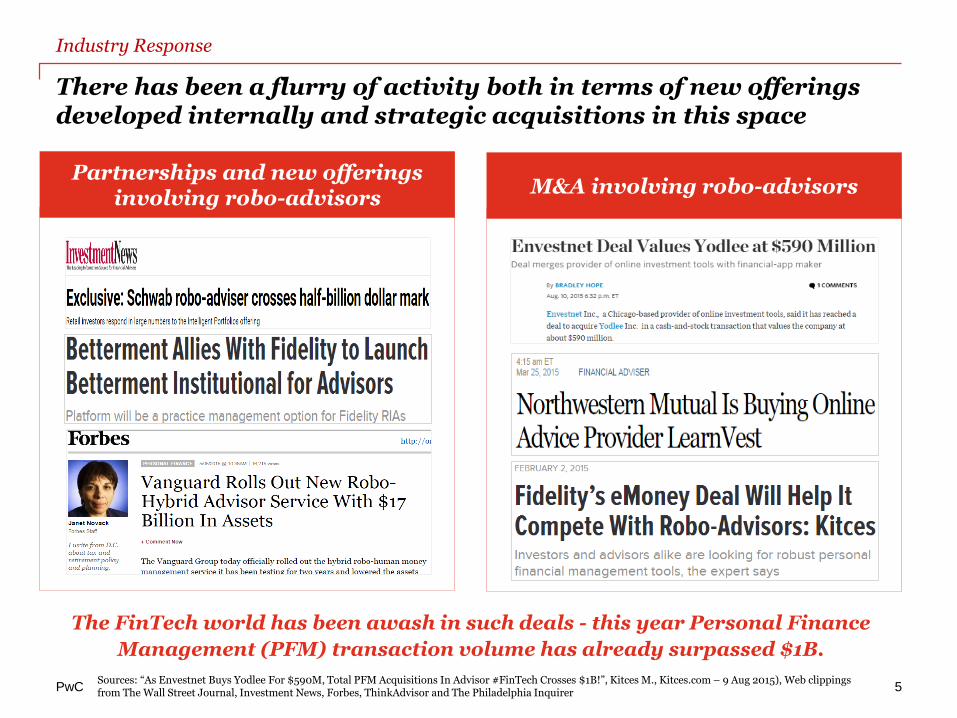
There has been a flurry of activity both in terms of new offerings developed internally and strategic acquisitions in this space
5
Industry Response
The FinTech world has been awash in such deals - this year Personal Finance
Management (PFM) transaction volume has already surpassed $1B.
Partnerships and new offerings involving robo-advisors
M&A involving robo-advisors
Sources: “As Envestnet Buys Yodlee For $590M, Total PFM Acquisitions In Advisor #FinTech Crosses $1B!”, Kitces M., Kitces.com – 9 Aug 2015), Web clippings from The Wall Street Journal, Investment News, Forbes, ThinkAdvisor and The Philadelphia Inquirer
PwC
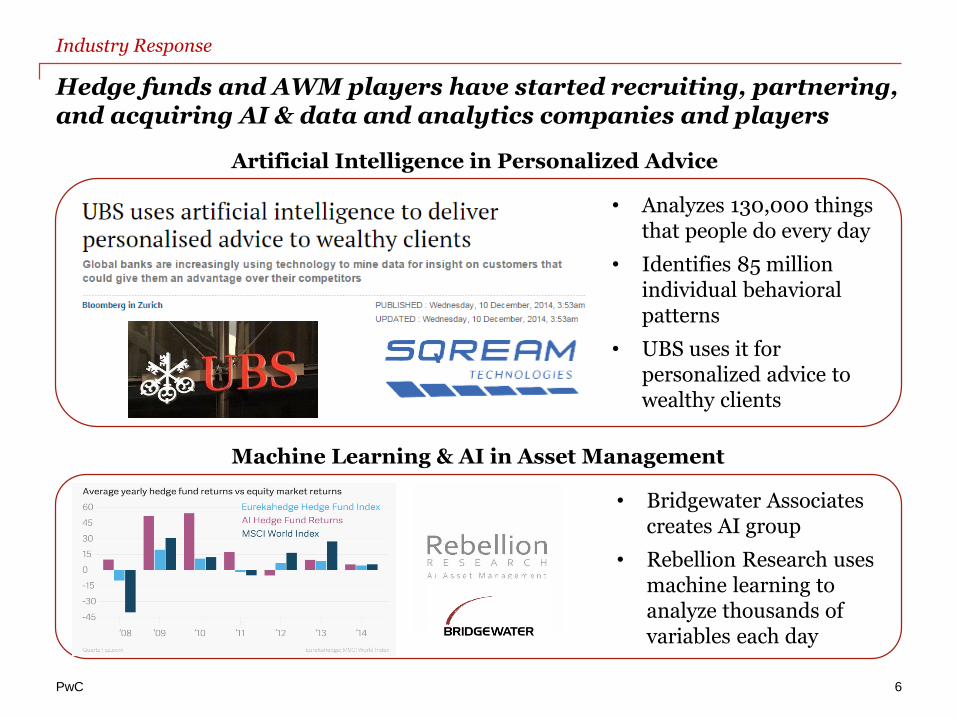
Hedge funds and AWM players have started recruiting, partnering, and acquiring AI & data and analytics companies and players
6
Industry Response
• Analyzes 130,000 things that people do every day
• Identifies 85 million individual behavioral patterns
• UBS uses it for personalized advice to wealthy clients
Artificial Intelligence in Personalized Advice
• Bridgewater Associates creates AI group
• Rebellion Research uses machine learning to analyze thousands of variables each day
Machine Learning & AI in Asset Management
PwC 7
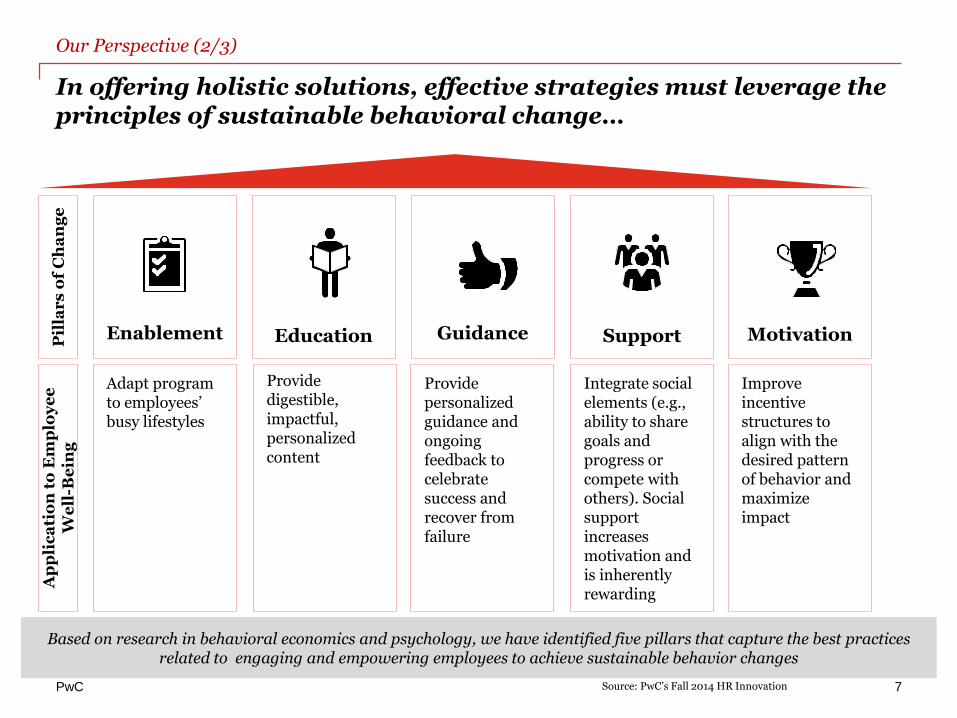
Enablement Education Guidance Support Motivation
Adapt program to employees’ busy lifestyles
Provide digestible, impactful, personalized content
Provide personalized guidance and ongoing feedback to celebrate success and recover from failure
Integrate social elements (e.g., ability to share goals and progress or compete with others). Social support increases motivation and is inherently rewarding
Improve incentive structures to align with the desired pattern of behavior and maximize impact
Pil
lar
s o
f C
ha
ng
eA
pp
lic
ati
on
to
Em
plo
ye
e
We
ll-B
ein
g
In offering holistic solutions, effective strategies must leverage the principles of sustainable behavioral change…
Based on research in behavioral economics and psychology, we have identified five pillars that capture the best practices related to engaging and empowering employees to achieve sustainable behavior changes
Source: PwC’s Fall 2014 HR Innovation
Our Perspective (2/3)
PwC 8
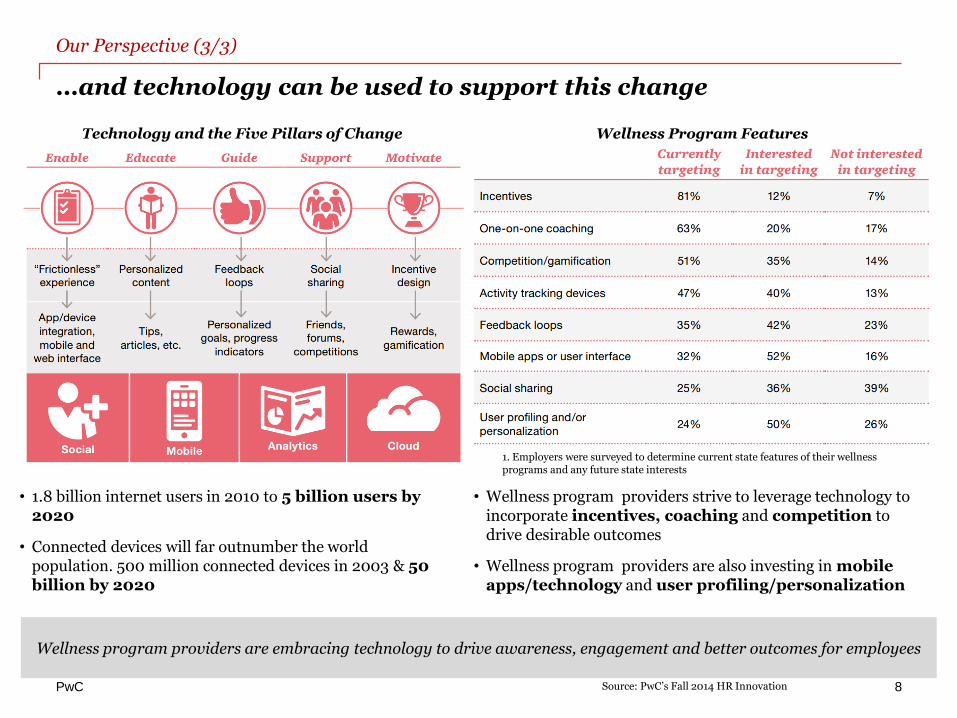
• 1.8 billion internet users in 2010 to 5 billion users by 2020
• Connected devices will far outnumber the world population. 500 million connected devices in 2003 & 50 billion by 2020
• Wellness program providers strive to leverage technology to incorporate incentives, coaching and competition to drive desirable outcomes
• Wellness program providers are also investing in mobile apps/technology and user profiling/personalization
…and technology can be used to support this change
Wellness program providers are embracing technology to drive awareness, engagement and better outcomes for employees
Source: PwC’s Fall 2014 HR Innovation
1. Employers were surveyed to determine current state features of their wellness programs and any future state interests
Technology and the Five Pillars of Change Wellness Program Features
Our Perspective (3/3)
PwC
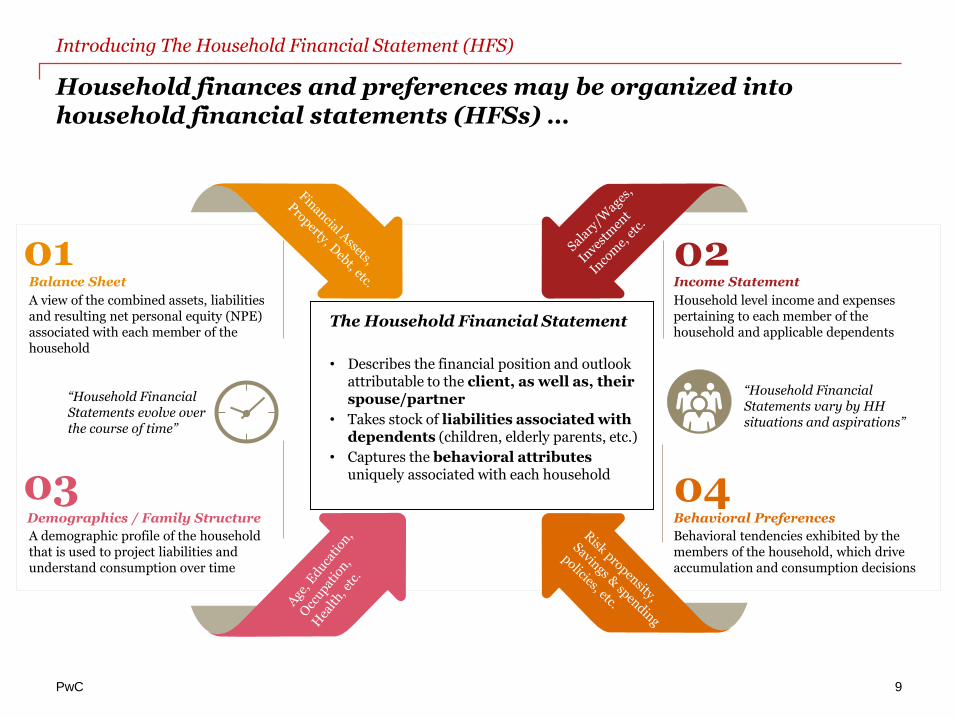
Household finances and preferences may be organized into household financial statements (HFSs) …
9
02Income Statement
Household level income and expenses pertaining to each member of the household and applicable dependents
04Behavioral Preferences
Behavioral tendencies exhibited by the members of the household, which drive accumulation and consumption decisions
The Household Financial Statement
• Describes the financial position and outlook attributable to the client, as well as, their spouse/partner
• Takes stock of liabilities associated with dependents (children, elderly parents, etc.)
• Captures the behavioral attributes uniquely associated with each household
Balance Sheet
A view of the combined assets, liabilities and resulting net personal equity (NPE) associated with each member of the household
03Demographics / Family Structure
A demographic profile of the household that is used to project liabilities and understand consumption over time
01
“Household Financial Statements evolve over the course of time”
“Household Financial Statements vary by HH situations and aspirations”
Introducing The Household Financial Statement (HFS)
PwC
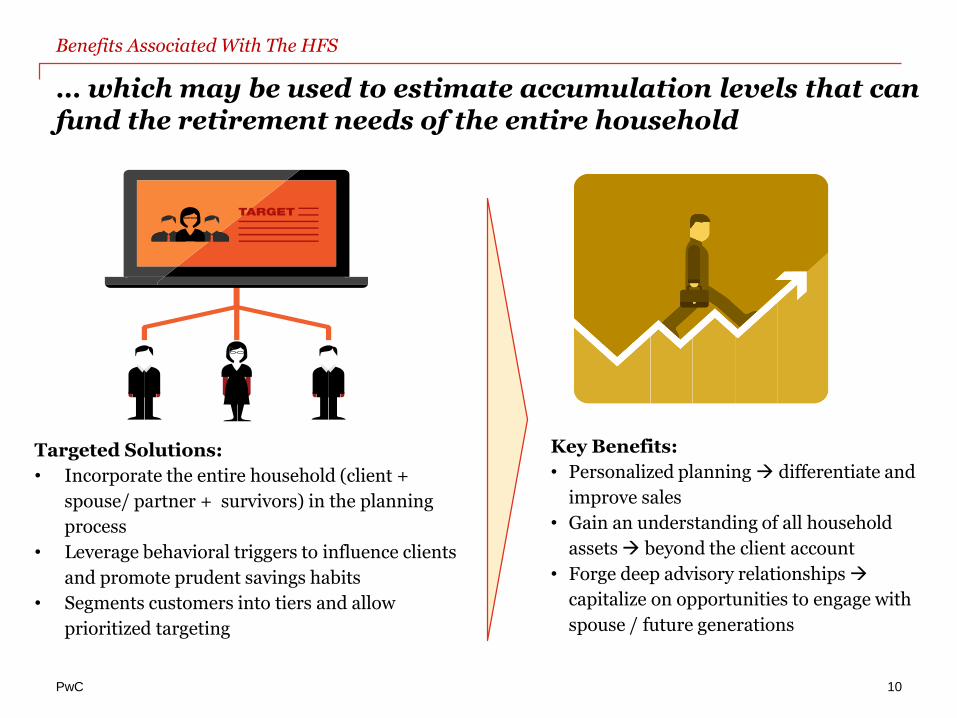
… which may be used to estimate accumulation levels that can fund the retirement needs of the entire household
10
Benefits Associated With The HFS
Targeted Solutions:
• Incorporate the entire household (client +
spouse/ partner + survivors) in the planning
process
• Leverage behavioral triggers to influence clients
and promote prudent savings habits
• Segments customers into tiers and allow
prioritized targeting
Key Benefits:
• Personalized planning differentiate and
improve sales
• Gain an understanding of all household
assets beyond the client account
• Forge deep advisory relationships
capitalize on opportunities to engage with
spouse / future generations
PwC
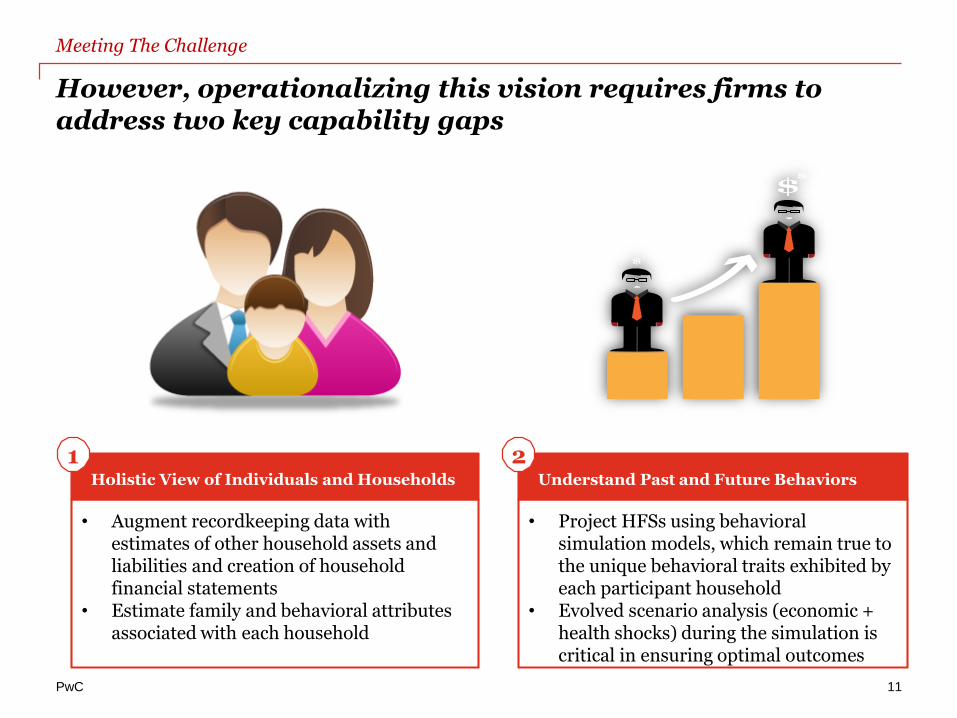
However, operationalizing this vision requires firms to address two key capability gaps
11
Meeting The Challenge
• Augment recordkeeping data with estimates of other household assets and liabilities and creation of household financial statements
• Estimate family and behavioral attributes associated with each household
Holistic View of Individuals and Households
• Project HFSs using behavioral simulation models, which remain true to the unique behavioral traits exhibited by each participant household
• Evolved scenario analysis (economic + health shocks) during the simulation is critical in ensuring optimal outcomes
Understand Past and Future Behaviors
1 2
PwC
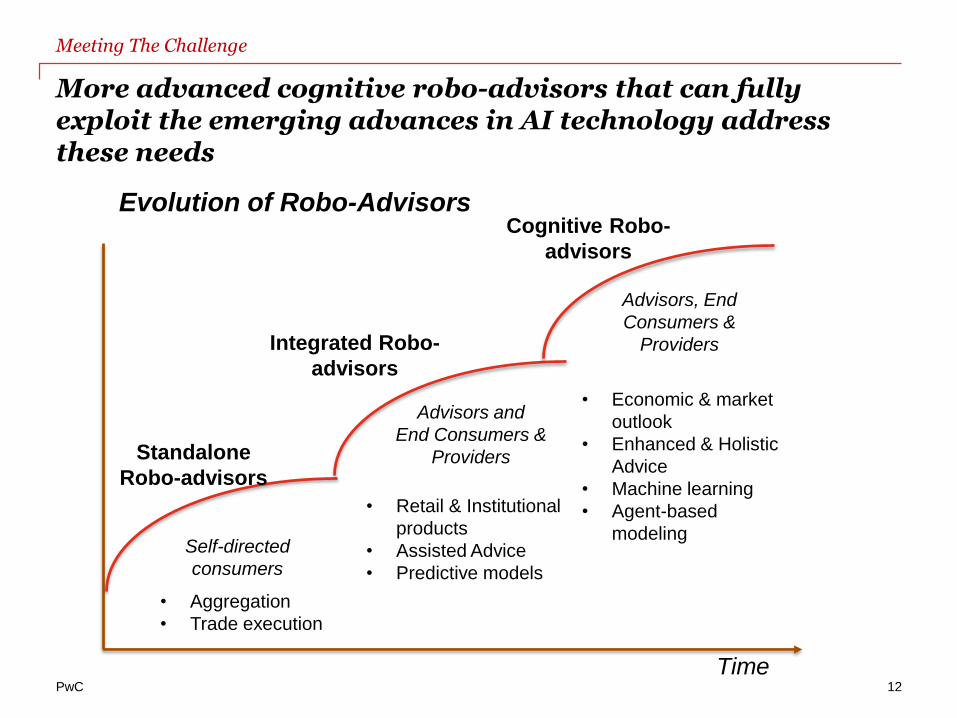
More advanced cognitive robo-advisors that can fully exploit the emerging advances in AI technology address these needs
12
Meeting The Challenge
Evolution of Robo-Advisors
Standalone
Robo-advisors
Self-directed
consumers
• Aggregation
• Trade execution
Integrated Robo-
advisors
Advisors and
End Consumers &
Providers
• Retail & Institutional
products
• Assisted Advice
• Predictive models
Cognitive Robo-
advisors
Time
Advisors, End
Consumers &
Providers
• Economic & market
outlook
• Enhanced & Holistic
Advice
• Machine learning
• Agent-based
modeling
PwC
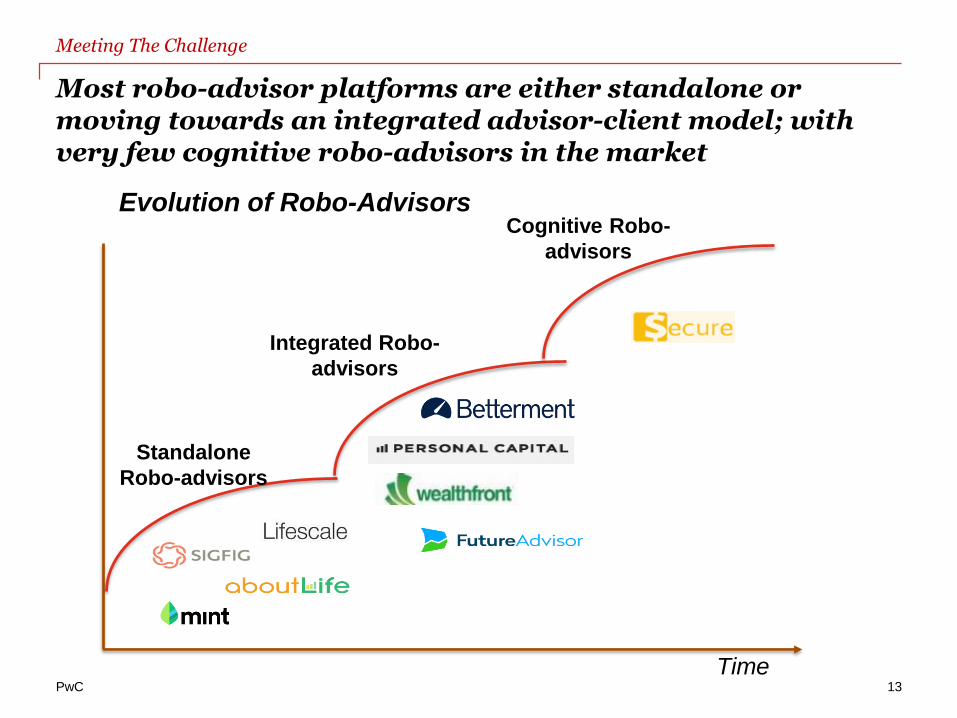
Most robo-advisor platforms are either standalone or moving towards an integrated advisor-client model; with very few cognitive robo-advisors in the market
13
Meeting The Challenge
Evolution of Robo-Advisors
Standalone
Robo-advisors
Integrated Robo-
advisors
Cognitive Robo-
advisors
Time
PwC
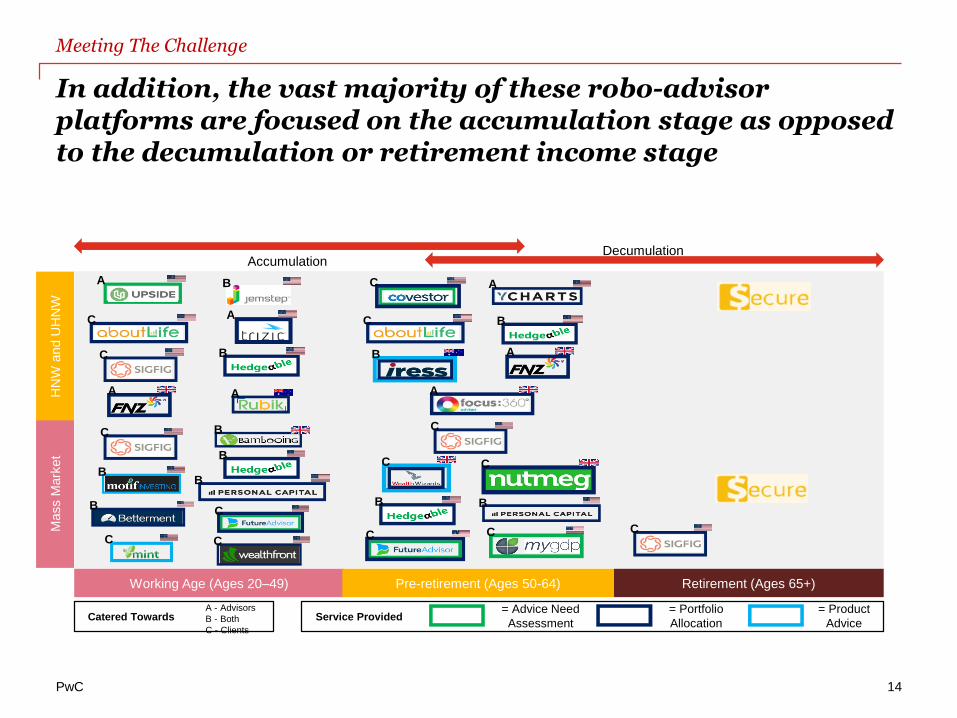
In addition, the vast majority of these robo-advisor platforms are focused on the accumulation stage as opposed to the decumulation or retirement income stage
14
Meeting The Challenge
Working Age (Ages 20–49) Retirement (Ages 65+)
Mass M
ark
et
Pre-retirement (Ages 50-64)
HN
W a
nd U
HN
W
= Advice Need
Assessment
= Product
Advice
= Portfolio
AllocationService ProvidedCatered Towards
A - Advisors
B - Both
C - Clients
Accumulation Decumulation
A B
C
C A
A
B
C
BB
B C
CCC
C
C
B
C
B
B
B
B A
A A
B
A
C C
C
C
PwC
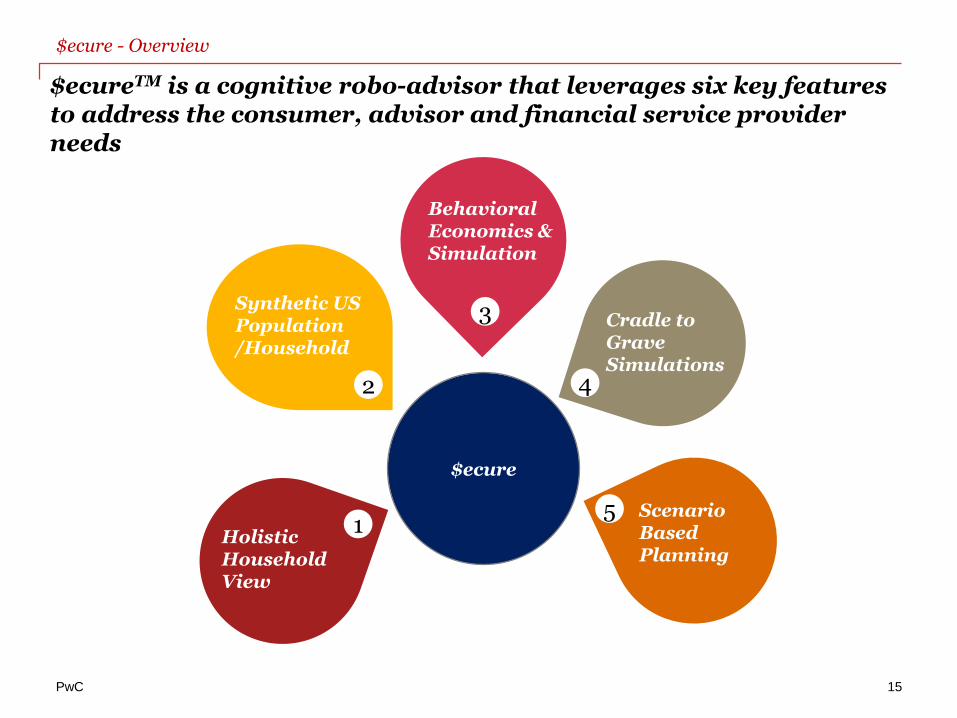
$ecureTM is a cognitive robo-advisor that leverages six key features to address the consumer, advisor and financial service provider needs
15
2
Synthetic US Population /Household
Cradle to Grave Simulations
Scenario Based Planning
BehavioralEconomics & Simulation
Holistic Household View
1
3
4
5
$ecure
$ecure - Overview
PwC
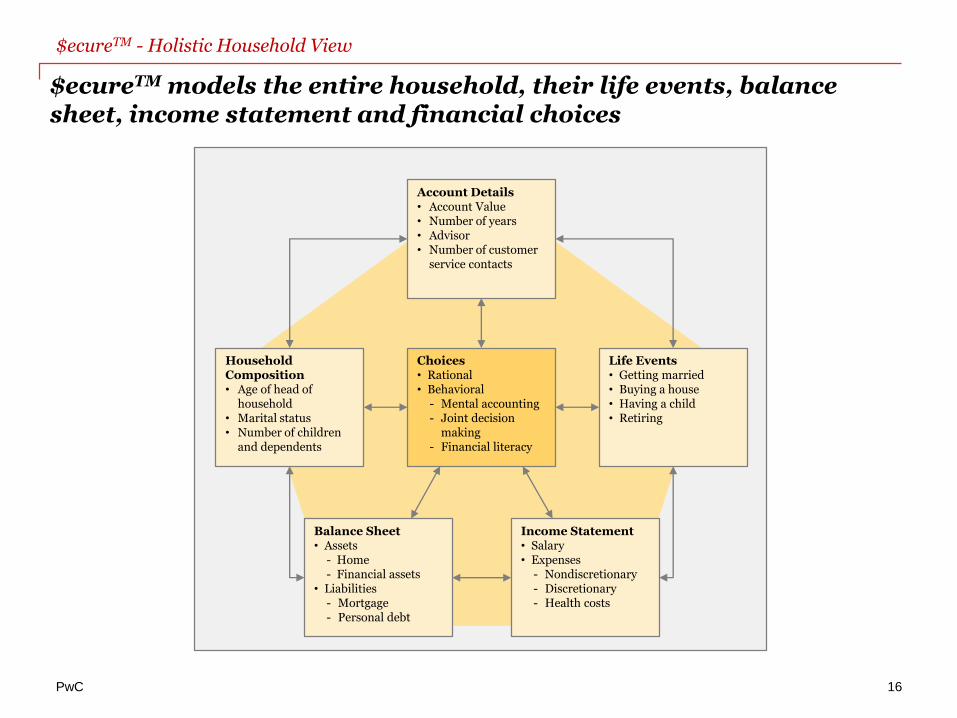
$ecureTM models the entire household, their life events, balance sheet, income statement and financial choices
16
$ecureTM - Holistic Household View
Account Details• Account Value• Number of years• Advisor• Number of customer
service contacts
Life Events• Getting married• Buying a house• Having a child• Retiring
Balance Sheet• Assets
- Home- Financial assets
• Liabilities- Mortgage- Personal debt
Choices• Rational• Behavioral
- Mental accounting- Joint decision
making- Financial literacy
Household Composition• Age of head of
household• Marital status• Number of children
and dependents
Income Statement• Salary• Expenses
- Nondiscretionary- Discretionary - Health costs
PwC
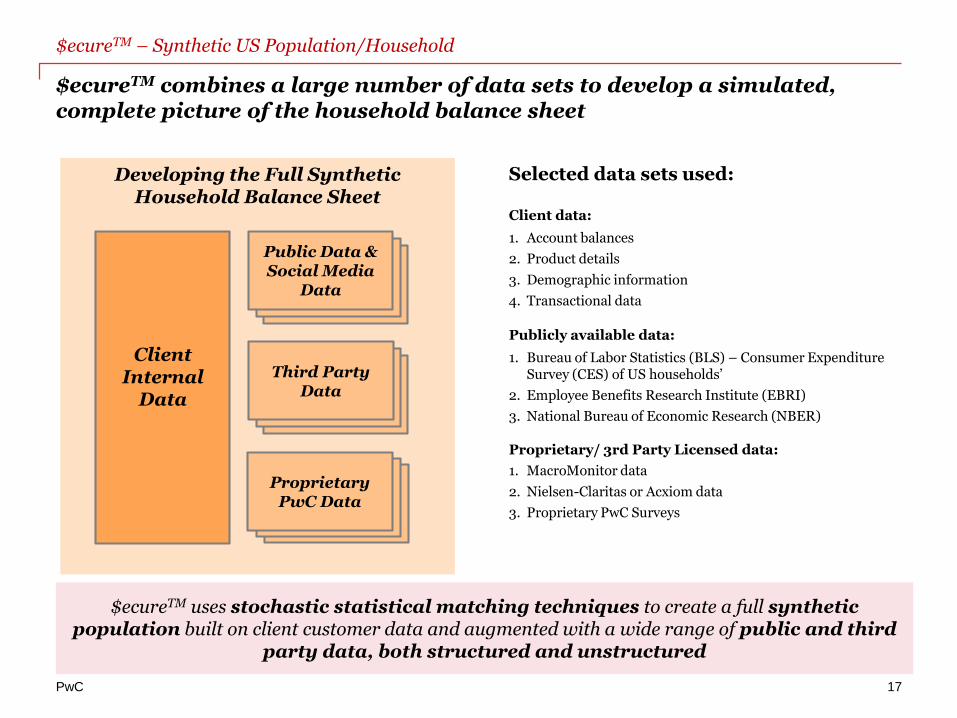
$ecureTM combines a large number of data sets to develop a simulated, complete picture of the household balance sheet
17
$ecureTM – Synthetic US Population/Household
Developing the Full Synthetic Household Balance Sheet
Client Internal
Data
$ecureTM uses stochastic statistical matching techniques to create a full synthetic population built on client customer data and augmented with a wide range of public and third
party data, both structured and unstructured
Additional Third Party
Data
Additional Third Party
Data
Third Party Data
Additional Third Party
Data
Additional Third Party
Data
Public Data & Social Media
Data
Additional Third Party
Data
Additional Third Party
Data
Proprietary PwC Data
Selected data sets used:
Client data:
1. Account balances
2. Product details
3. Demographic information
4. Transactional data
Publicly available data:
1. Bureau of Labor Statistics (BLS) – Consumer Expenditure Survey (CES) of US households’
2. Employee Benefits Research Institute (EBRI)
3. National Bureau of Economic Research (NBER)
Proprietary/ 3rd Party Licensed data:
1. MacroMonitor data
2. Nielsen-Claritas or Acxiom data
3. Proprietary PwC Surveys
PwC
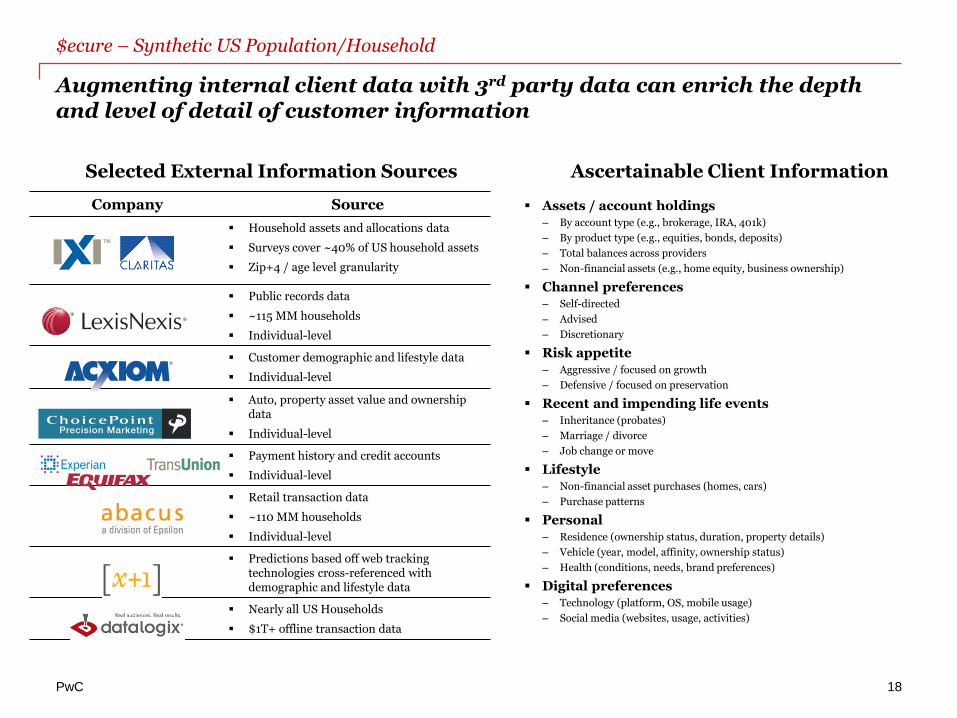
Augmenting internal client data with 3rd party data can enrich the depth and level of detail of customer information
18
Selected External Information Sources Ascertainable Client Information
Assets / account holdings– By account type (e.g., brokerage, IRA, 401k)
– By product type (e.g., equities, bonds, deposits)
– Total balances across providers
– Non-financial assets (e.g., home equity, business ownership)
Channel preferences– Self-directed
– Advised
– Discretionary
Risk appetite– Aggressive / focused on growth
– Defensive / focused on preservation
Recent and impending life events– Inheritance (probates)
– Marriage / divorce
– Job change or move
Lifestyle– Non-financial asset purchases (homes, cars)
– Purchase patterns
Personal– Residence (ownership status, duration, property details)
– Vehicle (year, model, affinity, ownership status)
– Health (conditions, needs, brand preferences)
Digital preferences– Technology (platform, OS, mobile usage)
– Social media (websites, usage, activities)
Company Source
Household assets and allocations data
Surveys cover ~40% of US household assets
Zip+4 / age level granularity
Public records data
~115 MM households
Individual-level
Customer demographic and lifestyle data
Individual-level
Auto, property asset value and ownership data
Individual-level
Payment history and credit accounts
Individual-level
Retail transaction data
~110 MM households
Individual-level
Predictions based off web tracking technologies cross-referenced with demographic and lifestyle data
Nearly all US Households
$1T+ offline transaction data
$ecure – Synthetic US Population/Household
PwC
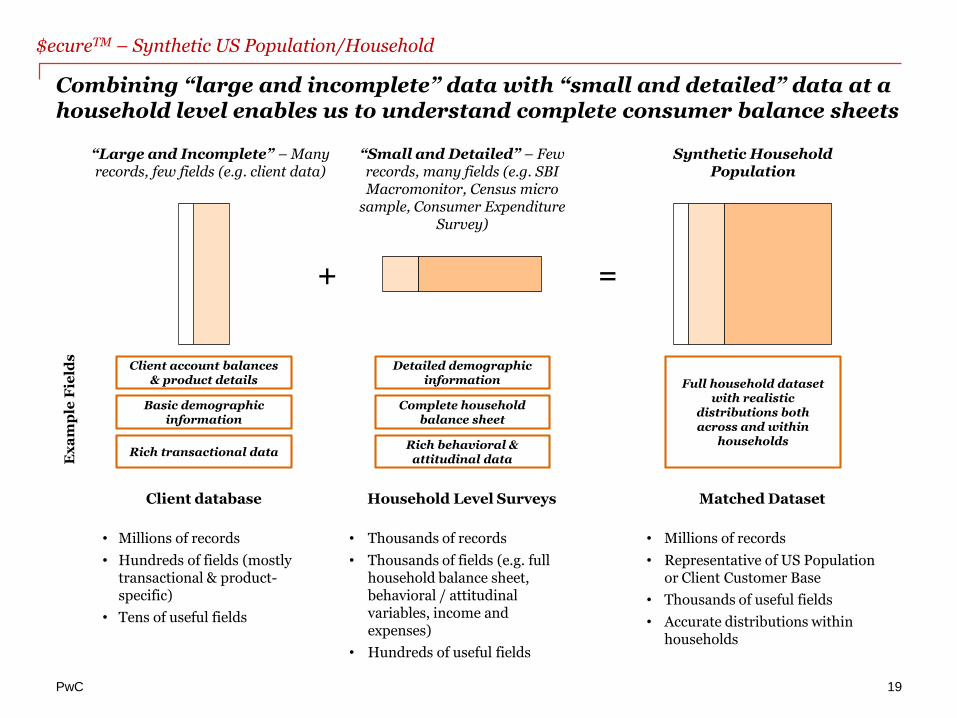
Combining “large and incomplete” data with “small and detailed” data at a household level enables us to understand complete consumer balance sheets
19
+ =
Client database
• Millions of records
• Hundreds of fields (mostly transactional & product-specific)
• Tens of useful fields
Household Level Surveys
• Thousands of records
• Thousands of fields (e.g. full household balance sheet, behavioral / attitudinal variables, income and expenses)
• Hundreds of useful fields
“Large and Incomplete” – Many records, few fields (e.g. client data)
“Small and Detailed” – Few records, many fields (e.g. SBI Macromonitor, Census micro
sample, Consumer Expenditure Survey)
Matched Dataset
• Millions of records
• Representative of US Population or Client Customer Base
• Thousands of useful fields
• Accurate distributions within households
Synthetic Household Population
Ex
am
ple
Fie
lds
Client account balances & product details
Basic demographic information
Rich transactional data
Detailed demographic information
Complete household balance sheet
Rich behavioral & attitudinal data
Full household dataset with realistic
distributions both across and within
households
$ecureTM – Synthetic US Population/Household
PwC
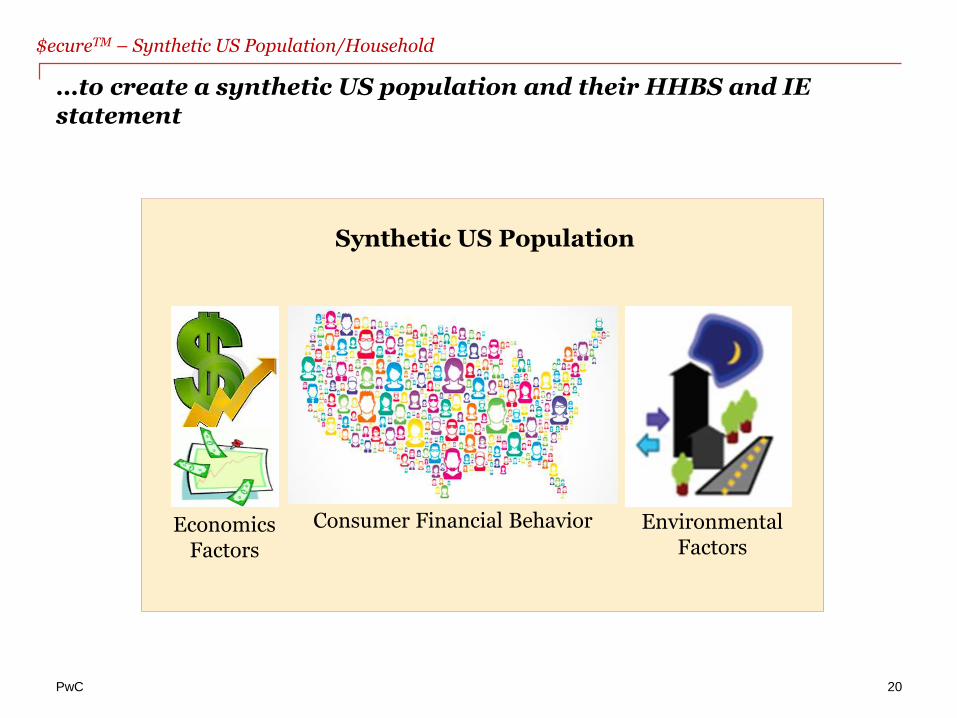
…to create a synthetic US population and their HHBS and IE statement
20
Environmental Factors
Economics Factors
Consumer Financial Behavior
Synthetic US Population
$ecureTM – Synthetic US Population/Household
PwC
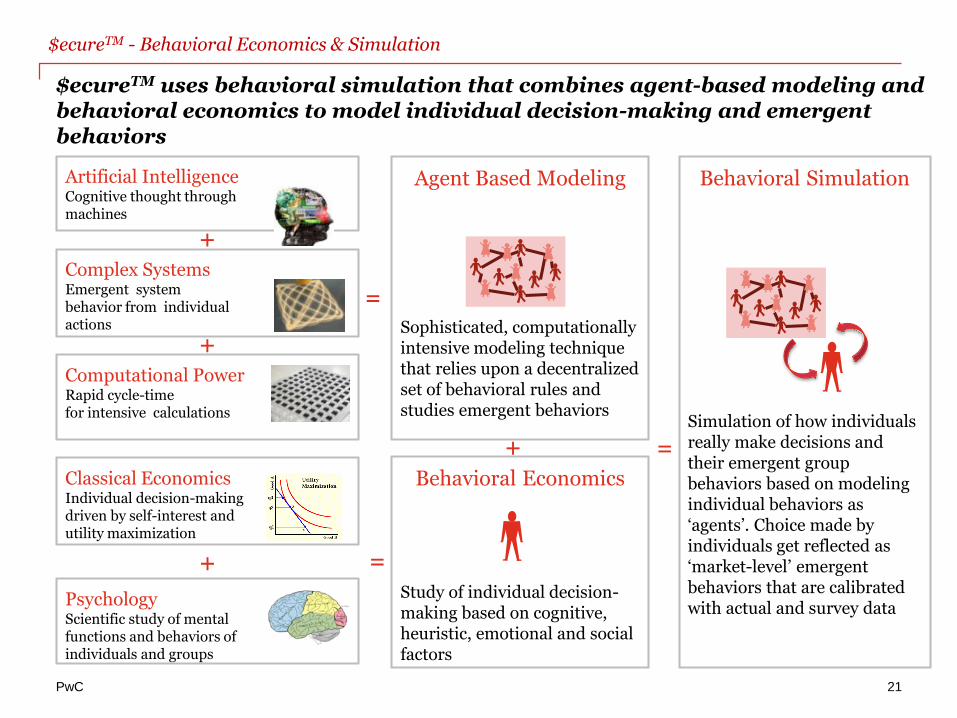
Behavioral Simulation
Simulation of how individuals really make decisions and their emergent group behaviors based on modeling individual behaviors as ‘agents’. Choice made by individuals get reflected as ‘market-level’ emergent behaviors that are calibrated with actual and survey data
$ecureTM uses behavioral simulation that combines agent-based modeling and behavioral economics to model individual decision-making and emergent behaviors
Artificial IntelligenceCognitive thought throughmachines
Complex SystemsEmergent system behavior from individual actions
Computational PowerRapid cycle-timefor intensive calculations
Agent Based Modeling
Sophisticated, computationally intensive modeling technique that relies upon a decentralized set of behavioral rules and studies emergent behaviors
Classical EconomicsIndividual decision-making driven by self-interest and utility maximization
PsychologyScientific study of mental functions and behaviors ofindividuals and groups
Behavioral Economics
Study of individual decision-making based on cognitive, heuristic, emotional and social factors
+
+
+
+
=
=
=
21
$ecureTM - Behavioral Economics & Simulation
PwC
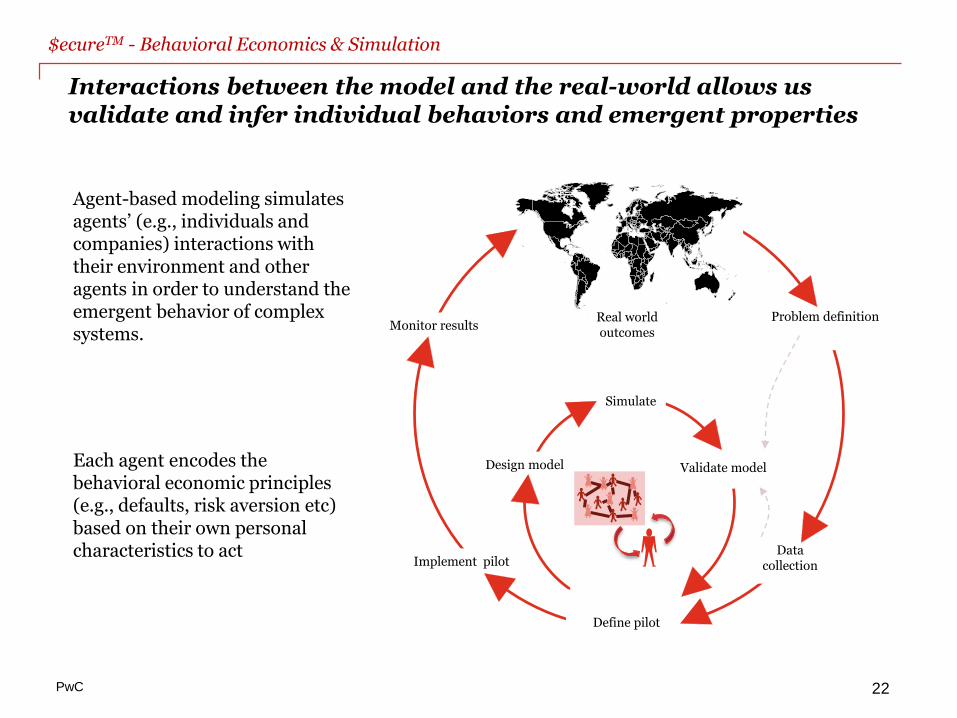
Interactions between the model and the real-world allows us validate and infer individual behaviors and emergent properties
22
Agent-based modeling simulates agents’ (e.g., individuals and companies) interactions with their environment and other agents in order to understand the emergent behavior of complex systems.
Problem definition
Data collection
Monitor results
Define pilot
Implement pilot
Simulate
Validate model
Real world outcomes
Simulate
Design model
$ecureTM - Behavioral Economics & Simulation
Each agent encodes the behavioral economic principles (e.g., defaults, risk aversion etc) based on their own personal characteristics to act
PwC
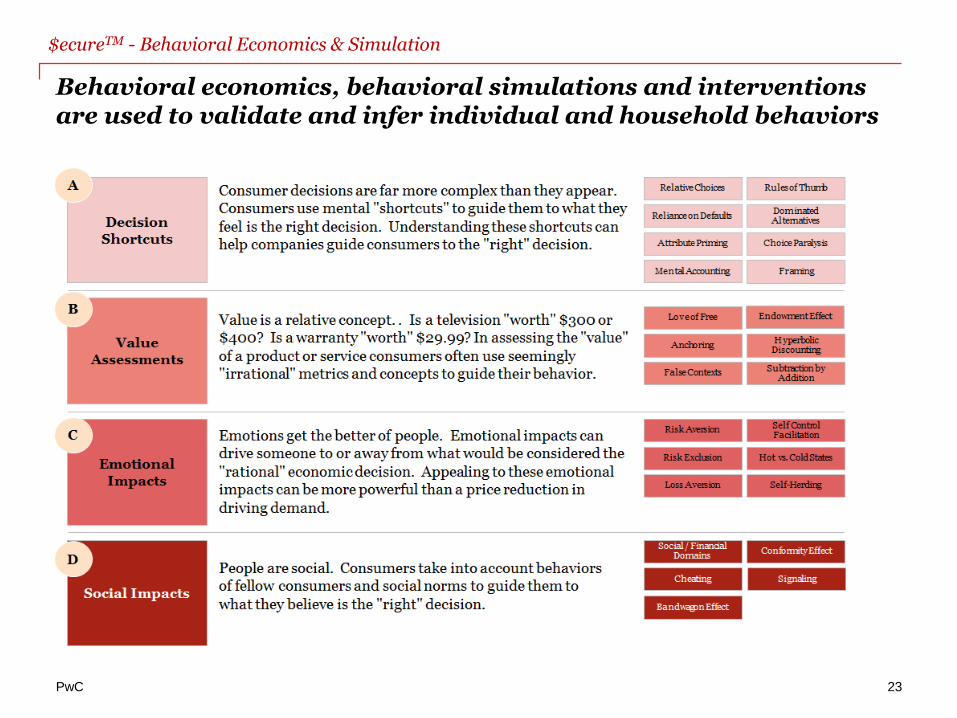
Behavioral economics, behavioral simulations and interventions are used to validate and infer individual and household behaviors
23
$ecureTM - Behavioral Economics & Simulation
PwC
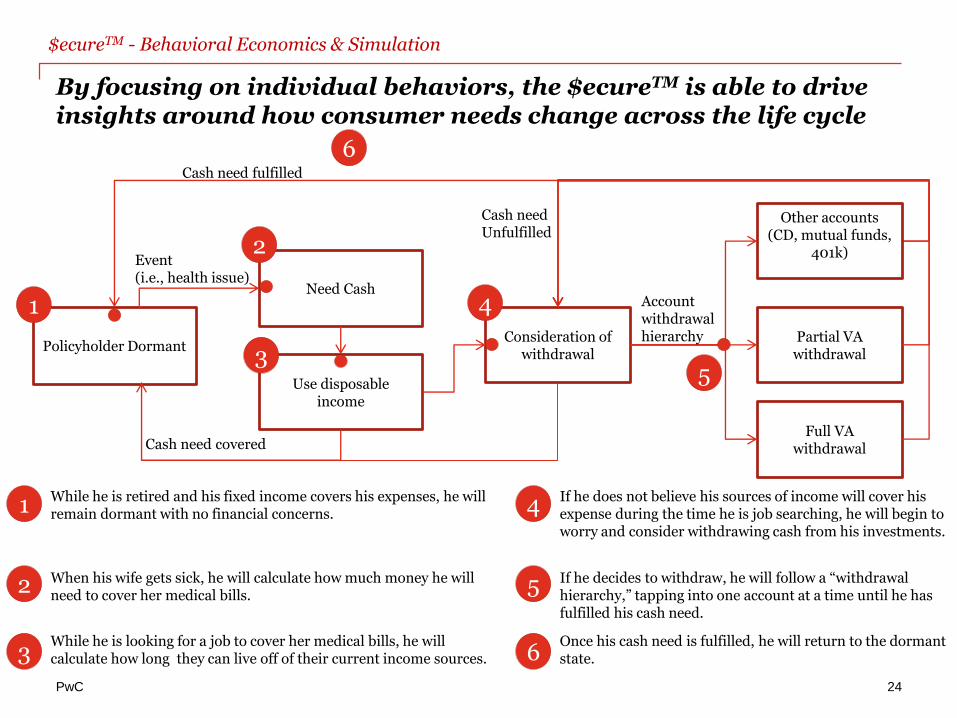
By focusing on individual behaviors, the $ecureTM is able to drive insights around how consumer needs change across the life cycle
24
Policyholder Dormant
Need Cash
Use disposable income
Partial VA withdrawal
Consideration of withdrawal
Cash need covered
Event(i.e., health issue)
Full VA withdrawal
Account withdrawal hierarchy
Cash need Unfulfilled
Other accounts (CD, mutual funds,
401k)
Cash need fulfilled
1
2
3
4
1
2
4
5
6
While he is retired and his fixed income covers his expenses, he will remain dormant with no financial concerns.
When his wife gets sick, he will calculate how much money he will need to cover her medical bills.
5
While he is looking for a job to cover her medical bills, he will calculate how long they can live off of their current income sources.
If he does not believe his sources of income will cover his expense during the time he is job searching, he will begin to worry and consider withdrawing cash from his investments.
If he decides to withdraw, he will follow a “withdrawal hierarchy,” tapping into one account at a time until he has fulfilled his cash need.
3
Once his cash need is fulfilled, he will return to the dormant state.6
$ecureTM - Behavioral Economics & Simulation
PwC 25
Dependents Single & ‘Rich’ Growing Family Pre-Retiree Retiree New Generation
Liability Creation
Asset Transfer
Asset Creation Asset Creation
Asset Protection
Asset Preservation
Asset Depletion
Po
licyh
old
er
Life
-Cycle
Sta
ge
sL
ife
Eve
nts
Ad
vic
e
Asset Cycle
• Paying off student loans
• Starting a career
• Getting married
• Buying a home
• Having or adopting children
• Paying tuition bills
• Caring for parents
• Planning for retirement
• Withdrawal money for retirement
• Paying for health care
• Creating a legacy
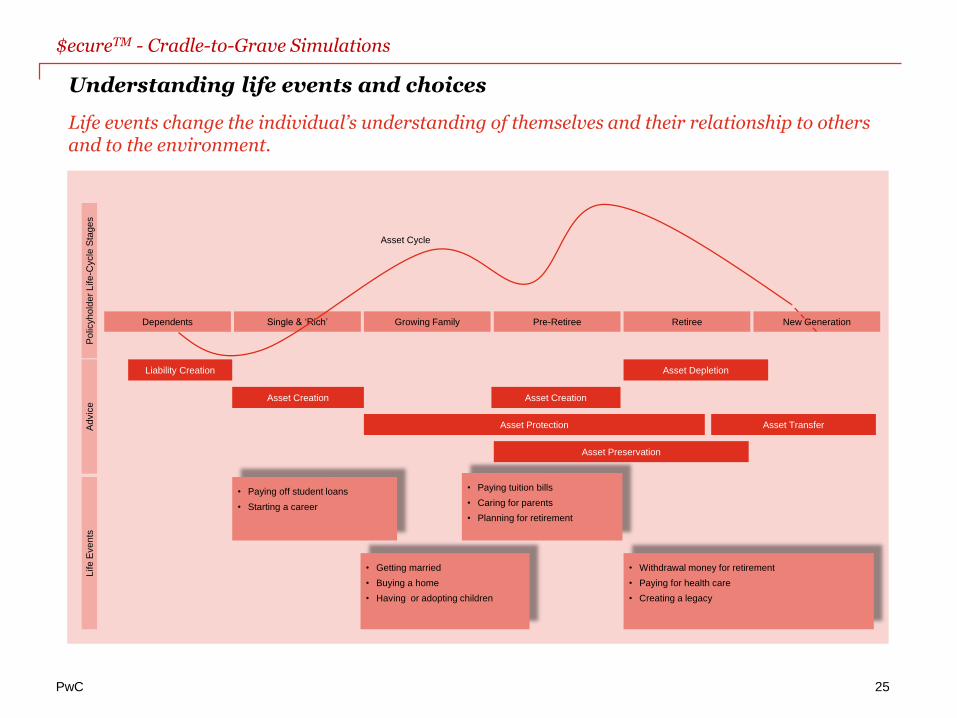
Understanding life events and choices
Life events change the individual’s understanding of themselves and their relationship to others and to the environment.
$ecureTM - Cradle-to-Grave Simulations
PwC
Synthetic Policyholder Population
Projected Product
Attributes
Projected Policyholder
Attributes
Competitive Factors
Economic Factors
Policyholder Factors
ProjectedSavings
Behavior
Parameters(For ‘what-if’ analysis)
Model ‘Agents’
Scenario Outputs
Simulation Model
Withdrawal
Medical
PolicyholderBehaviors
Social Security
Savings
Products
Economic Environment
Advisors&
Company
Policyholders
External Data
Views & Calibration
ProjectedWithdrawal
Behavior
ScenarioCombination
Scenario Inputs
26
Assumptions&
Scenarios
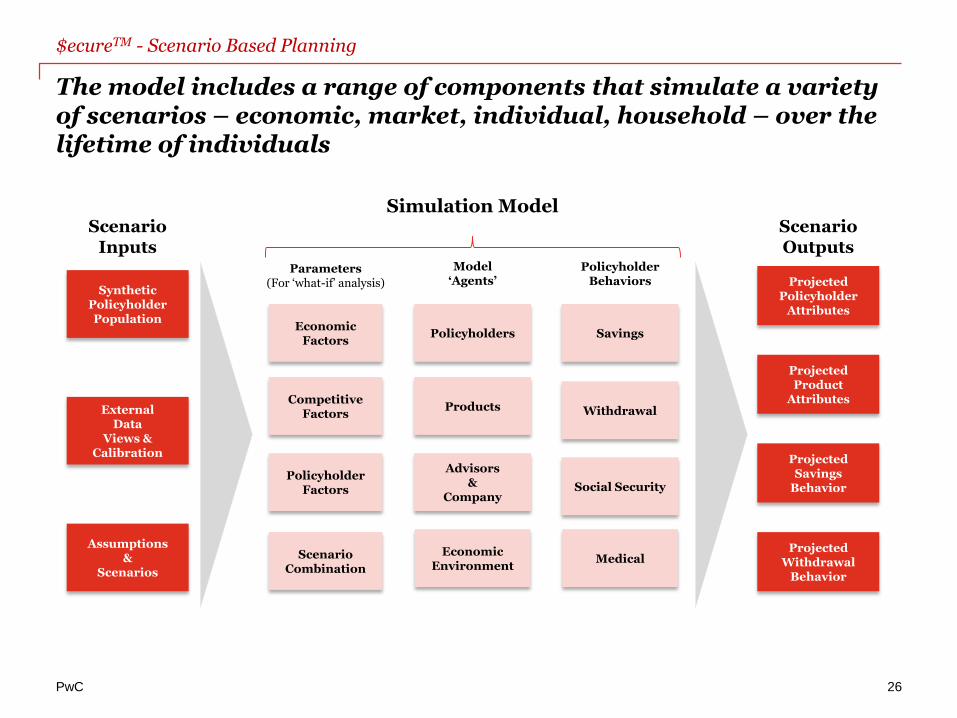
$ecureTM - Scenario Based Planning
The model includes a range of components that simulate a variety of scenarios – economic, market, individual, household – over the lifetime of individuals
PwC 27
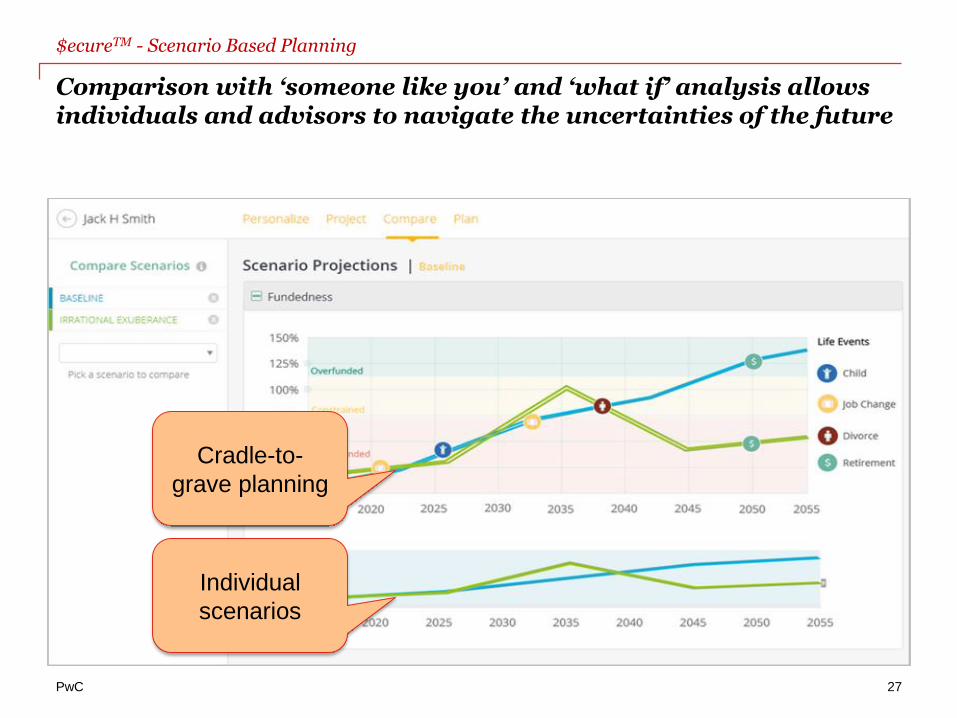
$ecureTM - Scenario Based Planning
Comparison with ‘someone like you’ and ‘what if’ analysis allows individuals and advisors to navigate the uncertainties of the future
Cradle-to-
grave planning
Individual
scenarios
PwC
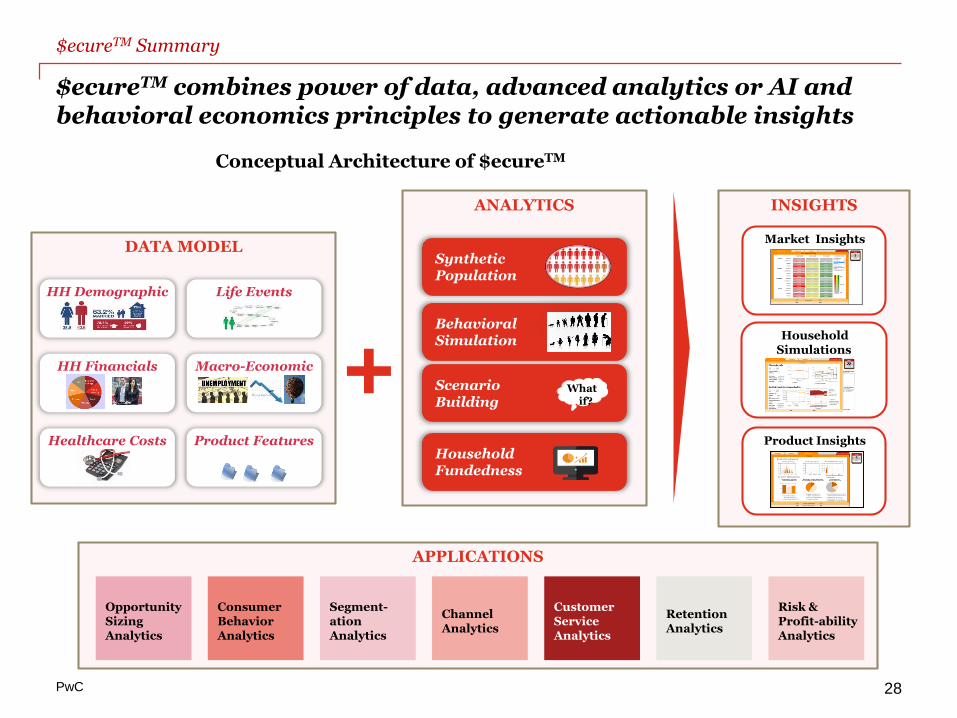
$ecureTM combines power of data, advanced analytics or AI and behavioral economics principles to generate actionable insights
28
$ecureTM Summary
APPLICATIONS
DATA MODEL
Product Features
Macro-Economic
Life Events
Healthcare Costs
HH Demographic
HH Financials
ANALYTICS
Behavioral Simulation
Once upon a time Once
upon a time Once upon
Synthetic Population
Household Fundedness
Scenario Building
What if?
INSIGHTS
Household Simulations
Market Insights
Product Insights
+
Opportunity Sizing Analytics
Segment-ationAnalytics
Risk & Profit-ability Analytics
Channel Analytics
Customer Service Analytics
Retention Analytics
Consumer Behavior Analytics
Conceptual Architecture of $ecureTM
PwC
Appendix 1
$ecureTM use cases
PwC
Data Types:
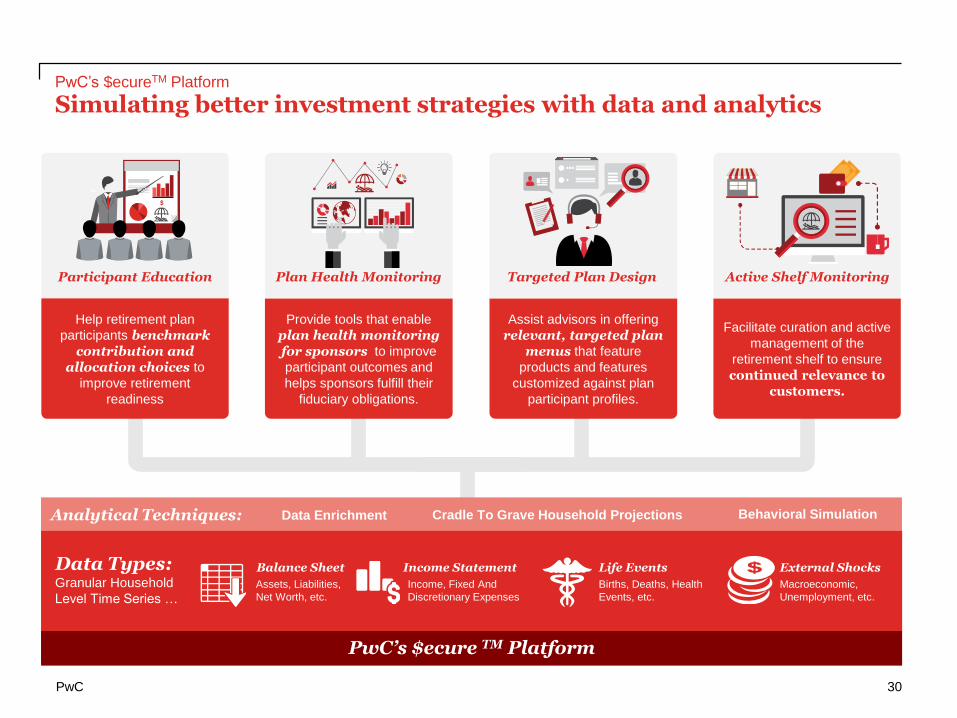
Participant Education
Provide tools that enable
plan health monitoring for sponsors to improve
participant outcomes and
helps sponsors fulfill their
fiduciary obligations.
Assist advisors in offering
relevant, targeted plan menus that feature
products and features
customized against plan
participant profiles.
Facilitate curation and active
management of the
retirement shelf to ensure
continued relevance to customers.
Help retirement plan
participants benchmark contribution and
allocation choices to
improve retirement
readiness
Plan Health Monitoring Targeted Plan Design Active Shelf Monitoring
30
XYZ Platform
PwC’s $ecureTM Platform
Simulating better investment strategies with data and analytics
Analytical Techniques:
PwC’s $ecure TM Platform
Analytical Techniques: Data Enrichment Cradle To Grave Household Projections Behavioral Simulation
Data Types: Granular Household
Level Time Series …
Balance Sheet
Assets, Liabilities,
Net Worth, etc.
Income Statement
Income, Fixed And
Discretionary Expenses
Life Events
Births, Deaths, Health
Events, etc.
External Shocks
Macroeconomic,
Unemployment, etc.
PwC
THE BOTTOM LINE
THE IMPACT OF ANALYTICS
Lacking guidance to make prudent retirement decisions, retirement plan participants tend to demonstrate
sub-optimal savings behavior. Such behavior has contributed to the United States’ ballooning retirement
savings deficit.
Leveraging $ecure, retirement services providers can educate and guide participants on how much they
should save, given their personal situation. Sophisticated analytics provides future retirees with
actionable information on how households should save to maintain their standard of living.
Enhanced retirement education can result in improved plan participation and higher contributions.
Implementing such programs can significantly improve the depth of providers’ relationships with their
plan participants.
THE CHALLENGE TODAY
Case Study is Illustrative 31
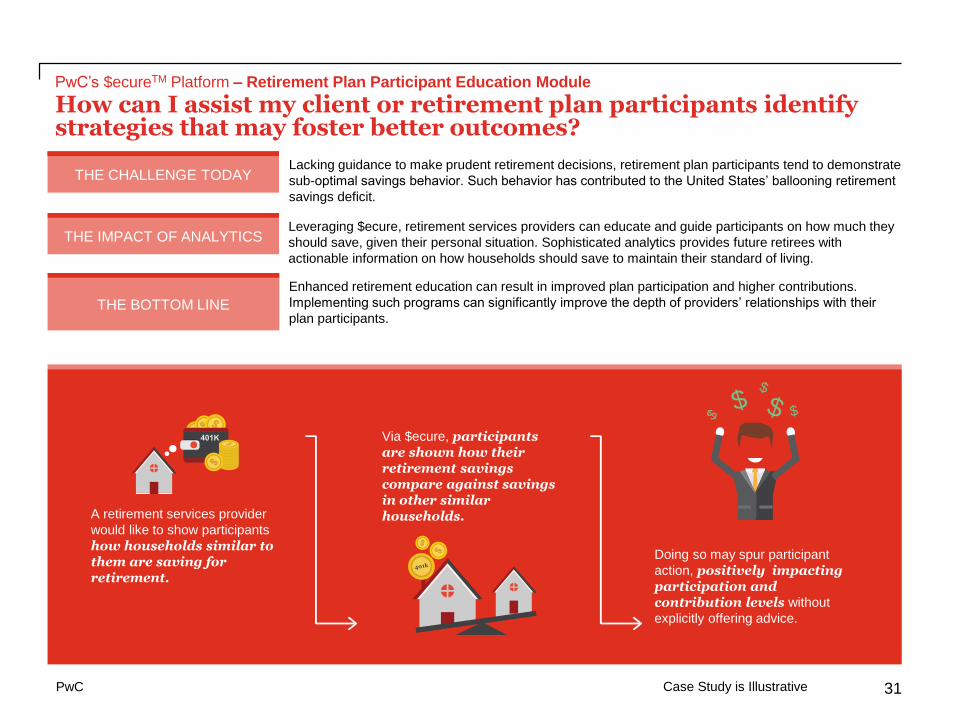
PwC’s $ecureTM Platform – Retirement Plan Participant Education Module
How can I assist my client or retirement plan participants identify strategies that may foster better outcomes?
A retirement services provider
would like to show participants
how households similar to them are saving for retirement.
401K Via $ecure, participants are shown how their retirement savings compare against savings in other similar households.
401k
Doing so may spur participant
action, positively impacting participation and contribution levels without
explicitly offering advice.
$ $$
$ $
PwC
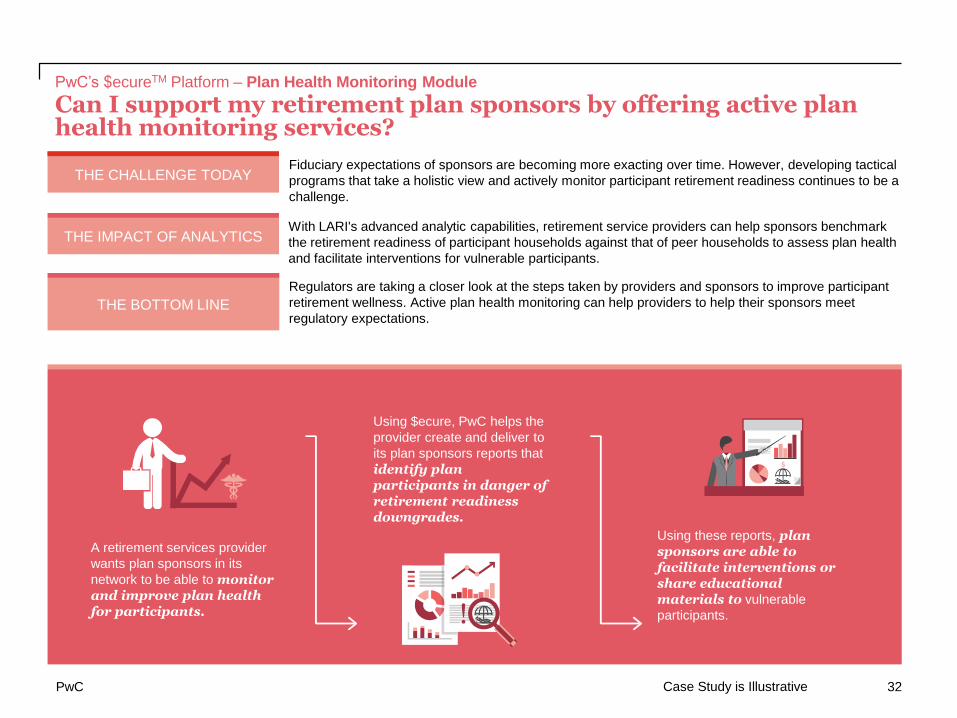
THE BOTTOM LINE
THE IMPACT OF ANALYTICS
Fiduciary expectations of sponsors are becoming more exacting over time. However, developing tactical
programs that take a holistic view and actively monitor participant retirement readiness continues to be a
challenge.
With LARI's advanced analytic capabilities, retirement service providers can help sponsors benchmark
the retirement readiness of participant households against that of peer households to assess plan health
and facilitate interventions for vulnerable participants.
Regulators are taking a closer look at the steps taken by providers and sponsors to improve participant
retirement wellness. Active plan health monitoring can help providers to help their sponsors meet
regulatory expectations.
THE CHALLENGE TODAY
Case Study is Illustrative 32
PwC’s $ecureTM Platform – Plan Health Monitoring Module
Can I support my retirement plan sponsors by offering active plan health monitoring services?
A retirement services provider
wants plan sponsors in its
network to be able to monitor and improve plan health for participants.
Using $ecure, PwC helps the
provider create and deliver to
its plan sponsors reports that
identify plan participants in danger of retirement readiness downgrades.
Using these reports, plan sponsors are able to facilitate interventions or share educational materials to vulnerable
participants.
PwC
THE BOTTOM LINE
THE IMPACT OF ANALYTICS
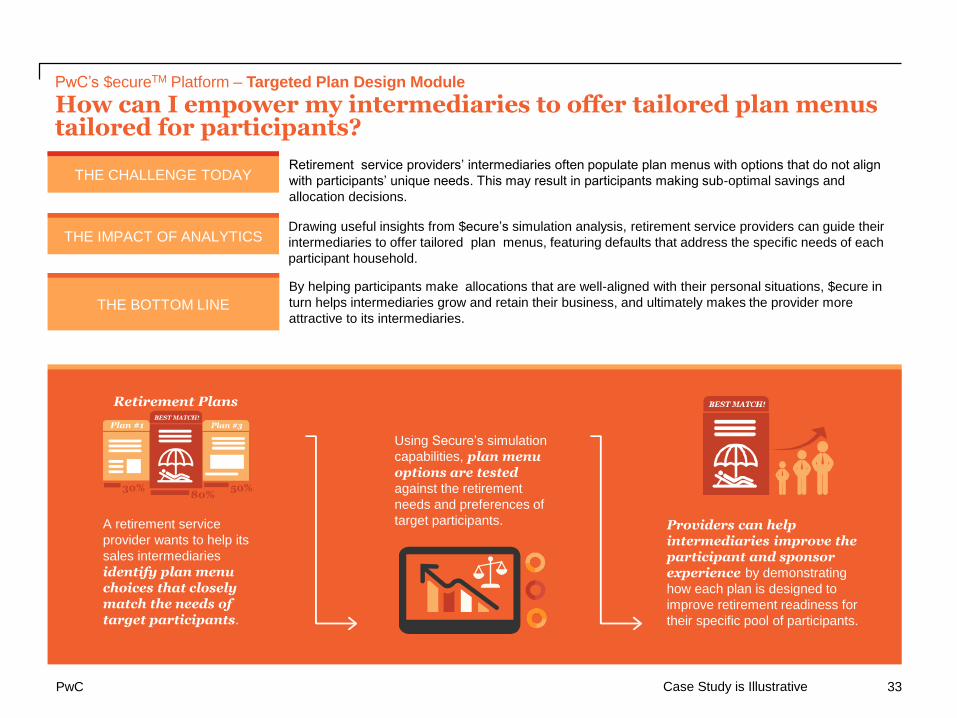
Retirement service providers’ intermediaries often populate plan menus with options that do not align
with participants’ unique needs. This may result in participants making sub-optimal savings and
allocation decisions.
Drawing useful insights from $ecure’s simulation analysis, retirement service providers can guide their
intermediaries to offer tailored plan menus, featuring defaults that address the specific needs of each
participant household.
By helping participants make allocations that are well-aligned with their personal situations, $ecure in
turn helps intermediaries grow and retain their business, and ultimately makes the provider more
attractive to its intermediaries.
THE CHALLENGE TODAY
Case Study is Illustrative 33
A retirement service
provider wants to help its
sales intermediaries
identify plan menu choices that closely match the needs of target participants.
Using Secure’s simulation
capabilities, plan menu options are tested against the retirement
needs and preferences of
target participants. Providers can help intermediaries improve the participant and sponsor experience by demonstrating
how each plan is designed to
improve retirement readiness for
their specific pool of participants.
PwC’s $ecureTM Platform – Targeted Plan Design Module
How can I empower my intermediaries to offer tailored plan menus tailored for participants?
PwC
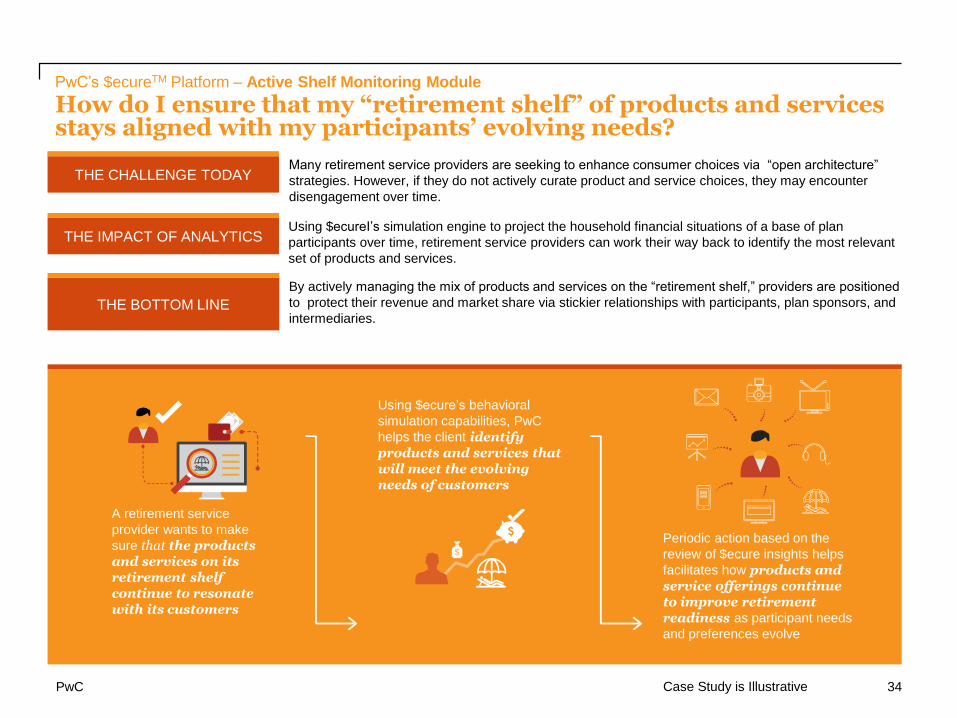
THE BOTTOM LINE
THE IMPACT OF ANALYTICS
Many retirement service providers are seeking to enhance consumer choices via “open architecture”
strategies. However, if they do not actively curate product and service choices, they may encounter
disengagement over time.
Using $ecureI’s simulation engine to project the household financial situations of a base of plan
participants over time, retirement service providers can work their way back to identify the most relevant
set of products and services.
By actively managing the mix of products and services on the “retirement shelf,” providers are positioned
to protect their revenue and market share via stickier relationships with participants, plan sponsors, and
intermediaries.
THE CHALLENGE TODAY
Case Study is Illustrative 34
A retirement service
provider wants to make
sure that the products and services on its retirement shelf continue to resonate with its customers
Using $ecure’s behavioral
simulation capabilities, PwC
helps the client identify products and services that will meet the evolving needs of customers
Periodic action based on the
review of $ecure insights helps
facilitates how products and service offerings continue to improve retirement readiness as participant needs
and preferences evolve
PwC’s $ecureTM Platform – Active Shelf Monitoring Module
How do I ensure that my “retirement shelf” of products and services stays aligned with my participants’ evolving needs?
PwC
Appendix 2
Retirement Income ModelSM (RIM) Screenshots and Sample Outputs
PwC
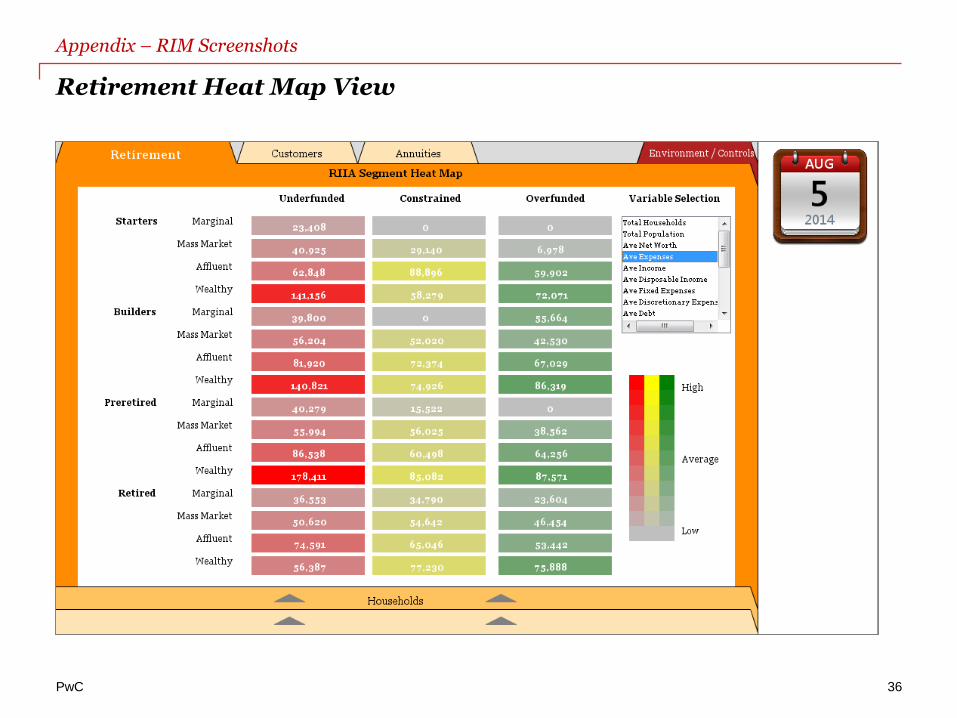
Retirement Heat Map View
Appendix – RIM Screenshots
36
PwC
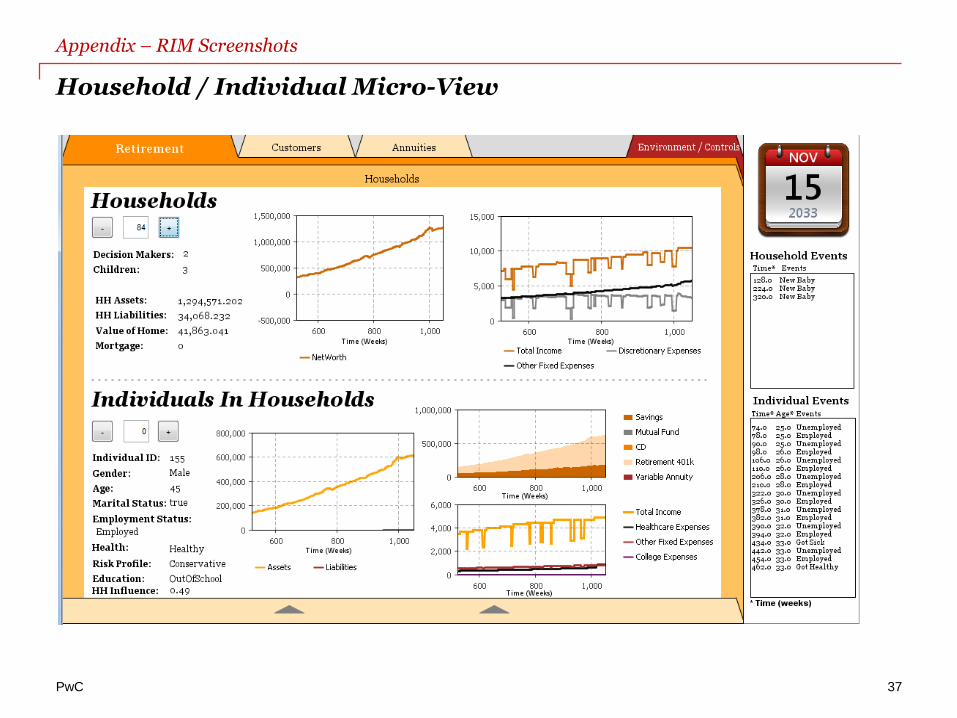
Household / Individual Micro-View
Appendix – RIM Screenshots
37
PwC
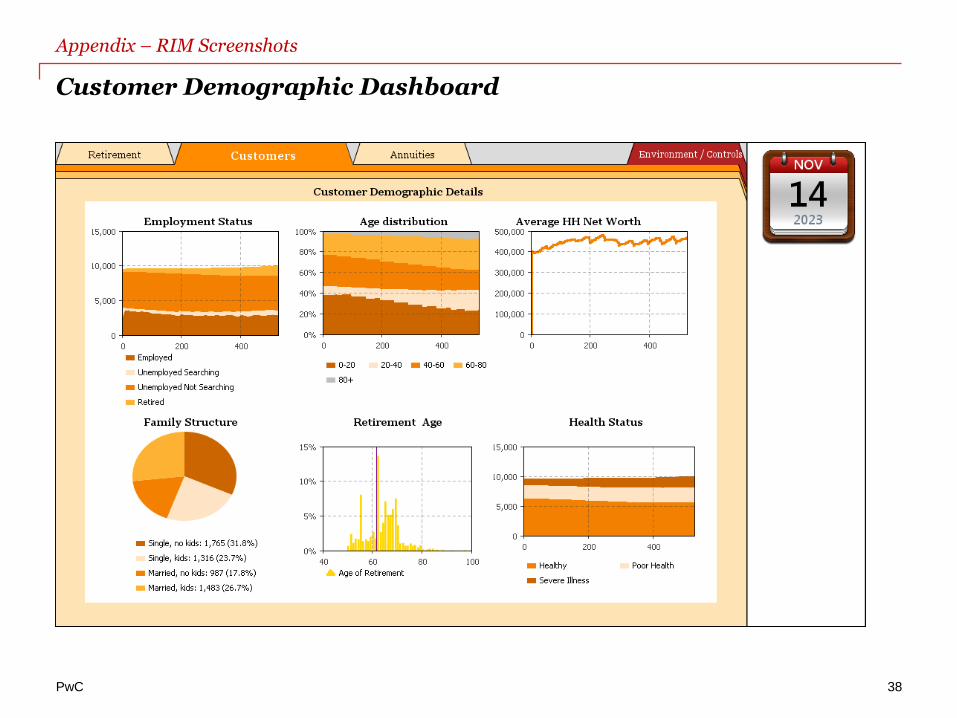
Customer Demographic Dashboard
Appendix – RIM Screenshots
38
PwC
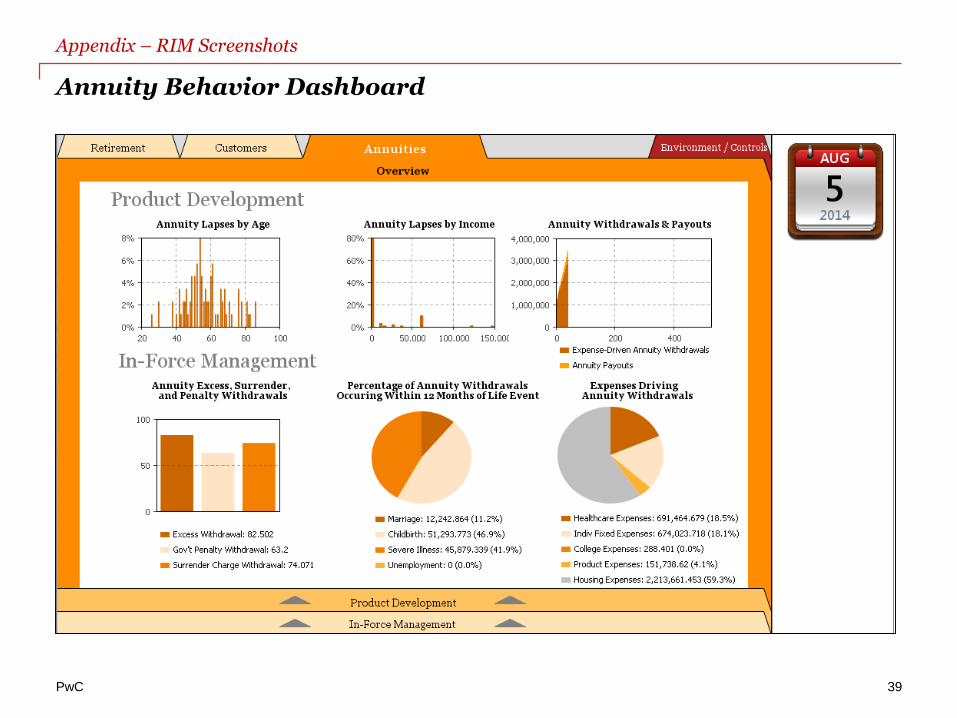
Annuity Behavior Dashboard
Appendix – RIM Screenshots
39
PwC
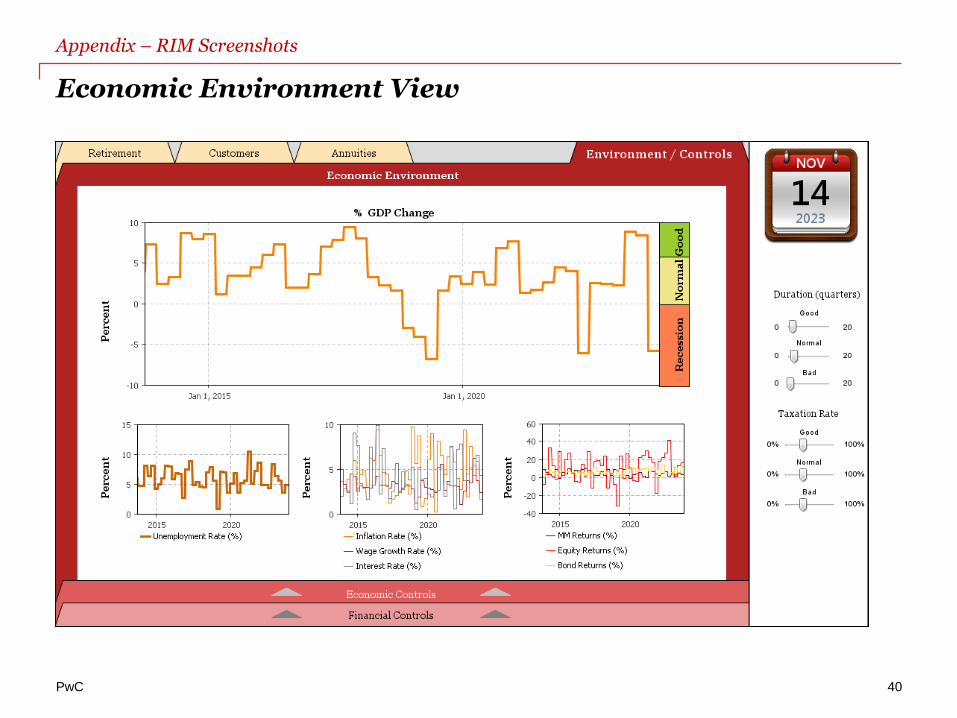
Economic Environment View
Appendix – RIM Screenshots
40
PwC
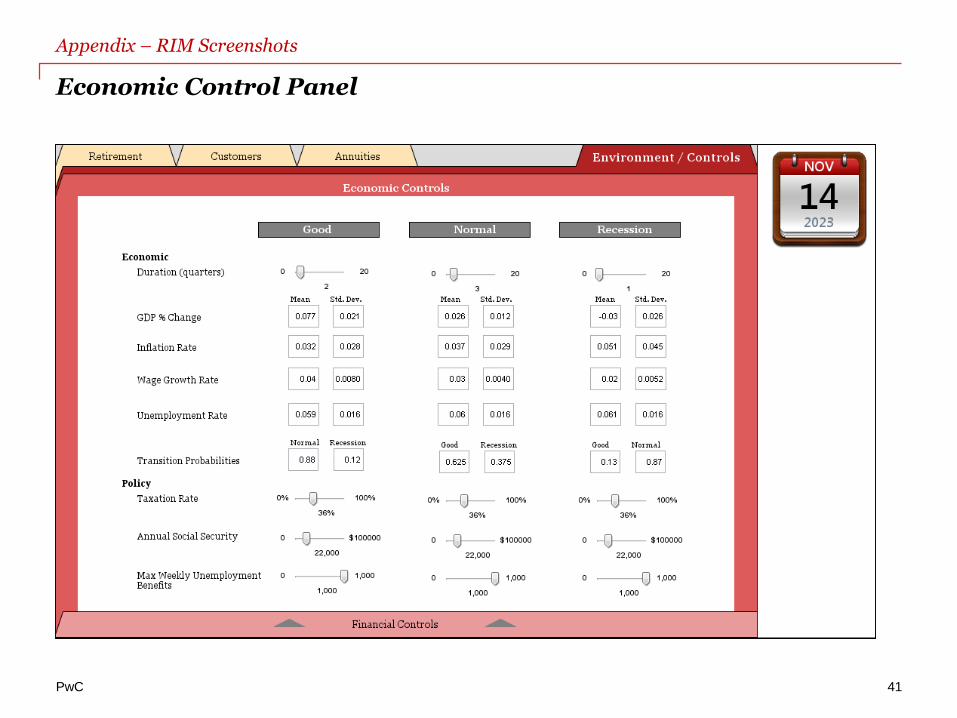
Economic Control Panel
Appendix – RIM Screenshots
41
PwC
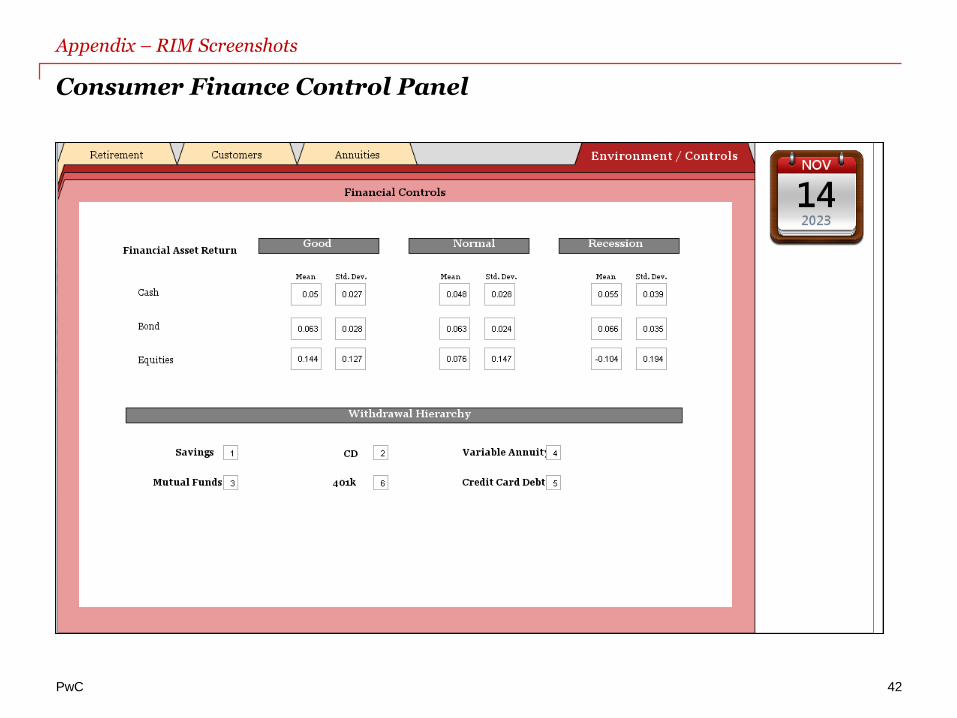
Consumer Finance Control Panel
Appendix – RIM Screenshots
42

PwC
Appendix 3
Supplemental RIM Insights
PwC
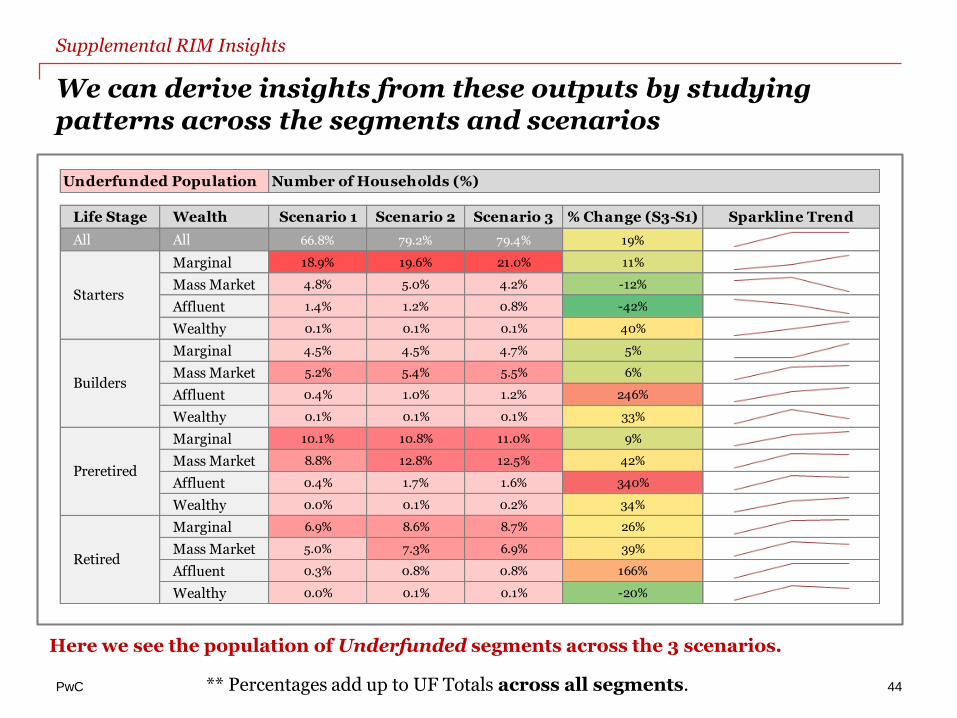
Underfunded Population Number of Households (%)
Life Stage Wealth Scenario 1 Scenario 2 Scenario 3 % Change (S3-S1) Sparkline Trend
All All 66.8% 79.2% 79.4% 19%
Marginal 18.9% 19.6% 21.0% 11%
Mass Market 4.8% 5.0% 4.2% -12%
Affluent 1.4% 1.2% 0.8% -42%
Wealthy 0.1% 0.1% 0.1% 40%
Marginal 4.5% 4.5% 4.7% 5%
Mass Market 5.2% 5.4% 5.5% 6%
Affluent 0.4% 1.0% 1.2% 246%
Wealthy 0.1% 0.1% 0.1% 33%
Marginal 10.1% 10.8% 11.0% 9%
Mass Market 8.8% 12.8% 12.5% 42%
Affluent 0.4% 1.7% 1.6% 340%
Wealthy 0.0% 0.1% 0.2% 34%
Marginal 6.9% 8.6% 8.7% 26%
Mass Market 5.0% 7.3% 6.9% 39%
Affluent 0.3% 0.8% 0.8% 166%
Wealthy 0.0% 0.1% 0.1% -20%
Starters
Builders
Preretired
Retired
** Percentages add up to UF Totals across all segments.
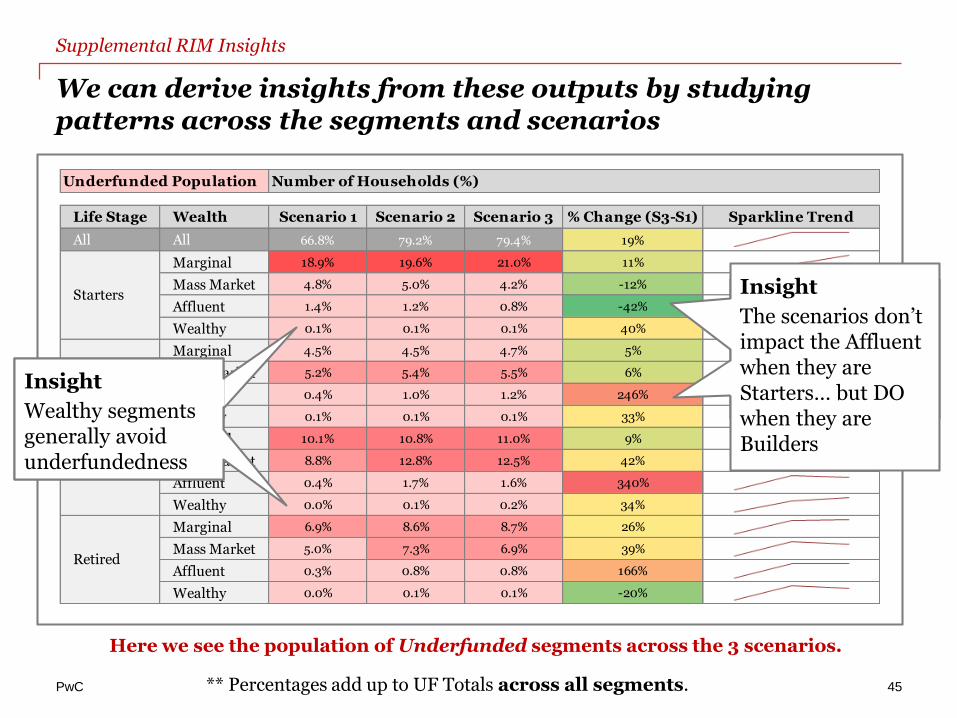
We can derive insights from these outputs by studying patterns across the segments and scenarios
Supplemental RIM Insights
44
Here we see the population of Underfunded segments across the 3 scenarios.
PwC
Underfunded Population Number of Households (%)
Life Stage Wealth Scenario 1 Scenario 2 Scenario 3 % Change (S3-S1) Sparkline Trend
All All 66.8% 79.2% 79.4% 19%
Marginal 18.9% 19.6% 21.0% 11%
Mass Market 4.8% 5.0% 4.2% -12%
Affluent 1.4% 1.2% 0.8% -42%
Wealthy 0.1% 0.1% 0.1% 40%
Marginal 4.5% 4.5% 4.7% 5%
Mass Market 5.2% 5.4% 5.5% 6%
Affluent 0.4% 1.0% 1.2% 246%
Wealthy 0.1% 0.1% 0.1% 33%
Marginal 10.1% 10.8% 11.0% 9%
Mass Market 8.8% 12.8% 12.5% 42%
Affluent 0.4% 1.7% 1.6% 340%
Wealthy 0.0% 0.1% 0.2% 34%
Marginal 6.9% 8.6% 8.7% 26%
Mass Market 5.0% 7.3% 6.9% 39%
Affluent 0.3% 0.8% 0.8% 166%
Wealthy 0.0% 0.1% 0.1% -20%
Starters
Builders
Preretired
Retired
** Percentages add up to UF Totals across all segments.
We can derive insights from these outputs by studying patterns across the segments and scenarios
Supplemental RIM Insights
45
Here we see the population of Underfunded segments across the 3 scenarios.
Insight
Wealthy segments generally avoid underfundedness
Insight
Wealthy segments generally avoid underfundedness
Insight
The scenarios don’t impact the Affluent when they are Starters… but DO when they are Builders
PwC
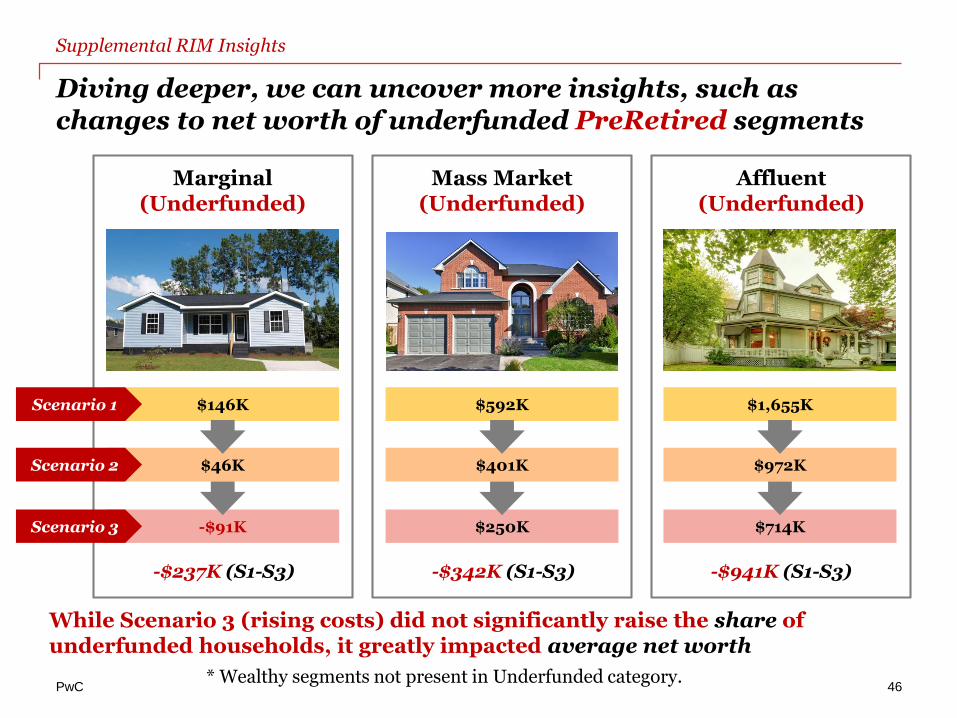
Diving deeper, we can uncover more insights, such as changes to net worth of underfunded PreRetired segments
Supplemental RIM Insights
46
Marginal(Underfunded)
Mass Market(Underfunded)
Affluent(Underfunded)
$146K $592K $1,655KScenario 1
* Wealthy segments not present in Underfunded category.
$46K $401K $972KScenario 2
-$91K $250K $714KScenario 3
While Scenario 3 (rising costs) did not significantly raise the share of underfunded households, it greatly impacted average net worth
-$237K (S1-S3) -$342K (S1-S3) -$941K (S1-S3)
PwC
Advisory
Team
Contacts
This publication has been prepared for general guidance on matters of interest only, and does not constitute professional advice. You should not act upon the
information contained in this publication without obtaining specific professional advice. No representation or warranty (express or implied) is given as to the accuracy
or completeness of the information contained in this publication, and, to the extent permitted by law, PwC, its members, employees and agents do not accept or
assume any liability, responsibility or duty of care for any consequences of you or anyone else acting, or refraining to act, in reliance on the information contained in
this publication or for any decision based on it.
© 2015 PricewaterhouseCoopers LLP. All rights reserved. PwC refers to the United States member firm, and may sometimes refer to the PwC network. Each member
firm is a separate legal entity. Please see www.pwc.com/structure for further details.
Anand RaoPricewaterhouseCoopers LLP (www.pwc.com)125 High StreetBoston, MA 02110+1 617 530 4691 (o) | +1 617 633 8354 (m)[email protected]
Juneen BelknapPricewaterhouseCoopers LLP (www.pwc.com)CNL Tower, 420 South Orange Avenue, Suite 200Orlando, FL 32801+1 407 236 5102 (o) | +1 617 312 9463 (m)[email protected]
Pallav RayPricewaterhouseCoopers LLP (www.pwc.com)2001 Ross Avenue, Suite 1800Dallas, TX 75201+1 214 754 4839 (o) | +1 202 230 1869 (m)[email protected]
Spencer AlleePricewaterhouseCoopers LLP (www.pwc.com)One North WackerChicago, IL 60611+1 847 4776 2430 (m)[email protected]