RE-EVALUATION OF THE LOWER SAN FERNANDO ... Hlails F-er y Road, V r ksbmq Mississippi 391 189 10 3 1...
107
CONTRACT REPORT GL-89-2 RE-EVALUATION OF THE LOWER * -~ SAN FERNANDO DAM Report 1 AN INVESTIGATION OF THE FEBRUARY 9, 1971 SLIDE VOLUME TEXT by Gcnzalo Castro, Thomas 0. Keller. Stephen S Boynton GEl Consultants Inc. Winchester. Massachusetts 01890-1943 N' DTIC ELECTE 103 11989 J , -, September 1989 Report 1 of a Series H', DEPARTMENT OF THE ARMY US Army Corps of Engineers Washington, DC 20314-1000 . Contract No. DACW39-85-C-0058 Geotechnica! Laboratory LABORATORY US Army Engineer Waterways Experiment Statton 399 Hlails F-er y Road, V r ksbmq Mississippi 391 189 10 3 1 1175
Transcript of RE-EVALUATION OF THE LOWER SAN FERNANDO ... Hlails F-er y Road, V r ksbmq Mississippi 391 189 10 3 1...

CONTRACT REPORT GL-89-2
RE-EVALUATION OF THE LOWER* -~ SAN FERNANDO DAM
Report 1
AN INVESTIGATION OF THE FEBRUARY 9, 1971 SLIDE
VOLUME TEXT
by
Gcnzalo Castro, Thomas 0. Keller. Stephen S Boynton
GEl Consultants Inc.Winchester. Massachusetts 01890-1943
N' DTICELECTE10311989 J
, -,
September 1989Report 1 of a Series
H', DEPARTMENT OF THE ARMYUS Army Corps of EngineersWashington, DC 20314-1000
. Contract No. DACW39-85-C-0058
Geotechnica! LaboratoryLABORATORY US Army Engineer Waterways Experiment Statton
399 Hlails F-er y Road, V r ksbmq Mississippi 391
189 10 3 1 1175

Destroy this report when no longer needed. Do not returnit to the originator.
The findings in this report are not to be construed as an officialDepartment of the Army position unless so designated
by other authorized documents.
The contents of this report are not to be used foradvertising, publication, or promotional purposes.Citation of trade narmes does not constitute anofficial endorsement or approval of the use of
such commercial products.

UnclassifiedSECURITY CLASSIFICATION OF THIS PAGE
IForm AwavdREPORT DOCUMENTATION PAGE 0MB No. 0704-0188
Ia. REPORT SECURITY CLASSIFICATION lb. RESTRICTIVE MARKINGSUnclassified2a. SECURITY CLASSIFICATION AUTHORITY 3. DISTRIBUTION /AVAILABILITY OF REPORT
Approved for public release;2b. DECLASSIFICATION / DOWNGRADING SCIEDULE distribution un limited
4. PERFORMING ORGANIZATION REPORT NUMBER(S) S. MONITORING ORGANIZATION REPORT NUMBER(S)
Contract Report GL-89-2
5a. NAME OF PERFORMING ORGANIZATION 6b. OFFICE SYMBOL 7a. NAME OF MONITORING ORGANIZATION(If applicable) USAEWES
GEI Consultants, Inc. Geotechnical Laborntory
6c. ADDRESS (City, State, and ZIPCode) 7b. ADDRESS (City, State, and ZIP Code)
3909 Halls Ferry RoadWinchester, MA 01890-1943 Vicksburg, MS 39180-6199
8.. NAME OF FUNDING/SPONSORING 8b. OFFICE SYMBOL 9. PROCUREMENT INSTRUMENT IDENTIFICATION NUMBERORGANIZATION US Army Engineer (If applicable)
District, Kansas City DACW39-85-C-0058
8c. ADDRESS (City, State, and ZIP Code) 10. SOURCE OF FUNDING NUMBERSPROGRAM - PROJECT TASK WORK UNITELEMENT NO. NO. NO. ACCESSION NO.
Kansas City, KS 64106-2896 1 E
11. TITLE (Include Security Classification) Re-Evaluation of the Lower San Fernando Dam, Report 1, An
Investigation of the February 9, 1971 Slide, Volume I: Text; Volume II: Appendixes A-F
12. PERSONAL AUTHOR(S)
Castro, Gonzalo; Keller, Thomas 0.; Boynton, Stephen S.13a. TYPE OF REPORTReport I 13b. TIME COVERED 14. DATE OF REPORT (Year,Month, Day) 15. PAGE COUNTof a series in 2 volum FROM TO September 1989 439
16. SUPPLEMENTARY NOTATIONAvailable from National Technical Information Service, 5285 Port Royal Road,Springfield, VA 22161
17. COSATI CODES 18. SUBJECT TERMS (Continuv on reverse if necessary and identify by block number)FIELD GROUP SUB-GROUP. Earthquakes Soil iquefactionj1
- Embankment dams fa th
19, ABSTRACT (Continue on reverse if nece and identify by block number)
---> The lower San Fernando D in California developed a major slide in the upstream slope
and crest as a result of the 1 San Fernando earthquake. The purpose of the investiga-
tion presented in this report was o test the validity of using steady state concepts and
methodology to perform liquefaction alyses of the dam and to further investigate someaspects of the physical mechanism of th slide.
The results of the steady state anal es were consistent with the observed behavior.i.e., (a) the dam was susceptible to a lique action failure in the upstream direction.
(b) the dam was not susceptible to a liquefac on failure in the downstream direction orce
the upstream slope had failed, and (c) the strains that accumulated duripg the 1971 earth-
quake were sufficient to trigger the upstream 1 quefaction failure. I/I6- - I"" J-..
20. DISTRIBUTIW/AVAILABILITY OF ABSTRACT 21, ABSTRACT SECURITY CLASSIFICATIONEl UNCLASSIFIED/UNLIMITED 0 SAME AS RPT. ro DTIC USERS Unclassified
22a. NAME OF RESPONSIBLE INDIVIDUAL 22b, TELEPHONE (Include Area Code) ,, OFFICE SYMIO
DD Form 1473, JUN 86 Previous editions ore obsolete. SECURITY CLASSIFIATtO4 OF ThI PA(ItUnclassified

SECU)RITY CLASSIFICATION OF THIS PAGE
SFCLJRITN CLASSIFICATION OF THIS PAGE

PREFACE
This study was a part of an in,,estigation of thestrength of soils that have been weakened by earthquakeshaking, and the stability of embankment dams containing orfounded on susceptible soils. This report is one of aseries which document the investigation. The project wascarried out jointly by Geotechnical Engineers, Inc. (GEI),H. Bolton Seed, Inc., Rensselaer Polytechnic Institute(RPI), and the US Army Engineer Waterways Experiment Station(WES). Principal Investigators were Dr. Gonzalo Castro forGEI, Professor H. Bolton Seed, Professor Ricardo Dobry forRPI, and Dr. A. G. Franklin for WES. Mr. Edward Pritchett,Office of the Chief of Engineers, Washington, DC, was re-sponsible for recognizing the importance and timeliness ofthis research to the Corps of Engineers, and for generatingCorps support for the project. Funding was provided throughthe US Army Engineer District, Kansas City, for whomoversight was provided by Mr. Francke Walberg.
Essential to the overall investigation was an explora-tion and records review effort at the Lower San FernandoDam, in order to obtain crucial data and soil samples forlaboratory testing. This effort included an extensivedrilling and penetration testing program, excavation of alarge diameter shaft, in situ testing, collection of sam-ples, and review of historical records. The Los AngelesDepartment of Water and Power, owner of the Lower SanFernando Dam, provided access to the site and to thehistorical records, and other assistance. The CaliforniaDepartment of Water Resources provided information fromtheir files.
Drilling, Standard Penetration Testing, and undisturbedsampling from borings were performed by WES, under the super-vision of Mr. Joseph Gatz. Cone Penetration Test soundingswere performed by Earth Technology Corporation (ERTEC).Excavation of the exploratory shaft was done by ZamborelliDrilling Company, under the direction of GEI. Investiga-tions and sampling in the shaft, and the review of histori-cal records, were done by and under the supervision ofMr. Tom Keller of GEI.
The work presented in this report was done by GEI,under WES Contract No. DACW39-85-C-0058. Aooesgiol Fr_
NTIS GRA&IDTIC TAR 0Unanno'amced 0Justifloation
ByDistrlbution/
Availa;lltt! Cod~sAvail and/or
Dist Special

The technical monitor and Contracting Officer's Repre-sentative at WES was Dr. A. G. Franklin, Chief of the Earth-quake Engineering and Geosciences Division, GeotechnicalLaboratory. The primary WES reviewer was Dr. Paul F.Hadala, Assistant Chief of the Geotechnical Laboratory.Chief of the Geotechnical Laboratory was Dr. William F.Marcuson III.
Commander and Director of WES during the preparation ofthis report was COL Larry B. Fulton, EN. Dr. Rnbert W.Whalin was Technical Director.
ii

EXECUTIVE SUMMARY
The Lower San Fernando Dam in California developed amajor slide in the upstream slope and crest as a result of the1971 San Fernando earthquake. The liquefaction slide nearlycaused a major uncontrolled release of the reservoir. Becauseof the magnitude of the slide and strong interest of the engi-neering profession in the evaluation of the seismic stabilityof earth dams, the Lower San Fernando Dam slide has receivedconsiderable attention beginning with detailed studies im-mediately following the slide (Seed et al, 1973). The purposeof our re-evaluation was to test the validity of using steadystate concepts and methodology to perform liquefaction analy-ses of the dam and to further investigate some aspects of thephysical mechanism of the slide. This work was sponsored bythe Army Corps of Engineers Waterways Experiment Station(WES).
The results of the steady state analyses were consistentwith the observed behavior, i.e., a) the dam was susceptibleto a liquefaction failure in the upstream direction, b) thedam was not susceptible to a liquefaction failure in thedownstream direction once the upstream slope had failed, andc) the strains that accumulated during the 1971 earthquakewere sufficient to trigger the upstream liquefaction failure.
A field exploration program was conducted in 1985 at thedamsite as part of this investigation. The main purpose ofthe exploration program was to characterize and obtain un-disturbed samples of the intact downstream section of the damso that analyses of the failed upstream section could bemade. Sampling was concentrated in those areas of the down-stream shell which were symmetrically opposite to the areas ofthe upstream shell which failed in 1971.
The exploration program consisted of six standard pene-tration test borings, twelve cone penetration test soundings,six undisturbed sample borings, and one 6-foot-diameter/85-foot deep exploration shaft to obtain undisturbed samples,perform in situ density tests, and map the sidewalls of theshaft. Undisturbed samples were distributed among GEI, WES,and H. B. Seed.
A prefailure cross section of the dam is shown in Fig. 2,and a cross section of the dam during the 1985 explorationprogram is shown in Fig. 4.
The exploration program on the downstream side revealed arelatively loose very silty fine sand layer about 15 feetthick at the base of the hydraulic fill shell. This finding
iii

is consistent with field observations in trenches and boringsmade on the upstream side of the dam soon after the 1971failure (Seed, 1973) which showed that the slide occurredthrough a zone of soil at the base of the upstream hydraulicfill shell. Observations in 1971 indicated that very largestrains occurred in this zone.
Construction records of the dam indicate that the sameborrow areas and similar construction methods were used forboth the upstream and downstream shells, and, therefore, weassumed in our analyses that the upstream and downstreamhydraulic fill shells were similar in composition. The15-foot-thick layer of soil found at the base of the down-stream shell is the critical layer of the dam from a lique-faction standpoint, and our liquefaction analyses focused onthis layer.
Our liquefaction analyses were divided into an evaluationof the liquefaction susceptibility of the upstream and down-stream slopes of the dam and an evaluation of the potentialfor earthquake loading to trigger a liquefaction failure (flowslide).
Liquefaction Susceptibility
The void ratio of the critical layer in the downstreamshell was measured using three methods: fixed piston samplingin boreholes, hand carved "tripod" tube sampling in a deepexploration shaft, and field density testing using sand conetechniques in the exploration shaft. All three methodsresulted in similar measurements of in situ void ratio withinthe normal scatter expected for a hydraulic fill. Therefore,both the fixed piston samples from boreholes and the tripodtube samples from the exploration shaft were found to beappropriate for measuring in situ void ratio for the liquefac-tion analyses as well as for performing laboratory tests toobtain undrained steady state strengths.
The steady state line of a batch mix of the criticallayer soil was determined using various testing methods and byfour separate laboratories. The various testing methodsconfirmed that the steady state line is not a function of thefollowing:
initial structure, i.e., method of samplepreparation.
initial state, i.e., consolidation stress° stress path, i.e., test type
iv
In general, the steady state lines determined by each of thefour laboratories were in remarkable agreement.
The in situ steady state strengths of samples from thedownstream critical layer prior to the 1971 failure wereestimated on the basis of measured values of S,. in the labor-atory and, using the steady state line, corrections for voidratio changes which took place between 1971 and the time oflaboratory testing. In situ void ratio changes which tookplace between 1971 and 1985 were estimated using lateralmovement and settlement measurements of the downstream slopemade by th'e Los Angeles Department of Water and Power(LADWP). Void ratio changes which took place between the timeof 1985 sampling and laboratory testing were based on directmeasurements of sample volume changes.
The in situ steady state strength of the upstream criti-cal layer was determined on the basis of estimated void ratiodifferences between the upstream and downstream layers. Thesedifferences were due to prolonged submergence of the upstreamslope and additional load on the downstream slope from berms.
Based on the results of 23 tests performed on undisturbedsamples by GEI and Stanford University laboratories, a repre-sentative value of the undrained steady state strength of theupstream critical layer was estimated to be about 0.26 tsfjust prior to the 1971 failure. The representative strengthwas selected to be the highest value that is lower than two-thirds of the mearured values (approximately equal to theaverage minus one-half of the standard deviation). Otherreasonable selections of a representative strength wouldindicate values of 0.26 + 0.05. The static driving shearstress prior to the failure in the critical layer on theupstream side of the dam was computed to be about 0.48 tsf.Therefore, the factor of safety of the upstream slope againstliquefaction susceptibility was about 0.54. Thus, even thoughthe upstream slope was stable under drained conditions, the1971 earthquake caused sufficient strains to trigger anundrained liquefaction (flow) slide.
The in situ steady state strength of the downstreamcritical layer was estimated to be about 0.33 tsf just priorto the 1971 failure. The static driving shear stress in thecritical layer on the downstream side of the dam was computedto be about 0.33 tsf prior to the upstream slide and about0.22 tsf immediately after the slide. Therefore, the factorof safety of the downstream slope against liquefaction suscep-tibility was about 1.0 and 1.5 prior to and immediately afterthe upstream slide, respectively. The 1971 earthquake causedhigh pore pressures and slight deformations in the downstream
V

slope, but the earthquake did not cause the slope to undergo a
flow slide.
Triggering of Liquefaction
The triggering analysis for the Lower San Fernando Damincluded three steps, namely, a) determination of the trigger-ing strain for the critical soil layer, b) estimation of thestrains induced by the 1971 earthquake and other previousearthquakes, and c) comparison of the strains in a) and b) todetermine whether the r3sults are consistent with the observedbehavior.
An accumulated undrained shear strain of about 1.5% inthe critical layer of the upstream slope is sufficient tolower the shear resistance of the layer to the driving shearstress and trigger the flow slide. If a smaller shear strainof about 0.5% is reached, the soil creeps under the drivingshear stress until the failure is triggered at a strain ofabout 1.5%.
Based on our triggering analysis, an earthquake with amaximum base rock acceleration of about 0.15 g and time recordsimilar to the 1971 earthquake would be sufficient to triggera liquefaction flow slide of the upstream slope. The maximumbase rock acceleration at the damsite during the 1971 earth-quake was about 0.55 to 0.6 g. Therefore, the 1971 earthquakewas much larger than necessary to trigger the failure.
Based on our analyses of the earthquake history of thedamsite, earthquake shaking at the damsite from everts priorto the 1971 earthquake did not exceed peak accelerations ofabout 0.1 g, and thus could not trigger a flow slide of theupstream slope of the dam.
Deformation measurements of the surface of the downstreamslope made by the LADWP after the 1971 earthquake indicatethat shear strains in the critical layer of the downstreamhydraulic fill shell were about 2 to 3%, and thus the shearresistance of the critical layer was probably reduced tovalues close to the undrained steady state strength. However,creep leading to failure of the downstream slope did notoccur. This is consistent with the fact that the downstreamslope was not susceptible to a liquefaction failure once theupstream slope had failed. However, limited shear deforma-tions and volume changes did develop which were reflected inlateral and vertical movements of the surface of the downs-tream slope of the dam.
The contrasting behavior between the upstream and down-stream sections of the dam clearly illustrates the importance
vi

of the relationship between driving shear stress rd andundrained steady state strength Su,. If rd exceeds S,, as inthe upstream slope, a major flow (liquefaction) slide canoccur. If rd is lower than Su, as in the downstream slope, theearthquake can produce increases in pore pressures and limiteddeformations, but a flow slide cannot occur regardless of theintensity of shaking.
vii

CONTENTS
VOLUME I Page
PREFACE i
EXECUTIVE SUMMARY iii
LIST OF TABLES x
LIST OF FIGURES xi
LIST OF APPENDIXES xiii
CONVERSION FACTORS, NON-SI TO SI (METRIC) UNITS OFMEASUREMENT xiv
1. Introduction 1
1.1 Purpose 1
1.2 Scope of Work 1
1.3 Authorization 2
1.4 Project Personnel 3
1.5 Acknowledgments 3
2. Historical Background 4
2.1 Construction of Dam 42.2 Slide in 1971 5
2.3 Reconstruction of the Dam 6
3. SUBSURFACE CONDITIONS IN 1985 7
3.1 General 73.2 Blowcount Profiles 7
3.3 Hydraulic Fill Shell 9
4. Susceptibility of Dam to Liquefaction Flow Slide 13
4.1 Analytical Approach 13
4.2 Determination of In situ Void Radios of
Critical Layer 15
4.2.1 In Situ Void Ratios of Critical
Layer in 1985 154.2.2 In Situ Void Ratios of Critical
Layer Prior to Failure 18
4.3 Determination of Slope of Steady State Line 18
4.4 Determinati n of Sus for UndisturbedSpecimens of Critical Layer 21
4.5 Correction of Measured Sus to 1971
In Situ Void Ratio 22
viii

CONTENTS (Contd.)
Page
4.5.1 Correction Method 22
4.5.2 Selection of Sus for Analysis 22
4.6 Calculation of In Situ Driving Shear Stressand the Factor of Safety 25
4.6.1 In Situ Driving Shear Stress 25
4.6.2 Factor of Safety Against Liquefaction 26
4.7 Liquefaction Susceptibility Through UpperZones of the Hydraulic Fill 27
4.8 Conclusions 28
5. Earthquake Required to Trigger LiquefactionFailure 30
5.1 Introduction 30
5.2 Strain Required to Trigger Flow Slide 30
5.2.1 Monotonic Tests 31
5.2.2 Cyclic Load/Creep Tests 33
5.3 In situ Strains Induced by Earthquake Loading 33
5.4 Determination of Yield Acceleration, ky 34
5.5 Analyses to Define Time Histories ofAcceleration 35
5.6 Critical Layer Strains During Earthquake Loading 35
5.7 Failure Mechanism--1971 Flow Slide 36
5.8 Earthquake History of the Dam 40
5.9 Comments on Methodology for Triggering Analysis 41
6. CONCLUSIONS 43
REFERENCES 47
NOTATIONS 51
TABLES
FIGURES
VOLUME 2
APPENDIXES A THROUGH F
ix

LIST OF TABLES
1 - Summary of Void Ratio and Steady State Strength Data -Samples from Zone 5 of Hydraulic Fill - GEl Test Data
2 - Summary of Void Ratio and Steady State Strength DataSamples from Zone 5 of Hydraulic FillStanford University Test Data
3 - Void Ratio Corrections Applied to Critical Layer TubeSamples
4 - Number of Tests Performed to Define Steady State Line ofCritical Layer Soil
5 - Summary of Liquefaction Susceptibility Analyses ofHydraulic Fill Zones 2 and 3
6 - Summary of Most Significant Earthquakes in theSan Fernando Valley Area
| | x

LIST OF FIGURES
1 - Site Location Map
2 - Cross Section Through Lower San Fernando Dam -Prefailure Geometry
3 - Cross Section After 1971 Earthquake & ReconstructedCross Section
4 - Cross Section Through Lower San Fernando Dam -1985 Geometry
5 - 1985 Boring Location Plan
6 - Cross Section at Station 16+40 Showing N-values
7 - Cross Section at Station 9+35 Showing N-values
8 - Cross Section at Station 5+85 Showing N-values
9 - Hydraulic Fill Zones at Location 111
10 - Hydraulic Fill Zones at Location 103
11 - Grain Size Curves - Hydraulic Fill Zone 5 Samples
12 - Flow Chart for Evaluating Liquefaction Susceptibility ofCritical Layer
13 - Coefficient of Swelling Vs. Initial Void Ratio
14 - 1985 In situ Void Ratios of Critical Layer Vs. Depth
15 - Steady State Line - Batch Mix 7 - GEl Test Results
16- Steady State Line - Batch Mix 7 - Test Results fromFour Laboratories
17 - Steady State Diagram - Critical Layer Soils
18 - 1971 in situ Steady State Strengths of Upstream CriticalLayer Soils Vs. Elevation
19 - 1971 In situ Steady State Strength of Downstream CriticalLayer Soils Vs. Elevation
20 - Schematic Stress Strain Curve for Liquefaction Failure
xi

LIST OF FIGURES(concluded)
21 - Flow Chart for Evaluating Potential to TriggerLiquefaction Failure
22 - Stress Strain Curves of Anisotropically Consolidated
Samples of Batch Mix 7
23 - Stress Paths of Critical Layer Soils
24 - Creep Rate Vs. Cumulative Axial Strain - Batch Mix 7
25 - Computed Shear Strains in Critical Layer Vs. MaximumBase Rock Acceleration
26 - Qualitative Driving & Resisting Forces at Initiation ofSlide
27 - Ranges of Maximum Accelerations in Rock
xii

LIST OF APPENDIXES
A - Subsurface Exploration Program
B - Exploration Shaft
C - In situ Void Ratio Changes of Critical Layer
D - Static and Pseudostatic Stability Analyses
E - Shake Analyses
F - Laboratory Testing Program
xiii

CONVERSION FACTORS, NON-SI TO SI (METRIC) UNITS OF MEASUREMENT
Non-SI units of measurement used in this report may be converted to metric
(SI) units as follows:
Multiply By To Obtain
cubic feet 0.02831685 cubic metres
inches 2.54 centimetres
pounds (force) 4.448222 newtons
pounds (force) per 6.894757 kilopascalssquare inch
square inches 6.4516 square centimetres
xiv
1. INTRODUCTION
1.1 Purpose
The Lower San Fernando Dam in California developed amajor slide in the upstream slope and crest as a result of the1971 San Fernando earthquake. The liquefaction slide nearlycaused a major uncontrolled release of the reservoir. Becauseof the magnitude of the slide and strong interest of theengineering profession in the evaluation of the seismicstability of earth dams, the Lower San Fernando Dam slide hasreceived considerable attention beginning with detailedstudies immediately following the slide (Seed et al, 1973).The purpose of our re-evaluation was to test the validity ofusing steady state concepts and methodology to perform lique-faction analyses of the dam and to further investigate someaspects of the physical mechanism of the slide that had notbeen explained by the results of prior investigations (Castroet al, 1985). This work was sponsored by the Army Corps ofEngineers Waterways Experiment Station (WES).
1.2 Scope of Work
The scope of work included the following:
1. Review available historical records and past reportsabout the dam that are pertinent to understanding theslide.
2. Perform a field exploration program at the dam,including:
a. One deep exploration shaft, 6 feet in diameterand 85 feet deep, to obtain undisturbed samples,measure in situ density, and map sidewalls of theexcavation.
b. Six standard penetration test borings.
c. Twelve cone penetration test soundings.
d. Six fixed-piston undisturbed sample borings.
e. Two groundwater observation wells.
3. Perform a laboratory testing program on samplesobtained from the dam, including:

a. Index tests:
7 specific gravity7 compaction1 Atterberg Limit1 mineralogic analyses
38 gradation
b. Triaxial tests on undisturbed samples:
20 monotonically loaded5 cyclically loaded
c. Triaxial tests on remolded samples:
21 monotonically loaded11 cyclically loaded
d. Vane shear test on one clay sample.
4. Perform analyses of the dam using steady statestrength concepts to determine its susceptibility toa liquefaction flow slide and to determine theearthquake shaking required to trigger a liquefactionfailure.
5. Attend meetings to discuss our findings and those ofother investigators.
6. Prepare this report.
1.3 Authorization
This work was authorized by the U.S. Army Corps ofEngineers Waterways Experiment Station, Corps of EngineersContract No. DACW39-85-C-0058, effective May 13, 1985.Dr. A. G. Franklin of WES was the technical contact for theGEI contract. WES also contracted with Professors H. B. Seedand R. Dobry to carry out investigations of the Lower SanFernando Dam slide. Samples obtained by GEI were provided toWES and Professors Seed and Dobry for their investigations.Meetings were held during the course of the work to exchangeresults obtained by the various organizations. This reportcontains only the results of GEI investigations unless notedotherwise.
2

1.4 Project Personnel
The following key personnel at GEI were responsible forcarrying out the work on this project:
Principal-in-Charge: Gonzalo Castro
Project Manager: Thomas 0. Keller
Project Engineers: Stephen S. BoyntonJay R. PerkinsKathryn D. AyanR. Lee WootenPaul G. Costello
In-House Consultant: Steve J. Poulos
1.5 Acknowledgments
The borings were performed by WES personnel and equip-ment, and the cone soundings were performed by the EarthTechnology Corporation. Joseph Gatz coordinated the drillingprogram for WES and Frank Stewart performed the drilling andsampling. Zamborelli Drilling advanced the explorationshaft. The field work was performed under the technicaldirection of GEI.
The State of California Department of Water Resourcesprovided information on the dam from their files. The LosAngeles Department of Water and Power (LADWP) provided supportto conduct the field work and extensive data on the construc-tion and past performance of the dam. The willingness ofMessrs. S. Matsuda, W. Wu, R. Bruce, A. Rudisill, Ms. C.Trehuba and others of LADWP to assist in the investigation andtheir responses to our numerous requests for information isgreatly appreciated.
3

2. HISTORICAL BACKGROUND
2.1 Construction of Dam
The Lower San Fernando Dam is located in San Fernando,California (Fig. 1). A cross section through the Lower SanFernando Dam showing the major sections of the embankmentprior to the 1971 failure is shown in Fig. 2. All elevationsin this report refer to National Geodetic Vertical Datum(NGVD). A general description of the dam construction ispresented by Seed et al (1973) and a brief overview is givenbelow.
Embankment construction was started in 1912. The embank-ment was founded on an alluvium foundation consisting pri-marily of stiff clay with lenses of sand and gravel. Olddrawings of the dam show three, clay-filled cutoff trenchesextending through the alluvium to bedrock.
The majority of the embankment consists of hydraulic fillplaced between 1912 and 1915. This material was sluiced fromthe floor of the reservoir and discharged from starter dikesoAi the upstream and downstream edges of the embankment. Theactual dimensions of the starter dikes are unknown, andtherefore, the dimensions shown in Fig. 2 are estimates basedon typical hydraulic fill construction practice. Thehydraulic fill process resulted in upstream and downstreamshells consisting of sands and silts and a central coreconsisting of clayey soil.
Construction photos of the hydraulic fill placementcontained in historical records and past reports indicate thatthe upstream and downstream sections were raised symmetricallyand constructed in a similar manner. Therefore, it is reason-able to assume that the general layering of the upstreamhydraulic fill shell is similar to that of the downstreamhydraulic fill shell.
A 10- to 15-foot-thick hydraulic fill layer consisting of"ground-up" shale from the left abutment was placed in 1916over the hydraulic fill described above. Records indicatethat the maximum size of the ground shale was about 3 inches.Limited 1985 sampling of the ground shale zone disclosed awidely graded sand and silty sand.
The embankment was raised a number of times between 1916and 1930 by placement of rolled fills. The maximum height ofthe embankment of about 135 feet was reached in 1930. A thinblanket was placed on the lower part of the downstream slope
4

in 1929 and 1930 apparently for seepage control and to provideadditional stability due to the raising of the crest. Thecomposition of the blanket was described in a post-constructionreport as a mixture of shale and gravelly material placed in12-inch layers and compacted by trucks.
The final addition to the dam was a 4.5H:lV berm placedon the downstream slope in 1940. Construction records relatedto the composition of the berm could not be found, but it hasbeen described in a previous report (Baumann et al, 1966) as arolled fill. A photograph of the construction operation showsa roller traveling on the fill.
2.2 Slide in 1971
A major slide of the upstream slope and crest of theLower San Fernando Dam occurred within about a minute afterthe February 9, 1971 San Fernando earthquake. An investiga-tion of the slide was performed and reported by Seed et al,1973, Seed et al, 1975a; Seed et al, 1975b; and Lee et al,1975. The field investigation showed that the liquefactionslide occurred through the lower part of the upstream hydrau-lic fill shell. Seed et al, 1973 presented three recon-structed cross sections of failed portions of the dam based onthe results of a trench made through the slide area, boringdata, and surficial mapping. All three cross sections indi-cated that the "liquefied" zone was a triangular area with itsbase at or near the bottom of the hydraulic fill. One ofthese reconstructed cross sections is presented in Fig. 3.The upper part of Fig. 3 shows that large blocks of essential-ly intact soil from the upstream section of the dam moved intothe reservoir, riding over the liquefied soil. After movementstopped, the liquefied soil was found to have extruded up-wards, between the intact blocks, and to have flowed as far as250 feet from the toe of the dam. The block of soil whichcontained the toe of the dam moved about 150 feet into thereservoir.
Seismoscopes located on the bedrock abutment and crest ofthe dam were analyzed to determine earthquake motions at thesite. Earthquake motions recorded in the abutment seismoscopehad a peak acceleration of about 0.55 to 0.6 g (Seed et al,1973). Interpretation of the seismoscope on the crest indi-cated peak accelerations of the crest of about 0.55 g (Seed etal, 1973). The seismoscope record from the crest was analyzed(Seed, 1979) to obtain the following time history of theembankment motion:
5

Time
0 Start of main shock of earthquake
-14 sec Strong motion of earthquake completed -slight tilting of dam crest
-40 sec Start of slide movement at crest of dam
-90 sec End of main slide movement
The slide movements of the crest started about 26 secondsafter the earthquake shaking stopped and the slide durationwas about 50 seconds. Thus the large slide movements devel-oped in the absence of earthquake loads and were driven onlyby the static stresses from the weight of the materials in theembankment.
The downstream shell of the embankment developed settle-ments and horizontal displacements of up to about one foot butremained essentially intact after the earthquake.
2.3 Reconstruction of the Dam
The dam was reconstructed in 1975 to act as a backup damto a new dam constructed in the reservoir area. Water has notbeen impounded behind the Lower San Fernando Dam since the1971 failure.
A cross section of the embankment in its 1985 configura-tion is shown in Fig. 4. A large excavation on the upstreamside of the dam was made in 1974-1975 to replace a portion ofthe slide debris with compacted earth backfill. The new crestwas placed at a lower elevation, and the center of the newcrest is downstream of the original centerline of the dam.
A plan view of the dam showing its 1985 geometry is shownin Fig. 5. The portion of the upstream slope involved in themost catastrophic sliding was located approximately betweenStations 2+00 and 14+00.
6

3. SUBSURFACE CONDITIONS IN 1985
3.1 General
A field exploration program was conducted at the dam sitebetween September 9 and December 20, 1985. The main purposeof the exploration program was to characterize and obtainundisturbed samples of the intact downstream section of thedam. The test results for the downstream section were usedfor analysis of the failed upstream section. Sampling wasconcentrated in those areas of the downstream shell that weresymmetrically opposite to the areas of the upstream shellwhich failed in 1971.
The exploration program consisted of the following:
a. Six standard penetration test (SPT) borings and12 cone penetration test (CPT) soundings along fourcross sections to define the character of the mate-rials in the dam.
b. Undisturbed sample borings adjacent to five selectedSPT/CPT locations.
c. One deep exploration shaft located adjacent to anSPT/CPT location to obtain undisturbed samples,perform in situ density tests, and map the sidewallsof the shaft.
A plan view showing SPT, CPT, and exploration shaftlocations is presented in Fig. 5. Explorations were conductedat 12 locations at the dam site. The borings and soundingswere numbered according to the location numbers shown inFig. 5. The exploration shaft was performed at Location 111.
Details of the borings and exploration shaft are pre-sented in Appendices A and B, respectively. Details of conepenetration test soundings are presented in a report by EarthTechnology Corporation (1985).
3.2 Blowcount Profiles
SPT borings were performed at six locations as shown inFig. 5. Borings S103 and Sll1 were located at the approximatecenter of the downstream hydraulic fill shell. Boring S105was located near the center of the clayey core and BoringsS101 and S104 were located in a transition zone between thecore and the shell. Boring S102 was performed just upstreamof the clayey core in a location where upstream slide move-ments in 1971 were limited.
7

Cross sections of the dam showing standard penetrationtest values (N-values) from the 1985 borings are presented inFigs. 6, 7, and 8. These cross sections also show the ap-proximate limits of the zones of the dam depicted in Fiq. 4.Groundwater levels in 1985 were located just above the base ofthe hydraulic fill as shown in Figs. 7 and 8.
The "dense fill" shown in the SPT cross sections repre-sents the rolled fill and ground shale hydraulic fill layer.These layers could not be differentiated on the basis of soildescription, SPT, or CPT data. The best samples of what arepresumed to be the ground shale layer (on the basis of con-struction elevations) were obtained in Boring S102 betweenEls. 1078 and 1095. Samples of the ground shale in thisboring consisted of dense widely graded sand and dense siltysand with N-values ranging from 33 to 60 blows/foot.
Continuous split-spoon samples of the "clayey core" wereobtained in Boring S105. The core was predominantly a siltyclay; however, about 20% of the core consisted of sandy soilsfound in layers ranging from about 1 to 30 inches thick. Therelatively high N-values in Boring S105 at elevations of about1026 and 1052 are in sandy zones of the core. Blowcounts inclayey zones were typically 8 blows/foot near the top of thecore and increased to about 18 blows/foot near the base of thecore.
The transition between the clayey core and the sandyshell is typified by Boring S104. The soil profile in thisboring consisted of about 70% sandy layers and 30% clayeylayers.
The hydraulic fill at the locations of Borings S103 andS111 consisted of sand and silt with virtually no claylayers. The hydraulic fill at these locations was dividedinto five zones, as shown in Figs. 7 and 8. These zones aredescribed in Section 3.3.
All SPT borings penetrated the alluvium foundation layerof the dam. The alluvium consisted of stift clay with lensesof dense sandy material.
Borings were performed through the Lower San Fernando Damin 1966 (Suzuki, 1966) and 1967 (Mayeda et al, 1909). The1966 program consisted of three borings performed through theclayey core of the dam. The 1967 program consisLed of threeborings performed primarily through the clayey core and oneboring (CH67-A) performed through the downstream shell.Boring CH67-A was located on the downstream berm road atStation 11+82, 149 feet south of the dam centerline. Sixsplit-spoon samples of the hydraulic fill portion of the damwere obtained in Boring CH67-A.
Si

Nineteen SPT borings were performed by the CaliforniaDepartment of Water Resources immediately after the 1971failure (Seed et al, 1973).
The blowcounts of the sandy shell and core obtained inthe 1985 borings are within the scatter of the blowcountsmeasured in these layers during the 1966, 1967, and 1971boring investigations.
3.3 Hydraulic Fill Shell
The general character of the hydraulic fill as foundunder the downstream berm road is described in this section.At this location the hydraulic fill represents the mirrorimage of a section of the upstream hydraulic fill shell whichfailed in 1971 (see Fig. 3).
Location 111
Location 111 is located on the berm road at Sta 5+85.The subsurface explorations at this location were: SPT BoringSIll, CPT Sounding CII, Undisturbed Sample Borings U111 andUIIIA, and the Exploration Shaft. Split-spoon samples weretaken continuously through the hydraulic fill in Boring S111.
The hydraulic fill at Location 111 has been divided intofive zones on the basis of 1985 N-values and descriptions ofsplit-spoon samples. These zones, together with N-values andCPT tip resistance values, are shown in Fig. 9. This figurealso shows the three locations in the exploration shaft wheresampling and wall mapping was performed.
The five zones in Fig. 9 were more easily identified byN-values trends than by CPT tip resistance trends. The CPTtip resistance profile (based on average CPT values) generallymirrors the SPT profile but does not provide a good demarca-tion between zones. Therefore, SPT data and soil descriptionswere used as the primary means to identify zonation within thehydraulic fill shell.
Each zone was stratified in "macro" layers with typicalthicknesses ranging from about 6 to 15 inches. An example ofmacro layering is shown in Fig. B5, a photograph of theexploration shaft wall. Undisturbed samples and wall mappingof the exploration shaft revealed that almost all of these
9

"macro" layers were intensely stratified by "micro" layers.The micro layers varied significantly in thickness but weretypically about 0.05 to 0.20 inches thick. An example ofmicro layering is shown in Fig. B6.
A general description of each zone of the hydraulic fillidentified in Fig. 9 is presented below.
Zone 1 - This zone, approximately 20 feet thick, con-sisted primarily of stratified narrowly graded to widelygraded sands and silty sands. Thin clay lenses were found onoccasion, but their combined thickness was only about6 inches. Blowcounts ranged from 14 to 34 blows/foot, with atypical value of 20 blows/foot. Approximately 30 macro layerchanges were observed in the continuous split-spoon sampleboring indicating an average layer thickness of about 8inches. CPT tip resistance values in this zone also indicatedabout 30 macro layer changes based on the number of spikes inthe record.
Zone 2 - This zone, approximately 15 feet thick, wascharacterized by the presence of sandy silt layers in additionto stratified sands and silty sands. Occasional thin claylayers were observed in this zone. Blowcounts ranged from 14to 21 blows/foot, with a typical value of 17 blows/foot.Approximately 30 macro layer changes were observed in split-spoon samples which was consistent with the number of spikesin the CPT tip resistance record. The average macro layerthickness in this zone was about 6 inches. A photograph of a3.4-foot thickness of this zone taken in the exploration shaftis shown in Fig. B5 (Appendix B). The soil layering observedin the exploration shaft was consistent with layering shown bySPT borings and CPT soundings.
Zone 3 - This zone, approximately 12 feet thick, con-sisted primarily of stratified sands and silty sands. Onaverage, the sands in this zone were somewhat cleaner than inzones above. Blowcounts ranged from 22 to 35 blows/foot witha typical value of 28 blows/foot. This zone was somewhat lessstratified than the zones above. About six macro layerchanges were observed in split-spoon samples and about tenlayer changes were indicated by the CPT tip resistancerecord. The average macro layer thickness in this zoneindicated by SPT and CPT data was about 15 inches. A photo-graph of a 3-foot thickness of this zone is shown in Fig. B6.This photograph clearly shows the intense stratification(micro layers) within each of the macro layers.
Zone 4 - This zone, about 5 feet thick, consisted pri-marily of dense, widely graded stratified silty sand. Blow-counts in this zone were typically greater than 40 blows/
10

foot. Macro layer thicknesses in this zone were similar tothat of Zone 3.
Zone 5 - This zone, approximately 15 feet thick, con-sisted primarily of stratified silty fine sands and sandysilts. This zone was critical from the standpoint of theliquefaction failure. Blowcounts in this zone ranged from 11to 28 blows/foot, with a typical value of 18 blows/foot.Approximately 15 to 20 macro layers were identified in split-spoon samples of this zone, and the CPT tip resistance recordindicated a comparable to slightly greater number of macrolayers. In general, macro layers in this zone were typically9 to 12 inches thick.
A photograph of a 2.3-foot thickness of this zone isshown in Fig. B7. Micro layers are extensive in this zone butare not obvious in Fig. B7 because sufficient time was notavailable for drying of the shaft wall to highlight thestratification. Grain size curves of undisturbed samples fromthis zone are shown in Fig. 11. The dashed line in Fig. 11 isthe gradation of a mixture of bag samples (Batch Mix 7) takenfrom Zone 5 of the exploration shaft. Batch Mix 7 had aliquid limit of 24 and plasticity index of 4.
Groundwater level was encountered in this zone, atEl. 1012.4. Note that no water was impounded behind the damat the time of the groundwater level reading in October 1985.
Location 103
Location 103 is located on the berm road at Sta 9+35which is 350 feet west of Location 111. The following subsur-face explorations were conducted at Location 103: SPT BoringS103, CPT Sounding C103, and Undisturbed Sample Boring U103.Split-spoon samples were taken continuously through thehydraulic fill in Boring S103. The five zones identified atLocation 111 also existed at Location 103. The five zones atLocation 103, together with N-values and CPT tip resistancevalues, are shown in Fig. 10. The trends of blowcounts andsoil layering are similar in S103 and S1ll. The CPT tipresistance trends in C103 generally mirror the N-value trendsin S103.
Discussion. - The main factors which support our assump-tion that the upstream and downstream hydraulic fill shellswere symmetrical are:
a. The material source for both shells was the same,i.e., the floor of the reservoir.
11

b. Construction photos indicate that the hydraulic fillwas raised symmetrically and that placement techni-ques were similar for both shells.
c. Two SPT borings performed through the downstreamshell (S103 and Sll) and located about 350 feetapart indicated similar zonation in the east-westdirection of the dam (parallel to dam centerline).
d. As will be shown in later sections of the report,in situ void ratios and steady state shear strengthsof Zone 5 soils at Locations 103 and 111 were sim-ilar.
Zone 5 was considered to be the most critical zone of thedam from a liquefaction standpoint for the following reasons:
a. Zone 5 is located at approximately the sameelevation as the zone which experienced largestrains during the 1971 failure, i.e., the zoneat or near the base of the hydraulic fill shell.
b. The static shear stresses available to drive aflow slide are greatest at the base of thehydraulic fill compared to upper parts of thehydraulic fill.
c. N-values in Zone 5 are generally lower thanN-values at higher elevations in the hydraulicfill, especially when corrected for overburdenpressure. Therefore, Zone 5 would be expected tohave somewhat lower strength than the otherzones.
d. Most of the failure surface for the 1971 lique-faction flow slide was within Zone 5.
Consequently, the remainder of our evaluation of the 1971slide is concentrated on Zone 5. In the following sections ofour report, Zone 5 is used synonymously with the phrase"critical layer."
12

4. SUSCEPTIBILITY OF DAM TO LIQUEFACTION FLOW SLIDE
4.1 Analytical Approach
A procedure for evaluating the susceptibility of anembankment, or any soil mass, to a liquefaction failure ispresented by Poulos, Castro, and France (1985). Liquefactionsusceptibility is determined by performing a stability ana-lyses which requires that the undrained steady state shearstrength and the shear stress in situ be determined. Theterms "liquefaction" and "steady state" are defined as fol-lows:
Liquefaction - a phenomenon of instability wherein theshear resistance of a mass of soil decreases and becomeslower than the applied shear stress when subjected tomonotonic, cyclic, or dynamic loading at constantvolume. The mass undergoes very large unidirectionalshear strains - it appears to flow - until the appliedshear stresses are as low or lower than the reduced shearresistance.
Steady State - a state of deformation of any mass ofparticles in which the mass is continuously deforming ata constant volume, constant normal effective stress,constant shear stress, and constant rate of shearstrain. The steady state strength is the shear strengthof the mass when deforming under steady state conditions.
Note that the definition of liquefaction refers to astability failure of a soil mass rather than to the behaviorof a specific soil element. Liquefaction susceptibilitydepends on the strength of all soils along the potentialfailure surface. Zones of loose (contractive) soils arecritical to analyzing liquefaction susceptibility because onlyloose soils can have an undrained strength that is signifi-cantly lower than their drained strength. Thus only loosesoils have the potential to lose strength when earthquake orother rapid loading changes the condition from drained toundrained. A liquefaction failure can occur if, and only if,the strength loss in the loose zone(s) is large enough torender the mass unstable. When a liquefaction failure occurs,the reduced strength need not be zero, and conversely, even avery low reduced strength may not lead to a liquefactionfailure if other zones are strong enough to prevent a loss ofstability.
The primary steps in the stability analyses for deter-mining the liquefaction susceptibility of a soil mass are asfollows:
13

1. Determine in situ undrained steady state shear
strength.
- Determine in situ void ratio (prefailure).
- Determine slope of steady state line from a plotof steady state void ratio vs. effective stressduring steady state deformation.
- Determine undrained steady state strengths for"undisturbed" specimens.
- Correct measured undrained steady state strengthsto in situ void ratio using the slope ot thesteady state line.
2. Calculate in situ driving shear stress along thefailure surface using conventional procedures forstability analysis.
3. Calculate factor of safety against liquefactionsusceptibility, FL as the ratio of driving shearstress to the undrained steady state shear strength.If the driving shear stress is less than the steadystate strength (FL <1), then the soil mass is suscep-tible to liquefaction.
The steps in the procedure listed above were followed inour re-evaluation of the Lower San Fernando Dam to determineif the procedure would predict that the upstream slope of thedam was susceptible to a liquefaction flow slide prior to theearthquake that caused the slide. The layer at the base ofthe hydraulic fill shell of the dam, Zone 5, was judged to bethe most critical from a liquefaction standpoint. Therefore,the soils in this critical layer are the focus of our lique-faction evaluation.
A soil mass which is susceptible to liquefaction (un-stable) will only experience a liquefaction failure when asufficiently large triggering event, such as an earthquake,causes the strength of the soil to decrease to its undrainedsteady state strength. In the case of the Lower San FernandoDam, the triggering event was an earthquake. A discussion ofthe earthquake required to trigger the 1971 flow slide of theLo%_r San Fernando Dam is presented in Section 5.
A flow chart for evaluating the liquefaction suscepti-bility of the Lower San Fernando Dam is presented in Fig 12.The primary steps in the procedure are shown on the right sideof the flow chart, and ancillary steps for this particularproject are shown on the left side. In the following sectionseach step of the procedure is described.
14

Data from laboratory tests on critical layer soils per-formed at Stanford University (Seed, R. B. et al, 1987), Corpsof Engineers Waterways Experiment Station (WES, 1987), andRensselaer Polytechnic Institute (Vasquez-Herrera et al, 1988)have been incorporated into this report. Data from theseorganizations were used to expand the data base for criticallayer soils and to allow comparisons to be made between thetest results of various organizations.
4.2 Determination of In situ Void Ratios of Critical Layer
The in situ void ratio of the critical layer on theupstream side of the dam just prior to the 1971 failure isrequired to perform the liquefaction susceptibility analysis.In situ void ratios of the critical layer on the downstreamside of the dam were determined from samples and tests per-formed in 1985 (in situ e1985). The in situ void ratios of thedownstream critical layer just prior to the 1971 failure(in situ e19 1 ) were determined by correcting the 1985 in situvoid ratios for volume changes which took place between 1971and 1985. In situ void ratios of the upstream critical layerwere determined on the basis of estimated void ratio differ-ences between the upstream and downstream layers. In thefollowing sections we present our determinations of in situe198 5 and e 19 71 .
4.2.1 In situ Void Ratios of Critical Layer in 1985
In situ void ratios of the critical layer on thedownstream side of the dam were determined using threemethods: fixed-piston sampling in boreholes, and"tripod" tube sampling and field density testing in theexploration shaft.
Fixed-Piston Sampling - Undisturbed samples of thecritical layer were obtained from borings using aHvorslev-type fixed-piston sampler. Carefulmeasurements of sampler penetration and soilrecovery were made to document soil volume changeswhich may have occurred during sampling. Fixed-piston sampling procedures are described inAppendix A, Poulos et al, 1985, and Keller, 1981.
Tripod Tube Sampling - Undisturbed samples of thecritical layer were obtained from the floor of theexploration shaft using a tripod sampler developedby GEI. The tripod sampling procedure isdescribed in Appendix B and Marcuson et al, 1980.The procedure involves advancing a tube into thesoil in increments using hand carving techniques,such that any length changes during carving can be
15

measured. The tube alignment is maintainedvertical by a tripod frame (Fig. B1).
Field Density Testing - Void ratios of the criti-cal layer were determined by field density testsusing the sand cone technique (ASTM D1556). Thesetests were performed at the floor of the explora-tion shaft, adjacent to the tripod tube samplinglocations. Field density test procedures aredescribed in Appendix B.
Appropriate corrections were made to the measuredvoid ratios to obtain 1985 in situ void ratios. Correc-tions were made for the volume changes (AV) which oc-curred during tube sampling and for swelling of soilsprior to sampling caused by unloading at the base of theexploration shaft. The following types of correctionswere made for the various void ratio determinationmethods:
Void Ratio Correction
AV During Sampling AV due to SwellDuring ShaftExcavation
Fixed-Piston Samples Yes No
Tripod Tube Samples Yes Yes
Field Density Tests No Yes
The soil length of fixed-piston and tripod tubesamples were measured at GEI's laboratory in Winchester,Massachusetts. No changes in length of these samplestook place during transportation or tube cutting, andtherefore, no void ratio corrections were necessary forthese effects.
A summary of all void ratio measurements in thecritical layer soils is presented in Tables 1 and 2.Data used to compute void ratio corrections for volumechanges which occurred during tube sampling are presentedin Table A2 (Appendix A) and Table B1 (Appendix B). Asshown by Tables , id 2, a large number of tube sampleshad only very small void ratio corrections for volumechanges during sampling.
Void ratio corrections for swelling at the base ofthe exploration shaft were estimated using data fromtriaxial swelling tests performed in the GEI laboratory(Appendix F, Section F.4.7). Five undisturbed samplesfrom the critical layer were consolidated to their 1985
16

in situ stresses and then unloaded. The void ratios wereplotted as a function of effective stress (&o) duringunloading. The coefficient of swelling, Ae/Alog a-, ofeach sample is plotted in Fig. 13 as a function of thepercent fines of the sample.
The initial effective stress at the base of theexploration shaft was estimated to be two thirds of thevertical effective stress (K, = 0.5). Void ratio measur-ements in the critical layer were made in saturated soilslocated 0.5 feet to 1.5 feet above the groundwaterlevel. The effective stress in soils of the criticallayer after shaft excavation was estimated to be thesuction corresponding to a column of water equal to thedistance between the sample and the groundwater level(about 1 foot). The effective stress caused by the selfweight of the sample was not significant and thereforewas not added to the suction pressure. Void ratiocorrections for swelling were made by determining thetotal change in effective stress of soils at the base ofthe shaft and the relationship shown in Fig. 13. Asummary of void ratio corrections for swelling of criti-cal layer samples is presented in Table 3. Undisturbedexploration shaft samples of the critical layer tested byboth GEI and Stanford were corrected for swelling usingthe same procedure.
A plot of 1985 in situ void ratios of criticallayer soils vs. elevation is presented in Fig. 14. Aunique relationship between in situ void ratio and depthwould not be expected because of the gradation differen-ces among the samples (Fig. 11). However, there is noconsistent difference between the void ratios measuredusing fixed piston samples, tripod tube samples, or fielddensity tests.
Void ratio measurements of the critical layer weremade at two locations on the downstream slope. These areLocations 111 and 103, about 350 feet apart (Fig. 5).The data indicate that void ratios of the critical layerare relatively consistent across substantial distancesparallel with the dam axis. One void ratio measurementwas made by Stanford on a sand sample obtained from theclayey core zone (Location 105) at the same elevation ofZone 5 at Locations 11 and 103. The void ratio of thissand sample was significantly higher than other samplesfrom Zone 5 as shown in Fig. 14.
17

4.2.2 In situ Void Ratios of Critical Layer Prior toFailure
In situ void ratios of the downstream criticallayer at the time of the 1971 dam failure were determinedby correcting the measured 1985 in situ void ratios forthe compression of the soils that occurred immediatelyfollowing the 1971 earthquake and also due to the graduallowering of the groundwater level within the dam as aresult of the permanent lowering of the reservoir.
In situ void ratios of the upstream critical layerat the time of the 1971 failure were determined bycorrecting downstream values for estimated void ratiodifferences between the upstream and downstream layers.These differences were due to prolonged submergence ofthe upstream slope (reservoir effect) and additionalcompression of downstream soils from the weight of the1930 and 1940 berms.
The Los Angeles Department of Water and Powerprovided GEI with detailed vertical and horizontalmovement survey data of the embankment obtained by theirpersonnel between 1929 and 1985. These data, presentedin Appendix C, formed the basis for analyses made toestimate the void ratio changes which occurred in thecritical layer between the time of failure in 1971 andthe time of sampling in 1985. In addition, the data wereused to evaluate void ratio differences between upstreamand downstream critical layer soils.
Analyses of void ratio changes induced by the 1971earthquake and by the subsequent drop in the groundwaterlevel are presented in Appendix C. This appendix alsocontains our evaluation of the void ratio differencesbetween the upstream and downstream critical layers. Theresulting void ratio corrections for the triaxial speci-mens are listed in Table 3 and the corresponding voidratios are listed in Tables 1 and 2. The same correctionprocedure was used for samples tested by GEI andStanford.
4.3 Determination of Slope of Steady State Line
The "steady state line" (SSL) depicts a correlation,unique for a particular soil, between the void ratio and theeffective minor principal stress (a3 ) during steady statedeformation. The effective minor principal stress could bereplaced in the plot by effective stress on the specimenfailure plane (-fs) or by undrained steady state strength(Su,). Values of 03,, of,, and S,. are all related by factors
18

that are a function of the steady state friction angle, 0,.Refer to Section F.4.4 of Appendix F for the relationshipsbetween these parameters.
A representative mixture of soils from the critical layer(Zone 5) was made from eight bag samples obtained from theexploration shaft. This remolded mixture is referred to inthis report as Batch Mix 7 (see Appendix F, Section F.2). Agrain size curve of Batch Mix 7 is shown in Fig. 11 andcompared with grain size curves of undisturbed samples fromthe critical layer.
Monotonically loaded triaxial shear tests were performedon remolded samples of Batch Mix 7 at various void ratios todefine the slope of the steady state line for critical layersoils. A summary of these triaxial tests is presented inAppendix F, Sections F.4.4 and F.4.5.
A variety of test procedures were used to measure thesteady state strength of critical layer soils. The parametersvaried in this test program were test type, consolidationtype, sample preparation procedure, and end platen treatment.A summary of the number of tests performed using each methodis shown in Table 4.
Remolded specimens were fabricated using two differentmethods. Fifteen specimens were prepared in layers of moistsoil using a tamper to compact each layer to the desiredinitial void ratio. Specimens were placed at water contentsof typically 3 to 4% (relatively dry) or 7% (relativelymoist). Two samples were placed as a slurry after thoroughmixing with water. Samples were generally placed at a highvoid ratio so that they would be contractive during shear.Fifteen tests were performed using lubricated end platens andtwo tests were performed using conventional end platens.
Fifteen consolidated-undrained (R) and two consolidated-drained (S) triaxial tests were performed. Ten of the A testsand the two S tests were isotropically consolidated. Theremaining five R tests were anisotropically consolidated.Most of the triaxial test specimens were sheared at an axialstrain rate of between 0.5 and 2.0% per minute. Two specimenswere sheared at faster rates of 48 and 33% per minute (A202and R207). A typical R test result on a compacted specimen ofBatch Mix 7 is shown in Fig. F78.
The steady state line (SSL) for Batch Mix 7 is shown inFig. 15 as a plot of void ratio versus effective stress on thespecimen failure plane during steady state deformation. Theinitial state for each test is also shown in Fig. 15 as wellas the path followed during shear.
19
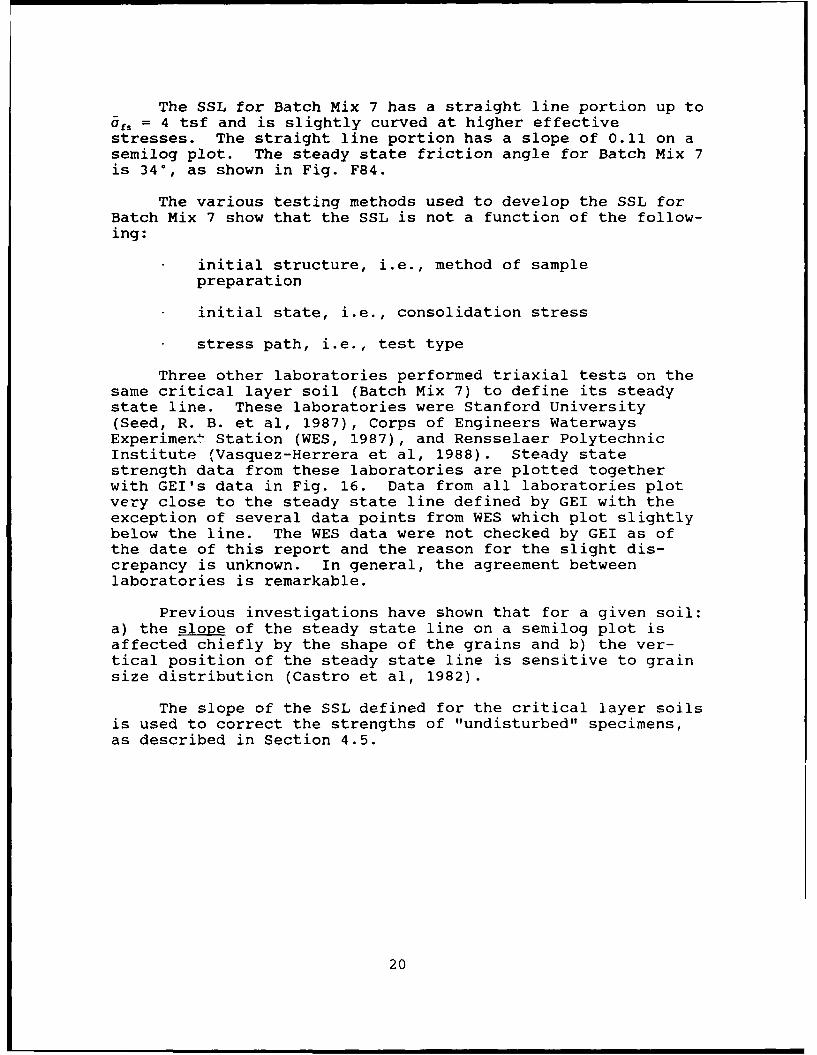
The SSL for Batch Mix 7 has a straight line portion up toaf, = 4 tsf and is slightly curved at higher effectivestresses. The straight line portion has a slope of 0.11 on asemilog plot. The steady state friction angle for Batch Mix 7is 34*, as shown in Fig. F84.
The various testing methods used to develop the SSL forBatch Mix 7 show that the SSL is not a function of the follow-ing:
initial structure, i.e., method of samplepreparation
initial state, i.e., consolidation stress
stress path, i.e., test type
Three other laboratories performed triaxial tests on thesame critical layer soil (Batch Mix 7) to define its steadystate line. These laboratories were Stanford University(Seed, R. B. et al, 1987), Corps of Engineers WaterwaysExperiment Station (WES, 1987), and Rensselaer PolytechnicInstitute (Vasquez-Herrera et al, 1988). Steady statestrength data from these laboratories are plotted togetherwith GEI's data in Fig. 16. Data from all laboratories plotvery close to the steady state line defined by GEI with theexception of several data points from WES which plot slightlybelow the line. The WES data were not checked by GEI as ofthe date of this report and the reason for the slight dis-crepancy is unknown. In general, the agreement betweenlaboratories is remarkable.
Previous investigations have shown that for a given soil:a) the slope of the steady state line on a semilog plot isaffected chiefly by the shape of the grains and b) the ver-tical position of the steady state line is sensitive to grainsize distribution (Castro et al, 1982).
The slope of the SSL defined for the critical layer soilsis used to correct the strengths of "undisturbed" specimens,as described in Section 4.5.
20

4.4 Determination of S,, for Undisturbed Specimens ofCritical Layer
A total of 16 consolidated-undrained (A) triaxial testswere performed by GEI on "undisturbed" samples of the criticallayer (Zone 5) to define steady state strengths of thesamples. These samples were obtained from two locations onthe downstream side of the dam: Locations 103 and 111 (seeFig. 5). Two types of samples were obtained at Locations 111:fixed-piston samples from borings and tripod tube samples fromthe exploration shaft. Fixed-piston samples were obtained atLocation 103. The test samples are representative of the Zone5 soils because they were taken from the full thickness ofZone 5 and from borings located 350 feet apart.
The undisturbed specimens of the critical layer sampleswere stratified to various degrees. The stratification washighlighted after partial drying of the tested specimens.Grain size analyses of undisturbed sai ples of the criticallayer were performed on a mixture of the layers representativeof the failed zone of the specimen.
X-ray photographs of the undisturbed tube samples wereexamined to select a section of tube for triaxial testing thatcontained approximately only one soil type. Lubricated endswere used for virtually all tests to allow for the use ofshorter samples that facilitated the selection of a relativelyuniform triaxial specimen.
The specimens were consolidated to relatively higheffective stresses so that the specimens would be contractiveafter consolidation because the steady state condition is moreeasily achieved within the strain limits of a triaxial testwhen specimens are contractive.
The results of R tests performed on undisturbed samplesof the critical layer are presented in Appendix F, SectionF.4.3. A typical R test result is shown in Fig. F64.
Stanford University (Seed, R. B. et al, 1987) performedseven additional R tests on undisturbed samples from the cri-tical layer. Four tests were performed on fixed-pistonsamples, three from Location 111 and one from Location 105,and three tests were performed on tripod tube samples from theexploration shaft.
Summaries of laboratory void ratio and shear strengthdata at steady state for undisturbed samples are presented inTable 1 (GEI data) and Table 2 (Stanford data). Data fromGEI's tests are plotted as solid square symbols on the steadystate diagram shown in Fig. 17. All of the steady statepoints for undisturbed samples plot above the SSL for Batch
21

Mix 7. We believe that this relationship occurs because thebatch mix was more widely graded than the soils comprising thethin layers of the undisturbed samples.The undrained steadystate shear strengths shown in Fig. 17 were obtained at thevoid ratio after consolidation in the laboratory, not at thein situ void ratio. Therefore, correction of the results tothe in situ void ratio must be made, as described in the nextstep.
4.5 Correction of Measured Su, to 1971 In situ VoidRatio
4.5.1 Correction Method
The steady state strengths of undisturbed samplesof the critical layer were determined in the laboratoryfor void ratios obtained after consolidation (Section4.4). The void ratios of these samples at the time ofthe 1971 failure were determined in Section 4.2. Theslope of the steady state line for each undisturbedsample of the critical layer is the same as the slope ofthe SSL for Batch Mix 7 because the average grain shapeof both soils is the same.
Steady state lines were drawn parallel to the SSLfor Batch Mix 7 through each laboratory data point of Su,and ec in Fig. 17 (solid squares). Only GEI laboratorytest data are shown in Fig. 17. The estimated 1971in situ void ratio of each sample, elg71, was plotted onthe SSL for that sample. Solid circles in the plot arebased on estimated upstream void ratios, and open circlesare based on estimated downstream void ratios. Theestimated in situ steady state shear strength of eachsample in 1971 was then read directly from the plot;upstream strength from solid circle symbols and down-stream strength from open circle symbols.
4.5.2 Selection of S,, for Analysis
Upstream Ss - A plot of 1971 in situ values ofupstream Ss versus elevation is shown in andFig. 18. This plot includes data from both GEIand Stanford. The Sus values are scattered, asexpected for an in situ hyaraulic fill deposit ofsand. The scatter reflects the natural variabil-ity in soil gradation and placement energy whichoccurred during the hydraulic filling operation.The final void ratio of a sandy deposit after con-solidation under any effective stress is verydependent on its initial void ratio. The steadystate strength of a sand is very sensitive to voidratio, and therefore, the scatter in initial
22

placement void ratio results in scatter in steadystate strength.
The data in Fig. 18 show that the strengthsobtained from the tripod samples and from thefixed-piston boring samples were similar. Thisresult is consistent with data obtained in anotherGEI project (GEI, 1985) and lends confidence tothe sampling methodology with the fixed-pistonsampler. In addition, Fig. 18 shows that the datagenerated by both GEI and Stanford are similarwhen the same method is used for making void ratiocorrections.
The data in Fig. 18 were evaluated to arrive at areasonable steady state strength to use in stabil-ity analyses. There are three methods one mightconsider to select a strength for analyses, asexplained below:
Average Strength - When the spatial variation ofstrength is such that the failure surface mustpass through all zones, an average strength isappropriate for analyses. The strength in thecritical layer of the Lower San Fernando Damvaries apparently at random based on our testresults. However, it is reasonable to expect somevertical variation in strength values in the layerdue to stratification caused by the hydraulic fillprocess. Since the failure occurred in Zone 5mostly as horizontal shear, a strength averagedover height would be too high to use for stabilityanalyses.
Lowest Strenath - Failure surfaces seek out planesof weakness in stratified soils, and therefore,the lowest strength, representing the weakeststratum, is often used for analyses in thesecases. Some of the strata comprising the criticallayer of the Lower San Fernando Dam are probablyrelatively weaker than others. However, thesestrata are typically 6 to 12 inches thick, and itis unlikely that a particular weak stratum wouldexist over great lateral extent. Therefore, thestrength of the weakest layer would be too low touse for stability analyses.
23

"Two-Thirds" Strength - A strength between the twodescribed above would be reasonable to use forstability analysis of the Lower San Fernando Dam.The U.S. Army Corps of Engineers (1970), in theirmanual for analyzing the stability of earth dams,recommends the following: "For each embankmentzone and foundation layer, design shear strengthsshould be selected such that two thirds of thetest values exceed the design values." Thismethod for arriving at a steady state strength forthe critical layer of the Lower San Fernando Damis reasonable considering the nature of the soilscomprising the critical layer. The "two-thirds"strength is approximately equal to the averagestrength minus one half of the standard deviation.
The "two-thirds" and average steady statestrengths of the upstream critical layer are shownin Fig. 18. The relatively high value of Su,obtained from Test R12 was not included in thecomputation of the average, since a localizeddense pocket would not significantly influence theoverall strength of the critical layer. The"two-thirds" value of steady state strength forthe upstream critical layer is 0.26 tsf while theaverage is 0.31 tsf. The data in Fig. 18 can beinterpreted in different ways to arrive at a valueof steady state strength to use in the liquefac-tion susceptibility analysis. A reasonable rangefor the steady state strength is 0.26 + 0.05 tsf.
Downstream Su. - A value of Su, for analysis of thedownstream critical layer was selected using thesame procedure described above for the upstreamcritical layer. A plot of 1971 in situ values ofdownstream Sus versus elevation is shown inFig. 19. The "two-thirds" value of steady statestrength for the downstream critical layer is 0.33tsf. A reasonable range for strength selectionfrom the data in Fig. 19 is 0.33 + 0.05 tsf.
24

4.6 Calculation of In situ Driving Shear Stress and the
Factor of Safety
4.6.1 In situ Driving Shear Stress
The "driving" shear stresses in the upstream anddownstream critical layer were determined by conventionalstatic stability analyses described in Appendix D. Thedriving shear stress in the critical layer is equal tothe minimum shear resistance the layer must have to justmaintain stability of the slope, assuming "mobilized"strengths in other layers. The "mobilized" strengths arethose that would act while deformations of the slope wereoccurring and would be available to resist a massive flowslide.
Upstream Slope - The strengths in the clayey corewere assumed to be the peak undrained strengths, Su,,using a S,,/p ratio ranging from 0.20 to 0.30.Drained strengths were used for the rolled fills andground shale hydraulic fill. The steady statefriction angle, 0.s, for these layers was variedbetween 30* and 35 ° in the analyses. A slip surfacethrough the upstream slope is shown in Fig. Dl.Using average SP and 0, values as described above,the average driving shear stress, Td, in the criticallayer on the upstream side of the dam is 0.48 tsf.Based on the range of soil strengths used in thestability analysis, a reasonable range for T
d is 0.48+ 0.04 tsf.
Downstream Slope - Stability analyses of thedownstream slope of the dam were performed in thesame way as the upstream slope. The berms on thedownstream slope were assumed to act in a drainedcondition with 4s = 40*. A reasonable range for theaverage driving shear stress in the critical layer onthe downstream side of the dam is 0.33 + 0.08 tsf forthe prefailure configuration.
Immediately after the failure of the upstream slope,the average driving shear stress in the criticallayer on the downstream side of the dam was reducedto about 0.22 + 0.06 tsf by the removal of the slidemass on the upstream side.
25

4.6.2 Factor of Safety Against Liquefaction
The factor of safety against liquefaction suscep-tibility, FL, is:
FL = Undrained Steady State Shear StrengthDriving Shear Stress
Values of S, and T d in the critical layer on theupstream side of the dam were obtained in Sections 4.5and 4.6.1, respectively. They are shown graphically inFig. 18. For the upstream slope the best estimate forthe factor of safety is:
FL = ius = 0.26 tsf = 0.54Td 0.48 tsf
Therefore, the upstream slope was potentially unstableprior to the 1971 flow slide. The average driving shearstress in the critical layer was greater than the avail-able undrained steady state shear strength.
Note that the steady state strength used tocompute FL was the "two-thirds" value, i.e., two thirdsof the measured strengths of the critical layer weregreater than the S,, used to compute FL. However, thevalue of FL would still be less than one if the averagevalue of S,, were used.
A FL <1 does not necessarily mean that a liquefac-tion flow slide of the slope will occur. An event, inthis case an earthquake, must occur to trigger afailure. The earthquake must be large enough to strainthe critical soil to the point where the peak ztrength isovercome and a reduction in strength to Su, takes placeleading to a slide. Triggering of the slide is discussedin Section 5.
The upstream slope was stable under staticloading conditions prior to the 1971 earthquake becausethe available strengths of all layers were their drainedstrengths. The factor of safety against sliding usingdrained strengths for all layers was about 2.
The value of FL for the downstream slope prior tothe failure was computed using the best estimates of Su,and rd on the downstream side of the dam, as follows:
FL =Su, = 0.33 tsf = 1.00rd 0.33 tsf
26

which is significantly larger than the value of 0.54 forthe upstream side.
After the upstream slope failed, the FL of thedownstream slope increased to about 1.5 due to a reduc-tion in driving shear stress. The downstream slope mayhave been susceptible to liquefaction before the 1971failure of the upstream slope (FL =1.0) but was notsusceptible to liquefaction after the upstream slopefailure (FL =1.5).
4.7 Liquefaction Susceptibility Through Upper Zones of theHydraulic Fill
In previous sections, the liquefaction susceptibility fora failure through Zone 5, judged to be the critical layer inthe hydraulic fill shell, has been addressed. Eight triaxialtests were performed on undisturbed samples from Zones 2 and 3of the hydraulic fill shell, located above Zone 5.
In situ values of S,, prior to the 1971 failure wereestimated for undisturbed samples from Zones 2 and 3 of theupstream shell using the same procedures described pre-viously. Estimated values of Su for Zones 2 and 3 arepresented in Table 5.
Driving shear stresses through upper zones of thehydraulic fill shell on the upstream side of the dam weredetermined using the same stability analyses proceduresdescribed previously. Driving shear stresses in Zones 2 and 3were typically 0.41 tsf and 0.43 tsf, respectively. Asexpected, these values of rd are less than the rd of 0.48 tsfcomputed for Zone 5. Computed values of FL for failure sur-faces through Zones 2 and 3 of the hydraulic fill on theupstream side of the dam are presented in Table 5 for eachsample tested. All FL values are larger than one, except forone borderline case with FL = 0.83. Thus results of ourliquefaction susceptibility analyses indicate that a liquefac-tion failure could not occur through Zones 2 and 3. Webelieve that liquefaction failures through Zones 1 and 4 werealso not possible. Zone 1 had generally higher N-values thanZone 2 and had a slightly lower driving shear stress, indicat-ing that it would be less critical than Zone 2. Zone 4 was adense widely graded sand that would probably be dilativeduring undrained shear.
Intact pieces of the upper zones of the shell were fcundduring investigations of slide debris on the upstream side ofthe dam (Seed et al, 1973). All available evidence indicatesthat the liquefaction flow slide occurred through the criticallayer near the base of the hydraulic fill shell and notthrough the upper zones of the shell. This is consistent with
27

the FL computed by GEI for Zones 5 and for the upper zones of
the hydraulic fill.
4.8 Conclusions
The measured values of undrained steady state strengthand driving shear stresses in the upstream slope of the LowerSan Fernando Dam are consistent with the fact that theupstream slope was susceptible to a liquefaction flow slide atthe time of the 1971 San Fernando earthquake. The data alsoconfirm that the failure would occur through a layer of soilat the base of the hydraulic fill shell and not through theoverlying layers in the shell. The measured strengths indi-cate that the downstream side of the dam may have been suscep-tible to a liquefaction failure prior to the 1971 upstreamslope failure. However, the downstream slope was not suscep-tible to a liquefaction failure once the upstream slope failedbecause the driving shear stresses on the downstream side ofthe dam were significantly reduced by loss of the upstreamslope.
It has been suggested (Seed, 1987) that the undrainedsteady state strength can be correlated with blowcounts andthat such a correlation can be used to estimate strengths atany given site. Data obtained at the Lower San Fernando Damhas been used to develop such a correlation. In general, useof blowcounts to estimate steady state strength is believed bythe authors to be inappropriate as explained below.
The blowcounts obtained in the critical zone of the LowerSan Fernando Dam in the post-earthquake investigations of 1971and 1985 are on the order of 20 blows/foot. Thus the samplerpenetration per blow was on average less than one inch.Densification of the soil within a couple of inches of thespoon tip would occur after each blow, increasing the penetra-tion resistance for the subsequent blow. Thus, even if eachpenetration occurred under undrained conditions, the resis-tance to penetration would not reflect the in situ undrainedstrength but a higher strength value considering the sen-sitivity of undrained strength to changes in density.Furthermore, it is likely that the soil is drained, at leastpartially, during each penetration and thus the penetrationtest reflects at least partly drained rather than undrainedconditions. Because of the large difference between drainedand undrained strength in loose sands and because of the sen-sitivity of undrained strength to changes in volume, theblowcounts for different soils with the same value of S,, willvary widely depending on the ability of the soil to drain andto densify during the SPT test. Densification and drainagewill depend on soil gradation, stratification, and otherfactors unrelated to Su,. Thus a correlation between blow-counts and S, would only be appropriate if the SPT test were
28

a fully undrained test. This is not likely to be the case forsandy soils. Therefore, blowcounts should not be used fordeterminations of Su, that are critical to evaluating thesafety of a structure. Blowcounts should only be used as acrude guide as to whether the soil is relatively loose ordense, and for identifying those zones of a soil deposit thatmight be critical for stability.
It has been conjectured (National Research Council, 1985)that in liquefaction slides water redistribution may occurcausing a reduction of the undrained strengths below their insitu pre-earthquake values. The analysis of the Lower SanFernando Dam demonstrates that the critical soils throughwhich the failure took place failed at their pre-earthquakevoid ratios because:
a. The zone of critical soils that developed extremelylarge deformations was about 15 feet in thickness,about 200 feet wide, and about 1,000 feet long. Sucha large volume of soil could not have changed sig-nificantly in density during the 1.5 minutes thatelapsed from the beginning of shaking to the end ofthe slide movements.
b. The values of S,, that were measured, assuming nowater redistribution, agreed well with the obser-vation of a failure in the upstream direction and nofailure in the downstream direction.
It is possible that after very large deformations and asthe sliding mass moved into the reservoir, water may have beentrapped under and between the various sections of the failingmass. Thus the overall resistance to sliding would decrease,leading to the very flat slope of the final configuration ofthe failure mass. However, the soils within the failure massdeformed under undrained conditions prior to the movement of asubstantial part of the sliding mass into the reservoir.
29

5. EARTHQUAKE REQUIRED TO TRIGGER LIQUEFACTION FAILURE
5.1 Introduction
When a soil mass is susceptible to liquefaction, thestress strain behavior in critical zones of the soil mass canbe shown by the schematic stress strain curve in Fig. 20. Thedriving shear stress rd is well below the drained strength,but it is higher than the undrained steady state strength.Undrained straining leads to a massive failure if the strainreaches the triggering strain -yt, the strain at which thedriving shear stress exceeds the available strength. Un-drained straining can be caused by a rapid monotonic, cyclic,or transient increase in shear stress. The additional shearstress must be applied rapidly so that it causes undrainedbehavior. Previous work (Castro et al, 1982; Poulos et al,1986) has shown that the triggering strain is about the samewhether triggering is caused by monotonic or by cyclic load-ing.
Based on this background, the triggering analysis for theLower San Fernando Dam included three steps, namely, a) deter-mination of the triggering strain 7tr for the critical soillayer, b) estimation of the strains induced by the 1971earthquake and other previous earthquakes, and c) comparisonof the strains in a) and b) to determine whether the resultsare consistent with the observed behavior.
The analytical approach used to determine the earthquakemagnitude required to trigger a liquefaction flow slide of theupstream slope is shown by the flow chart in Fig. 21. Theleft side of the flow chart in Fig. 21 shows the general stepsused to determine the triggering strain required to reducesoil strengths of the critical layer to steady state values.The right side of the flow chart shows the steps used todetermine the amount of strain that various drthquakes wouldproduce in the critical layer. The above steps were combinedto arrive at the earthquake magnitude required to trigger aliquefaction failure.
A description of the triggering analysis, an explanationof the delayed failure of the dam, and a summary of theearthquake history of the dam prior to 1971 are presentedbelow.
5.2 Strain Required to TrigQer Flow Slide
Remolded specimens of Batch Mix 7, which represent thecritical layer, were anisotropically consolidated in a tri-axial cell such that the ratio of undrained steady statestrength Su, to driving shear stress rd was about 0.65
30

(FL = 0.65). We desired a laboratory SU,/7d of 0.54, ourestimate of the factor of safety against liquefaction suscep-tibility in the critical layer for an upstream failure.However, we could only achieve values as low as 0.60 andtypically 0.65 due to the sample preparation and consolidationprocedures used.
In terms of stresses on the 45° plane of the specimen,the ratio q,/qc is also 0.65. Values of q,, are only a func-tion of void ratio after consolidation and qc is the staticshear stress applied to the specimen during consolidation.
5.2.1 Monotonic Tests
A series of monotonically loaded triaxial testswith varying strain rates were performed on Batch Mix 7.These tests were done on anisotropically consolidatedremolded (compacted) specimens. The results are reportedin Appendix F, Section F.4.6. These tests were performedto determine the triggering strains for various strainrates and to estimate the peak strength of critical layersoils prior to the failure.
Several specimens were consolidated such that theratio of undrained steady state strength, Su, was about0.65 times the applied static consolidation shear stress,Td. Stress-strain curves of two tests consolidated inthis way are shown in Fig. 22. The shear stress isplotted in terms of q, the shear stress on the 45° planeof the specimen.
Stress-strain curve A in Fig. 22 is from TestA209 performed with strain control at a relatively slowrate of 0.9% axial strain per minute. The consolidationshear stress, q,, was about 0.50 tsf for this test. Thepeak shear strength of this specimen was qP = 0.62 tsf,and it occurred at an axial strain of only 0.13%. Thespecimen strength was reduced to the consolidation shearstress in about 1.1% axial strain. Continued strainingcaused further reductions in strength. The undrainedsteady state strength of the specimen was reached afterabout 25% axial strain.
A second specimen (Test R203) was set up in thesame way as the specimen in Test R209. However, thespecimen in Test A203 was sheared at a very fast strainrate of about 4,600%/min as opposed to a slow strain rateof 0.9%/min. The high strain rate was obtained by thesudden application of a large axial load, higher than thepeak strength of the specimen. The stress-strain curveof the fast strain rate specimen, monitored with a high
31

speed strip chart recorder, is shown by Curve B inFig. 22. The peak strength of the fast strain ratespecimen was higher than that of the slow strain ratespecimen but occurred at a similarly low axial strain.The loss in strength of the fast strain rate specimenwith continued straining was more gradual than for theslow strain rate specimen. The steady state strength ofthe fast strain rate specimen was not reached within thestrain limits of the triaxial test.
Slow strain and fast strain rate laboratory testswere performed at two effective consolidation stresseswhich bracket the average in situ stresses in the criti-cal layer prior to the 1971 failure. Stress paths forthe laboratory tests and those estimated to apply in situare shown in Fig. 23.
The average in situ static stresses on thefailure plane through the upstream hydraulic fill shellof the dam prior to the 1971 failure are plotted inFig. 23 as point A. Curves e and f in Fig. 23 areestimated stress paths for 1971 in situ conditions forslow and fast strain rates, respectively.
The peaks of stress paths e and f shown inFig. 23 represent the average peak strengths of the insitu critical layer soil along the failure plane. Forslow strain rates, the average in situ peak strength isabout 0.75 tsf. For fast strain rates, the average insitu peak strength is about 0.85 tsf.
The test results of the monotonic tests indicatedthe following:
a. In slow strain rate tests, the triggering strainwas about 1.0% axial (Etr), 1.5% in shear (-y,).
b. The peak strength increased with rate of strain.
c. The triggering strain increased with rate ofstrain.
The flow slide of the Lower San Fernando Dam wastriggered sometime after the end of shaking, and thestart of the slide itself occurred relatively slowly.Thus the appropriate triggering strain is that for slowstrain rate, or -Ytr equal to about 1.5%. During theearthquake, the applicable peak strength is that ap-propriate for fast rates of strain.
32

5.2.2 Cyclic Load/Creep Tests
A series of cyclic load triaxial tests wereperformed to investigate the influence of low strainlevels on the behavior of critical layer soils. Thepurpose of a number of these tests was to determine ifsamples strained to values less than ytr would eventuallycreep to failure. The details of these tests arepresented in Appendix F, Section F.4.8.
Specimens of Batch Mix 7 were consolidated suchthat FL was typically 0.65. Cyclic stresses were appliedwith a hammer, creating transient pulses which were notavailable to drive the failure as was the case in thefield.
Ten cyclic load tests were performed, varying themagnitude of loading and the number of load cycles.After applying cyclic loads, the specimens were allowedto creep under the static consolidation loads (drivingshear stress) while maintaining undrained conditions.The creep rate of the specimens was a function of theamount of strain the specimen had accumulated. A plot ofcreep rate vs. cumulative axial strain for the tests isshown in Fig. 24. This plot indicates that continuedcreep leading to complete collapse of the specimen wouldoccur once axial strains exceeded 0.35%. An axial strainof 0.35% corresponds to a shear strain of 0.5% forPoisson's ratio = 0.5. A rapid increase in rate ofstrain occurred after about 1% axial strain (1.5% shearstrain). The rapid increase in strain would correspondto the triggering strain as defined in Fig. 20. Thus thetriggering strain for both cyclic and slow monotonictests were comparable. The cyclic tests showed, however,that if a smaller strain were induced by cyclic loading(0.35% axial, 0.5% shear), the soil would creep untilfailure was triggered. Note that failure could betriggered because the driving shear stress exceeded theundrained steady state strength.
5.3 In situ Strains Induced by Earthauake LoadinQ
Analyses were performed to estimate the strains thatwould accumulate in the critical layer on the upstream side ofthe dam under various earthquake load levels. A Newmark-typeanalysis (Newmark, 1965) was performed to estimate displace-ments of the potential failure mass and the correspondingstrains in the critical layer.
The basic assumption in this type of analysis is thatdisplacements are initiated only when the earthquake-induced
33

accelerations of the potential sliding mass exceed the yieldacceleration of the mass.
The basic steps of the method, as applied for this study,are as follows:
a. For the critical failure surface through the upstreamslope, determine from a pseudostatic stabilityanalysis the horizontal acceleration which produces asafety factor of one. This is referred to as theyield acceleration, ky, and has units of g (acceler-ation due to gravity).
b. Define a time history of average acceleration, k(t),of the failure wedge during earthquake loading, forvarious earthquake levels. Values of k(t) are givenin units of g. For this study, the computer programSHAKE (Schnabel et al, 1972) was used to compute k(t)by modeling the propagation of earthquake accelera-tions from bedrock through the critical layer.
c. Compute the displacements which are initiated whenthe earthquake accelerations exceed the yield ac-celerations; i.e., when k(t) >k,. Add displacementswhich occur each time the yield acceleration isexceeded to obtain the accumulated displacementcaused by the earthquake. Do this for various k(t)developed from various earthquake levels. Convertaccumulated displacement to strain of the criticallayer and plot these strains vs earthquake magnitude.
Each step is discussed below as it was applied to the
analysis of the upstream slope of the Lower San Fernando Dam.
5.4 Determination of Yield Acceleration, ky
Yield accelerations of the upstream slope, ky, werecomputed using pseudostatic stability analyses as described inAppendix D. Yield accelerations of the upstream slope werecomputed to be in the range of 0.05 g to 0.07 g for the rangeof soil strengths assigned to the different soil layers.Details of the analysis are presented in Appendix D.
The yield strength of the critical layer (in situ) wasestimated on the basis of R tests on remolded samples of BatchMix 7 for fast rate of loading, as presented in Section5.2.1. The yield strength of the in situ "undisturbed" soilwould likely be somewhat higher than that of remolded samples.
Therefore, the pseudostatic analysis is somewhat conser-vative, i.e., the computed yield accelerations will be some-what lower than the actual value.
34
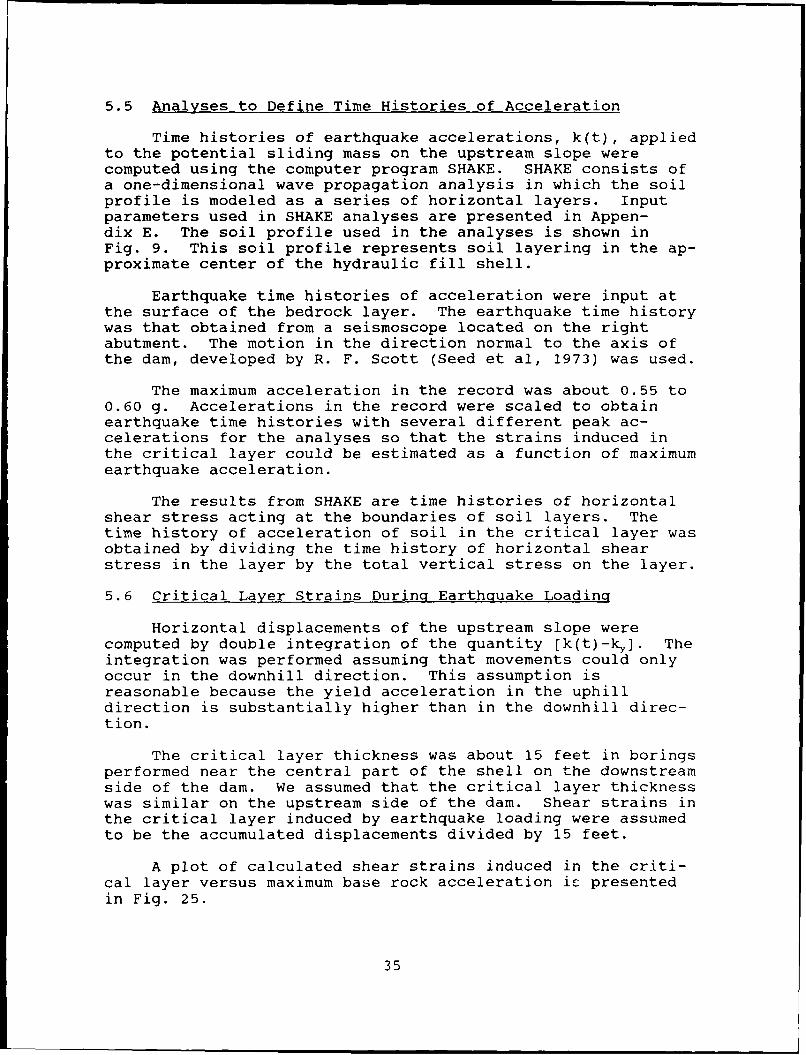
5.5 Analyses to Define Time Histories of Acceleration
Time histories of earthquake accelerations, k(t), appliedto the potential sliding mass on the upstream slope werecomputed using the computer program SHAKE. SHAKE consists ofa one-dimensional wave propagation analysis in which the soilprofile is modeled as a series of horizontal layers. Inputparameters used in SHAKE analyses are presented in Appen-dix E. The soil profile used in the analyses is shown inFig. 9. This soil profile represents soil layering in the ap-proximate center of the hydraulic fill shell.
Earthquake time histories of acceleration were input atthe surface of the bedrock layer. The earthquake time historywas that obtained from a seismoscope located on the rightabutment. The motion in the direction normal to the axis ofthe dam, developed by R. F. Scott (Seed et al, 1973) was used.
The maximum acceleration in the record was about 0.55 to0.60 g. Accelerations in the record were scaled to obtainearthquake time histories with several different peak ac-celerations for the analyses so that the strains induced inthe critical layer could be estimated as a function of maximumearthquake acceleration.
The results from SHAKE are time histories of horizontalshear stress acting at the boundaries of soil layers. Thetime history of acceleration of soil in the critical layer wasobtained by dividing the time history of horizontal shearstress in the layer by the total vertical stress on the layer.
5.6 Critical Layer Strains During Earthquake Loading
Horizontal displacements of the upstream slope werecomputed by double integration of the quantity [k(t)-k] . Theintegration was performed assuming that movements could onlyoccur in the downhill direction. This assumption isreasonable because the yield acceleration in the uphilldirection is substantially higher than in the downhill direc-tion.
The critical layer thickness was about 15 feet in boringsperformed near the central part of the shell on the downstreamside of the dam. We assumed that the critical layer thicknesswas similar on the upstream side of the dam. Shear strains inthe critical layer induced by earthquake loading were assumedto be the accumulated displacements divided by 15 feet.
A plot of calculated shear strains induced in the criti-cal layer versus maximum base rock acceleration ic presentedin Fig. 25.
35
5.7 Failure Mechanism - 1971 Flow Slide
The plot shown in Fig. 25 can be used to estimate theearthquake intensity (in terms of maximum bedrock accelera-tion) needed to trigger a liquefaction flow slide of theupstream slope of the dam. Creep leading to a flow slidewould occur if shear strains in the critical layer exceededabout 0.5% during undrained loading. Based on the Newmark-type analysis, an earthquake with a maximum acceleration ofabout 0.12 + 0.02 g would cause about 0.5% shear strain toaccumulate in the critical layer. However, the analysis wasperformed using undrained peak strengths in Zone 5 that weredetermined from tests on remolded samples. It is likely thatthe peak strength of the in s tu undisturbed soil is higher,and therefore, the earthquake required to cause a strain of0.5% would have a somewhat larger peak acceleration. There-fore, a flow slide of the upstream slope would be predicted ifthe dam were subjected to an earthquake having a peak ac-celeration somewhat larger than 0.12 g, probably near 0.15 g.
The 1971 earthquake had a peak acceleration of about0.55 to 0.60 g, which would cause accumulated strains in thecritical layer to be well in excess of 0.5%. Therefore, ouranalysis would predict that the 1971 earthquake would causesufficient strain to reduce the strength _'n the critical layerto a value close to its undrained steady state strength. Sucha strength reduction would then trigger a flow slide of theupstream slope.
The actual flow slide of the upstream slope started about26 seconds after completion of earthquake shaking (seeSection 2.2). The delayed failure was most likely caused byeither, or both, of the following two factors:
a. Accumulated shear strain in some zones of the criti-cal layer may not have been quite enough to reduceits strength to the driving shear stress, and addi-tional creep under the static driving stress wasneeded to lower its strength sufficiently to cause aflow slide.
b. The dense sandy dike at the toe of the upstream slopewas dilative, and during undrained shear there was areduction in pore pressures which caused the strengthof the toe dike to be significantly greater than itsdrained strength. The failure occurred when thestrength was gradually reduced to its drained valueas water from the reservoir flowed into the soil.This mechanism of the delay in the slide was proposedby Seed, 1979.
36

Mechanism (a) was observed in the laboratory duringtriaxial testing of anisotropically consolidated, remoldedsamples of the critical layer (Appendix F, Section F.4.8). Ina number of these tests, samples accumulated small strainsunder cyclic loading. The specimens resisted applied staticshear stresses for a time after cyclic loading, but continuedto strain slowly (creep) under static stresses. The specimenseventually collapsed under the driving stresses as thespecimen strength decreased during straining.
A scenario of the failure is illustrated in Fig. 26, aplot of total shear force (F) along the failure surface vs.the shear displacement (6) across the surface. The failuresurface through the upstream slope shown in Fig. D1 was usedto develop Fig. 26. The plot in Fig. 26 shows the totaldriving force along the failure surface obtained from a staticstability analysis, the resisting force contributed by eachlayer through which the failure surface passes, and the totalavailable resisting force. The plot in Fig. 26 is intended toshow qualitatively the shear stress transfer between thevarious zones.
For the upstream slope the mobilized friction angle understatic conditions was approximately 20° for all layers, ascompared with a failure friction angle of 30 tc 35'. Hencethe slope was stable under drained conditions. The averageshear force in each layer prior to the earthquake, for drainedconditions, is shown in Fig. 26 at zero displacement. Notethat the total driving force is the sum of the initial shearforces under drained conditions. The total driving forceremains essentially constant at the beginning of slope move-ments, but it eventually decreases when very large displace-ments cause the slope to flatten.
The resistance of the various soil layers along thefailure surface will change as movements take place during andafter the earthquake. The resistance depends on whether thesoil responds in drained or undrained shear and on the shapesof the stress strain curves.
A brief description of the resisting forces contributedby each layer is present below.
37

Critical Layer - The critical layer, Zone 5 of thehydraulic fill shell, behaved undrained during the failure.Because of the relatively long section of the failure surfacewithin Zone 5, its contribution to the total shear resistancewas more significant than all of the other layers combined.The shape of the F-6 curve was based on the shape of thestress-strain curve from Test R205. The peak strength wasobtained from Fig. 23 for slow strain rate conditions. Theactual peak strength during an earthquake cycle would be thatfor fast strain rate conditions.
Clayey Core - The clayey core strained undrained duringthe entire failure. The peak strength of the clayey core wasbased on a Su /p ratio of 0.25. The F-6 curve of the core wasbased on the stress vs vane displacement curve from a labora-tory vane test on an undisturbed core sample (Appendix F,Section F.5). Shear strains of the clayey core were estimatedfrom vane displacements based on correlations developed fromprevious tests on clayey soils (Poulos et al, 1985). Verylarge shear strains are required to reach the steady statestrength for clayey soils. Thus, during the earthquake andprior to initiation of the failure, the mobilized strength inthe clay is approximately equal to the peak strength.
Embankment Cap - The embankment cap, including the groundshale layer, were assumed to act under drained conditionsduring the failure. The shape of the F-6 curve for the capwas based on the shape of a typical stress-strain curve of aslightly dilative sand. A steady state friction angle of 30 °
was used.
Toe Dike - The toe dike was assumed to be a dense sandwith a steady state friction angle of 30* The sand wasprobably highly dilative because of the low effective normalstresses under which it was consolidated. It was assumed tobe undrained during earthquake shaking and to drain graduallyafter completion of shaking. The shape of the undrained F-6curve was based on the shape of a typical stress-strain curvefor a highly dilative sand. The toe dike was under a verylarge "back pressure," being approximately 90 feet belowreservoir level. The peak undrained strength was based on theassumption that dilation occurred until cavitation of the porewater started. The undrained strength was then ten times thedrained strength. After completion cf earthquake shaking, thestrength of the toe dike gradually decreased to the drainedstrength as "negative" pore pressures dissipated.
The shear displacement of the failure surface whichoccurred during the 14 seconds of earthquake shaking wasassumed to be 1 foot, as shown in Fig. 26. This amount ofdisplacement is consistent with the interpretation of the
38

seismoscope record from the dam crest which indicated a"slight tilting" of the crest immediately after shaking (Seed,1979). One foot of displacement corresponds to a shear strainof about 7% in the critical layer which would cause the shearresistance in the critical layer to approach the undrainedsteady state strength.
Since the dam did not fail during the earthquake, thesummation of resisting forces was still significantly greaterthan the total driving force during shaking, as shown inFig. 26. As creep occurred after the earthquake, the resist-ing forces gradually dropped due to: a) additional loss ofstrength of the critical layer as it approached its undrainedsteady state strength and b) dissipation of negative porepressures in the toe dike causing resisting forces in the toedike to decrease. Eventually the total resisting force fellbelow the total driving force and the major slide occurred.The creep stage lasted about 26 seconds in the field based onseismoscope records (see Section 2.2). Once resisting forcesfell below driving forces, the resisting forces decreased evenfurther as soil strengths of all layers moved toward theirsteady state values. The actual slide duzation was about 50seconds.
The above description is a qualitative view of a rathercomplex process of shear stress transfer among the variouszones, leading to instability and to an upstream liquefaction(flow) failure. Even though the stress-strain behaviorassumed for the various layers is approximate, the processpresented in Fig. 26 illustrates the importance of consideringthe complete stress-strain behavior rather than peak or steadystate strength alone (Poulos, 1971).
The downstream slope did not develop a flow slide;however, limited movements occurred as a result of the earth-quake, as described in Appendix C. Horizontal movements inexcess of 0.5 feet were observed at the berm road at themaximum dam section. These movements correspond to shearstrains in the critical soil in excess of 2 to 3%, which mayhave reduced its strength to values close to the undrainedsteady state strength. However, the factor of safety of thedownstream slope against liquefaction susceptibility was about1.0, and therefore, it may not have had the potential for aliquefaction flow slide. After the upstream slope failed, thedownstream slope was no longer susceptible to a liquefactionflow slide due to a reduction in driving shear stress in thedownstream slope.
39

5.8 Earthauake History of the Dam
Our triggering analyses indicated that an earthquake witha maximum acceleration of about 0.15 g and with a similar timehistory as the 1971 event would have caused a flow slide ofthe upstream slope of the dam. The earthquake history of thedam site prior to 1971 was reviewed to test the validity ofthis conclusion.
Earthquake data within a 200-kilometer radius of the damwere obtained from the National Geophysical Data Center(NGDC)/National Oceanic and Atmospheric Administration(NOAA). Richter (1973) has compiled information on pre-1971earthquakes which appeared to be the most significant in thearea affected by the 1971 San Fernando earthquake. Table 6lists the earthquakes presented by Richter (after dam con-struction and prior to 1971) together with pertinent informa-tion from NGDC. Records of actual earthquake accelerations atthe dam site are not available for these earthquakes. Aprobable range of maximum accelerations at the Lower SanFernando Dam due to each earthquake was obtained from Fig. 27(Schnabel et al, 1973) and are presented in Table 6.
Data in Table 6 indicate that previous earthquakes at thedam site would not have caused a liquefaction flow slide ofthe dam because maximum accelerations were lower than theestimated value of 0.15 g needed to trigger a slide.
Generally the movements of the dam prior to 1971 occurredgradually with increased rates of movements corresponding toconstruction activities at the dam, such as construction ofthe downstream berms (see Appendix C). An exception is themovement that coincided with an earthquake on August 30,1930. At the time of this earthquake, the geometry of the damwas the same as that shown in Fig. 2, except the 1940 berm wasnot in place and the reservoir was at about El. 1090. Smalltransverse cracks were observed in the embankment after theearthquake, near its contact with the left (east) abutment.The maximum measured movements occurred in the parapet walllocated on the upstream side of the crest. The parapet wallsettled about 0.15 to 0.25 foot as a result of the earthquakewith maximum settlements occurring between Stas 3+00 and9+00. Prior to the earthquake, the parapet wall was movinglaterally in the downstream direction. However, the wallmoved upstream an average of about 0.03 feet as a result ofthe earthquake, with the maximum upstream movement being about0.06 feet.
According to a statement by the caretaker of the dam, the1930 shock was very severe; the heaviest he had everexperienced at the dam since its construction, he havingresided near the dam since it was built (Jacques, 1930). The
40

maximum earthquake acceleration at the dam site due to theAugust 30, 1930 earthquake was estimated to be only 0.02 g inTable 6 based on NOAA's epicentral location. However, Richter(1973) indicated that the epicentral location of this earth-quake has been questioned and that it may have been actuallycloser to the Lower San Fernando Dam. The closer epicenterwould result in a maximum acceleration at the dam site in therange of 0.02 to 0.09 g for the August 30, 1930 earthquake.
The Kern County earthquake of June 21, 1952 would havecaused maximum accelerations at the dam site to be between0.05 to 0.12 g according to Fig. 27, more than any otherpre-1971 earthquake. However, all movement and settlementsurvey data of the dam indicate that the Kern County earth-quake did not cause measurable movement of the embankment. Itis likely that the maximum accelerations at the dam site forthis earthquake were less than 0.1 g. This is consistent withmeasured maximum accelerations of 0.048 g and 0.058 g in thenorth-south direction (perpendicular to dam axis) at the twoclosest recording stations to the dam. These recordingstations were 74 and 78 miles from the epicenter and are 18and 22 miles further than the dam was from the epicenter.
The behavior of the dam during earthquakes prior to 1971is consistent with the results of our triggering analysis ofthe dam. The most severe pre-1971 earthquake occurred in 1930and had an estimated maximum acceleration at the dam site inthe range of 0.02 to 0.09 g. Our triggering analysis indi-cated that an earthquake with a maximum acceleration of about0.15 g would be required to trigger a flow slide of theupstream slope. The 1930 earthquake did not cause a flowslide but did cause small movements and some cracking of thedam.
5.9 Comments on Methodology for Triggering Analysis
The methodology described in the previous sections foranalyzing liquefaction triggering at the Lower San FernandoDam involved a rather extensive series of various types oftriaxial tests. Some of the tests were performed to confirmprevious findings and would not be necessary in generalpractice. The flow chart in Fig. 21 illustrates the mainitems in the liquefaction triggering evaluation performed forthe Lower San Fernando Dam. In practice the strain requiredto trigger (left branch of flow chart) can be determined usingmonotonic (rather than cyclic) load tests on specimens pre-pared to have values of S,, and anisotropic consolidationstresses that are representative of in situ conditions. Thesetests will be generally performed on remolded specimensbecause undisturbed specimens would have too high a value ofSu, due to unavoidable densification during sampling andconsolidation. The performance of monotonic rather that
41

cyclic tests is based on the finding that the triggeringstrain defined in Fig. 20 is the same for monotonic and forcyclic loading.
The peak undrained strength obtained from the monotonictests described above can be used in the evaluation of theyield accelerations and the corresponding displacements andstrains, as shown on the right branch of the flow chart inFig. 21.
Note that the use of the results of tests on remoldedspecimens will generally underestimate the peak strengths andthus will lead to a conservative estimate of the earthquakerequired to trigger liquefaction. Presently there is littleinformation available for estimating the degree of conser-vatism.
42

6. CONCLUSIONS
The Lower San Fernando Dam in California developed amajor slide in the upstream slope and crest as a result of the1971 San Fernando earthquake. The purpose of our re-evalua-tion of the slide was to test the validity of using steadystate concepts and methodology to perform liquefaction ana-lyses of the dam.
The results of the stability analyses, based on theundrained steady state strengths measured, were consistentwith the observed behavior, i.e., a) the dam was susceptibleto a liquefaction failure in the upstream direction, b) thedam was not susceptible to a liquefaction failure in thedownstream direction once the upstream slope had failed, andc) the strains that accumulated during the 1971 earthquakewere sufficient to trigger the upstream liquefaction failure.
The main conclusions are presented below:
Composition and Strengths, Su. of Hydraulic Fill Shells
1. Downstream Slope. Borings performed through thedownstream shell indicated similar zonation in theeast-west direction (parallel to the dam center-line). The loosest zone found in the downstreamsection of the hydraulic fill shell was a 15-foot-thick layer of very silty fine sand located at thebase of the shell. This zone corresponds to theupstream zone that experienced very large strains atthe base of the hydraulic fill based on field obser-vations in trenches and borings made on the upstreamside of the dam after the 1971 failure (Seed, 1973).
Based on the results of 23 tests performed on undis-turbed samples by GEI and Stanford University labora-tories, the undrained steady state strength of thedownstream critical layer soils was estimated to beabout 0.33 tsf just prior to the 1971 failure.
2. Upstream Slope. Construction records and continuityof layers across substantial distances found in thedownstream shell indicate that the hydraulic fillstratigraphy was symmetrical with respect to thecenterline of the dam. Thus it was concluded thattests performed on samples from the downstream shellcould be used to estimate properties of soils in theupstream shell. In particular, the zone at the baseof the downstream shell was considered similar to thecritical layer for the upstream failure, i.e., thelayer that developed very large strains during the
43

slide. Considering void ratio differences betweenthe upstream and downstream critical layer soils (dueto prolonged submergence of the upstream shell andadditional loading of downstream shell by berms), theundrained steady state strength of the upstreamcritical layer soil was estimated to be about 0.26tsf, as compared to 0.33 tsf in the downstream shell.
Liauefaction Susceptibility
Liquefaction is a phenomenon wherein a mass of soil losesa large percentage of its shear resistance, when subjected toundrained monotonic, cyclic, or shock loading, and flows in amanner resembling a liquid until the shear stresses acting onthe mass are as low as the reduced shear resistance.
The loss in shear resistance is due to the conversion ofthe mass from a practically drained condition, at which it cansustain the in situ shear stresses, i.e., it is stable, to apractically undrained condition of shear under which the soilmass is unstable. Liquefaction susceptibility refers to acondition under which the soil mass can develop a liquefactionfailure as defined herein.
1. Pre-earthQuake Stability. The factor of safetyagainst a slide in the upstream direction usingdrained strengths was about 2. The factor of safetyof the downstream slope for drained conditions wasslightly greater than 2. Thus, under drained (noearthquake) conditions, the dam had a factor ofsafety that normally would be considered ample.
2. Upstream Slope. In the upstream direction, thestatic driving shear stress in the critical layer wasabout 0.48 tsf. Therefore, the computed factor ofsafety against liquefaction susceptibility was about0.54 (0.26/0.48). Thus the results of the analysiswere consistent with the fact that, even though theupstream slope was stable under drained conditions, atriggering event, such as the 1971 earthquake, couldcause an unirained failure (liquefaction).
3. Downstream Slope. The static driving shear stress inthe critical layer was about 0.33 tsf prior to theupstream slide and about 0.22 tsf after the slide.Therefore, the factor of safety of the downstreamslope against liquefaction susceptibility was about1.0 prior to the upstream slide and about 1.5 after-wards. The computed factors of safety are consistentwith the fact that the 1971 earthquake caused highpore pressures and slight deformations in the down-
44

stream slope, but the earthquake did not cause the
slope to fail.
TrigQering of Liguefaction
If a soil mass is susceptible to liquefaction, a trigger-ing action is required to induce liquefaction. The triggeringaction is a monotonic impact or seismic type of loading thatcauses the mass to deform undrained. It was found that shearstrains of about 0.5% in the critical soils and applied underundrained conditions were sufficient for an upstream liquefac-tion failure to occur in the Lower San Fernando Dam.
1. Upstream Slope. Based on our triggering analysis, anearthquake with a maximum base rock acceleration ofabout 0.15 g and duration similar to the 1971 earth-quake would cause enough shear strain (about 0.5%) toreduce the strength in the critical layer to thepoint where a liquefaction failure of the upstreamslope would occur. The maximum base rock accelera-tion at the dam site during the 1971 earthquake wasabout 0.55 to 0.6 g. Therefore, the results of theanalysis agrees with the fact that the 1971 earth-quake was severe enough to trigger the failure. Inaddition, an analysis of earthquake events prior tothe 1971 earthquake indicated that they were notsevere enough to trigger a flow slide of the upstreamslope of the dam.
2. Downstream Slope. Deformation measurements of thesurface of the downstream slope made by the LADWPafter the 1971 earthquake indicate that shear strainsin the critical layer of the downstream hydraulicfill shell were about 2 to 3%, which are sufficientto reduce its strength to values close to the un-drained steady state strength. However, failure ofthe downstream slope did not occur. This is consis-tent with the fact that the downstream slope had afactor of safety against liquefaction susceptibilityof about 1.0 prior to the upstream slide and about1.5 after the slide. Once the upstream slope failed,it was not possible for the downstream slope to fail,regardless of the magnitude of pore pressure build upand of strain accumulation.
Other Conclusions
1. The void ratio of the critical layer in the down-stream shell was measured using fixed-piston sam-pling, hand carved "tripod" tube sampling in a deepexploration shaft, and field density testing using asand cone in the exploration shaft. All three
45

methods resulted in similar measurements of in situvoid ratio within the normal scatter expected for ahydraulic fill. Therefore, both the fixed pistonsamples from boreholes and the tripod tube samplesfrom the exploration shaft were found to be appro-priate for measuring in situ void ratio for theliquefaction analyses as well as for performinglaboratory tests to obtain undrained steady statestrengths.
2. In general, fixed-piston samples were more costeffective for performing the steady state analysesthan tripod tube samples. This is because a) tripodtube samples required additional void ratio correc-tions due to swell of the exploration shaft bottomand b) construction of the exploration shaft was muchcostlier than performing borings.
3. Four separate laboratories performed triaxial labora-tory tests to define the steady state line of thecritical layer soil, Batch Mix 7. In general, thelaboratories showed remarkable agreement in definingthe steady state line, Fig. 16.
4. The tests performed showed that the steady state lineis not a function of the following:
" initial structure, i.e., method of samplepreparation.
" initial state, i.e., consolidation stress
" stress path, i.e., test type
5. An accumulated undrained shear strain of about 1.5%in the critical layer of the upstream slope is suf-ficient to lower the shear resistance of the layer tothe driving shear stress and trigger the flow slide.However, if a smaller shear strain of 0.5% to 1.5% isreached, the soil creeps under the driving shearstress until the failure is triggered at a strain ofabout 1.5%.
46

REFERENCES
Baumann, P.; Richter, C. F.; Pentegoff, V. P.; and Duke,C. M. (1966). "Lower Van Norman Reservoir - Board ofConsultants' Report on Safety," 14 pp., December.
Boutrup, E. (1977). "Computerized Slope Stability Analysisfor Indiana Highways," Joint Highway Research Project, FileNo. 6-14-22, Vols. 1 and 2, Engineering Experiment Station,Purdue University, West Lafayette, Indiana, December.
Castro, G. (1987). "On the Behavior of Soils During Earth-quakes - Liquefaction," The Proceedings of the 3rdInternational Conference on Soil Dynamics and EarthquakeEngineering, Princeton, New Jersey, June.
Castro, G.; Poulos, S. J., and Leathers, F. D. (1985). "ARe-examination of the Slide of the Lower San Fernando Dam,"Journal of Geotechnical Engineering, ASCE 111 (GT9).
Castro, G.; Poulos, S. J.; France, J. W.; and Enos, J. L.(1982). "Liquefaction Induced by Cyclic Loading," report byGeotechnical Engineers Inc. to National Science Foundation,Washington, D.C., pp. 1-80, March.
Castro, G. and Poulos, S. J. (1977). "Factors AffectingLiquefaction and Cyclic Mobility," Journal of the GeotechnicalEngineering Division, ASCE, Vol. 103, No. GT6, pp. 501-516.
Castro, G. (1968) "Laboratory Investigation on UndisturbedSamples of Subsoils for the CONOX Project," Report to Companiade Acero del Pacifico, Harvard University, Cambridge,Massachusetts.
Earth Technology Corporation, Long Beach, California, (1985)."Cone Penetration Tests, Lower San Fernando Dam," Project No.86-140-03 report to U.S. Army Corps of Engineers.
Farrar, J. A. (1986). "Travel Report," Code D-1542, U.S.Bureau of Reclamation, Denver, Colorado, April 14.
Geotechnical Engineers Inc. (1985). "Seismic Studies -Pinopolis West Dam," report submitted to U.S. Army Corps ofEngineers, Savannah District, GEl Project 84351.
Gutenberg, B. and Richter, C. F. (1956). "EarthquakeMagnitude, Intensity, Energy and Acceleration (Second Paper),Bulletin of the Seismological Society of America, Vol. 46,No. 2, pp. 105-146, April.
47

REFERENCES(continued)
Ishibashi, I.; Kawamura, M., and Bhatia, S. (1985). "Effectof Initial Shear on Cyclic Behavior of Sand," Journal ofGeotechnical Engineering, Vol. 111, No. 12, December.
Jacques, H. L. (1930). "Report on Dams After Earthquake ofAugust 30, 1930," Los Angeles Department of Water and Power,File No. AX-245.
Keller, T. 0. (1981). "Procedure for Undisturbed FixedPiston Sampling of Cohesionless Soil," Geotechnical EngineersInc. (GEl), Internal Memorandum, 23 pp., Rev. May 1982.
Lee, K. L.; Seed, H. B.; Idriss, I. M.; and Makdisi, F. I.(1975). "Properties of Soil in the San Fernando Hydraulic FillDams," Journal of the Geotechnical Engineering Division, ASCE,Vol. 101, No. GT8, pp. 801-821.
Marcuson, W. F. III and Franklin, A. G. (1980). "State ofthe Art of Undisturbed Sampling of Cohesionless Soils,"Geotechnical Engineering, Vol. 11, pp. 31-52.
Mayeda, S. H., Jackson, L. A., et al (1969). "Lower SanFernando Dam 1967 Core Hole Investigation," L. A. Departmentof Water & Power, Water Engineering Division.
National Research Council (1985). "Liquefaction of SoilsDuring Earthquakes," Report No. CETS-EE-001, Committee onEarthquake Engineering. National Academy Press, Washington,D.C.
Newmark, N. M. (1965). "Effects of Earthquake on Dams andEmbankments," Geotechnique, London, Vol. 5, No. 2, June.
Poulos, S. J.; Robinsky, E. I.; and Keller, T. 0. (1986)."Liquefaction Resistance of Thickened Tailings," Journal ofGeotechnical Engineering, ASCE, Vol. 111, No. 12, PaperNo. 20213, pp. 1380-1394.
Poulos, S. J.; Castro, G., and France, J. W. (1985)."Liquefaction Evaluation Procedure," Journal of GeotechnicalEngineering, ASCE, 111(6) pp. 772-791.
Poulos, S. J. (1971). "The Stress-Strain Curves of Soils,"Geotechnical Engineers Inc., Winchester, Massachusetts,pp. 1-80.
48
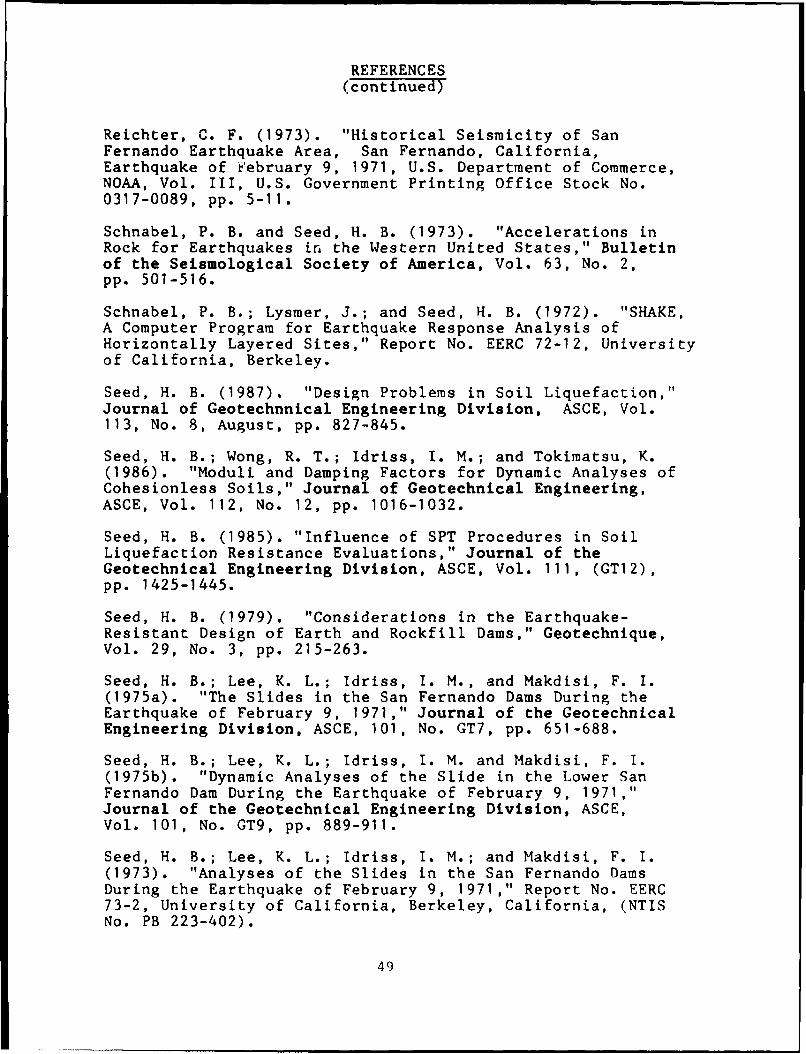
REFERENCES(continued)
Reichter, C. F. (1973). "Historical Seismicity of SanFernando Earthquake Area, San Fernando, California,Earthquake of February 9, 1971, U.S. Department of Commerce,NOAA, Vol. III, U.S. Government Printing Office Stock No.0317-0089, pp. 5-11.
Schnabel, P. B. and Seed, H. B. (1973). "Accelerations inRock for Earthquakes in the Western United States," Bulletinof the Seismological Society of America, Vol. 63, No. 2,pp. 501-516.
Schnabel, P. B.; Lysmer, J.; and Seed, H. B. (1972). "SHAKE,A Computer Program for Earthquake Response Analysis ofHorizontally Layered Sites," Report No. EERC 72-12, Universityof California, Berkeley.
Seed, H. B. (1987). "Design Problems in Soil Liquefaction,"Journal of Geotechnnical Engineering Division, ASCE, Vol.113, No. 8, August, pp. 827-845.
Seed, H. B.; Wong, R. T.; Idriss, I. M.; and Tokimatsu, K.(1986). "Moduli and Damping Factors for Dynamic Analyses ofCohesionless Soils," Journal of Geotechnical Engineering,ASCE, Vol. 112, No. 12, pp. 1016-1032.
Seed, H. B. (1985). "Influence of SPT Procedures in SoilLiquefaction Resistance Evaluations," Journal of theGeotechnical Engineering Division, ASCE, Vol. 111, (GT12),pp. 1425-1445.
Seed, H. B. (1979). "Considerations in the Earthquake-Resistant Design of Earth and Rockfill Dams," Geotechnique,Vol. 29, No. 3, pp. 215-263.
Seed, H. B.; Lee, K. L.; Idriss, 1. M., and Makdisi, F. I.(1975a). "The Slides in the San Fernando Dams During theEarthquake of February 9, 1971," Journal of the GeotechnicalEngineering Division, ASCE, 101, No. GT7, pp. 651-688.
Seed, H. B.; Lee, K. L.; Idriss, I. M. and Makdisi, F. I.(1975b). "Dynamic Analyses of the Slide in the Lower SanFernando Dam During the Earthquake of February 9, 1971,"Journal of the Geotechnical Engineering Division, ASCE,Vol. 101, No. GT9, pp. 889-911.
Seed, H. B.; Lee, K. L.; Idriss, 1. M.; and Makdisi, F. I.(1973). "Analyses of the Slides in the San Fernando DamsDuring the Earthquake of February 9, 1971," Report No. EERC73-2, University of California, Berkeley, California, (NTISNo. PB 223-402).
49

REFERENCES(concluded)
Seed, H. B. and Idriss, 1. M. (1970). "Soil Moduli andDamping Factors for Dynamic Response Analyses," EERC Report70-10, College of Engineering, University of California,Berkley.
Seed, R. B.; Jong, H. and Nicholson, P. G. (1987)."Laboratory Evaluation of Undrained Cyclic and ResidualStrengths of Lower San Fernando Dam Soils," Report No.SU/GT/87-01, Stanford University, Stanford, California,168 pp.
Siegel, R. A. (1978). STABL User Manual, Joint HighwayResearch Project, File No. 6-14-11, Engineering ExperimentStation, Purdue University, West Lafayette, Indiana, June.
Siegel, R. A. (1975). "Computer Analysis of Ceneral SlopeStability Problems," Joint Highway Research Project, File6-14-11, Engineering Experiment Station, Purdue Unviersity,West Lafayette, Indiana, June.
Suzuki, T. (1966). "Lower San Fernando Dam Investigation ofHydraulic Fill," L. A. Department of Water and Power, WaterEngineering Division, May 1966, Rev. November 1966.
U.S. Army Corps of Engineers (1970). "Engineering and DesignStability of Earth and Rock-Fill Dams," Manual No. 1110-2-1902, Office of the Chief of Engineers, Washington, D.C.
Vasquez-Herrera, A. and Dobry, R. (1988). "Evaluation ofLiquefaction Triggering in Lower San Fernando Dam in 1971Earthquake Using Torsional Cyclic Tests," RensselaerPolytechnic Institute, Troy, N.Y., Dept. of Civil EngineeringReport to U.S. Army Corps of Engineers WES, in preparation.
WES (1987). Waterways Experiment Station Laboratory TestData. Telephone Communication.
Wilun, Z. and Starzewski, K. (1972). "Soil Mechanics inFoundation Engineering" Vol. 1 John Wiley and Sons, New York,N.Y., 252 pp.
Wright, S. G. (1974). "SSTAB2 - A General Computer Programfor Slope Stability Analyses," Research Report No. GE-74-1,Department of Civil Engineering, the University of Texas atAustin, August.
50

NOTATIONS
The following symbols are used in this report:
Symbols and Abbreviations
Ac = area of triaxial test specimen after consolidation
amax = maximum base rock acceleration
Bc = Skempton's pore pressure coefficient after con-solidation
C = cone penetration test sounding prefix
c = cohesion intercept of a strength envelope
CR = clearance ratio of sampling tube = ID CECE
where ID = inside diameter of tubeand CE = inside diameter of cutting edge
CR = consolidated undrained cyclic load triaxial test
CR = CR test followed by an R phase
D10 = diameter at which 10% of the soil is finer by weight
E = east
et = void ratio in sampling tube
e = void ratio
ec = void ratio after consolidation
ES = exploration shaft
e19 85 = in situ void ratio at time of sampling in 1985
e1971 = in situ void ratio immediately prior to 1971San Fernando earthquake
F = force
Fa = maximum cyclic load applied in CR test
51

NOTATIONS(continued)
FD = field density test
FL = factor of safety against liquefaction susceptibility(equal to ratio of Sus/rd)
Fr = maximum load above anisotropic load felt by sampleduring cyclic loading in CR test
ft = feet
G = specific gravity of solids
G = shear modulus
g = acceleration due to gravity (32.2 feet per second)
Gmax = shear modulus at very low strains
Kc = consolidation stress ratio = ;lc/53c
Ko = coefficient of lateral earth pressure, equal toh/av
k(t) - time history of average acceleration of sliding mass
kmax = maximum value of k(t)
ky - yield acceleration
LV = laboratory vane shear test; undrained
N = north
N - standard penetration test blowcount, blows/foot
NGVD = National Geodetic Vertical Datum; elevation
p = mean of minor and major effective principal stressesor vertical effective stress when used in the form c/p
q = one half of difference between major and minorprincipal stress; shear stress on plane inclined at458 to major principal plane;
qa = maximum applied q during CW test; summation ofqc and Fa/Ac
52

NOTATIONS(continued)
qc = q at completion of consolidation
qp = q when peak shear stress is reached during triaxialtest
qr = maximum soil stress felt by sample during CR test;
summation of qc and Fr/Ac
qs = q during steady state deformation
qus - q during steady state deformation; undrainedconditions
= consolidated undrained, monotonically loaded triaxialtest
S = south
S = degree of saturation
S - split-spcon sample boring number prefix
S = consolidated drained, monotonically loaded triaxialtest
sec - seconds
Sds - drained steady state shear strength
SSL = steady state line
Sup - peak undrained shear strength
Sus - undrained steady state shear strength
Sy = yield strength
t - time
t = tons
tsf = tons per square foot
TS = tripod tube sample number prefix
U = undisturbed sample boring number prefix
53

NOTATIONS
(continued)
U = undisturbed sample number prefix for fixed piston
samples from borings
uc = backpressure in triaxial test
V = volume
W = west
W = weight of sliding mass
as = slope of line through points representing steadystate of deformation on stress path plot (q versus
AV = change in volume
Ae = change in void ratio
6 = shear deformation
ca = axial strain
es = axial strain when steady state deformation is reachedduring triaxial test
ep = axial strain when peak shear stress is reached duringtriaxial test
Cec = axial strain at end of cyclic loading in CR test(see Fig. F105)
Crf = axial strain at start of rapid failure in CR test(see Fig. 105)
etr = triggering axial strain; axial strain required to
trigger liquefaction failure
= shear strain
Yt = total unit weight
Yd = dry unit weight
ldc = dry unit weight at end of consolidation
Ytr = triggering shear strain; shear strain required totrigger liquefaction failure
54

NOTATIONS(concluded)
P = Poisson's ratio
Ts = friction angle at steady state of deformation interms of effective stress
Tp = maximum effective stress friction angle computed froma Mohr diagram
ah = horizontal effective stress
al = major principal effective stress
o1c = major principal effective stress after consolidation
0 3ec = minor principal effective stress at end of cyclicloading in CR test (see Fig. F105)
03s = minor principal effective stress during steady stateof deformation
j3rf = minor principal effective stress at start of rapid
failure in CR test (see Fig. F105)
;3 = minor principal effective stress
;3c = minor principal effective stress after consolidation
of = effective normal stress on failure plane
ofs = effective normal stress on failure plane duringsteady state of deformation
Ov = vertical effective stress
oo = octahedral effective stress; also contact stressbetween soil particles
= shear stress on failure plane
Td = driving shear stress on failure plane
55

AM 0 N 4"e r4. 4. 1 1
'43 i . . . a
U. 0
cc 0 m o- '1
C6 A
LLo
414)
C, 0 00 0-000 r41% 4*0 4 2,L
LO lm 0% 0 ,
>X1 .0 I 41
C.- M0j 0 v
cc aa a 4WA
XU a 64-00~ 0. . . =4 I4
cf) a a. -. .
W- u ~ 0.
CIO biA 0 0 0 0 0 0 0 0 a a D a a "aa4 3 a L4.
4..)0. ~ Q4- NO 0.. 0
0000 C04 40Ua0 81 0 a0 00 a
- -- - - - -C o
-0 14 .1a01 "U 0
0 0 Li a x
z C 0do~ -C0 I - -0 4u0cN . : a~r I 14 0
0 44 . W1 P1 00 0 0 0 0 0 00 0 0 . 41
C 0 0000 A ( t - 0 a Cc 004. U W -o CcC af-.4 0 cL 0
IO a ago- 4.
-: -*1. W.. . . . . . . . I. W W W a 4tJH td~ i W00 0 00 0 0 0 I 0 1

a- 0 10 60 0. 0 '
cc CC-0 10* c0
6I? UC Gooa-C4 o4) A1
de 0
UD aS a 60 N N 0
61 0
U 00 41
.- Ong to Go- go 0 co.
- W b3 N N . NN26
> 61 a0 0 ) 0
*0
ad Go en 4-
0 0
w - ' N 'C h 0'0N N
-. " . . . . . . ..A to L.-C 1 0 0 0 CL006
8-0. to 6
cm a- ".a0.-'N 2 1 a-0'~ ~~~~ 61 c C U 4 0U'
~0 0 - -
w e % 4"11 0 61
- -4 L. 1.0 N 04.'; 4 N l
40 u 1wC, w 01 - 0 - 0 -IM16 1
00661 0 04 0 w (C N 0 0 N444C.-. P~~b23 W4 0.0 'C N MC 4,' C N 0 6
0~~~ V-. c~ - - .. . . . . .- o 6 Lcn -A a- . '4.z 4 L
0 0 v .. '.
061 '-' 41 0 1 .0124C260.0 0o -CO.
a 0 ~ C~0 t . 4, a
0 0 e4 0A 0'~ 21 .6
w~ Go0.0

TABLE 3 - VOID RATIO CORRECTIONS APPLIED TOCRITICAL LAYER TUBE SAMPLESLower San Fernando Dam
Page I of 2
Upstream/Void Ratio Changes DownstreamBetween 1971 and 1985 Void Ratio
Sample Boring No. DifferenceTriaxial or AeI Ae2 Ae3 Ae4Test No. Exploration
GEl Shaft(ES)Tests _ _ __ (1) (2) (3)
RI ES 0.0260 0.0065 -0.0248 0.011
R5 U111A 0.0254 0.0063 - 0.011
R6 ES 0.0259 0.0064 -0.0224 0.011
R7 ES 0.0254 0.0063 -0.0309 0.011
R8 U103 0.0376 0.0069 - 0.011
R12 ES 0.0247 0.0061 -0.0270 0.011
R13 ES 0.0261 0.0065 -0.0306 0.011
R14 U111A 0.0262 0.0065 - 0.011
R15 U111A 0.0258 0.0064 - 0.011
R16 U111A 0.0255 0.0063 - 0.011
T17 U111A 0.0252 0.0063 - 0.011
R18 Ulll 0.0253 0.0063 - 0.011
R19 U103 0.0361 0.0066 - 0.011
R20 U111A 0.0248 0.0062 - 0.011
CR1 ES 0.0258 0.0064 -0.0284 0.011
CR-2 ES 0.0256 0.0064 -0.0259 0.011
Notes: see page 2.
Project 85669
Geotechnical Engineers Inc. January 15, 1988
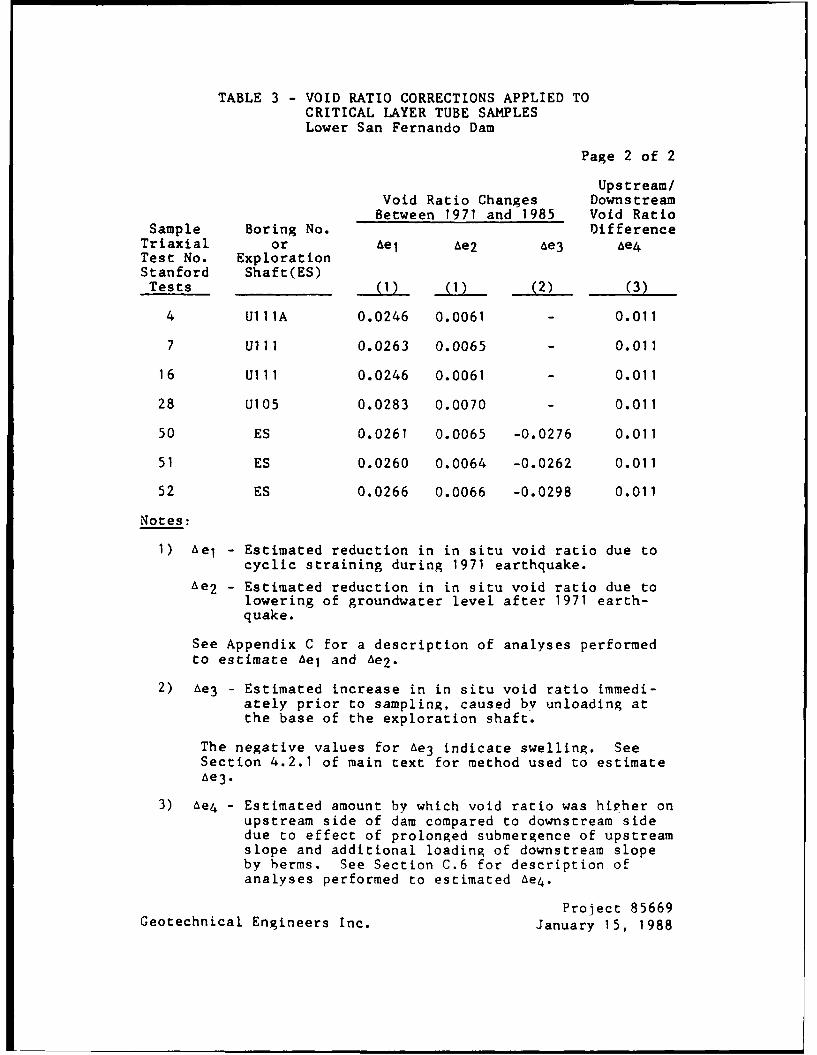
TABLE 3 - VOID RATIO CORRECTIONS APPLIED TOCRITICAL LAYER TUBE SAMPLESLower San Fernando Dam
Page 2 of 2
Upstream/Void Ratio Changes DownstreamBetween 1971 and 1985 Void Ratio
Sample Boring No. DifferenceTriaxial or Ael Ae2 ae3 Ae4Test No. ExplorationStanford Shaft(ES)Tests (I) (i) (2) (3)
4 UllA 0.0246 0.0061 - 0.011
7 U111 0.0263 0.0065 - 0.011
16 U111 0.0246 0.0061 - 0.011
28 U105 0.0283 0.0070 - 0.011
50 ES 0.0261 0.0065 -0.0276 0.011
51 ES 0.0260 0.0064 -0.0262 0.011
52 ES 0.0266 0.0066 -0.0298 0.011
Notes:
1) Ae I - Estimated reduction in in situ void ratio due tocyclic straining during 1971 earthquake.
Ae 2 - Estimated reduction in in situ void ratio due tolowering of groundwater level after 1971 earth-quake.
See Appendix C for a description of analyses performedto estimate AeI and Ae2 .
2) Ae3 - Estimated increase in in situ void ratio immedi-ately prior to sampling, caused by unloading atthe base of the exploration shaft.
The negative values for Ae3 indicate swelling. SeeSection 4.2.1 of main text for method used to estimateAe3•
3) Ae4 - Estimated amount by which void ratio was higher onupstream side of dam compared to downstream sidedue to effect of prolonged submergence of upstreamslope and additional loading of downstream slopeby herms. See Section C.6 for description ofanalyses performed to estimated Ae4 .
Project 85669Geotechnical Engineers Inc. January 15, 1988

TABLE 4 - NUMBER OF TESTS PERFORMED TO DEFINESTEADY STATE LINE OF CRITICAL LAYER SOILLower San Fernando Dam
RS
Isotropic Anisotropic Isotropic Anisotropic
COMPACTED MOIST
Lubricated End 8 3 2 -
Conventional End - 2 - -
SLURRY
Lubricated End 2 - - -
Conventional End -..
Definitions:
- Consolidated undrained monotonically loadedtriaxial test
S - Consolidated drained monotonically loadedtriaxial test
Isotropic - Sample consolidated isotropically; refer toAppendix F, Section F.4.4
Anisotropic - Sample consolidated anisotropically: refer toAppendix F, Section F.4.5
Compacted Moist - Sample prepared in layers of moist soil
Slurry - Sample placed as a slurry
Lubricatcd End - Top and bottom platens were lubricated and height todiameter ratio of sample was typically 1.3
Conventional End - Top and bottom platens were not lubricated and heightto diameter ratio of sample was typically 2.0
Project 85669Geotechnical Engineers Inc. January 15, 1988

v c
- a41 4/C -. -
N~ 4 0.0. $1* U
-'~~ w sm a 0 ~ N . 4 U U~. U (
/ 0- w 4 /U 0- c C4u //
O1 0 //.uU
C4 m/ON m I
C. 0; 04 00 0 0 ~4) 40 U C 4, 's O/ ua) 4p w/UN wU w 0 a-.-~ CU.0 tu -. 4Ol- 0U, 0. - . U5.1
e0 Go C 0. U 4/'>4C m 4C c/ C >'X ). 0 0/.
C 44 ofU /-. v/
-"/I-0 0 :1 0 w moCL.'E 4~ o / U r 0 . - C
00 4 0 0 .4 - U4 4 4u0 .C U * 0 ~ ~ 3.4/0- O U C
- U . /UO0- 'o. 4/ '0 4/CUA A >, ds 04 W, - C .0 41U
0~- w 0)/ M..0 M 4/. 4/ .4.-3O
U, 4/4/4/4/ 41./ 44 / U '4110
- ,03 ZI - - -4/ U) -o-
zoo 4/ m, UU > 0. .UC43.:.A /0 U U0 U U341
do". -4 . / cc0 on. - 0 2 4/ 4/0..
0 z.O 4/U 0-- 0 -4 C.th- N/ 0 04 U U O U
4/N 4//-3. U *'0-
'n do/ v0 0. w09/' COI 0 C 0 0 0 0 0
< c3 - x 4.4) 0- N 4 0' N. 0 4 e .0
t/J ON N. CL m 0 44/ 0 0. 0C6 0 >li N. r'. 'C >, -. I. N
0..3 0U/a 40 0- 0 0 0
004 m. 0 e //'"0 / 0 u . . 'U . m1,Z 4C 4/ '0 -l0
o. Co OC/ 0 / M 4
N.40) 44 a QU 0 4/OCO0 . . U 0) C C~/ 2 4/(- N0 m/ .4 N. U 4 1C O 0/ . 4
0~ ... U.. . . . . . . .4c.K. U u 0 - 4
~ U~ / ./ 4 4 4 4 ' ~' '0. '0 0a 00 0 0 0UC
U 0 0 04e4U~~~~ 0024.' / U
U'0U33U 0 / c -cotj0V'4/4/ -1 Uo a- 00 n U4/ 0U4 CU. W/ 4/ u - tfU0 U0 00 U 0. 11 M M. C1 4/
.3 4/4 U.44 4/ 4/ 1 OL40* C U 0 U0 C U 0.C4/
0 0- 4 .O/4 -0 4/ - 0(L
V/1 . -0 U 1040 -0 1 1c 1
0~ ~~ ~ 0..0 m/3 31.- 0 4/ 0 4/
0 1 IO/U, 0 Uc C '.0,4
, .04/ U5 W.2 C C004/ > 4U0 UO w/ 2/4 .. ' W
0/ .0 - 00 / u.' 4~ // 4 / / //4 0. /4 0 U U . ~ U14 - . n 0 4U U 3 U. U 40 .- 0./
K U~ ~~ ~ '/ f - w0 .0- . / U / 0 I C U 4 4 / 04// .0~ .000 . 10 - '.U. '-- 4 0.O 0 U C
U U U O U4//-".~ U! 4/ U -- COU 4/ 0 4/ 03 U4/' 4/I-''0 .- 4U0.~~'.- 9 I CN./

TABLE 6 - SUMMARY OF MOST SIGNIFICANT EARTHQUAKES IN THESAN FERNANDO VALLEY AREA
Low San Fernando Dam
Data from NG0C/NOAA Records 2 )
Earthquake Date"1 Distance from Maximum Magnitude Estimated MaximumDam Site to Intensity 3 ) Acceleration at
Epicenter Lower San Fernando Dam4 )
(miles) g
1919, February 16 58 VII N R -
1920, June 21 22 VIII 4.9 <0.01
1925, June 29 76 X 6.25 0-0.03
1926, February 18 61 VI N R -
1927, November 4 >125 - 17.51 0-0.03
1930, August 30 275) VI 5.25 0-0.025)
1931, April 4 (81 - (4) 1 0.041
1933, March 10 55 IX 6.3 0-0.07
1952, July 21 58 XI 7.7 0.05-0.12
1952, August 22 74 VIII 5.8 0-0.02
1952, August 23 23 VI 5.0 0-0.02
1954, January 12 58 VII 5.9 0.01-0.05
1956, February 7 22 V1 4.6 1 0.021
1964, February 8 (83 - 13.71 1 0.031
1964, August 30 2.5 V 4 I 0.051
1965, July 16 14 VI 4 1 0.021
1971, February 9 96) Xl 6.5 0.55-0.607)
Notes:
1) Significant pre-1971 earthquakes In the San Fernando earthquake area listed byRichter (1973), starting from the end of dam construction.
2) Data from the National Geophysical Data Center/National Oceanic and AtmosphericAdministration earthquake data file. Values In brackets taken from Richter
(1973) because Information not provided by NGOC/NOAA. N R indicates no record.3) Maximum Intensity Is Modified Mercall Scale of 1931.4) Maximum accelerations at dam site estimated from attenuation curves presented by
Schnabel, et al (1973), except for 1971 earthquake. The distance from causativefault to dam site was taken to be tht distance between the epicenter location anddam site. Values In brackets for low magnitude earthquakes are based onGutenberg and Richter (1956) relationships for California earthquakes.
5) Richter (1973) Indicates that there are questions about the location of the epi-
center for this earthquake and that It may have originated In Chatsworth (cloerto the Lower San Fernando Dam). If the earthquake were located In Chatsworth,
the estimated maximum acceleration at the dam site would range from 0.02 to 0.09 g.
6) The fault trace was closer to the dam site than the epicenter.7) Maximum accelerations at the dam site based on the Interpretation of selsmoscope
record from rock abutment (Seed, 1973).
ProJect 85669
Geotechnical Engineers Inc. January 15, 1988
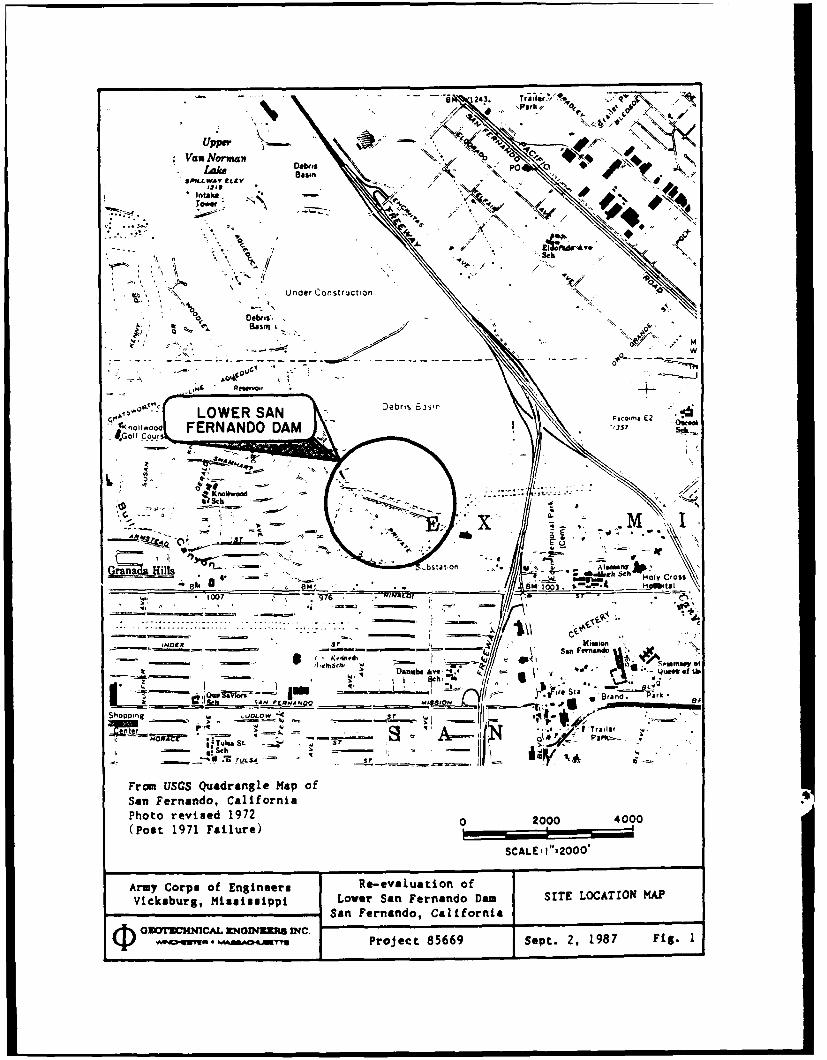
xPafkv' K'~~
Upiwer ___- 4
Van Normaw NIr 9"P ~ ~ NLake Basin
SPILL WAY tLEV
Sin - /
Tow -\/ .
A. El- ' zVic'
M Under' Cosruto
% Deb.i.
0Bs k~
0eri Debris
LOWER SAN Pao~ E2'rnlwo FERNANDO DAM -,.757
4Golf -C -U-rs
"Z V E _
HiKs-o "3c_____ ____ - M B 103. .1* 2!4t8
Hi -- ". h SW'1
Sr Mimian~ - ~ I See Fernando '
...... Y~~O IB, NL Brand. Pirk.
Shoppo 1 u~w sr- ~ ~ ~ --. '
' A*.. * t Trader1.O -0 ,, -I
-a Sch I
From USGS Quadrangle Map ofSan Fernando, CaliforniaPhoto revised 1972020040(Post 1971 Failuare) 20000
SCALE! 1":2000'
AMY7 Corps of Engineers Re-evaluation ofVicksburg, Mississippi Lover San Fernando Dam SITE LOCATION MAP
ISan Fernando, CaliforniaG O3rTCHMCAL VfODMINDC.
~Tm.&w4.inYgProject 85669 Sept. 2, 1987 Fig. 1

C 06
a:a
XI
og 0
I, a
4' JS 100 j
0~0./
I~ -J
I" ~ ell
CAON .1 'OI.LVA3I1

0-0-
in.
0- 47%
w wl0 4
0 cn
z 4-341 0
0 0 0-
0 0
ul 11 10
do~ 0
cl~ v wv
a
0o w
za z
00
0--
0 C04
ot
X E
. >
C4-
Ch
_00o -
4,
0o 0 0 0 0 0 0 0 0 0 L0D Nl W u ~
- Z z 0 0 a.1333 NI NOII'VA313
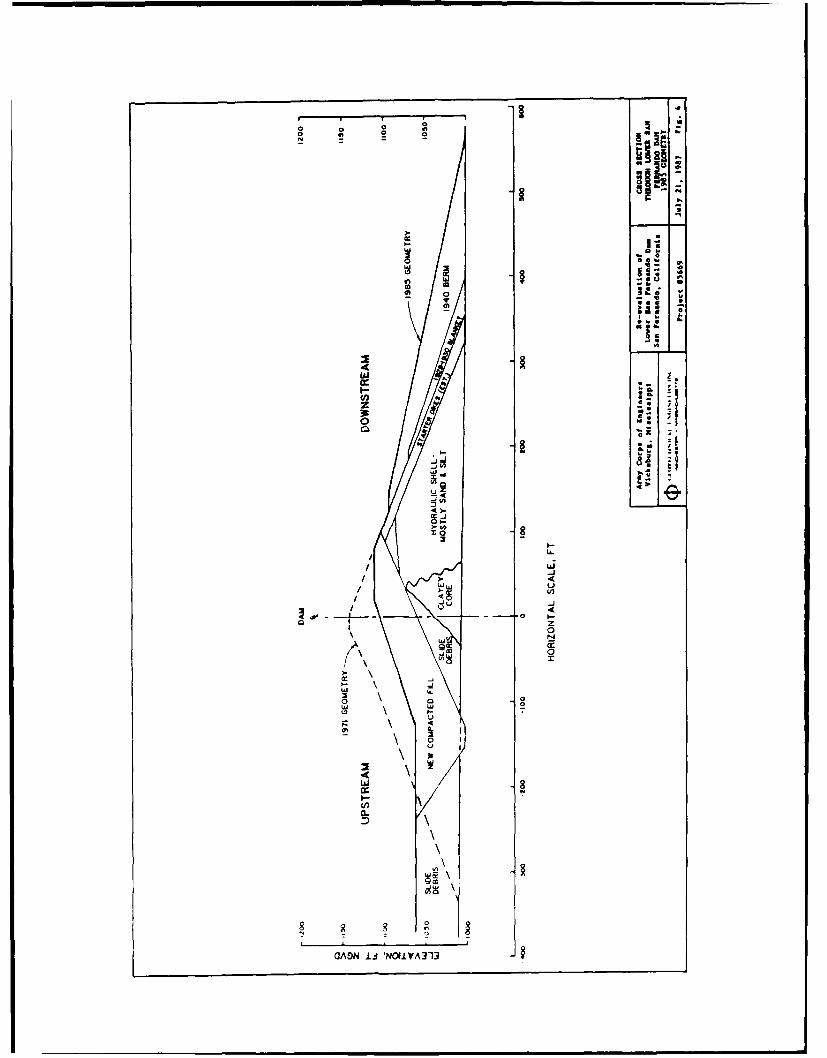
0 3
oo 0a
ot
in"m* 0
uih
0O
NU
eCgDI ~
GAON~~~* 1- C11A

00-6+
00 00 0Eo
0 @
Sa, at
(4 3 .
W 00-01+ -I - -
P* - :3go
o2 1 -
o~ (.5
U uI~In-1' .
- -,on

0_-I I I
w2
C2.;zA
3t!4
10*O,-
*
o[
&Wt
,j :
m InI
(0
> (0
w w
0-j0
aAS ii'OLY3

0
In -z
WJ I I J W
ISOt
U);
00
ACi
Zo)N 'MVT

Ya
m I.-I in
w CIino Z -
aAS 1. UXA

l u I
I nI
0 Lo
I I.4 U) U
UI ,UaV)40
hi I
> 0
-. 7J I
a:'
0 00 4
~Iiic 'Hi~

06
0 0 12
01*
LL
0 AI\/
L.J 'Hd

.LHO13M AS U3SdVOO .LN33N3d -
0 9 0 0 0 0 0 0 0 0 0 ) -
C~~.J~ >r A (0 ~ 0 d
0 UU
U)4 =)
t/ L
4"
0
00
Ia 1LIv...-- ,g ---------
0 4r 0
W, 16 laj _e 4) L"
- La
V 0.
w U)z4 -r0
0
Ccco 0
m 0
----l--- -- - - -I Tt1 z
~ 9 0
iHDI~~~t AS0Nii33

STEPS IN LIQUEFACTION EVALUATION PROCEDURE-CRITICAL LAYER OF LOWER SAN FERNANDO DAM
Obtain Measure Estimate In situ EstimateUndisturbed e 198 5 A e Between In situSmples 1971 and 1985 e1971in 1985
Prepare Perform R and DetermineBatch Mix S Tests on SSL
Batch Mix
Perfor R Tests Determine
on Undisturbed SUB ofSamples Undisturbed
Samples in, Lab
EstimateIn Situ
SuA in1971
Calculate
d
Calculate
F L
Army Corps of Engineers LRe-evaatio Fen oD FLOW CHART FORVickobvrg, Mississippi oe a Frad a EVALUATING LIQUEFACTION
,. San Fernando, California SUSCEPTIBILITY OF
____________ __________ CRITICAL LAYER
o Vo*0mV 0 Mc. Project 85669• ,,,ot= .,.,., , Sep. 2, 97 Fig. 12

0.020
0.015CP
0
I"--RR TEST NO.
.c:_0.010 3f0
*5(3
0
0.005
00
0 20 40 60 80 100
Percent Fines(Passing No. 200 Seive)
Note: This plot is based on data obtained during Phase eof Tests CRRI through CRIB. Refer to Appendix F,Section F.4.7 and Figs. F94 through F98.
Army Corps of Engineers Re-evaluation of COEFFICIENT OF SWELLINGVicksburg, Mississippi Lower San Fernando Dam VS. INITIAL VOID RATIO
San Fernando, California
i GEECHNICAL KINGINEERS INC'.4... ss&,,ti~ Project 85669 Sep. 2, 1987 Fig. 13

Dry Unit Weight, pc f
115 110 105 100 95 901030
1025
UU
Lii
I
1015 I
, 0
1010
005
1000 - _ _ ___ _
0.4 0.5 0.6 0.7 0.8 0.9Insjtu Void Ratio, e
At rime of 1985 Sampling
0 Explorcton Shaft-Tripod Tube Samples
AExploration Shaft -Sand Cone Density Tests Hydraulic bhell
0 Boig lladU11 ixe Pito TueSmls Une emRa
* Boring 00 103-Fixed Piston Tube Samples
V Boring U105- Fixed Piston Tube Sample - Sand Layer in Core
Army Corps of Engineers Re-evaluation of 199 IN SIT'U VOID RATIOSVicksburg, Mississippi Lower San Fernanoo Damn OF CRITICAL LAYER
___________________ - San Fernando, California VS. DEPTH
•ENGNEERS INCSProect 85669 Sep. 2, 1987 Fig. 14

IA
0 -4
E -r
I'- 0.u G
0'
a. u
0i N o0~
Er 00I)
uJ 0 ,
< W 0J~ 0IJ0
u- 0 U4
0~~ 0
o 000 0 I
o5 d-
8 a 9.. O I-A

U')Cm-4
CK
U. 0
400
00 0
0- w
0-0,
00
0 CL
00 0 0 0
00 0OJVHGQ

-t
2 -
I! Ti 60 4.1 3~1 ___ I. *
U :~ -:82!.
CI ~Ii ~tij ~
!~ i~I A~
i ~ Q. iiS - 0
2 -o -- !u3~
J.w 5 *6_____________________ - -~ -
* *ca eel* ~z a
* C ~ S.U .~. a.
a 6 *b.- -N o B0
S-k
* 1"* .5U -
a1/
'U / S- A/ .1/ 7 I U* :~
'U''1 4
//
~/ // /
/ // CS
/ 00
I' ____________ cn0
4 0
(A'1// if aS
(A
owCa
'09/3 II C
@0
I
/070..
I I I I -
o 0 Q A QI- w A
o 0 0 0 o 0 0
B'OIIO~ PIOA

UPSTREAM1030
Driving Shear StressUpstream Slope
1025 -
14
1020-*(28)
0 1015- 6 19
0 13> O * CRRIOCRRZ "2-J 0 (1 @ 12 o. (50) (4) W N
(16) (52) 20 597
1010-
*16
1005-
Average Sus
"Two-Thirds" Sus
1000 I I I I I 0 0.2 0.4 0.6 0.8 1.0
Sus of Critical Layer onUpstream Side of Dam
At Time of 1971 Earthquake
* Exploration Shaft Samples
6 Boring UIII and UIIIA Samples
* Boring U103 Samples
NOTES: Number next to each point Indicates A or CRR test numberNumbers in parentheses ore Stanford Univ. tests(Table 2)4 12 excluded from averaging
Army Corps of Engineers Re-evaluation of 1971 IN SITU STEADYVickeburg, Mississippi Lover San Fernando Dam STATE STRENGTHS OF
San Fernando, California UPSTRE CRITICAL LAInGE7CHIA SOILSER IN osvs. ELEVATION
Project 85669JaENnINEERSF INC, *,E-R*MA... As~:4,E,,S Project 85669 jan. 15, 1988 Fig. 18

DOWNSTREAM1030 I
Driving Shear Stresses;{Downstream Slope After Upstream Slope Failed1025
~-Downstream Slope
020g(28)
n(7) 1
U-6 W-13 OCRR ICRR2 z
M(16) (a 0 2.5(')(52) 20 E
-J 1010
a16
1005AL..Average Sue
Two -Third s!Sus
1000 I0 02 0.4 0.6 0.8 1.0
Sus of Critical Layer onDownstream Side of Dam
At Time of 1971 Earthquake
* Exploration Shaft Samples
N Boring UliI and UIIIA Samples
* Boring U103 Samples
NOTES: Number next to each point indicates A or CAR test numberNumbers in parentheses are Stanford Univ tests (Table 2)A 1 excluded from averaging
.rrnv Coros of Engineers Ae-evaluacion of 1971 IN SITU STE.ALDYJicksburg, Misuissippi Lover San Fernando Dam STATE STRENGTHS OF
San Fernanao, California DOWNSTREAM CRITICAL____________________ LAYERSOILSVS._EL.
GwrcsncL ~u~ ic. Project 85669 Jan. 15, 1988 FLS. 19

- -- -- -- --- DRAINED STRENGTH
C/, -- -UNDRAINED PEAK/ STRENGTH,Sup
c-
w UNDRAINED STEADY
STATE STRENGTH, SusW,
Str
SHEAR STRAINN
Td: DRIVING SHEAR STRESS
Xtr: TRIGGERING STRAIN
Army Corps of Engineers I Re-evaluation of SCEEMATIC STRESS STRAINVicksburg, Mississippi Lover San Fernando Dam CURVE FOR
GEOECHICL EOFNER IN, San7Fernando, California LIQUEFACTION FAILURE
~~St*AiS*Oa~YSProject 85669 Jan. 15, 1988 Fig. 20

FLOW CHART FOR TRIGGERING ANALYSIS
Anisotropically
Consolidated Remolded Determine YieldSpecimens of Critical AccelerationsLayer Soils Such That of Failure Wedge
Through Upstream SlopeSus - 0.75Td
Apply Various Cyclic Determine Time HistoryStresses with of Average AccelerationImpact Loading of Failure Wedge for
Various Earthquake Levels
Perform Newmark Analysesto Estimate Accumulated
Determine Strain Displacements of Failure
Required to Trigger Wedge During VariousFailure of Specimen Earthquake Loadings.
Convert Displacements toStrains of Critical Layer
Determine EarthquakeWhich Would CauseTriggering Strain
to be Reached
Army Corps of Engineers Re-evaluation of FLOW CHART FORVicksburg, Mississippi Lower San Fernando Dam EVALUATING POTENTIAL
TO TRIGGERSan Fernando, California LIQUEFACTION FAILURE
GW TE ICAL FMOKN'EERS INC.- o~I .. *sProject 85669 Sep. 2, 1987 Fig. 21
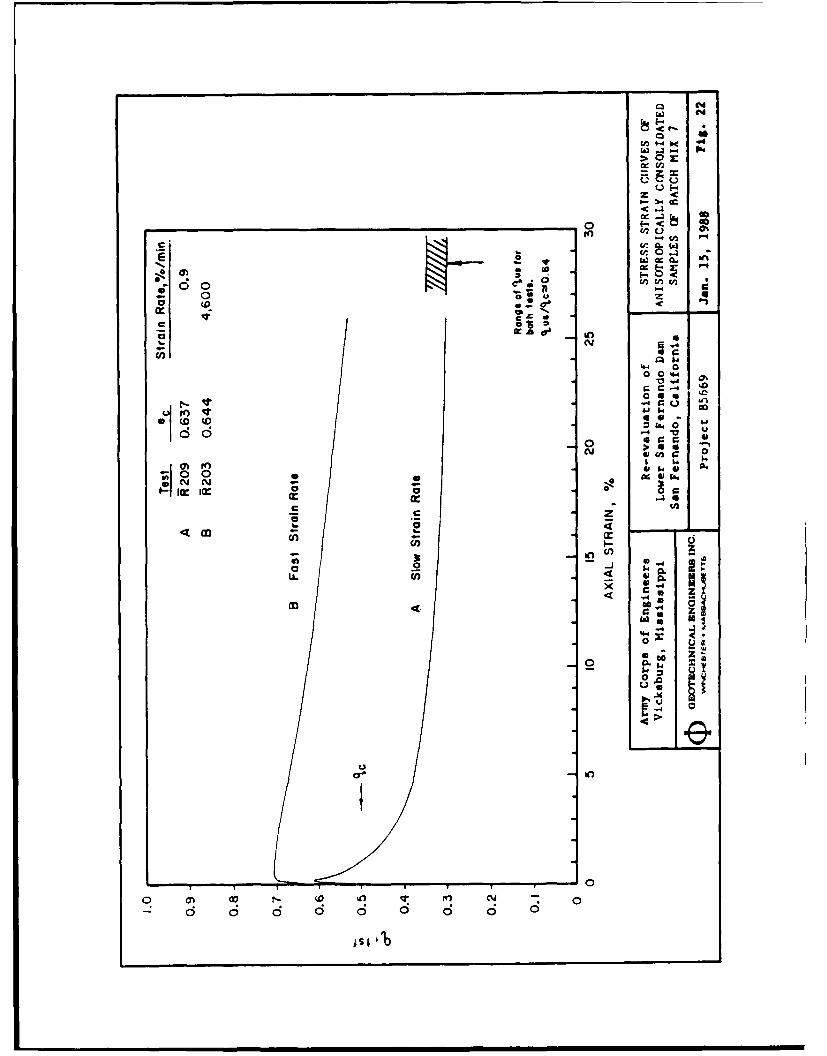
o 4
~cj
0- z
0 40u 0 4
- 0 z uc4 V
0. N .
0
0 0 U, ISO 4cm N
021: a 0 0c 2C
U) 0- -4
00
00
jsj S1
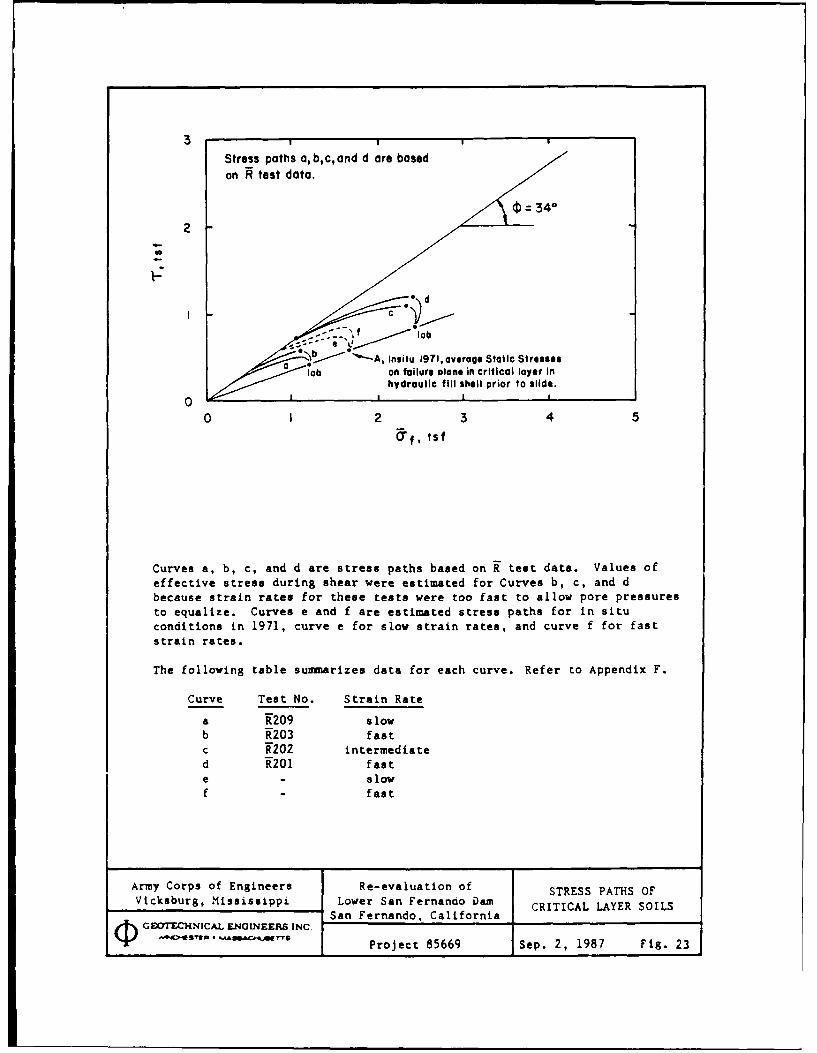
Stress paths a, b,c, and d are basedon test data.
D 43402 L
;' d
>i.. *--A, lnsitu 1971,average Static Stresseslab on failure alane in critical layer In
hydraulic fill shell prior to slide.
0 1 1 I I
0 I 2 3 4 5
0'q, tsf
Curves a, b, c, and d are stress paths based on R test data. Values ofeffective stress during shear were estimated for Curves b, c, and dbecause strain rates for these tests were too fast to allow pore pressuresto equalize. Curves e and f are estimated stress paths for in situconditions in 1971, curve e for slow strain rates, and curve f for faststrain rates.
The following table summarizes data for each curve. Refer to Appendix F.
Curve Test No. Strain Rate
a K209 slowb T203 fastc R202 intermediated R201 faste - slowf - fast
Army Corps of Engineers Re-evaluation of STRESS PATHS OFVlcksburg, Mississippi Lower San Fernanoo Dam CRITICAL LAYER SOILS
San Fernando, CaliforniaGEOTECHNICAL ENOINEERS INC.
I's Project 85669 Sep. 2, 1987 Fig. 23

'-4
-4
'A. 0 0
94
Ilk-
x0
C 46
0~ 01) 0 LA
U, ca r 0wU U
cu 0( 9 0 w
*4D ~ ~ ~ ~ cr Aoi-UD4 DX / ~
0~ 0 00
14)it
x wa3±ANIin <% MI~± wvx
~iVI r3

100-
-A oo -
Of Upstream Slope
5 0 o-4za
Le
0 0.1 0.2 0.3 0.4 0.5
MAXIMUM 8AS£ ROCK ACCELERATION,O max
Army Corps of Engineers Pe-evaluation of COPUTED SHEAR STRAINSVickabuig, Mississippi Lower Sani Fernando Dasi IN CRITICAL LAYER VS.
San Fernando, California MAX. BASE ROCKG___________________________ ACCELERATION, 45T!R*A.... JHyTvS Project 85669 Sep. 2, 1987 Fig. 25

300
Triggering Strong Start ofShakingMajor
11, sec. Co 26et Slide - 50 sec
250 1 "Slide Duration
200
Toa Diig oc
C0
qr 150
2 *o lo5stLL. Zone 5 of Hydraulic Fill,
V 00
E to 67t
0L
S 50 - U Clayey Core
to 16 tU To Dik __020 t
-=D~bonlmsntC~apto 2 t
0 12 3
Shear Displacement, ,ft
N4otes U-Undrained0-Drained
Al-my Corps of Engineers Re-evaluation of QUALITATIVE DRIVING &Vicksburg, Mississippi Lower San Fernando Dam RESISTING FORCES AT
San Fernando, California THITIATION OF SLIDE
Project 85669 Jan. 15, 1988 Fig. 26
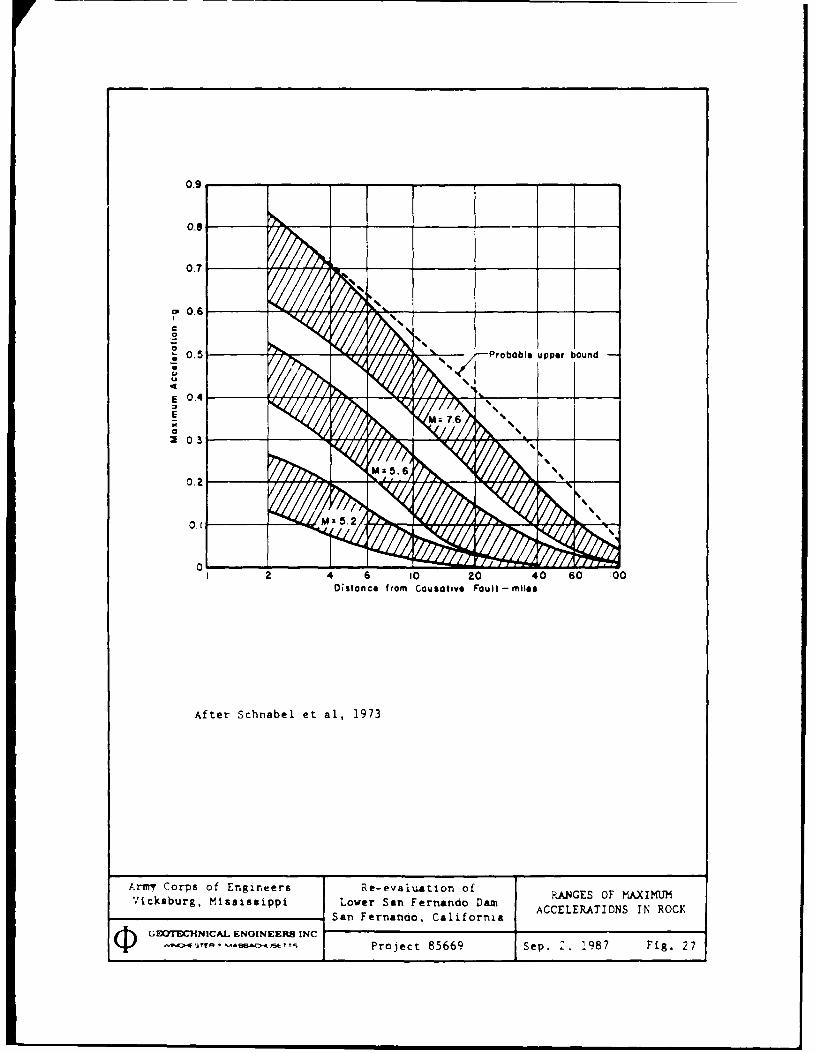
0.9 - __ __
0.6
0.7
0.
S0.5 oalupebon
U4
E 0.4E
2 03
0.2%
0.1 4 Mzz 5
0 2 4 6 10 20 40 60 100Distance from Causative Fault -mile$
After Schnabel et al, 1973
Arm! Corps of Engin~eers J Re-evaluation of AGSOMXIUViksur, isisipi orSan Fernando D na ACCELERATIONS IN ROCKVicsbug, isassipi LorSan Fernando ionaAGSO AIU
GECOrECHNICAL ENGINEERS INCjj4lr Q AMC 1 - Project 85669 Sep. 2. 1987 Fig. 27