Re-enrichment of West European Depleted Uranium Tails in Russia.. · 2005-07-31 · Re-enrichment...
47
Re-enrichment of West European Depleted Uranium Tails in Russia prepared for Ecodefense Russia by Peter Diehl Contents 1. Depleted uranium: the long-neglected waste problem .......................... 2 1.1. Uranium enrichment: the origin of depleted uranium ..................... 2 1.2. Cylinder storage of depleted uranium hexafluoride ....................... 4 1.3. Depleted uranium: waste or resource? ................................. 6 1.4. Possible uses of depleted uranium .................................... 6 1.5. Long-term storage or disposal ....................................... 7 2. Re-enrichment of depleted uranium tails ................................... 10 2.1. Tails enrichment - the deal ......................................... 10 2.2. Mass balance of the re-enrichment process ............................ 12 2.3. Cost balance of the re-enrichment business ............................ 19 2.4. Blendstock production for HEU downblending ......................... 22 2.5. Policy, trade and legal aspects of tails enrichment ....................... 28 Annex: Mass- and cost balance ............................................. 32 Option N ........................................................... 32 Option B ........................................................... 38 Glossary ................................................................ 44 References ............................................................... 46 Abstract Since 1996, depleted uranium tails from West European enrichers Urenco and Eurodif are being sent to Russia for re-enrichment. In Russia, the imported tails are, instead of natural uranium, fed into surplus enrichment cascades. The product obtained from re-enrichment is mostly natural-equivalent uranium plus some reactor-grade low-enriched uranium. These products are sent back to Urenco and Eurodif, while the secondary tails generated remain in Russia, where they are re-enriched further to obtain more natural-equivalent uranium and/or slightly enriched uranium. The latter is then used as blendstock for the downblending of surplus highly-enriched weapons-grade uranium into reactor-grade low-enriched uranium. The ultimate tails left, still comprising at least two thirds of the amount imported, remain in Russia with unknown fate. This paper collects the scarce information available on this strange business, sets up a mass balance for it, looks into its odd economics and the policies behind it. Three driving forces are identified: Urenco‘s and Eurodif‘s aim to avoid tails disposal cost, Russia‘s shortage of uranium deposits, and the trade restrictions for Russian enrichment services.
Transcript of Re-enrichment of West European Depleted Uranium Tails in Russia.. · 2005-07-31 · Re-enrichment...

Re-enrichment of West European Depleted Uranium Tailsin Russia
prepared for Ecodefense Russia by
Peter Diehl
Contents
1. Depleted uranium: the long-neglected waste problem . . . . . . . . . . . . . . . . . . . . . . . . . . 21.1. Uranium enrichment: the origin of depleted uranium . . . . . . . . . . . . . . . . . . . . . 21.2. Cylinder storage of depleted uranium hexafluoride . . . . . . . . . . . . . . . . . . . . . . . 41.3. Depleted uranium: waste or resource? . . . . . . . . . . . . . . . . . . . . . . . . . . . . . . . . . 61.4. Possible uses of depleted uranium . . . . . . . . . . . . . . . . . . . . . . . . . . . . . . . . . . . . 61.5. Long-term storage or disposal . . . . . . . . . . . . . . . . . . . . . . . . . . . . . . . . . . . . . . . 7
2. Re-enrichment of depleted uranium tails . . . . . . . . . . . . . . . . . . . . . . . . . . . . . . . . . . . 102.1. Tails enrichment - the deal . . . . . . . . . . . . . . . . . . . . . . . . . . . . . . . . . . . . . . . . . 102.2. Mass balance of the re-enrichment process . . . . . . . . . . . . . . . . . . . . . . . . . . . . 122.3. Cost balance of the re-enrichment business . . . . . . . . . . . . . . . . . . . . . . . . . . . . 192.4. Blendstock production for HEU downblending . . . . . . . . . . . . . . . . . . . . . . . . . 222.5. Policy, trade and legal aspects of tails enrichment . . . . . . . . . . . . . . . . . . . . . . . 28
Annex: Mass- and cost balance . . . . . . . . . . . . . . . . . . . . . . . . . . . . . . . . . . . . . . . . . . . . . 32Option N . . . . . . . . . . . . . . . . . . . . . . . . . . . . . . . . . . . . . . . . . . . . . . . . . . . . . . . . . . . 32Option B . . . . . . . . . . . . . . . . . . . . . . . . . . . . . . . . . . . . . . . . . . . . . . . . . . . . . . . . . . . 38
Glossary . . . . . . . . . . . . . . . . . . . . . . . . . . . . . . . . . . . . . . . . . . . . . . . . . . . . . . . . . . . . . . . . 44
References . . . . . . . . . . . . . . . . . . . . . . . . . . . . . . . . . . . . . . . . . . . . . . . . . . . . . . . . . . . . . . . 46
Abstract
Since 1996, depleted uranium tails from West European enrichers Urenco and Eurodif are being sent toRussia for re-enrichment. In Russia, the imported tails are, instead of natural uranium, fed into surplusenrichment cascades. The product obtained from re-enrichment is mostly natural-equivalent uraniumplus some reactor-grade low-enriched uranium. These products are sent back to Urenco and Eurodif,while the secondary tails generated remain in Russia, where they are re-enriched further to obtain morenatural-equivalent uranium and/or slightly enriched uranium. The latter is then used as blendstock for thedownblending of surplus highly-enriched weapons-grade uranium into reactor-grade low-enricheduranium. The ultimate tails left, still comprising at least two thirds of the amount imported, remain inRussia with unknown fate.This paper collects the scarce information available on this strange business, sets up a mass balance forit, looks into its odd economics and the policies behind it. Three driving forces are identified: Urenco‘sand Eurodif‘s aim to avoid tails disposal cost, Russia‘s shortage of uranium deposits, and the traderestrictions for Russian enrichment services.

- 2 -
1. Depleted uranium: the long-neglected waste problem
1.1. Uranium enrichment: the origin of depleted uranium
For the use of uranium as fuel in a light water reactor (LWR), the percentage of the fissileuranium isotope U-235 has to be raised from its value of 0.71% in natural uranium to a reactorgrade of 3 - 5%. The enrichment technologies commercially available at present are the gaseousdiffusion process and the centrifuge process. Both of them require the prior conversion of theuranium to the gaseous form of uranium hexafluoride (UF6). The product stream of enrichedUF6 obtained is then converted to the form of UO2 for further processing to nuclear fuelassemblies. Table 2 shows the - in parts outdated - installed enrichment capacities of the world.
The enrichment process not only produces the enriched product, but it also generates a wastestream („tails“) of uranium hexafluoride depleted in U-235 ("depleted uranium" - DU), typicallydown to 0.2% - 0.35%. The residual concentration of U-235 (the "tails assay") in this depleteduranium waste is a parameter that can be adjusted to economical needs, depending on the costof fresh natural uranium (expressed in $ per lb U3O8) and on the enrichment cost (expressed in$ per Separative Work Unit - SWU). Table 1 shows a typical mass balance for the enrichmentprocess. It can be seen that the depleted uranium waste stream is approx. seven times theenriched uranium product stream. 88% of the feed mass ends up in the tails. For typical isotopiccompositions of uranium, see Table 3.
Table 1: Typical mass balance of uranium enrichment(per t of enriched uranium, 3.6% product assay, 0.3% tails assay)
Unat Feed11.9 t UF6(8.05 t Unat)
0.71% U-235
Enrichment
4531 SWU
LEU Product1.48 t UF6
(1 t Uenr)3.6% U-235
DU Waste10.42 t UF6(7.05 t Udep)
0.3% U-235

- 3 -
Table 2: World Uranium Enrichment Capacities
Country Owner /Controller Plant Name / Location
Capacity a)
[millionSWU]
Gaseous Diffusion Plants
China CNNC Lanzhou 0.90
France Eurodif Tricastin 10.80
UnitedStates
U.S. Enrich-ment Corp. Paducah, Kentucky 11.30
Subtotal Diffusion Plants 23.00
Centrifuge Plants
China CNNCHanzhong 0.50
Lanzhou 0.50
Germany Urenco Gronau 1.46
Japan
JNC Ningyo Toge 0.20
Japan NuclearFuel Limited(JNFL)
Rokkasho-mura 1.05
Netherlands Urenco Almelo 1.95
Russia Rosatom Urals Electrochemical Integrated Enterprise(UEIE), Novouralsk (formerlySverdlovsk-44, near Ekaterinburg)
7.00
Siberian Chemical Combine (SKhK),Seversk (formerly Tomsk-7) 4.00
Electrochemical Plant (ECP), Zelenogorsk(formerly Krasnoyarsk-45) 3.00
Angarsk Electrolytic Chemical Combine(AEKhK), Angarsk 1.00
UK Urenco Capenhurst 2.44
Subtotal Centrifuge Plants 23.10
TOTAL 46.10a) Nominal capacity

- 4 -
Table 3: Typical isotopic compositions of uranium [weight-percent]
U-235 U-234 U-238
Depleted uranium - DU (0.2%) 0.200% 0.0009% 99.799%
Natural uranium 0.711% 0.0053% 99.284%
Low enriched uranium - LEU (3.5%) 3.500% 0.0288% 96.471%
Highly enriched uranium - HEU (93%) 93.000% 1.0100% 5.990%Note: DU, LEU and HEU from enrichment of natural uranium.
1.2. Cylinder storage of depleted uranium hexafluoride
Amounts stored
Most of the depleted uranium generated to date is being stored as UF6 in steel cylinders in theopen air in so-called cylinder yards located adjacent to the enrichment plants. The cylinderscontain up to 12.5 t of UF6. An inventory of depleted uranium stocks of the world is given inTable 4. These figures are, however, incomplete and rather outdated. In the U.S. alone, forexample, approximately 739,000 t U of depleted uranium, stored as UF6 in 61,400 cylinders,have accumulated until April 2003, rather than the 480,000 t U listed. [USEC Apr. 11, 2003]
Portsmouth (Ohio) Depleted Uranium Cylinder Storage Yard (U.S. DOE)

- 5 -
Table 4: World Stocks of Depleted Uranium(t U as UF6, as of end 1999, unless otherwise indicated)
Stocks [t U] Notes
USA 480,000 As of mid-2000
Russia 460,000 10,000 t of which as metal and oxides
France 190,000 140,000 t of which as U3O8
United Kingdom 30,000 non-Urenco only (BNFL)
Urenco 16,000 in UK, Netherlands, and Germany
Japan 10,000 As of February 2001
China 2,000 As of end 2000
Germany 300 non-Urenco only (ANF)
Korea, Rep. 200
South Africa 73 mostly metal and oxides
World Total 1,188,573Source: [NEA 2001]
Hazards of DU storage in cylinder yards
At ambient temperature, UF6 is a crystalline solid, but at a temperature of 56.4°C already, itsublimates (becomes a gas). Chemically, UF6 is very reactive: with water (atmospherichumidity!) it forms the extremely corrosive hydrofluoric acid and the highly toxic uranylfluoride (UO2F2). In case of an accidental release of UF6, the hydrofluoric acid causes skin burns, and, afterinhalation, damages the lung. Further health hazards from intake result from the chemicaltoxicity of the uranium to the kidneys, and from the radiation hazard of the uranium (an alphaemitter).Under normal conditions, the external radiation hazard is a concern for workers in the cylinderyards. While the external radiation hazard from the uranium itself is rather low, decay productsgrowing in within a few months emit some gamma radiation. In addition, some neutronradiation is emitted from so-called nuclear (alpha,n)-reactions, initiated in the fluorinecomponent of the UF6 by the uranium‘s alpha radiation. Near cylinders holding depleteduranium, up to 20% of the external radiation exposure can be due to the neutron radiation[Urenco 2002].In the storage yards, the cylinders are subject to corrosion. The integrity of the cylinders musttherefore be monitored and the painting must be refreshed from time to time. This maintenancework requires moving of the cylinders, causing further hazards from breaching of corrodedcylinders, and from handling errors.If UF6 cylinders are engulfed in externally fueled fires for more than 30 - 60 minutes, suddenreleases of large amounts of UF6 can occur, once a cylinder breaches. If the whole contents ofa cylinder is released during a fire, lethal air concentrations of toxic substances can occur within

- 6 -
distances of 500 - 1000 meters.As a worst-case scenario, the crash of an airplane into a cylinder yard must be assumed.
1.3. Depleted uranium: waste or resource?
Depleted uranium with a tails assay of 0.3% still contains 42% of the fissile uranium isotopeU-235 found in natural uranium. Further extraction of the U-235 would be technically possible,but not economically feasible under current cost and market conditions.According to the proponents of nuclear power, changes in the market or new enrichmenttechnologies might allow for a future economical recovery of the residual U-235. The depleteduranium should therefore not be seen as a waste that has to be disposed of, but as a futureresource that should be stored indefinitely.However, industry‘s and regulators' views are not exactly conclusive regarding this question: • On Nov. 5, 1998, a French appeals court, revoking a lower tribunal's decision, ruled that
depleted uranium is no waste, but a "directly usable raw material that is effectively usedfor multiple uses" - and the DU therefore may be stored indefinitely in the form of U3O8in purpose-built storage buildings, as requested by the license applicant (Eurodif‘sparent company Cogéma, see below).
• On Sep. 8, 2004, U.S. NRC staff presented its view before the U.S. Nuclear RegulatoryCommission that depleted uranium is a low level waste - and the DU therefore may betransferred to the Department of Energy (DOE) for disposition, as requested by thelicense applicant (Urenco‘s U.S. subsidiary Louisiana Energy Services - LES). A finaldecision of the NRC is still pending at the time of this writing.
• On Sept. 26, 2001, the Texas Department of Health approved the disposal of DUcounterweights at a land burial facility not even licensed for disposal of radioactivewaste, as requested by the license applicant (Philotechnics Ltd.).
Amazingly, the position of Urenco‘s U.S. subsidiary is diametrically opposed to that of Cogémain France, but it is the key to get access to the cheapest tails disposition route available in theU.S. And, it appears that the views of the regulators are more depending on the respectivedesires of the nuclear industry, rather than on some general concept.
1.4. Possible uses of depleted uranium
Historically, uranium has been used as a coloring matter in pottery. More recent civilian usesinclude the use of uranium as a steel alloying constituent, and the use of several uraniumcompounds in chemical processes, for example as a catalyst. For its high density of 18.9 g/cm3
(67% higher than that of lead and slightly lower than that of tungsten) uranium can be used indense metal applications such as counterweights or flywheels. The first 550 Boeing 747aircrafts built, utilized depleted uranium weights for mass balance of outboard elevator andupper rudder assemblies, for example. But this use of depleted uranium in the form of uraniummetal also included drawbacks: over 20% of these weights were corroded at each major aircraftoverhaul and had to be reprocessed, although nickel and cadmium plated [USNRC 1983]. Inmore recent aircraft designs, however, the use of counterweights has been minimized due toadvanced design technology. Military dense metal applications of depleted uranium include the

- 7 -
use for penetrators and for tank armor.During the production process of uranium metal applications, the pyrophoric behaviour of smalluranium metal particles constitutes a problem. These particles, such as finely divided metallicsaw turnings and chips, sawdust, and abrasive saw sludge are capable of spontaneous ignition,and have caused many incidents. Inhalation of dust from fires involving uranium metal cancause high radiation doses.Another possible use of depleted uranium based on its high density is the use in radiationshields: though an alpha-radioactive material itself, it is suitable for shielding penetratinggamma-radiation better than lead. For all of the uses mentioned it doesn't matter, other than for use as nuclear fuel, that theuranium is depleted in U-235.
To date, none of the civilian uses of depleted uranium has brought an appreciable decrease ofthe existing stockpiles of this material; not even the military use could achieve this, thoughcurrently the largest consumer. In the U.S. therefore, the Department of Energy (DOE), alertedby the increasing maintenance problems of its cylinder yards, is now performing the first stepstowards a large-scale civilian use of depleted uranium. As of July 1993, DOE‘s inventory was559,000 metric tonnes of depleted UF6 stored in 46,422 cylinders; and in 1998 DOE assumedresponsibility for a further 137,000 metric tonnes (11,400 cylinders) produced by USEC. DOE'spreferred alternative is to use the entire inventory of material in the form of metal or oxide,mainly for radiation shielding in casks for spent fuel and high-level waste, but also for otherindustrial uses to be developed. The depleted uranium, now contained at a few sites, then wouldbe dispersed over a wide range of products. DOE now plans to build two plants, at costs ofnearly $200 million each, to convert the UF6 to more stable forms, suitable for manufacturinginto marketable products, or for disposal.
1.5. Long-term storage or disposal
The portion of the depleted uranium for which no use can be identified must be disposed of, ormust be safely stored in the long term for possible future uses.For long-term storage or disposal, the depleted UF6 must be converted to a less reactivechemical form: candidates are UF4, U3O8, and UO2. UF4 has the advantage of being easily re-convertible to UF6, while U3O8 is the most stable form, also existing in natural minerals.
The depleted uranium long-term storage project at Bessines (France)
France's nuclear fuel company Cogéma was the first to go ahead with the concept of long-termstorage of its depleted uranium in oxide form. For this purpose, it is storing the depleteduranium as U3O8 at the site of the former uranium mill of Bessines-sur-Gartempe (HauteVienne) near Limoges. Following an appeals court decision approving the storage on the basisthat the DU represents a raw material rather than a waste, Cogéma sent the first DU shipmentto Bessines on Nov. 12, 1998.Cogéma‘s depleted uranium is generated at the Eurodif Tricastin gaseous diffusion enrichmentplant in the Rhône valley. Its residual contents of U-235 (tails assay) is 0.2 to 0.3%. For storage,the UF6 is converted to the chemically more stable form of U3O8 in „Usine W“ of Cogéma's

- 8 -
Pierrelatte facility. Then it is transported by rail to the Bessines site and stored as a powder iniron containers. The containers (8.5 or 11 t each) are being stored in 11 purpose-built buildings.Each building can store 2500 containers; the projected total storage capacity is 199,900 t U, ata total investment cost of EUR 9.15 million over a period of 15 years. The maximum dose thatan individual would be exposed to at the fence of the facility, is calculated at 0.7 mSv per year.
Urenco‘s Gronau depleted uranium storage project
Meanwhile, Urenco too, is planing the storage of depleted uranium as oxide: Together with theapplication for a capacity-increase of its Gronau, Germany, enrichment plant to 4 millionSWU/year, Urenco filed an application for the construction of two storage buildings for itsdepleted uranium waste. The depleted uranium is currently being stored as uraniumhexafluoride in cylinder yards next to the plant with a licensed capacity of 38,100 t UF6. Forstorage, the depleted uranium is to be converted to the more stable form of U3O8 at thePierrelatte facility in France. The storage buildings are to be designed for a capacity of 50,000t U as U3O8. [Urenco 2002]
Urenco‘s Capenhurst depleted uranium storage project
At its Capenhurst (UK) site, Urenco plans to hold the tails as UF6 until 2020. Then,deconversion to U3O8 shall start at a rate of 3000 tU/year through to 2042. The U3O8 will bestored in „suitably engineered facilities“ on the Capenhurst site. Transfer of the U3O8 to thefinal repository is scheduled to begin in 2120 (!), when the repository becomes available, andto end in 2142. [HSE 2004]
Disposal cost
For the ultimate disposal of depleted uranium, only estimates can be made, since no large tailsdisposal is in existence yet. Nearly all depleted uranium generated so far is temporarily storedand waiting for a decision about its ultimate disposition.A „Cost analysis report for the long term management of depleted uranium hexafluoride“performed by the U.S. Department of Energy (DOE) analyzes the costs for a number ofmanagement options. Among these, the most promising one from an environmental protectionview is the disposal of the depleted uranium as U3O8 in cemented form in a mine. The costestimates for the specific cost of this option are $4.57 per kg UF6, see Table 5 [Elayat 1997].But, even for this option it is unclear, how it shall meet the requirements for long-termcontainment of the uranium and its decay products growing in (such as radium).In a 2003 filing with the U.S. Nuclear Regulatory Commission (NRC), U.S. enricher USECpresented an even lower estimate for its tails disposition cost in 2004: deconversion anddisposal cost of 2.99 US$ per kg U, plus transport cost of 0.21 US$ per kg U [USEC 2003].This corresponds to 2.02 and 0.14 US$ per kg UF6, respectively.In its balance sheets, Urenco makes provisions of 7.03 EUR per kg U for the deposition of itstails (see below). For the German branch of Urenco, disposal in the proposed Gorleben HLWdeposit must be assumed, although the depleted uranium would be suitable for disposal in aLLW deposit. But the activity limits for the only LLW deposit in Germany, the proposed„Schacht Konrad“ deposit, would only allow for the disposal of a total of approx. 100 t of

- 9 -
depleted uranium [Wingender 1994].
Table 5: Estimated discounted disposition cost for depleted UF6 (U.S. DOE)(Option: disposal as cemented U3O8 in a mine, dry defluorination process w/AHF Prod.)
Total Costfor 560,000 t UF6
Specific Cost
[US$ million] [US$/kg UF6] [US$/kg U]
Continued Storage 197 0.35 0.52
Transport 702 1.25 1.85
Conversion 267 0.48 0.71
Disposal 1395 2.49 3.69
TOTAL 2561 4.57 6.77Source: [Elayat 1997], specific cost added
For the Gorleben deposit, the final disposal cost can be estimated at approx. 10.2 US$ per kgUF6 for bulk disposal as U3O8, or 22.5 US$ per kg UF6 for cemented disposal as U3O8 (or 15.1resp. 33.3 US$ per kg U contained in UF6).(This figure is based on the following assumptions: The storage cost for a 200-liter barrel at the proposed GorlebenHLW deposit is estimated at 7670 EUR; the volume needed for disposal of the tails as U3O8 in barrels is estimatedat 550 litre/t U3O8 for cemented disposal and 250 litre/t U3O8 for bulk disposal; conversion cost of 1.6 EUR per kgUF6; 1 US$ = 0.79 EUR).
The comparison of the tails disposition cost estimates (see Table 6) shows an extraordinarilywide range. And, it becomes clear that the tails disposition cost for Urenco‘s German branch areprohibitive, since they would claim up to nearly half of the proceeds from the enrichmentbusiness. Urenco‘s German branch (at least) thus is in an urgency to get rid of its tails whateverhappens; otherwise it would not be able to survive in the market.
Table 6: Summary of tails disposition cost estimates(deconversion + disposal only, no discounting)
Tails dispositioncost estimate a)[US$/kg UF6]
Percentage ofenrichment price b)
USEC 2.02 4.2%
US DOE (as U3O8, cemented, in a mine) 2.97 6.2%
Urenco provision (as U3O8) 6.02 12.6%
Gorleben (as U3O8, bulk) 10.20 21.4%
Gorleben (as U3O8, cemented) 22.50 47.0%a) based on 1 US$ = 0.79 EURb) based on 110 US$/SWU , tails at 2.3 kg UF6/SWU (for product assay of 3.6% and tails assay of 0.3%)

- 10 -
2. Re-enrichment of depleted uranium tails
2.1. Tails enrichment - the deal
Surprisingly, the recovery of the residual U-235 contained in the depleted uranium no longer isa matter of the future: it is being practiced since 1996 already, although neither new highly-efficient enrichment technologies have entered the market, nor enrichment cost have decreased.Depleted uranium, mainly from European uranium enrichers Urenco and Eurodif, is beingenriched in Russia. Urenco is operating three centrifuge enrichment plants in Capenhurst(United Kingdom), Almelo (The Netherlands), and Gronau (Germany), while Eurodif, asubsidiary of Cogéma (Areva Group), is operating the Tricastin diffusion enrichment plant atPierrelatte (France), see Table 2 on p.3. For ownership details on Urenco, see Table 7, and onEurodif, see Table 8.Surplus capacities at the centrifuge enrichment plant of Rosatom‘s Ural ElectrochemicalIntegrated Plant (UEChK, formerly Sverdlovsk-44) at Novouralsk near Ekaterinburg are beingused for the enrichment of tails rather than natural uranium. Rosatom is the Russian FederalAtomic Energy Agency (previously Minatom). While further depleting ("stripping") thedepleted uranium, it produces uranium of natural contents (0.71%) in U-235. It thus re-enrichesor upgrades the tails to natural-equivalent U-235 grade. This product is then delivered back toUrenco and Eurodif for further enrichment to reactor grade.
Table 7: Ownership details of Urenco Ltd.
Share Owner Parent
33.3% BNFL Enrichment 100% British Nuclear Fuels plc. (BNFL)
33.3% Ultra-Centrifuge Nederland N.V. (UNC)
33.3% Uranit GmbH50 % RWE Power AG
50% E.ON Kernkraft GmbHNote: the British and Dutch holdings are ultimately owned by the respective governments
Table 8: Ownership details of Eurodif SA
Share Owner Parent
44.653% COGEMA (Areva Group) (France)
25% SOFIDIF60% COGEMA (Areva Group) (France)
40% OEAI (Iran)
11.111% ENUSA (Spain)
11.111% SYNATOM (Belgium)
8.125% ENEA (Italy)Note: total holdings of COGEMA in Eurodif: 59.653%

- 11 -
Available facts on the Re-enrichment business
Details on the re-enrichment business, though it is currently taking place at large scale, arehardly obtainable. In Russia, all related information is confidential; and, the West-Europeanenrichment companies involved, Urenco and Eurodif, are not very communicative, to put itpolitely. In its recent annual reports, Urenco not even discloses its annual production figure, northe capacity break down for its facilities, not to speak about other data of interest, such asamount and assays of tails produced.Only some scattered figures can be found here and there, most of which can be traced back toinformation originally obtained from the company RWE Nukem. Moreover, in some cases it isnot clear whether mass figures are meant for the amount of uranium hexafluoride, or theuranium contained. On the other hand, the physics of the uranium enrichment process are wellestablished, and allow to determine (or at least guess) many missing parameters.
These are the - mostly unconfirmed - data found in the public domain:
1) The re-enrichment deals between Urenco / Eurodif and Rosatom:• Urenco and Eurodif each send 7,000 t U in tails per year to Russia for enrichment [NF,
May 12, 2003]. For the tails sent by Urenco‘s German branch, a break down of thedestinations within Russia is available, see Table 9.
• Urenco‘s tails have an assay of 0.3%, Eurodif‘s an assay of 0.35%. [NF, May 12, 2003]• Urenco and Eurodif each get back 1,100 t U of re-enriched natural-equivalent uranium
(Uneq) contained in UF6. [NF, May 12, 2003]• Approximately half of the total of 2,200 t U of re-enriched Uneq received by Urenco
and Eurodif is used by EU utilities (see Table 19 on p.18), the rest is being exported.[ESA AR 1998]
• Eurodif, in addition, gets back 130 t U in UF6 of uranium re-enriched to 3.5%. [NF, May12, 2003]
• Rosatom spends a total of 2.58 million SWU on this re-enrichment deal for Urenco andEurodif. [Bukharin 2004]
• Rosatom does not charge the market price for the SWU it spends, but presumably a costprice of $20 per SWU. [Bukharin 2004]
• The secondary tails generated by the re-enrichment process remain in Russia. [BT-Drs.13/8810] [Bukharin 2004]
2) Rosatom‘s additional exploitation of the secondary tails from the Urenco / Eurodif deals:• The secondary tails are re-enriched further by Rosatom on its own account.• Rosatom strips them down to a tails assay of 0.1%. [Bukharin 2004]• Rosatom this way obtains a further 3300 t U [?] of re-enriched natural-equivalent
uranium per year, which it can use or sell on its own account; Rosatom uses at least partof this material for the production of blendstock (assay 1.5%) for the downblending ofHEU (see below). [NF, May 12, 2003] [Bukharin 2004]
3) Overall re-enrichment performed by Rosatom on Urenco / Eurodif tails:• Rosatom spends a total of 7 million SWU annually on all re-enrichment done under 1)
and 2). [Bukharin 2004]
Note: In addition, Rosatom also re-enriches tails from its own DU stocks; this process is not covered here,however.

- 12 -
A detailed analysis (see Annex) shows that, in fact, these data allow to establish a plausiblemass balance of the whole re-enrichment business, with one major exception: the figure of 3300tons of re-enriched uranium obtained by Rosatom on its own account has to be taken as theamount of UF6, not that of the uranium contained (2231 t U). Some minor differences with otherfigures can possibly be explained by generous rounding. All further discussion in this paper isbased on that estimated mass balance.
Table 9: German exports of depleted uranium to Russia for re-enrichment [t U as UF6]
Year
Destination
TotalUral Electro-chemical Plant,
Novouralsk
SiberianGroup,Seversk
AngarskElectrolizing,
Angarsk
1991 - 1995 No exports
1996 502.395
1997 2404.585
1998 1893.100 201.069 133.956 2228.125
1999 1574.520 569.312 284.777 2428.608
2000 1305.896 200.740 251.273 1757.909
2001, 1st Q. 284.569 133.863 418.433Source: BT-Drs. 14/5638 (March 23, 2001), 14/6692 (July 16, 2001)
2.2. Mass balance of the re-enrichment process
The key features of the mass balance are presented as a flowchart in Table 10 for the re-enrichment performed on Urenco‘s tails, and in Table 11 for that performed on Eurodif‘s tails.
Analysis from a tails disposition perspective
One important aspect of the re-enrichment deal with Russia is that it opens a disposition routefor the tails generated by Urenco and Eurodif.To produce the amount of 7000 t U of tails that is sent to Russia, Urenco would have to spendapprox. 4.5 million SWU. This exactly equals Urenco‘s production figure for 2000, but insubsequent years the production was higher due to capacity increases, see Table 12.The production figures for the subsequent years are not given in Urenco‘s annual reports, onlythe increase rates are given: 2001: +11%; 2002: +11%; 2003: +10% [Urenco AR 2000 - 2003].The resulting production figures are shown in Table 13, together with the estimated amounts oftails generated.So, for 2000, the amount of tails produced by Urenco was equivalent to the amount delivered toRussia for re-enrichment. In the later years, tails production exceeded the deliveries to Russia.

- 13 -
Table 10: Annual mass balance estimate for re-enrichment of Urenco‘s tails
Unat Feed11821 t UF6
(7993 t Unat)0.71% U-235
Urencoenrichment
4.5 million SWU
LEU Product1469 t UF6(993 t Uenr)
3.6% U-235
DU Waste /Refeed
10352 t UF6(7000 t Udep)
0.3% U-235
Rosatomre-enrichment Step 1
(on Urenco‘s account)0.79 million SWU
Uneq Product1619 t UF6(1095 t Uneq)
0.71% U-235
DU Waste /Refeed
8733 t UF6(5905 t Udep)
0.224% U-235
Rosatomre-enrichment Step 2(on its own account)
Opt.N: 2.42 mln SWUOpt.B: 3.37 mln SWU
Product
Option N:Uneq
1775 t UF6(1200 t Uneq)
0.71% U-235
Option B:LEU
774 t UF6(523 t Uenr)
1.5% U-235
DU Waste
Option N:6958 t UF6(4705 t Udep)
0.1% U-235
Option B:7960 t UF6(5382 t Udep)
0.1% U-235
Product produced by Rosatom on its own account:Option N: „Natural-equivalent“ uranium (0.71% assay), orOption B: Blendstock with 1.5% assay, for HEU downblending

- 14 -
Table 11: Annual mass balance estimate for re-enrichment of Eurodif‘s tails
Unat Feed11642 t UF6
(7872 t Unat)0.71% U-235
Eurodifenrichment
3.6 million SWU
LEU Product1290 t UF6(872 t Uenr)
3.6% U-235
DU Waste /Refeed
10352 t UF6(7000 t Udep)
0.35% U-235
44%
56%
Rosatomre-enrichment Step 1a(on Eurodif‘s account)
1.21 million SWU
LEU Product192 t UF6(130 t Uenr)
3.5% U-235
Rosatomre-enrichment Step 1b(on Eurodif‘s account)
0.67 million SWU
Uneq Product1633 t UF6(1105 t Uneq)
0.71% U-235
DU Waste /Refeed
8526 t UF6(5765 t Udep)
0.21% U-235
Rosatomre-enrichment Step 2(on its own account)
Opt.N: 2.25 mln SWUOpt.B: 3.07 mln SWU
Product
Option N:Uneq
1538 t UF6(1040 t Uneq)
0.71% U-235
Option B:LEU
670 t UF6(453 t Uenr)
1.5% U-235
DU Waste
Option N:6989 t UF6(4726 t Udep)
0.1% U-235
Option B:7857 t UF6(5312 t Udep)
0.1% U-235
Product produced by Rosatom on its own account:Option N: „Natural-equivalent“ uranium (0.71% assay), orOption B: Blendstock with 1.5% assay, for HEU downblending

- 15 -
Table 12: Urenco‘s nominal enrichment capacity at end of year [million SWU]
Year Capenhurst Almelo Gronau TOTAL
2000 2 1.5 1.3 4.8
2001 5.25
2002 2.44 1.95 1.46 5.85
2003 6.5Source: [Urenco AR 2000 - 2003]
Table 13: Estimate of tails generated by Urenco(assuming product assay of 3.6% and tails assay of 0.30%)
Year Production[million SWU]
Tails[t U as UF6]
2000 4.5 7001
2001 5 7779
2002 5.54 8619
2003 6.1 9490
Nevertheless, Urenco‘s tails stocks were decreasing even in those later years.The data available on Urenco‘s tails stocks is only rather imcomplete:• As of June 30, 1994, Urenco‘s DU inventory was 8,000 t in Capenhurst (UK), 12,000 t
in Almelo (NL), and 3,800 t in Gronau (Germany), totaling 23,800 t (t U?). [NF Nov. 7,1994]
• As of end 1999, the total tails inventory was 16,000 t U. [NEA 2001]• In 2001 alone, total tails stocks held on all Urenco sites were reduced by around 8%,
and in 2002 by a further 5%. [Urenco AR 2001 & 2002]• As of Feb. 2003, only 1,000 t were left over from the tails stock of 3,800 t reported for
Urenco‘s Gronau (Germany) site as of June 30, 1994. [NF Feb. 17, 2003]
The financial provisions made by Urenco for the tails disposition in its balance sheets (seeTable 14) presumably roughly reflect the changes in its tails inventory. The decrease in 2001and 2002 can be recognized, however the sharp 34.4% increase in 2003 after several years ofconsecutive decrease is remarkable.Using the figure of 16,000 t U given in [NEA 2001] for Urenco‘s tails inventory at the end of1999, Urenco‘s related provision of EUR 112,535,000 [Urenco AR 2000] corresponds to EUR7.03 per kg U.
In addition to transferring depleted uranium hexafluoride to Russia for re-enrichment, Urencois exporting smaller quantities also to a number of other facilities across Europe. The figures forUrenco's German branch were disclosed by the German government‘s answer to aparliamentary question, see Table 15.

- 16 -
Table 14: Urenco‘s provision for liabilities and charges - Tails
Year Arisingin year
[EUR mln]
Releasedin year
[EUR mln]
Exchangeadj., etc.
[EUR mln]
at Dec. 31
[EUR mln]
Change
1999 112.535
2000 41.532 -67.501 -2.421 84.145 -25.2%
2001 48.963 -57.470 1.020 76.658 -8.9%
2002 57.382 -60.547 -2.702 70.791 -7.7%
2003 66.899 -40.146 -2.411 95.133 34.4%Source: [Urenco AR 2000 - 2003]
Table 15: Exports of depleted uranium in the form of UF6 from Germany to destinationsother than Russia [t U]
YearCogéma,
Pierrelatte,France a)
BNFL,Capenhurst,
UK b)
BNFL,Springfields,
UK c)
WestinghouseAtom AB,Västerås,Sweden d)
TOTAL
1998 251.188 125.645 8.504 385.337
1999 251.181 83.763 334.944
2000 100.354 66.976 17.925 185.255
2001, 1st Q. 150.570 150.570Source: BT-Drs. 14/6692 (July 16, 2001)a) presumably "Usine W" which converts depleted UF6 to U3O8.b) a former diffusion enrichment plant, where BNFL now operates a "uranic storage facility", where DUapparently is stored in the form of UF6.c) comprises a reconversion facility to uranium metal and a fuel production plant for uranium oxide fuel, amongothers.d) fuel production plant for uranium oxide fuel.
The German government's answer does not contain any mention of the purpose of these exportsnor the further fate of the exported DU. However, if such transfers from Urenco‘s Dutch andBritish plants would reach a similar order of magnitude, then these transfers could explain, whyUrenco‘s DU stockpile has been on the decrease in 2001 and 2002 still, when the tailsproduction already was larger than the tails transfers to Russia. But it becomes also clear, thatwith the planned further increasing capacities, Urenco will more and more run into problems todispose of the arising tails in this „elegant“ way.
One obvious effect of the tails re-enrichment in Russia is a decrease of the amount of tails thathas to be disposed of. However, the effect is only comparatively small: as a result of the re-enrichment performed on the account of Urenco and Eurodif (Step 1), the amount of tails

- 17 -
decreases by only approx. 17%, see Table 16. As a result of the further re-enrichmentperformed on Rosatom‘s own account (Step 2), the amount of tails decreases by another 19%(Option N), or 8% (Option B). Overall, Russia still has to dispose of 67%, or 76%, respectively,of the amount imported.With an assay of only 0.1%, these roughly 10,000 t U of secondary tails annually are less likelyto be seen as a future resource: any attempt to recover the residual U-235 would require atremendous separation work expenditure that cannot be expected to be affordable in theforeseeable future. Nevertheless, Rosatom still keeps these residual tails stored in the form ofUF6; it is not known what plans Rosatom has for them.
Table 16: Estimated annual tails balance for re-enrichment of imported tails in Russia
Urenco Eurodif TOTAL
Tails[t U as UF6]
Assay Tails[t U as UF6]
Assay Tails[t U as UF6]
Tails imported to Russia 7000 0.30% 7000 0.35% 14000
Tails left after re-enrich-ment for Urenco / Eurodif
5906 0.224% 5766 0.21% 11672
Tails left afterfurtherstripping byRosatom
Opt. N 4705
0.10%
4726
0.10%
9431
Opt. B 5382 5312 10695
Analysis from a uranium recovery perspective
A second important aspect of the re-enrichment deal is the recovery of residual U-235 stillcontained in the tails. The amounts of the recovered products are shown in Table 17.
Table 17: Estimated annual balance of recovered uranium products [t U as UF6]Uneq: assay 0.71%; Uenr: assay 3.5%
Uneq Uenr
Urenco Eurodif SUBTOTAL Eurodif
re-enrichment for Urenco / Eurodif 1100 1100 2200 130
further re-enrichment by Rosatom 1200 1040 2240 0
TOTAL 2300 2140 4440 130
A comparison of these figures to the current Russian annual uranium production from mines of3150 t U (2003) shows that the total amount of „natural-equivalent“ uranium recovered byRosatom from the imported tails is larger than Russia‘s production from mines. And, theamount of 2240 t „natural-equivalent“ uranium recovered by Rosatom from these tails on its

- 18 -
own account adds 71% to Russia‘s uranium production from mines.
The secondary tails with an already rather low assay of 0.1% still contain residual U-235 thatcould be recovered at excessive expense of enrichment work only: 1328 t U/year (Option N), or1506 t U/year (Option B) of „natural-equivalent“ uranium.The amount of enrichment work spent by Rosatom per kg „natural-equivalent“ uraniumrecovered increases considerably with decreasing assay of the material fed into the re-enrichment cascade, see Table 18.
Table 18: Specific separation work for „natural-equivalent“ uranium recovered
Uraniumrecovered[t Uneq/a]
Specific separ-ation work
[SWU/kg Uneq]
Stripping from 0.30% and 0.35% to approx. 0.22% tailsassay on Urenco‘s resp. Eurodif‘s account (Step 1)
2200 0.7
Further stripping to 0.1% tails assay on Rosatom‘saccount (Step 2, Option N)
2240 2.1
Hypothetical further stripping to 0.05% tails assay 714 6.5
Approximately half of the „natural-equivalent“ uranium recovered on Urenco‘s and Eurodif‘saccount is being supplied to European utilities (see Table 19), the other half is being soldelsewhere.
Table 19: Russian supply of re-enriched tails (of natural UF6 equivalent) to the EU
Year 1997 1998 1999 2000 2001 2002 2003 TOTAL
[t U] - - 1100 1200 1050 1000 1200 5550NB: For 1997 and 1998, re-enriched tails are not shown because quantities were small and could not be shownseparately for confidentiality reasons.Source: [ESA AR 2003]
Conclusions:' For Urenco, the export to Russia represents the major disposition route for the tails
currently generated in its plants.' For several years, tails exports (mainly to Russia) resulted in a net decrease in Urenco‘s
tails stocks, in spite of increasing production at Urenco‘s plants.' The decrease in the amount of tails as a result of the re-enrichment performed is only
marginal: 17% for the re-enrichment performed on Urenco‘s and Eurodif‘s account, and33% (Opt. N) resp. 24% (Opt. B) for all re-enrichment performed on the imported tails
' The amount of 2240 t „natural-equivalent“ uranium recovered by Rosatom from theimported tails on its own account adds 71% to Russia‘s current uranium productionfrom mines.
' The separative work expense per kg „natural-equivalent“ uranium recovered increasesconsiderably with decreasing tails assays: the further re-enrichment performed by

- 19 -
Rosatom on its own account requires three times the separative work per kg recovered,compared to the re-enrichment performed on Urenco‘s and Eurodif‘s account.
' The future of the secondary tails remaining in Russia is particularly unclear, since anyfurther extraction of residual uranium would only be possible at extreme expense ofseparative work.
2.3. Cost balance of the re-enrichment business
The mass balance presented above can also serve as the basis for an assessment of theeconomics of the re-enrichment business. However, since no hard facts are known on costs andon prices paid, some more assumptions have to be made.
Cost analysis from Urenco‘s and Eurodif‘s perspective
General assumptions:• Urenco and Eurodif pay Rosatom for its operating cost (assumed at $20/SWU) only, and
for that part of the re-enrichment only that is performed on the account of Urenco andEurodif; Rosatom gets no extra money for the disposition of the secondary tails.
• For the determination of the reference value for the 3.5%-LEU produced for Eurodif itas assumed that natural uranium is enriched at market prices.
• for the transport cost between Urenco/Eurodif and Rosatom, a figure of $1.50 per kgUF6 is used.
The cost balance is based on the mass balance (see above) and on various cost situations, usingthe market prices of three distinct dates, see Table 20.
Table 20: Cost parameters used in the cost analysis
Uranium[$/lb U3O8]
Conversion[$/kg U]
Enrichment[$/SWU]
Exchange rate c)[EUR/$]
Dec. 25, 1995 a) 12.25 5.85 95 0.74
Dec. 25, 2000 b) 7.10 4.25 84 1.08
Nov. 15, 2004 20.25 10.00 110 0.77a) this is approximately at the time the tails transfers to Russia started,b) at this time, the uranium price was at its all-time low, and the enrichment price had just recovered from itslowest level.c) 1995 exchange rate based on DEM/$ rate and official DEM/EUR ratio.
The annual cost balances are based on these three distinct cost situations; there is no account forany price changes occurred during the course of the year.
Four options are used for Urenco‘s and Eurodif‘s disposal cost that are being avoided by the re-enrichment:• Option NO: no account for disposal cost,

- 20 -
• Option US: $4.39 / kg U (U.S. DOE estimate for disposal as U3O8 in a mine), • Option UR: EUR 7.03 / kg U (provision made by Urenco), and• Option DE: EUR 27.24 / kg U (estimate for cemented disposal as U3O8 in Gorleben
HLW deposit, Germany).
An overview of the resulting profit estimates for Urenco and Eurodif is given in Table 21; thedetailed results are shown in the Annex: profits are generated under all market conditionsexamined, except for Urenco during the all-time low of the uranium price, but only withouttaking the avoided tails disposal cost into account
Table 21: Annual profit estimates for Urenco and Eurodif from the tails re-enrichment inRussia ($ million)assuming Urenco and Eurodif pay $20/SWU for re-enrichment
Urenco Eurodif
Disposal cost option: NO US UR DE NO US UR DE
Dec. 25, 1995 8 38 74 265 77 108 144 335
Dec. 25, 2000 -9 22 37 168 38 69 84 215
Nov. 15, 2004 35 66 99 283 141 172 205 389
This result is mainly based on the low SWU price of $20/SWU presumably paid to Rosatom(just approx. one fifth of the market price). Eurodif‘s estimated profits are higher than Urenco‘s,since Eurodif‘s deal (including re-enrichment to 3.5%-LEU) requires the consumption of moreSWUs; but, possibly Eurodif pays more for the SWU spent for the LEU part of its re-enrichment deal.The result would be rather different, if Urenco and Eurodif would have to pay the market pricefor the re-enrichment performed by Rosatom on their behalf, see Table 22.
Table 22: Annual profit estimates for Urenco and Eurodif from the tails re-enrichment inRussia ($ million)assuming Urenco and Eurodif would pay market prices for re-enrichment
Urenco Eurodif
Disposal cost option: NO US UR DE NO US UR DE
Dec. 25, 1995 -52 -21 15 206 -64 -33 3 194
Dec. 25, 2000 -59 -29 -14 117 -82 -52 -37 94
Nov. 15, 2004 -36 -5 28 212 -28 2 35 219
Conclusions:' For Urenco and Eurodif, the re-enrichment deal is profitable under all market conditions
examined, except for Urenco during the all-time low of the uranium price, but onlywithout taking the avoided tails disposal cost into account.
' If Urenco and Eurodif would have to pay the market price for enrichment, the deal

- 21 -
would be profitable for Urenco and Eurodif only, if their avoided disposal cost werecomparable to Urenco‘s provision made for tails disposition (Option UR), at least, andonly if the market prices were not too low.
Cost Analysis from Rosatom‘s perspective
General assumptions:• Rosatom gets paid for its operating cost (assumed at $20/SWU) only, and for that part
of the re-enrichment only that is performed on the account of Urenco and Eurodif;Rosatom gets no extra money for the disposition of the secondary tails
• no account for any transport cost
So, if Rosatom would only perform the re-enrichment on the account for Urenco and Eurodif(Step 1), then it would make a loss as high as the disposition cost of the secondary tails.Once Rosatom re-enriches the tails further on its own account (Step 2), the balance depends onthe market prices for the products. The cost balance is analyzed for different cost situations,using the market prices for the same distinct dates as above for Urenco / Eurodif, see Table 20.
Two options are considered for the product produced by the further stripping of the tails byRosatom on its own account:• Option N: „natural-equivalent“ uranium with 0.71% assay• Option B: blendstock with 1.5% assay for HEU downblending (see below)For the determination of the reference value for the blendstock it as assumed that Unat isenriched at market prices, though this process would not yield the same low contents in U-234(critical for blendstock use, see below).
Three options are assumed for Rosatom‘s tails disposal cost:• Option NO: no account for disposal cost, • Option US: $4.39 / kg U (U.S. DOE estimate for disposal as U3O8 in a mine),• Option UR: EUR 7.03 / kg U (provision made by Urenco for its tails)
An overview of the resulting profit estimates for Rosatom is given in Table 23. The detailedresults are shown in the Annex.
Table 23: Annual profit estimates for Rosatom from the tails re-enrichment ($ million)(combined data from re-enrichment of Urenco and Eurodif tails)
Step 1 only Step 1 and 2
Option N Option B
Disposal cost option: NO US UR NO US UR NO US UR
Dec. 25, 1995 0 -51 -111 -9 -50 -99 65 18 -37
Dec. 25, 2000 0 -51 -76 -43 -84 -104 12 -35 -58
Nov. 15, 2004 0 -51 -107 47 5 -39 150 103 52

- 22 -
Conclusions:' If Rosatom would only perform the re-enrichment on the account for Urenco and
Eurodif (Step 1), then it would make a loss as high as the disposition cost of thesecondary tails. So, if the assumption is correct that Urenco and Eurodif are not payingany tails disposition fee, then Rosatom has to make money by further processing of thesecondary tails for not being left with its ultimate disposition cost.
' In the case that Rosatom produces uranium of natural assay in that part of the re-enrichment deal performed on its own account (Option N for Step 2), Rosatom wouldmake a profit only at the current high market prices for uranium and enrichmentservices, and this only for the lower disposal cost options. In all other market conditionsexamined, Rosatom would suffer losses, often only slightly lower, or even higher thanthose experienced without any re-enrichment on its own account at all.
' If, however, Rosatom produces uranium enriched to 1.5% as blendstock for HEUdownblending (Option B), then Rosatom would make profits in more cases, however, inthe high disposal cost case only for the current high price level, while at the all-time lowof the market prices only if no ultimate tails disposition cost are taken into account.
2.4. Blendstock production for HEU downblending
Uranium used in nuclear weapons is enriched to approx. 93% U-235, while uranium used asfuel in commercial light water reactors typically is enriched to 3 - 5% U-235. Uranium enrichedto more than 20% U-235 is called Highly Enriched Uranium (HEU) and can only be used innuclear weapons and in research reactors. Surplus HEU thus is not directly useable as fuel innuclear power plants, but it can be downblended to Low Enriched Uranium (LEU) to make itsuitable for use as commercial nuclear fuel. As blendstock material, depleted, natural, or evenslightly enriched uranium can be used. Table 24 shows a typical mass balance for HEUdownblending with slightly enriched blendstock.
In 1993, the U.S. and Russia concluded the US-Russia HEU Agreement, under which Russia issupplying the downblended uranium derived from 500 t of HEU to the USA over a period ofabout 20 years. [UI 1999b]The downblending is being performed at the facilities in Novouralsk, Seversk, and Zelenogorsk,by mixing the HEU and some blendstock uranium as gaseous UF6. The LEU product obtainedcan be further processed in the usual way to manufacture nuclear fuel.
The problem of unwanted isotopes
The HEU material may contain several impurities, among them the unwanted uranium isotopeU-234. This is a minor isotope (a member of the U-238 decay chain) contained in naturaluranium; during the enrichment process, its concentration increases even more than that ofU-235. High concentrations of U-234 may cause excessive worker radiation exposures duringfuel fabrication. In case natural or depleted uranium is used as blendstock, U-234 concentrations in the LEUproduct may exceed the ASTM specifications for nuclear fuel, shown in Table 25.

- 23 -
Table 24: Typical mass balance of HEU downblending with enriched blendstock(per t HEU with 93% assay, 1.5% blendstock assay, 4% LEU product assay)
Blendstock52.6 t UF6(35.6 t Uenr)
1.5% U-235
Blending HEU1.5 t UF6(1 t Uenr)
93% U-235
LEU Product54.1 t UF6(36.6 t Uenr)
4.0% U-235
Table 25: ASTM specification C 996 for U-234 in nuclear fuel
Isotope max. concentration [µg per g U-235]
U-23410,000
11,000 (by special agreement)
If, however, slightly enriched uranium at typically 1.5 wt-% U-235 is used as a blendstock, theunwanted isotopes are sufficiently diluted in the LEU product. The dilution effect is evenstronger, if the slightly enriched blendstock is generated from re-enrichment of depleteduranium, rather than from enrichment of natural uranium. Table 26 shows the mass balance andthe U-234 concentrations for various blendstock production options for the downblending of 1 tHEU. The options analyzed are:• DU Uenr Tails enrichment from 0.22% to 1.5%• Unat Uenr Enrichment of natural uranium to various assays• DU Uneq Tails enrichment from 0.22% to 0.71%• Unat Direct use of natural uranium as blendstock• Unat DU Use of depleted uranium (0.3%) as blendstock
From Table 26 it becomes obvious that re-enrichment of depleted uranium is not the only optionto obtain downblended LEU conforming to the ASTM specification for U-234 of 10,000 µg perg U-235: enrichment of natural uranium to U-235 assays of 1.15% and higher can also generatesuitable blendstock; this requires the availability of sufficient amounts of natural uranium,however.If Rosatom uses all of the 11,672 t U of tails (at approx. 0.22% assay) left over from the re-enrichment done on behalf of Urenco and Eurodif (see Table 16 on p.17) for production ofblendstock with 1.5% assay, then the resulting 1000 t U of blendstock are sufficient for thedownblending of 28.1 t HEU; that is in fact the approximate annual amount to be downblended

- 24 -
under the US-Russia HEU Agreement.
Table 26: Mass balance of blendstock production options for downblending of 1 t HEU(HEU: U-235 assay 93%, U-234 assay 1.01%; LEU: U-235 assay 4%)
Blendstockproduction
option
Blendstockorigin
Final Blendstock LEU
Mass[t U]
U-235assay
[wt-%]
Mass[t U]
U-235assay
[wt-%]
U-234assay
[wt-%]
Mass[t U]
U-234conc.
[µg/g U-235]
DU Uenr a) 415.3 0.22% 35.6 1.50% 0.00814% 36.6 8868
Unat Uenr b)
962.7
0.71%
130.7 3.32% 0.02803% 131.7 8867
104.2 35.6 1.50% 0.01193% 36.6 9789
64.7 31.2 1.15% 0.00897% 32.2 9994
DU Uneq a) 137.3 0.22% 27.0 0.71% 0.00364% 28.0 9865
Unat - - 27.0 0.71% 0.00534% 28.0 10273
Unat DU c) 27.4 0.71% 24.0 0.30% 0.00174% 25.0 10478Note: depending on assumptions made on enrichment process details, U-234 concentrations may differ somewhat.a) 0.1% tails assay at blendstock enrichment; blendstock origin DU generated from enrichment of Unat to 4%.b) 0.3% tails assay at blendstock enrichmentc) blendstock DU generated from enrichment of Unat to 4%.
Recovery of separative work from the HEU
A major reason why the HEU downblending is at all performed is the recovery of the vastenergy-intensive separative work spent for its production, to make it useable in nuclear fuel.Due to the nature of the downblending process, not all separative work spent for the originalHEU production can be recovered, however.With Unat as blendstock, for example, about one quarter of the SWU spent for the HEUproduction is lost, see Table 27: For an assessment of the usable SWU contents of thedownblended LEU, a hypothetical reference case is shown, assuming direct enrichment ofnatural uranium to the same amount of LEU and the same assay as obtained with the LEU fromdownblending. If the blended LEU were produced by straight enrichment of natural uranium,then 148 SWU would have to be spent, to obtain the same amount and assay of LEU asproduced from the actual downblending process per kg HEU processed. So, in the downblendedLEU, we get an equivalent of 148 SWU per kg HEU blended, while the separative workoriginally spent for the HEU was 200 SWU per kg. Thus, 52 SWU per kg HEU, or 26% of theSWU contained in the HEU cannot be recovered and are lost.The SWU loss increases excessively, if the separative work spent for blendstock re-enrichmentfrom DU is taken into account. For illustration purposes, the mass balance for the currentlypracticed case of blendstock re-enrichment of tails from approx. 0.22% to 1.5% is presented in

- 25 -
detail in Table 28. Here, the reference case shows that the usable SWU contained in the LEUare 193 SWU per kg HEU blended. This is only 3.5% less than the 200 SWU per kg HEUoriginally spent for the production of the HEU. But, to make those 193 SWU accessible, 232SWU have to be spent for blendstock enrichment! Taking the malus from blendstock enrichmentinto account, the corresponding net SWU loss is calculated as (200 - 193 + 232)/200 = 120%.So, in this case, the net SWU loss reaches 120% of the separative work spent for the HEUproduction; the SWU loss exceeds the SWUs originally spent for the HEU by 20%. And, ineffect, other than anticipated, there is no recovery of separative work taking place at all in thiscase; the whole process is a SWU sink, on the contrary.Table 29 shows the SWU loss in tabular form for the same blendstock production options aspresented in Table 26.
Table 27: Estimated mass balance of HEU downblending with Unat blendstock(per t HEU)
Feed226 t Unat
0.71% U-235
Past HEUEnrichment
200,000 SWU
HEU1 t Uenr
93% U-235
Tails225 t Udep0.3% U-235
Downblending LEU28 t Uenr
4.0% U-235
Blendstock27 t Unat
0.71% U-235
Reference case for LEU production:
Feed253 t Unat
0.71% U-235
HypotheticalEnrichment
148,000 SWU
LEU28 t Uenr
4.0% U-235
Tails332 t Udep0.3% U-235

- 26 -
Table 28: Estimated mass balance of HEU downblending with blendstock re-enrichment(per t HEU)
Feed226 t Unat
0.71% U-235
Past HEUEnrichment
200,000 SWU
HEU1 t Uenr
93% U-235
Tails225 t Udep0.3% U-235
Downblending LEU36.6 t Uenr4.0% U-235
Blendstockorigin
415.3 t Udep0.22% U-235
Blendstockre-enrichment232,000 SWU
FinalBlendstock35.6 t Uenr1.5% U-235
Tails379.7 t Udep0.1% U-235
Reference case for LEU production:
Feed330 t Unat
0.71% U-235
HypotheticalEnrichment
193,000 SWU
LEU36.6 t Uenr4.0% U-235
Tails293.4 t Udep0.3% U-235

- 27 -
Table 29: Estimated effect of blendstock production options on SWU balance fordownblending of HEU (per kg HEU)Malus from blendstock enrichment taken into account(200 SWU spent for enrichment of Unat to 1 kg HEU at 93% assay and 0.3% tails assay)
Blendstockproduction
option
Blendstockorigin
Final Blendstock LEU netSWU loss
U-235assay
[wt-%]
U-235assay
[wt-%]
SWU spent forblendstockenrichment
[SWU]
usableSWU equiv.contained
[SWU]
DU Uenr a) 0.22% 1.50% 232 193 120%
Unat Uenr b) 0.71%
3.32% 524 696 14%
1.50% 33 193 20%
1.15% 14 170 22%
DU Uneq a) 0.22% 0.71% 56 148 54%
Unat - 0.71% 0 148 26%
Unat DU c) 0.71% 0.30% 0 132 34%a) 0.1% tails assay at blendstock enrichment; blendstock origin DU generated from enrichment of Unat to 4%.b) 0.3% tails assay at blendstock enrichmentc) blendstock DU generated from enrichment of Unat to 4%.
Recovery of the uranium feedstock component from HEU
The question, why Rosatom is spending more separative work on the feedstock enrichment thancontained in and recoverable from the downblended HEU, draws the attention to the only otherresource recoverable from the HEU, that is the uranium feedstock component contained.And, indeed, a closer look shows that the downblending process presents an attractive uraniumresource for Rosatom (see Table 30).
Table 30: Uranium component balance for downblending of HEU
Uranium feed originally used for HEU production, per kg HEU a) 226 kg Unat
Uranium feed equiv. contained in downblended LEU, per kg HEU b) c) 330 kg Unat
Uranium feed equiv. contained in downblend. LEU, for 28.1 t HEU b) c) 9300 t Unat
excess SWU spent, per kg HEU: (20% of 200 SWU) 40 SWU
excess SWU spent per kg U feed equiv. contained in downblend. LEU 0.12 SWU/kg Ua) HEU: 93% product assay, enrichted from 0.71% feed assay with 0.3% tails assayb) Blendstock: 1.5% assay, re-enriched from 0.22% assay tails with 0.1% secondary tails assayc) LEU reference case: 4.0% product assay, enriched from 0.71% feed assay with 0.3% tails assay

- 28 -
If the excess separative work spent on the tails enrichment for blendstock production isattributed to the uranium feed component recovered by the downblending process, then theresulting expense of 0.12 SWU per kg U recovered is extraordinarily low (compare this toTable 18 on p.18!).
Conclusions:' The use of re-enriched depleted uranium as blendstock is not the only option to obtain
ASTM-conforming LEU from downblending of HEU. Therefore, other than itsometimes appears, re-enrichment of tails is not the sine qua non for HEUdownblending.
' The combined loss of separative work from tails-enrichment for blendstock-productionand from the downblending itself is 20% higher than the SWU originally spent for theHEU production. So, in fact, the whole process consumes 20% more separativework than it can recover. Doing nothing at all would be more efficient, from an SWUperspective, than this combination of tails-enrichment and subsequent HEU-downblending!
' The only recovery actually taking place with the current scheme of HEU downblendingwith re-enriched tails is the recovery of the uranium feedstock component contained inthe HEU. So, in effect, Rosatom is running an operation to recover the uraniumcomponent contained in the HEU, at the expense of quite modest separative work,while it completely sinks the tremendous separative work contained in the HEU.
' The blendstock production therefore must be more likely seen as a reaction to thecurrently rather low Russian domestic uranium production from mines and Russia‘srather limited uranium reserves mineable at current market prices, and/or as a means tocircumvent existing trade restrictions for Russian SWU (see below).
2.5. Policy, trade and legal aspects of tails enrichment
Russia‘s uranium supply and demand situation
Since the dissolution of the Soviet Union, Russia is cut off from major uranium resources,mainly in Kazakhstan, see Table 31. At the current production rate of 3150 t/a (2003), Russia‘sreserves that are mineable at current uranium prices will be mined out in just 15 years.Moreover, Russia‘s annual reactor-related uranium requirements of 5100 t U (as of 2003)exceed the domestic production by 1950 t U, or 62%. In addition, Russia has plans to buildseveral new reactors. So, unless Russia is holding major uranium stocks (no data available), itis running into a serious uranium supply crisis in a rather short time.On the other hand, Russia has huge surplus centrifuge enrichment capacities left over from theCold War era (alone more than 7 million SWU are currently being used for the re-enrichmentof imported tails, while further capacities are in use for re-enrichment of domestic tails). Whilethe enrichment capacities in other countries are constantly being expanded (such as Urenco‘splants in the UK, the Netherlands, and Germany), and old diffusion enrichment capacities aregoing to be replaced by centrifuge technology (such as in France and the U.S.), Russia cannotsell its surplus enrichment services on the world market, due to trade restrictions (see below).

- 29 -
Table 31: Uranium Resources in the former Soviet UnionReasonably Assured Resources (RAR) as of Jan.1, 2003, vs. cost range
< $40/kg U($15.38/lb U3O8)
< $80/kg U($30.77/lb U3O8)
[t U] share [t U] share
Kazakhstan 280,620 68.4% 384,625 63.6%
Uzbekistan 61,510 15.0% 61,510 10.2%
Russia 52,610 12.8% 124,050 20.5%
Ukraine 15,380 3.8% 34,630 5.7%
TOTAL 410,120 100.0% 604,815 100.0%Source: [NEA 2004]
So, in Russia‘s view, the second-best thing it can do with its surplus enrichment capacities is touse them to recover residual uranium from depleted uranium tails. And in fact, the estimatedannual recovery of 2240 t U of „natural-equivalent“ uranium from further re-enrichment ofUrenco‘s and Eurodif‘s tails on Rosatom‘s own account (see Table 17 on p.17), would alreadyfill Russia‘s current supply gap, while Russia, in addition, is re-enriching tails from its ownstocks. In Russia‘s view, the uranium recovery from the imported tails has the advantage of notusing up the residual uranium „reserve“ contained in the tails stocks of its own. The totalamount of uranium recovered from tails on its own account is larger than Russia‘s current needsand therefore allows for other uses, such as blendstock supply for HEU downblending.And now it also becomes clear, why Russia is not using natural uranium for blendstockenrichment, though this would allow for the recovery of a major part of the separative workcontained in the HEU: Russia simply has no surplus natural uranium available, while it disposesof vast surplus enrichment capacities.
Safeguards obligations for Australian and Canadian uranium
The major uranium producers Australia and Canada require that the depleted uranium tailsremaining from enrichment or re-enrichment of uranium originating in their countries must besubject to IAEA safeguards. Russia, however, is not willing to conform to this requirement.Urenco and Eurodif, therefore, cannot send tails that were generated from enrichment ofuranium originating in Australia or Canadia to Russia for re-enrichment, if the tails are toremain in Russia. Discussions are ongoing on this issue between Russia, Australia, Canada andEuratom. [UI 2001]During the summer of 2003, a temporary arrangement was reached on tails from uraniumoriginating in Canada; this arrangement is „limited in time, until ongoing political consultationsresult in a definitive solution.“ [ESA AR 2003]The obvious option of taking the tails back apparently is not being considered, since this wouldundermine the economic basis for the re-enrichment in Russia.

- 30 -
Trade restrictions on import of Russian uranium or enrichment
The U.S. Department of Commerce (DOC) maintains a complicated system of trade restrictionson imports of Russian uranium and enrichment services, aiming at protecting its domesticuranium industry, see [UI 1999a].The Euratom Supply Agency‘s (ESA) current policy on the import of Commonwealth ofIndependent States (CIS) uranium and Russian enrichment seeks to maintain diversity ofsources. This means that EU utilities (i.e. the end-users) should not depend, on average, formore than about one quarter of their natural uranium needs on CIS suppliers; for Russianenrichment the limit is slightly less than one fifth of their needs. ESA‘s policy moreover aimsat assuring „market-related“ prices. [UI 2000]
Trade restrictions on import of tails re-enriched in Russia
The United States considers that re-enriched tails material is subject to the same importrestrictions as Russian material. Among other restrictions, it is subject to the provisions of theUS-Russia Suspension Agreement and the USEC Privatization Act. [UI 2001] [UI 1999a]The Euratom Supply Agency considers re-enriched tails material, if sold in the form in whichit is imported, as Russian and subject to the same limitations as those applicable to otheruranium imports from countries in the CIS. However, if the material is further enriched withinthe EU then it is not subject to such limitations and can be sold to EU end-users withoutrestriction. [UI 2001] [UI 2000]
Legal aspect: import of radioactive waste?
The secondary tails generated during the upgrading process remain in Russia. Considering thatthe re-enrichment process results only in a minor reduction of the amount of tails to be disposedof, the possibility must be taken into consideration that the tails transfer to Russia constitutes anillegal transfer of radioactive waste for final disposal.Given the various uses Russia is making of the recovered uranium, this view might appearsomewhat inappropriate; but it has to be kept in mind that all this re-enrichment is only beingperformed, since Russia apparently is doing it for the operating cost only (presumably 18% ofthe current market price). If the re-enrichment were so economically attractive, then Urenco andEurodif would do it on their own. And, if the residual uranium contained in the tails were sovaluable, then Urenco and Eurodif would be eager to keep the tails rather than to give themaway on the contrary, as is the case now.For Urenco and Eurodif, the main purpose of the deal is to "solve" their waste managementproblem by transferring the depleted uranium to Russia.The German Federal Government, however, stresses the results of an investigation it hasconducted together with the governments of the United Kingdom and the Netherlands. Thestudy has approved that the re-enrichment in Russia is „not connected to a management ofresidues violating international rules, standards, or obligations“. [BT-Drs.13/8810, Oct. 22,1997]

- 31 -
Conclusions:' Russia faces a serious shortage in uranium supply from domestic ore deposits, while it
has huge surplus uranium enrichment capacities.' Trade restrictions limit the sale of surplus Russian separative work, except when
uranium recovered in Russia from imported tails is further enriched in the EU.' The re-enrichment of imported tails gives Russia access to additional uranium resources
at the expense of separative work, and it gives Russia the occasion to sell part of itsSWU, though not at market prices.
' The fact that the ultimate tails, comprising roughly 10,000 t U (contained in 15,000 t ofUF6) annually, remain in Russia with unknown fate gives rise to the suspicion that thetails import constitutes an illegal transfer of nuclear waste. This view is supported by thefact that the re-enrichment reduces the amount of the tails only by a minor fraction, andby the very low likeliness that the residual uranium still contained in the ultimate tailsmay ever be recoverable economically, and by taking into account that the whole re-enrichment business is only functioning at prices that are a small fraction of marketprices.
Depleted uranium storage cylinders at the Portsmouth (Ohio) Gaseous Diffusion Plant site. (U.S. DOE)

- 32 -
Annex: Mass- and cost balance
Option N
Product produced by Rosatom by further stripping of the secondary tails on its own account isnatural-equivalent uranium with 0.71% assay.
Table columns:! Urenco: re-enrichment of Urenco tails to natural-equivalent assay! Ed. (neq): re-enrichment of one part of Eurodif tails to natural-equivalent assay! Ed. (enr): re-enrichment of other part of Eurodif tails to 3.5% assay! Ed. (tot): total for re-enrichment of all Eurodif tails! Ure.+Ed.: total for re-enrichment of Urenco and Eurodif tails! Ref.case: reference case for enrichment to 3.5% (to determine product value)
Assumptions for Mass Balance:! Conversion losses not included,! Depleted and natural UF6 transported in 48Y cylinders,! Enriched UF6 transported in 30B cylinders,! Re-enrichment divided in 2 subsequent steps (for accounting purposes), though
physically one process:" Step 1: performed by Rosatom on the account of Urenco and Eurodif" Step 2: performed by Rosatom on its own account, 0.71% assay (natural-
equivalent)
Assumptions for Cost Balances:! Urenco and Eurodif pay operating cost price for re-enrichment Step 1 only,! Three options for avoided tails disposal cost for Urenco and Eurodif:
" US: U.S. DOE estimate for cemented disposal as U3O8 in a mine, " UR: provision made by Urenco, and" DE: estimate for cemented disposal as U3O8 in Gorleben HLW deposit,
Germany.! Two options for tails disposal cost for Rosatom: US and UR (as above)! For the value of the natural-equivalent uranium and enriched uranium obtained, the
market price for uranium of the respective assays is used.! Prices are spot market prices for the dates given, as obtained from Ux Consulting
Company, LLC, http://www.uxc.com ; no account for price changes during the year.! Exchange rates are as obtained from „The Currency Site“ http://www.oanda.com/ (for
dates before the introduction of the Euro, the DEM exchange rate was used andconverted to EUR using the official DEM/EUR ratio of 1.95583)
Conventions:t stands for metric tonne, % stands for weight-percent, $ stands for US-DollarUneq: „natural-equivalent“ uranium (0.71% assay)profit UE: profit for Urenco / Eurodifprofit R: profit for Rosatom

- 33 -
ANNUAL MASS BALANCE - OPT. N Urenco Ed. (neq) Ed. (enr) Ed. tot Ure.+Ed. Ref. CaseConstantsmass ratio U/UF6 0.676 0.676 0.676 0.676mass ratio U/U3O8 0.848 0.848 0.848lb U3O8 / kg U 2.600 2.600 2.600capacity of 48Y cylinder [t UF6] 12.501 12.501 12.501capacity of 30B cylinder [t UF6] 2.277
Urenco/Eurodif enrichmentfeed assay [% U235] 0.71 0.71 0.71product assay [% U235] 3.60 3.60 3.60tails assay [% U235] 0.30 0.35 0.35feed quantity Unat in UF6 [t U] 7993.08 4436.00 3435.97 7871.97 15865.05feed quantity UF6 [t UF6] 11820.81 6560.32 5081.39 11641.71 23462.52product quantity UF6 [t UF6] 1468.65 726.68 562.86 1289.54 2758.19product quantity U in UF6 [t U] 993.08 491.37 380.60 871.97 1865.05tails quantity UF6 [t UF6] 10352.17 5833.63 4518.53 10352.16 20704.33tails quantity U in UF6 [t U] 7000.00 3944.63 3055.37 7000.00 14000.00number of 48Y cylinders for tails 829 467 362 829 1658separation work [million SWU] 4.50 2.03 1.57 3.60 8.10
Tails upgrading Step 1feed assay [% U235] 0.30 0.35 0.35 0.71product assay [% U235] 0.71 0.71 3.50 3.50tails assay [% U235] 0.224 0.21 0.21 0.35feed quantity UF6 [t UF6] 10352.17 5833.63 4518.53 10352.16 20704.33 1682.20feed quantity U in UF6 [t U] 7000.00 3944.63 3055.37 7000.00 14000.00 1137.48product quantity [t UF6] 1618.86 1633.42 192.28 192.25product quantity U in UF6 [t U] 1094.65 1104.50 130.02 130.00number of 48Y cylinders for product Uneq 130 131 131 261number of 30B cylinders for product Uenr 85 85 85tails quantity [t UF6] 8733.31 4200.22 4326.25 8526.47 17259.78 1489.95tails quantity U in UF6 [t U] 5905.35 2840.13 2925.35 5765.49 11670.84 1007.48separation work [million SWU] 0.79 0.67 1.21 1.88 2.67 0.51
Tails upgrading Step 2feed assay [% U235] 0.224 0.21 0.21product assay [% U235] 0.71 0.71 0.71tails assay [% U235] 0.10 0.10 0.10feed quantity UF6 [t UF6] 8733.31 4200.22 4326.25 8526.47 17259.78feed quantity U in UF6 [t U] 5905.35 2840.13 2925.35 5765.49 11670.84product quantity [t UF6] 1775.30 757.42 780.14 1537.56 3312.86product quantity U in UF6 [t U] 1200.43 512.15 527.52 1039.68 2240.11tails quantity [t UF6] 6958.01 3442.80 3546.11 6988.91 13946.92tails quantity U in UF6 [t U] 4704.92 2327.98 2397.83 4725.81 9430.73number of 48Y cylinders for tails 557 276 284 560 1117residual Uneq equiv. contained in tails [t U] 662.66 327.88 337.72 665.61 1328.27separation work [million SWU] 2.42 1.11 1.14 2.25 4.67

- 34 -
SPECIFIC TAILS DISPOSAL COST Urenco Ed. (neq) Ed. (enr) Ed. tot Ure.+Ed. Ref. Case
Specific Tails Disposal Cost (DE)specific deconversion cost UF6 to U3O8 [EUR/kg UF6] 1.60specific deconversion cost UF6 to U3O8 [EUR/kg U] 2.37cost for storage of 200-litre barrel [EUR] 7670.00specific storage cost per litre [EUR/ltr] 38.35specific storage volume per t U3O8 [ltr/t U3O8] 550.00specific storage cost per kg U3O8 [EUR/kg U3O8] 21.09specific storage cost per kg U as U3O8 [EUR/kg U] 24.87specif. storage cost per kg UF6 as U3O8 [EUR/kg UF6] 16.82specific disposal cost (deconv. + storage) [EUR/kg U] 27.24 27.24 27.24 - as above for UF6 [EUR/kg UF6] 18.42 18.42 18.42
Specific Tails Disposal Cost (UR)specific disposal cost (deconv. + storage) [EUR/kg U] 7.03 7.03 7.03 - as above for UF6 [EUR/kg UF6] 4.75 4.75 4.75
Specific Tails Disposal Cost (US)specific deconversion cost UF6 to U3O8 [$/kg UF6] 0.48specific storage cost per kg UF6 as U3O8 [$/kg UF6] 2.49specific disposal cost (deconv. + storage) [$/kg UF6] 2.97 2.97 2.97 - as above for U [$/kg U] 4.39 4.39 4.39

- 35 -
ANNUAL COST BALANCE - OPT.N, Dec.25, 1995 Urenco Ed. (neq) Ed. (enr) Ed. tot Ure.+Ed. Ref. CaseGeneral cost dataprice of Unat [$/lb U3O8] 12.25 12.25 12.25price of Unat as U3O8 [$/kg U] 31.85 31.85 31.85specific conversion cost U3O8 to UF6 [$/kg U] 5.85 5.85 5.85price of Unat as UF6 [$/kg U] 37.70 37.70 37.70 37.70exchange rate [EUR/$] 0.74 0.74 0.74
Urenco/Eurodif enrichment planttheoretical tails disposal cost (DE) [$ million] 257.67 145.20 112.47 257.67 515.34theoretical tails disposal cost (UR) [$ million] 66.50 37.47 29.03 66.50 133.00theoretical tails disposal cost (US) [$ million] 30.75 17.33 13.42 30.75 61.49
Tails upgrading Step 1specific transport cost [$/kg UF6] 1.50 1.50 1.50transport cost [$ million] 17.96 11.20 7.07 18.27 36.22specific separation work cost [$/SWU] 20.00 20.00 20.00 95.00separation work cost [$ million] 15.76 13.49 24.20 37.69 53.45 48.92separation work cost per kg Uneq produced [$/kg U] 14.39 12.22separation work cost per t UF6 feed [$/t UF6] 1522.08 2312.79 5355.10price paid for re-enrichment [$ million] 15.76 13.49 24.20market value of the product as UF6 [$ million] 41.27 41.64 91.80 133.44 174.71 91.80theoretical tails disposal cost (UR) [$ million] 56.10 26.98 27.79 54.77 110.87theoretical tails disposal cost (US) [$ million] 25.94 12.47 12.85 25.32 51.26profit UE1NO = prod. val. ./. transp ./. sep. [$ million] 7.56 16.95 60.54 77.49 85.04profit UE1DE = UE1NO + avoid.disp. (DE) [$ million] 265.22 162.15 173.01 335.16 600.38profit UE1UR = UE1NO + avoid.disp. (UR) [$ million] 74.06 54.42 89.57 143.99 218.04profit UE1US = UE1NO + avoid.disp. (US) [$ million] 38.30 34.27 73.96 108.23 146.53profit R1UR = re-e.pr. ./. sep. ./. disp.(UR) [$ million] -56.10 -26.98 -27.79 -54.77 -110.87profit R1US = re-e.pr. ./. sep. ./. disp.(US) [$ million] -25.94 -12.47 -12.85 -25.32 -51.26
Tails upgrading Step 2specific separation work cost [$/SWU] 20.00 20.00 20.00separation work cost [$ million] 48.43 22.18 22.84 45.02 93.45separation work cost per kg Uneq produced [$/kg U] 40.35 43.30 43.30 43.30 41.72separation work cost per t UF6 feed [$/t UF6] 5545.87 5279.52 5279.52 5279.52 5414.29market value of the product Uneq as UF6 [$ million] 45.26 19.31 19.89 39.20 84.45tails disposal cost (UR) [$ million] 44.70 22.12 22.78 44.90 89.59tails disposal cost (US) [$ million] 20.67 10.23 10.53 20.76 41.42profit R2NO = R1 + prod. val. + avoid.disp. ./. separ. [$million]
-3.18 -2.87 -2.95 -5.82 -9.00
profit R2UR = R2NO ./. disp. cost (UR) [$ million] -47.87 -24.98 -25.73 -50.72 -98.59profit R2US = R2NO ./. disp. cost (US) [$ million] -23.84 -13.09 -13.48 -26.58 -50.42

- 36 -
ANNUAL COST BALANCE - OPT.N, Dec.25, 2000 Urenco Ed. (neq) Ed. (enr) Ed. tot Ure.+Ed. Ref. CaseGeneral cost dataprice of Unat [$/lb U3O8] 7.10 7.10 7.10price of Unat as U3O8 [$/kg U] 18.46 18.46 18.46specific conversion cost U3O8 to UF6 [$/kg U] 4.25 4.25 4.25price of Unat as UF6 [$/kg U] 22.71 22.71 22.71 22.71exchange rate [EUR/$] 1.08 1.08 1.08
Urenco/Eurodif enrichment planttheoretical tails disposal cost (DE) [$ million] 176.55 99.49 77.06 176.55 353.10theoretical tails disposal cost (UR) [$ million] 45.56 25.68 19.89 45.56 91.13theoretical tails disposal cost (US) [$ million] 30.75 17.33 13.42 30.75 61.49
Tails upgrading Step 1specific transport cost [$/kg UF6] 1.50 1.50 1.50transport cost [$ million] 17.96 11.20 7.07 18.27 36.22specific separation work cost [$/SWU] 20.00 20.00 20.00 84.00separation work cost [$ million] 15.76 13.49 24.20 37.69 53.45 43.26separation work cost per kg Uneq produced [$/kg U] 14.39 12.22separation work cost per t UF6 feed [$/t UF6] 1522.08 2312.79 5355.10price paid for re-enrichment [$ million] 15.76 13.49 24.20market value of the product as UF6 [$ million] 24.86 25.08 69.09 94.17 119.03 69.09theoretical tails disposal cost (UR) [$ million] 38.44 18.49 19.04 37.53 75.97theoretical tails disposal cost (US) [$ million] 25.94 12.47 12.85 25.32 51.26profit UE1NO = prod. val. ./. transp ./. sep. [$ million] -8.85 0.39 37.82 38.22 29.36profit UE1DE = UE1NO + avoid.disp. (DE) [$ million] 167.70 99.88 114.89 214.77 382.46profit UE1UR = UE1NO + avoid.disp. (UR) [$ million] 36.71 26.07 57.71 83.78 120.49profit UE1US = UE1NO + avoid.disp. (US) [$ million] 21.89 17.72 51.24 68.96 90.85profit R1UR = re-e.pr. ./. sep. ./. disp.(UR) [$ million] -38.44 -18.49 -19.04 -37.53 -75.97profit R1US = re-e.pr. ./. sep. ./. disp.(US) [$ million] -25.94 -12.47 -12.85 -25.32 -51.26
Tails upgrading Step 2specific separation work cost [$/SWU] 20.00 20.00 20.00separation work cost [$ million] 48.43 22.18 22.84 45.02 93.45separation work cost per kg Uneq produced [$/kg U] 40.35 43.30 43.30 43.30 41.72separation work cost per t UF6 feed [$/t UF6] 5545.87 5279.52 5279.52 5279.52 5414.29market value of the product Uneq as UF6 [$ million] 27.26 11.63 11.98 23.61 50.87tails disposal cost (UR) [$ million] 30.63 15.15 15.61 30.76 61.39tails disposal cost (US) [$ million] 20.67 10.23 10.53 20.76 41.42profit R2NO = R1 + prod. val. + avoid.disp. ./. separ. [$million]
-21.17 -10.54 -10.86 -21.40 -42.58
profit R2UR = R2NO ./. disp. cost (UR) [$ million] -51.80 -25.70 -26.47 -52.17 -103.96profit R2US = R2NO ./. disp. cost (US) [$ million] -41.84 -20.77 -21.39 -42.16 -84.00

- 37 -
ANNUAL COST BALANCE - OPT.N, Nov. 15, 2004 Urenco Ed. (neq) Ed. (enr) Ed. tot Ure.+Ed. Ref. CaseGeneral cost dataprice of Unat [$/lb U3O8] 20.25 20.25 20.25price of Unat as U3O8 [$/kg U] 52.65 52.65 52.65specific conversion cost U3O8 to UF6 [$/kg U] 10.00 10.00 10.00price of Unat as UF6 [$/kg U] 62.65 62.65 62.65 62.65exchange rate [EUR/$] 0.77 0.77 0.77
Urenco/Eurodif enrichment planttheoretical tails disposal cost (DE) [$ million] 247.63 139.54 108.09 247.63 495.26theoretical tails disposal cost (UR) [$ million] 63.91 36.01 27.90 63.91 127.82theoretical tails disposal cost (US) [$ million] 30.75 17.33 13.42 30.75 61.49
Tails upgrading Step 1specific transport cost [$/kg UF6] 1.50 1.50 1.50transport cost [$ million] 17.96 11.20 7.07 18.27 36.22specific separation work cost [$/SWU] 20.00 20.00 20.00 110.00separation work cost [$ million] 15.76 13.49 24.20 37.69 53.45 56.64separation work cost per kg Uneq produced [$/kg U] 14.39 12.22separation work cost per t UF6 feed [$/t UF6] 1522.08 2312.79 5355.10price paid for re-enrichment [$ million] 15.76 13.49 24.20market value of the product as UF6 [$ million] 68.58 69.20 127.91 197.10 265.68 127.91theoretical tails disposal cost (UR) [$ million] 53.92 25.93 26.71 52.64 106.55theoretical tails disposal cost (US) [$ million] 25.94 12.47 12.85 25.32 51.26profit UE1NO = prod. val. ./. transp ./. sep. [$ million] 34.87 44.50 96.64 141.15 176.01profit UE1DE = UE1NO + avoid.disp. (DE) [$ million] 282.50 184.05 204.73 388.78 671.27profit UE1UR = UE1NO + avoid.disp. (UR) [$ million] 98.78 80.52 124.54 205.06 303.83profit UE1US = UE1NO + avoid.disp. (US) [$ million] 65.61 61.83 110.06 171.89 237.51profit R1UR = re-e.pr. ./. sep. ./. disp.(UR) [$ million] -53.92 -25.93 -26.71 -52.64 -106.55profit R1US = re-e.pr. ./. sep. ./. disp.(US) [$ million] -25.94 -12.47 -12.85 -25.32 -51.26
Tails upgrading Step 2specific separation work cost [$/SWU] 20.00 20.00 20.00separation work cost [$ million] 48.43 22.18 22.84 45.02 93.45separation work cost per kg Uneq produced [$/kg U] 40.35 43.30 43.30 43.30 41.72separation work cost per t UF6 feed [$/t UF6] 5545.87 5279.52 5279.52 5279.52 5414.29market value of the product Uneq as UF6 [$ million] 75.21 32.09 33.05 65.14 140.34tails disposal cost (UR) [$ million] 42.96 21.25 21.89 43.15 86.10tails disposal cost (US) [$ million] 20.67 10.23 10.53 20.76 41.42profit R2NO = R1 + prod. val. + avoid.disp. ./. separ. [$million]
26.77 9.91 10.21 20.12 46.89
profit R2UR = R2NO ./. disp. cost (UR) [$ million] -16.18 -11.34 -11.68 -23.03 -39.21profit R2US = R2NO ./. disp. cost (US) [$ million] 6.11 -0.31 -0.32 -0.64 5.47

- 38 -
Option B
Product produced by Rosatom by further stripping of the secondary tails on its own account isblendstock uranium with 1.5% assay for use in HEU downblending.
Table columns:! Urenco: re-enrichment of Urenco tails to natural-equivalent assay! Ed. (neq): re-enrichment of one part of Eurodif tails to natural-equivalent assay! Ed. (enr): re-enrichment of other part of Eurodif tails to 3.5% assay! Ed. (tot): total for re-enrichment of all Eurodif tails! Ure.+Ed.: total for re-enrichment of Urenco and Eurodif tails! Ref.case: reference cases for enrichment to 3.5% and 1.5% (to determine product value)
Assumptions for Mass Balance:! Conversion losses not included,! Depleted and natural UF6 transported in 48Y cylinders,! Enriched UF6 transported in 30B cylinders,! Re-enrichment divided in 2 subsequent steps (for accounting purposes), though
physically one process:" Step 1: performed by Rosatom on the account of Urenco and Eurodif" Step 2: performed by Rosatom on its own account, 1.5% assay for blendstock
Assumptions for Cost Balances:! Urenco and Eurodif pay operating cost price for re-enrichment Step 1 only,! Three options for avoided tails disposal cost for Urenco and Eurodif:
" US: U.S. DOE estimate for cemented disposal as U3O8 in a mine, " UR: equivalent to provision made by Urenco, and" DE: estimate for cemented disposal as U3O8 in Gorleben HLW deposit,
Germany.! Two options for tails disposal cost for Rosatom: US and UR (as above)! For the value of the natural-equivalent uranium, enriched uranium, and blendstock
uranium obtained, the market price for uranium of the respective assays is used.! Prices are spot market prices for the dates given, as obtained from Ux Consulting
Company, LLC, http://www.uxc.com ; no account for price changes during the year.! Exchange rates are as obtained from „The Currency Site“ http://www.oanda.com/ (for
dates before the introduction of the Euro, the DEM exchange rate was used andconverted to EUR using the official DEM/EUR ratio of 1.95583)
Conventions:t stands for metric tonne, % stands for weight-percent, $ stands for US-DollarUneq: „natural-equivalent“ uranium (0.71% assay)profit UE: profit for Urenco / Eurodifprofit R: profit for Rosatom

- 39 -
ANNUAL MASS BALANCE - OPT. B Urenco Ed. (neq) Ed. (enr) Ed. tot Ure.+Ed. Ref. CaseConstantsmass ratio U/UF6 0.676 0.676 0.676 0.676mass ratio U/U3O8 0.848 0.848 0.848lb U3O8 / kg U 2.600 2.600 2.600capacity of 48Y cylinder [t UF6] 12.501 12.501 12.501capacity of 30B cylinder [t UF6] 2.277 2.277
Urenco/Eurodif enrichmentfeed assay [% U235] 0.71 0.71 0.71product assay [% U235] 3.60 3.60 3.60tails assay [% U235] 0.30 0.35 0.35feed quantity Unat in UF6 [t U] 7993.08 4436.00 3435.97 7871.97 15865.05feed quantity UF6 [t UF6] 11820.81 6560.32 5081.39 11641.71 23462.52product quantity UF6 [t UF6] 1468.65 726.68 562.86 1289.54 2758.19product quantity U in UF6 [t U] 993.08 491.37 380.60 871.97 1865.05tails quantity UF6 [t UF6] 10352.17 5833.63 4518.53 10352.16 20704.33tails quantity U in UF6 [t U] 7000.00 3944.63 3055.37 7000.00 14000.00number of 48Y cylinders for tails 829 467 362 829 1658separation work [million SWU] 4.50 2.03 1.57 3.60 8.10
Tails upgrading Step 1feed assay [% U235] 0.30 0.35 0.35 0.71product assay [% U235] 0.71 0.71 3.50 3.50tails assay [% U235] 0.224 0.21 0.21 0.35feed quantity UF6 [t UF6] 10352.17 5833.63 4518.53 10352.16 20704.33 1682.00feed quantity U in UF6 [t U] 7000.00 3944.63 3055.37 7000.00 14000.00 1137.35product quantity [t UF6] 1618.86 1633.42 192.28 192.23product quantity U in UF6 [t U] 1094.65 1104.50 130.02 129.98number of 48Y cylinders for product Uneq 130 131 131 261number of 30B cylinders for product Uenr 85 85 85 85tails quantity [t UF6] 8733.31 4200.22 4326.25 8526.47 17259.78 1489.77tails quantity U in UF6 [t U] 5905.35 2840.13 2925.35 5765.49 11670.84 1007.36separation work [million SWU] 0.79 0.67 1.21 1.88 2.67 0.51
Tails upgrading Step 2feed assay [% U235] 0.224 0.21 0.21 0.71product assay [% U235] 1.50 1.50 1.50 1.50tails assay [% U235] 0.10 0.10 0.10 0.30feed quantity UF6 [t UF6] 8733.31 4200.22 4326.25 8526.47 17259.78 4224.75feed quantity U in UF6 [t U] 5905.35 2840.13 2925.35 5765.49 11670.84 2856.72product quantity [t UF6] 773.52 330.02 339.92 669.94 1443.46 1443.46product quantity U in UF6 [t U] 523.05 223.15 229.85 453.00 976.05 976.05tails quantity [t UF6] 7959.79 3870.20 3986.33 7856.53 15816.32 2781.29tails quantity U in UF6 [t U] 5382.30 2616.98 2695.51 5312.48 10694.79 1880.67number of 48Y cylinders for tails 637 310 319 629 1266residual Uneq equiv. contained in tails [t U] 758.07 368.59 379.65 748.24 1506.31 794.65separation work [million SWU] 3.37 1.51 1.56 3.07 6.44 0.90

- 40 -
SPECIFIC TAILS DISPOSAL COST Urenco Ed. (neq) Ed. (enr) Ed. tot Ure.+Ed. Ref. Case
Specific Tails Disposal Cost (DE)specific deconversion cost UF6 to U3O8 [EUR/kg UF6] 1.60specific deconversion cost UF6 to U3O8 [EUR/kg U] 2.37cost for storage of 200-litre barrel [EUR] 7670.00specific storage cost per litre [EUR/ltr] 38.35specific storage volume per t U3O8 [ltr/t U3O8] 550.00specific storage cost per kg U3O8 [EUR/kg U3O8] 21.09specific storage cost per kg U as U3O8 [EUR/kg U] 24.87specif. storage cost per kg UF6 as U3O8 [EUR/kg UF6] 16.82specific disposal cost (deconv. + storage) [EUR/kg U] 27.24 27.24 27.24 - as above for UF6 [EUR/kg UF6] 18.42 18.42 18.42
Specific Tails Disposal Cost (UR)specific disposal cost (deconv. + storage) [EUR/kg U] 7.03 7.03 7.03 - as above for UF6 [EUR/kg UF6] 4.75 4.75 4.75
Specific Tails Disposal Cost (US)specific deconversion cost UF6 to U3O8 [$/kg UF6] 0.48specific storage cost per kg UF6 as U3O8 [$/kg UF6] 2.49specific disposal cost (deconv. + storage) [$/kg UF6] 2.97 2.97 2.97 - as above for U [$/kg U] 4.39 4.39 4.39

- 41 -
ANNUAL COST BALANCE - OPT.B, Dec. 25, 1995 Urenco Ed. (neq) Ed. (enr) Ed. tot Ure.+Ed. Ref. CaseGeneral cost dataprice of Unat [$/lb U3O8] 12.25 12.25 12.25price of Unat as U3O8 [$/kg U] 31.85 31.85 31.85specific conversion cost U3O8 to UF6 [$/kg U] 5.85 5.85 5.85price of Unat as UF6 [$/kg U] 37.70 37.70 37.70 37.70exchange rate [EUR/$] 0.74 0.74 0.74
Urenco/Eurodif enrichment planttheoretical tails disposal cost (DE) [$ million] 257.67 145.20 112.47 257.67 515.34theoretical tails disposal cost (UR) [$ million] 66.50 37.47 29.03 66.50 133.00theoretical tails disposal cost (US) [$ million] 30.75 17.33 13.42 30.75 61.49
Tails upgrading Step 1specific transport cost [$/kg UF6] 1.50 1.50 1.50transport cost [$ million] 17.96 11.20 7.07 18.27 36.22specific separation work cost [$/SWU] 20.00 20.00 20.00 95.00separation work cost [$ million] 15.76 13.49 24.20 37.69 53.45 48.91separation work cost per kg Uneq produced [$/kg U] 14.39 12.22separation work cost per t UF6 feed [$/t UF6] 1522.08 2312.79 5355.10price paid for re-enrichment [$ million] 15.76 13.49 24.20market value of the product as UF6 [$ million] 41.27 41.64 91.79 133.43 174.70 91.79theoretical tails disposal cost (UR) [$ million] 56.10 26.98 27.79 54.77 110.87theoretical tails disposal cost (US) [$ million] 25.94 12.47 12.85 25.32 51.26profit UE1NO = prod. val. ./. transp. ./. sep. [$ million] 7.56 16.95 60.53 77.48 85.03profit UE1DE = UE1NO + avoid.disp. (DE) [$ million] 265.22 162.15 173.00 335.14 600.37profit UE1UR = UE1NO +avoid.disp. (UR) [$ million] 74.06 54.42 89.55 143.98 218.03profit UE1US = UE1NO + avoid.disp. (US) [$ million] 38.30 34.27 73.95 108.22 146.52profit R1UR = re-e.pr. ./. sep. ./. disp.(UR) [$ million] -56.10 -26.98 -27.79 -54.77 -110.87profit R1US = re-e.pr. ./. sep. ./. disp.(US) [$ million] -25.94 -12.47 -12.85 -25.32 -51.26
Tails upgrading Step 2specific separation work cost [$/SWU] 20.00 20.00 20.00 95.00separation work cost [$ million] 67.35 30.24 31.15 61.40 128.74 85.73separation work cost per kg Uenr produced [$/kg U] 128.76 135.53 135.53 135.53 131.90separation work cost per t UF6 feed [$/t UF6] 7711.60 7200.72 7200.72 7200.72 7459.22market value of the product Uenr as UF6 [$ million] 103.66 44.22 45.55 89.78 193.43 193.43tails disposal cost (UR) [$ million] 51.13 24.86 25.61 50.47 101.60tails disposal cost (US) [$ million] 23.64 11.49 11.84 23.33 46.97profit R2NO = R1 + prod. val. + avoid.disp. ./. separ. [$million]
36.31 13.98 14.40 28.38 64.69
profit R2UR = R2NO ./. disp. cost (UR) [$ million] -14.82 -10.88 -11.21 -22.09 -36.91profit R2US = R2NO ./. disp. cost (US) [$ million] 12.67 2.48 2.56 5.04 17.71
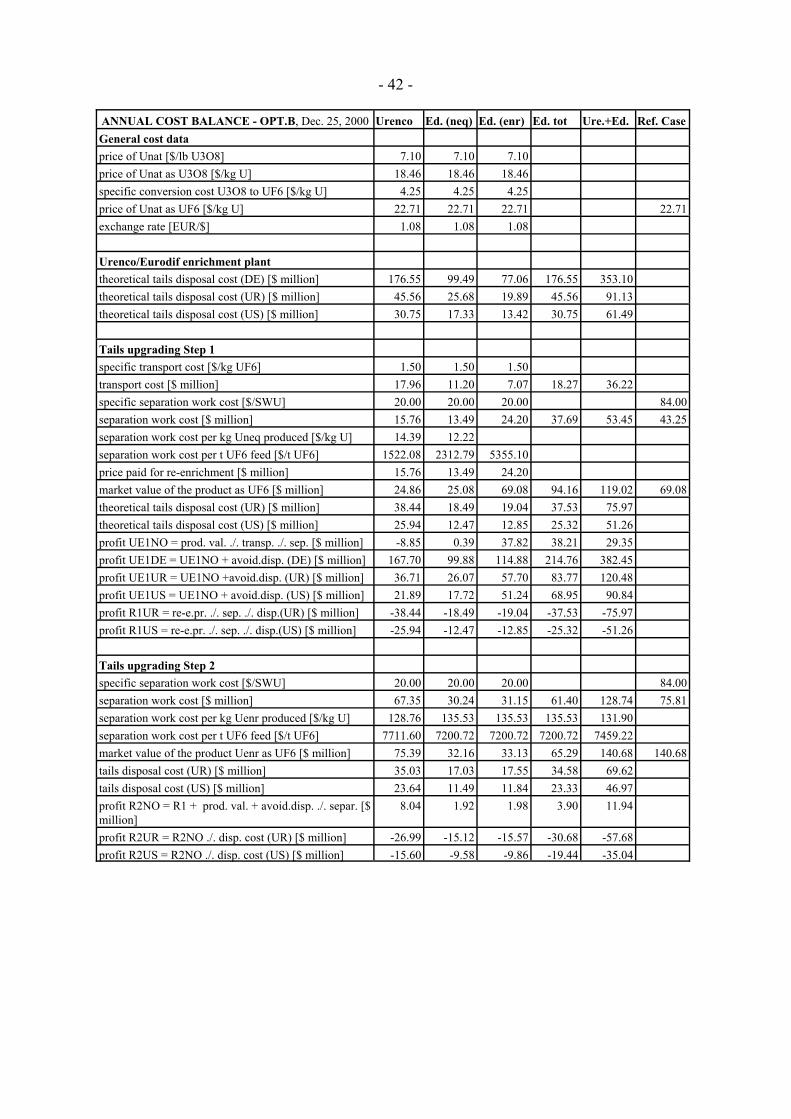
- 42 -
ANNUAL COST BALANCE - OPT.B, Dec. 25, 2000 Urenco Ed. (neq) Ed. (enr) Ed. tot Ure.+Ed. Ref. CaseGeneral cost dataprice of Unat [$/lb U3O8] 7.10 7.10 7.10price of Unat as U3O8 [$/kg U] 18.46 18.46 18.46specific conversion cost U3O8 to UF6 [$/kg U] 4.25 4.25 4.25price of Unat as UF6 [$/kg U] 22.71 22.71 22.71 22.71exchange rate [EUR/$] 1.08 1.08 1.08
Urenco/Eurodif enrichment planttheoretical tails disposal cost (DE) [$ million] 176.55 99.49 77.06 176.55 353.10theoretical tails disposal cost (UR) [$ million] 45.56 25.68 19.89 45.56 91.13theoretical tails disposal cost (US) [$ million] 30.75 17.33 13.42 30.75 61.49
Tails upgrading Step 1specific transport cost [$/kg UF6] 1.50 1.50 1.50transport cost [$ million] 17.96 11.20 7.07 18.27 36.22specific separation work cost [$/SWU] 20.00 20.00 20.00 84.00separation work cost [$ million] 15.76 13.49 24.20 37.69 53.45 43.25separation work cost per kg Uneq produced [$/kg U] 14.39 12.22separation work cost per t UF6 feed [$/t UF6] 1522.08 2312.79 5355.10price paid for re-enrichment [$ million] 15.76 13.49 24.20market value of the product as UF6 [$ million] 24.86 25.08 69.08 94.16 119.02 69.08theoretical tails disposal cost (UR) [$ million] 38.44 18.49 19.04 37.53 75.97theoretical tails disposal cost (US) [$ million] 25.94 12.47 12.85 25.32 51.26profit UE1NO = prod. val. ./. transp. ./. sep. [$ million] -8.85 0.39 37.82 38.21 29.35profit UE1DE = UE1NO + avoid.disp. (DE) [$ million] 167.70 99.88 114.88 214.76 382.45profit UE1UR = UE1NO +avoid.disp. (UR) [$ million] 36.71 26.07 57.70 83.77 120.48profit UE1US = UE1NO + avoid.disp. (US) [$ million] 21.89 17.72 51.24 68.95 90.84profit R1UR = re-e.pr. ./. sep. ./. disp.(UR) [$ million] -38.44 -18.49 -19.04 -37.53 -75.97profit R1US = re-e.pr. ./. sep. ./. disp.(US) [$ million] -25.94 -12.47 -12.85 -25.32 -51.26
Tails upgrading Step 2specific separation work cost [$/SWU] 20.00 20.00 20.00 84.00separation work cost [$ million] 67.35 30.24 31.15 61.40 128.74 75.81separation work cost per kg Uenr produced [$/kg U] 128.76 135.53 135.53 135.53 131.90separation work cost per t UF6 feed [$/t UF6] 7711.60 7200.72 7200.72 7200.72 7459.22market value of the product Uenr as UF6 [$ million] 75.39 32.16 33.13 65.29 140.68 140.68tails disposal cost (UR) [$ million] 35.03 17.03 17.55 34.58 69.62tails disposal cost (US) [$ million] 23.64 11.49 11.84 23.33 46.97profit R2NO = R1 + prod. val. + avoid.disp. ./. separ. [$million]
8.04 1.92 1.98 3.90 11.94
profit R2UR = R2NO ./. disp. cost (UR) [$ million] -26.99 -15.12 -15.57 -30.68 -57.68profit R2US = R2NO ./. disp. cost (US) [$ million] -15.60 -9.58 -9.86 -19.44 -35.04

- 43 -
ANNUAL COST BALANCE - OPT.B, Nov. 15, 2004 Urenco Ed. (neq) Ed. (enr) Ed. tot Ure.+Ed. Ref. CaseGeneral cost dataprice of Unat [$/lb U3O8] 20.25 20.25 20.25price of Unat as U3O8 [$/kg U] 52.65 52.65 52.65specific conversion cost U3O8 to UF6 [$/kg U] 10.00 10.00 10.00price of Unat as UF6 [$/kg U] 62.65 62.65 62.65 62.65exchange rate [EUR/$] 0.77 0.77 0.77
Urenco/Eurodif enrichment planttheoretical tails disposal cost (DE) [$ million] 247.63 139.54 108.09 247.63 495.26theoretical tails disposal cost (UR) [$ million] 63.91 36.01 27.90 63.91 127.82theoretical tails disposal cost (US) [$ million] 30.75 17.33 13.42 30.75 61.49
Tails upgrading Step 1specific transport cost [$/kg UF6] 1.50 1.50 1.50transport cost [$ million] 17.96 11.20 7.07 18.27 36.22specific separation work cost [$/SWU] 20.00 20.00 20.00 110.00separation work cost [$ million] 15.76 13.49 24.20 37.69 53.45 56.64separation work cost per kg Uneq produced [$/kg U] 14.39 12.22separation work cost per t UF6 feed [$/t UF6] 1522.08 2312.79 5355.10price paid for re-enrichment [$ million] 15.76 13.49 24.20market value of the product as UF6 [$ million] 68.58 69.20 127.89 197.09 265.67 127.89theoretical tails disposal cost (UR) [$ million] 53.92 25.93 26.71 52.64 106.55theoretical tails disposal cost (US) [$ million] 25.94 12.47 12.85 25.32 51.26profit UE1NO = prod. val. ./. transp. ./. sep. [$ million] 34.87 44.50 96.63 141.13 176.00profit UE1DE = UE1NO + avoid.disp. (DE) [$ million] 282.50 184.05 204.71 388.76 671.26profit UE1UR = UE1NO +avoid.disp. (UR) [$ million] 98.78 80.52 124.52 205.04 303.82profit UE1US = UE1NO + avoid.disp. (US) [$ million] 65.61 61.83 110.05 171.88 237.49profit R1UR = re-e.pr. ./. sep. ./. disp.(UR) [$ million] -53.92 -25.93 -26.71 -52.64 -106.55profit R1US = re-e.pr. ./. sep. ./. disp.(US) [$ million] -25.94 -12.47 -12.85 -25.32 -51.26
Tails upgrading Step 2specific separation work cost [$/SWU] 20.00 20.00 20.00 110.00separation work cost [$ million] 67.35 30.24 31.15 61.40 128.74 99.27separation work cost per kg Uenr produced [$/kg U] 128.76 135.53 135.53 135.53 131.90separation work cost per t UF6 feed [$/t UF6] 7711.60 7200.72 7200.72 7200.72 7459.22market value of the product Uenr as UF6 [$ million] 149.11 63.61 65.52 129.14 278.24 278.24tails disposal cost (UR) [$ million] 49.14 23.89 24.61 48.50 97.64tails disposal cost (US) [$ million] 23.64 11.49 11.84 23.33 46.97profit R2NO = R1 + prod. val. + avoid.disp. ./. separ. [$million]
81.76 33.37 34.37 67.74 149.50
profit R2UR = R2NO ./. disp. cost (UR) [$ million] 32.62 9.48 9.76 19.24 51.86profit R2US = R2NO ./. disp. cost (US) [$ million] 58.12 21.88 22.53 44.41 102.52

- 44 -
Glossaryassay: concentration of an isotope (U-235 subsumed, if not otherwise indicated) in uranium,usually given as weight-%
blendstock: uranium (*LEU, *Unat, or *DU) used for *downblending of *HEU
conversion: conversion of uranium from one chemical form into another one (usually *U3O8 to*UF6, if not otherwise indicated)
depleted uranium (DU): uranium (of any chemical form) with concentration of isotope U-235lower than in *natural uranium (< 0.711 weight-%)
DOE: U.S. Department of Energy
downblending: mixing of *HEU with *blendstock uranium, to obtain *LEU for nuclear fuel
DU: *depleted uranium
enriched uranium: uranium (of any chemical form) with concentration of isotope U-235higher than in *natural uranium (> 0.711 weight-%)
enrichment: process of increasing the concentration of the fissile isotope U-235 in uranium,usually by physical processes, such as gas diffusion or gas centrifugation; produces a productstream of *enriched uranium and a byproduct stream of *depleted uranium (tails)
ESA: Euratom Supply Agency
feed: uranium introduced into the enrichment cascade as *UF6
HEU: *highly enriched uranium
highly enriched uranium (HEU): uranium with an U-235 *assay of 20%, or higher (only usedin nuclear weapons and in research reactors)
HLW: High-Level Radioactive Waste
IAEA: International Atomic Energy Agency
LEU: *Low Enriched Uranium
LLW: Low-Level Radioactive Waste
low enriched uranium (LEU): uranium with an U-235 *assay > 0.711% and < 20% (as usedin Light Water Reactors - *LWR)
LWR: Light Water Reactor, such as Boiling Water Reactor and Pressurized Water Reactor,requires *enriched uranium with U-235 *assay of 3-5% as fuel

- 45 -
natural uranium: uranium (of any chemical form) of natural isotopic composition, containing0.711 weight-% (equal to 0.72 atom-%) U-235
„natural-equivalent“ uranium: term used in this paper for uranium with natural concentrationof U-235 obtained from *re-enrichment of *tails; the concentration of the minor isotope U-234is lower than in real *Unat; sometimes also called „pseudo-natural“ uranium.
NRC: U.S. Nuclear Regulatory Commission
product: enriched (or re-enriched) *UF6 produced in the *enrichment process
re-enrichment: use of *depleted uranium rather than *natural uranium as *feed for the*enrichment process; not to be mistaken for the recycling of uranium from spent fuel.
Rosatom: Russian Federal Atomic Energy Agency (previously Minatom)
secondary tails: *tails generated from *re-enrichment of tails
SWU: Separative Work Unit
t: metric tonne = 1000 kg
t U: metric tonne uranium contained in some compound
tails: byproduct from *enrichment of uranium: *depleted uranium in the form of *UF6; not tobe mistaken for uranium mill tailings - the waste arising from uranium extraction from ore
tails upgrading: equivalent to *re-enrichment
Udep: *depleted uranium
Uenr: *enriched uranium
Unat: *natural uranium
Uneq: *„natural-equivalent“ uranium
UF6: uranium hexafluoride (chemical form required for enrichment)1 t UF6 contains 0.676 t U, while 1 t U is contained in 1.479 t UF6
UO2: uranium dioxide (chemical form used in fuel for *LWRs)1 t UO2 contains 0.8815 t U, while 1 t U is contained in 1.134 t UO2
U3O8: triuranium octoxide (chemical from extracted from ore)1 t U3O8 contains 0.848 t U, while1 t U is contained in 1.179 t U3O81 lb U3O8 contains 0.385 kg U, while 1 kg U is contained in 2.6 lbs U3O8
USEC: U.S. Enrichment Corporation

- 46 -
References[ASTM] Standard Specification for Uranium Hexafluoride Enriched to Less Than 5 % 235U,ASTM, C 996http://www.astm.org/
[Bukharin 2004] Bukharin, Oleg: Russia’s Gaseous Centrifuge Technology and UraniumEnrichment Complex, Program on Science and Global Security, Woodrow Wilson School ofPublic and International Affairs, Princeton University, January 2004http://www.ransac.org/Documents/bukharinrussianenrichmentcomplexjan2004.pdf
[Elayat 1997] Elayat, H; Zoller, J; Szytel, L: Cost analysis report for the long term managementof depleted uranium hexafluoride, Lawrence Livermore National Laboratory,UCRL-AR-127650, 131 p., May 1997http://web.ead.anl.gov/uranium/documents/costs/
[ESA AR 1996 - 2003]: Euratom Supply Agency: Annual Reports 1996 - 2003http://europa.eu.int/comm/euratom/
[HSE 2004] Urenco (Capenhurst) Ltd’s strategy for decommissioning its nuclear licensed site,A review by HM Nuclear Installations Inspectorate, The Health and Safety Executive, Bootle,Merseyside, UK, November 2004http://www.hse.gov.uk/nsd/uclqqr.pdf
[NEA 2001] OECD Nuclear Agency / International Atomic Energy Agency: Management ofDepleted Uranium, Paris 2001http://www.nea.fr
[NEA 2004] OECD Nuclear Agency / International Atomic Energy Agency: Uranium 2003:Resources, Production and Demand, Paris 2004http://www.nea.fr
[UI 1999a] Uranium Imports to the USA from CIS Countries, UI Trade Briefing, Issue 1,August 1999http://www.world-nuclear.org/trade_issues/
[UI 1999b] The US-Russia HEU Agreement, UI Trade Briefing, Issue 1, August 1999http://www.world-nuclear.org/trade_issues/
[UI 2000] EU Policy on Imports of Uranium and Enrichment Services, UI Trade Briefing, Issue1, February 2000http://www.world-nuclear.org/trade_issues/
[UI 2001] Trade Aspects of the Re-enrichment of Uranium Tails, UI Trade Briefing Issue 1,January 2001http://www.world-nuclear.org/trade_issues/
[Urenco 2002] Urananreicherungsanlage Gronau. Kurzbeschreibung des Endausbaus und der

- 47 -
voraussichtlichen Auswirkungen auf die Umgebung. Stand: Dezember 2002, UrencoDeutschland
[Urenco AR 2000 - 2003] Urenco Ltd.: Annual Reports 2000 - 2003http://www.urenco.com
[USDOE 1999] Final Programmatic Environmental Impact Statement for Alternative Strategiesfor the Long-Term Management and Use of Depleted Uranium Hexafluoride, U.S. DOE,DOE/EIS-0269, 3 volumes, April 1999http://web.ead.anl.gov/uranium/documents/nepacomp/peis/
[USEC 2003] U.S. Enrichment Corporation: Application for Renewal of Certificate ofCompliance GDP-1, Enclosure 3, Decommissioning Funding Program Description, April 11,2003http://www.nrc.gov/reading-rm/adams.html
[USNRC 1983] U.S. Nuclear Regulatory Commission: Boeing Company Request ConcerningDepleted Uranium Counterweights, HPPOS-206http://www.nrc.gov/what-we-do/radiation/hppos/hppos206.html
[Wingender 1994] Wingender, H J; Becker, H J; Doran, J: Study on depleted uranium (tails)and on uranium residues from reprocessing with respect to quantities, characteristics, storage,possible disposal routes and radiation exposure. European Commission (Ed.), EUR 15032,ISBN 92-826-6478-3, Luxembourg 1994, 95 p.
[Zoller 1995] Zoller, J N; Rosen, R S; Holliday, M A: Depleted Uranium HexafluorideManagement Program. The technology assessment report for the long-term management ofdepleted uranium hexafluoride. U.S. DOE (Ed.), Washington, D.C. 1995, Volume 1: UCRL-AR-120372-VOL.1, 600 p., Volume 2: UCRL-AR-120372-VOL.2, 400 p.
[Zoller 1997] Zoller, J N; Dubrin, J W; Rahm-Crites, L; et al.: Engineering analysis report forthe long-term management of depleted uranium hexafluoride, Lawrence Livermore NationalLaboratory, 1997, Volume 1: UCRL-AR-124080-VOL-1-REV-2, 957 p., Volume 2: UCRL-AR-124080-VOL-2-REV-2, 1176 p.http://web.ead.anl.gov/uranium/documents/eng/
BT-Drs. = Bundestags-DrucksacheNF = Nuclear Fuel
Nov. 25, 2004 - Rev. 2
(c) Peter Diehl, WISE Uranium Project, 2004http://www.wise-uranium.org