RDG-ENSO-Final (1)
45
WILLIS RE CATASTROPHE MANAGEMENT SERVICES Return of the Damned Child: Uncertainty in ENSO Prediction, Climatic Impacts and Insurance Implications By: Alexander Pui
-
Upload
alexander-pui -
Category
Documents
-
view
198 -
download
2
Transcript of RDG-ENSO-Final (1)

WILLIS RE CATASTROPHE MANAGEMENT SERVICES
Return of the Damned Child:
Uncertainty in ENSO Prediction, Climatic Impacts and Insurance Implications
By: Alexander Pui

Outline
How predictable is ENSO?
What are its climatic impacts?
What are its economic and insurance implications?
How to develop an ‘ENSO-readiness’ plan?

3
HOW PREDICTABLE IS ENSO?

Section Outline
What is ENSO?
What are the key ‘Ingredients’ for an El Niño?
How do we know an El Niño has occurred?
What are the complexities of ENSO?
How accurate are ENSO predictions?
4

What is ENSO?
El Niño Southern Oscillation
A global climate phenomenon that describes changes in
both the ocean and atmosphere.
Has 3 states:
– El Niño
– Neutral
– La Niña
5

ENSO state (Neutral)
Schematic of ENSO during neutral state (neither El Niño or La Niña)
Source: BOM 2011
West (Warm)
East (Cool)
Walker Circulation
SSTA in Nino 3.4 region
Nino 3.4
SSTAs in Nino 3.4 region

Cool ENSO state (La Niña)
Schematic of ENSO during La Niña state : Note warmer SST and increased
convection in the West Pacific Ocean.
Source: BOM 2011
SSTA in Nino 3.4 region
West (Warmer)
East (Cooler)
Nino 3.4

Warm ENSO state (El Niño)
Schematic of ENSO during El Niño state :
Note warmer SST and increased convection in the West Pacific. Source: BOM 2011
SSTA in Nino 3.4 region
East (Warmer)
West (Cooler)
Nino 3.4

Key Ingredients for an El Niño
Westerly Wind Bursts
Spread of Sea Surface
Ocean Warmth
Spread of Sub Surface Ocean
Warmth Source: NOAA

Evolution of current El Niño
Note spread of Pacific Ocean warmth towards the West Coast of American Continent
Source: NOAA

Different ‘Flavors’ of El Niño
11
East Pacific/Classical El Niño
Hybrid El Nino
Source: NOAA
Central Pacific / Modoki (もどき) El Niño
2. Find Covariance Matrix of Y
1. Let Y = SSTA Field in Space & Time
3. Solve Eigen Equation for C
…AND HOW ARE THE PATTERNS & INDICES OF THESE ‘ FLAVORS’ DERIVED?
Where,
e1 =1st EOF / Classical Pattern
e2 =2nd EOF / Modoki Pattern
(~52%Variance Explained)
.
(~11%Variance Explained)
.

Has an El Niñodeveloped?
Is the monthly
Nino 3.4 SSTA
>= 0.50 C? NO
Not El Niño
Conditions
YES
Will SSTAs stay >= 0.50 C
for next few seasons?
Insufficiently
weak Walker
Circulation
YES
What does
atmosphere look
like?
El Niño
Conditions!
Indication of
weak Walker
Circulation
(i.e.
atmospheric
response!)
NO
Source: NOAA

13
IPO (inter-decadal
variations)
NOISE
Internal
Variations (i.e.
Modoki)
Annual Cycle
(i.e. Seasons)
ENSO
Adapted from: Axel Timmerman,2015
COMPLEXITIES OF ENSO

14
IPO (inter-decadal
variations) Annual Cycle
(i.e.Seasons)
NOISE
Internal
Variations (i.e.
Modoki)
ENSO
COMPLEXITIES OF ENSO
(ICE AGE)

15
IPO (inter-decadal
variations) Annual Cycle
(i.e. Monsoon)
NOISE
Internal
Variations (i.e.
Modoki)
ENSO
COMPLEXITIES OF ENSO
(GLOBAL WARMING)

16
COMPLEXITIES OF ENSO
(ORBITAL CYCLES)
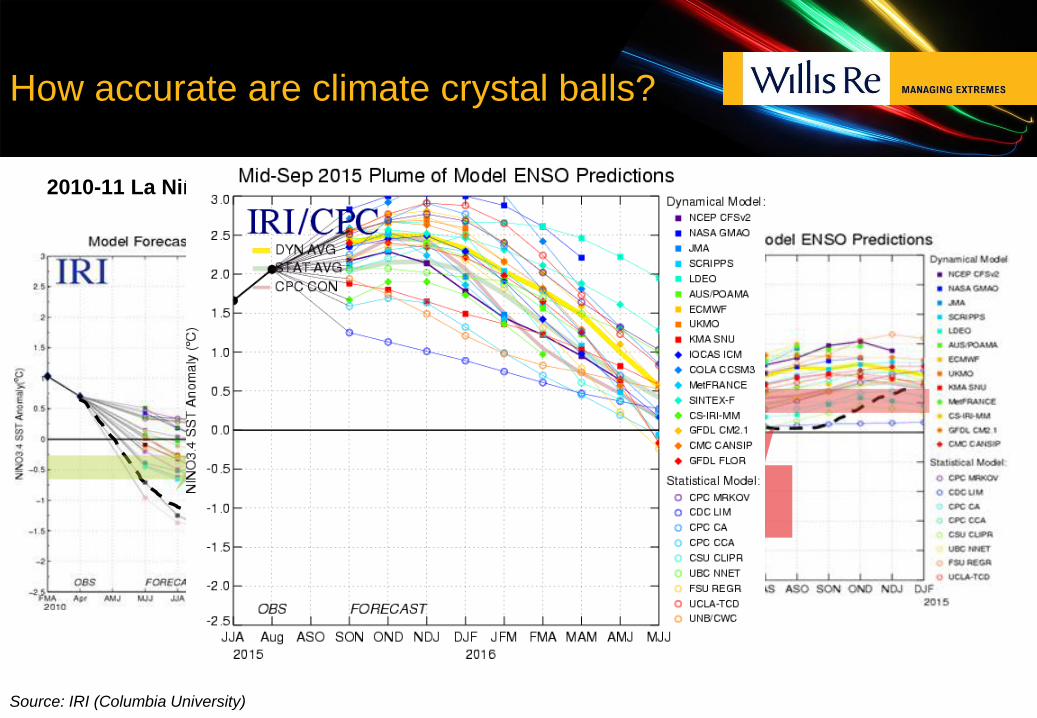
How accurate are climate crystal balls?
2010-11 La Niña
2014-15 El Niño
Model ‘Hit’?
Model ‘Miss’?
Source: IRI (Columbia University)

Who Killed the 2014 ‘Super’ Niño?
18
SSTA at Time of Prediction
Outcome
April 1997
April 2014
September 1997
September 2014
Adapted from: M.McPhaden,2015

Predictions not perfect, but still useful
19
Model View
Odds of La Niña following strong
El Niño?
Source: NOAA

20
REGIONAL CLIMATIC IMPACTS (ASIA PACIFIC)

Rainfall (El Niño)
21
Historical Rainfall Anomalies (Sep-Nov, 1901: 2013)
Less Rain
More Rain
Dry Conditions in
Indonesia and East
Australia
Dry
Conditions
in Northern
India
Source: KNMI
Rainfall Anomalies (Jul – Sep 2015)

Temperature (El Niño)
22
Seasonal Temperature Anomalies (Dec-Feb)
Warmer
Cooler
Warmer in Thailand ,
Malaysia and East
Australia
Warmer in
India
Source: KNMI

Forest Fires and Drought (El Niño)
23
2015 Indonesian Haze Event
24th Sep 2015 NASA
terra satellite image of
Peat Forest Burning
Source: NASA
Reduced Visibility
Levels rivalling that of
1997 record haze year

Bushfires in Australia (El Niño)
24
Canberra 2003 Fires co-occuring with the 2002-2003 El Nino Modoki.
Decreasing Trend
in Soil Moisture to
exacerbate
Bushfires?
Bushfire Risk heightened
during El Nino, +ve IOD (or
both co-occuring)
Source: Cai et al., Positive Indian Ocean Dipole events precondition South East Australia Bushfires, GRL, 2009

Typhoons (All Years)
25
Largest ACE since
1976
The Pacific is primed for a
very active Typhoon season.
(give e.g. of elapsed
Typhoons thus far)
6 tropical cyclones at once!
.
Source: Phil Klotzbach (Colorado State via RMS)

Cyclones (East Australia)
26
Source: KNMI
Feature
Frequency
Genesis Location
Track Bias
Intensity
Cyclone Lifespan
Unknown?
Lower
Unknown?
Coral Sea (SW Pacific) Cyclone Characteristics during El Nino
Response
Lower
North East Shift
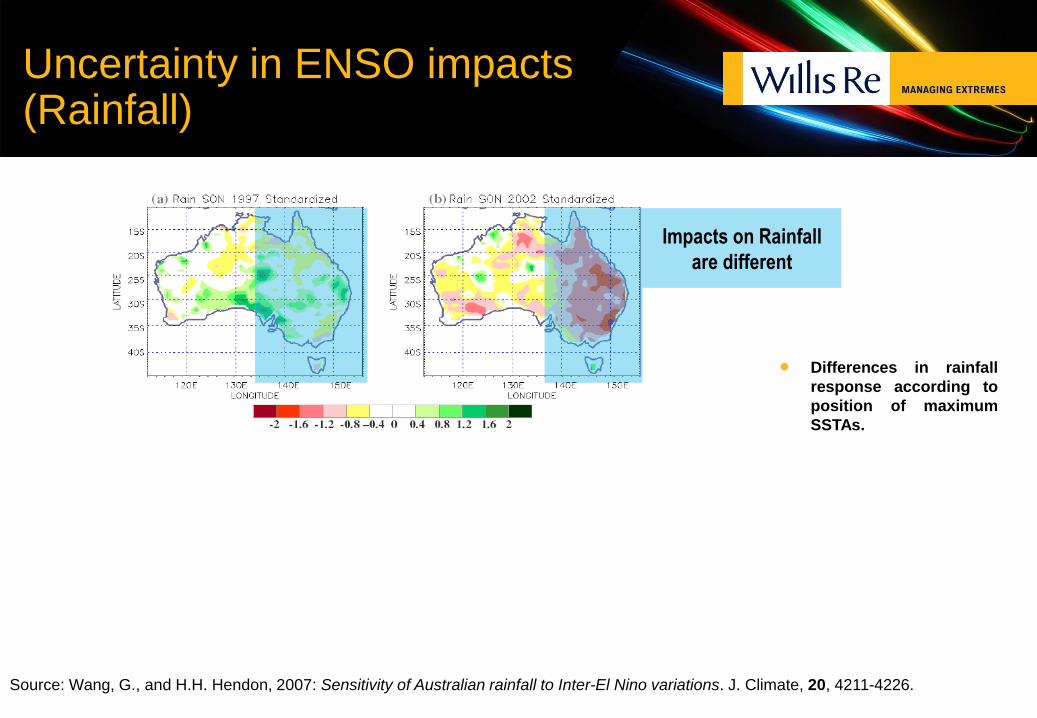
Source: Wang, G., and H.H. Hendon, 2007: Sensitivity of Australian rainfall to Inter-El Nino variations. J. Climate, 20, 4211-4226.
Impacts on Rainfall
are different
Max. SSTAs at
different locations
Differences in rainfall
response according to
position of maximum
SSTAs.
Uncertainty in ENSO impacts (Rainfall)

Source: Risbey et al. On the Remote Drivers of Rainfall Variability in Australia, Monthly Weather Review, 2009.
Max. SSTAs at
different locations
Uncertainty in ENSO impacts (Rainfall)
Strength of correlation between
rainfall and SOI index (proxy for
ENSO activity). Note differences in
extent and strength of correlations
at different periods of time.

Reinforcing Climate Drivers (Australia)
29
‘3 Headed Dog’ :
ENSO
IOD
SAM
Joint Impact of the ‘3
Headed Dog’ during 2011
Brisbane Floods:
ENSO (La Niña)
IOD (-ve phase)
SAM (-ve phase)
Source: Risbey et al. On the Remote Drivers of Rainfall Variability in Australia, Monthly Weather Review, 2009.

Climate Change Factor
Increased frequency of extreme
ENSO events?
Extreme = 101 Extreme = 212
Increased risk of coastal
flooding from storms/ cyclones
due to sea level rise?
Source: Cai et al. 2014,Increasing frequency of extreme El Nino events due to greenhouse warming, Nature
Pole-wards migration of
cyclones/hurricanes?

31
ECONOMIC IMPACTS &
RISK MANAGEMENT STRATEGIES

Section Outline
32
Is there evidence of ENSO signature in property, BI and
crop economic costs?
How to incorporate ENSO into risk management and RI
decisions?
Other Applications

Economic costs of ENSO (Property)
33
Event El Niño Neutral La Niña Total
Bushfire 2 1 1 4
Cyclone 3 1 6 10
Hail 4 2 4 10
Flood 0 0 4 4
Storm 3 2 2 7
Non-Bushfire 10 5 16 31
Total 12 6 17 35
Count of Seasonal Natural Catastrophe Events
Exceeding $500M AUD in 2015 Values - By ENSO Phase
Source: Prepared by Ned Scandrett, using ICA data (1967 – current)
Higher Losses in La Niña and
El Niño years compared to
Neutral.
Differences especially stark
after considering ‘residence’
time spent in each ENSO
phase.
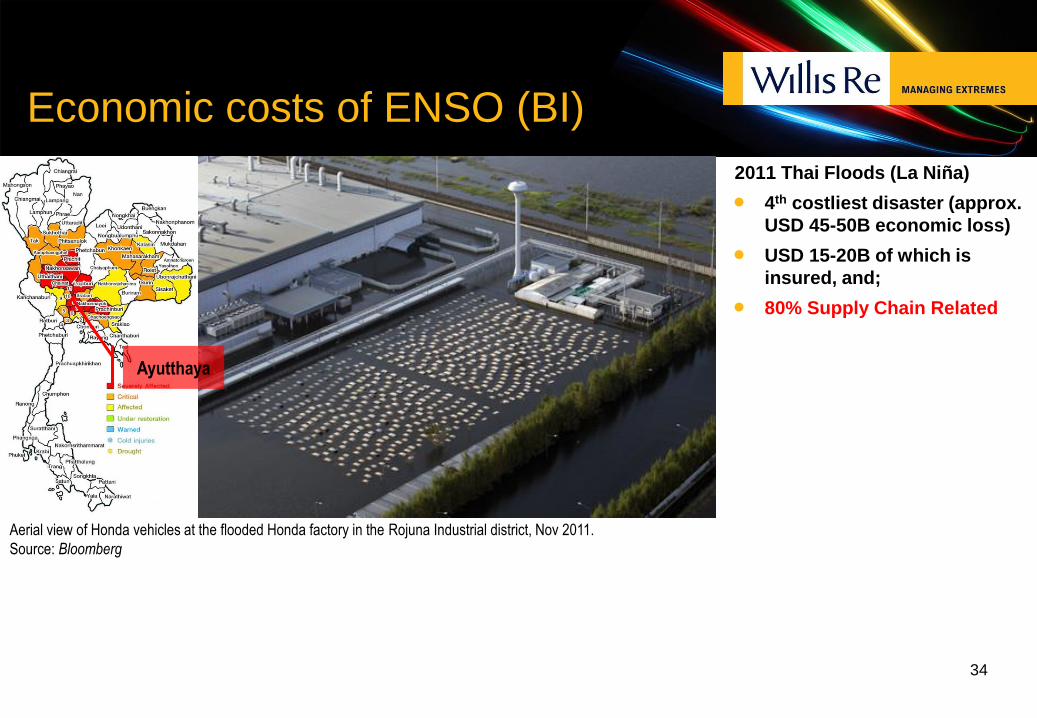
Economic costs of ENSO (BI)
2011 Thai Floods (La Niña)
4th costliest disaster (approx.
USD 45-50B economic loss)
USD 15-20B of which is
insured, and;
80% Supply Chain Related
34
Ayutthaya
Aerial view of Honda vehicles at the flooded Honda factory in the Rojuna Industrial district, Nov 2011.
Source: Bloomberg
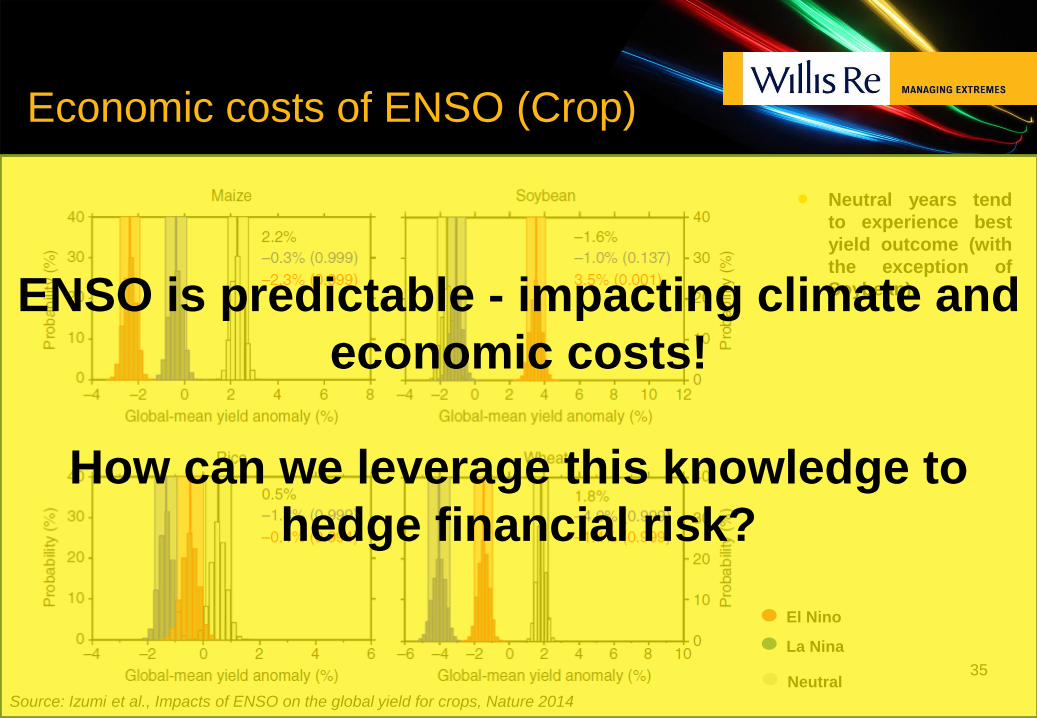
Neutral years tend
to experience best
yield outcome (with
the exception of
Soybean).
Economic costs of ENSO (Crop)
35
Source: Izumi et al., Impacts of ENSO on the global yield for crops, Nature 2014
El Nino
La Nina
Neutral
ENSO is predictable - impacting climate and
economic costs!
How can we leverage this knowledge to
hedge financial risk?

ENSO to support technical risk view
36
‘Best’ view of risk
• Exposure Analysis (e.g. RMS Cat Modelling)
• Experience Analysis
• Climate Variability
Technical Technical/Commercial
Risk Appetite
• How much risk to take?
• Shareholder expectations
Capital Requirements
• How much RI purchased?
• Regulatory Requirements
Commercial
RI Quotes
• Soft/Hard Market?
• Relationship with Reinsurers
ENSO INPUT

ENSO to support technical risk view
37
1 in 200 year event
(w/o ENSO
considerations)
1 in 100 year event
(with ENSO
considerations)
+50%

Example of Short Term RI Strategy
38
Hypothetical Property Biz
• Fixed Capital of $250m
• XOL reinsurance
• Constant P(ruin) = 0.1%
• Ruin if losses > 30% net worth
Idealized Hurricane scenarios
• Quiet vs Active Seasons
• 1000 realizations, each 100yrs
• Wind Damage only
Source: Emanuel et al. 2012: Potential Economic Value of Seasonal Hurricane Forecasts Weather, Climate and Society, Vol 4, 110 -117
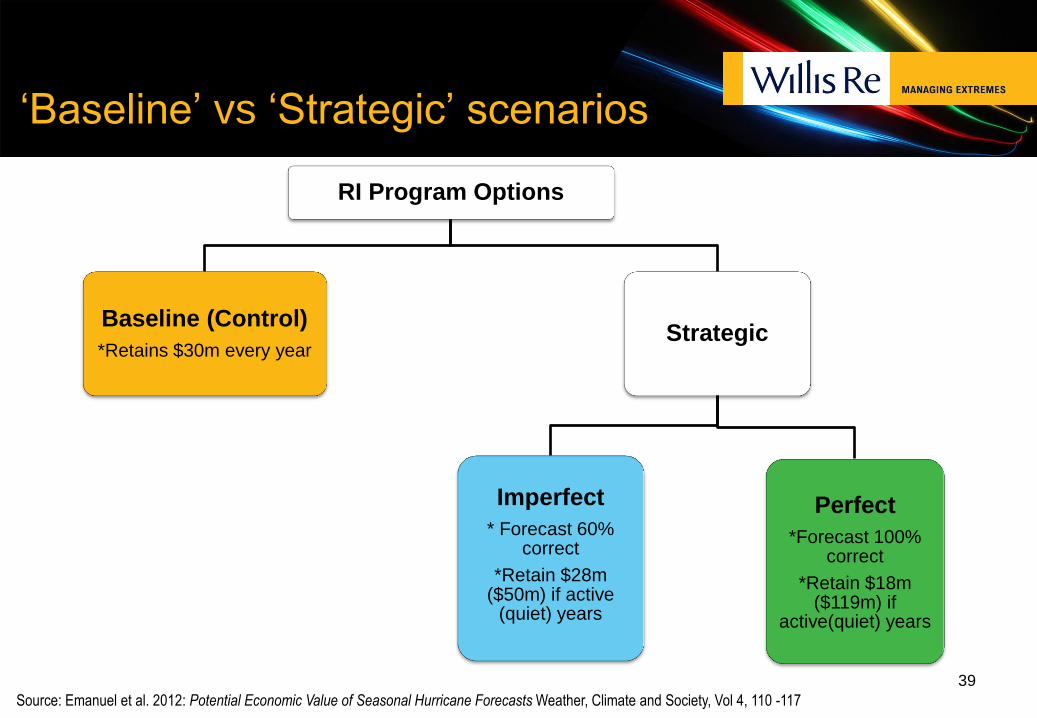
‘Baseline’ vs ‘Strategic’ scenarios
39
RI Program Options
Baseline (Control)
*Retains $30m every year Strategic
Perfect
*Forecast 100% correct
*Retain $18m ($119m) if
active(quiet) years
Imperfect
* Forecast 60% correct
*Retain $28m ($50m) if active
(quiet) years
Source: Emanuel et al. 2012: Potential Economic Value of Seasonal Hurricane Forecasts Weather, Climate and Society, Vol 4, 110 -117
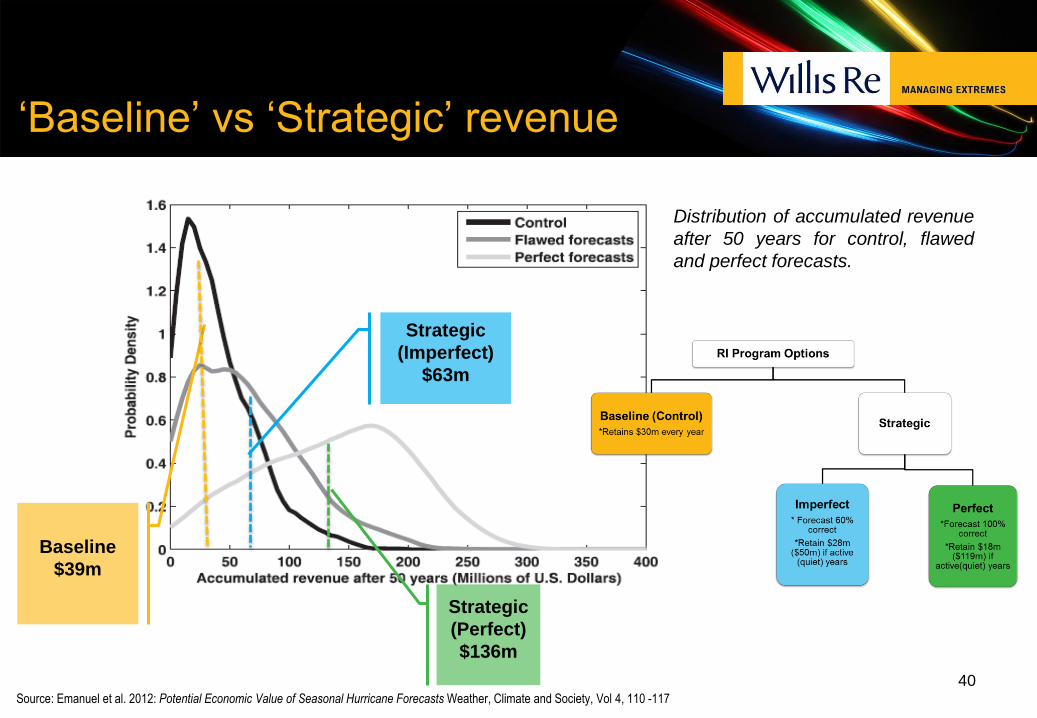
‘Baseline’ vs ‘Strategic’ revenue
40
Distribution of accumulated revenue
after 50 years for control, flawed
and perfect forecasts.
Baseline
$39m
Strategic
(Perfect)
$136m
Strategic
(Imperfect)
$63m
Source: Emanuel et al. 2012: Potential Economic Value of Seasonal Hurricane Forecasts Weather, Climate and Society, Vol 4, 110 -117

Reinsurance Treaty Inception Dates
41
Jan (Y2) Jan(Y1) Jan (Y3) Predictability
Barrier
Early
Year
Inception
Mid Year
Inception
Peak Bushfire/Flood Season
Window of
(arbitrage)
Opportunity?
Time window to consider:
Increase Limits?
Lower Retentions?
Additional Sideways
Protection?
Reinstatements?

Longer Term Strategies
Multi-year Reinsurance Contracts
Hedge against price hikes
42
State IPO + All IPO -P(Niño|Niño) 17% 10% 0%
P(Niña|Niño) 42% 33% 22%
P(Niño|Niña) 31% 29% 25%
P(Niña|Niña) 15% 25% 38%
How likely are back-to-back adverse ENSO events?
Source: Pui et al. 2015, Representing low frequency variability in continuous rainfall simulations, Journal of Hydrology (submitted)

Other Applications
Reduce volatility in earnings through Natural Perils
‘allowance’
Underwriting (Embargoes, pricing adjustments)
Claims Handling (Event Response Capability)
43

Conclusion
ENSO is predictable up to 9 months in advance*
ENSO has quantifiable impacts on climate and ensuing
economic costs.
Insurers should incorporate ENSO in risk management
decisions and when formulating business strategies.
44 * In a probabilistic sense

Subtitle 1
Subtitle 2
Subtitle 3
WHAT IS YOUR 2015-16 ENSO STRATEGY GOING TO BE?