RC-1572 - Pedestrian and Bicycle Crash Data Analysis: … report summarizes data for motor vehicle...
48
MICHIGAN DEPARTMENT OF TRANSPORTATION Pedestrian and Bicycle Crash Data Analysis: 2005 - 2010 FINAL REPORT Prepared by: T.Y. Lin International and Western Michigan University 4/3/2012
Transcript of RC-1572 - Pedestrian and Bicycle Crash Data Analysis: … report summarizes data for motor vehicle...
MICHIGAN DEPARTMENT OF TRANSPORTATION
Pedestrian and Bicycle Crash Data Analysis: 2005 - 2010 FINAL REPORT
Prepared by: T.Y. Lin International and Western Michigan University 4/3/2012
Michigan Department of Transportation Pedestrian and Bicycle Crash Data Analysis
ii
TABLE OF CONTENTS List of Figures ................................................................................................................................... iii
List of Tables .................................................................................................................................... iv
1.0 Introduction ......................................................................................................................... 1
1.1 Data Sources .................................................................................................................... 1
2.0 Key Findings ......................................................................................................................... 2
3.0 Overall Crashes .................................................................................................................... 3
4.0 Pedestrian Crash Statistics .................................................................................................. 5
4.1 Pedestrian Age ................................................................................................................. 5
4.2 Pedestrian Gender ........................................................................................................... 8
4.3 Pedestrian Crash Location ............................................................................................... 9
4.4 Roadway Type ............................................................................................................... 11
4.5 Pedestrian Crashes by Speed Limit................................................................................ 13
4.6 Time and Day ................................................................................................................. 15
4.7 Conditions ...................................................................................................................... 17
4.7.1 Lighting Conditions ................................................................................................ 17
4.7.2 Roadway Conditions .............................................................................................. 18
4.8 Driver and Pedestrian Actions ....................................................................................... 19
4.9 Alcohol Involvement ...................................................................................................... 23
4.10 Hit and Runs .................................................................................................................. 24
5.0 Bicycle Crash Statistics....................................................................................................... 25
5.1 Bicyclist Age ................................................................................................................... 25
5.2 Bicyclist Gender ............................................................................................................. 28
5.3 Crash Location ............................................................................................................... 29
5.4 Bicycle Crashes by Speed Limit ...................................................................................... 34
5.5 Time and Day ................................................................................................................. 36
5.6 Conditions ...................................................................................................................... 38
5.6.1 Lighting Conditions ................................................................................................ 38
5.6.2 Roadway Conditions .............................................................................................. 39
5.7 Driver and Bicyclist Actions ........................................................................................... 40
5.8 Alcohol Involvement ...................................................................................................... 44
Michigan Department of Transportation Pedestrian and Bicycle Crash Data Analysis
iii
5.9 Hit and Runs .................................................................................................................. 44
LIST OF FIGURES Figure 1: Michigan Crash Trends ..................................................................................................... 3 Figure 2: Pedestrian Crashes Resulting in Injury by Age Group ...................................................... 5 Figure 3: Michigan Population and Pedestrian Crashes by Age ...................................................... 6 Figure 4: Michigan Pedestrian Crash Incidence and Injury Severity by Age Group ........................ 7 Figure 5: Michigan Fatal and Serious Injury Pedestrian Crashes by Gender ................................... 8 Figure 7: Michigan and National Crashes by Location .................................................................... 9 Figure 6: Michigan Fatal and Serious Injury Pedestrian Crashes by Location ................................. 9 Figure 8: Michigan Pedestrian Crashes by Crash Location ............................................................ 10 Figure 9: Michigan Pedestrian Crashes and Injury Severity by Number of Travel Lanes .............. 12 Figure 10: Speed Limits at Pedestrian Crashes by Injury Severity ................................................. 13 Figure 11: Michigan Pedestrian Crashes and Injury Severity by Speed Limit ............................... 14 Figure 12: Michigan Fatal and Serious Injury Pedestrian Crashes by Day of Week ...................... 15 Figure 13: Michigan Fatal and Serious Injury Pedestrian Crashes by Lighting Condition ............. 17 Figure 14: Michigan Fatal and Serious Injury Pedestrian Crashes by Road Condition .................. 18 Figure 15: Michigan Fatal and Serious Injury Crashes by Driver Action at Intersections .............. 19 Figure 16: Michigan Fatal and Serious injury Pedestrian Crashes by Driver Action at Non-Intersections .................................................................................................................................. 20 Figure 17: Michigan Pedestrian Crashes by Driver Action and Traffic Control ............................. 21 Figure 18: Michigan Pedestrian Crashes by Pedestrian Action ..................................................... 22 Figure 19: Michigan and National Alcohol Involvement in Fatal Pedestrian crashes ................... 23 Figure 20: Hit and Run Pedestrian and Bicycle Crashes in Michigan ............................................ 24 Figure 21: Michigan Bicycle Crashes by Age Group ...................................................................... 25 Figure 22: Michigan Bicycle Crashes by Injury Severity and Population ....................................... 26 Figure 23: Michigan Bicycle Incidence and Injury Severity by Age Group .................................... 27 Figure 24: Michigan Fatal and Serious Injury Bicycle Crashes by Gender ..................................... 28 Figure 26: Michigan and National Bicycle Crashes By Intersection vs. Non-intersection and Injury Severity .......................................................................................................................................... 29 Figure 25: Michigan Fatal and Serious Injury Bicycle Crashes by Location ................................... 29 Figure 27: Michigan Fatal and Serious Injury Bicycle Crashes by Traffic Control .......................... 30 Figure 28: Michigan Fatal and Serious Injury Bicycle Crashes by Crash Location ......................... 31 Figure 29: Michigan Bicycle Crashes and Injury Severity by Number of Lanes ............................. 33 Figure 30: Michigan Bicycle Crashes by Speed Limit ..................................................................... 34 Figure 31: Michigan Bicycle Crashes and Injury Severity by Speed LImit...................................... 35 Figure 32: Michigan Fatal and Serious Injury Bicycle Crashes by Day ........................................... 37 Figure 33: Michigan Fatal and Serious Injury Bicycle Crashes by Lighting Condition ................... 38 Figure 34: Michigan Fatal and Serious Injury Bicycle Crashes by Roadway Condition ................. 39 Figure 35: Michigan Fatal and Serious Injury Bicycle Crashes by Driver Action ............................ 40

Michigan Department of Transportation Pedestrian and Bicycle Crash Data Analysis
iv
Figure 36: Michigan Fatal and Serious Injury Bicycle Crashes by Driver Action at Non-intersections .................................................................................................................................. 41 Figure 37: Michigan Fatal and Serious Injury Bicycle Crashes by Driver Action and Traffic Control ....................................................................................................................................................... 42 Figure 38: Bicycle Crashes by Bicyclist Action ............................................................................... 43 Figure 39: Michigan Fatal Bicycle Crashes Involving Alcohol ........................................................ 44 Figure 40: Michigan Bicycle Crashes Involving Hit-and-Run Drivers ............................................. 44
LIST OF TABLES Table 1: Average Yearly Crash Victims ............................................................................................ 4 Table 2: Michigan Fatal and Serious Injury Pedestrian Crashes by Number of Lanes .................. 11 Table 3: Michigan Fatal and Serious Injury Pedestrian Crashes by Time Period ........................... 16 Table 4: Michigan Fatal and Serious Injury Crashes by Number of Travel Lanes .......................... 32 Table 5: Michigan Fatal and Serious Injury Bicycle Crashes by Time of Day ................................. 36

Michigan Department of Transportation Pedestrian and Bicycle Crash Data Analysis
1
1.0 INTRODUCTION The safety of pedestrians and bicyclists using the roadway is an increasing concern for the Michigan Department of Transportation (MDOT). This report summarizes data for motor vehicle crashes involving pedestrians and bicyclists in Michigan from 2005 through 2010. The results are compared to national statistics obtained from the National Highway Traffic Safety Administration (NHTSA) for the years 2005 through 2009. The purpose of this effort is to understand what is causing pedestrian and bicycle crashes in Michigan and determine if there are crash trends unique to the State. The analysis will form the basis for recommendations and alternatives to improve pedestrian and bicycle safety in Michigan.
Between 2005 and 2010, 775 pedestrians and 147 bicyclists were killed in traffic crashes in the State of Michigan, accounting for approximately 15.1% of the total traffic related fatalities. Additionally, 6,948 pedestrians and 5,500 bicyclists were injured as a result of traffic crashes.
In 2009, the pedestrian fatality rate in Michigan was 1.18 per 100,000 people and the national average was 1.33. The bicycle fatality rate in Michigan was at 1.90 per 100,000 and the national average was 2.05. Although Michigan reported fatality rates lower than the national average, Michigan ranks 23rd in pedestrian traffic fatalities and 19th in bicycle fatalities. Michigan has higher pedestrian and bicycle fatality rates than the states of Ohio, Indiana, Illinois and Pennsylvania. Lacking good exposure data, it is difficult to accurately rate the risk for pedestrians or bicyclists in each state. However, it is important to understand the crash trends and identify potential causes of the crashes.
1.1 DATA SOURCES
Michigan crash data was obtained from the Michigan Traffic Crash Facts website, using the Data Query Tool. Data associated with pedestrian and bicycle crashes for the years 2005 through 2010 were downloaded to get an understanding of who is involved in crashes, what is causing the crashes, and when and where they occurred. Thus, the age groups and gender of crash victims, location of crashes, type of signal control, and other details were examined. The results are presented in this report in the form of charts and graphs.
Where possible, the Michigan statistics were compared to national statistics. National data was extracted from Traffic Safety Facts, NHTSA’s annual report on traffic crashes, which include statistics about crashes resulting in fatalities and injuries. The annual report for 2010 was not available at the time of this writing; therefore national statistics were compiled for the years 2005 through 2009.
Section 2.0 of this report presents the key findings from the analyses and suggests possible countermeasures and further study. Section 3.0 includes an overview of pedestrian and bicycle crashes in Michigan between 2005 and 2010. Sections 4.0 and 5.0 provide detail on the pedestrian and bicycle crashes, respectively.
Michigan Department of Transportation Pedestrian and Bicycle Crash Data Analysis
2
2.0 KEY FINDINGS The following presents the key findings from the comprehensive crash analysis. Subsequent sections of this report provide detail on these findings.
• Pedestrians account for 0.4% of all traffic crashes in Michigan. However, they account for 12.7% of traffic fatalities. Older pedestrians are more likely to be severely injured than younger pedestrians. Over the age of 35, both pedestrian and bicycle crashes are more likely to result in a fatality or serious injury than minor injuries.
• The age group 5 to 24 is involved in the most pedestrian and bicycle crashes in Michigan. They are over-represented in comparison to the percent of the population they make up. They also are over-represented in comparison to the national proportion of pedestrian and bicycle crashes for this age group. However, youth crashes are less likely to result in serious injury or fatality than other age groups.
• More pedestrian crashes occur at non-intersections than at intersections. At the same time, a smaller proportion of these crashes resulted from pedestrians walking or standing in the roadway. Intersections that are far apart may influence pedestrians to cross at non-intersection locations.
• While 22% of total pedestrian crashes occur on roads with posted speed limits of 45 mph or higher, 53% of fatal pedestrian crashes occur on these roads. Likewise, while 18.2% of all bicycle crashes occur on these roads, 63% of fatal bicycle crashes occur on roads with posted speeds of 45 mph or higher.
• 20.3% of fatal bicycle crashes occur on roadways with posted speeds between 25 and 30 mph. However, only 2.3% of fatal pedestrian crashes occur on these roadways. This suggests that speed is less a factor for bicycle crashes than it is for pedestrian crashes.
• Pedestrian crashes occur more often in the late evening and early morning hours (between 9 pm and 3 am) in Michigan than nationally. In Michigan, more pedestrian crashes occur in dark conditions than in daylight.
• Bicyclists are most often struck between 3 pm and 6 pm in Michigan.
Michigan Department of Transportation Pedestrian and Bicycle Crash Data Analysis
3
0
500
1,000
1,500
2,000
2,500
3,000
0
50,000
100,000
150,000
200,000
250,000
300,000
350,000
400,000
2005 2006 2007 2008 2009 2010
All Motor Vehicle Crashes
Pedestrian Crashes
Bicyclist Crashes
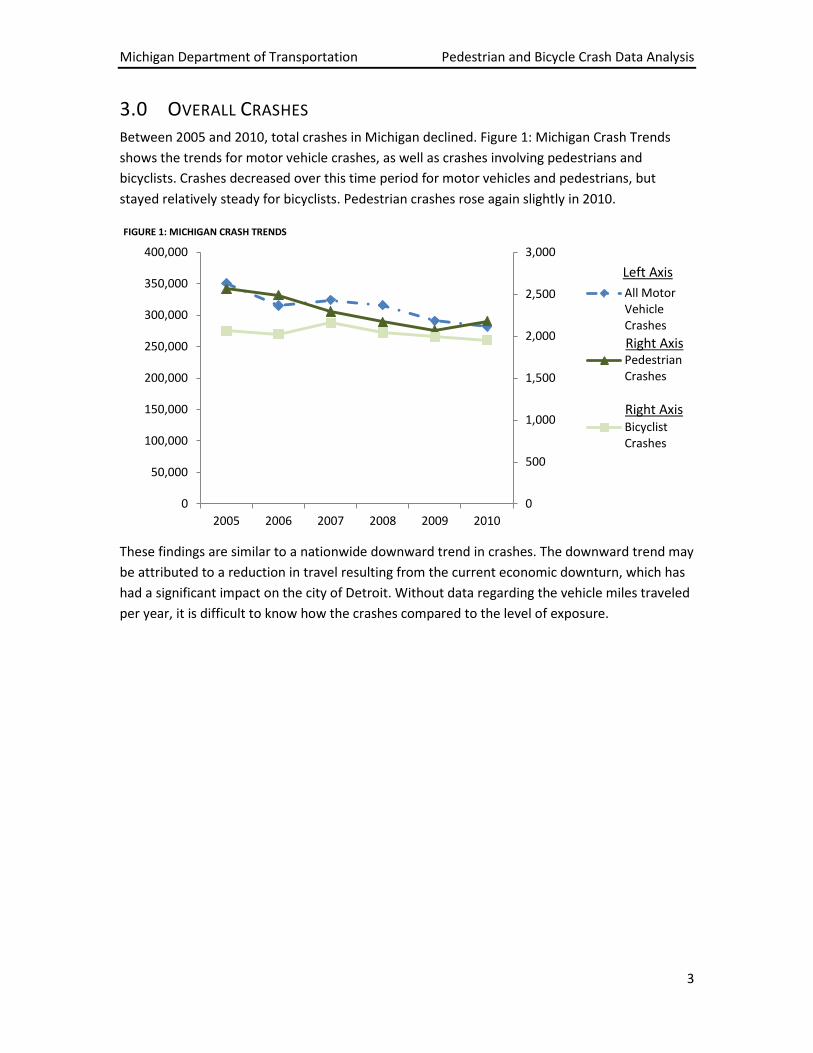
3.0 OVERALL CRASHES Between 2005 and 2010, total crashes in Michigan declined. Figure 1: Michigan Crash Trends shows the trends for motor vehicle crashes, as well as crashes involving pedestrians and bicyclists. Crashes decreased over this time period for motor vehicles and pedestrians, but stayed relatively steady for bicyclists. Pedestrian crashes rose again slightly in 2010.
These findings are similar to a nationwide downward trend in crashes. The downward trend may be attributed to a reduction in travel resulting from the current economic downturn, which has had a significant impact on the city of Detroit. Without data regarding the vehicle miles traveled per year, it is difficult to know how the crashes compared to the level of exposure.
FIGURE 1: MICHIGAN CRASH TRENDS
Left Axis
Right Axis
Right Axis
Michigan Department of Transportation Pedestrian and Bicycle Crash Data Analysis
4
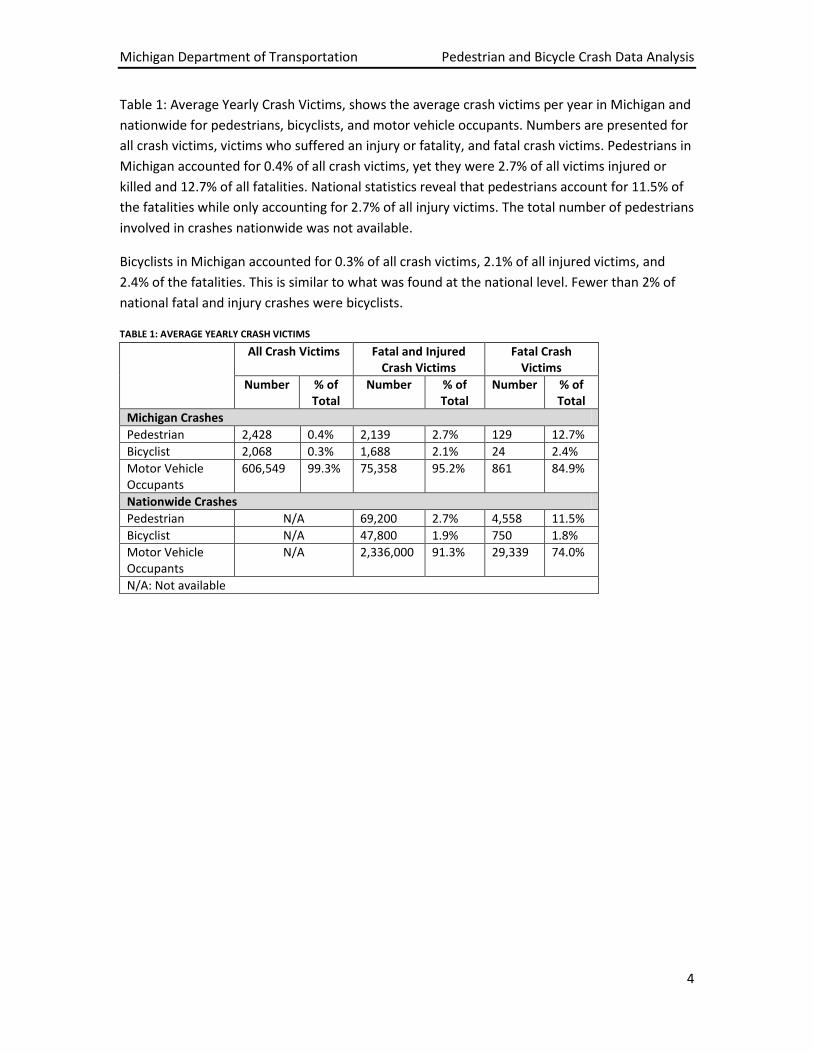
Table 1: Average Yearly Crash Victims, shows the average crash victims per year in Michigan and nationwide for pedestrians, bicyclists, and motor vehicle occupants. Numbers are presented for all crash victims, victims who suffered an injury or fatality, and fatal crash victims. Pedestrians in Michigan accounted for 0.4% of all crash victims, yet they were 2.7% of all victims injured or killed and 12.7% of all fatalities. National statistics reveal that pedestrians account for 11.5% of the fatalities while only accounting for 2.7% of all injury victims. The total number of pedestrians involved in crashes nationwide was not available.
Bicyclists in Michigan accounted for 0.3% of all crash victims, 2.1% of all injured victims, and 2.4% of the fatalities. This is similar to what was found at the national level. Fewer than 2% of national fatal and injury crashes were bicyclists.
TABLE 1: AVERAGE YEARLY CRASH VICTIMS
All Crash Victims Fatal and Injured Crash Victims
Fatal Crash Victims
Number % of Total
Number % of Total
Number % of Total
Michigan Crashes Pedestrian 2,428 0.4% 2,139 2.7% 129 12.7% Bicyclist 2,068 0.3% 1,688 2.1% 24 2.4% Motor Vehicle Occupants
606,549 99.3% 75,358 95.2% 861 84.9%
Nationwide Crashes Pedestrian N/A 69,200 2.7% 4,558 11.5% Bicyclist N/A 47,800 1.9% 750 1.8% Motor Vehicle Occupants
N/A 2,336,000 91.3% 29,339 74.0%
N/A: Not available
Michigan Department of Transportation Pedestrian and Bicycle Crash Data Analysis
5
4.0 PEDESTRIAN CRASH STATISTICS In the following analyses, fatal crashes and fatal and incapacitating (serious) injury crashes are analyzed. In some cases, fatal and injury crashes are summarized to facilitate comparison to national statistics. The data excludes non-injury and unknown injury type crashes.
4.1 PEDESTRIAN AGE
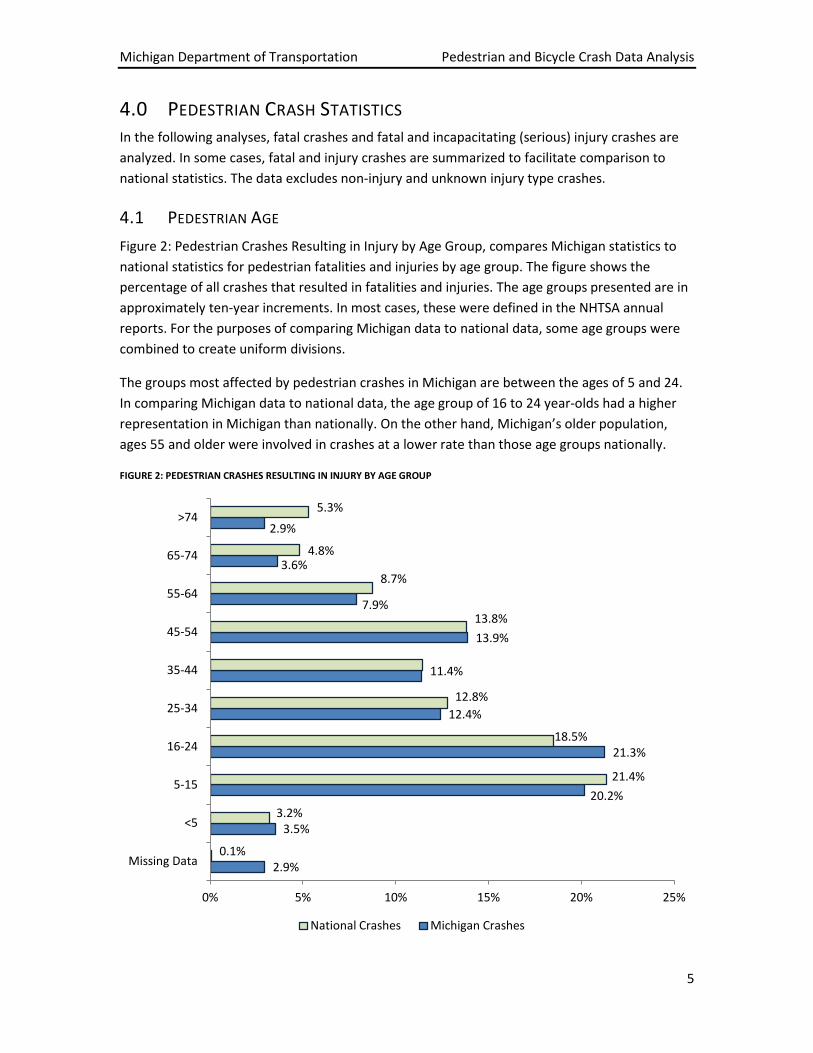
Figure 2: Pedestrian Crashes Resulting in Injury by Age Group, compares Michigan statistics to national statistics for pedestrian fatalities and injuries by age group. The figure shows the percentage of all crashes that resulted in fatalities and injuries. The age groups presented are in approximately ten-year increments. In most cases, these were defined in the NHTSA annual reports. For the purposes of comparing Michigan data to national data, some age groups were combined to create uniform divisions.
The groups most affected by pedestrian crashes in Michigan are between the ages of 5 and 24. In comparing Michigan data to national data, the age group of 16 to 24 year-olds had a higher representation in Michigan than nationally. On the other hand, Michigan’s older population, ages 55 and older were involved in crashes at a lower rate than those age groups nationally.
FIGURE 2: PEDESTRIAN CRASHES RESULTING IN INJURY BY AGE GROUP
2.9%
3.5%
20.2%
21.3%
12.4%
11.4%
13.9%
7.9%
3.6%
2.9%
0.1%
3.2%
21.4%
18.5%
12.8%
13.8%
8.7%
4.8%
5.3%
0% 5% 10% 15% 20% 25%
Missing Data
<5
5-15
16-24
25-34
35-44
45-54
55-64
65-74
>74
National Crashes Michigan Crashes
Michigan Department of Transportation Pedestrian and Bicycle Crash Data Analysis
6
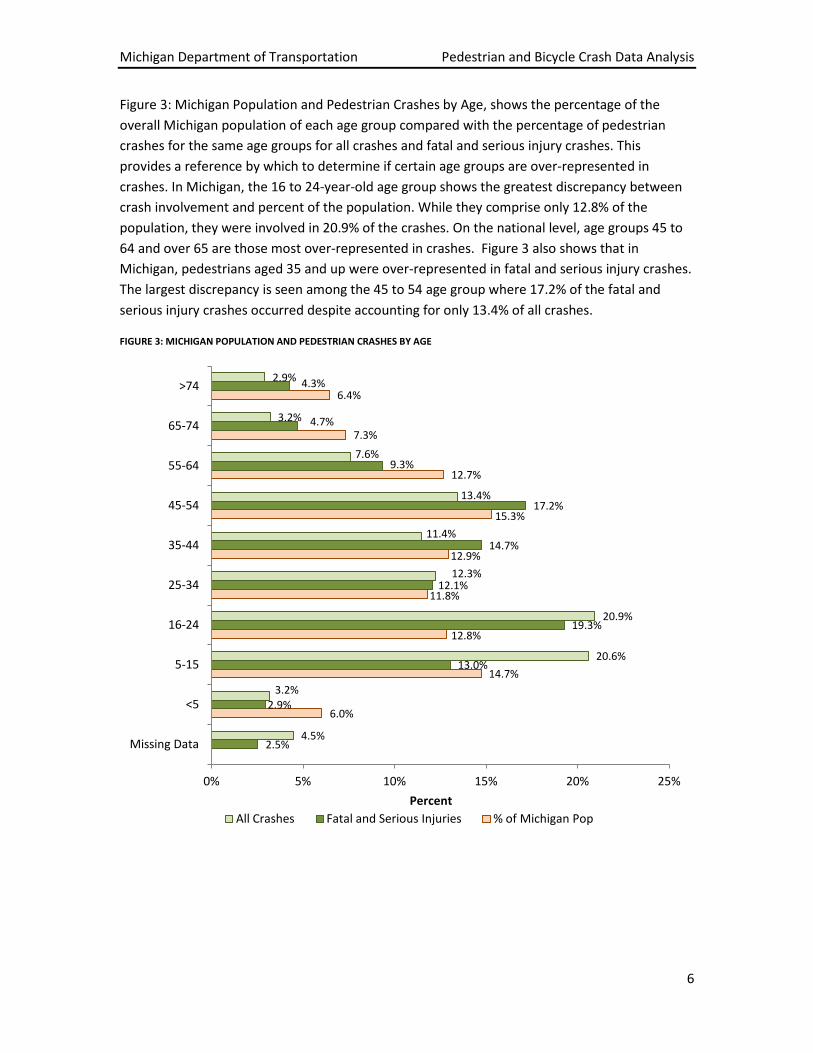
Figure 3: Michigan Population and Pedestrian Crashes by Age, shows the percentage of the overall Michigan population of each age group compared with the percentage of pedestrian crashes for the same age groups for all crashes and fatal and serious injury crashes. This provides a reference by which to determine if certain age groups are over-represented in crashes. In Michigan, the 16 to 24-year-old age group shows the greatest discrepancy between crash involvement and percent of the population. While they comprise only 12.8% of the population, they were involved in 20.9% of the crashes. On the national level, age groups 45 to 64 and over 65 are those most over-represented in crashes. Figure 3 also shows that in Michigan, pedestrians aged 35 and up were over-represented in fatal and serious injury crashes. The largest discrepancy is seen among the 45 to 54 age group where 17.2% of the fatal and serious injury crashes occurred despite accounting for only 13.4% of all crashes.
FIGURE 3: MICHIGAN POPULATION AND PEDESTRIAN CRASHES BY AGE
6.0%
14.7%
12.8%
11.8%
12.9%
15.3%
12.7%
7.3%
6.4%
2.5%
2.9%
13.0%
19.3%
12.1%
14.7%
17.2%
9.3%
4.7%
4.3%
4.5%
3.2%
20.6%
20.9%
12.3%
11.4%
13.4%
7.6%
3.2%
2.9%
0% 5% 10% 15% 20% 25%
Missing Data
<5
5-15
16-24
25-34
35-44
45-54
55-64
65-74
>74
Percent All Crashes Fatal and Serious Injuries % of Michigan Pop

Michigan Department of Transportation Pedestrian and Bicycle Crash Data Analysis
7
Figure 4: Michigan Pedestrian Crash Incidence and Injury Severity by Age Group, provides a comparison of the number and severity of injury of crashes by age group. This graph shows that the age group 16 to 24 was involved in the most crashes, followed by the 5 to 15 age group and the 45 to 54 age group. The 45 to 54 age group also shows a significant number of fatalities. When examining the type of injury by age group, it was found that higher age groups are more likely to sustain a severe injury or fatality in a crash. For example, for pedestrians over 74 years of age, 14.9% of crashes resulted in a fatality. Overall, 5.3% of crashes resulted in a fatality. This shows again that older pedestrians are more vulnerable to fatality and serious injury when involved in crashes.
FIGURE 4: MICHIGAN PEDESTRIAN CRASH INCIDENCE AND INJURY SEVERITY BY AGE GROUP
0
500
1000
1500
2000
2500
3000
Fatality
Serious Injury
Non-serious Injury
No or Unknown Injury
Michigan Department of Transportation Pedestrian and Bicycle Crash Data Analysis
8
4.2 PEDESTRIAN GENDER
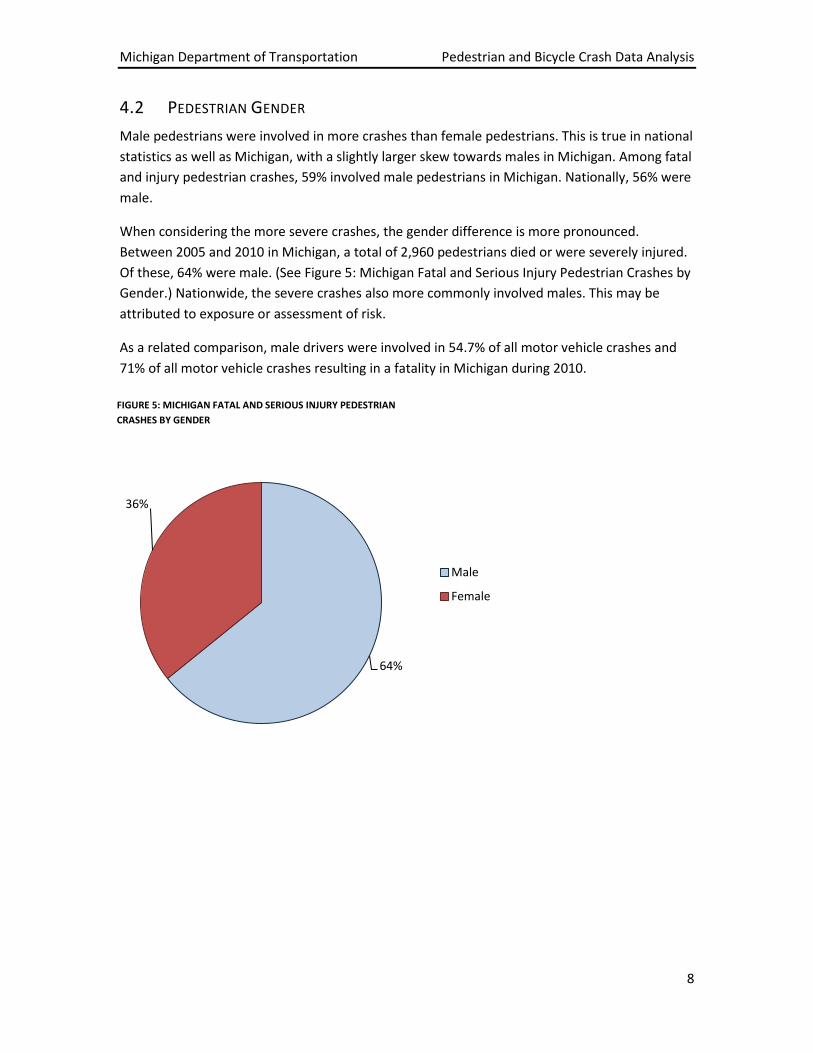
Male pedestrians were involved in more crashes than female pedestrians. This is true in national statistics as well as Michigan, with a slightly larger skew towards males in Michigan. Among fatal and injury pedestrian crashes, 59% involved male pedestrians in Michigan. Nationally, 56% were male.
When considering the more severe crashes, the gender difference is more pronounced. Between 2005 and 2010 in Michigan, a total of 2,960 pedestrians died or were severely injured. Of these, 64% were male. (See Figure 5: Michigan Fatal and Serious Injury Pedestrian Crashes by Gender.) Nationwide, the severe crashes also more commonly involved males. This may be attributed to exposure or assessment of risk.
As a related comparison, male drivers were involved in 54.7% of all motor vehicle crashes and 71% of all motor vehicle crashes resulting in a fatality in Michigan during 2010.
64%
36%
Male
Female
FIGURE 5: MICHIGAN FATAL AND SERIOUS INJURY PEDESTRIAN CRASHES BY GENDER
Michigan Department of Transportation Pedestrian and Bicycle Crash Data Analysis
9
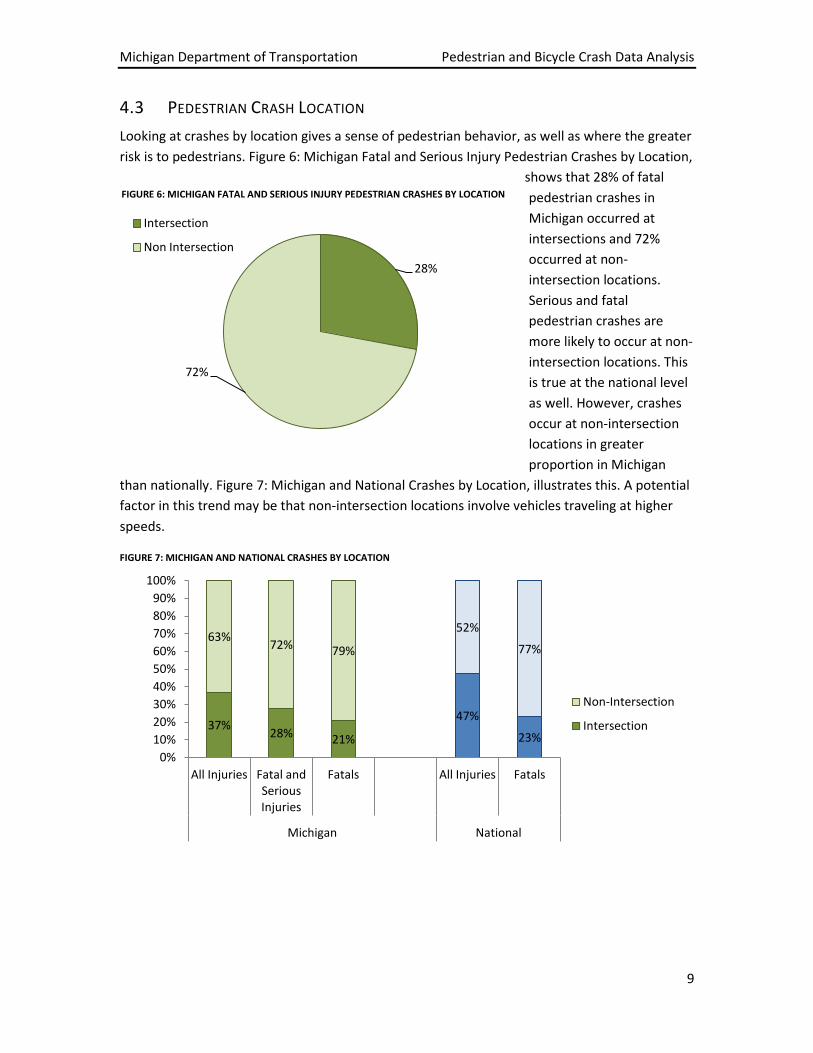
4.3 PEDESTRIAN CRASH LOCATION
Looking at crashes by location gives a sense of pedestrian behavior, as well as where the greater risk is to pedestrians. Figure 6: Michigan Fatal and Serious Injury Pedestrian Crashes by Location,
shows that 28% of fatal pedestrian crashes in Michigan occurred at intersections and 72% occurred at non-intersection locations. Serious and fatal pedestrian crashes are more likely to occur at non-intersection locations. This is true at the national level as well. However, crashes occur at non-intersection locations in greater proportion in Michigan
than nationally. Figure 7: Michigan and National Crashes by Location, illustrates this. A potential factor in this trend may be that non-intersection locations involve vehicles traveling at higher speeds.
FIGURE 7: MICHIGAN AND NATIONAL CRASHES BY LOCATION
37% 28% 21%
47%
23%
63% 72% 79%
52%
77%
0% 10% 20% 30% 40% 50% 60% 70% 80% 90%
100%
All Injuries Fatal and Serious Injuries
Fatals All Injuries Fatals
Michigan National
Non-Intersection
Intersection
28%
72%
Intersection
Non Intersection
FIGURE 6: MICHIGAN FATAL AND SERIOUS INJURY PEDESTRIAN CRASHES BY LOCATION

Michigan Department of Transportation Pedestrian and Bicycle Crash Data Analysis
10
Figure 8: Michigan Pedestrian Crashes by Crash Location, shows where pedestrian crashes occurred with respect to the roadway for both intersection and non-intersection locations. This figure shows that most crashes occurred on the road, with few occurring on the shoulder or outside of the shoulder/curb line. Those that did occur on the shoulder or outside of the shoulder were more likely to be non-intersection crashes.
FIGURE 8: MICHIGAN PEDESTRIAN CRASHES BY CRASH LOCATION
92.0%
0.8%
1.3%
5.3%
82.0%
5.9%
3.2%
8.5%
0% 20% 40% 60% 80% 100%
On the road
On the shoulder
Outside of shoulder/curbline
Other/Unknown % Non-Intersection
% Intersection
Michigan Department of Transportation Pedestrian and Bicycle Crash Data Analysis
11
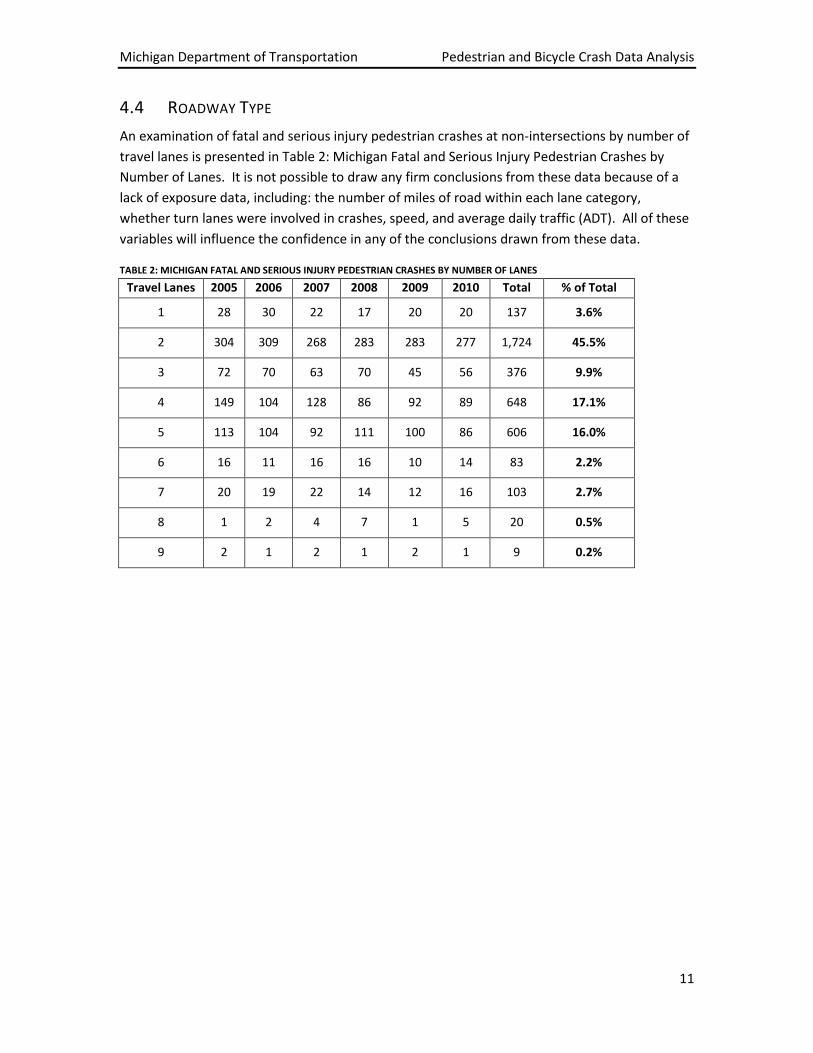
4.4 ROADWAY TYPE
An examination of fatal and serious injury pedestrian crashes at non-intersections by number of travel lanes is presented in Table 2: Michigan Fatal and Serious Injury Pedestrian Crashes by Number of Lanes. It is not possible to draw any firm conclusions from these data because of a lack of exposure data, including: the number of miles of road within each lane category, whether turn lanes were involved in crashes, speed, and average daily traffic (ADT). All of these variables will influence the confidence in any of the conclusions drawn from these data.
TABLE 2: MICHIGAN FATAL AND SERIOUS INJURY PEDESTRIAN CRASHES BY NUMBER OF LANES
Travel Lanes 2005 2006 2007 2008 2009 2010 Total % of Total
1 28 30 22 17 20 20 137 3.6%
2 304 309 268 283 283 277 1,724 45.5%
3 72 70 63 70 45 56 376 9.9%
4 149 104 128 86 92 89 648 17.1%
5 113 104 92 111 100 86 606 16.0%
6 16 11 16 16 10 14 83 2.2%
7 20 19 22 14 12 16 103 2.7%
8 1 2 4 7 1 5 20 0.5%
9 2 1 2 1 2 1 9 0.2%
Michigan Department of Transportation Pedestrian and Bicycle Crash Data Analysis
12
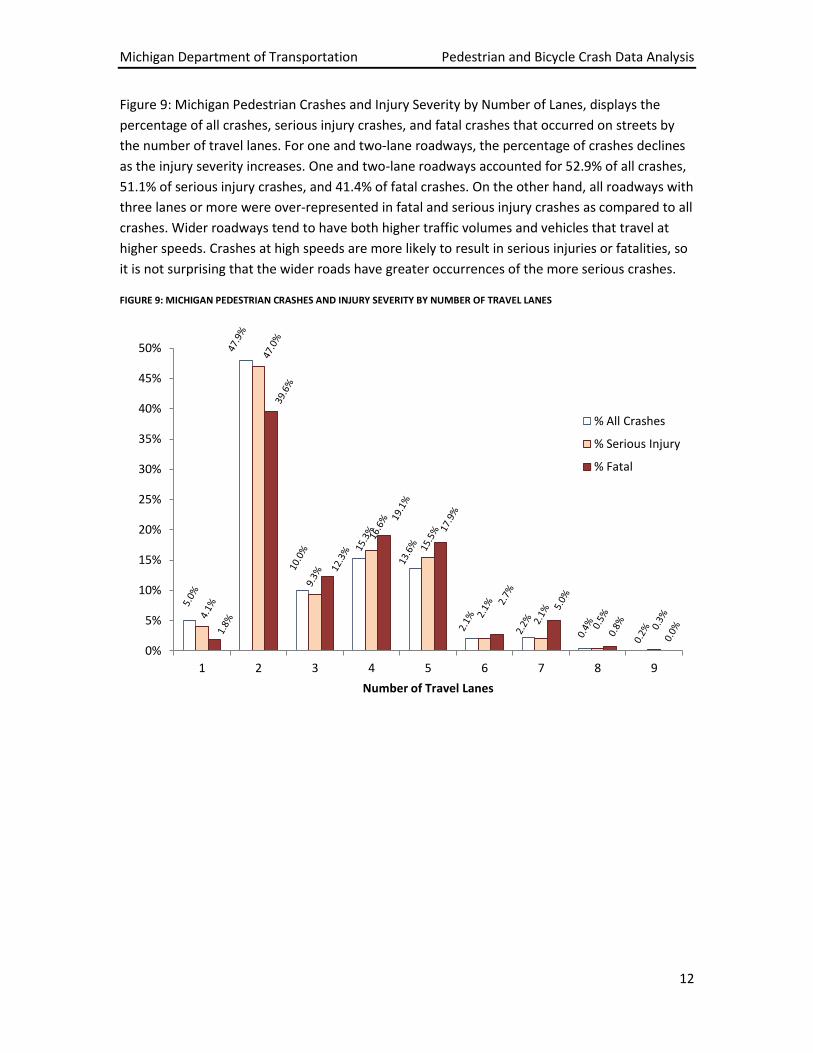
Figure 9: Michigan Pedestrian Crashes and Injury Severity by Number of Lanes, displays the percentage of all crashes, serious injury crashes, and fatal crashes that occurred on streets by the number of travel lanes. For one and two-lane roadways, the percentage of crashes declines as the injury severity increases. One and two-lane roadways accounted for 52.9% of all crashes, 51.1% of serious injury crashes, and 41.4% of fatal crashes. On the other hand, all roadways with three lanes or more were over-represented in fatal and serious injury crashes as compared to all crashes. Wider roadways tend to have both higher traffic volumes and vehicles that travel at higher speeds. Crashes at high speeds are more likely to result in serious injuries or fatalities, so it is not surprising that the wider roads have greater occurrences of the more serious crashes.
FIGURE 9: MICHIGAN PEDESTRIAN CRASHES AND INJURY SEVERITY BY NUMBER OF TRAVEL LANES
0%
5%
10%
15%
20%
25%
30%
35%
40%
45%
50%
1 2 3 4 5 6 7 8 9
Number of Travel Lanes
% All Crashes
% Serious Injury
% Fatal
Michigan Department of Transportation Pedestrian and Bicycle Crash Data Analysis
13
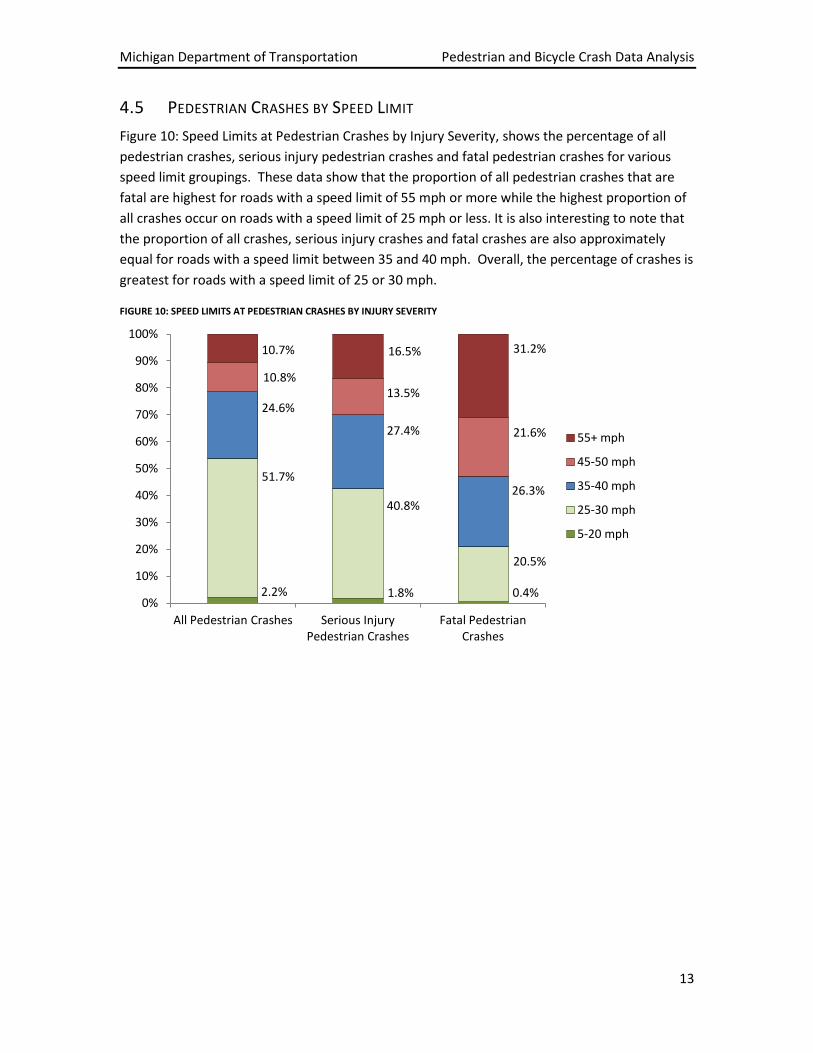
4.5 PEDESTRIAN CRASHES BY SPEED LIMIT
Figure 10: Speed Limits at Pedestrian Crashes by Injury Severity, shows the percentage of all pedestrian crashes, serious injury pedestrian crashes and fatal pedestrian crashes for various speed limit groupings. These data show that the proportion of all pedestrian crashes that are fatal are highest for roads with a speed limit of 55 mph or more while the highest proportion of all crashes occur on roads with a speed limit of 25 mph or less. It is also interesting to note that the proportion of all crashes, serious injury crashes and fatal crashes are also approximately equal for roads with a speed limit between 35 and 40 mph. Overall, the percentage of crashes is greatest for roads with a speed limit of 25 or 30 mph.
FIGURE 10: SPEED LIMITS AT PEDESTRIAN CRASHES BY INJURY SEVERITY
2.2% 1.8% 0.4%
51.7%
40.8%
20.5%
24.6%
27.4%
26.3%
10.8% 13.5%
21.6%
10.7% 16.5% 31.2%
0%
10%
20%
30%
40%
50%
60%
70%
80%
90%
100%
All Pedestrian Crashes Serious Injury Pedestrian Crashes
Fatal Pedestrian Crashes
55+ mph
45-50 mph
35-40 mph
25-30 mph
5-20 mph

Michigan Department of Transportation Pedestrian and Bicycle Crash Data Analysis
14
Figure 11: Michigan Pedestrian Crashes and Injury by Speed Limit, shows that as the speed limit increases, the percentage of serious injury and fatal crashes increases, despite fewer crashes occurring on those streets. Nearly half, 48.5% of the fatal and serious injury crashes occurred on streets with speed limits of 55 mph and over while only 10.2% of all crashes happened on those streets.
FIGURE 11: MICHIGAN PEDESTRIAN CRASHES AND INJURY SEVERITY BY SPEED LIMIT
In terms of the total number of crashes, more fatal pedestrian crashes occurred on roads with a 55 mph speed limit, while all crashes and injury crashes occur most frequently on roads with a 25 mph speed limit. These data suggest that there are more pedestrians on urban roads and in towns with lower posted speed limits than on high posted speed roadways. The data also show that the percentage of fatal crashes increases with increasing speed limit even though there likely are fewer pedestrians on higher speed roads.
2.1%
49.5%
23.5%
10.4% 10.2%
17.2% 16.2%
22.9% 25.6%
31.7%
1.0% 2.3%
6.2%
11.5% 16.8%
0%
5%
10%
15%
20%
25%
30%
35%
40%
45%
50%
5-20 mph 25-30 mph 35-40 mph 45-50 mph 55+ mph
% All Crashes
% Serious Injury
% Fatal

Michigan Department of Transportation Pedestrian and Bicycle Crash Data Analysis
15
4.6 TIME AND DAY
Figure 12: Michigan Fatal and Serious Injury Crashes by Day of Week, shows that crashes are lowest between Sunday and Tuesday and are higher Wednesday through Saturday with the peak days being Friday and Saturday. Exposure data would be needed to confirm the possible reasons for this trend, such as more pedestrian activity on Fridays and Saturdays than on other days. National data were broken down by weekday versus weekend but not by individual days. On average, weekend days had more crashes nationally than weekdays.
FIGURE 12: MICHIGAN FATAL AND SERIOUS INJURY PEDESTRIAN CRASHES BY DAY OF WEEK
476 487 496
560 537
602 634
0
100
200
300
400
500
600
700
Sunday Monday Tuesday Wednesday Thursday Friday Saturday

Michigan Department of Transportation Pedestrian and Bicycle Crash Data Analysis
16
Table 3: Michigan Fatal and Serious Injury Pedestrian Crashes by Time Period, shows the total and percentage of pedestrian fatal and serious injury crashes across time of day. Crashes are most frequent during the period between 3 pm and 3 am, with the highest 3-hour peak between 6 pm and 9 pm. Relatively few crashes occur during the morning hours between 6 am and 9 am despite being the morning peak travel period. The percentage of crashes between 12 pm and 3 pm is higher than the morning peak period between 6 am and 9 am.
TABLE 3: MICHIGAN FATAL AND SERIOUS INJURY PEDESTRIAN CRASHES BY TIME PERIOD
Time Period 2005 2006 2007 2008 2009 2010 Total % of Total National
12 am-3 am 79 64 78 66 64 73 424 11.2% 5.5%
3 am-6 am 44 39 20 36 30 20 189 5.0% 2.9%
6 am-9 am 49 77 61 65 43 52 347 9.1% 11.8%
9 am-12 am 53 67 38 45 32 39 274 7.2% 9.6%
12 pm-3 pm 72 57 55 68 53 73 378 10.0% 14.6%
3 pm-6 pm 139 94 107 100 106 80 626 16.5% 22.3%
6 pm-9 pm 162 145 140 141 131 123 842 22.2% 21.2%
9 pm-12 am 123 140 125 98 123 111 720 19.0% 12.1%
According to national data, the time periods with the most crashes were 3 pm to 6 pm, followed by 6 pm to 9 pm. Forty-five percent of the crashes occurred during these two time periods. The 12 am to 3 am time period has a much lower crash rate nationally at 5.5% than in Michigan, where it is 11.2%. Similarly, the 9 pm to 12 am time period had 19.0% of the crashes versus 12.1% nationally.

Michigan Department of Transportation Pedestrian and Bicycle Crash Data Analysis
17
4.7 CONDITIONS
4.7.1 LIGHTING CONDITIONS Figure 13: Michigan Fatal and Serious Injury Pedestrian Crashes by Lighting Condition, shows pedestrian crashes based on lighting condition. This figure shows that more pedestrian crashes and injuries occur in dark (lighted or unlighted) conditions (54.2%) than during daylight (40.0%). This is consistent with the findings from the time of day analysis. Although exposure data are not available, it is probable that exposure is greater during daytime hours. A relatively small number of crashes occur during the short dawn and dusk periods.
FIGURE 13: MICHIGAN FATAL AND SERIOUS INJURY PEDESTRIAN CRASHES BY LIGHTING CONDITION
Research has documented that drivers’ inability to see pedestrians at a safe distance is a major factor in nighttime pedestrian crashes (Blomberg, Hale & Presusser, 1984, 1986; Leibowitz, Owens, & Tyrrell, 1998; Rumar, 1990; Wood, Tyrell & Carberry, 2005; Wootton, 2006). These findings are further supported by analysis of the Fatality Analysis Reporting System (FARS) database, which show that pedestrian fatalities increase as illumination decreases even when other factors are held constant (Owens & Sivak, 1996; Sullivan & Flannagan, 2002). Sullivan and Flannagan (2002) found that collisions were 4.8 times more likely at night than during daylight on arterial roadways and 3.0 times more likely at night on collector roadways. In addition, studies examining the relationship between crashes and lighting levels found that increasing overhead lighting levels is associated with a reduction in nighttime crashes (Elvik, 1995). These results suggest that a potentially effective approach to reducing nighttime crashes would include improving ambient lighting to enhance the visibility of pedestrians at specific locations.
32.0%
22.2%
1.6%
40.0%
3.6% 0.3% 0.3%
0
200
400
600
800
1,000
1,200
1,400
1,600

Michigan Department of Transportation Pedestrian and Bicycle Crash Data Analysis
18
4.7.2 ROADWAY CONDITIONS Figure 14: Michigan Fatal and Serious Injury Pedestrian Crashes by Road Condition, shows pedestrian crashes by roadway condition. Most pedestrian crashes (over 70%) occur when the roadway is dry, with most of the remainder occurring when the roadway is wet. Few crashes occur during snowy, slushy or icy conditions. These data fit the profile of walking behavior, with most walking occurring in good weather and less walking during inclement weather conditions.
71.3%
3.6%
5.0%
18.0%
0.0%
2.0%
0% 10% 20% 30% 40% 50% 60% 70% 80%
Dry
Icy
Slushy/Snowy
Wet
Muddy
Other/Unknown
FIGURE 14: MICHIGAN FATAL AND SERIOUS INJURY PEDESTRIAN CRASHES BY ROAD CONDITION

Michigan Department of Transportation Pedestrian and Bicycle Crash Data Analysis
19
4.8 DRIVER AND PEDESTRIAN ACTIONS
Figure 15: Michigan Fatal and Serious Injury Crashes by Driver Action at Intersections, shows driver action at the time of pedestrian fatality and serious injury crashes for intersection locations. This includes signalized and unsignalized intersections. These data show that straight ahead movements are involved in 34% of crashes and turning movements are involved in 38 % of crashes.
Together these two conditions account for 71.6% of crashes. Crashes involving straight ahead movements at signalized intersections could be attributed to various actions, such as pedestrians crossing against the light or vehicles running a red light. At locations controlled by a stop sign, these crashes typically involve driver violations because the motorist should be able to yield to pedestrians crossing in a marked or unmarked crosswalk when starting from a stop. Turning crashes at signalized intersections may involve a motorist failure to yield or a pedestrian failure to yield during a protected right or left turn movement.
At uncontrolled locations, the straight ahead movements likely involve either driver violations, pedestrians stepping out into traffic when the vehicles are too close to stop, or pedestrians walking or standing in the roadway.
The next largest contributors are drivers starting up the roadway (at the beginning of a green light) or slowing/stopping. These account for 10.8% and 9.5% percent of crashes, respectively. Motorists leaving parking and entering the roadway account for 0.7% and 1.6% of crashes respectively.
2.3%
4.2%
0.7%
1.6%
9.5%
10.8%
12.8%
25.0%
33.8%
0% 10% 20% 30% 40%
Unknown
Other
Leaving parking
Entering roadway
Slowing/stopping on roadway
Starting up on roadway
Turning left
Turning right
Going straight ahead
FIGURE 15: MICHIGAN FATAL AND SERIOUS INJURY CRASHES BY DRIVER ACTION AT INTERSECTIONS
Michigan Department of Transportation Pedestrian and Bicycle Crash Data Analysis
20
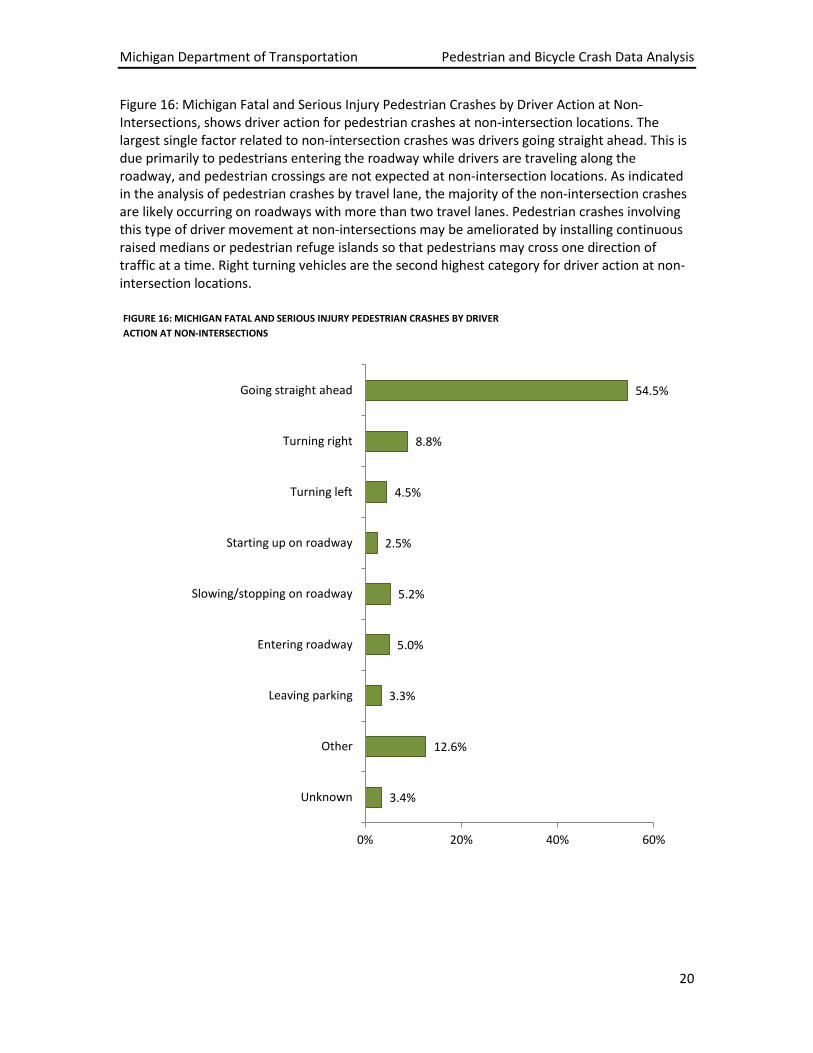
Figure 16: Michigan Fatal and Serious Injury Pedestrian Crashes by Driver Action at Non-Intersections, shows driver action for pedestrian crashes at non-intersection locations. The largest single factor related to non-intersection crashes was drivers going straight ahead. This is due primarily to pedestrians entering the roadway while drivers are traveling along the roadway, and pedestrian crossings are not expected at non-intersection locations. As indicated in the analysis of pedestrian crashes by travel lane, the majority of the non-intersection crashes are likely occurring on roadways with more than two travel lanes. Pedestrian crashes involving this type of driver movement at non-intersections may be ameliorated by installing continuous raised medians or pedestrian refuge islands so that pedestrians may cross one direction of traffic at a time. Right turning vehicles are the second highest category for driver action at non-intersection locations.
3.4%
12.6%
3.3%
5.0%
5.2%
2.5%
4.5%
8.8%
54.5%
0% 20% 40% 60%
Unknown
Other
Leaving parking
Entering roadway
Slowing/stopping on roadway
Starting up on roadway
Turning left
Turning right
Going straight ahead
FIGURE 16: MICHIGAN FATAL AND SERIOUS INJURY PEDESTRIAN CRASHES BY DRIVER ACTION AT NON-INTERSECTIONS
Michigan Department of Transportation Pedestrian and Bicycle Crash Data Analysis
21
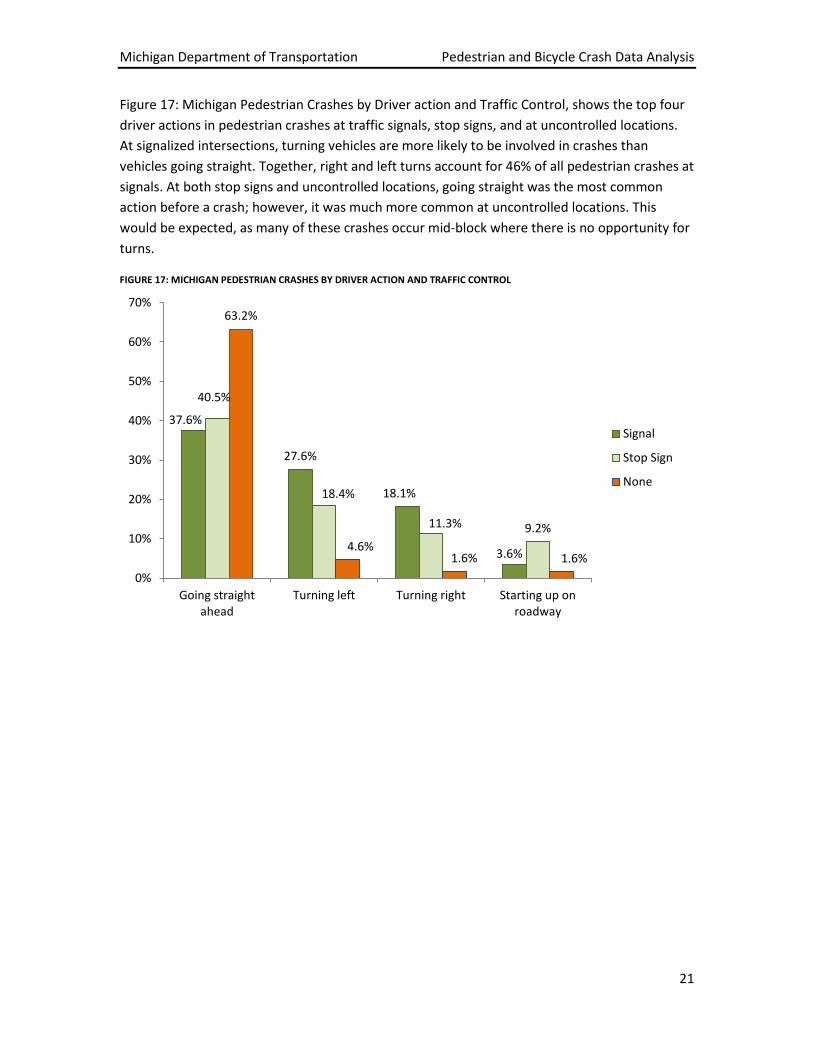
Figure 17: Michigan Pedestrian Crashes by Driver action and Traffic Control, shows the top four driver actions in pedestrian crashes at traffic signals, stop signs, and at uncontrolled locations. At signalized intersections, turning vehicles are more likely to be involved in crashes than vehicles going straight. Together, right and left turns account for 46% of all pedestrian crashes at signals. At both stop signs and uncontrolled locations, going straight was the most common action before a crash; however, it was much more common at uncontrolled locations. This would be expected, as many of these crashes occur mid-block where there is no opportunity for turns.
FIGURE 17: MICHIGAN PEDESTRIAN CRASHES BY DRIVER ACTION AND TRAFFIC CONTROL
37.6%
27.6%
18.1%
3.6%
40.5%
18.4%
11.3% 9.2%
63.2%
4.6% 1.6% 1.6%
0%
10%
20%
30%
40%
50%
60%
70%
Going straight ahead
Turning left Turning right Starting up on roadway
Signal
Stop Sign
None

Michigan Department of Transportation Pedestrian and Bicycle Crash Data Analysis
22
Figure 18: Michigan Pedestrian Crashes by Pedestrian Action, shows pedestrian crashes by pedestrian action at intersections and non-intersections. These data show that at intersections, 58.1% of crashes involved crossing the roadway; however, 8.2% of crashes involving pedestrians crossing the roadway at intersections are listed as non-intersection crashes. The data are unclear; there should not be any non-intersection crossings at an intersection, nor should there be intersection crashes at non-intersection locations. It appears that these crashes have been miscoded. Regardless, the data indicates that the majority of pedestrians were struck while crossing the roadway at intersections. At non-intersections, 33% of crashes were coded as crossing the street at a non-intersection. Another 30% of crashes involved pedestrians in the roadway.
This includes pedestrians walking with and against traffic, working in the roadway, playing in the roadway, or being in the roadway for some other reason. A significant number of crashes involve being in the roadway for a purpose other than crossing, particularly at non-intersections.
FIGURE 18: MICHIGAN PEDESTRIAN CRASHES BY PEDESTRIAN ACTION
58.1%
13.8% 10.8%
4.5% 2.8% 4.4% 5.5% 8.2%
32.6% 30.1%
4.2% 7.0%
9.3% 8.6%
0%
10%
20%
30%
40%
50%
60%
70%
Intersections
Non-Intersections
Michigan Department of Transportation Pedestrian and Bicycle Crash Data Analysis
23
4.9 ALCOHOL INVOLVEMENT
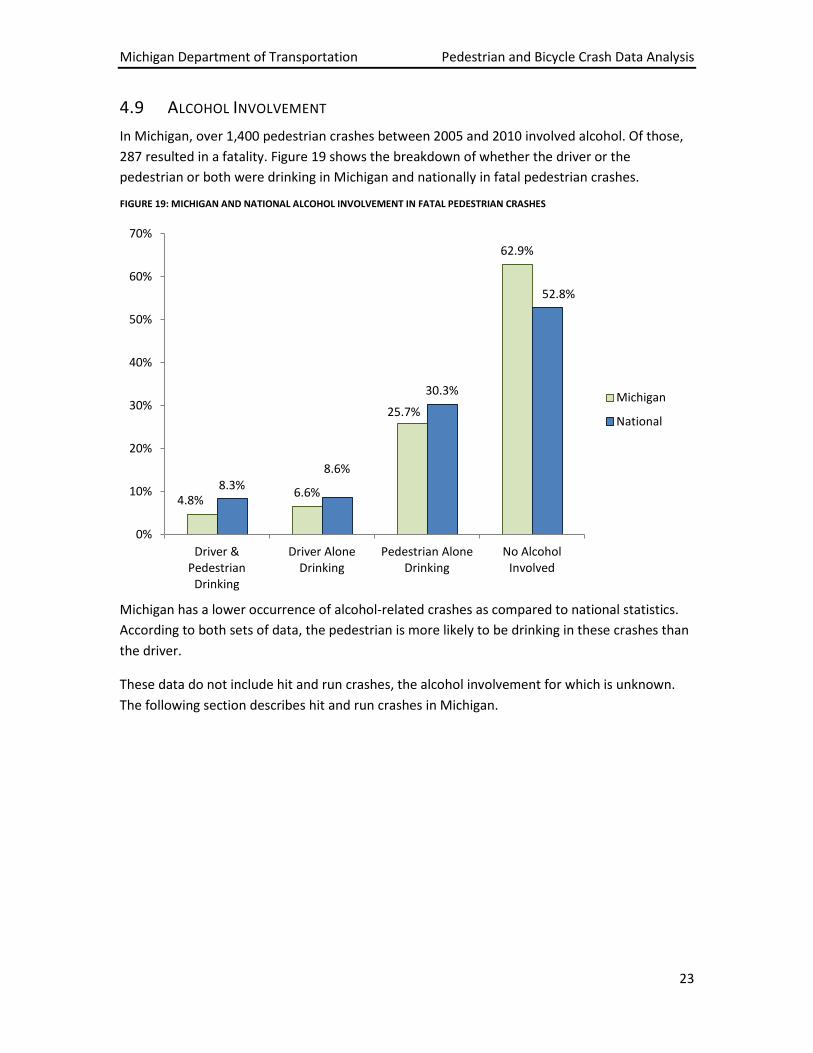
In Michigan, over 1,400 pedestrian crashes between 2005 and 2010 involved alcohol. Of those, 287 resulted in a fatality. Figure 19 shows the breakdown of whether the driver or the pedestrian or both were drinking in Michigan and nationally in fatal pedestrian crashes.
Michigan has a lower occurrence of alcohol-related crashes as compared to national statistics. According to both sets of data, the pedestrian is more likely to be drinking in these crashes than the driver.
These data do not include hit and run crashes, the alcohol involvement for which is unknown. The following section describes hit and run crashes in Michigan.
4.8% 6.6%
25.7%
62.9%
8.3% 8.6%
30.3%
52.8%
0%
10%
20%
30%
40%
50%
60%
70%
Driver & Pedestrian
Drinking
Driver Alone Drinking
Pedestrian Alone Drinking
No Alcohol Involved
Michigan
National
FIGURE 19: MICHIGAN AND NATIONAL ALCOHOL INVOLVEMENT IN FATAL PEDESTRIAN CRASHES
Michigan Department of Transportation Pedestrian and Bicycle Crash Data Analysis
24
4.10 HIT AND RUNS
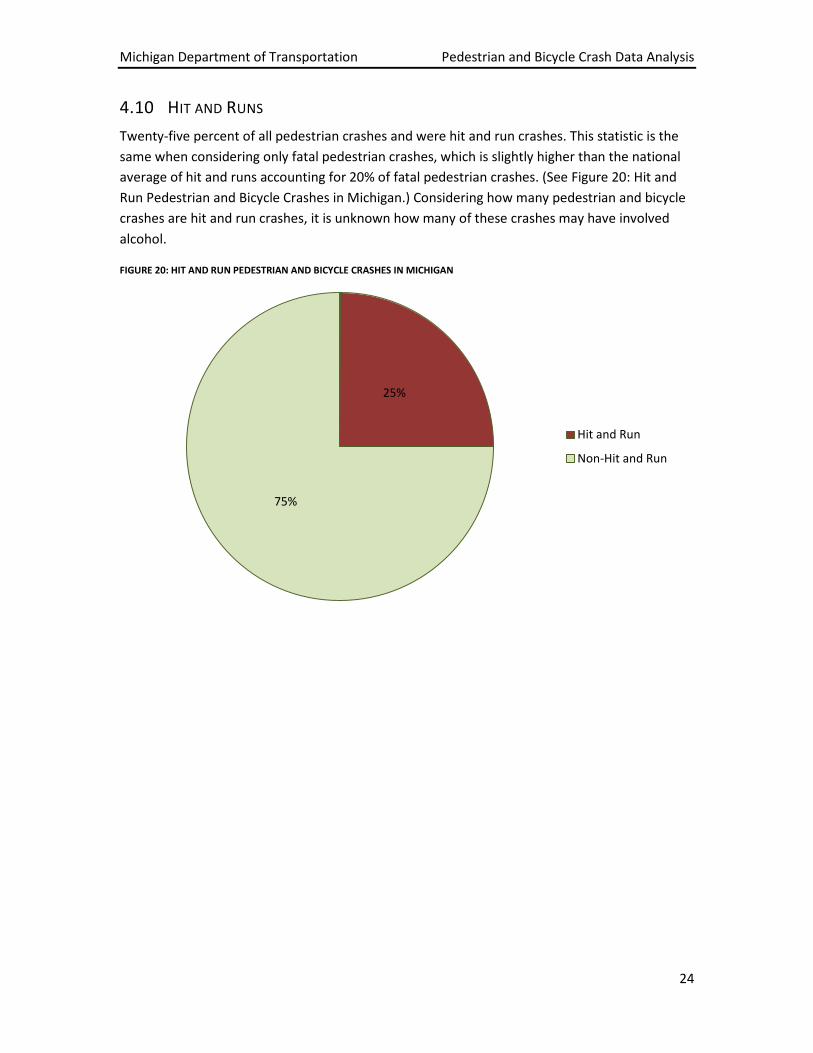
Twenty-five percent of all pedestrian crashes and were hit and run crashes. This statistic is the same when considering only fatal pedestrian crashes, which is slightly higher than the national average of hit and runs accounting for 20% of fatal pedestrian crashes. (See Figure 20: Hit and Run Pedestrian and Bicycle Crashes in Michigan.) Considering how many pedestrian and bicycle crashes are hit and run crashes, it is unknown how many of these crashes may have involved alcohol.
FIGURE 20: HIT AND RUN PEDESTRIAN AND BICYCLE CRASHES IN MICHIGAN
25%
75%
Hit and Run
Non-Hit and Run

Michigan Department of Transportation Pedestrian and Bicycle Crash Data Analysis
25
5.0 BICYCLE CRASH STATISTICS
5.1 BICYCLIST AGE
Youth (ages 5 to 15) involvement in bicycle crashes is higher in Michigan compared to national statistics as shown in Figure 21: Michigan Bicycle Crashes by Age Group. This age group had the highest involvement in bicycle crashes, with the subsequent age group, 16 to 24 year-olds having the second highest involvement. It is also noteworthy that the age group of 25 to 34 year-olds is the most under-represented age group in Michigan compared to national crashes. These data suggest outreach opportunities for school age students.
FIGURE 21: MICHIGAN BICYCLE CRASHES BY AGE GROUP
2.4%
32.4%
22.3%
9.3%
9.6%
12.8%
6.0%
2.1%
1.1%
0.0%
26.8%
23.3%
15.0%
11.1%
13.4%
7.9%
1.8%
0.5%
0% 5% 10% 15% 20% 25% 30% 35%
Missing Data
<5
5-15
16-24
25-34
35-44
45-54
55-64
65-74
>74
National Crashes Michigan Crashes
Michigan Department of Transportation Pedestrian and Bicycle Crash Data Analysis
26
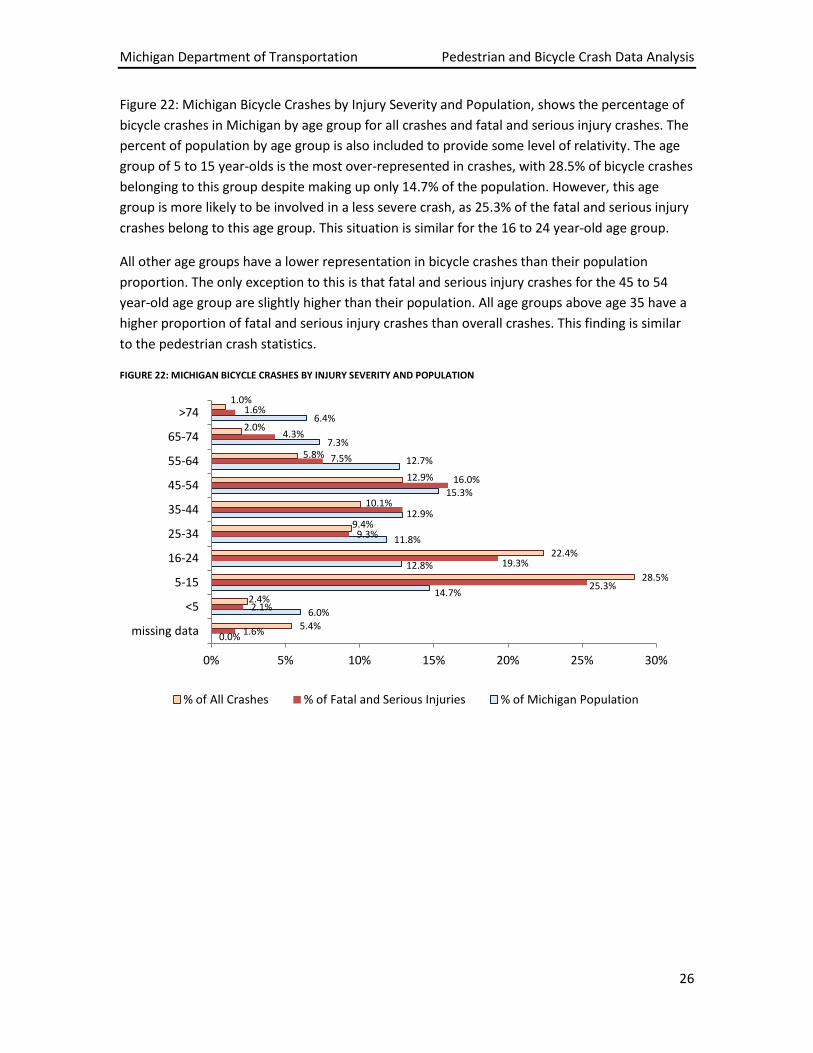
Figure 22: Michigan Bicycle Crashes by Injury Severity and Population, shows the percentage of bicycle crashes in Michigan by age group for all crashes and fatal and serious injury crashes. The percent of population by age group is also included to provide some level of relativity. The age group of 5 to 15 year-olds is the most over-represented in crashes, with 28.5% of bicycle crashes belonging to this group despite making up only 14.7% of the population. However, this age group is more likely to be involved in a less severe crash, as 25.3% of the fatal and serious injury crashes belong to this age group. This situation is similar for the 16 to 24 year-old age group.
All other age groups have a lower representation in bicycle crashes than their population proportion. The only exception to this is that fatal and serious injury crashes for the 45 to 54 year-old age group are slightly higher than their population. All age groups above age 35 have a higher proportion of fatal and serious injury crashes than overall crashes. This finding is similar to the pedestrian crash statistics.
FIGURE 22: MICHIGAN BICYCLE CRASHES BY INJURY SEVERITY AND POPULATION
0.0%
6.0%
14.7%
12.8%
11.8%
12.9%
15.3%
12.7%
7.3%
6.4%
1.6%
2.1%
25.3%
19.3%
9.3%
16.0%
7.5%
4.3%
1.6%
5.4%
2.4%
28.5%
22.4%
9.4%
10.1%
12.9%
5.8%
2.0%
1.0%
0% 5% 10% 15% 20% 25% 30%
missing data
<5
5-15
16-24
25-34
35-44
45-54
55-64
65-74
>74
% of All Crashes % of Fatal and Serious Injuries % of Michigan Population
Michigan Department of Transportation Pedestrian and Bicycle Crash Data Analysis
27
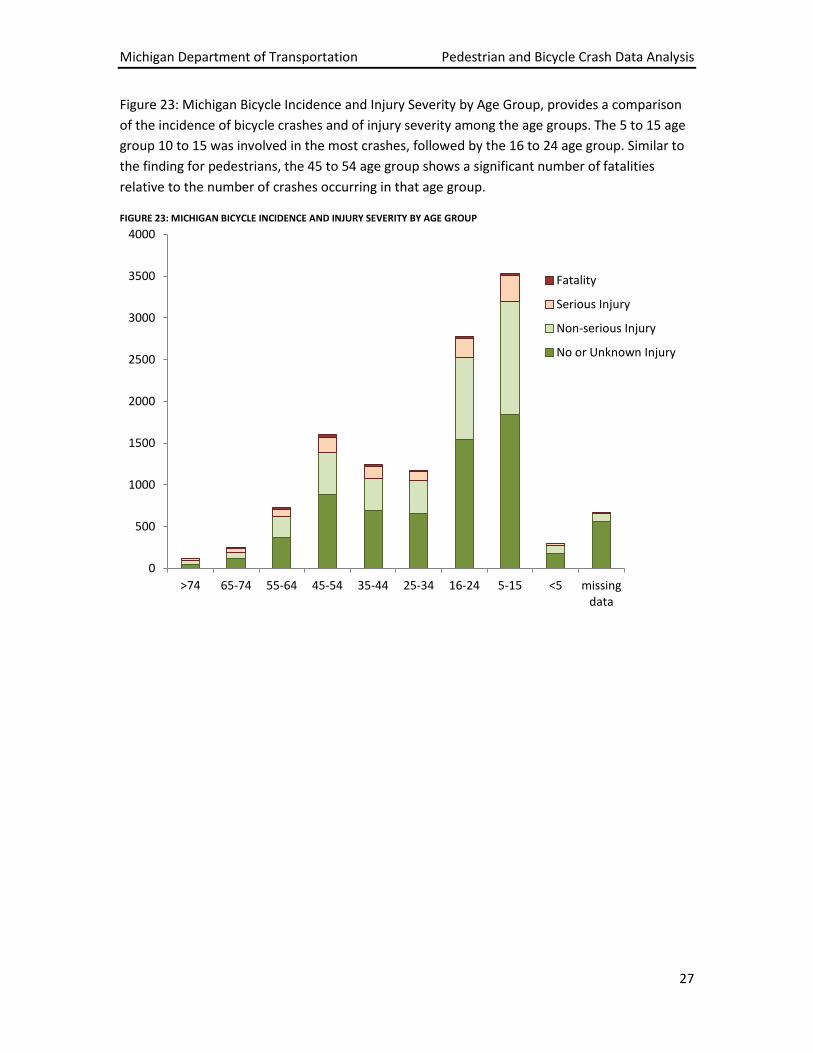
Figure 23: Michigan Bicycle Incidence and Injury Severity by Age Group, provides a comparison of the incidence of bicycle crashes and of injury severity among the age groups. The 5 to 15 age group 10 to 15 was involved in the most crashes, followed by the 16 to 24 age group. Similar to the finding for pedestrians, the 45 to 54 age group shows a significant number of fatalities relative to the number of crashes occurring in that age group.
FIGURE 23: MICHIGAN BICYCLE INCIDENCE AND INJURY SEVERITY BY AGE GROUP
0
500
1000
1500
2000
2500
3000
3500
4000
>74 65-74 55-64 45-54 35-44 25-34 16-24 5-15 <5 missing data
Fatality
Serious Injury
Non-serious Injury
No or Unknown Injury

Michigan Department of Transportation Pedestrian and Bicycle Crash Data Analysis
28
5.2 BICYCLIST GENDER
Following a similar trend as pedestrian crashes, the majority of bicyclists killed or seriously injured between 2005 and 2010 were male. Figure 24: Michigan Fatal and Serious Injury Bicycle Crashes by Gender, shows the distribution of males and females in fatal and serious injury crashes. Males were involved in 81% of fatal and serious injury bicycle crashes. A similar split is seen nationally among all fatalities and injuries. When considering fatalities nationwide, the split is more pronounced with 88% of bicycle fatalities being male and 12% female.
80.6%
19.4%
Male
Female
FIGURE 24: MICHIGAN FATAL AND SERIOUS INJURY BICYCLE CRASHES BY GENDER
Michigan Department of Transportation Pedestrian and Bicycle Crash Data Analysis
29
5.3 CRASH LOCATION
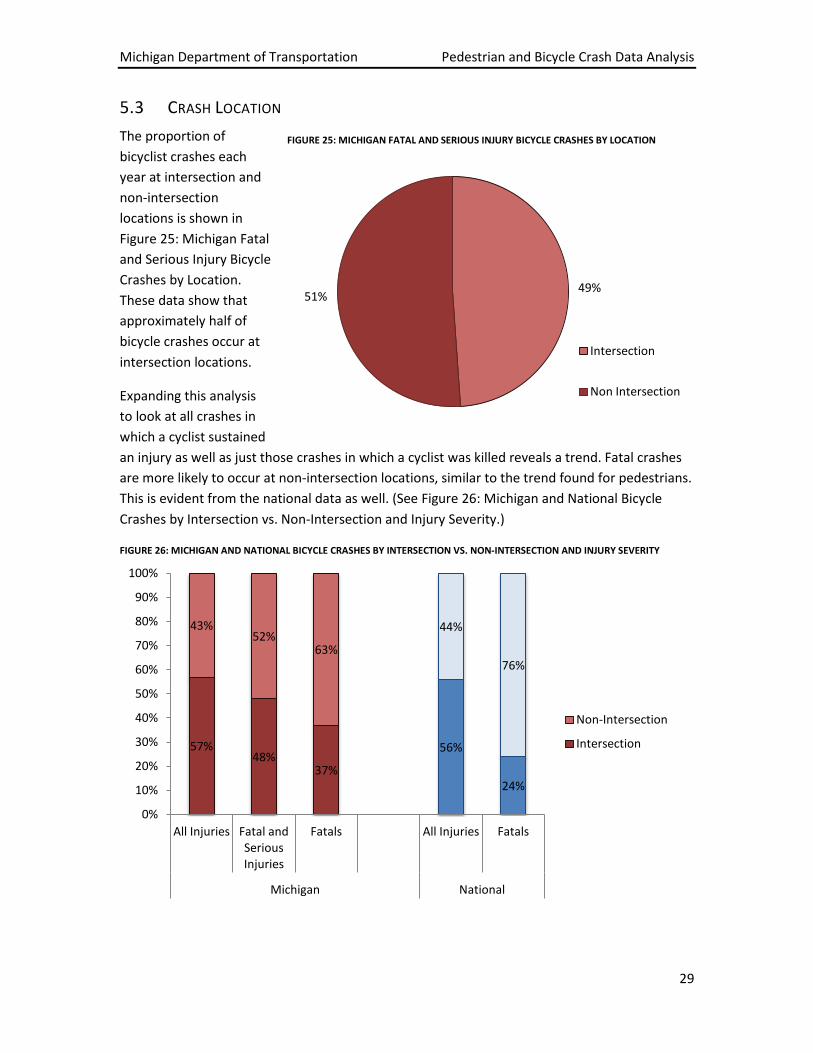
The proportion of bicyclist crashes each year at intersection and non-intersection locations is shown in Figure 25: Michigan Fatal and Serious Injury Bicycle Crashes by Location. These data show that approximately half of bicycle crashes occur at intersection locations.
Expanding this analysis to look at all crashes in which a cyclist sustained an injury as well as just those crashes in which a cyclist was killed reveals a trend. Fatal crashes are more likely to occur at non-intersection locations, similar to the trend found for pedestrians. This is evident from the national data as well. (See Figure 26: Michigan and National Bicycle Crashes by Intersection vs. Non-Intersection and Injury Severity.)
FIGURE 26: MICHIGAN AND NATIONAL BICYCLE CRASHES BY INTERSECTION VS. NON-INTERSECTION AND INJURY SEVERITY
57% 48%
37%
56%
24%
43% 52%
63%
44%
76%
0%
10%
20%
30%
40%
50%
60%
70%
80%
90%
100%
All Injuries Fatal and Serious Injuries
Fatals All Injuries Fatals
Michigan National
Non-Intersection
Intersection
49% 51%
Intersection
Non Intersection
FIGURE 25: MICHIGAN FATAL AND SERIOUS INJURY BICYCLE CRASHES BY LOCATION
Michigan Department of Transportation Pedestrian and Bicycle Crash Data Analysis
30
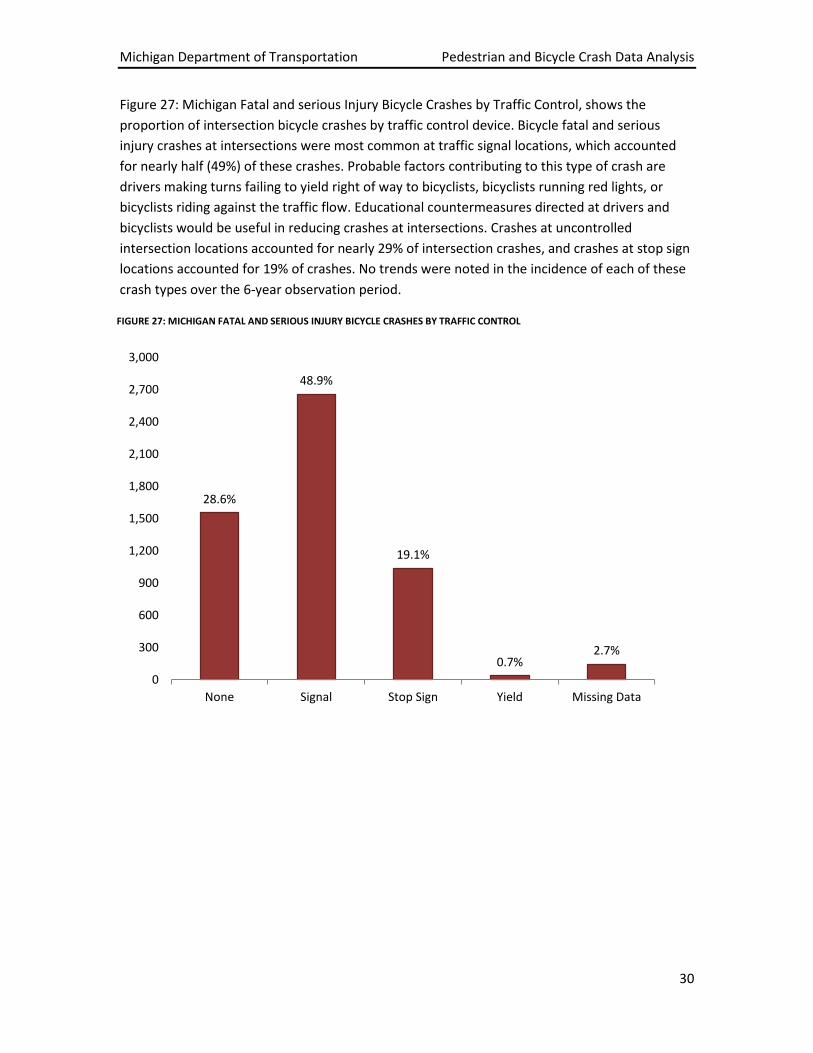
Figure 27: Michigan Fatal and serious Injury Bicycle Crashes by Traffic Control, shows the proportion of intersection bicycle crashes by traffic control device. Bicycle fatal and serious injury crashes at intersections were most common at traffic signal locations, which accounted for nearly half (49%) of these crashes. Probable factors contributing to this type of crash are drivers making turns failing to yield right of way to bicyclists, bicyclists running red lights, or bicyclists riding against the traffic flow. Educational countermeasures directed at drivers and bicyclists would be useful in reducing crashes at intersections. Crashes at uncontrolled intersection locations accounted for nearly 29% of intersection crashes, and crashes at stop sign locations accounted for 19% of crashes. No trends were noted in the incidence of each of these crash types over the 6-year observation period.
28.6%
48.9%
19.1%
0.7% 2.7%
0
300
600
900
1,200
1,500
1,800
2,100
2,400
2,700
3,000
None Signal Stop Sign Yield Missing Data
FIGURE 27: MICHIGAN FATAL AND SERIOUS INJURY BICYCLE CRASHES BY TRAFFIC CONTROL

Michigan Department of Transportation Pedestrian and Bicycle Crash Data Analysis
31
Figure 28: Michigan Fatal and Serious Injury Bicycle Crashes by Crash Location, shows where bicycle crashes occurred with respect to the roadway for both intersection and non-intersection locations. These data show that most crashes occurred on the road with a much smaller proportion occurring on the shoulder or outside of the shoulder/curb line. What is not known from these data was cyclist action at the time of the crash; for example, whether the cyclist was crossing the roadway, riding with traffic, or riding against traffic. Closer examination of individual crash reports would reveal that detailed information.
92.4%
1.0%
1.7%
4.8%
74.8%
4.8%
7.8%
12.5%
0% 20% 40% 60% 80% 100%
On the road
On the shoulder
Outside of shoulder/curbline
Other/Unknown
% Non-Intersection % Intersection
FIGURE 28: MICHIGAN FATAL AND SERIOUS INJURY BICYCLE CRASHES BY CRASH LOCATION

Michigan Department of Transportation Pedestrian and Bicycle Crash Data Analysis
32
Table 4: Michigan Fatal and Serious Injury Crashes by Number of Travel Lanes, shows the bicycle crashes by the total number of travel lanes. Nearly 60% of bicycle crashes occur on roads with one or two lanes with most of these occurring on two lane roads. This is higher than the percentage of pedestrian crashes on these roads.
TABLE 4: MICHIGAN FATAL AND SERIOUS INJURY CRASHES BY NUMBER OF TRAVEL LANES
Travel Lanes 2005 2006 2007 2008 2009 2010 Total % of Total
1 4 3 10 6 3 7 33 2.5%
2 143 143 110 110 133 121 760 56.5%
3 21 21 28 19 21 21 131 9.7%
4 36 25 29 30 31 23 174 12.9%
5 28 45 30 28 29 26 186 13.8%
6 4 4 7 0 4 0 19 1.4%
7 1 0 0 3 3 2 9 0.71%
8 0 0 1 0 0 0 1 0%
9 0 0 0 1 0 0 1 0%
Michigan Department of Transportation Pedestrian and Bicycle Crash Data Analysis
33
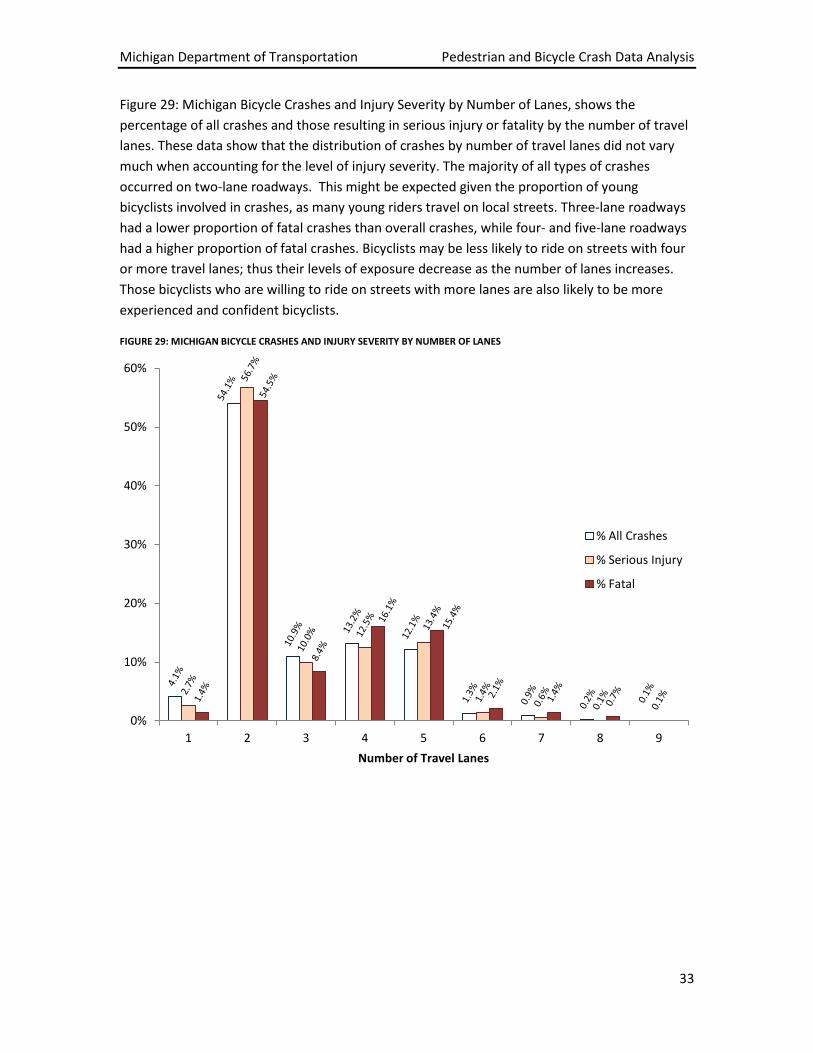
Figure 29: Michigan Bicycle Crashes and Injury Severity by Number of Lanes, shows the percentage of all crashes and those resulting in serious injury or fatality by the number of travel lanes. These data show that the distribution of crashes by number of travel lanes did not vary much when accounting for the level of injury severity. The majority of all types of crashes occurred on two-lane roadways. This might be expected given the proportion of young bicyclists involved in crashes, as many young riders travel on local streets. Three-lane roadways had a lower proportion of fatal crashes than overall crashes, while four- and five-lane roadways had a higher proportion of fatal crashes. Bicyclists may be less likely to ride on streets with four or more travel lanes; thus their levels of exposure decrease as the number of lanes increases. Those bicyclists who are willing to ride on streets with more lanes are also likely to be more experienced and confident bicyclists.
FIGURE 29: MICHIGAN BICYCLE CRASHES AND INJURY SEVERITY BY NUMBER OF LANES
0%
10%
20%
30%
40%
50%
60%
1 2 3 4 5 6 7 8 9
Number of Travel Lanes
% All Crashes
% Serious Injury
% Fatal
Michigan Department of Transportation Pedestrian and Bicycle Crash Data Analysis
34
5.4 BICYCLE CRASHES BY SPEED LIMIT
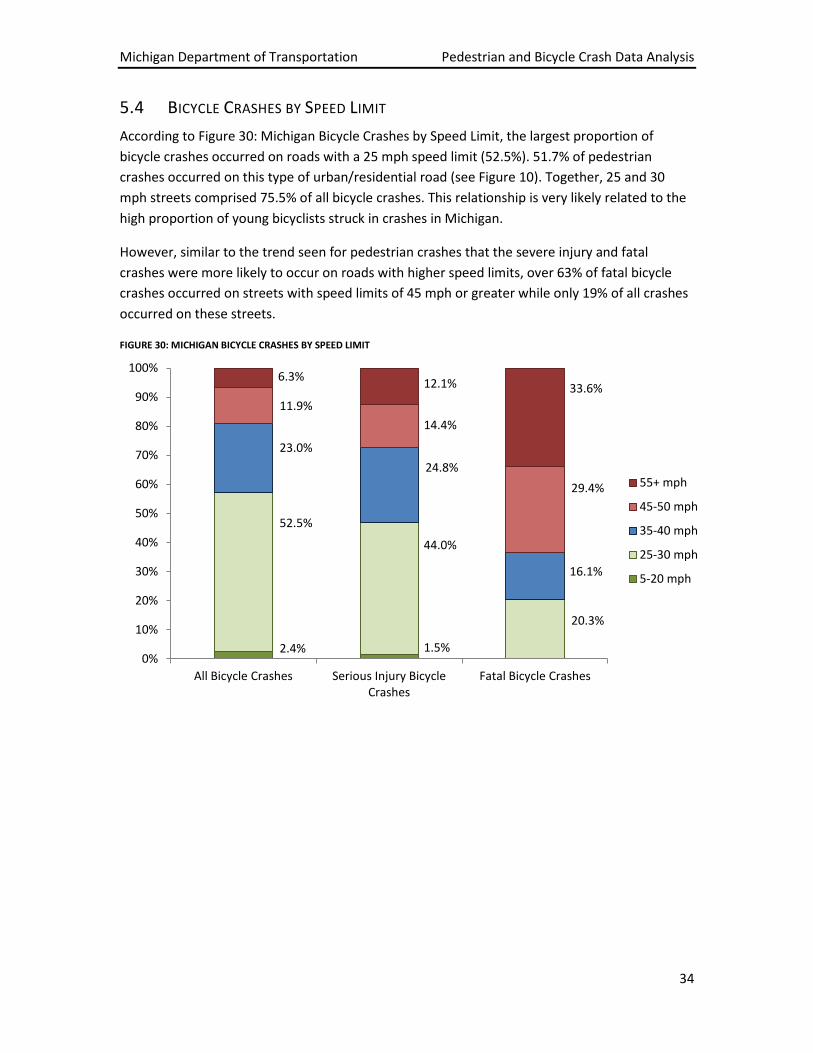
According to Figure 30: Michigan Bicycle Crashes by Speed Limit, the largest proportion of bicycle crashes occurred on roads with a 25 mph speed limit (52.5%). 51.7% of pedestrian crashes occurred on this type of urban/residential road (see Figure 10). Together, 25 and 30 mph streets comprised 75.5% of all bicycle crashes. This relationship is very likely related to the high proportion of young bicyclists struck in crashes in Michigan.
However, similar to the trend seen for pedestrian crashes that the severe injury and fatal crashes were more likely to occur on roads with higher speed limits, over 63% of fatal bicycle crashes occurred on streets with speed limits of 45 mph or greater while only 19% of all crashes occurred on these streets.
FIGURE 30: MICHIGAN BICYCLE CRASHES BY SPEED LIMIT
2.4% 1.5%
52.5%
44.0%
20.3%
23.0%
24.8%
16.1%
11.9%
14.4%
29.4%
6.3% 12.1% 33.6%
0%
10%
20%
30%
40%
50%
60%
70%
80%
90%
100%
All Bicycle Crashes Serious Injury Bicycle Crashes
Fatal Bicycle Crashes
55+ mph
45-50 mph
35-40 mph
25-30 mph
5-20 mph

Michigan Department of Transportation Pedestrian and Bicycle Crash Data Analysis
35
Another way to examine the issue of crash severity and speed is shown in Figure 31: Michigan Bicycle Crashes and Injury Severity by Speed Limit. This figure shows the percentage of all crashes, serious injury crashes, and fatal crashes that fall into each speed limit category. This graph illustrates that as speed limit increases, the likelihood of a crash resulting in a fatality also increases. While only 6% of all crashes occur at speed limits of 55 mph and higher, 34% of the fatal crashes occur in that category.
FIGURE 31: MICHIGAN BICYCLE CRASHES AND INJURY SEVERITY BY SPEED LIMIT
0%
10%
20%
30%
40%
50%
60%
5-20 mph 25-30 mph 35-40 mph 45-50 mph 55+ mph
% All Crashes
% Serious Injury
% Fatal

Michigan Department of Transportation Pedestrian and Bicycle Crash Data Analysis
36
5.5 TIME AND DAY
Table 5: Michigan Fatal and Serious Injury Bicycle Crashes by Time of Day, shows the total and percentage of fatal and serious injury bicycle crashes across time of day. Crashes are most frequent during the period between 3 pm and 9 pm, with the highest 3-hour peak between 3 pm and 6 pm. This is also the case nationally. This period coincides with the after school period and the evening rush hour period. These results differ from the statistics for pedestrian crashes, which indicate the highest 3-hour peak between 6 pm and 9 pm, but also show a significant number of pedestrians being hit during the late night and early morning hours, from 9 pm to 3 am. By contrast, the 12 am to 3 am time period is low for bicycle crashes; however, this and the 3 am to 6 am time periods have more crashes in Michigan than nationally.
TABLE 5: MICHIGAN FATAL AND SERIOUS INJURY BICYCLE CRASHES BY TIME OF DAY
Time Period 2005 2006 2007 2008 2009 2010 Total % of Total National Stats
12 am-3 am 6 8 9 10 9 8 50 3.7% 1.0%
3 am-6 am 2 7 7 7 2 3 28 2.1% 0.1%
6 am-9 am 22 14 17 20 14 12 99 7.4% 10.8%
9 am-12 am 24 21 20 23 29 22 139 10.4% 11.3%
12 pm-3 pm 35 50 37 25 36 39 222 16.6% 18.5%
3 pm-6 pm 81 60 59 55 62 48 365 27.2% 30.1%
6 pm-9 pm 48 62 40 48 49 45 292 21.8% 21.2%
9 pm-12 am 24 25 31 13 27 25 145 10.8% 7.0%
Michigan Department of Transportation Pedestrian and Bicycle Crash Data Analysis
37
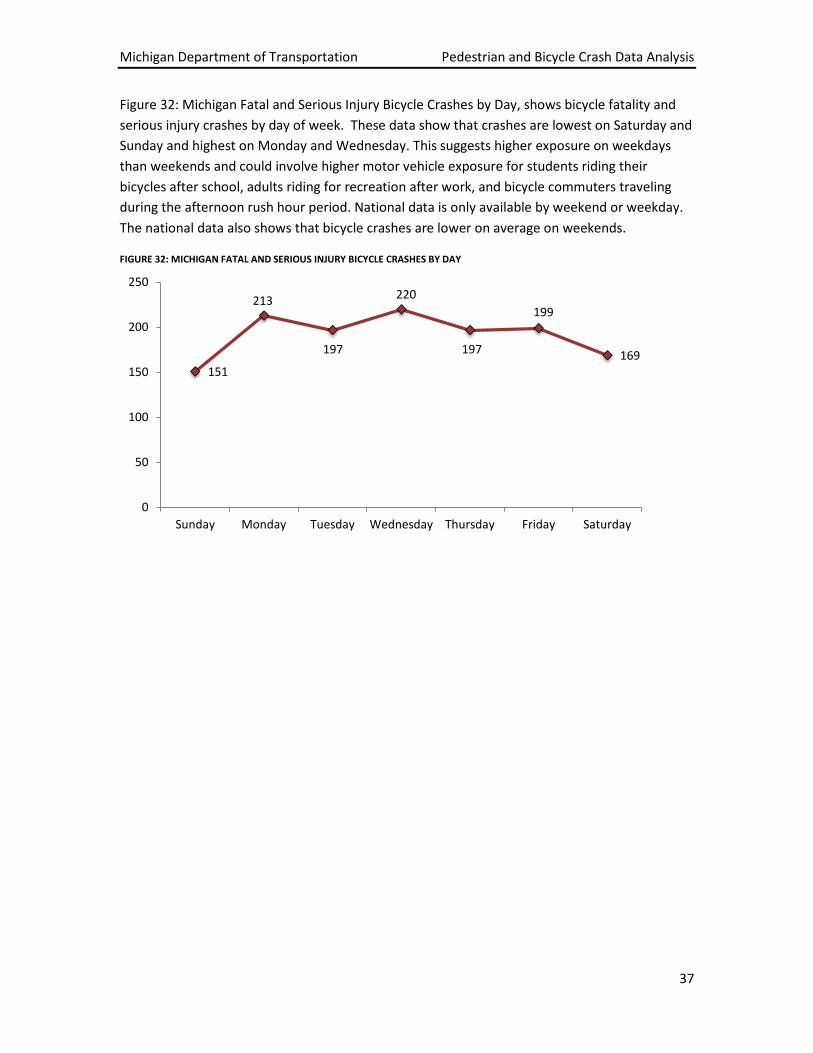
Figure 32: Michigan Fatal and Serious Injury Bicycle Crashes by Day, shows bicycle fatality and serious injury crashes by day of week. These data show that crashes are lowest on Saturday and Sunday and highest on Monday and Wednesday. This suggests higher exposure on weekdays than weekends and could involve higher motor vehicle exposure for students riding their bicycles after school, adults riding for recreation after work, and bicycle commuters traveling during the afternoon rush hour period. National data is only available by weekend or weekday. The national data also shows that bicycle crashes are lower on average on weekends.
FIGURE 32: MICHIGAN FATAL AND SERIOUS INJURY BICYCLE CRASHES BY DAY
151
213
197
220
197
199
169
0
50
100
150
200
250
Sunday Monday Tuesday Wednesday Thursday Friday Saturday
Michigan Department of Transportation Pedestrian and Bicycle Crash Data Analysis
38
5.6 CONDITIONS
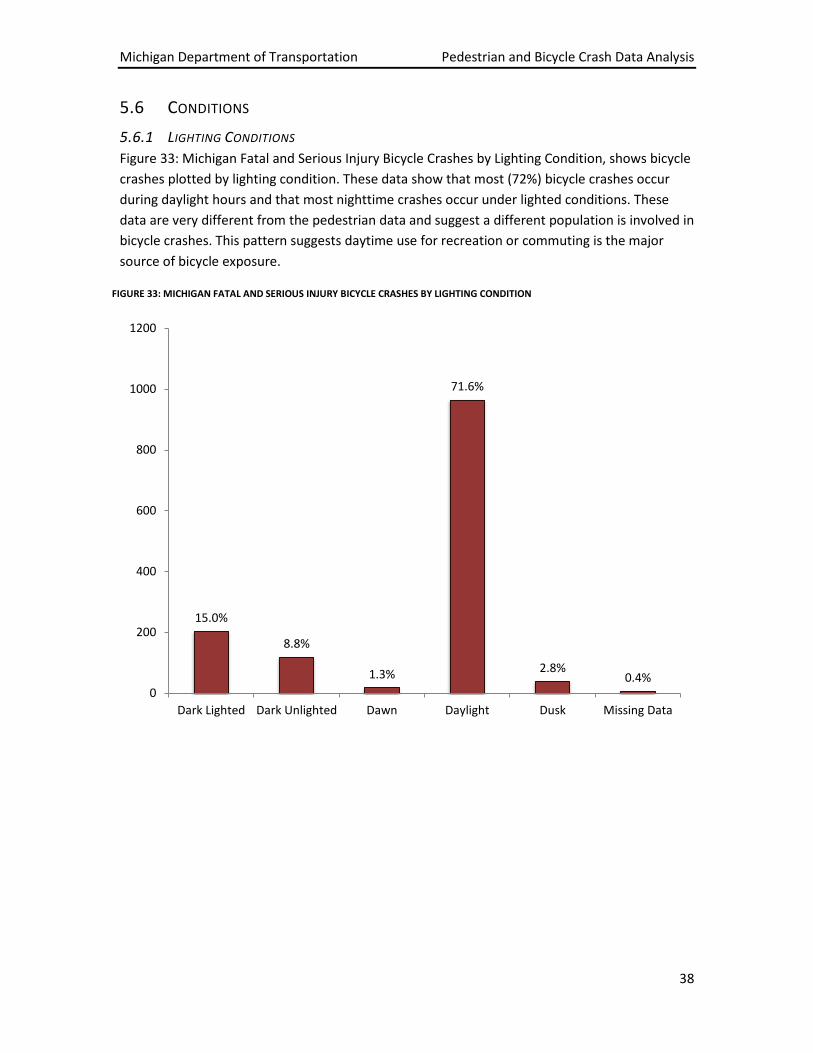
5.6.1 LIGHTING CONDITIONS Figure 33: Michigan Fatal and Serious Injury Bicycle Crashes by Lighting Condition, shows bicycle crashes plotted by lighting condition. These data show that most (72%) bicycle crashes occur during daylight hours and that most nighttime crashes occur under lighted conditions. These data are very different from the pedestrian data and suggest a different population is involved in bicycle crashes. This pattern suggests daytime use for recreation or commuting is the major source of bicycle exposure.
15.0%
8.8%
1.3%
71.6%
2.8% 0.4%
0
200
400
600
800
1000
1200
Dark Lighted Dark Unlighted Dawn Daylight Dusk Missing Data
FIGURE 33: MICHIGAN FATAL AND SERIOUS INJURY BICYCLE CRASHES BY LIGHTING CONDITION

Michigan Department of Transportation Pedestrian and Bicycle Crash Data Analysis
39
5.6.2 ROADWAY CONDITIONS Figure 34: Michigan Fatal and Serious Injury Bicycle Crashes by Roadway Condition, shows bicycle crashes as a function of roadway condition. Almost 90% of bicycle crashes occur when the roadway is dry and only 8% occur when the road is wet. These data suggest that exposure is low during very inclement weather. It is not surprising that people are less likely to bicycle under snowy, icy and slushy conditions.
FIGURE 34: MICHIGAN FATAL AND SERIOUS INJURY BICYCLE CRASHES BY ROADWAY CONDITION
89%
1%
8%
1%
0% 10% 20% 30% 40% 50% 60% 70% 80% 90% 100%
Dry
Snowy
Wet
Other/Unknown

Michigan Department of Transportation Pedestrian and Bicycle Crash Data Analysis
40
5.7 DRIVER AND BICYCLIST ACTIONS
Figure 35: Michigan Fatal and Serious Injury Bicycle Crashes by Driver Action, shows bicycle crashes by driver action for intersection-related crashes. These data show that through vehicles (34%), right turning vehicles (25%) and left turning vehicles (13%) are involved in most bicycle crashes at intersections. Slowing or stopping in the roadway are associated with the next highest category (10%). The role of turning vehicles is well understood but it is not clear from these data what percentage of through vehicle crashes involves right angle crashes.
FIGURE 35: MICHIGAN FATAL AND SERIOUS INJURY BICYCLE CRASHES BY DRIVER ACTION
3.1%
1.9%
0.3%
0.3%
0.7%
1.6%
9.5%
10.9%
12.8%
25.0%
33.8%
0% 5% 10% 15% 20% 25% 30% 35% 40%
Unknown
Other
Overtaking or passing
Parked
Entering or leaving parking
Entering roadway
Slowing/stopping on roadway
Starting up on roadway
Turning left
Turning right
Going straight ahead

Michigan Department of Transportation Pedestrian and Bicycle Crash Data Analysis
41
Figure 36: Michigan Fatal and Serious Injury Bicycle Crashes by Driver Action at Non-Intersections, shows bicycle crashes by driver action at non-intersection locations. These data show that more than half the drivers (55%) were going straight ahead at the time of the crash. Drivers making right and left turning maneuvers were only associated with 9% and 5% of crashes, respectively. One would expect fewer drivers make turning maneuvers at non-intersection locations, although actual exposure data are not available. Drivers entering the roadway or leaving parking accounted for 5% and 4% of crashes respectively.
FIGURE 36: MICHIGAN FATAL AND SERIOUS INJURY BICYCLE CRASHES BY DRIVER ACTION AT NON-INTERSECTIONS
4.4%
6.3%
1.8%
2.4%
3.9%
5.0%
5.2%
2.5%
4.5%
8.8%
54.5%
0% 10% 20% 30% 40% 50% 60%
Unknown
Other
Overtaking or passing
Parked
Entering or leaving parking
Entering roadway
Slowing/stopping on roadway
Starting up on roadway
Turning left
Turning right
Going straight ahead

Michigan Department of Transportation Pedestrian and Bicycle Crash Data Analysis
42
Figure 37: Michigan Fatal and Serious Injury Bicycle Crashes by Driver Action and Traffic Control, shows bicycle crashes by driver action at traffic signals, stop signs, and for uncontrolled intersections. These data show that nearly 15% of crashes involve vehicles traveling straight ahead at traffic signals. Because relatively few cyclists are typically hit from behind this indicates that cyclists are hit while turning right or left at the traffic signal. Nearly 17% of bicyclists are struck by motor vehicles traveling straight at stop signs.
A total of 23% of crashes involved motor vehicles travelling straight that were not at stop signs or at a traffic signal. These crashes may involve bicyclist turning or crossing the roadway at minor roads or other locations, cyclists turning in or out of minor roads, or cyclists turning in or out of driveways. It is surprising that there were few bicycle crashes with drivers turning right or left.
FIGURE 37: MICHIGAN FATAL AND SERIOUS INJURY BICYCLE CRASHES BY DRIVER ACTION AND TRAFFIC CONTROL
0%
5%
10%
15%
20%
25%
Going straight ahead Turning left Turning right Starting up on roadway
Signal
Stop Sign
None

Michigan Department of Transportation Pedestrian and Bicycle Crash Data Analysis
43
Figure 38: Bicycle Crashes by Bicyclist Action, shows bicycle crashes by bicyclist action at intersections and non-intersections for the top four actions. By far the most common action was a bicyclist going straight ahead. For intersection crashes, bicyclists going straight or “crossing at an intersection” accounted for over 75% of the crashes. Bicyclists turning left or right accounted for less than 4% of crashes in both intersection and non-intersection cases. With such a high percentage of bicyclists being struck while going straight ahead at non-intersections, one would expect the number of turning vehicles involved to have been higher. One possible explanation for this is that the bicyclist was travelling straight on the sidewalk and was struck at a driveway by a vehicle also travelling straight ahead. A closer examination of individual crash reports would be required to determine if a bicyclist involved in a crash was on the sidewalk.
FIGURE 38: BICYCLE CRASHES BY BICYCLIST ACTION
54.4%
25.3%
2.5% 5.0%
56.7%
6.0% 8.9% 6.3%
0%
10%
20%
30%
40%
50%
60%
Going Straight Ahead
Crossing at Intersection
Crossing not at Intersection
Entering Roadway
Intersection
Non-intersection

Michigan Department of Transportation Pedestrian and Bicycle Crash Data Analysis
44
5.8 ALCOHOL INVOLVEMENT
Fewer bicycle crashes involved alcohol than pedestrian crashes, and bicyclists were much less likely to be drinking than pedestrians. Figure 39: Michigan Fatal Bicycle Crashes Involving Alcohol, shows the bicycle crashes involving alcohol that resulted in a fatality. Twenty percent of these crashes involved a bicyclist drinking as opposed to 39% of the pedestrian crashes involving pedestrians drinking. Again, these data exclude hit-and-run drivers who may have been drinking. National statistics were not available for alcohol involvement in bicycle crashes.
FIGURE 39: MICHIGAN FATAL BICYCLE CRASHES INVOLVING ALCOHOL
5.9 HIT AND RUNS
Figure 40: Michigan Bicycle Crashes Involving Hit-and-Run Drivers, shows the breakdown of bicycle crashes that involve hit and run drivers. Compared to pedestrian crashes, hit and run drivers are involved in a smaller proportion of bicycle crashes. Seventeen percent of all bicycle crashes and 19% of all fatal bicycle crashes were hit and run crashes.
6% 10%
14%
70%
0%
10%
20%
30%
40%
50%
60%
70%
80%
Driver & Bicyclist Drinking
Driver Alone Drinking
Bicyclist Alone Drinking
No Alcohol Involved
17%
83%
Hit and Run
Non-Hit and Run
FIGURE 40: MICHIGAN BICYCLE CRASHES INVOLVING HIT-AND-RUN DRIVERS