Rb/Sr isotopic and compositional retentivity of muscovite ... the 87Rb/86Sr vs Sr/86Sr space. They...
18
Rb/Sr isotopic and compositional retentivity of muscovite during deformation T. Eberlei a, ⁎, G. Habler a,1 , W. Wegner a,2 , R. Schuster b,3 , W. Körner c,4 , M. Thöni a , R. Abart a,5 a Department of Lithospheric Research, University of Vienna, Althanstraße 14, A-1090 Vienna, Austria b Austrian Geological Survey, Neulinggasse 38, A-1030 Vienna, Austria c Department of Environmental Geosciences, University of Vienna, Althanstraße 14, A-1090 Vienna, Austria abstract article info Article history: Received 30 September 2014 Accepted 12 April 2015 Available online 25 April 2015 Keywords: Rb–Sr geochronology Permian metapegmatites Upper-greenschist facies deformation Magmatic muscovite Permian metapegmatite muscovite from the Upper-Austroalpine Matsch Unit in Southern Tyrol (Italy) was in- vestigated regarding its Rb/Sr and compositional retentivity during Cretaceous Upper-greenschist facies defor- mation. The data imply that microstructurally relic Permian magmatic muscovite largely maintained its major and trace element compositions during deformation, whereas the Rb/Sr geochronometer is strongly affected by a net loss of Sr. Lower Sr concentrations of muscovite correlate with higher 87 Rb/ 86 Sr and 87 Sr/ 86 Sr ratios. In most samples, the muscovite grain size- and magnetic-fractions with the lowest 87 Rb/ 86 Sr and 87 Sr/ 86 Sr ratios preserve a Permo-Triassic muscovite–whole rock Rb/Sr apparent age interpreted as to reflect formation during or cooling after pegmatite emplacement. Contrastingly, muscovite fractions with higher 87 Rb/ 86 Sr and 87 Sr/ 86 Sr ratios are arranged along a roughly linear array with a positive correlation of the 87 Rb/ 86 Sr and 87 Sr/ 86 Sr ratios in the 87 Rb/ 86 Sr vs 87 Sr/ 86 Sr space. They yield successively lower muscovite–whole rock Rb/Sr apparent ages. We explain the variations in the Rb/Sr isotopic character of microstructurally relic muscovite by a, presumably deformation-related, loss of Sr during the Cretaceous event. Contemporaneously, only very limited amounts of isotopically different Sr from the matrix reservoir might possibly have entered the muscovite. Consequently, the Rb/Sr of the relic muscovite is affected by a net loss of Sr. The results imply that at temperatures of b 500 °C, deformation is supposed to be the predominant factor in controlling the Rb/Sr geochronometer of relic muscovite, by significantly reducing the characteristic length scale for volume diffusion. However, variations of the major and trace element compositions within Permian relic muscovite are interpreted to rather reflect pri- mary compositional instead of deformation-related variations. © 2015 The Authors. Published by Elsevier B.V. This is an open access article under the CC BY license (http://creativecommons.org/licenses/by/4.0/). 1. Introduction As one of the most common minerals in the Earth's crust, muscovite is stable in various igneous and metamorphic rock types and a wide range of P–T conditions. The Rb–Sr geochronometer in muscovite has commonly been used to infer cooling, (neo-)crystallisation and recrystallisation ages, often in conjunction with the associated whole rock or other coexisting phases (e.g., Armstrong et al., 1966; Bröcker et al., 2013; Freeman et al., 1997; George & Bartlett, 1996; Glodny et al., 2003; Glodny et al., 2002; Glodny et al., 1998; Glodny et al., 2008; Jäger, 1967; Kühn et al., 2000; Müller et al., 1999, 2000; Thöni, 1981). The original concept of the ‘blocking’ or ‘closure’ temperature (Dodson, 1973; Jäger, 1967) implies that temperature is the rate-limit- ing factor for isotope mobility and that isotopes leaving the crystal by temperature-dependent volume diffusion are exchanged with an infi- nite reservoir. Other important factors are the effective diffusion do- main size (i.e., grain size), dynamic recrystallisation, the cooling rate, the diffusion coefficients for elements and isotopes in the mineral under investigation, the modal composition of a rock, the presence or absence of grain boundary fluids which could influence rates of material exchange with an infinite reservoir, chemical exchange among different minerals during cooling and the mineral composition (Ganguly & Ruiz, 1987; Glodny et al., 2003; Jenkin, 1997; Jenkin et al., 2001; Jenkin, Rogers et al., 1995; Villa, 1998; Yund & Tullis, 1991). For example, Kühn et al. (2000) found that biotite largely preserved its Neoproterozoic Rb–Sr ages in rocks which had experienced eclogite Lithos 227 (2015) 161–178 ⁎ Corresponding author. Tel.: +43 1 4277 53362. E-mail addresses: [email protected] (T. Eberlei), [email protected] (G. Habler), [email protected] (W. Wegner), [email protected] (R. Schuster), [email protected] (W. Körner), [email protected] (M. Thöni), [email protected] (R. Abart). 1 Tel.: +43 1 4277 53475. 2 Tel.: +43 1 4277 53104. 3 Tel.: +43 1 712 56 74 210. 4 Tel.: +43 1 4277 53120. 5 Tel.: +43 1 4277 53319. http://dx.doi.org/10.1016/j.lithos.2015.04.007 0024-4937/© 2015 The Authors. Published by Elsevier B.V. This is an open access article under the CC BY license (http://creativecommons.org/licenses/by/4.0/). Contents lists available at ScienceDirect Lithos journal homepage: www.elsevier.com/locate/lithos
Transcript of Rb/Sr isotopic and compositional retentivity of muscovite ... the 87Rb/86Sr vs Sr/86Sr space. They...

Lithos 227 (2015) 161–178
Contents lists available at ScienceDirect
Lithos
j ourna l homepage: www.e lsev ie r .com/ locate / l i thos
Rb/Sr isotopic and compositional retentivity of muscoviteduring deformation
T. Eberlei a,⁎, G. Habler a,1, W. Wegner a,2, R. Schuster b,3, W. Körner c,4, M. Thöni a, R. Abart a,5
a Department of Lithospheric Research, University of Vienna, Althanstraße 14, A-1090 Vienna, Austriab Austrian Geological Survey, Neulinggasse 38, A-1030 Vienna, Austriac Department of Environmental Geosciences, University of Vienna, Althanstraße 14, A-1090 Vienna, Austria
⁎ Corresponding author. Tel.: +43 1 4277 53362.E-mail addresses: [email protected] (T. Eberle
(G. Habler), [email protected] (W. Wegner), R(R. Schuster), [email protected] (W. Körner), m(M. Thöni), [email protected] (R. Abart).
1 Tel.: +43 1 4277 53475.2 Tel.: +43 1 4277 53104.3 Tel.: +43 1 712 56 74 210.4 Tel.: +43 1 4277 53120.5 Tel.: +43 1 4277 53319.
http://dx.doi.org/10.1016/j.lithos.2015.04.0070024-4937/© 2015 The Authors. Published by Elsevier B.V
a b s t r a c t
a r t i c l e i n f oArticle history:Received 30 September 2014Accepted 12 April 2015Available online 25 April 2015
Keywords:Rb–Sr geochronologyPermian metapegmatitesUpper-greenschist facies deformationMagmatic muscovite
Permian metapegmatite muscovite from the Upper-Austroalpine Matsch Unit in Southern Tyrol (Italy) was in-vestigated regarding its Rb/Sr and compositional retentivity during Cretaceous Upper-greenschist facies defor-mation. The data imply that microstructurally relic Permian magmatic muscovite largely maintained its majorand trace element compositions during deformation, whereas the Rb/Sr geochronometer is strongly affectedby a net loss of Sr. Lower Sr concentrations of muscovite correlate with higher 87Rb/86Sr and 87Sr/86Sr ratios. Inmost samples, the muscovite grain size- and magnetic-fractions with the lowest 87Rb/86Sr and 87Sr/86Sr ratiospreserve a Permo-Triassic muscovite–whole rock Rb/Sr apparent age interpreted as to reflect formation duringor cooling after pegmatite emplacement. Contrastingly, muscovite fractions with higher 87Rb/86Sr and 87Sr/86Srratios are arranged along a roughly linear array with a positive correlation of the 87Rb/86Sr and 87Sr/86Sr ratiosin the 87Rb/86Sr vs 87Sr/86Sr space. They yield successively lower muscovite–whole rock Rb/Sr apparent ages.We explain the variations in the Rb/Sr isotopic character of microstructurally relic muscovite by a, presumablydeformation-related, loss of Sr during the Cretaceous event. Contemporaneously, only very limited amounts ofisotopically different Sr from the matrix reservoir might possibly have entered the muscovite. Consequently,the Rb/Sr of the relic muscovite is affected by a net loss of Sr. The results imply that at temperatures ofb500 °C, deformation is supposed to be the predominant factor in controlling the Rb/Sr geochronometer ofrelicmuscovite, by significantly reducing the characteristic length scale for volumediffusion. However, variationsof themajor and trace element compositionswithin Permian relic muscovite are interpreted to rather reflect pri-mary compositional instead of deformation-related variations.
© 2015 The Authors. Published by Elsevier B.V. This is an open access article under the CC BY license(http://creativecommons.org/licenses/by/4.0/).
1. Introduction
As one of themost commonminerals in the Earth's crust, muscoviteis stable in various igneous and metamorphic rock types and a widerange of P–T conditions. The Rb–Sr geochronometer in muscovitehas commonly been used to infer cooling, (neo-)crystallisation andrecrystallisation ages, often in conjunction with the associated wholerock or other coexisting phases (e.g., Armstrong et al., 1966; Bröcker
i), [email protected]@[email protected]
. This is an open access article under
et al., 2013; Freeman et al., 1997; George & Bartlett, 1996; Glodnyet al., 2003; Glodny et al., 2002; Glodny et al., 1998; Glodny et al.,2008; Jäger, 1967; Kühn et al., 2000; Müller et al., 1999, 2000; Thöni,1981). The original concept of the ‘blocking’ or ‘closure’ temperature(Dodson, 1973; Jäger, 1967) implies that temperature is the rate-limit-ing factor for isotope mobility and that isotopes leaving the crystal bytemperature-dependent volume diffusion are exchanged with an infi-nite reservoir. Other important factors are the effective diffusion do-main size (i.e., grain size), dynamic recrystallisation, the cooling rate,the diffusion coefficients for elements and isotopes in the mineralunder investigation, the modal composition of a rock, the presenceor absence of grain boundary fluids which could influence rates ofmaterial exchange with an infinite reservoir, chemical exchangeamong different minerals during cooling and the mineral composition(Ganguly & Ruiz, 1987; Glodny et al., 2003; Jenkin, 1997; Jenkin et al.,2001; Jenkin, Rogers et al., 1995; Villa, 1998; Yund & Tullis, 1991). Forexample, Kühn et al. (2000) found that biotite largely preserved itsNeoproterozoic Rb–Sr ages in rocks which had experienced eclogite
the CC BY license (http://creativecommons.org/licenses/by/4.0/).

162 T. Eberlei et al. / Lithos 227 (2015) 161–178
facies conditions in the Ordovician at temperatures exceeding 650 °C,which they attributed to the absence of a free fluid phase during meta-morphism. The Rb–Sr isotopic system of cm-sized, undeformedmusco-vite from granitic metapegmatites in the western Bohemian massifremained closed at temperatures exceeding 600 °C (Glodny et al.,1998). Commonly reported closure temperatures for the Rb–Srgeochronometer in white micas are in the range of 500 °C to N600 °C(e.g., Blanckenburg et al., 1989; Freeman et al., 1997; Glodny et al.,2008; Purdy & Jäger, 1976). Glodny et al. (1998) also identified plasticdeformation at these temperatures in shear zones as cause for resettingthe Rb–Sr isotopic system of muscovites. In 40Ar–39Ar geochronology, itis well known, that dislocations, subgrain boundaries, kinks and stack-ing faults can act as fast-diffusion pathways and therefore influencethe Ar-retentivity of crystals at temperatures below the closure temper-ature of Ar diffusion for pristine crystals of a given size (e.g., Baldwin &Lister, 1998; Cosca et al., 2011; Dunlap & Kronenberg, 2001; Hames &Cheney, 1997; Kramar et al., 2003; Mulch et al., 2002; Reddy et al.,1996). It is also known, that cryptic recrystallisation during metamor-phism can influence the Ar-retentivity (Beltrando et al., 2013).
Permian metapegmatites in the Austroalpine Matsch Unit (Ötztal–Stubai Basement Complex, OSC) in Southern Tyrol (Italy) were over-printed by localised shear deformation at upper-greenschist faciesconditions of c. 500 °C and 5 kbar during the Cretaceous Eo-Alpinetectonometamorphic event (Habler et al., 2009; Schmid & Haas,1989). Therefore, the Permian metapegmatites provide excellent natu-ral examples to study the Rb–Sr isotopic and compositional retentivityof coarse-grained microstructurally relic muscovite clasts and themechanisms affecting their Rb–Sr system during deformation. For thispurpose, we used different bulk mineral separates from several handspecimens (6 in total). Different muscovite grain-size and magnetic-fractions were used for the combined analysis of Rb and Sr by ID-TIMSand the major and trace elements by EPMA, ICP-OES and ICP-MS. Thenew data provide insights into the behaviour of the Rb–Sr system andmajor and trace elements in Permian muscovite porphyroclasts duringCretaceous deformation.
2. Geological setting
Samples of Permian metapegmatites were collected in the MatschUnit in Southern Tyrol (Italy). A list of studied samples with UTM coor-dinates (UTM Zone 32T, WGS84) is given in Table 1. The Matsch Unit islocated at the southernmargin of the Upper-Austroalpine Ötztal–StubaiCrystalline complex (OSC, Fig. 1a). The km-wide ‘Vinschgau Shear Zone’(Schmid & Haas, 1989) defines its southern tectonic boundary. Eo-Alpine T-conditions are supposed to gradually increase fromW to E inshear direction of the Vinschgau Shear Zone. The predominant lithologiesin theMatsch Unit are biotite–sillimanite gneisses and garnet–staurolite–two mica schists with frequently intercalated Permian metapegmatites(Fig. 1b–c, Ratschiller, 1953). Cretaceous deformation is localised inshear zones and characterised by north-dipping foliations, E–W trendingfold axes and stretching lineations of quartz and feldspar, locally varying
Table 1Sampling locations (UTM Zone 32T, WGS 84) of the studied samples. Sampling locationsare givenwith an accuracy of±10m. They are also shownwithwhite stars in Fig. 1a. Notethat HM00305 and the three samples M1203, M1201 and M1206 are from differentoutcrops of the same pegmatite body (cf. Fig. 1c).
Sample Rock type North [m] East [m] Altitude [m]
M1210 Meta-pegmatite 5,170,589 640,300 2830M1217 Meta-pegmatite 5,170,206 640,396 2680HM00305 Protomylonitic meta-pegmatite 5,170,494 641,263 2596M1203 Protomylonitic meta-pegmatite 5,170,319 640,984 2624M1201 Mylonitic meta-pegmatite 5,170,319 640,984 2624M1206 Ultramylonitic meta-pegmatite 5,170,310 640,963 2620
gradients of finite-strain at the cm- tom-scale and top-W shear kinemat-ics (Schmid &Haas, 1989). The polymetamorphic evolution of theMatschUnit is characterised by Carboniferous amphibolite facies regional meta-morphism, a Permian HT/LP event related with pegmatite formationand finally upper-greenschist facies tectonometamorphism culminatingin P–T conditions of 480 ± 26 °C at 4 ± 1.6 kbar (Habler et al., 2009).The timing of pegmatite emplacement was constrained to 263–280 Maby Sm–Nd garnet–whole rock data (Habler et al., 2009). Eo-Alpine defor-mationwas dated at 83±1Mabased onRb–Sr thin slab data ofmyloniticmeta-pegmatites (Thöni, 1986). Eo-Alpine metamorphism in the OSCformed a sequence of NE–SW trending mineral zones which docu-ment increasing Cretaceous metamorphism from NW to SE by:(i) a zone without Cretaceous metamorphic mineral content, (ii) aStilpnomelane zone, (iii) a Chloritoid zone (Purtscheller, 1967)and (iv) the Eo-Alpine Staurolite zone (Thöni, 1981, 1983). Thesezones correlate with characteristic K–Ar and Rb–Sr biotite ages(Thöni, 1981). Zone (i) correlates with Carboniferous biotite coolingages (Fig. 1a). The stilpnomelane and chloritoid zones are characterisedby opening and incomplete resetting of the K–Ar isotopic system in bio-tite, or excess 40Ar in biotite (Fig. 1a, Thöni, 1981) whereas the zone ofEo-Alpine staurolite correlates with Late Cretaceous biotite cooling ages.Regarding the regional distribution of Cretaceous minerals, the studiedrocks of theMatschUnit are part of the chloritoid zone,wherefrombiotiteK–Ar isotopic data showeddisturbance but no complete Cretaceous isoto-pic resetting (Thöni, 1981, 1983).
The metapegmatites are commonly intercalated in biotite–sillimanitegneisses, rarely in Grt–St micaschist (Fig. 1b–c). The primary magmaticmineral assemblage of the pegmatites consists of quartz +albite +muscovite± garnet±K-feldspar± apatite± accessory zircon andmon-azite. The metamorphic mineral assemblage contains albite +quartz +muscovite ± K-feldspar ± apatite ± biotite ± garnet ± clinozoisite/allanite. Despite intense deformation, muscovite and feldspar clastsof the primary magmatic mineral assemblage were preserved as mi-crostructural relics.
3. Analytical methods
3.1. Electron microprobe (EPMA)
Compositional mineral analyses were performed at the Departmentof Lithospheric Research at the University of Vienna using a CamecaSX100 instrument with an acceleration voltage of 15 keV, a beam cur-rent of 20 nA and a beam diameter of 3 μm for white mica and apatiteand 6 μm for feldspar. Natural and synthetic standards were used forcalibration. The PAP routine (Pouchou& Pichoir, 1991)was used forma-trix corrections. Mineral formulae of white mica are normalised to 11oxygen and assuming all Fe as Fe2+. Element distribution maps wereobtained by continuous stage movement with dwell times of 40 msand a step size of 1 μm. Representative muscovite analyses are givenin Table 2.
3.2. Rb/Sr isotope dilution analysis (ID-TIMS)
Selected rock samples were crushed in a jaw crusher and a roll mill,and sieved. Whole rock splits were taken after crushing the kg-sizedsamples. White mica concentrates were obtained by using a vibratingtable, repeated grinding in ethanol and sieving, magnetic purificationon a Frantz isodynamic magnetic separator and washing in acetone.Subsequently impurities were removed by handpicking under an opti-cal microscope, increasing the optical purity to N99%. Different well-de-fined primary grain size- and magnetic-fractions were produced (seeTable 3).
For isotope dilution analysis, 100–200mgof eachmuscovite concen-trate was weighed into Savillex® screw top beakers, mixed with a87Rb–84Sr spike and dissolved in a 4:1 HF/HNO3 mixture on a hot platefor 2weeks at 110 °C. Rb and Srwere extracted applying standard cation

Fig. 1. (a) Simplified geological sketchmap of the Upper-Austroalpine Ötztal–Stubai Crystalline complex based on Schmid et al., (2004) and Thöni (1981). Abbreviations: EW=Engadinewindow; TW=Tauernwindow; OSC=Ötztal–Stubai Complex; SC= Schneeberg Complex; TC= Texel Complex; MU=Matsch Unit. (b) Simplified sketchmap of the eastern portion oftheMatsch Unit (based on Habler et al., 2009) with white stars marking the locations of the four sampledmeta-pegmatite bodies (cf. Table 1). (c) Representativemetapegmatite outcropwithin the biotite–sillimanite gneisses. Coordinates are UTM Zone 32T, WGS 84.
163T. Eberlei et al. / Lithos 227 (2015) 161–178
exchange techniques. Sr isotope ratios weremeasured on a FINNIGAN®Tritonmulticollector thermal ionisationmass spectrometer.Within-runmass-dependent Sr isotope fraction was corrected for with 86Sr/88Sr =0.1194. The 87Rb/85Rb ratio was measured on a FINNIGAN® MAT262mass spectrometer. Both instruments are part of the Laboratory ofGeochronology at the University of Vienna. During the 9-month mea-suring period, the 87Sr/86Sr value of the NBS standard SRM 987 was0.710269 ± 4 (2σ, n = 17). Total procedural blanks of Rb and Sr wereconsistently below 0.03 ng. By default, a 1% relative error is assignedto the 87Rb/86Sr ratio. All other errors are quoted on the 2σ level (95%confidence). Age calculations are based on a 87Rb decay constant of1.42 ∗ 10−11 a−1 (Steiger & Jäger, 1977). A second aliquot of each mus-covite concentrate was used for the production of a mineral separateembedded in epoxy resin. Polished thin sections prepared from the em-bedded separates were used for major element compositional analysiswith the electron microprobe.
3.3. Major and trace element analyses by ICP-OES/MS
A third aliquot of separatedmuscovite fractions and thewhole rockswas used for major and trace element analyses by ICP-OES and ICP-MS.Selected elements (K, Na, Ca, P, Be, Li, Cs, REE) were measured on anAgilent 7700 Series inductively coupled mass spectrometer (ICP-MS)and a PerkinElmer Optima 5300 DV inductively coupled optical emis-sion spectrometer instrument (ICP-OES) at the Department of Envi-ronmental Sciences at the University of Vienna. REE was exclusivelyanalysed by ICP-MS. Standards were run at the end of each measuringcycle. The reproducibility of the standards is generally better than 20%.
4. Results
4.1. Sample description
For the isotopic and compositional analyses, 6 samples from fourdifferent pegmatite outcrops have been selected (Table 1). Four ofthem stem from a single proto- to ultra-mylonitic meta-pegmatitelayer (Fig. 1c) of about 1.5 m thickness and extending laterally overN100 m. Deformation intensity increases across this meta-pegmatitelayer towards the footwall (Fig. 1c). The latter also shows pronouncedgrain-size reduction especially of albite, K-feldspar, muscovite and – ifpresent – garnet (Fig. 2). The remaining two were sampled from twodifferent pegmatite bodies about 25 m (sample M1217) and 450 m(sample M1210) structurally above the former outcrop, estimated ap-proximately normal to the mylonitic foliation. Sample M1210 stemsfrom the centre of a massive, largely undeformed metapegmatite bodyand M1217 was collected near the core of a massive, weakly foliatedmetapegmatite. Whereas samples M1210 and M1217 stem from posi-tions at some distance from a Cretaceous shear zone, the remainingsamples HM00305, M1203, M1201 and M1206 stem from a Cretaceoushigh strain zone localised within meta-pegmatite at the lithologicalboundary between Bt–Sill gneiss and orthogneiss (Figs. 1 and 2).
4.1.1. MuscovitePermian magmatic relic muscovite generally occurs as cm- to mm-
sized porphyroclasts, with decreasing grain-size from the undeformedmetapegmatite M1210 (N1 cm) to the ultramylonite M1206 (b500 μm;Fig. 2a–f). Several samples show prominent kinks with kink band widthsof several hundred μm((1) in Fig. 2a,c,e). Additionally,muscovite clasts in

Table 2Representative EPMA analyses of muscovite.
Wm group I II III I II III I II III I II III I II III
Generation Permian Cretaceous Cretaceous Permian Cretaceous Cretaceous Permian Cretaceous Cretaceous Permian Cretaceous Cretaceous Permian Cretaceous Cretaceous
Sample M1217 HM00305 M1203 M1201 M1206
Position Clast Clast rim Matrix Clast Clast rim Matrix Clast Clast rim Matrix Clast Clast rim Matrix Clast Clast rim Matrix
SiO2 45.93 47.24 46.38 45.62 46.71 48.18 45.52 46.76 47.36 45.87 47.00 46.13 47.01 47.25 46.76TiO2 0.09 0.08 0.08 0.05 0.04 0.02 0.08 0.18 0.08 0.01 0.11 0.10 1.35 0.43 0.01Al2O3 35.68 32.43 34.47 36.25 32.29 32.60 35.37 31.13 30.98 36.95 34.35 35.14 34.52 31.75 32.67Cr2O3 0.01 0.00 0.00 0.00 0.00 0.00 0.00 0.00 0.01 0.00 0.00 0.00 0.00 0.00 0.00FeO 2.48 3.52 2.60 2.16 3.92 4.23 2.17 4.94 4.44 1.29 2.71 2.51 3.44 4.23 4.25MnO 0.00 0.02 0.01 0.00 0.03 0.04 0.01 0.04 0.02 0.02 0.03 0.01 0.01 0.00 0.02MgO 0.42 1.01 0.67 0.30 0.67 1.02 0.35 1.07 1.12 0.38 0.75 0.50 0.47 0.65 0.48CaO 0.01 0.08 0.03 0.01 0.00 0.00 0.00 0.00 0.00 0.00 0.00 0.01 0.00 0.00 0.00Na2O 0.25 0.17 0.34 0.40 0.20 0.17 0.38 0.25 0.12 0.59 0.49 0.53 0.35 0.35 0.45K2O 10.83 10.48 10.73 10.69 10.56 10.19 10.80 10.77 11.10 10.70 10.38 10.26 10.64 10.57 10.23Total 95.69 95.02 95.30 95.48 94.42 96.46 94.69 95.14 95.22 95.81 95.81 95.18 97.79 95.24 94.88Oxygens 11.00 11.00 11.00 11.00 11.00 11.00 11.00 11.00 11.00 11.00 11.00 11.00 11.00 11.00 11.00Si 3.06 3.18 3.11 3.04 3.18 3.20 3.07 3.18 3.21 3.04 3.13 3.09 3.08 3.19 3.16Ti 0.00 0.00 0.00 0.00 0.00 0.00 0.00 0.01 0.00 0.00 0.01 0.00 0.07 0.02 0.00Al 2.80 2.57 2.72 2.85 2.59 2.55 2.81 2.50 2.48 2.88 2.69 2.77 2.67 2.53 2.61Cr 0.00 0.00 0.00 0.00 0.00 0.00 0.00 0.00 0.00 0.00 0.00 0.00 0.00 0.00 0.00Fe-II 0.14 0.20 0.15 0.12 0.22 0.23 0.12 0.28 0.25 0.07 0.15 0.14 0.19 0.24 0.24Mn 0.00 0.00 0.00 0.00 0.00 0.00 0.00 0.00 0.00 0.00 0.00 0.00 0.00 0.00 0.00Mg 0.04 0.10 0.07 0.03 0.07 0.10 0.04 0.11 0.11 0.04 0.07 0.05 0.05 0.07 0.05Ca 0.00 0.01 0.00 0.00 0.00 0.00 0.00 0.00 0.00 0.00 0.00 0.00 0.00 0.00 0.00Na 0.03 0.02 0.04 0.05 0.03 0.02 0.05 0.03 0.02 0.08 0.06 0.07 0.04 0.05 0.06K 0.92 0.90 0.92 0.91 0.92 0.86 0.93 0.93 0.96 0.90 0.88 0.88 0.89 0.91 0.88Total 7.01 6.99 7.01 7.01 7.00 6.97 7.01 7.05 7.03 7.01 6.99 7.00 6.99 7.00 7.00
164T.Eberleietal./Lithos
227(2015)
161–178

Table 3ID-TIMS Rb/Sr analytical results for the Permianmetapegmatites and thewell-defined grain size- andmagnetic-fractions ofmuscoviteWm I. FeO-concentrations are themean of up to 50EPMA-analyses from the embedded aliquots. A Frantz isodynamicmagnet separatorwith chute inclinations relative to horizontal of 10–13°was used formagnetic purification (n.m.=notmeasured; nm= non-magnetic at□Volts; m=magnetic at□Volts; Rb–Sr muscovite–whole rock apparent ages have been calculated with a decay constant of 1.42 ∗ 10−11 a−1). Fromtop to bottom, samples are ordered by deformation intensity.
Sample no. Material FeO [wt.%] (n = 50) Rb [ppm] Sr [ppm] 87Rb/86Sr 87Sr/86Sr 2σ error on 87Sr/86Sr Wr–Ms age in Ma 2σ
Meta-pegmatiteM1210TE-F0 Whole-rock 184 18.30 29.7 0.938380 0.000007TE-F1 Ms 250–450 μm; nm 28 V 1.39 737 2.03 1525 5.343540 0.000034 207.2 ± 2.1TE-F2 Ms 250–450 μm; m 28 V n.m. 747 2.55 1230 5.283590 0.000060 254.6 ± 2.6TE-F3 Ms N450 μm; m 32 V 1.42 739 1.68 1925 5.917890 0.000073 184.8 ± 1.8TE-F4 Ms N450 μm; nm 42 V 1.39 740 1.91 1652 5.560900 0.000089 200.3 ± 2.0TE-F5 Ms N450 μm; m 42 V 1.41 723 1.61 1954 5.807510 0.000040 177.9 ± 1.8
Meta-pegmatiteM1217TE-B0 Whole-rock 143 32.67 12.8 0.775608 0.000004TE-B1 Ms 250–450 μm; nm 28 V 1.75 683 4.56 504 2.360024 0.000021 226.8 ± 2.3TE-B2 Ms 250–450 μm; m 28 V n.m. 659 5.45 398 2.098390 0.000012 241.6 ± 2.4TE-B3 Ms N450 μm; m 32 V 2.13 688 4.51 514 2.399020 0.000033 227.6 ± 2.3TE-B4 Ms N450 μm; nm 42 V 1.69 699 4.24 562 2.524294 0.000033 223.7 ± 2.2TE-B5 Ms N450 μm; m 42 V 1.95 691 4.98 470 2.468850 0.000061 260.2 ± 2.6
Meta-pegmatiteHM00305TE-A0 Whole-rock 115 8.10 41.5 0.850000 0.000024TE-A1 Ms N250 μm (125–250); m 40 V n.m. 504 1.61 1316 5.358590 0.000040 248.8 ± 2.5TE-A2 Ms N250 μm (100–125); nm 40 V n.m. 521 1.47 1528 5.720270 0.000066 230.3 ± 2.3TE-A3 Ms N250 μm (125–250); nm 40 V n.m. 514 1.22 1913 6.484900 0.000132 211.7 ± 2.1
Meta-pegmatiteM1203TE-C0 Whole-rock 104 50.88 5.95 0.750029 0.000003TE-C1 Ms 250–450 μm; nm 28 V 1.74 468 3.18 476 1.909100 0.000079 173.5 ± 1.7TE-C2 Ms 250–450 μm; m 28 V 2.25 463 4.21 352 1.787880 0.000014 210.8 ± 2.1TE-C3 Ms N450 μm; m 32 V 2.25 470 4.77 317 1.843320 0.000025 246.9 ± 2.5TE-C4 Ms N450 μm; nm 42 V 1.83 481 3.50 449 2.014660 0.000024 200.9 ± 2.0TE-C5 Ms N450 μm; m 42 V 1.93 473 3.58 428 1.910080 0.000056 193.5 ± 1.9
Meta-pegmatiteM1201TE-E0 Whole-rock 91 54.11 4.86 0.747920 0.000005TE-E1 Ms 250–450 μm; nm 28 V 1.54 503 4.70 339 1.675110 0.000002 195.0 ± 1.9TE-E2 Ms 250–450 μm; m 28 V n.m. 489 4.35 354 1.627210 0.000024 177.0 ± 1.8TE-E3 Ms N450 μm; m 32 V 1.51 519 3.32 508 1.944220 0.000026 167.4 ± 1.7TE-E4 Ms N450 μm; nm 42 V 1.45 526 3.61 474 1.975890 0.000004 184.1 ± 1.8TE-E5 Ms N450 μm; m 42 V 1.53 495 2.98 542 1.989970 0.000020 162.7 ± 1.6
Meta-pegmatiteM1206TE-D0 Whole-rock 143 54.40 7.64 0.776630 0.000004TE-D1 Ms N250 μm; nm 20 V n.m. 927 8.88 329 1.627490 0.000015 186.0 ± 1.9
165T. Eberlei et al. / Lithos 227 (2015) 161–178
several samples contain numerous microkinks with lengths ofb20–30 μm and slight lattice bendings as displayed by undulose ex-tinction in polarised light microscope images ((2) in Fig. 2a,c,d). Ac-cording to Bell et al., (1986), kinks are generally associated withdislocations and cleavage cracks parallel to muscovite (001). Thestrong lattice deformation along the kink axial planes is associatedwith a fine-grained (b50 μm) muscovite generation ((3) inFig. 2a,b). Additionally in the deformed samples, fine-grained mus-covite is also present in the quartzo-feldspathic rock matrix, defin-ing a weak to strong mylonitic foliation by its shape preferredorientation (Fig. 2c–f). However, in none of the samples a correla-tion between clast grain-size and presence/absence of large kinksor microkinks was observed. Coarse-grained clasts in a few samples(M1210 and M1217) contain numerous, μm-sized, acicular inclu-sions of Fe-oxides and -sulphides with a clear shape preferred orien-tation parallel to muscovite (001) ((4) in Fig. 2a,b) and small(b20 μm), euhedral apatite crystals. In none of the samples, a spatialcorrelation between presence/absence of such inclusions and kinksof any size was found. Several clasts show evidence for grain-scalecracking at high angles to muscovite (001) ((5) in Fig. 2b,c).
4.1.2. QuartzQuartz microstructures indicate recovery by subgrain rotation and
grain boundary migration recrystallisation, with decreasing grain-sizeof the recrystallised quartz grains from the largely undeformed meta-pegmatite M1210 to the ultramylonite. The quartz grain-size decreasesfrom a few hundred μm inM1210 to b40 μm inM1206 (Fig. 2). Assum-ing constant temperatures during the Cretaceous tectonometamorphicevent, this is explained by substantially higher strain-rates in theultramylonitic sample M1206, compared to M1210 (cf. Stipp et al.,2002). Additionally, the mylonitic foliation, as expressed by the shapepreferred orientation of the small muscovite generation, is also pre-served in a weak shape preferred orientation of quartz.
4.1.3. FeldsparAlbite and K-feldspar have survived the intense Cretaceous mylo-
nitisation as clasts that range in size from N1 cm in M1210 to b500 μmin M1206 (Fig. 2). Furthermore, both feldspars preserve evidence for ex-tensive dissolution–precipitation, producing grain-sizes of b50 μm, thattend to decrease fromM1210 toM1206. Together with alternating layers

Fig. 2.Representativemicrostructures of (a)M1210, (b)M1217, (c) HM00305, (d)M1203, (e)M1201 and (f)M1206. Note the intense grain-size reduction of clasts and in thematrixwithincreasing deformation intensity from (a) to (f). Numbers in round brackets highlight specific microstructures discussed in the text.
166 T. Eberlei et al. / Lithos 227 (2015) 161–178
of quartz, muscovite and fractured garnet (b100 μm), these delineate amylonitic foliation in the high-strain samples (e.g., Fig. 2c–f).
4.2. Muscovite generations and mineral assemblages
Based on backscatter electron images and element mapping 3 dis-tinct groups of white mica have been identified in all samples (Fig. 3).
Core-domains of coarse-grained Permian magmatic muscovite clastshave unaltered primary major element composition (Wm I). Thesehave compositionally altered rims (Wm II) which are separated fromWm I by compositional fronts with sharp transitions (e.g., Fig. 3i). WmII is microstructurally not distinguishable from Wm I, but may alsoform alteration zones within the interior of coarse-grained clasts. WmII occurs immediately adjacent to (001) cleavage planes (Fig. 3b) and

Fig. 3. (a–b) BSE images of sample HM00305 showing the different muscovite groups (Wm I–III), their inclusions and the related syntectonic phase assemblage including WM III.(c) Photomicrograph with crossed polarised light showing a kinked and fractured Ms-clast of sample M1203. (d–f) Quantitative element maps showing (d) Fe- ,(e) Mg- and (f) Na-distribution in the area highlighted in panel (c). (g–h) Quantitative element maps of a mm-sized Permian muscovite clast from sample M1217 showing (g) Fe- and (h) Mg-distributionrelated to the differentmuscovite groups. Note, theweak compositional difference betweenWm II associatedwith the clast-internal domain (crack) and theWm II along the rims, possiblyrepresenting different generations of Wm II. (i) Detailed BSE-image of a sharp transition front between Wm I andWm II (head of black arrow) in sample HM00305.
167T. Eberlei et al. / Lithos 227 (2015) 161–178

Fig. 3 (continued).
168 T. Eberlei et al. / Lithos 227 (2015) 161–178
along fractures (Fig. 3c–h). The microstructurally characteristic fine-grained (b50 μm) third muscovite group (Wm III) constitutes themylonitic rock matrix, forms overgrowths on Wm I (Fig. 3a–b) andnewly crystallised along kink axial planes.
Qualitative EDX analysis in SEM in combination with BSE imagingshowed that μm-sized inclusions of allanite, biotite and apatite areoften related with the compositionally altered rimsWm II of the Perm-ian muscovite clasts Wm I (Fig. 3a,b). Furthermore, the syntectonicphase assemblage muscovite (Wm III), fine-grained K-feldspar, biotite,apatite, albite and quartz adjacent to the muscovite clasts has beenidentified in the mylonitic rock matrix and in strain shadows of Wm Iclasts (Fig. 3a,b).
4.3. Mineral composition
4.3.1. MuscoviteRepresentative compositions of muscovite groups Wm I, Wm II and
Wm III derived from EMPA are given in Table 2.
4.3.1.1. Wm I — Permian magmatic muscovite. The cm-sized Permianmagmatic muscovite grains are compositionally close to the puremuscovite endmember with b3.1 Si c.p.f.u. (cations per formulaunit), N2.7 Al c.p.f.u., and commonly less than 0.2 Fe2+ c.p.f.u. andb0.04 Mg2+ c.p.f.u. (Fig. 4, Table 2).
4.3.1.2.Wm II— compositionally overprinted rims ofWm I.WmII portionsof coarse grained clasts are commonly richer in Fe with Fe2+ c.p.f.u. inthe range 0.15–0.3. Si typically ranges from 3.1 to 3.2 Si c.p.f.u. withsome exceptions of Si c.p.f.u. N3.2 (Fig. 4, Table 2). Wm II and Wm IIIare compositionally identical (Fig. 4). However, small compositionalfluctuations within Wm II may also exist. An example for this isdisplayed by one mm-sized muscovite clast in sample M1217. Here, agrain-scale crack in that clast is associated with Wm II that is slightlypoorer in Fe and Mg, compared to Wm II on the clasts rim (Fig. 3g–h).Wm II forms 10–40 micrometre thick rims of Wm I and is separatedfrom the latter by sharp compositional fronts (e.g., Fig. 3i).
4.3.1.3. Wm III — matrix muscovite. Mylonitic matrix muscovite is oftencompositionally indistinguishable from Wm II (Figs. 3–4, Table 2). Inall medium- and low-strained samples, Wm II and Wm III have signifi-cantly higher Al-celadonite contents (elevated Fe and Si contents) thanWm I allowing for a clear distinction between primary magmatic mus-covite (Wm I) andmuscovite-fractions formed during themetamorphicoverprint (Wm II, Wm III). Contrastingly, the highly strained samplesM1201 andM1206 display awider scatter of theWmII andWm III com-positions, causing an overlapping compositional range of the micro-structurally different muscovite generations (Fig. 4).
4.3.2. Embedded muscovite separatesMuscovite separates from samples M1210, M1217, M1203 and
M1201 were embedded in epoxy resin and analysed by EMPA inorder to detect a potential contribution of the metamorphic musco-vite fractions (Fig. 5). The EMPA data from embedded separatesshowed that all different muscovite grain size and magnetic frac-tions consist exclusively of Wm I (Fig. 5). The embedded materialis characterised by relatively low Si (b3.1 Si c.p.f.u.) and low Fe(b0.15 Fe2+ c.p.f.u.). Only in the high-strain sample M1201, thereis a compositional overlap with Wm II and Wm III as indicated bythe grey areas that are shown to highlight the compositional rangeof these 2 groups which have been derived from grains during thinsection analyses (Fig. 5). Contributions from other phases and sub-microscopic mineral inclusions were not observed in the embeddedmuscovite separates, although a potential contribution of sub-μmsized feldspar, apatite or zoisite/allanite inclusions can never be ex-plicitly excluded. The mean FeO concentrations of up to 50 singlespot analyses of individual grains for each fraction are given inTable 2. Some data show a weak correlation of FeO concentrationwith magnetic susceptibility, thus pointing to the role of Fe in con-trolling the magnetic properties of the analysed material. For sam-ple HM00305, there was only sufficient muscovite material forisotopes, leaving nothing for further EPMA analysis.
4.3.3. Apatite and feldsparSample HM00305 contains fine-grained (b20 μm) euhedral apatite
crystals, spatially related to the syntectonic phase assemblage (Fig. 3a–b). Some of these supposedly Cretaceous apatite crystals are rich in fluo-rine (1.1–3.3 wt.% F), poorer in chlorine (b0.4 wt.% Cl) and containsmall concentrations of Sr (~0.01wt.% SrO) as determinedby electronmi-croprobe analysis. Albite grains from a different microdomain within thesame thin section formed by dissolution–precipitation and also containsome Sr (~0.02–0.05 wt.% SrO).

Fig. 4.Muscovite compositional data by EMPA ofWm I (blue diamonds), Wm II (red squares), Wm III (green triangles) of (a–b) M1217, (c–d) HM00305, (e–f) M1203, (g–h)M1201 and(i–j) M1206. Note the compositional overlap of different generations in the high-strain samples M1201 and M1206. For legend, see panel a.
169T. Eberlei et al. / Lithos 227 (2015) 161–178

Fig. 5. EMPA compositional data of embeddedmuscovite separates ofWm I used for Rb/Sr ID-TIMS analysis of (a–b)M1210, (c–d)M1217, (e–f)M1203 and (g–h)M1201. Grey areas limitthe compositional range ofWm II andWm III determined by EMPA from thin sections of rock chips. Note the overlap of this fieldwith data fromWm I separates inM1201 (g–h) (cf. Fig. 4).Sample HM00305 was not analysed as the separated Wm I did not provide enough material for an additional aliquot. See text for discussion.
170 T. Eberlei et al. / Lithos 227 (2015) 161–178
4.4. Isotope, major and trace element data (ICP-MS and ID-TIMS)
4.4.1. Permian metapegmatite bulk compositionsPermian metapegmatites are Si-rich rocks (N73 wt.% SiO2) with
moderate Al-concentrations (12.5–15 wt.% Al2O3). Their K/Rb ratiosare 130–250, while Rb/Cs ratios range at 15–80. At Li-concentrationsof 16–30 ppm their REE-contents are generally below 1–2 ppm. InM1203, M1201 and M1206, the concentrations of La, Ce and Nd areslightly elevated (up to 11.5 ppm, Table 4). Their chondrite-normalisedREE-pattern shows no significant fractionation (Cen/Ybn b 5) except theweakest deformed sample M1210 (TE-F0) in which Cen/Ybn = 32(Fig. 6a). The ultramylonite sample M1206 has REE-concentrations
about one order of magnitude larger than the other samples. Apartfrom that, no relation between intensity of deformation and REE-con-tents in the bulk samples was observed. Some samples exhibit a weaknegative Eu-anomaly (HM00305,M1210,M1206),while the other sam-ples do not show significant anomalies (Fig. 6a).
Concerning the composition of different muscovite fractions,their Li- and Cs-contents are increasing with decreasing K/Rb ratios(Fig. 6b–c), while with increasing Sr-concentrations the K/Rb alsoincreases (Fig. 6d). The Sr-concentration of muscovite from sampleM1210 are slightly lower than in the remainder of the investigated sam-ples, which is consistent with the significantly lower Sr-concentration ofthe correspondingwhole rock (18.3ppm inM1210, Table 2) and resulting
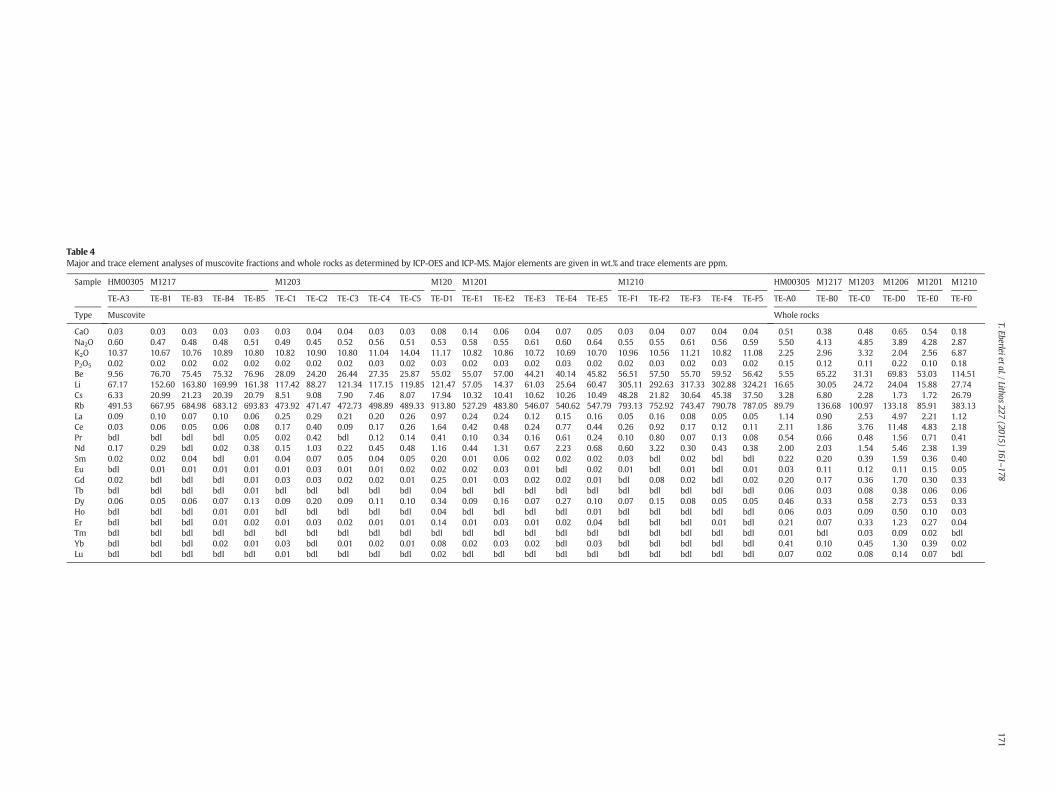
Table 4Major and trace element analyses of muscovite fractions and whole rocks as determined by ICP-OES and ICP-MS. Major elements are given in wt.% and trace elements are ppm.
Sample HM00305 M1217 M1203 M120 M1201 M1210 HM00305 M1217 M1203 M1206 M1201 M1210
TE-A3 TE-B1 TE-B3 TE-B4 TE-B5 TE-C1 TE-C2 TE-C3 TE-C4 TE-C5 TE-D1 TE-E1 TE-E2 TE-E3 TE-E4 TE-E5 TE-F1 TE-F2 TE-F3 TE-F4 TE-F5 TE-A0 TE-B0 TE-C0 TE-D0 TE-E0 TE-F0
Type Muscovite Whole rocks
CaO 0.03 0.03 0.03 0.03 0.03 0.03 0.04 0.04 0.03 0.03 0.08 0.14 0.06 0.04 0.07 0.05 0.03 0.04 0.07 0.04 0.04 0.51 0.38 0.48 0.65 0.54 0.18Na2O 0.60 0.47 0.48 0.48 0.51 0.49 0.45 0.52 0.56 0.51 0.53 0.58 0.55 0.61 0.60 0.64 0.55 0.55 0.61 0.56 0.59 5.50 4.13 4.85 3.89 4.28 2.87K2O 10.37 10.67 10.76 10.89 10.80 10.82 10.90 10.80 11.04 14.04 11.17 10.82 10.86 10.72 10.69 10.70 10.96 10.56 11.21 10.82 11.08 2.25 2.96 3.32 2.04 2.56 6.87P2O5 0.02 0.02 0.02 0.02 0.02 0.02 0.02 0.02 0.03 0.02 0.03 0.02 0.03 0.02 0.03 0.02 0.02 0.03 0.02 0.03 0.02 0.15 0.12 0.11 0.22 0.10 0.18Be 9.56 76.70 75.45 75.32 76.96 28.09 24.20 26.44 27.35 25.87 55.02 55.07 57.00 44.21 40.14 45.82 56.51 57.50 55.70 59.52 56.42 5.55 65.22 31.31 69.83 53.03 114.51Li 67.17 152.60 163.80 169.99 161.38 117.42 88.27 121.34 117.15 119.85 121.47 57.05 14.37 61.03 25.64 60.47 305.11 292.63 317.33 302.88 324.21 16.65 30.05 24.72 24.04 15.88 27.74Cs 6.33 20.99 21.23 20.39 20.79 8.51 9.08 7.90 7.46 8.07 17.94 10.32 10.41 10.62 10.26 10.49 48.28 21.82 30.64 45.38 37.50 3.28 6.80 2.28 1.73 1.72 26.79Rb 491.53 667.95 684.98 683.12 693.83 473.92 471.47 472.73 498.89 489.33 913.80 527.29 483.80 546.07 540.62 547.79 793.13 752.92 743.47 790.78 787.05 89.79 136.68 100.97 133.18 85.91 383.13La 0.09 0.10 0.07 0.10 0.06 0.25 0.29 0.21 0.20 0.26 0.97 0.24 0.24 0.12 0.15 0.16 0.05 0.16 0.08 0.05 0.05 1.14 0.90 2.53 4.97 2.21 1.12Ce 0.03 0.06 0.05 0.06 0.08 0.17 0.40 0.09 0.17 0.26 1.64 0.42 0.48 0.24 0.77 0.44 0.26 0.92 0.17 0.12 0.11 2.11 1.86 3.76 11.48 4.83 2.18Pr bdl bdl bdl bdl 0.05 0.02 0.42 bdl 0.12 0.14 0.41 0.10 0.34 0.16 0.61 0.24 0.10 0.80 0.07 0.13 0.08 0.54 0.66 0.48 1.56 0.71 0.41Nd 0.17 0.29 bdl 0.02 0.38 0.15 1.03 0.22 0.45 0.48 1.16 0.44 1.31 0.67 2.23 0.68 0.60 3.22 0.30 0.43 0.38 2.00 2.03 1.54 5.46 2.38 1.39Sm 0.02 0.02 0.04 bdl 0.01 0.04 0.07 0.05 0.04 0.05 0.20 0.01 0.06 0.02 0.02 0.02 0.03 bdl 0.02 bdl bdl 0.22 0.20 0.39 1.59 0.36 0.40Eu bdl 0.01 0.01 0.01 0.01 0.01 0.03 0.01 0.01 0.02 0.02 0.02 0.03 0.01 bdl 0.02 0.01 bdl 0.01 bdl 0.01 0.03 0.11 0.12 0.11 0.15 0.05Gd 0.02 bdl bdl bdl 0.01 0.03 0.03 0.02 0.02 0.01 0.25 0.01 0.03 0.02 0.02 0.01 bdl 0.08 0.02 bdl 0.02 0.20 0.17 0.36 1.70 0.30 0.33Tb bdl bdl bdl bdl 0.01 bdl bdl bdl bdl bdl 0.04 bdl bdl bdl bdl bdl bdl bdl bdl bdl bdl 0.06 0.03 0.08 0.38 0.06 0.06Dy 0.06 0.05 0.06 0.07 0.13 0.09 0.20 0.09 0.11 0.10 0.34 0.09 0.16 0.07 0.27 0.10 0.07 0.15 0.08 0.05 0.05 0.46 0.33 0.58 2.73 0.53 0.33Ho bdl bdl bdl 0.01 0.01 bdl bdl bdl bdl bdl 0.04 bdl bdl bdl bdl 0.01 bdl bdl bdl bdl bdl 0.06 0.03 0.09 0.50 0.10 0.03Er bdl bdl bdl 0.01 0.02 0.01 0.03 0.02 0.01 0.01 0.14 0.01 0.03 0.01 0.02 0.04 bdl bdl bdl 0.01 bdl 0.21 0.07 0.33 1.23 0.27 0.04Tm bdl bdl bdl bdl bdl bdl bdl bdl bdl bdl bdl bdl bdl bdl bdl bdl bdl bdl bdl bdl bdl 0.01 bdl 0.03 0.09 0.02 bdlYb bdl bdl bdl 0.02 0.01 0.03 bdl 0.01 0.02 0.01 0.08 0.02 0.03 0.02 bdl 0.03 bdl bdl bdl bdl bdl 0.41 0.10 0.45 1.30 0.39 0.02Lu bdl bdl bdl bdl bdl 0.01 bdl bdl bdl bdl 0.02 bdl bdl bdl bdl bdl bdl bdl bdl bdl bdl 0.07 0.02 0.08 0.14 0.07 bdl
171T.Eberleietal./Lithos
227(2015)
161–178

Fig. 6. Compositional characteristics of Permian pegmatites andmagmaticmuscovites. (a) Chondrite-normalised REE pattern of the pegmatites (CI-values from Sun &McDonough, 1989),(b) K/Rb vs Li, (c) K/Rb vs Cs and (d) K/Rb vs Sr of the muscovites and (e) Rb–Sr whole rock data of the pegmatites. Data labelled HR371, HR362 and HR363 are from Haas (1985).
172 T. Eberlei et al. / Lithos 227 (2015) 161–178
in a higher 87Rb/86Sr ratio of 29.7. Sample HM00305 shares similar com-positional and isotopic features with M1210 (Table 4) having lower Sr-concentrations and consequently higher 87Rb/86Sr and 87Sr/86Sr ratioscompared to the other samples. The 87Sr/86Sr ratios of 0.93838 (M1210)and 0.85000 (HM00305) are significantly larger compared to the othersamples, which range from0.74792 to 0.77663 (Table 4, Fig. 6e). Calculat-ing a Rb–Sr whole rock regression using all samples from the currentstudy and the data of the samples HR371, HR362 and HR363 from Haas(1985), results in a poorly defined apparent age of 257 ± 130 Ma(Fig. 6e). Despite the common caveats, like isotopic inhomogeneity (e.g.,Brooks et al., 1968) and the huge error, the result is still consistent witha pegmatite forming event in the Permo-Triassic (cf. Haas, 1985).
4.4.2. MuscoviteWith the exception of Nd, muscovite has REE contents of b1 ppm
(Table 4). Despite these low concentrations, the chondrite-normalisedREE-pattern of the differentmuscovite fractions shares the following sim-ilarities (Fig. 7): (i) there is almost no REE-fractionation, (ii) positive Pr–Nd–(Eu–)Dy–anomalies are recognised in all samples and (iii) no correla-tion between deformation intensity and REE-pattern or -concentrationexists (Fig. 7). Additionally, no correlation between REE-pattern and
Rb–Sr muscovite–whole rock ages can be identified (cf. Fig. 7 andTables 2 and 4).
Rb-concentrations among the different muscovite fractions of singlesamples showonly small fluctuations (Fig. 9d, Table 3), like inM1210, inwhich the difference in Rb-concentration between the fractions withthe highest and lowest Rb-concentrations is ~24 ppm, at total concen-trations of N700 ppm. In comparison, Sr concentrations often vary bymore than 20% relative. For example, in M1210, the difference betweenthe grain-size and magnetic fractions TE-F2 and TE-F5 is 0.94 ppm,which is, at these concentration levels, a deviation of 36% relative(Table 3). Consistent with the whole rock data (see Section 4.4.1), mus-covite from samples M1210 and HM00305 is slightly different thanthose from all other samples. Firstly, they have significantly lowerSr-concentrations of b2.5 ppm, compared to the other samples withSr-concentrations of 3–8 ppm. Secondly, their 87Rb/86Sr ratios at1200–2000 and 87Sr/86Sr ratios at 5.2–6.5 are correspondingly largerthan those from muscovite fractions of the other samples (Table 3).ICP data of additional aliquots of Wm I were used to carefully check po-tential contributions of apatite and/or feldspar by monitoring P (for ap-atite) and Ca and Na (for feldspar). In no case, we found any correlationpointing to significant contributions of such phases (see Table 4).

Fig. 7. Chondrite-normalised REE-pattern of the different muscovite fractions.
173T. Eberlei et al. / Lithos 227 (2015) 161–178
Despite this fact, the distinct muscovite fractions of 5 samples with sev-eral muscovite grain size- and magnetic-fractions share the followingcommon features (Fig. 8; Table 3): (i) different muscovite fractionswithin single samples show a positive correlation of 87Rb/86Sr and87Sr/86Sr, with (ii) poorly defined muscovite-internal regression dataranging from 62 ± 39 to 164 ± 170 Ma. (iii) All samples, except M1201and M1206, have at least one muscovite fraction with a Permo-TriassicRb–Sr mineral–whole rock apparent age. (iv) The remaining muscovitefractions range at lower Sr-concentrations systematically related withhigher 87Rb/86Sr ratios and therefore yield systematically decreasing cal-culated Rb–Sr mineral–whole rock apparent ages within single samples,spanning an “age” difference of 32 Ma in sample M1201 and 76 Ma insample M1210 at slightly increasing 87Sr/86Sr (Fig. 8, Table 3). In general,the mean Rb–Sr mineral–whole rock apparent ages of up to 5 muscovitegrain-size andmagnetic fractions showaweak trend to decrease from theweakly deformed sample M1217 (236 Ma) to the mylonitic sampleM1201 (177 Ma).
A comparison of the FeO- and Sr-concentrations shows that theSr concentration variations do not correlate with the FeO-contentand thus with the magnetic susceptibility of the respective fraction(Table 3). No other element is recognised to steadily decrease or in-crease with the calculated Rb–Sr muscovite–whole rock apparent ageor deformation intensity in all samples (Figs. 7–9), suggesting that thevariations in Sr are decoupled from the other elements as well. Be, Li,Cs and Rb are present in appreciable concentrations (Fig. 9). Differencesin the concentrations of these elements in the different muscovite frac-tions of single samples are small andmost likely related to primary var-iations between different pre-Cretaceous pegmatites and differentpegmatite domains. However, it is interesting to note, that, for example,
M1210 with the weakest deformational imprint shows the highest Li-,Be-, Cs- and Rb-contents, while they apparently decrease with sampledeformation intensity from M1217 to M1201 (Fig. 9).
5. Discussion
5.1. Permian magmatic stage
The formation ofwide-spread pegmatites in the Austroalpine Unit ofthe European Eastern Alps has been attributed to a long-lasting HT/LPtectonometamorphic event during the Permian–Triassic (Schusteret al., 2001; Thöni et al., 2008). Sm–Nd garnet–whole rock data fromPermian metapegmatites in the Upper-Austroalpine Matsch Unit pointto pegmatite formation at 263–280Ma (Habler et al., 2009). Despite po-tential isotopic inhomogeneity in granitic melts (e.g., Brooks et al.,1968) and the large associated error, the regression calculation usingdifferent metapegmatite Rb–Sr whole rocks yielding 257 ± 130 Ma(Fig. 6e) is in agreement with pegmatite formation in the Permo-Trias-sic. The major and trace element data presented in this study indicate arather unfractionated nature of the pegmatites. Only samples M1210and HM00305 show some minor fractionation, as indicated by weaknegative Eu-anomalies and low Sr-concentrations of the whole rocks.M1210 is additionally characterised by some REE-fractionation andelevated Li-contents and high Cs-concentrations of the whole rock andof muscovite (Fig. 6, Table 4). The low Sr-concentrations and the Eu-anomalies are possibly caused by fractionation of primary apatite, zois-ite and/or plagioclase in the pegmatitic melt. The low Sr-concentrationsof these samples and corresponding muscovites lead to relativelyhigh 87Rb/86Sr whole rock ratios of N30 (compared to b10 in the

174 T. Eberlei et al. / Lithos 227 (2015) 161–178

Fig. 9. Plots of (a) Be-, (b) Li-, (c) Cs- and (d) Rb-concentrations vs Rb–Sr muscovite–wholerock apparent age. Note, that none of these elements show a positive correlation with themineral–whole rock age.
175T. Eberlei et al. / Lithos 227 (2015) 161–178
other meta-pegmatite whole rock samples) and N1200 in muscovite,respectively. In turn, also the 87Sr/86Sr ratios are significantly higher(Figs. 6e and 8, Table 3).
Fig. 8. ID-TIMS Rb/Sr data plotted in 87Rb/86Sr vs 87Sr/86Sr space (left column) and Sr-concentraM1217, (e–f) HM00305, (g–h)M1203 and (i–j) M1201. Age values in the left column refer to mevent and the positive correlation trend of Sr in muscovite with the in muscovite–whole rock
5.2. The effect of deformation on the major and trace element compositionsof muscovite
Muscovite porphyroclasts from the studied Permian metapegmatitespreserve evidence for grain-internal brittle and crystal-plastic defor-mation as indicated by the presence of cracks, undulose extinction,(micro-)kinks and dynamic recrystallisation, especially along kinkplanes (Fig. 2). Despite the partly intense mylonitisation of the Perm-ian pegmatites during the Cretaceous tectonometamorphism(Fig. 1c), primary magmatic muscovite persisted as cm- to sub-mm-sized clasts (Fig. 2). They largely retained their magmatic major ele-ment composition of nearly pure muscovite endmember, as reflectedby their relatively homogeneous major element composition (Fig. 3).According to combined microstructural and mineral compositionalcharacteristics, fine-grained matrix muscovite (Wm III) formed bynewmuscovite crystallisation, recrystallisation by dissolution–precip-itation creep, and dynamic recrystallisation. Their formation is spatial-ly clearly related with deformation microstructures: they representthe mylonitic foliation of the quartzo-feldspathic rock matrix; theycrystallised in strain shadows of coarse-grained Ms-clasts and alongcracks within Ms-clasts; and crystallisation occurred at sites of highdislocation densities like kink planes of primary clasts (Fig. 2). Signifi-cant compositional changes of muscovite occurred in relationwith dy-namic recrystallisation producing Wm III, especially in the myloniticmatrix and along cracks and kink planes and chemical alteration pro-ducing Wm II on rims, along cracks and muscovite (001) cleavageplanes (Fig. 3c–i). Similar altered muscovite rims with sharp composi-tional fronts but with different compositional characteristics as ourWm II have been observed elsewhere in hydrothermally altered gran-ites (e.g., Dempster et al., 1994; Gomes & Neiva, 2000). Dempster et al.(1994) found such secondary rims on primary magmatic muscovitesfrom the Oughterard granite in western Ireland. They correlated in-creasing Si-contents (up to 3.4 c.p.f.u.) of these secondary muscoviteswith increasing degree of hydrothermal alteration. Gomes and Neiva(2000) presented a detailed compositional analysis of such rims fromzonedmuscovite in the Ervedosa granite in northern Portugal. Accord-ing to their data, the overgrowth is richer in Fe + Mg and Rb but hasless Al and Na, than the relic magmatic muscovite.
The normalised REE-concentrations of the muscovite fractions indi-cate that the REE characteristics of the differently strained samples aresimilar (Fig. 7). Thus, it is concluded, that the REE characteristics ofmuscovite largely remain unaffected by deformation. The major ele-ment characteristics of the almost pure muscovite endmember ofPermian relic muscovite (Wm I) obviously remained unaffected byCretaceous deformation in undeformed core domains (Fig. 3) andthus are interpreted to reflect the primary composition of the mus-covite grains. However, although there might be a weak correlationbetween the concentrations of the trace elements Li, Be, Cs and Rband total finite strain, variations in these elements are most likelycaused by bulk rock compositional variations among the differentpegmatite bodies and different pegmatite domains (Fig. 9). Theonly element that shows a trend to decrease with decreasing Rb/Srmuscovite–whole rock apparent age is Sr. However, namely in thesamples M1217 and M1201, this trend is not obvious (cf. Fig. 8).
5.3. The effect of deformation on the Rb–Sr isotopic system of muscovite
Microstructurally relic muscovite clasts have previously been shownto reflect incomplete isotopic resetting (e.g., Glodny et al., 2008; Villa,1998), whereas dynamic recrystallisation and (neo-)crystallisationwere supposed to potentially lead to complete isotopic resetting
tions vs Rb–Srmuscovite–whole rock apparent age (right column) for (a–b)M1210, (c–d)uscovite-internal regressions. Note the scatter of these around the time of the Cretaceous
apparent age.

176 T. Eberlei et al. / Lithos 227 (2015) 161–178
(Freeman et al., 1997; Glodny et al., 2002, 2008; Villa, 1998; Yund &Tullis, 1991). Permo-Triassic Rb–Sr muscovite–whole rock apparentrock ages of the investigated samples confirm their relict characterwith respect to the Rb–Sr isotopic system.
Based on theoretical considerations, deformation is expected to havean effect on the Rb–Sr geochronometer, comparable with the effect onthe Ar-retentivity of muscovite (e.g., Cosca et al., 2011; Kramar et al.,2003; Mulch et al., 2002). Deformation may introduce dislocations,point defects, new grain boundaries and cracks, all of which reducethe effective diffusion domain size, which is then smaller as the initialprimary grain size of the undeformed muscovite. Therefore, deforma-tion at upper-greenschist facies P–T conditions (T≤ 500 °C) is supposedto be the predominant factor in affecting the Rb–Sr isotopic system ofmicrostructurally relic muscovite (cf. Freeman et al., 1997; Glodnyet al., 1998; Müller et al., 1999; Villa, 1998).
Even for single hand specimen, analyses of multiple grain size- andmagnetic-fractions of Wm I yielded a range of different Rb–Sr musco-vite–whole rock apparent ages positively correlating with their Sr-concentration (Fig. 8, Table 3). Deformation-induced defects, such asdislocations, point defects, new grain boundaries and cracks haveacted as high-diffusivity pathways, allowing the incompatible Sr toleave the crystal lattice more easily through multipath diffusion (Lee,1995).Wm I grain size- andmagnetic-fractions with the lowest Sr-con-centrations and the lowest Rb–Sr muscovite–whole rock apparent agesmost likely represent more strongly deformed parts ofWm I clasts. Fur-thermore, the Dodson theory implies that the loss of 87Sr controls theRb–Sr geochronometer (Dodson, 1973). More precisely it is a net lossof Sr, potentially coupled with very restricted uptake of Sr in muscovitefrom the matrix reservoir with unknown isotopic composition (Fig. 8,Table 3).
The proposed model to explain our data assumes a pegmatiticmuscovite population with an initially homogeneous 87Rb/86Sr ratiothat is in isotopic equilibrium with the whole rock reservoir (Fig. 10).After the pegmatites cooled, the isotope ratios evolved along the growthline (1) (Fig. 10). The effect of the inferred net loss of Sr, potentiallycoupled with very restricted uptake of Sr with unknown isotopic com-position from thematrix reservoir during themeta-pegmatite evolutionin the Cretaceous is a spread in the 87Rb/86Sr ratios between differentmuscovite populations ((2) in Fig. 10). The effect on the present-daypattern is shown by the different muscovite fractions scattering arounda hypothetic line ((3) in Fig. 10) with a lower slope than an undisturbedPermian muscovite–whole rock would show. The preferential loss of87Sr is likely to have only minor effects as the resulting muscovite re-gression would yield lower apparent ages than in the proposed model(Fig. 10).
Fig. 10. Simplified sketch representing the proposed model that includes a primarymagmaticmuscovite populationwith a homogeneous 87Rb/86Sr ratio, evolving isotope ra-tios (1) and a single stage net loss of Sr during the Cretaceous (2) and its predicted effecton the present-day data distribution (3).
Different parts of the crystal are supposed to have lost variableamounts of Sr due to different deformation intensities, successively in-creasing the 87Rb/86Sr ratio of the respective muscovite population.However, as mentioned above, it is also possible, that very restrictedamounts of Sr with unknown isotopic composition from the matrixreservoir may have entered the muscovite crystal lattice and thushave potentially caused also variations in the 87Sr/86Sr ratios (Fig. 10).In cases of variations in 87Sr loss, the influence of deformation was sup-posedly related with alteration by a fluid phase. The predicted present-day scattered distribution of the various muscovite populations almostmatches the measured distribution of the different muscovite popula-tions in the studied samples (cf. Figs. 8 and 10). Calculating musco-vite-internal regressions yield poorly defined apparent ages in oursamples in the range from 62 ± 39 to 164 ± 170 Ma (cf. Fig. 8). Addi-tionally, the presentedmodel also allows for at least onemuscovite pop-ulation that neither loses nor gains Sr and thus retains its isotopiccomposition during the Cretaceous event (black square in Fig. 10). Con-sequently, a Rb/Sr muscovite–whole rock regression using this musco-vite population is expected to yield the timing of Permo-Triassicformation or cooling. Indeed, except for M1201 andM1206, every sam-ple contains at least one muscovite population with a Permo-TriassicRb/Sr muscovite–whole rock apparent age. Furthermore, these musco-vites are also those with the lowest 87Rb/86Sr ratios (Fig. 8, Table 3).Therefore, we interpret these as to reflect Permo-Triassic formation/cooling. At least, these are well in line with Sm–Nd garnet–whole rockdata, pointing to pegmatite formation at 263–280 Ma (Habler et al.,2009) and subsequent cooling below c. 500–550 °C at 240–260 Ma.Consequently, the presented data are explained by a variable net lossof Sr during the meta-pegmatite evolution in the Cretaceous.
6. Conclusions
Muscovite porphyroclasts from Permian metapegmatites of theUpper-Austroalpine Matsch Unit in Southern Tyrol (Italy) provideinformation on the behaviour of Sr in muscovite and the associatedeffects on the Rb–Sr geochronometer during upper greenschist fa-cies deformation:
1. New Rb–Sr data indicate significant effects of deformation-relatednet loss of Sr on the Rb–Sr geochronometer. Kink planes, subgrainboundaries and cracks showmajor element compositional alterationand may have provided short-circuit diffusion (fast-diffusion) path-ways for incompatible Sr.
2. Based on BSE images, quantitative element mapping by EMPA andsingle spot analyses, 3 distinct muscovite groups were identified inPermian metapegmatite: (i) Wm I represents primary magmaticPermianmuscovitewith almost puremuscovite endmember compo-sition; (ii) Wm II forms portions of Ms clasts, whichwere affected byalteration/dissolution–reprecipitation; and (iii) Wm III appears asfine-grainedmicrostructurally distinct Ms generation, which is largelycompositionally similar toWm II, but results from (neo)crystallisationin the rock matrix and strain shadows, or from dynamic recrystal-lisation in highly strained portions of coarse grained clasts (Figs. 2–3).
3. The presentedmodel assumes a primarymagmaticmuscovite popula-tionwith a homogeneous 87Rb/86Sr ratio and variable net loss of Sr. Thepredicted present-day scattered distribution of the muscovite popu-lations almost matches the measured distribution and confirms therole of net loss of Sr during the metapegmatite evolution in theCretaceous.
4. All samples show a positive internal correlation of 87Rb/86Sr and87Sr/86Sr ratios of their muscovite irrespective of their finite strainmagnitude.
5. All samples, exceptM1201 andM1206, comprise a primarymagmat-ic muscovite fraction that has not been significantly affected by a netloss of Sr and hence preserves the original Permo-Triassic formation/cooling age.
177T. Eberlei et al. / Lithos 227 (2015) 161–178
6. A whole-rock Rb–Sr apparent age from Permian pegmatites is in linewith a pegmatite formation during the Permo-Triassic HT/LP event,suggesting that thewhole rock systemshave remained largely closedsystems during Cretaceous tectonometamorphic overprinting atleast with respect to Rb and Sr.
7. Investigation of different grain size- and magnetic-fractions fromsingle samples provides a comprehensive dataset documenting sig-nificant systematic variations in the Rb–Sr system even at hand spec-imen scale. Mean Rb–Sr muscovite–whole rock apparent ages ofdifferent muscovite grain-size and magnetic fractions decreasefrom theweakly deformed sampleM1217 (236Ma) to themyloniticsample M1201 (177 Ma), hence documenting a significant effect ofdeformation on the muscovite Rb–Sr geochronometer at upper-greenschist facies conditions.
Acknowledgments
Funding was provided by the University of Vienna (DoctoralSchool): IK052 and the Austrian Science Fund (FWF): I471-N19 aspart of the International Research Group FOR 741 D-A-CH. The authorsacknowledge access to the ElectronMicroprobe Laboratory and the Lab-oratory of Geochronology at the Faculty of Geosciences, Geography andAstronomy at the University of Vienna (Austria). S. Hrabe and C. Beybelare thanked for their excellent thin section preparation, F. Biedermannfor the valuable help during the mineral separation, M. Horschineggfor the assistance with the ID-TIMS analyses and T. Ntaflos and F. Kiralyfor their help with the EPMA analyses. We are grateful to MarcoBeltrando, Johannes Glodny and an anonymous reviewer for their veryconstructive reviews that helped to clarify our arguments. MarcoScambelluri is thanked for the editorial work.
References
Armstrong, R.L., Jäger, E., Eberhardt, P., 1966. A comparison of K–Ar and Rb–Sr ages onAlpine biotites. Earth and Planetary Science Letters 1, 13–19.
Baldwin, S.L., Lister, G.S., 1998. Thermochronology of the South Cyclades Shear Zone, Ios,Greece: effects of ductile shear in the argon partial retention zone. Journal of Geo-physical Research 103, 7315–7336.
Bell, I.A.,Wilson, C.J.L., McLaren, A.C., Etheridge,M.A., 1986. Kinks inmica: role of dislocationsand (001) cleavage. Tectonophysics 127, 49–65.
Beltrando, M., Di Vicenzo, G., Ferraris, C., 2013. Preservation of sub-microscopic structuralrelicts in micas from the Gran Paradiso Massif (Western Alps): implications for40Ar/39Ar geochronology. Geochimica et Cosmochimica Acta 119, 359–380.
Blanckenburg, F.v., Villa, I., Baur, H., Morteani, G., Steiger, R.H., 1989. Time calibration of aPT-path from the Western Tauern Window, Eastern Alps: the problem of closuretemperatures. Contributions to Mineralogy and Petrology 101, 1–11.
Bröcker, M., Baldwin, S.L., Arkudas, R., 2013. The geological significance of 40Ar/39Ar andRb–Sr white mica ages from Syros and Sifnos, Greece: a record of continuous (re)-crystallization during exhumation? Journal of Metamorphic Geology 31, 629–646.
Brooks, C., Wendt, I., Harre,W., 1968. A two-error regression treatment and its applicationto Rb–Sr and initial Sr87/Sr86 ratios of younger variscan granitic rocks from theSchwarzwald Massif, southwest Germany. Journal of Geophysical Research 73,6071–6084.
Cosca, M., Stünitz, H., Bourgeix, A.L., Lee, J.P., 2011. 40Ar⁎ loss in experimentally deformedmuscovite and biotite with implications for 40Ar/39Ar geochronology of naturallydeformed rocks. Geochimica et Cosmochimica Acta 75, 7759–7778.
Dempster, T.J., Tanner, P.W.G., Ainsworth, P., 1994. Chemical zoning of white micas: a re-cord of fluid infiltration in the Oughterard granite, western Ireland. American Miner-alogist 79, 536–544.
Dodson, M.H., 1973. Closure temperature in cooling geochronological and petrologicalsystems. Contributions to Mineralogy and Petrology 40, 259–274.
Dunlap, W.J., Kronenberg, A.K., 2001. Argon loss during deformation of micas: constraintsfrom laboratory deformation experiments. Contributions to Mineralogy and Petrology141, 174–185.
Freeman, S.R., Inger, S., Butler, R.W.H., Cliff, R.A., 1997. Dating deformation using Rb–Sr inwhite mica: greenschist facies deformation ages from the Entrelor shear zone, ItalianAlps. Tectonics 16 (1), 57–76.
Ganguly, J., Ruiz, J., 1987. Time–temperature relation of mineral isochrons: a thermody-namicmodel, and illustrative examples for the Rb–Sr system. Earth and Planetary Sci-ence Letters 81, 338–348.
George, M.T., Bartlett, J.M., 1996. Rejuvenation of Rb–Sr mica ages during shearing on thenorthwestern margin of the Nanga Parbat–Haramosh massif. Tectonophysics 260,167–185.
Glodny, J., Grauert, B., Fiala, J., Vejnar, Z., Krohe, A., 1998. Metapegmatites in the westernBohemian massif: ages of crystallization and metamorphic overprint, as constrained
by U–Pb zircon, monazite, garnet, columbite and Rb–Sr muscovite data. GeologischeRundschau 87, 124–134.
Glodny, J., Bingen, B., Austrheim, H., Molina, J., Rusin, A., 2002. Precise eclogitization agesdeduced from Rb/Sr mineral systematics: the Maksyutov complex, Southern Urals,Russia. Geochimica et Cosmochimica Acta 66 (7), 1221–1235.
Glodny, J., Austrheim, H., Molina, J., Rusin, A., Seward, D., 2003. Rb/Sr record of fluid–rockinteraction in eclogites: the Marun–Keu complex, Polar Urals, Russia. Geochimica etCosmochimica Acta 67 (22), 4353–4371.
Glodny, J., Kühn, A., Austrheim, H., 2008. Diffusion versus recrystallization processes inRb–Sr geochronology: isotopic relics in eclogite facies rocks, Western Gneiss Region,Norway. Geochimica et Cosmochimica Acta 72, 506–525.
Gomes, M.E.P., Neiva, A.M.R., 2000. Chemical zoning of muscovite from the Ervedosagranite, northern Portugal. Mineralogical Magazine 64, 347–358.
Haas, R., 1985. Zur Metamorphose des südlichen Ötztalkristallins unter besondererBerücksichtigung derMatscher Einheit (Vinschgau/Südtirol). (PhD thesis). Universityof Innsbruck, p. 118.
Habler, G., Thöni, M., Grasemann, B., 2009. Cretaceous metamorphism in the AustroalpineMatsch Unit (Eastern Alps): the interrelation between deformation and chemicalequilibration processes. Mineralogy and Petrology 97, 149–171.
Hames, W.E., Cheney, J.T., 1997. On the loss of 40Ar* from muscovite duringpolymetamorphism. Geochimica et Cosmochimica Acta 61, 3863–3872.
Jäger, E., 1967. Die Bedeutung der Biotit–Alterswerte. In: Jäger, E., Niggli, E., Wenk, E.(Eds.), Rb–Sr Altersbestimmungen an Glimmern der Zentralalpen. Beiträge zurGeologischen Karte der Schweiz, NF 134, pp. 28–31.
Jenkin, G.R.T., 1997. Do cooling paths derived from mica Rb–Sr data reflect true coolingpaths? Geology 25, 907–910.
Jenkin, G.R.T., Rogers, G., Fallick, A.E., Farrow, C.M., 1995. Rb–Sr closure temperatures inbi-mineralic rocks: a mode effect and test for different diffusionmodels. Chemical Ge-ology 122, 227–240.
Jenkin, G.R.T., Ellam, R.M., Rogers, G., Stuart, F.M., 2001. An investigation of closure tem-perature of the biotite Rb–Sr system: the importance of cation exchange. Geochimicaet Cosmochimica Acta 65, 1141–1160.
Kramar, N., Cosca, M., Buffat, P.A., Baumgartner, L., 2003. Stacking fault-enhanced argondiffusion in naturally deformed muscovite. In: Vance, D., Müller, W., Villa, I. (Eds.),Geochronology: Linking the Isotopic Record with Petrology and Textures. GeologicalSociety, London, Special Publications 220, pp. 249–260.
Kühn, A., Glodny, J., Iden, K., Austrheim, H., 2000. Retention of Precambrian Rb/Sr phlog-opite ages through Caledonian eclogite facies metamorphism, Bergen Arc Complex,W-Norway. Lithos 51, 305–330.
Lee, J.K.W., 1995. Multipath diffusion in geochronology. Contributions to Mineralogy andPetrology 120, 60–82.
Mulch, A., Cosca, M., Handy, M., 2002. In-Situ UV-laser 40Ar/39Ar geochronology of a mi-caceous mylonite: an example of defect-enhanced argon loss. Contributions to Min-eralogy and Petrology 142, 738–752.
Müller,W., Dallmeyer, D., Neubauer, F., Thöni, M., 1999. Deformation-induced resetting ofRb/Sr and 40Ar/3Ar mineral systems in a low-grade, polymetamorphic terrane (EasternAlps, Austria). Journal of the Geological Society, London 156, 261–278.
Müller, W., Mancktelow, N., Meier, M., 2000. Rb–Sr microchrons of synkinematic mica inmylonites: an examples from the DAV fault of the Eastern Alps. Earth and PlanetaryScience Letters 180, 385–397.
Pouchou, J.L., Pichoir, F., 1991. Quantitative analysis of homogeneous or stratifiedmicrovolumes applying the model “PAP”. In: Heinrich, K.F.J., Newbury, D.E. (Eds.),Electron Probe Quantitation, pp. 31–75.
Purdy, J.W., Jäger, E., 1976. K–Ar ages on rock-forming minerals from the Central Alps.Memorie degli Istituti di Geologia e Mineralogia dell'Università di Padova 30, 1–31.
Purtscheller, F., 1967. Mineralzonen im Ötztal–Stubaier Altkristallin. Akademie derWissenschaften in Wien. Mathematisch-naturwissenschaftliche Klasse 2, 66–70.
Ratschiller, L.K., 1953. Beiträge zur regionalen Petrographie des Vintschgau–Gebietes(Südtirol). Neues Jahrbuch für Mineralogie Abhandlungen 85, 247–302.
Reddy, S.M., Kelley, S.P., Wheeler, J., 1996. A 40Ar/39Ar laser probe study of micas from theSesia Zone, Italian Alps: implications for metamorphic and deformation histories.Journal of Metamorphic Geology 14, 493–508.
Schmid, S.M., Haas, R., 1989. Transition from near-surface thrusting to intrabasementdecollement, Schlinig thrust, Eastern Alps. Tectonics 8, 697–718.
Schmid, S.M., Fügenschuh, B., Kissling, E., Schuster, R., 2004. Tectonic map and overall ar-chitecture of the Alpine orogen. Eclogae Geologicae Helvetiae 97, 93–117.
Schuster, R., Scharbert, S., Abart, R., Frank, W., 2001. Permo-Triassic extension and relatedHT/LP metamorphism in the Austroalpine–Southalpine realm. Mitteilungen der Ge-sellschaft der Geologie und Bergbaustudenten in Österreich 45, 111–141.
Steiger, R.H., Jäger, E., 1977. Subcommission on Geochronology: convention on the use ofdecay constants in geo- and cosmochronology. Earth and Planetary Science Letters36, 359–362.
Stipp, M., Stünitz, H., Heilbronner, R., Schmid, S., 2002. Dynamic recrystallization ofquartz: correlation between natural and experimental conditions. In: De Meer, S.,Drury, M.R., De Bresser, J.H.P., Pennock, G.M. (Eds.), Deformation Mechanisms, Rheol-ogy and Tectonics: Curren Status and Future Perspectives. Geological Society, London,Special Publications 200, pp. 171–190.
Sun, S.S., McDonough, W.F., 1989. Chemical and isotopic systematics of oceanic basalts:implications for mantle composition and processes. In: Saunders, A.D., Norry, M.J.(Eds.), Magmatism in the Ocean Basins. Geological Society Special Publications 42,pp. 313–345.
Thöni, M., 1981. Degree and evolution of the Alpine metamorphism in the Austroalpineunit W of the Hohe Tauern in the light of K/Ar and Rb/Sr age determinations onmicas. Jahrbuch der Geologischen Bundesanstalt 124-1, 111–174 (Wien).
Thöni, M., 1983. The thermal climax of the early alpine metamorphism in theAustroalpine thrust sheet. Memorie di Scienze Geologica 36, 211–238.

178 T. Eberlei et al. / Lithos 227 (2015) 161–178
Thöni, M., 1986. The Rb–Sr thin slab isochron method — an unreliable geochronologicalmethod for dating geological events in polymetamorphic terrains? — evidence fromthe Austroalpine basement Nappe, The Eastern Alps. Memorie di Scienze Geologica38, 283–352.
Thöni, M., Miller, C., Zanetti, A., Habler, G., Goessler, W., 2008. Sm–Nd isotope systematicsof high-REE accessory minerals and major phases: ID-TIMS, LA-ICP-MS and EPMA
data constrain multiple Permian–Triassic pegmatite emplacement in the Koralpe,Eastern Alps. Chemical Geology 254, 216–237.
Villa, I., 1998. Isotopic closure. Terra Nova 10, 42–47.Yund, R.A., Tullis, J., 1991. Compositional changes of minerals associatedwith dynamic re-
crystallization. Contributions to Mineralogy and Petrology 108, 346–355.