RBC Capital Markets 2015 Global Mining & Materials Conference
44
June 15-17, 2015 RBC Capital Markets 2015 Global Mining & Materials Conference
-
Upload
primeromining -
Category
Documents
-
view
22 -
download
0
Transcript of RBC Capital Markets 2015 Global Mining & Materials Conference

June 15-17, 2015
RBC Capital Markets 2015 Global Mining & Materials Conference
TSX P | NYSE PPP | 2
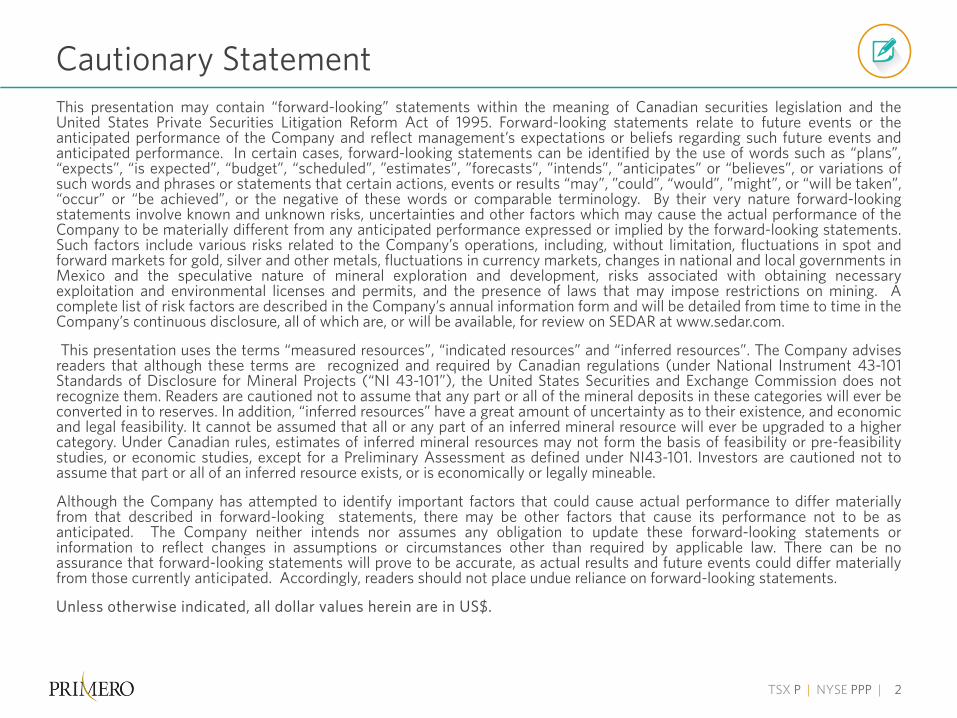
This presentation may contain “forward-looking” statements within the meaning of Canadian securities legislation and the United States Private Securities Litigation Reform Act of 1995. Forward-looking statements relate to future events or the anticipated performance of the Company and reflect management’s expectations or beliefs regarding such future events and anticipated performance. In certain cases, forward-looking statements can be identified by the use of words such as “plans”, “expects”, “is expected”, “budget”, “scheduled”, ”estimates”, ”forecasts”, ”intends”, ”anticipates” or “believes”, or variations of such words and phrases or statements that certain actions, events or results “may”, ”could”, “would”, ”might”, or “will be taken”, “occur” or “be achieved”, or the negative of these words or comparable terminology. By their very nature forward-looking statements involve known and unknown risks, uncertainties and other factors which may cause the actual performance of the Company to be materially different from any anticipated performance expressed or implied by the forward-looking statements. Such factors include various risks related to the Company’s operations, including, without limitation, fluctuations in spot and forward markets for gold, silver and other metals, fluctuations in currency markets, changes in national and local governments in Mexico and the speculative nature of mineral exploration and development, risks associated with obtaining necessary exploitation and environmental licenses and permits, and the presence of laws that may impose restrictions on mining. A complete list of risk factors are described in the Company’s annual information form and will be detailed from time to time in the Company’s continuous disclosure, all of which are, or will be available, for review on SEDAR at www.sedar.com.
This presentation uses the terms “measured resources”, “indicated resources” and “inferred resources”. The Company advises readers that although these terms are recognized and required by Canadian regulations (under National Instrument 43-101 Standards of Disclosure for Mineral Projects (“NI 43-101”), the United States Securities and Exchange Commission does not recognize them. Readers are cautioned not to assume that any part or all of the mineral deposits in these categories will ever be converted in to reserves. In addition, “inferred resources” have a great amount of uncertainty as to their existence, and economic and legal feasibility. It cannot be assumed that all or any part of an inferred mineral resource will ever be upgraded to a higher category. Under Canadian rules, estimates of inferred mineral resources may not form the basis of feasibility or pre-feasibility studies, or economic studies, except for a Preliminary Assessment as defined under NI43-101. Investors are cautioned not to assume that part or all of an inferred resource exists, or is economically or legally mineable.
Although the Company has attempted to identify important factors that could cause actual performance to differ materially from that described in forward-looking statements, there may be other factors that cause its performance not to be as anticipated. The Company neither intends nor assumes any obligation to update these forward-looking statements or information to reflect changes in assumptions or circumstances other than required by applicable law. There can be no assurance that forward-looking statements will prove to be accurate, as actual results and future events could differ materially from those currently anticipated. Accordingly, readers should not place undue reliance on forward-looking statements.
Unless otherwise indicated, all dollar values herein are in US$.
Cautionary Statement
TSX P | NYSE PPP | 3
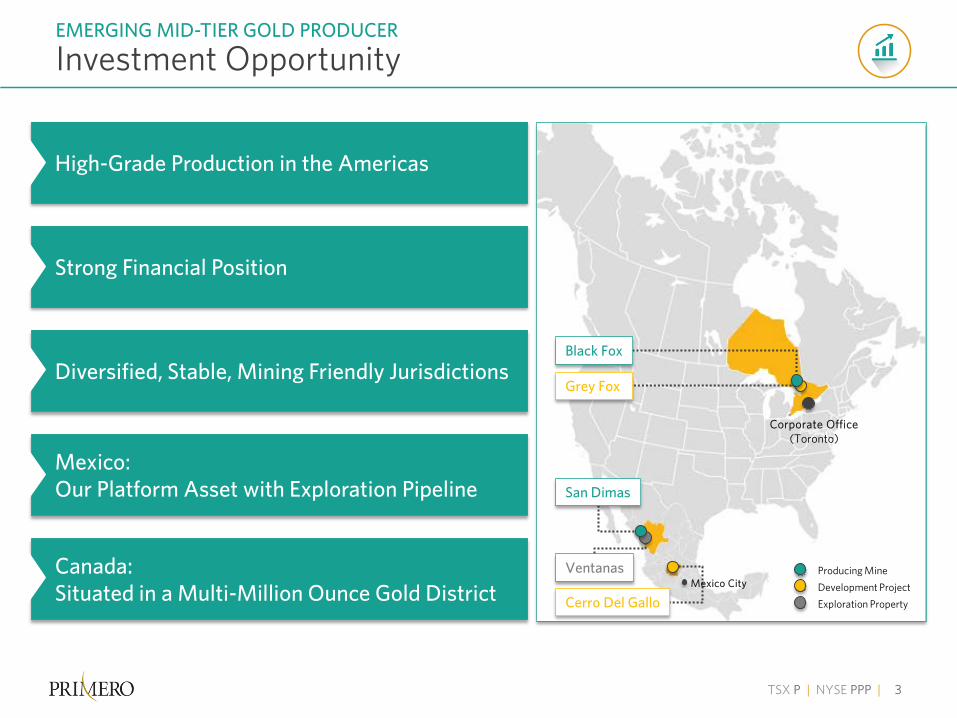
Investment Opportunity EMERGING MID-TIER GOLD PRODUCER
Corporate Office (Toronto)
Producing Mine Development Project Exploration Property
Black Fox
Grey Fox
San Dimas
Cerro Del Gallo
Ventanas Mexico City
High-Grade Production in the Americas
Diversified, Stable, Mining Friendly Jurisdictions
Strong Financial Position
Mexico: Our Platform Asset with Exploration Pipeline
Canada: Situated in a Multi-Million Ounce Gold District

TSX P | NYSE PPP | 4
Strong Financial Position SUFFICIENT LIQUIDITY TO FUND ORGANIC GROWTH
Source: 2015E-2017E Operating Cash Flow – Capital IQ consensus CFPS multiplied by current 162 million shares outstanding.
*See final slide for footnotes.
$72 $74 $91
$135 $130
2013 2014 2015E 2016E 2017E
Consensus Estimated Operating Cash Flow ($ millions)
$133M STRONG LIQUIDITY
$123M1 PRUDENT DEBT LEVEL
As at March 31, 2015
Exchanges TSX: P NYSE: PPP
Balance Sheet (As at March 31, 2015)
Cash $58 million
Line of Credit2 $75 million
Total Liquidity $133 million
Convertible Debenture (6.5%, due Mar. 2016, US$14.00 conversion)
$48 million
Convertible Debenture (5.75%, due Feb. 2020, US$6.55 conversion)
$75 million
Line of Credit Draw Down2 (Due May 2017)
Nil
Total Debt1 $123 million
Capital Structure
Common Shares Outstanding 162 million
Fully Diluted3 193 million
Market Capitalization (At April 30, 2015)
C$720 million
TSX P | NYSE PPP | 5
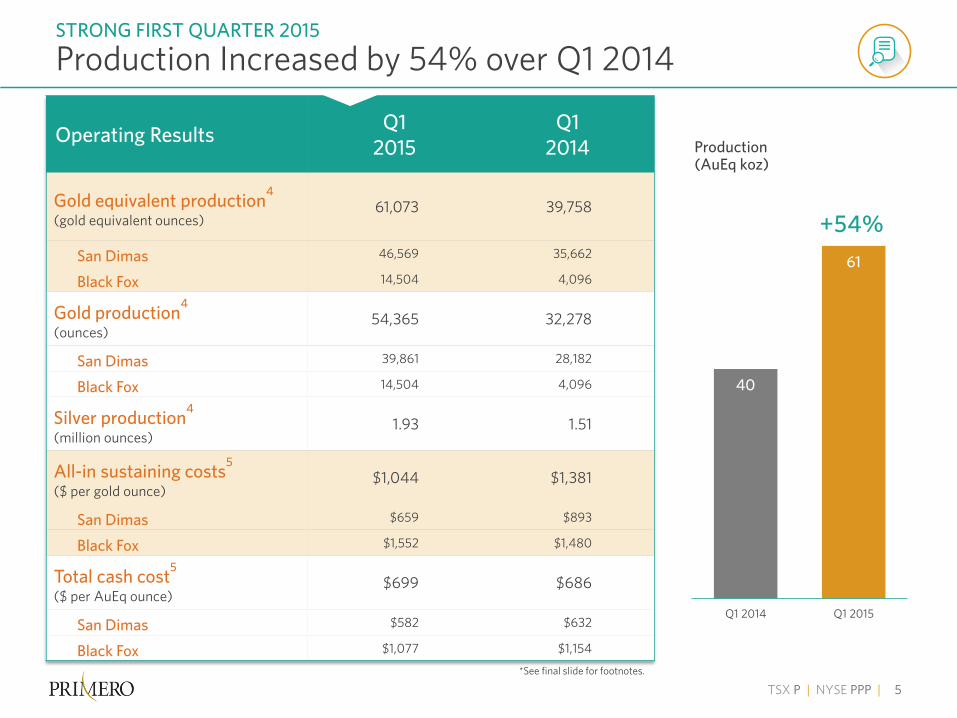
Production Increased by 54% over Q1 2014 STRONG FIRST QUARTER 2015
Operating Results Q1 2015
Q1 2014
Gold equivalent production4
(gold equivalent ounces) 61,073 39,758
San Dimas 46,569 35,662
Black Fox 14,504 4,096
Gold production4
(ounces) 54,365 32,278
San Dimas 39,861 28,182
Black Fox 14,504 4,096
Silver production4 (million ounces)
1.93 1.51
All-in sustaining costs5 ($ per gold ounce)
$1,044 $1,381
San Dimas $659 $893
Black Fox $1,552 $1,480
Total cash cost5 ($ per AuEq ounce)
$699 $686
San Dimas $582 $632
Black Fox $1,077 $1,154
*See final slide for footnotes.
40
61
Q1 2014 Q1 2015
+54%
Production (AuEq koz)

TSX P | NYSE PPP | 6
Production To Increase By Up To 20% In 2015 HIGH-GRADE PRODUCTION WITH ORGANIC GROWTH
161 180
190
215 64
80
100
100
2014 2015E 2016E 2017E
Black FoxSan Dimas
300-350
250-270
280-300
225
8
*See final slide for footnotes.
Guidance Black Fox
San Dimas
2015
Attributable production4 (gold equivalent ounces)
75,000- 85,000
175,000-185,000
250,000-270,000
Gold production4
(ounces) 75,000- 85,000
145,000-155,000
220,000-240,000
Silver production4 (million ounces) - 6.5-7.5 6.5-7.5
All-in sustaining costs5,6 (per gold ounce)
$1,075-$1,125 $840-$890 $1,000-$1,100
Total cash costs5,6 (per gold equivalent ounce)
$820-$870 $590-$640 $650-$700
Capital expenditures ($ millions) $22.6 $41.4 $66.7
Exploration ($ millions) $12.3 $6.4 $19.1
Targeted Production Growth Profile (AuEq koz)4,7
TSX P | NYSE PPP | 7
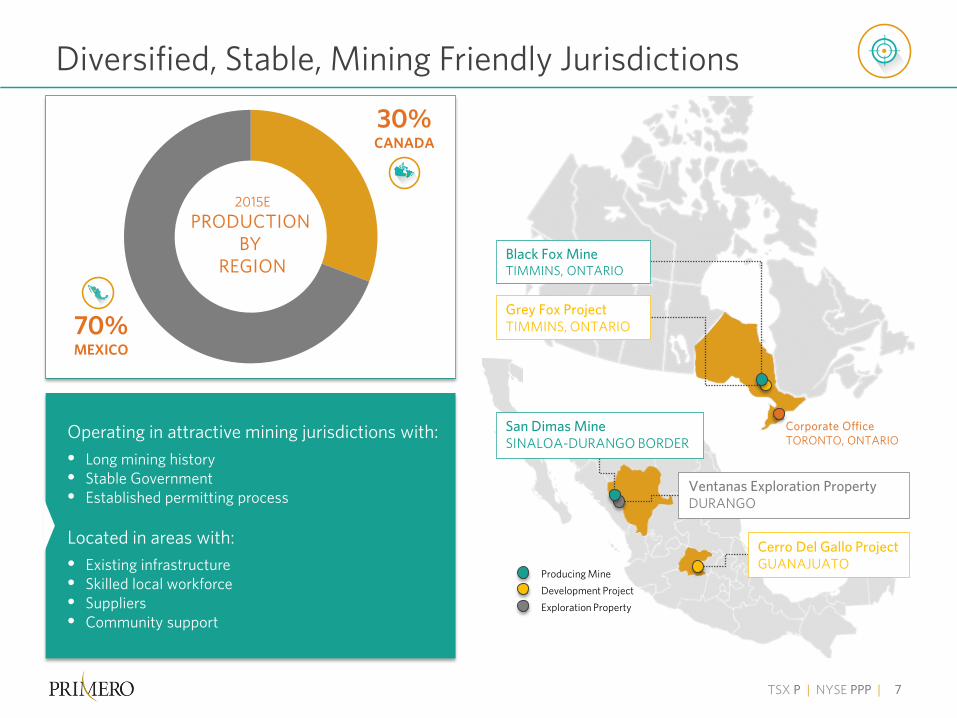
Diversified, Stable, Mining Friendly Jurisdictions
Corporate Office TORONTO, ONTARIO
Producing Mine Development Project Exploration Property
Black Fox Mine TIMMINS, ONTARIO
Grey Fox Project TIMMINS, ONTARIO
San Dimas Mine SINALOA-DURANGO BORDER
Cerro Del Gallo Project GUANAJUATO
Ventanas Exploration Property DURANGO
70% MEXICO
30% CANADA
2015E PRODUCTION
BY REGION
Operating in attractive mining jurisdictions with: • Long mining history • Stable Government • Established permitting process
Located in areas with: • Existing infrastructure • Skilled local workforce • Suppliers • Community support

TSX P | NYSE PPP | 8
Production Details
LOCATION Guanajuato State, Mexico
OWNERSHIP 100% (no stream)
METALS Gold, Silver, & Copper
MINING Open pit, Heap leach
STAGE May 2012 Feasibility Study on Phase 1 Heap Leach
Development Details
LOCATION 32km south of San Dimas, Durango, Mexico
OWNERSHIP 100% (no stream)
METALS Gold & Silver
PROPERTY 3,470 hectares
RESULTS 7.1 g/t AuEq over 9.7 m, 7.9 g/t AuEq over 6.2 m
Exploration Details
LOCATION Sinaloa-Durango, Mexico
OWNERSHIP 100% (silver stream4)
METALS Gold & Silver
MINING Underground
CAPACITY 2,500 TPD (nameplate)
2015E 180,000 AuEq oz4
$865 per oz5,6
all-in sustaining costs
San Dimas
Ventanas
Cerro del Gallo 95,000 AuEq oz 4
24 months from construction decision
MEXICO
Platform Asset with Exploration Pipeline
*See final slide for footnotes.
TSX P | NYSE PPP | 9
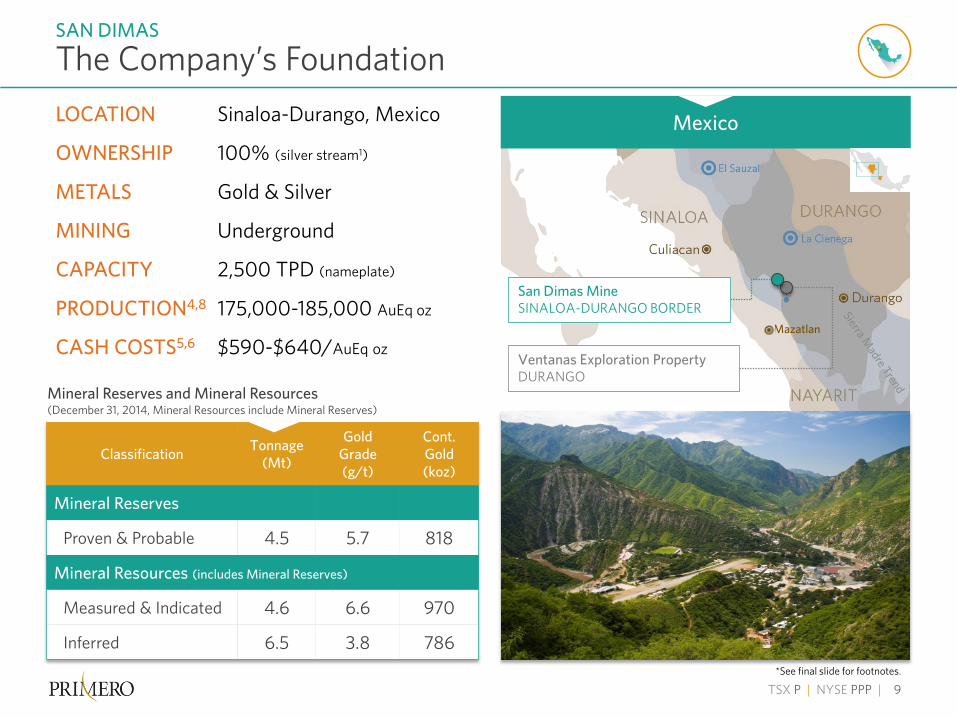
The Company’s Foundation SAN DIMAS
*See final slide for footnotes.
Mineral Reserves and Mineral Resources (December 31, 2014, Mineral Resources include Mineral Reserves)
Classification Tonnage (Mt)
Gold Grade (g/t)
Cont. Gold (koz)
Mineral Reserves
Proven & Probable 4.5 5.7 818
Mineral Resources (includes Mineral Reserves)
Measured & Indicated 4.6 6.6 970
Inferred 6.5 3.8 786
Mazatlan
San Dimas Mine SINALOA-DURANGO BORDER
Ventanas Exploration Property DURANGO
LOCATION Sinaloa-Durango, Mexico
OWNERSHIP 100% (silver stream1)
METALS Gold & Silver
MINING Underground
CAPACITY 2,500 TPD (nameplate)
PRODUCTION4,8 175,000-185,000 AuEq oz
CASH COSTS5,6 $590-$640/AuEq oz
Mexico
TSX P | NYSE PPP | 10
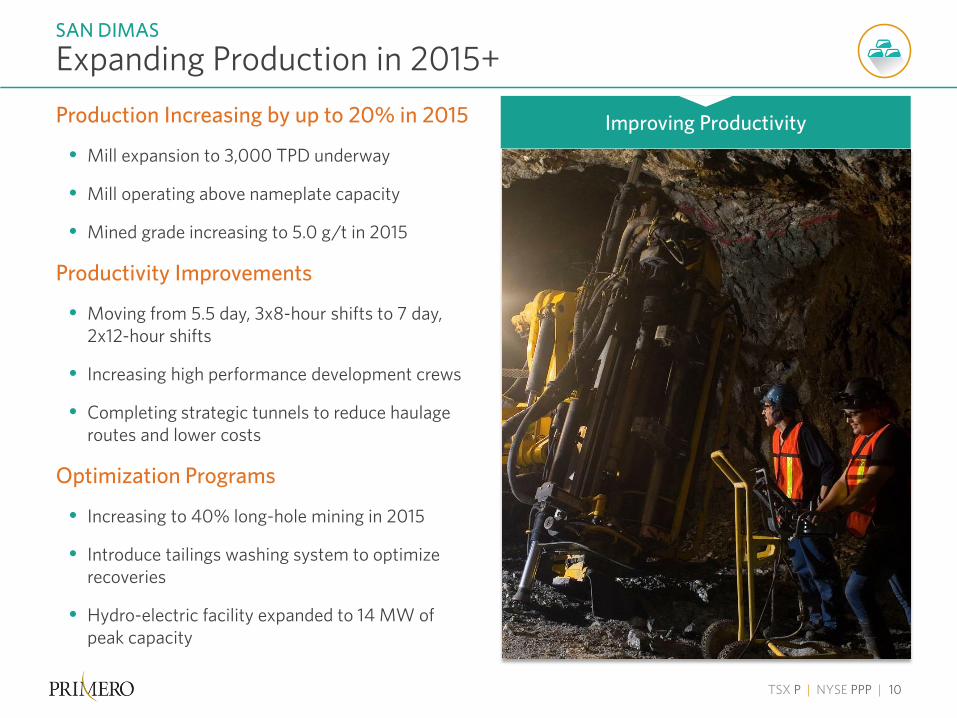
Expanding Production in 2015+ SAN DIMAS
Production Increasing by up to 20% in 2015
• Mill expansion to 3,000 TPD underway
• Mill operating above nameplate capacity
• Mined grade increasing to 5.0 g/t in 2015
Productivity Improvements
• Moving from 5.5 day, 3x8-hour shifts to 7 day, 2x12-hour shifts
• Increasing high performance development crews
• Completing strategic tunnels to reduce haulage routes and lower costs
Optimization Programs
• Increasing to 40% long-hole mining in 2015
• Introduce tailings washing system to optimize recoveries
• Hydro-electric facility expanded to 14 MW of peak capacity
Improving Productivity
TSX P | NYSE PPP | 11
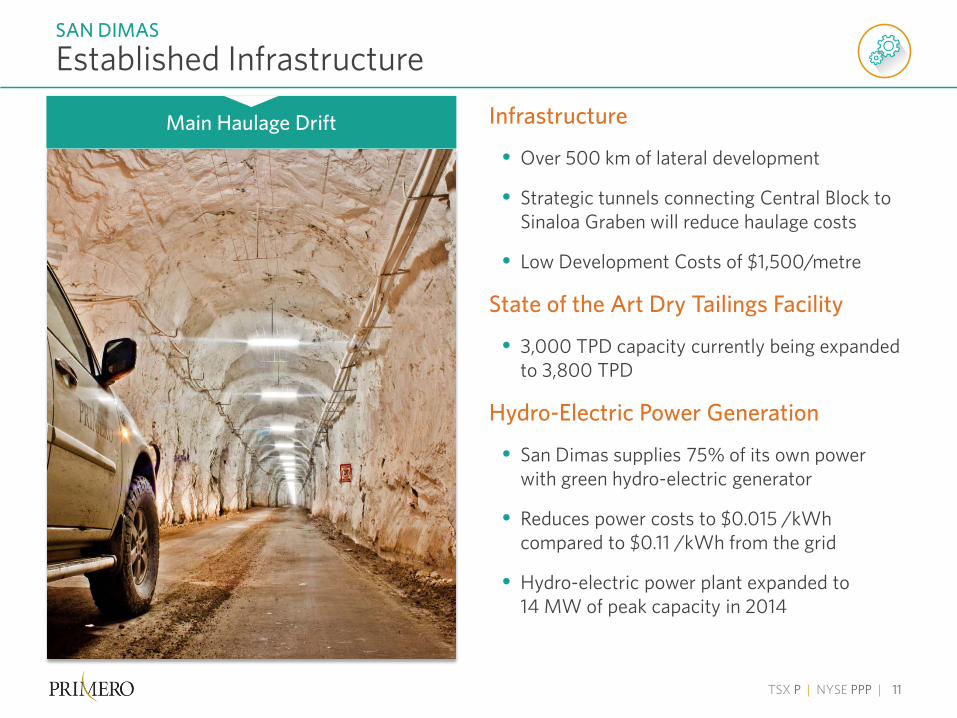
Established Infrastructure SAN DIMAS
Main Haulage Drift Infrastructure
• Over 500 km of lateral development
• Strategic tunnels connecting Central Block to Sinaloa Graben will reduce haulage costs
• Low Development Costs of $1,500/metre
State of the Art Dry Tailings Facility
• 3,000 TPD capacity currently being expanded to 3,800 TPD
Hydro-Electric Power Generation
• San Dimas supplies 75% of its own power with green hydro-electric generator
• Reduces power costs to $0.015 /kWh compared to $0.11 /kWh from the grid
• Hydro-electric power plant expanded to 14 MW of peak capacity in 2014

TSX P | NYSE PPP | 12
Significant Exploration Upside SAN DIMAS
Large Prospective Property • 22,500 hectare property • Over 120 known veins • 90% of Reserves located within
6km of mill • Entire property highly prospective
Jessica Vein Discovery • Not included in 2014 Resource
estimate, currently being mined • Open along 225 metres averaging
9.7 g/t gold and 1,497 g/t silver over 2.2 metres true width
• Located under volcanic capping
Victoria Vein • Reserves of 168koz of gold at
9.1 g/t and 7.9Moz of silver at 428 g/t
Perez Vein • Intercepts include 7.4 g/t gold and 528
g/t silver over 11.9 metres

TSX P | NYSE PPP | 13
Production Details
LOCATION 3.5 km south of Black Fox, Ontario
OWNERSHIP 100% (no stream)
METALS Gold
MINING Open pit & potential underground
STAGE Scoping study to be completed by Q1 2016
Development Details
LOCATION Between Grey Fox and Black Fox
OWNERSHIP 100% (6.3% gold stream on Pike River4)
METALS Gold
PROPERTY 1,750 hectares (total contiguous land package, including Black Fox and Grey Fox), covering 6.5 km strike length of the Destor-Porcupine Fault Zone
Exploration Details
LOCATION Timmins, Ontario
OWNERSHIP 100% (8% gold stream4)
METALS Gold
MINING Open pit & Underground
CAPACITY 2,200 TPD
2015E 80,000 Au oz4
$1,100 per oz5,6
all-in sustaining costs
Black Fox
Pike River Property
Grey Fox
Multi-Million Ounce Gold District CANADA
*See final slide for footnotes.

TSX P | NYSE PPP | 14
District Wide Proven Depth Potential BLACK FOX COMPLEX
Classification Property Tonnage (Mt)
Gold Grade (g/t)
Cont. Gold (koz)
Mineral Reserves Proven & Probable Black Fox 3.0 4.0 393
Mineral Resources (includes Mineral Reserves)
Measured & Indicated Black Fox 3.6 5.3 608
Measured & Indicated Grey Fox 4.7 4.4 668
Inferred Black Fox 0.3 8.3 68
Inferred Grey Fox 1.3 4.2 174
LOCATION Timmins, Ontario OWNERSHIP 100% (8% gold stream1)
METALS Gold MINING Open pit & Underground CAPACITY 2,200 TPD PRODUCTION4,8 75,000-85,000 oz
CASH COSTS5,6 $820-$870/ oz
Mineral Reserves and Mineral Resources (December 31, 2014, Mineral Resources include Mineral Reserves)
Timmins, Ontario
*See final slide for footnotes.
TSX P | NYSE PPP | 15
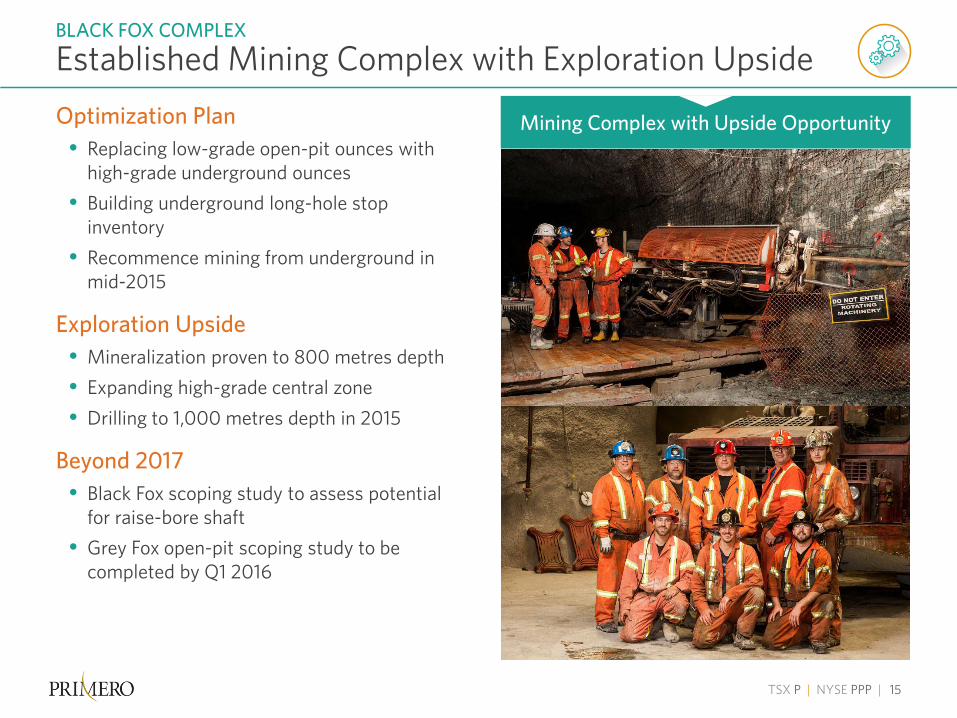
Optimization Plan • Replacing low-grade open-pit ounces with
high-grade underground ounces • Building underground long-hole stop
inventory • Recommence mining from underground in
mid-2015
Exploration Upside • Mineralization proven to 800 metres depth • Expanding high-grade central zone • Drilling to 1,000 metres depth in 2015
Beyond 2017 • Black Fox scoping study to assess potential
for raise-bore shaft • Grey Fox open-pit scoping study to be
completed by Q1 2016
Established Mining Complex with Exploration Upside BLACK FOX COMPLEX
Mining Complex with Upside Opportunity
TSX P | NYSE PPP | 16
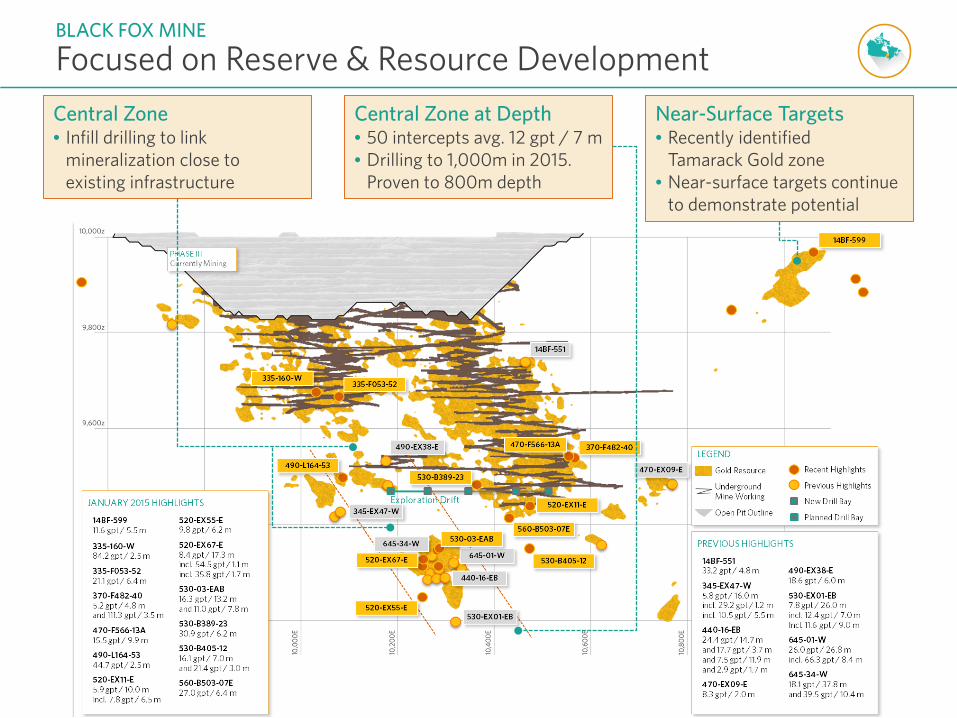
Focused on Reserve & Resource Development BLACK FOX MINE
Near-Surface Targets • Recently identified
Tamarack Gold zone • Near-surface targets continue
to demonstrate potential
Central Zone • Infill drilling to link
mineralization close to existing infrastructure
Central Zone at Depth • 50 intercepts avg. 12 gpt / 7 m • Drilling to 1,000m in 2015.
Proven to 800m depth
TSX P | NYSE PPP | 17
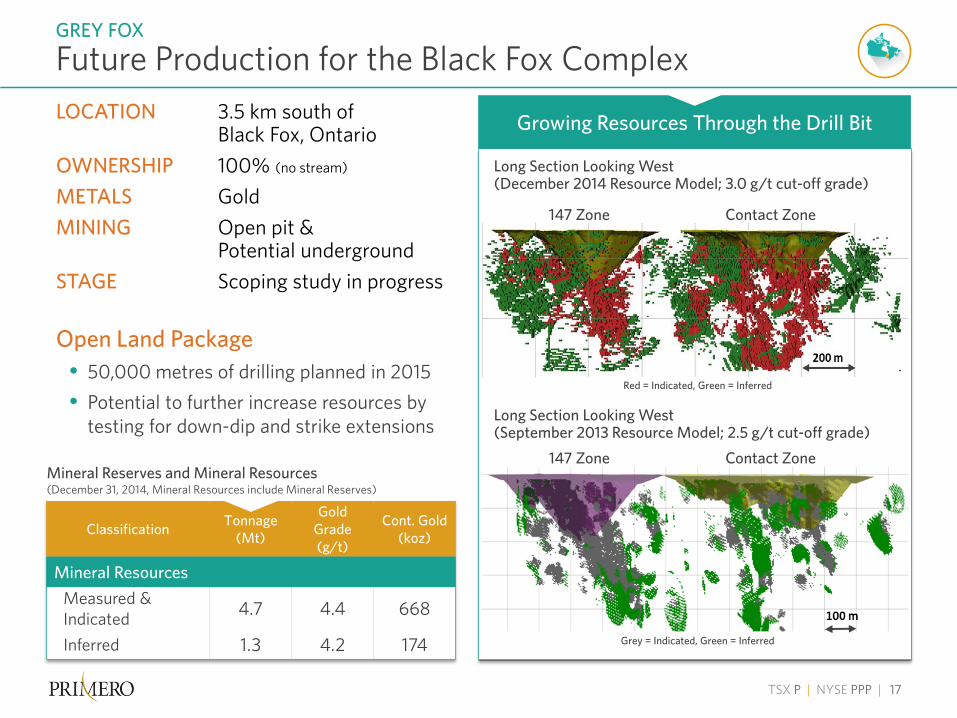
Open Land Package • 50,000 metres of drilling planned in 2015 • Potential to further increase resources by
testing for down-dip and strike extensions
Future Production for the Black Fox Complex GREY FOX
Growing Resources Through the Drill Bit
Long Section Looking West (September 2013 Resource Model; 2.5 g/t cut-off grade)
Long Section Looking West (December 2014 Resource Model; 3.0 g/t cut-off grade)
147 Zone Contact Zone
Grey = Indicated, Green = Inferred
Red = Indicated, Green = Inferred
147 Zone Contact Zone
Classification Tonnage (Mt)
Gold Grade (g/t)
Cont. Gold (koz)
Mineral Resources Measured & Indicated 4.7 4.4 668
Inferred 1.3 4.2 174
Mineral Reserves and Mineral Resources (December 31, 2014, Mineral Resources include Mineral Reserves)
LOCATION 3.5 km south of Black Fox, Ontario
OWNERSHIP 100% (no stream)
METALS Gold MINING Open pit &
Potential underground STAGE Scoping study in progress
TSX P | NYSE PPP | 18
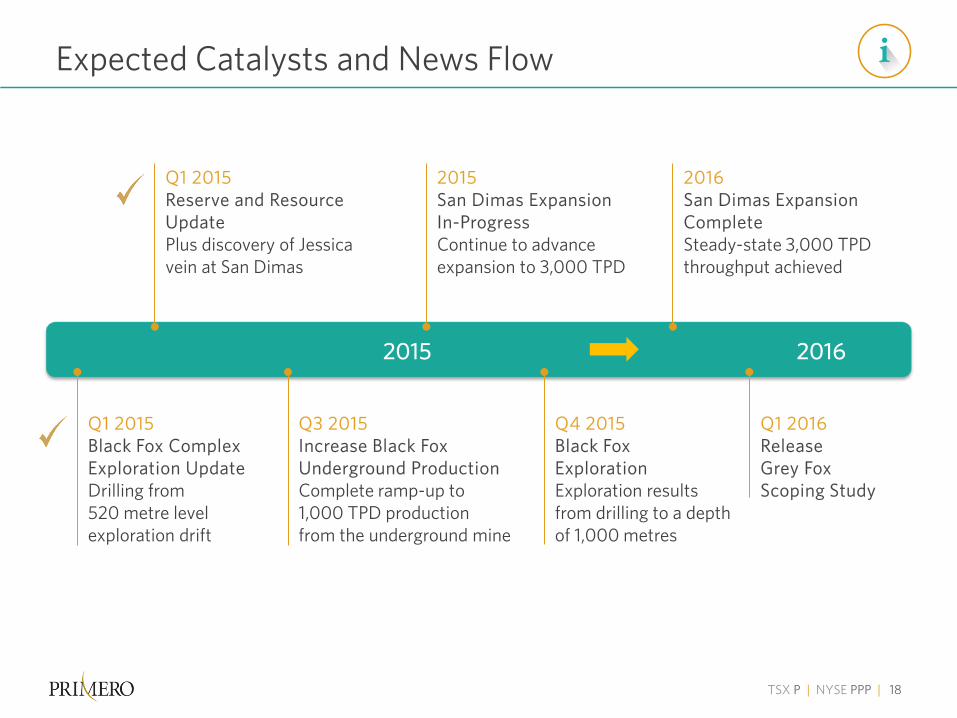
Expected Catalysts and News Flow
Q1 2015 Reserve and Resource Update Plus discovery of Jessica vein at San Dimas
Q1 2015 Black Fox Complex Exploration Update Drilling from 520 metre level exploration drift
Q1 2016 Release Grey Fox Scoping Study
2016 2015
Q3 2015 Increase Black Fox Underground Production Complete ramp-up to 1,000 TPD production from the underground mine
2015 San Dimas Expansion In-Progress Continue to advance expansion to 3,000 TPD
Q4 2015 Black Fox Exploration Exploration results from drilling to a depth of 1,000 metres
2016 San Dimas Expansion Complete Steady-state 3,000 TPD throughput achieved
TSX P | NYSE PPP | 19
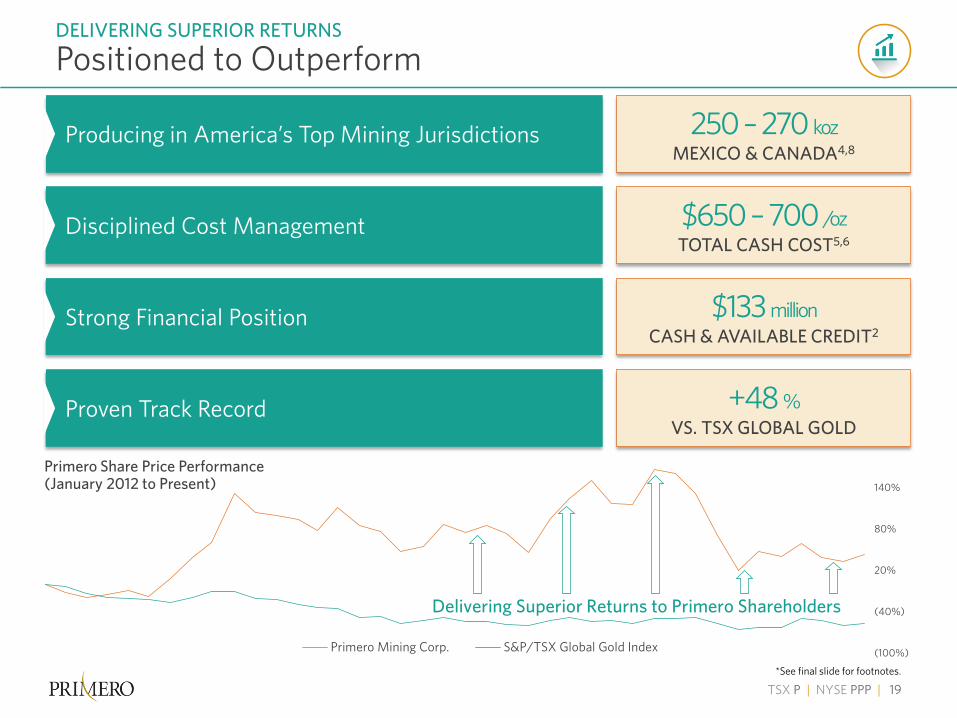
Positioned to Outperform DELIVERING SUPERIOR RETURNS
250 – 270 koz MEXICO & CANADA4,8
Primero Share Price Performance (January 2012 to Present)
*See final slide for footnotes.
Producing in America’s Top Mining Jurisdictions
Disciplined Cost Management
Strong Financial Position
Proven Track Record
$650 – 700 /oz TOTAL CASH COST5,6
$133 million CASH & AVAILABLE CREDIT2
+48 % VS. TSX GLOBAL GOLD
(100%)
(40%)
20%
80%
140%
Primero Mining Corp. S&P/TSX Global Gold Index
Delivering Superior Returns to Primero Shareholders
APPENDICES
TSX P | NYSE PPP | 21
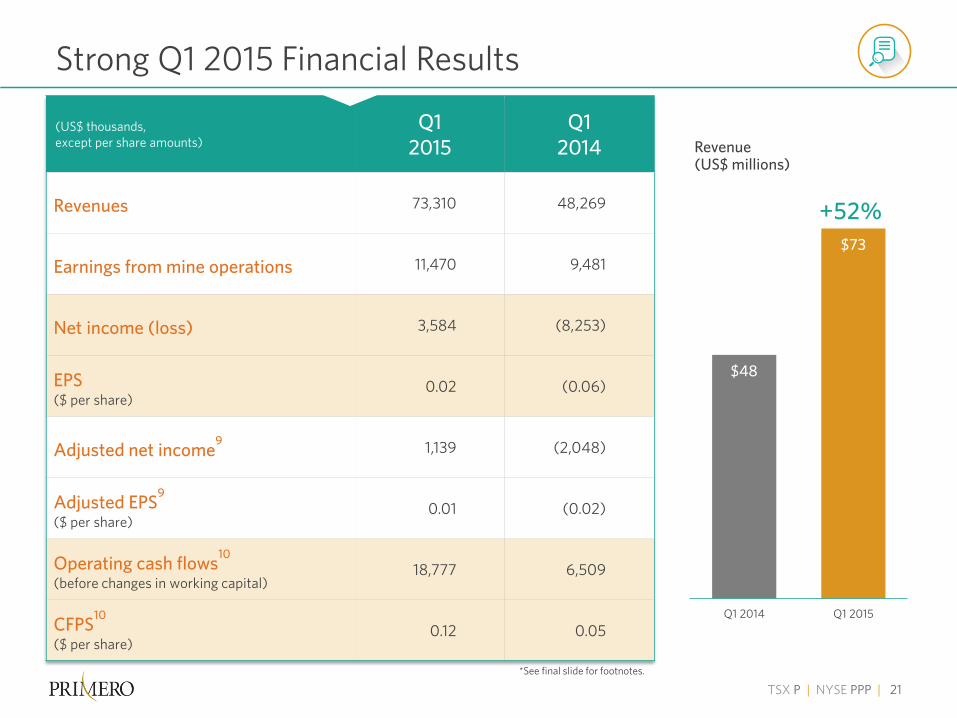
Strong Q1 2015 Financial Results
(US$ thousands, except per share amounts)
Q1 2015
Q1 2014
Revenues 73,310 48,269
Earnings from mine operations 11,470 9,481
Net income (loss) 3,584 (8,253)
EPS ($ per share)
0.02 (0.06)
Adjusted net income9 1,139 (2,048)
Adjusted EPS9 ($ per share)
0.01 (0.02)
Operating cash flows10 (before changes in working capital)
18,777 6,509
CFPS10 ($ per share)
0.12 0.05
$48
$73
Q1 2014 Q1 2015
+52%
*See final slide for footnotes.
Revenue (US$ millions)

TSX P | NYSE PPP | 22
Lower Capital Expenditures & Investment in Exploration 2015 GUIDANCE
Note: Figures may not add due to rounding.
Capital Expenditures Estimated 2015 Costs
San Dimas Underground Development $15.2 million
San Dimas Sustaining Capital $10.8 million
San Dimas Projects $15.4 million
San Dimas Sub Total $41.4 million
Black Fox Underground Development $13.4 million
Black Fox Sustaining Capital $4.5 million
Black Fox Projects $3.4 million
Grey Fox Development Studies $1.3 million
Black Fox Complex Sub Total $22.6 million
Cerro del Gallo Development $2.7 million
Total $66.7 million
2014 Capital Expenditure $80.5 million
Exploration Expenditures Estimated 2015 Costs
San Dimas Diamond Drilling $3.1 million
San Dimas Drifting $1.9 million
San Dimas Regional Diamond Drilling $0.9 million
Ventanas Regional Diamond Drilling *$0.5 million
San Dimas Sub Total $6.4 million
Black Fox Diamond Drilling $5.0 million
Grey Fox & Regional Exploration $7.3 million
Black Fox Complex Sub Total $12.3 million
Cerro del Gallo Geology Mapping $0.4 million
Total $19.1 million
2014 Exploration $34.3 million
TSX P | NYSE PPP | 23
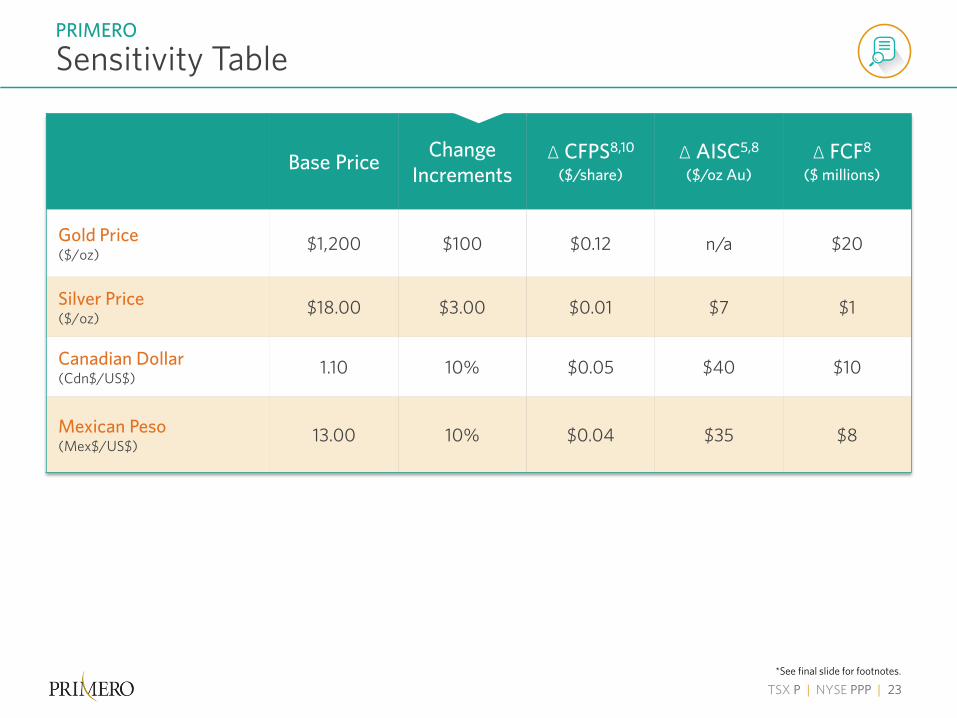
Sensitivity Table PRIMERO
Base Price Change Increments
Δ CFPS8,10
($/share) Δ AISC5,8
($/oz Au) Δ FCF8
($ millions)
Gold Price ($/oz)
$1,200 $100 $0.12 n/a $20
Silver Price ($/oz)
$18.00 $3.00 $0.01 $7 $1
Canadian Dollar (Cdn$/US$)
1.10 10% $0.05 $40 $10
Mexican Peso (Mex$/US$)
13.00 10% $0.04 $35 $8
*See final slide for footnotes.
TSX P | NYSE PPP | 24
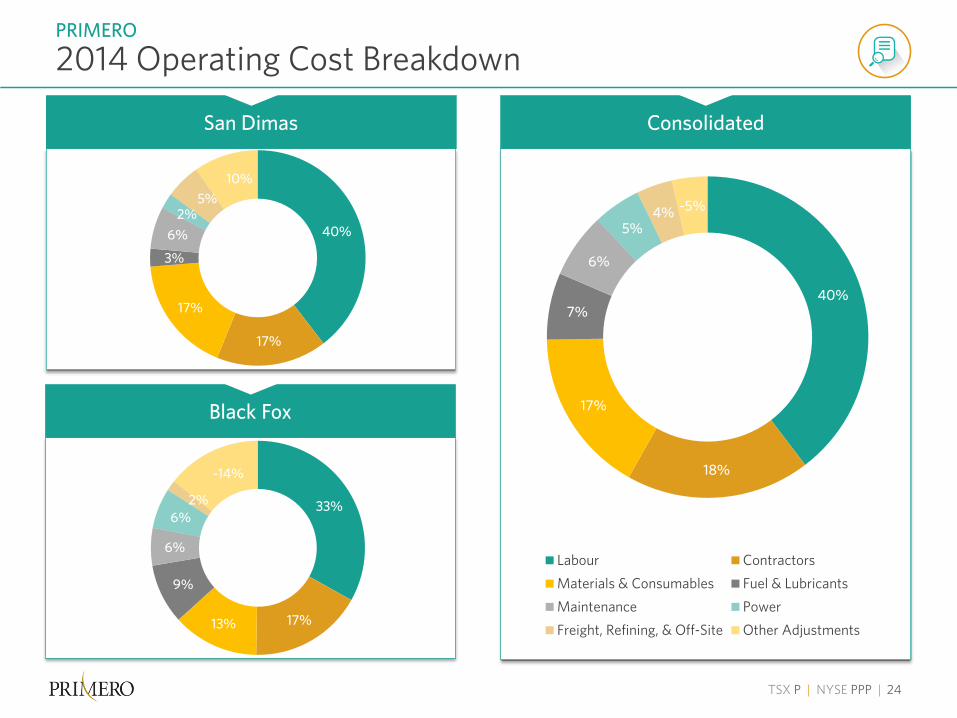
2014 Operating Cost Breakdown PRIMERO
40%
18%
17%
7%
6%
5% 4% -5%
Labour ContractorsMaterials & Consumables Fuel & LubricantsMaintenance PowerFreight, Refining, & Off-Site Other Adjustments
40%
17%
17%
3%
6% 2%
5% 10%
33%
17% 13%
9%
6%
6% 2%
-14%
Consolidated San Dimas
Black Fox
TSX P | NYSE PPP | 25
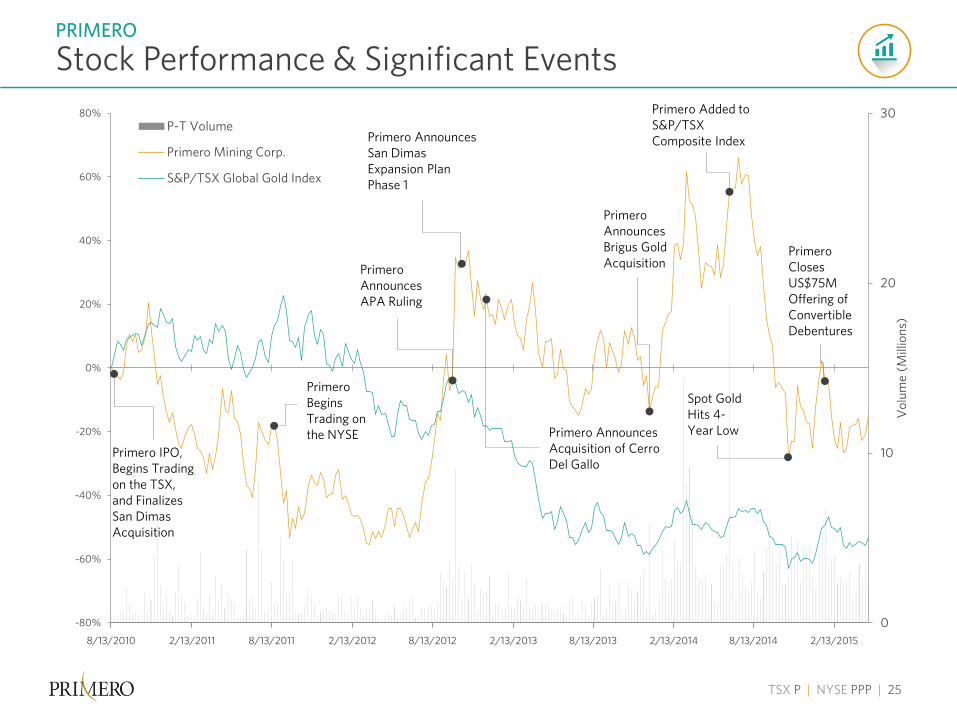
0
10
20
30
-80%
-60%
-40%
-20%
0%
20%
40%
60%
80%
8/13/2010 2/13/2011 8/13/2011 2/13/2012 8/13/2012 2/13/2013 8/13/2013 2/13/2014 8/13/2014 2/13/2015
Vol
ume
(Mill
ions
)
P-T Volume
Primero Mining Corp.
S&P/TSX Global Gold Index
Primero IPO, Begins Trading on the TSX, and Finalizes San Dimas Acquisition
Primero Announces Brigus Gold Acquisition
Primero Added to S&P/TSX Composite Index Primero Announces
San Dimas Expansion Plan Phase 1
Primero Begins Trading on the NYSE Primero Announces
Acquisition of Cerro Del Gallo
Primero Announces APA Ruling
Spot Gold Hits 4-Year Low
Primero Closes US$75M Offering of Convertible Debentures
PRIMERO
Stock Performance & Significant Events
TSX P | NYSE PPP | 26
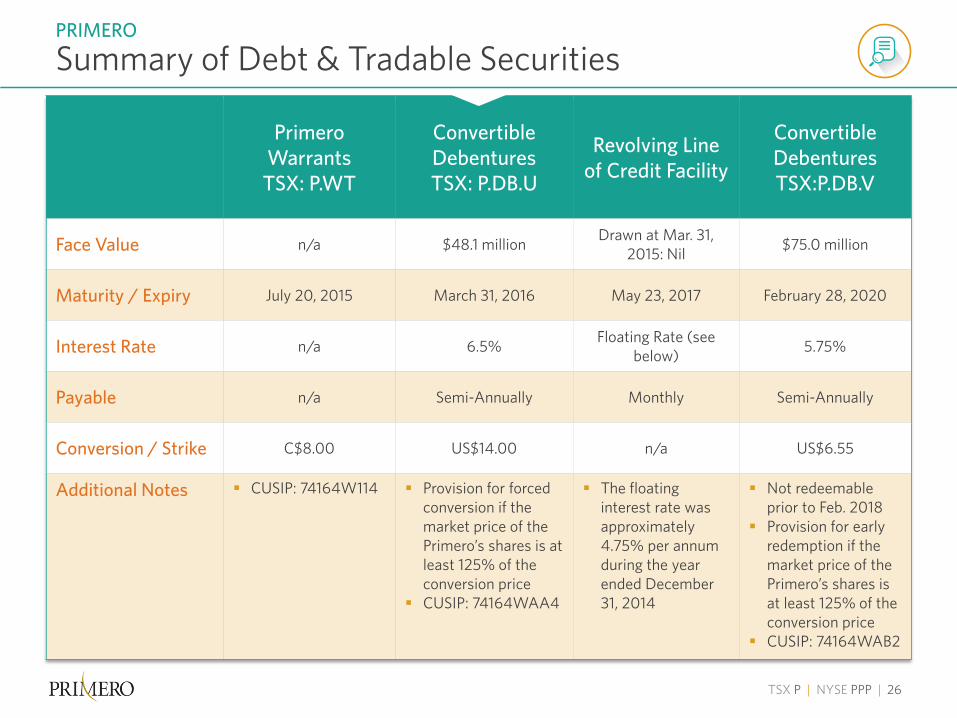
Primero Warrants TSX: P.WT
Convertible Debentures TSX: P.DB.U
Revolving Line of Credit Facility
Convertible Debentures TSX:P.DB.V
Face Value n/a $48.1 million Drawn at Mar. 31, 2015: Nil $75.0 million
Maturity / Expiry July 20, 2015 March 31, 2016 May 23, 2017 February 28, 2020
Interest Rate n/a 6.5% Floating Rate (see below) 5.75%
Payable n/a Semi-Annually Monthly Semi-Annually
Conversion / Strike C$8.00 US$14.00 n/a US$6.55
Additional Notes CUSIP: 74164W114 Provision for forced conversion if the market price of the Primero’s shares is at least 125% of the conversion price
CUSIP: 74164WAA4
The floating interest rate was approximately 4.75% per annum during the year ended December 31, 2014
Not redeemable prior to Feb. 2018
Provision for early redemption if the market price of the Primero’s shares is at least 125% of the conversion price
CUSIP: 74164WAB2
Summary of Debt & Tradable Securities PRIMERO
TSX P | NYSE PPP | 27
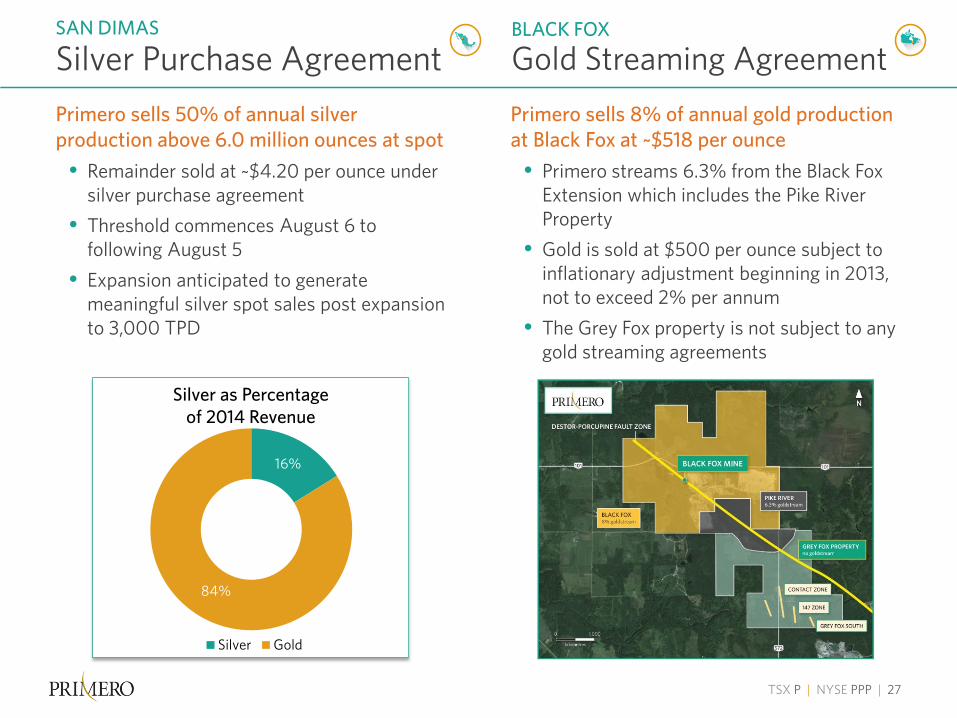
Primero sells 8% of annual gold production at Black Fox at ~$518 per ounce
• Primero streams 6.3% from the Black Fox Extension which includes the Pike River Property
• Gold is sold at $500 per ounce subject to inflationary adjustment beginning in 2013, not to exceed 2% per annum
• The Grey Fox property is not subject to any gold streaming agreements
Silver Purchase Agreement SAN DIMAS BLACK FOX
Gold Streaming Agreement
16%
84%
Silver Gold
Silver as Percentage of 2014 Revenue
Primero sells 50% of annual silver production above 6.0 million ounces at spot
• Remainder sold at ~$4.20 per ounce under silver purchase agreement
• Threshold commences August 6 to following August 5
• Expansion anticipated to generate meaningful silver spot sales post expansion to 3,000 TPD
TSX P | NYSE PPP | 28
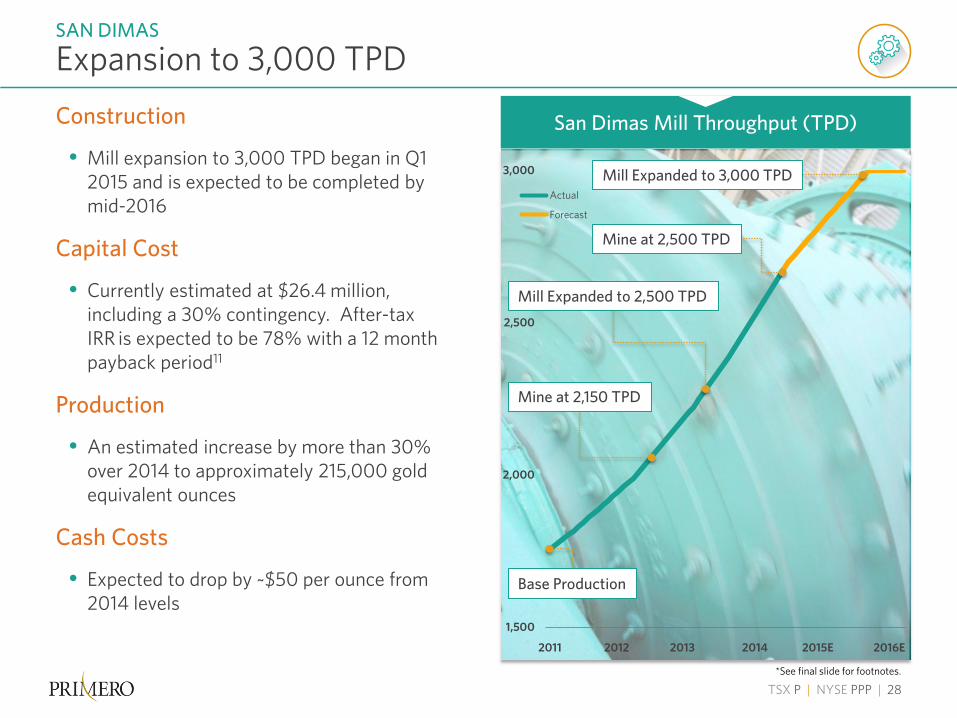
Construction
• Mill expansion to 3,000 TPD began in Q1 2015 and is expected to be completed by mid-2016
Capital Cost
• Currently estimated at $26.4 million, including a 30% contingency. After-tax IRR is expected to be 78% with a 12 month payback period11
Production
• An estimated increase by more than 30% over 2014 to approximately 215,000 gold equivalent ounces
Cash Costs
• Expected to drop by ~$50 per ounce from 2014 levels
Expansion to 3,000 TPD SAN DIMAS
1,500
2,000
2,500
3,000
Actual
Forecast
Base Production
Mine at 2,150 TPD
Mill Expanded to 2,500 TPD
Mine at 2,500 TPD
Mill Expanded to 3,000 TPD
2011 2012 2013 2014 2015E 2016E
San Dimas Mill Throughput (TPD)
*See final slide for footnotes.
TSX P | NYSE PPP | 29
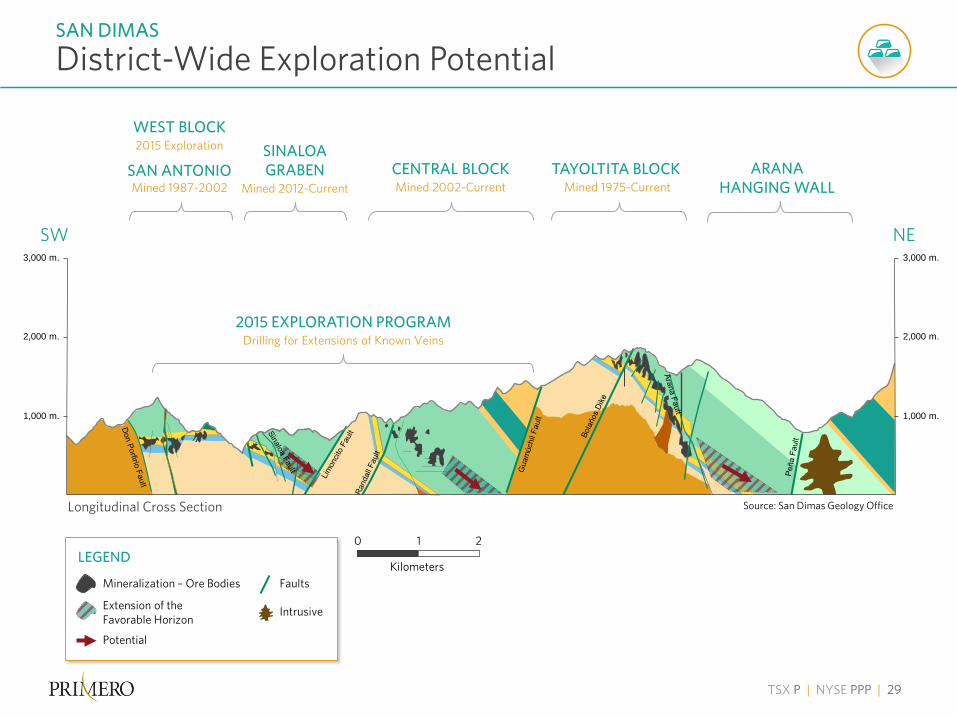
District-Wide Exploration Potential SAN DIMAS
SW NE 3,000 m.
2,000 m.
1,000 m.
Source: San Dimas Geology Office
WEST BLOCK 2015 Exploration
SAN ANTONIO Mined 1987-2002
CENTRAL BLOCK Mined 2002-Current
TAYOLTITA BLOCK Mined 1975-Current
ARANA HANGING WALL
SINALOA GRABEN
Mined 2012-Current
2015 EXPLORATION PROGRAM Drilling for Extensions of Known Veins
Longitudinal Cross Section
3,000 m.
2,000 m.
1,000 m.
Mineralization – Ore Bodies
Extension of the Favorable Horizon
Potential
Intrusive
Faults
LEGEND Kilometers
0 1 2

TSX P | NYSE PPP | 30
Grey Fox • Gold resources hosted
primarily in 3 zones: Contact, 147, & Grey Fox South
• Mineralization consistent with Brittle Deformation emplacement
• Bounded by the Destor-Porcupine and Gibson-Kelore faults
Contact Zone • Gold mineralization traced
over 600 x 550 metres, and to a depth of 700 metres. Remains open to the north and at depth.
147 Zone • Gold mineralization traced
over 700 x 500 metres, and to a depth of 500 metres.
Grey Fox South • Gold mineralization traced
over 700 x 500 metres, and to a depth of 400 metres.
The Continuation of a Regional Play GREY FOX
Contact Zone
147 Variolitic Volcanic
Sedimentary Unit
Mafic Volcanic
Mafic Intrusive
Variolitic Volcanic
Mafic Volcanic
Ultramafic Volcanic
147 Zone
GF South
Contact Zone
Black Fox Mine
Grey Fox Project
Hislop Mine
1.3 km & Open to
the North

TSX P | NYSE PPP | 31
Depositional Model BLACK FOX COMPLEX
Colvine et al. (1988)
Troop (1985)
Archean Lode Gold Deposits Depositional Model
147 &Contact Zones • Mineralization
predominantly in stockwork structures
Black Fox Mine • Mineralization
predominantly in vein structures
Producing & Past-Producing Mines
Ross Mine Composite Level Plans
Upper Portion of the Ross Mine Shows Mineralization Characteristics Similar to the Grey Fox 147 Zone
• Ross Mine is located 3 km south of the 147 Zone
• Ross Mine produced over 1 million ounces at 4.7 g/t average grade.
• Note the change in ore body shape over a vertical range of 1 km as one moves from a brittle to a ductile environment.
TSX P | NYSE PPP | 32
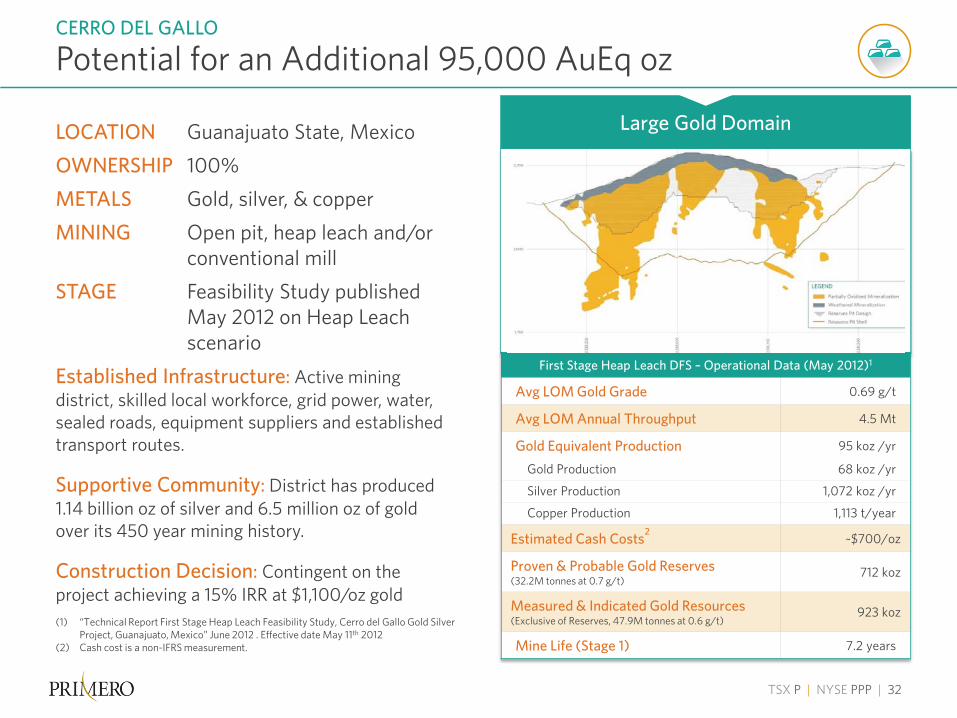
Potential for an Additional 95,000 AuEq oz CERRO DEL GALLO
(1) “Technical Report First Stage Heap Leach Feasibility Study, Cerro del Gallo Gold Silver
Project, Guanajuato, Mexico” June 2012 . Effective date May 11th 2012 (2) Cash cost is a non-IFRS measurement.
LOCATION Guanajuato State, Mexico OWNERSHIP 100% METALS Gold, silver, & copper MINING Open pit, heap leach and/or conventional mill STAGE Feasibility Study published May 2012 on Heap Leach scenario Established Infrastructure: Active mining district, skilled local workforce, grid power, water, sealed roads, equipment suppliers and established transport routes.
Supportive Community: District has produced 1.14 billion oz of silver and 6.5 million oz of gold over its 450 year mining history.
Construction Decision: Contingent on the project achieving a 15% IRR at $1,100/oz gold
First Stage Heap Leach DFS – Operational Data (May 2012)1
Avg LOM Gold Grade 0.69 g/t
Avg LOM Annual Throughput 4.5 Mt
Gold Equivalent Production 95 koz /yr
Gold Production 68 koz /yr
Silver Production 1,072 koz /yr
Copper Production 1,113 t/year
Estimated Cash Costs2 ~$700/oz
Proven & Probable Gold Reserves (32.2M tonnes at 0.7 g/t)
712 koz
Measured & Indicated Gold Resources (Exclusive of Reserves, 47.9M tonnes at 0.6 g/t)
923 koz
Mine Life (Stage 1) 7.2 years
Large Gold Domain
TSX P | NYSE PPP | 33
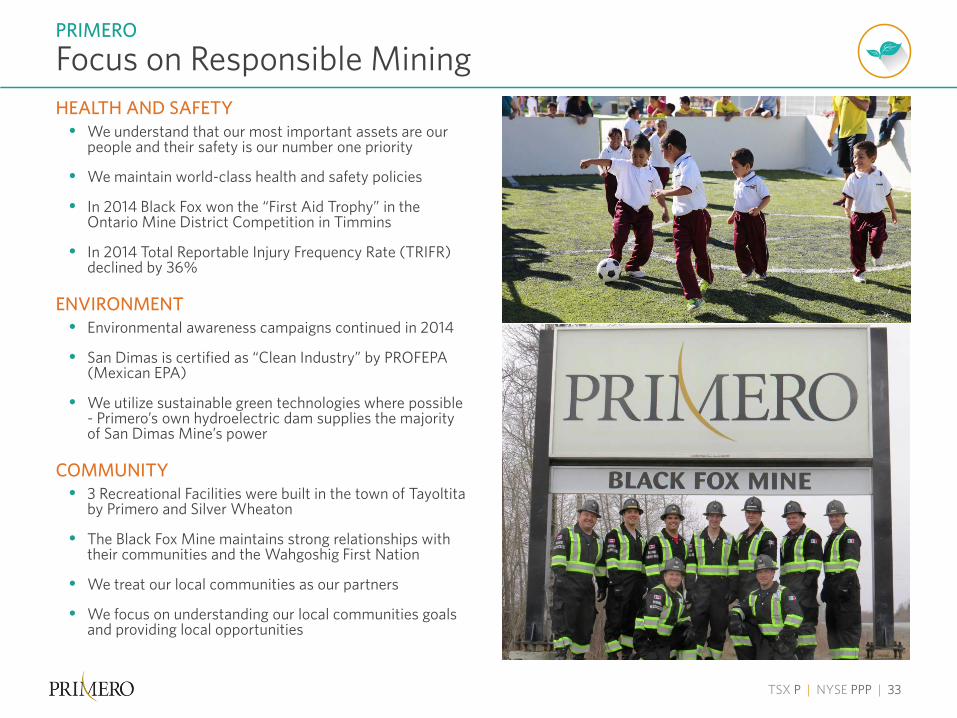
HEALTH AND SAFETY • We understand that our most important assets are our
people and their safety is our number one priority
• We maintain world-class health and safety policies
• In 2014 Black Fox won the “First Aid Trophy” in the Ontario Mine District Competition in Timmins
• In 2014 Total Reportable Injury Frequency Rate (TRIFR) declined by 36%
ENVIRONMENT • Environmental awareness campaigns continued in 2014
• San Dimas is certified as “Clean Industry” by PROFEPA (Mexican EPA)
• We utilize sustainable green technologies where possible - Primero’s own hydroelectric dam supplies the majority of San Dimas Mine’s power
COMMUNITY • 3 Recreational Facilities were built in the town of Tayoltita
by Primero and Silver Wheaton
• The Black Fox Mine maintains strong relationships with their communities and the Wahgoshig First Nation
• We treat our local communities as our partners
• We focus on understanding our local communities goals and providing local opportunities
Focus on Responsible Mining PRIMERO
TSX P | NYSE PPP | 34
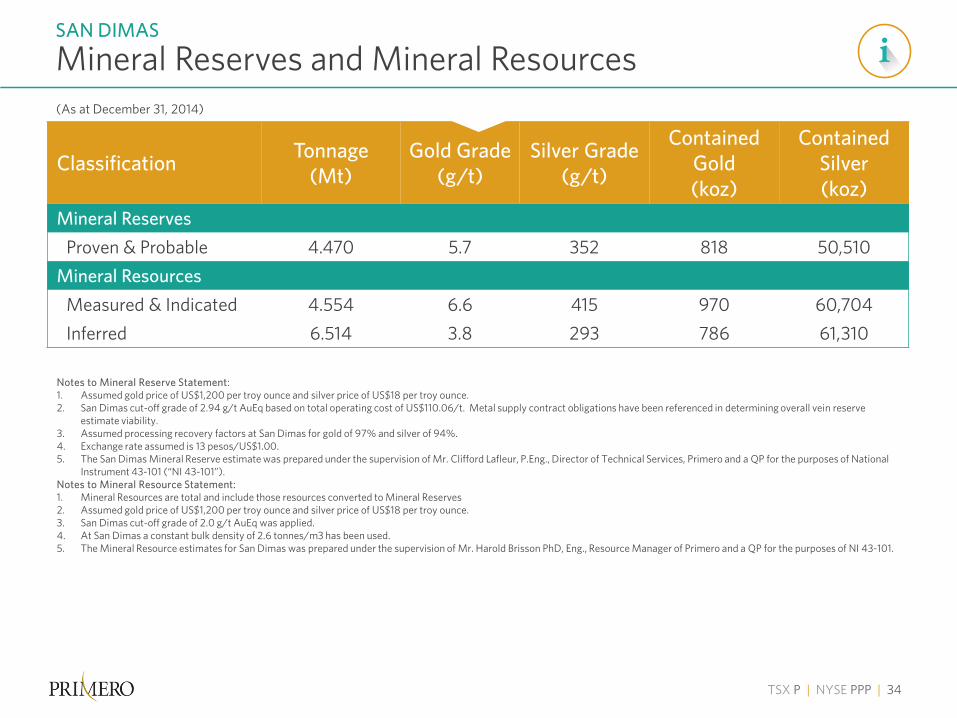
Mineral Reserves and Mineral Resources SAN DIMAS
(As at December 31, 2014)
Classification Tonnage (Mt)
Gold Grade (g/t)
Silver Grade (g/t)
Contained Gold (koz)
Contained Silver (koz)
Mineral Reserves Proven & Probable 4.470 5.7 352 818 50,510
Mineral Resources Measured & Indicated 4.554 6.6 415 970 60,704 Inferred 6.514 3.8 293 786 61,310
Notes to Mineral Reserve Statement: 1. Assumed gold price of US$1,200 per troy ounce and silver price of US$18 per troy ounce. 2. San Dimas cut-off grade of 2.94 g/t AuEq based on total operating cost of US$110.06/t. Metal supply contract obligations have been referenced in determining overall vein reserve
estimate viability. 3. Assumed processing recovery factors at San Dimas for gold of 97% and silver of 94%. 4. Exchange rate assumed is 13 pesos/US$1.00. 5. The San Dimas Mineral Reserve estimate was prepared under the supervision of Mr. Clifford Lafleur, P.Eng., Director of Technical Services, Primero and a QP for the purposes of National
Instrument 43-101 (“NI 43-101”). Notes to Mineral Resource Statement: 1. Mineral Resources are total and include those resources converted to Mineral Reserves 2. Assumed gold price of US$1,200 per troy ounce and silver price of US$18 per troy ounce. 3. San Dimas cut-off grade of 2.0 g/t AuEq was applied. 4. At San Dimas a constant bulk density of 2.6 tonnes/m3 has been used. 5. The Mineral Resource estimates for San Dimas was prepared under the supervision of Mr. Harold Brisson PhD, Eng., Resource Manager of Primero and a QP for the purposes of NI 43-101.
TSX P | NYSE PPP | 35
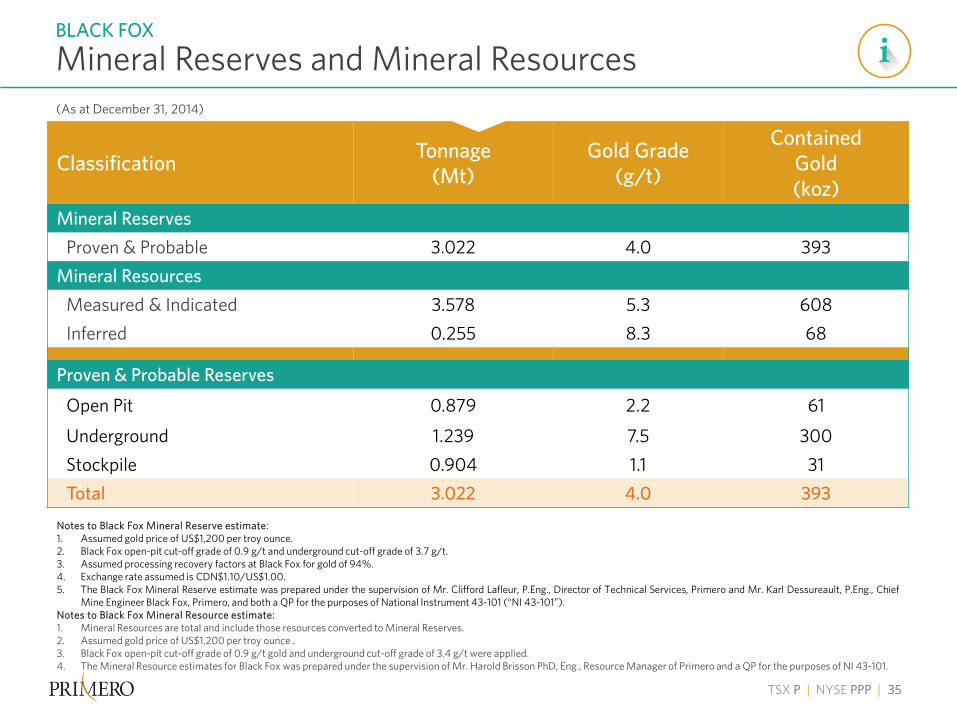
Classification Tonnage (Mt)
Gold Grade (g/t)
Contained Gold (koz)
Mineral Reserves Proven & Probable 3.022 4.0 393
Mineral Resources Measured & Indicated 3.578 5.3 608 Inferred 0.255 8.3 68
Proven & Probable Reserves
Open Pit 0.879 2.2 61
Underground 1.239 7.5 300 Stockpile 0.904 1.1 31 Total 3.022 4.0 393
Mineral Reserves and Mineral Resources BLACK FOX
(As at December 31, 2014)
Notes to Black Fox Mineral Reserve estimate: 1. Assumed gold price of US$1,200 per troy ounce. 2. Black Fox open-pit cut-off grade of 0.9 g/t and underground cut-off grade of 3.7 g/t. 3. Assumed processing recovery factors at Black Fox for gold of 94%. 4. Exchange rate assumed is CDN$1.10/US$1.00. 5. The Black Fox Mineral Reserve estimate was prepared under the supervision of Mr. Clifford Lafleur, P.Eng., Director of Technical Services, Primero and Mr. Karl Dessureault, P.Eng., Chief
Mine Engineer Black Fox, Primero, and both a QP for the purposes of National Instrument 43-101 (“NI 43-101”). Notes to Black Fox Mineral Resource estimate: 1. Mineral Resources are total and include those resources converted to Mineral Reserves. 2. Assumed gold price of US$1,200 per troy ounce . 3. Black Fox open-pit cut-off grade of 0.9 g/t gold and underground cut-off grade of 3.4 g/t were applied. 4. The Mineral Resource estimates for Black Fox was prepared under the supervision of Mr. Harold Brisson PhD, Eng., Resource Manager of Primero and a QP for the purposes of NI 43-101.
TSX P | NYSE PPP | 36
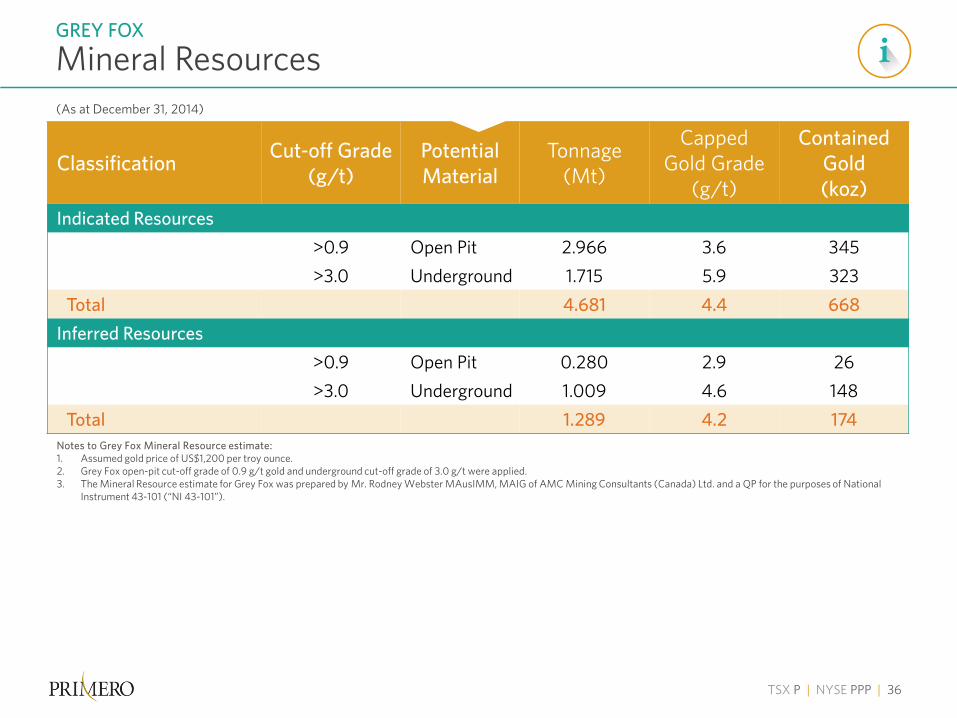
Mineral Resources GREY FOX
(As at December 31, 2014)
Classification Cut-off Grade (g/t)
Potential Material
Tonnage (Mt)
Capped Gold Grade
(g/t)
Contained Gold (koz)
Indicated Resources >0.9 Open Pit 2.966 3.6 345 >3.0 Underground 1.715 5.9 323
Total 4.681 4.4 668 Inferred Resources
>0.9 Open Pit 0.280 2.9 26 >3.0 Underground 1.009 4.6 148
Total 1.289 4.2 174 Notes to Grey Fox Mineral Resource estimate: 1. Assumed gold price of US$1,200 per troy ounce. 2. Grey Fox open-pit cut-off grade of 0.9 g/t gold and underground cut-off grade of 3.0 g/t were applied. 3. The Mineral Resource estimate for Grey Fox was prepared by Mr. Rodney Webster MAusIMM, MAIG of AMC Mining Consultants (Canada) Ltd. and a QP for the purposes of National
Instrument 43-101 (“NI 43-101”).

TSX P | NYSE PPP | 37
Reserves and In-Pit Resources1 CERRO DEL GALLO
1. “Technical Report First Stage Heap Leach Feasibility Study, Cerro del Gallo Gold Silver Project, Guanajuato, Mexico” June 2012 (“Feasibility Study”). Gold equivalent ounces calculated by Cerro Resources using gold, silver and copper prices of US$1,341/oz, US$25.58/oz and US$7,582/t respectively. 2. These resources are reported using internal cut-off grade of 0.2 g/tAu as per Feasibility Study, 2012 and Golder Associates Technical Report, 2008.
Phase I Heap Leach In-Pit Proven and Probable Reserves3 Proven 28.2 0.71 0.64 15.1 13.7 0.08 50.2 1.15 1.05 Probable 4.0 0.54 0.07 13.2 1.7 0.07 6.2 0.93 0.12 Proven & Probable 32.2 0.69 0.71 14.8 15.3 0.08 56.4 1.14 1.18
In-Pit Resources (excluding Proven and Probable Reserves)4,5 Measured 39.9 0.61 0.78 13.8 17.71 0.10 88.8 1.07 1.37 Indicated 8.0 0.55 0.14 11.0 2.83 0.08 14.6 0.92 0.24 Measured & Indicated 47.9 0.60 0.92 13.3 20.55 0.1 103.4 1.06 1.64
Category Tonnage (Mt)
Gold Grade (g/t)
Contained Gold
(Moz)
Silver Grade (g/t)
Contained Silver
(Moz)
Copper Grade
(%)
Contained Copper (Mlb)
AuEq Grade (g/t)
Contained AuEq (Moz)
Total Resources Within the Gold Domain2 Measured 129 0.54 2.24 12.0 49.8 0.09 256.0 0.94 3.91 Indicated 80 0.38 0.98 8.0 20.6 0.08 141.1 0.69 1.77 Measured & Indicated 209 0.48 3.22 11.0 70.3 0.08 396.9 0.83 5.58 Inferred 20 0.3 0.19 7.0 4.5 0.09 39.7 0.59 0.38
3. These reserves are reported using internal cut-off grades of 0.24 and 0.29 gAuEq/t for weathered and partially oxidized, respectively.
4. These resources are reported using internal cut-off grades of 0.24, 0.29, and 0.34 gAuEq/t for weathered, partially oxidized, and fresh material resp. 5. See note 7 in January 23, 2013 News Release “Primero achieves 2012 Guidance and Provides 2013 Outlook”.

TSX P | NYSE PPP | 38
Tamara Brown | VP, Investor Relations • Former Director Investor Relations for IAMGOLD • Former partner of a Toronto based, boutique investment bank and
professional engineer in mining industry
H. Maura Lendon | Chief General Counsel and Corporate Secretary • Former Senior Vice President, Chief Legal Officer and Corporate
Secretary of HudBay Minerals Inc.; Chief Counsel Canada, Chief Privacy Officer - Canada of AT&T
David Sandison | VP, Corporate Development • Former VP, Corporate Development of
Clarity Capital ; Director, Corporate Development Xstrata Zinc Canada ; Director Business Development, Noranda/Falconbridge; Former EVP, Noranda Chile
Louis Toner | VP, Project Development & Construction • Over 30 Years of Engineering and Construction experience,
formerly held Senior Project Management roles with BBA Inc. and Lafarge Canada Inc.
Gabriel Voicu | VP, Geology and Exploration • 25 Years of mining experience, formerly held senior technical and
exploration positions with Cambior and IAMGOLD
James Mallory | VP, Corporate Responsibility • Over 35 Years of mining experience • Former VP, Vice-President, Operations & Social Responsibility at
South American Silver • 13 Years of experience in Latin America
Joseph Conway | Chief Executive Officer • 30 Years of experience • Appointed President and CEO in June 2010 • Former CEO, President & Director of IAMGOLD and Repadre
Capital
Wendy Kaufman | Chief Financial Officer • 20 Years of experience • Appointed CFO in September 2014 • Former VP, Finance and Treasurer of Inmet Mining Corporation
Executive Management
Ernest Mast | President & COO • 25 Years of experience • Appointed President & COO in Feb. 2015 • Former President & CEO – Minera Panama (Inmet), VP Ops. –
New Gold.
Maria-Luisa Sinclair | VP, Human Resources • 25 Years of international Human Resources experience in the
mining sector with particular expertise in Latin America. • Held key human resources positions with Placer Dome, Pan
American Silver, Baja Mining, and Skye Resources.
TSX P | NYSE PPP | 39
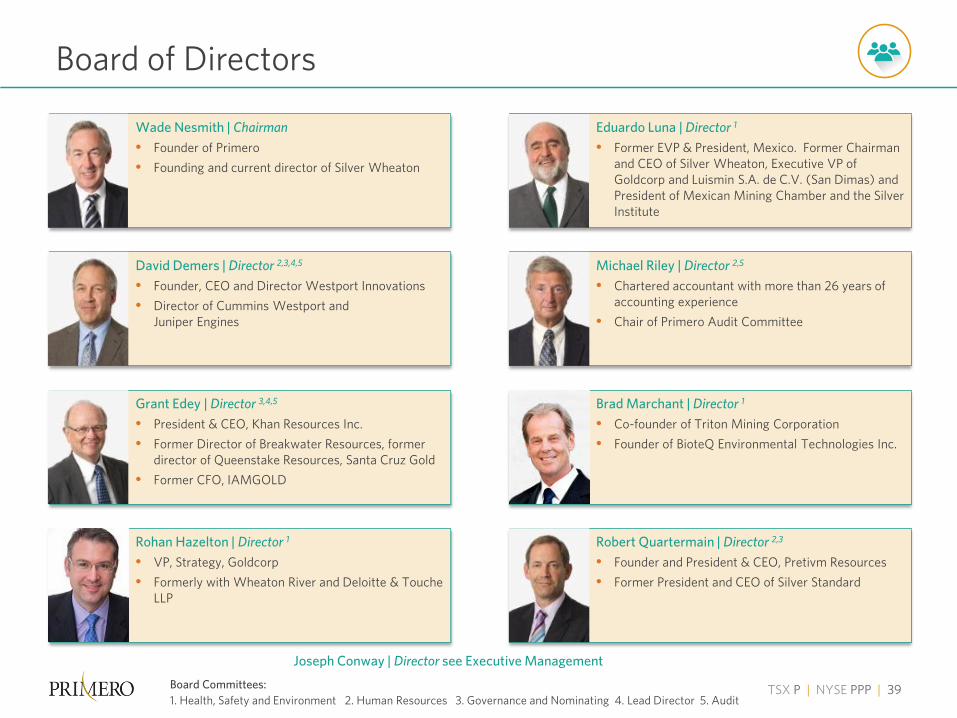
Robert Quartermain | Director 2,3
• Founder and President & CEO, Pretivm Resources • Former President and CEO of Silver Standard
Brad Marchant | Director 1
• Co-founder of Triton Mining Corporation • Founder of BioteQ Environmental Technologies Inc.
Michael Riley | Director 2,5
• Chartered accountant with more than 26 years of accounting experience
• Chair of Primero Audit Committee
Eduardo Luna | Director 1
• Former EVP & President, Mexico. Former Chairman and CEO of Silver Wheaton, Executive VP of Goldcorp and Luismin S.A. de C.V. (San Dimas) and President of Mexican Mining Chamber and the Silver Institute
Rohan Hazelton | Director 1
• VP, Strategy, Goldcorp • Formerly with Wheaton River and Deloitte & Touche
LLP
Grant Edey | Director 3,4,5
• President & CEO, Khan Resources Inc. • Former Director of Breakwater Resources, former
director of Queenstake Resources, Santa Cruz Gold • Former CFO, IAMGOLD
David Demers | Director 2,3,4,5
• Founder, CEO and Director Westport Innovations • Director of Cummins Westport and
Juniper Engines
Wade Nesmith | Chairman • Founder of Primero • Founding and current director of Silver Wheaton
Board of Directors
Board Committees: 1. Health, Safety and Environment 2. Human Resources 3. Governance and Nominating 4. Lead Director 5. Audit
Joseph Conway | Director see Executive Management
TSX P | NYSE PPP | 40
This presentation has been prepared in accordance with the requirements of Canadian provincial securities laws which differ from the requirements of U.S. securities laws. Unless otherwise indicated, all mineral reserve and resource estimates included in this presentation have been prepared in accordance with Canadian National Instrument 43-101 Standards of Disclosure for Mineral Projects (“NI 43-101”) and the Canadian Institute of Mining, Metallurgy and Petroleum classification systems. NI 43-101 is a rule developed by the Canadian Securities Administrators that establishes standards for all public disclosure an issuer makes of scientific and technical information concerning mineral projects. These standards differ significantly from the requirements of the United States Securities and Exchange Commission (the “SEC”), and reserve and resource estimates disclosed in this presentation may not be comparable to similar information disclosed by U.S. companies. The mineral reserve estimates in this presentation have been calculated in accordance with NI 43-101, as required by Canadian securities regulatory authorities. For United States reporting purposes, SEC Industry Guide 7 under the United States Securities Exchange Act of 1934, as amended, as interpreted by Staff of the SEC, applies different standards in order to classify mineralization as a reserve. As a result, the definition of “probable reserves” used in NI 43-101 differs from the definition in the SEC Industry Guide 7. Under SEC standards, mineralization may not be classified as a “reserve” unless the determination has been made that the mineralization could be economically and legally produced or extracted at the time the reserve determination is made. Among other things, all necessary permits would be required to be in hand or issuance imminent in order to classify mineralized material as reserves under the SEC standards. Accordingly, mineral reserve estimates contained in this presentation may not qualify as “reserves” under SEC standards. In addition, this presentation uses the terms “indicated resources” and “inferred resources” to comply with the reporting standards in Canada. The Company advises United States investors that while those terms are recognized and required by Canadian regulations, the SEC does not recognize them. United States investors are cautioned not to assume that any part or all of the mineral deposits in these categories will ever be converted into mineral reserves. Further, “inferred resources” have a great amount of uncertainty as to their existence and as to whether they can be mined legally or economically. Therefore, United States investors are also cautioned not to assume that all or any part of the “inferred resources” exist. In accordance with Canadian securities laws, estimates of “inferred resources” cannot form the basis of feasibility or other economic studies. It cannot be assumed that all or any part of “indicated resources” or “inferred resources” will ever be upgraded to a higher category or are economically or legally mineable. In addition, disclosure of “contained ounces” is permitted disclosure under Canadian securities laws; however, the SEC only permits issuers to report mineralization as in place tonnage and grade without reference to unit measures. NI 43-101 also permits the inclusion of disclosure regarding the potential quantity and grade, expressed as ranges, of a target for further exploration provided that the disclosure (i) states with equal prominence that the potential quantity and grade is conceptual in nature, that there has been insufficient exploration to define a mineral resource and that it is uncertain if further exploration will result in the target being delineated as a mineral resources, and (ii) states the basis on which the disclosed potential quantity and grade has been determined. Disclosure regarding exploration potential has been included in this presentation. United States investors are cautioned that disclosure of such exploration potential is conceptual in nature by definition and there is no assurance that exploration will result in any category of NI 43-101 mineral resources being identified.
Notes to Investors Regarding the Use of Resources

TSX P | NYSE PPP | 41
1. $48.1 million senior unsecured convertible debenture (acquired from Brigus, with a 6.5% coupon an effective conversion price of US$14.00 and an expiry of March 2016); US$75 million convertible, unsecured, subordinated debentures; and nil draw down from line of credit. Excludes capital leases.
2. The Company closed a $75 million line of credit on May 23, 2014 and has drawn down nil as of March 31, 2015. 3. Fully diluted shares include 20.8 million warrants with an exercise price of Cdn$8.00 per share, expiring on July 20, 2015; and 10.4 million options
with an average exercise price of Cdn$5.96. 4. “Gold equivalent ounces” include silver ounces produced at San Dimas, and converted to a gold equivalent based on a ratio of the average commodity
prices realized for each period. Silver production is subject to a silver purchase agreement. The silver purchase agreement dictates that until August 6, 2014 Primero will deliver to Silver Wheaton a per annum amount equal to the first 3.5 million ounces of silver produced at San Dimas and 50% of any excess at $4.16 per ounce (increasing by 1% per year). Thereafter Primero will deliver to Silver Wheaton a per annum amount equal to the first 6.0 million ounces of silver produced at San Dimas and 50% of any excess at $4.20 per ounce (increasing by 1% per year). The Company will receive silver spot prices only after the annual threshold amount has been delivered. Black Fox is subject to a gold purchase agreement under which Sandstorm is entitled to 8% of production at the Black Fox mine and 6.3% at the Black Fox Extension.
5. Cash costs and All-in Sustaining Costs are non-GAAP measures. Refer to the Company’s first quarter 2015 MD&A for a reconciliation to operating expenses. Note the calculation of all-in sustaining costs at San Dimas changed with the acquisition of a second producing asset and subsequently do not include corporate G&A.
6. Major assumptions include a flat gold price per ounce of $1,200, a flat silver price per ounce of $18. 7. Assumes San Dimas operates at least at 3,000 TPD from end of Q2 2016; and Primero management estimates for Black Fox production, based on
2,200-2,300 TPD operation and underground throughput increasing to 1,000 TPD by the end of 2015. 8. Based on 2015 Guidance, refer to news release dated January 20, 2015 “Primero Increases Production by 57% in 2014 and Expects a Further 20%
Increase in 2015” as filed on www.sedar.com. 9. Adjusted net income/earnings and adjusted net income/earnings per share are non-GAAP measures. Neither of these non-GAAP performance
measures has any standardized meaning and is therefore unlikely to be comparable to other measures presented by other issuers. The Company believes that, in addition to conventional measures prepared in accordance with GAAP, the Company and certain investors use this information to evaluate the Company’s performance. Accordingly, it is intended to provide additional information and should not be considered in isolation or as a substitute for measures of performance prepared in accordance with GAAP. Refer to the Company’s first quarter 2015 MD&A for a reconciliation of adjusted net income/earnings to reported net income.
10. “Operating cash flow” is operating cash flow before working capital changes. This and operating cash flows before working capital changes per share (CFPS) are non-GAAP measures which the Company believes provides a better indicator of the Company’s ability to generate cash flow from its mining operations. See the Company’s first quarter 2015 MD&A for a reconciliation of operating cash flows to GAAP.
11. The Company currently estimates that expanding the San Dimas mill to 3,000 TPD will require approximately $26.4 million of capital investment, with approximately $6 million expenditure expected in 2014 and the remainder spread over the following eighteen months. As a result of the preliminary nature of the capital assessment a contingency factor of 30% has been included in the capital estimate.
Footnotes

TSX P | NYSE PPP | 42
Notes
TSX P | NYSE PPP | 43
Notes
PRIMERO MINING CORP. 79 Wellington St. West, Suite 2100 Toronto, ON M5K 1H1 T 416 814 3160 TF 877 619 3160 www.primeromining.com
Tamara Brown Vice President, Investor Relations T 416 814 3168 [email protected]
June 15-17, 2015
RBC Capital Markets 2015 Global Mining & Materials Conference