RBA Overview for Connecticut Nonprofits and Communities
93
I N N O V A T I The Charter Oak Group, LLC Rev. 1 (12/31/11) RBA Overview for Connecticut Nonprofits and Communities
-
Upload
adrian-patton -
Category
Documents
-
view
34 -
download
2
description
RBA Overview for Connecticut Nonprofits and Communities. The Charter Oak Group, LLC Rev. 1 (12/31/11). Results-Based Accountability™. Mark Friedman Fiscal Policy Studies Institute Santa Fe, New Mexico. WEBSITES www.resultsacountability.com www.raguide.org. - PowerPoint PPT Presentation
Transcript of RBA Overview for Connecticut Nonprofits and Communities
I N
N O
V A
T I
O N
The Charter Oak Group, LLC
Rev. 1 (12/31/11)
RBA Overview for Connecticut Nonprofits and Communities RBA Overview for Connecticut Nonprofits and Communities
2
Mark Friedman
Fiscal Policy Studies Institute
Santa Fe, New Mexico
WEBSITESWEBSITES
www.resultsacountability.comwww.resultsacountability.com
www.raguide.orgwww.raguide.org
Book - DVD Ordersamazon.com
resultsleadership.org
Results-Based Accountability™
2
3
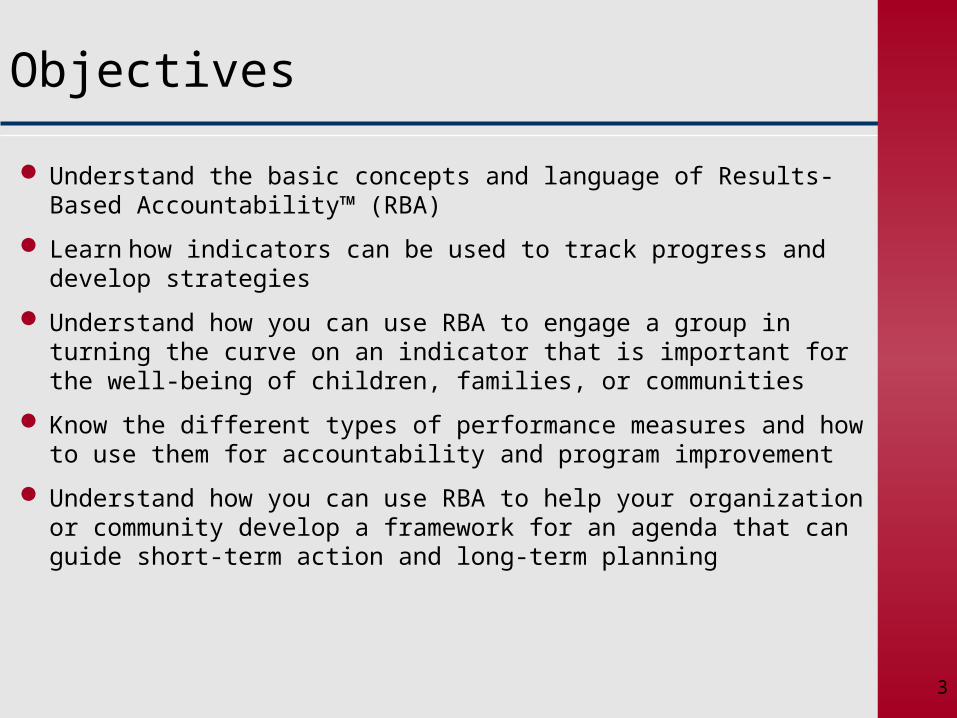
Objectives
Understand the basic concepts and language of Results-Based Accountability™ (RBA)
Learn how indicators can be used to track progress and develop strategies
Understand how you can use RBA to engage a group in turning the curve on an indicator that is important for the well-being of children, families, or communities
Know the different types of performance measures and how to use them for accountability and program improvement
Understand how you can use RBA to help your organization or community develop a framework for an agenda that can guide short-term action and long-term planning
3
4
SIMPLE
COMMON SENSE
PLAIN LANGUAGE
MINIMUM PAPER
USEFUL4
5
Two Key Principles for Achieving Measurable Community Results
1. Start with ends and work backwards to means
2. Use data-driven, transparent decision making
5
6
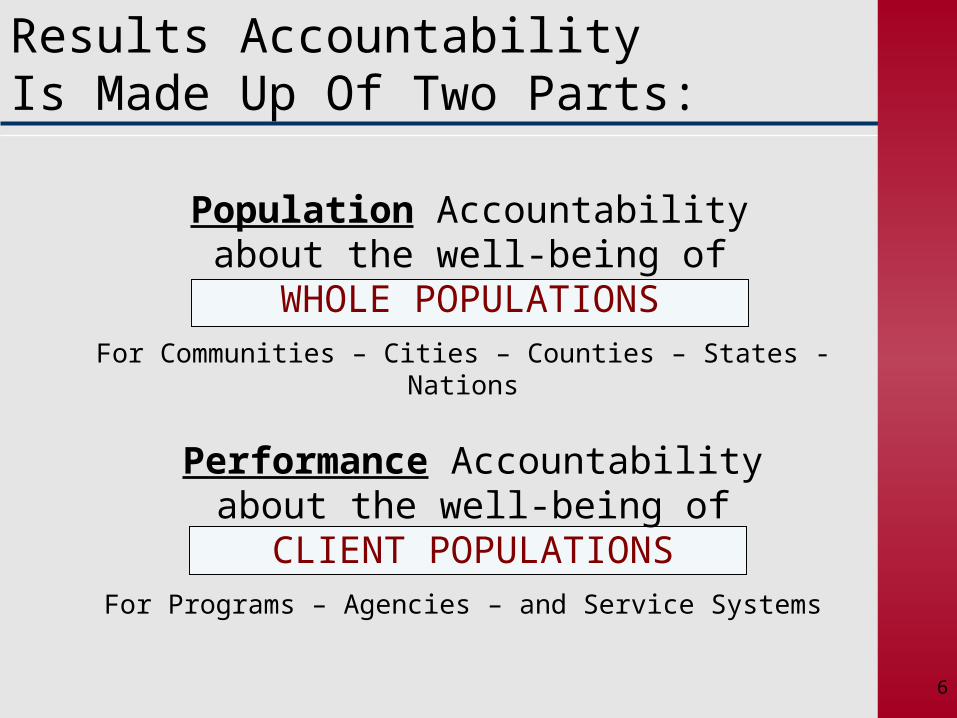
Results AccountabilityIs Made Up Of Two Parts:
Performance Accountabilityabout the well-being of
CLIENT POPULATIONSFor Programs – Agencies – and Service Systems
Population Accountabilityabout the well-being of
WHOLE POPULATIONSFor Communities – Cities – Counties – States - Nations
6
7
Results and Performance Accountability
COMMON LANGUAGE
COMMON SENSE
COMMON GROUND
7
8
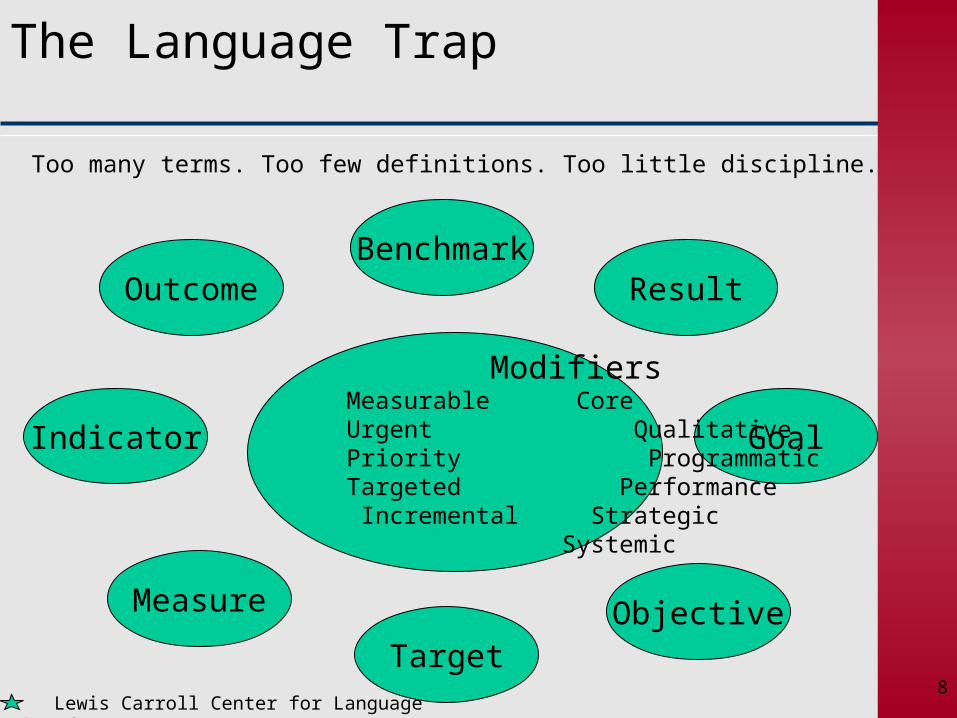
The Language Trap
Benchmark
Target
Indicator Goal
Result
Objective
Outcome
Measure
Modifiers Measurable Core Urgent Qualitative Priority Programmatic Targeted Performance Incremental Strategic Systemic
Lewis Carroll Center for Language Disorders
Too many terms. Too few definitions. Too little discipline.
8
9
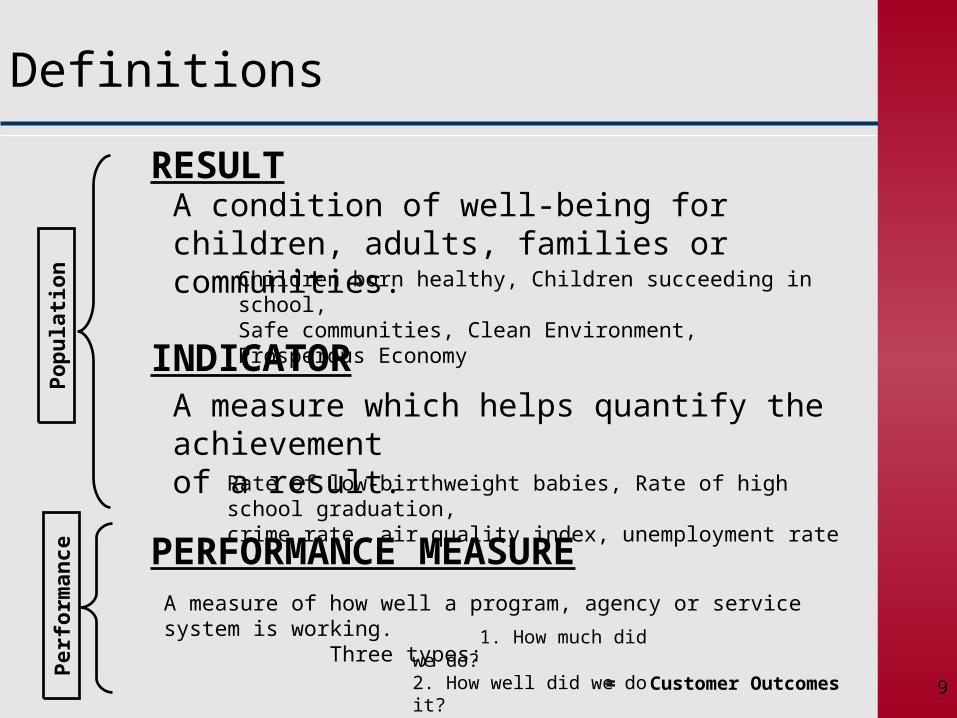
Definitions
Children born healthy, Children succeeding in school, Safe communities, Clean Environment, Prosperous Economy
Rate of low-birthweight babies, Rate of high school graduation, crime rate, air quality index, unemployment rate
1. How much did we do? 2. How well did we do it? 3. Is anyone better off?
RESULT
INDICATOR
PERFORMANCE MEASURE
A condition of well-being for children, adults, families or communities.
A measure which helps quantify the achievement of a result.
A measure of how well a program, agency or service system is working. Three types:
= Customer Outcomes
Popu
latio
nPe
rfor
man
ce
9
10
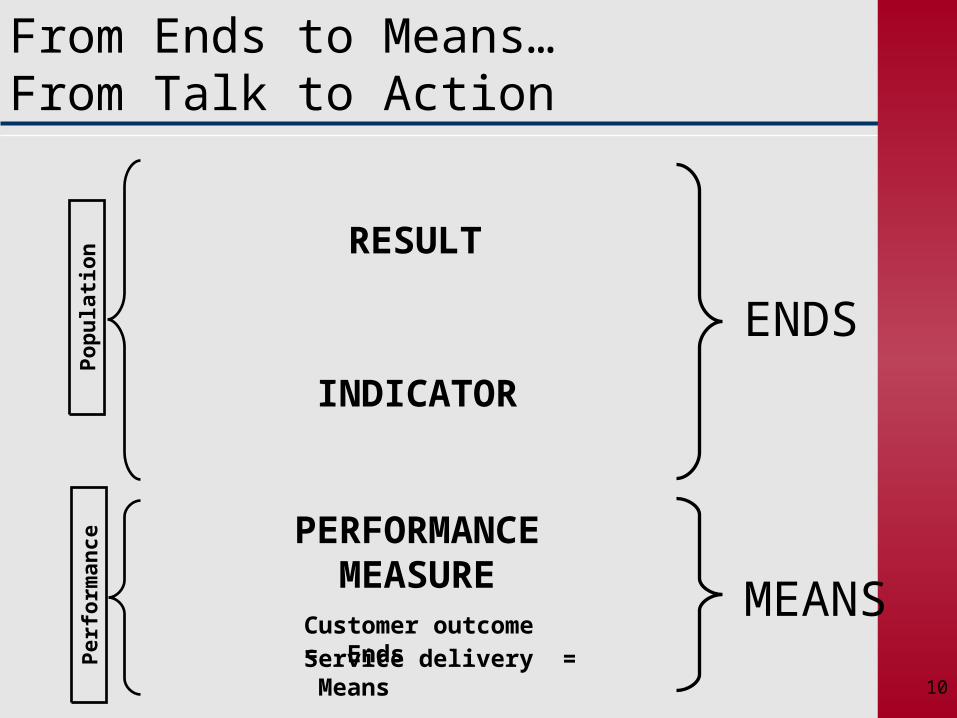
From Ends to Means… From Talk to Action
ENDS
MEANS
Popu
latio
nPe
rfor
man
ce
RESULT
INDICATOR
PERFORMANCEMEASURE
Customer outcome = EndsService delivery = Means
10
11
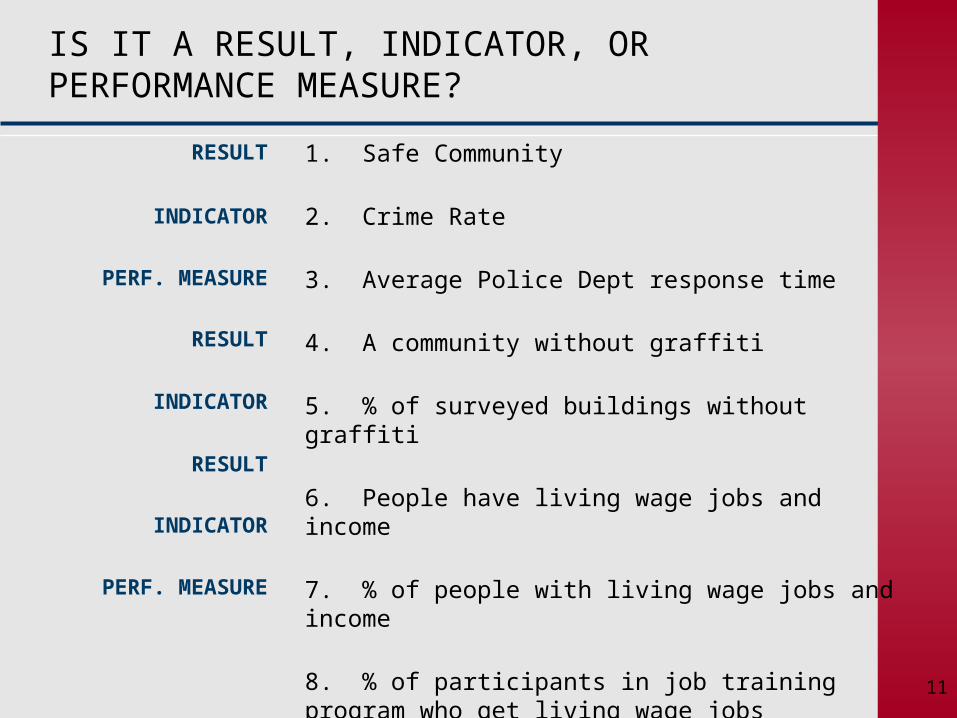
1. Safe Community
2. Crime Rate
3. Average Police Dept response time
4. A community without graffiti
5. % of surveyed buildings without graffiti
6. People have living wage jobs and income
7. % of people with living wage jobs and income
8. % of participants in job training program who get living wage jobs
IS IT A RESULT, INDICATOR, OR PERFORMANCE MEASURE?
RESULT
INDICATOR
PERF. MEASURE
RESULT
INDICATOR
RESULT
INDICATOR
PERF. MEASURE
11
12
Connecticut Glossary of RBA Terms
The Appropriations Committee standardized the terms we use in Connecticut
Terms in Connecticut glossary are consistent with Friedman’s RBA approach
Everyone in Connecticut– executive branch, legislative branch, and now communities – is using a common language and speaking with a common understanding
12
I N
N O
V A
T I
O N
For Whole Populationsin a Geographic Area
POPULATIONACCOUNTABILITY
14
Results
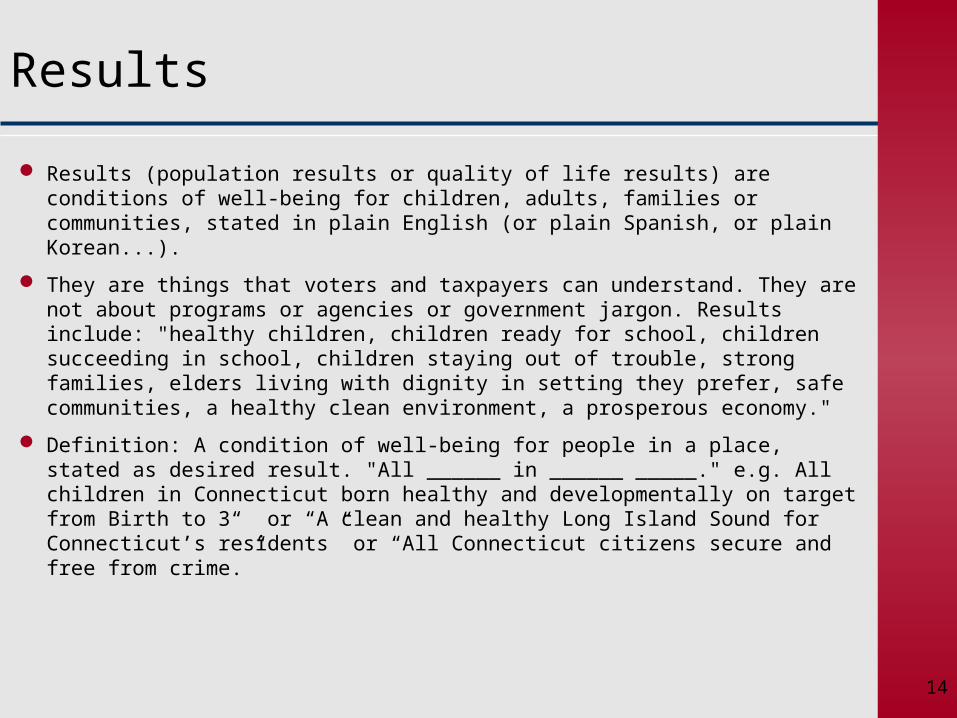
Results (population results or quality of life results) are conditions of well-being for children, adults, families or communities, stated in plain English (or plain Spanish, or plain Korean...).
They are things that voters and taxpayers can understand. They are not about programs or agencies or government jargon. Results include: "healthy children, children ready for school, children succeeding in school, children staying out of trouble, strong families, elders living with dignity in setting they prefer, safe communities, a healthy clean environment, a prosperous economy."
Definition: A condition of well-being for people in a place, stated as desired result. "All ______ in ______ _____." e.g. All children in Connecticut born healthy and developmentally on target from Birth to 3“ or “A clean and healthy Long Island Sound for Connecticut’s residents” or “All Connecticut citizens secure and free from crime.”
14
15
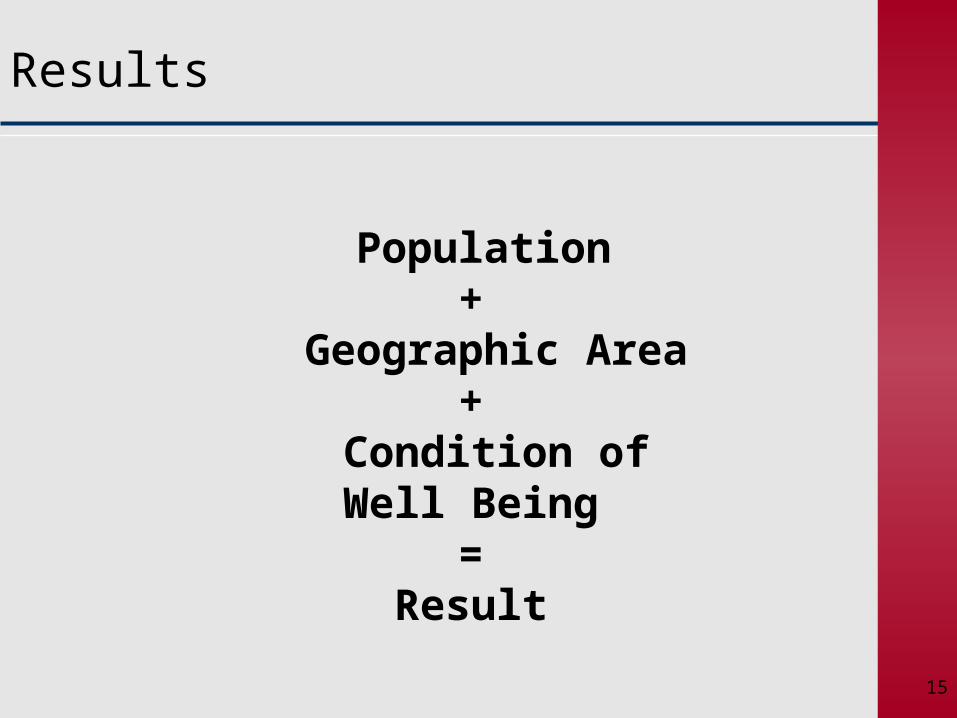
Results
Population +
Geographic Area+
Condition of Well Being
=Result
15
16
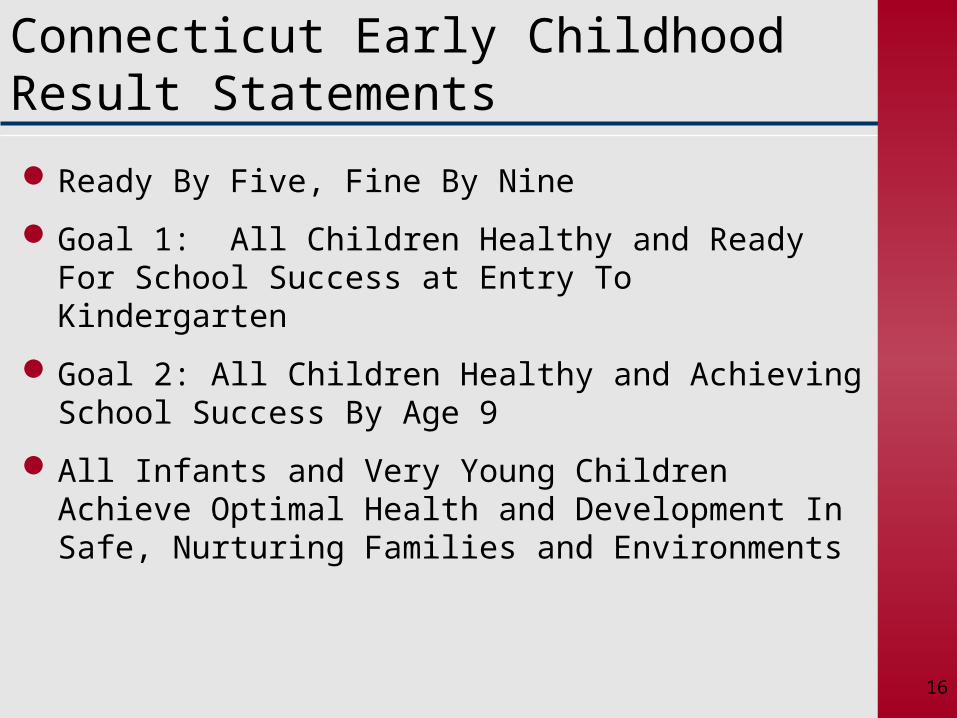
Connecticut Early Childhood Result Statements
Ready By Five, Fine By Nine
Goal 1: All Children Healthy and Ready For School Success at Entry To Kindergarten
Goal 2: All Children Healthy and Achieving School Success By Age 9
All Infants and Very Young Children Achieve Optimal Health and Development In Safe, Nurturing Families and Environments
16
17
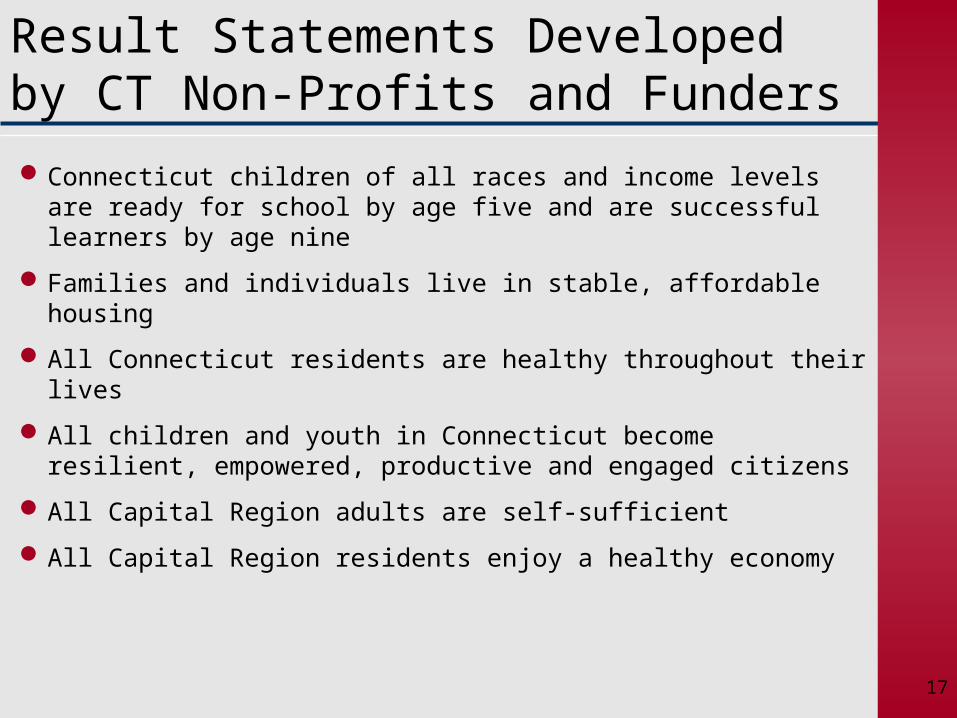
Result Statements Developed by CT Non-Profits and Funders
Connecticut children of all races and income levels are ready for school by age five and are successful learners by age nine
Families and individuals live in stable, affordable housing
All Connecticut residents are healthy throughout their lives
All children and youth in Connecticut become resilient, empowered, productive and engaged citizens
All Capital Region adults are self-sufficient
All Capital Region residents enjoy a healthy economy
17

18
●
Community Outcomes for Christchurch, NZ
A Safe City
A City of Inclusive and Diverse Communities
A City of People who Value and Protect the Natural Environment
A Well-Governed City
A Prosperous City
A Healthy City
A City for Recreation, Fun and Creativity
A City of Lifelong Learning
An Attractive and Well-Designed City
18
19
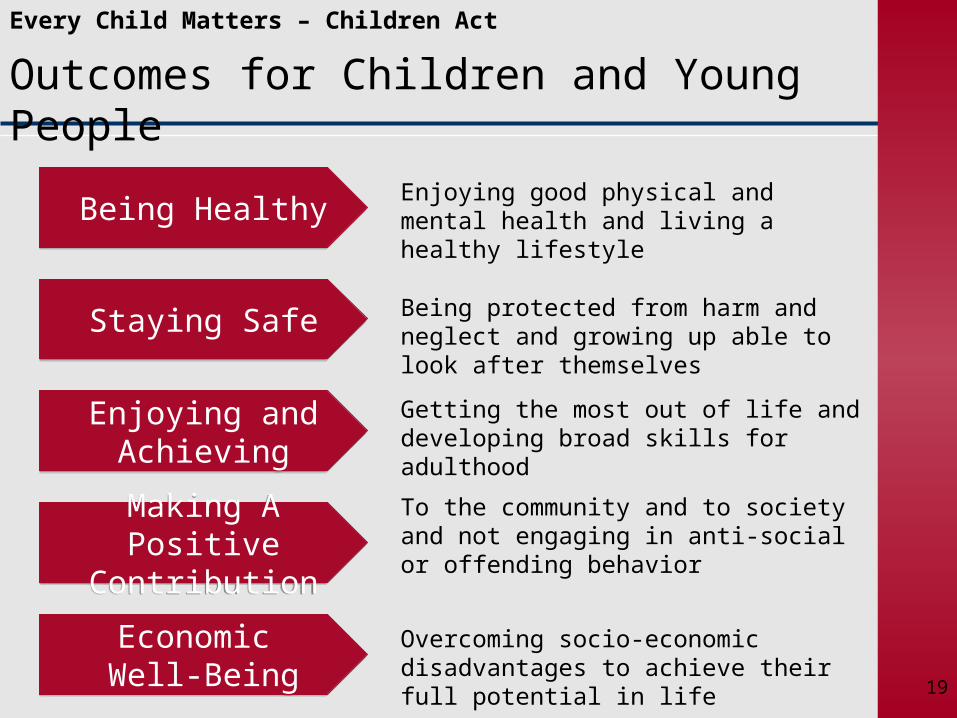
Every Child Matters – Children Act
Outcomes for Children and Young People
Being HealthyBeing Healthy
Staying SafeStaying Safe
Enjoying and Achieving
Enjoying and Achieving
Making A Positive Contribution
Making A Positive Contribution
Economic Well-BeingEconomic Well-Being
Enjoying good physical and mental health and living a healthy lifestyle
Being protected from harm and neglect and growing up able to look after themselves
Getting the most out of life and developing broad skills for adulthood
To the community and to society and not engaging in anti-social or offending behavior
Overcoming socio-economic disadvantages to achieve their full potential in life
19
20
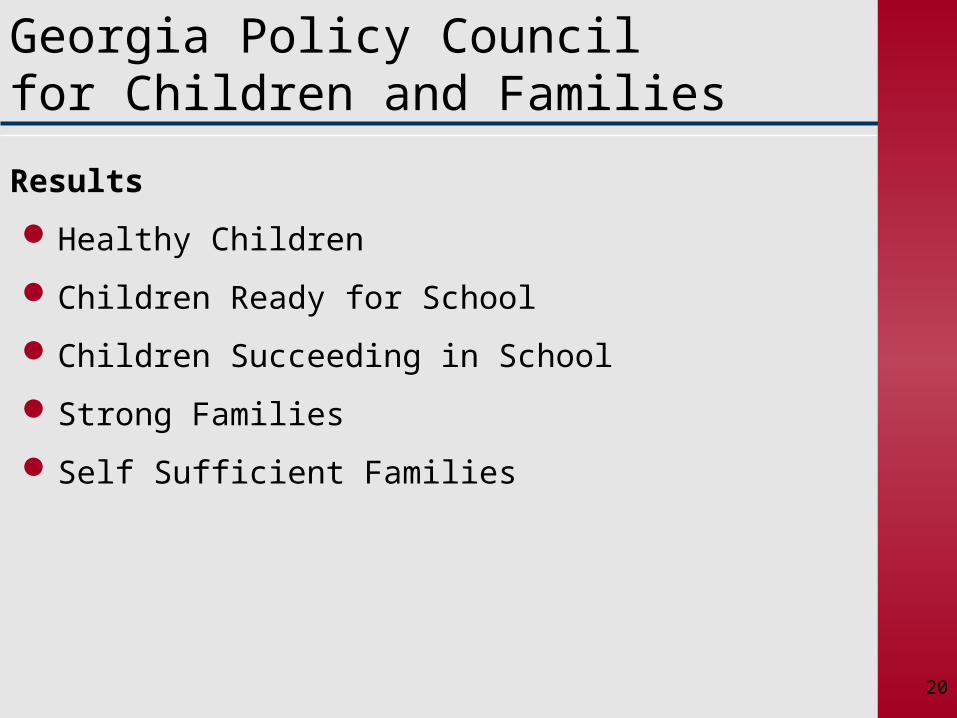
Georgia Policy Councilfor Children and Families
Results
Healthy Children
Children Ready for School
Children Succeeding in School
Strong Families
Self Sufficient Families
20
21
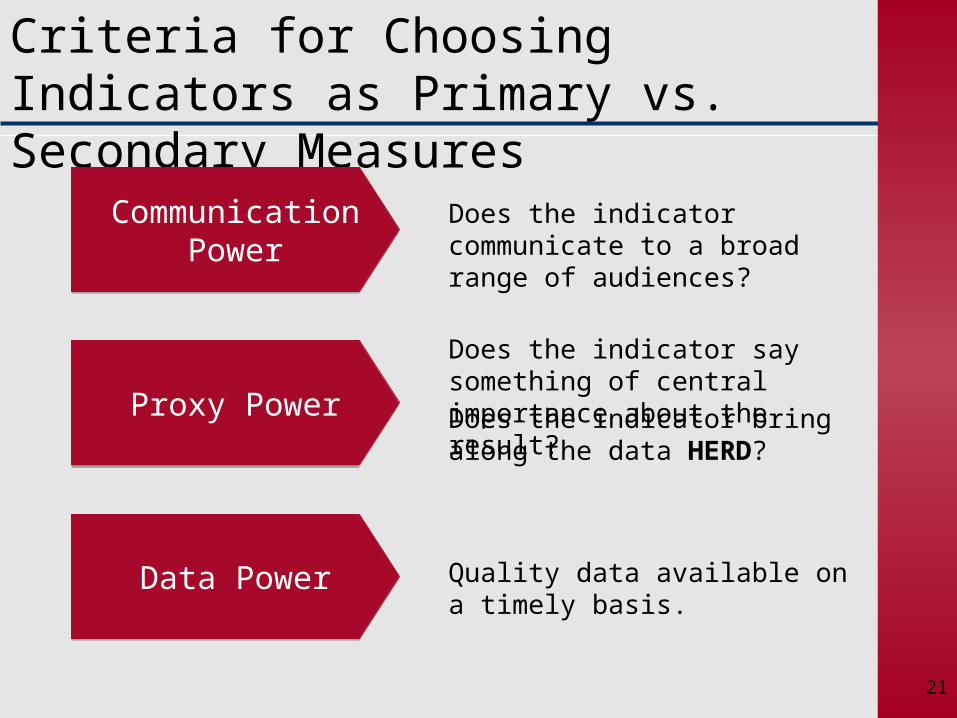
Criteria for Choosing Indicators as Primary vs. Secondary Measures
Does the indicator communicate to a broad range of audiences?
Does the indicator say something of central importance about the result?Does the indicator bring along the data HERD?
Quality data available on a timely basis.
Communication Power
Communication Power
Proxy PowerProxy Power
Data PowerData Power
21
22
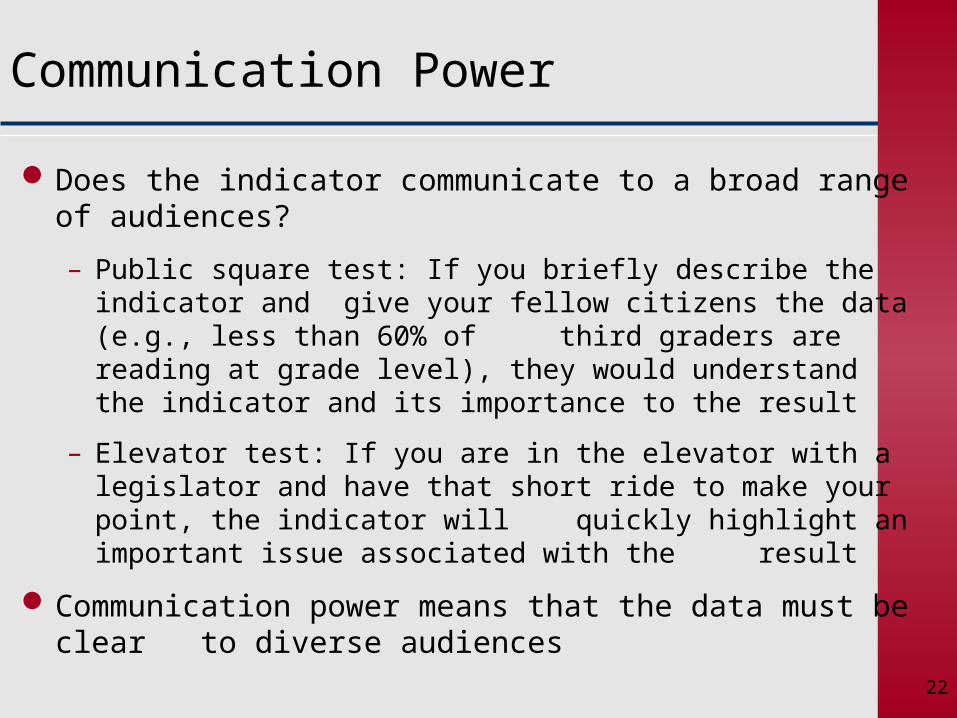
Communication Power
Does the indicator communicate to a broad range of audiences?
– Public square test: If you briefly describe the indicator and give your fellow citizens the data (e.g., less than 60% of third graders are reading at grade level), they would understand the indicator and its importance to the result
– Elevator test: If you are in the elevator with a legislator and have that short ride to make your point, the indicator will quickly highlight an important issue associated with the result
Communication power means that the data must be clear to diverse audiences
22
23
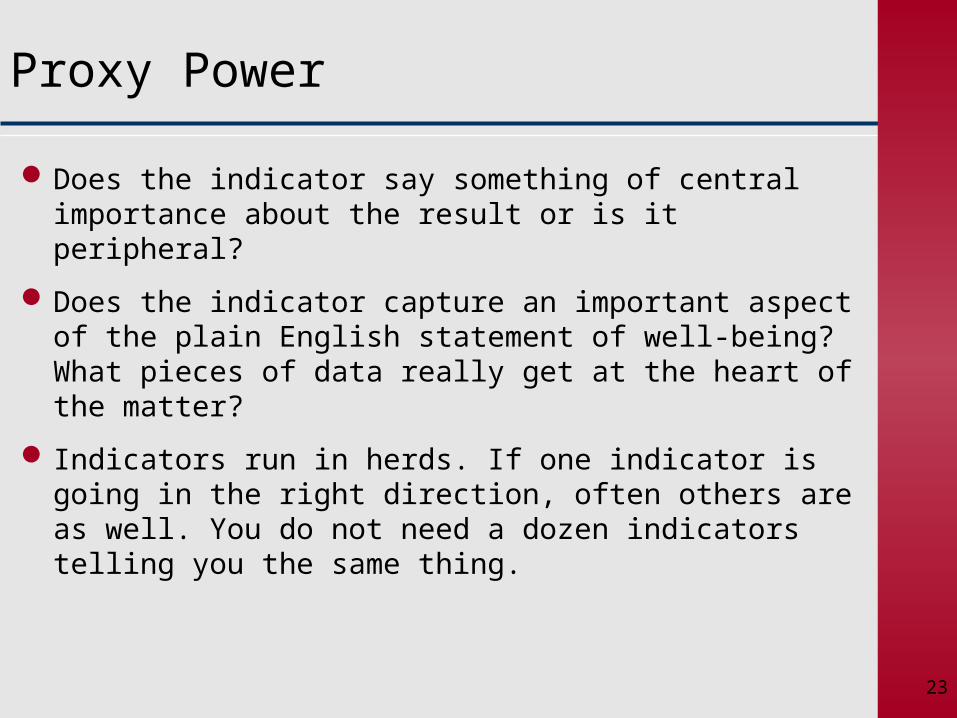
Proxy Power
Does the indicator say something of central importance about the result or is it peripheral?
Does the indicator capture an important aspect of the plain English statement of well-being? What pieces of data really get at the heart of the matter?
Indicators run in herds. If one indicator is going in the right direction, often others are as well. You do not need a dozen indicators telling you the same thing.
23
24
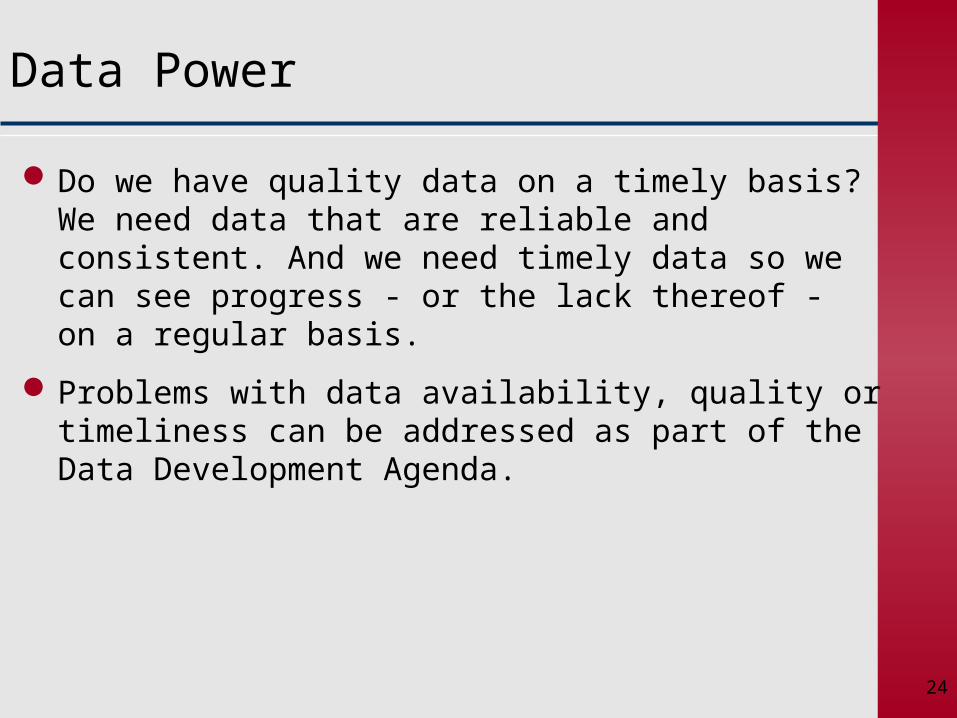
Data Power
Do we have quality data on a timely basis? We need data that are reliable and consistent. And we need timely data so we can see progress - or the lack thereof - on a regular basis.
Problems with data availability, quality or timeliness can be addressed as part of the Data Development Agenda.
24
25
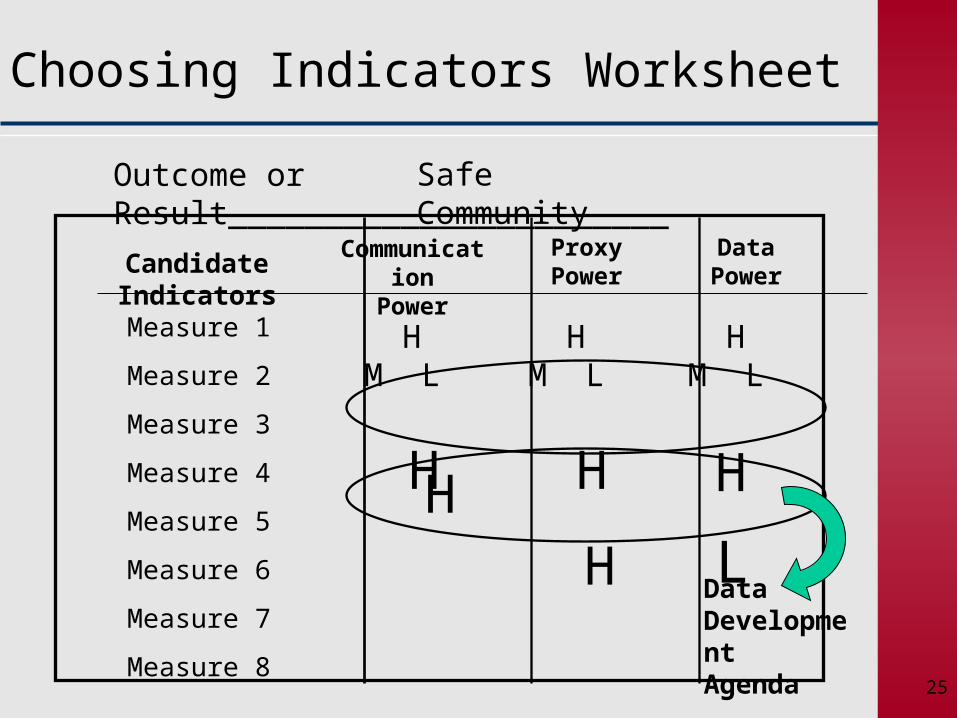
Choosing Indicators Worksheet
Outcome or Result_______________________
Candidate IndicatorsCommunication
PowerProxyPower
DataPower
H M L
H
Measure 1
Measure 2
Measure 3
Measure 4
Measure 5
Measure 6
Measure 7
Measure 8
H
DataDevelopmentAgenda
Safe Community
H M L H M L
H H
H L
25
26
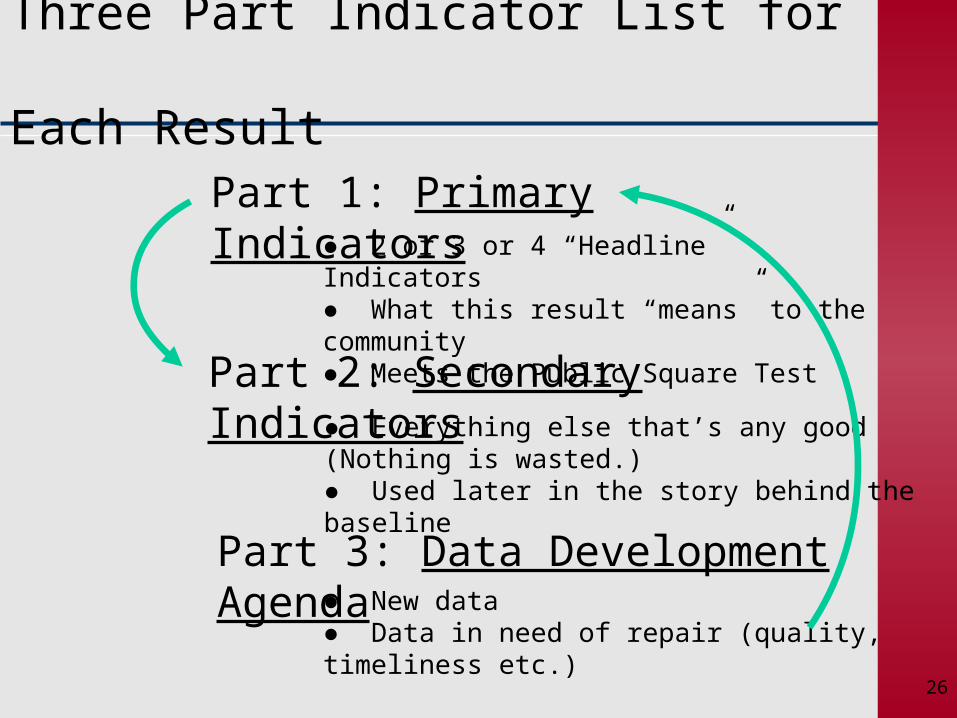
Three Part Indicator List for Each Result
Part 1: Primary Indicators
Part 2: Secondary Indicators
Part 3: Data Development Agenda
● 2 or 3 or 4 “Headline” Indicators● What this result “means” to the community● Meets the Public Square Test
● Everything else that’s any good (Nothing is wasted.)● Used later in the story behind the baseline
● New data● Data in need of repair (quality, timeliness etc.)
26
27
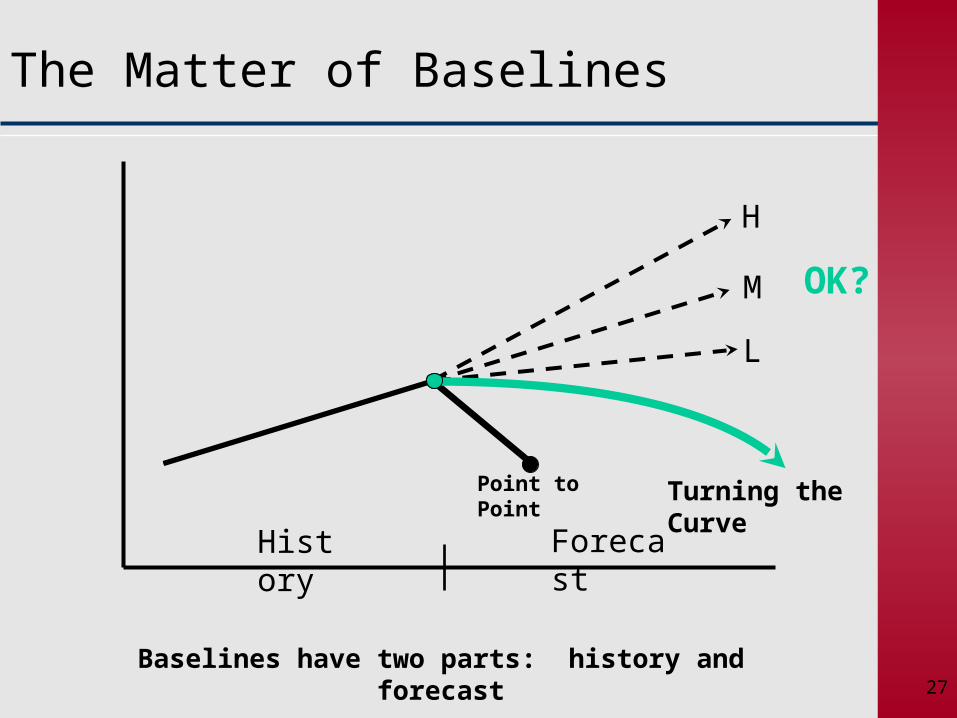
The Matter of Baselines
Baselines have two parts: history and forecast
H
M
L
History Forecast
Turning the CurvePoint to Point
OK?
27
28
Caution
Data are not the same as reality. Think of a leaking roof. No water in the bucket under the leak does not prove that the roof is fixed. In fact, the ceiling may be about to come down.
Data are a proxy for the condition of well-being we want. Our goal is not an empty bucket; it is a fixed roof and a dry house.
The better the proxy, the closer to reality we get. Having more than one indicator increases the chance that we have actually captured reality.
The rating of headline indicators is not the last word. You must look at the identified indicators and see if, as a whole, they encompass the important dimensions of the result statement. Sometimes you need to select a less powerful headline indicator in order to be able to talk about an aspect of the result that is important to your community.
28
2929
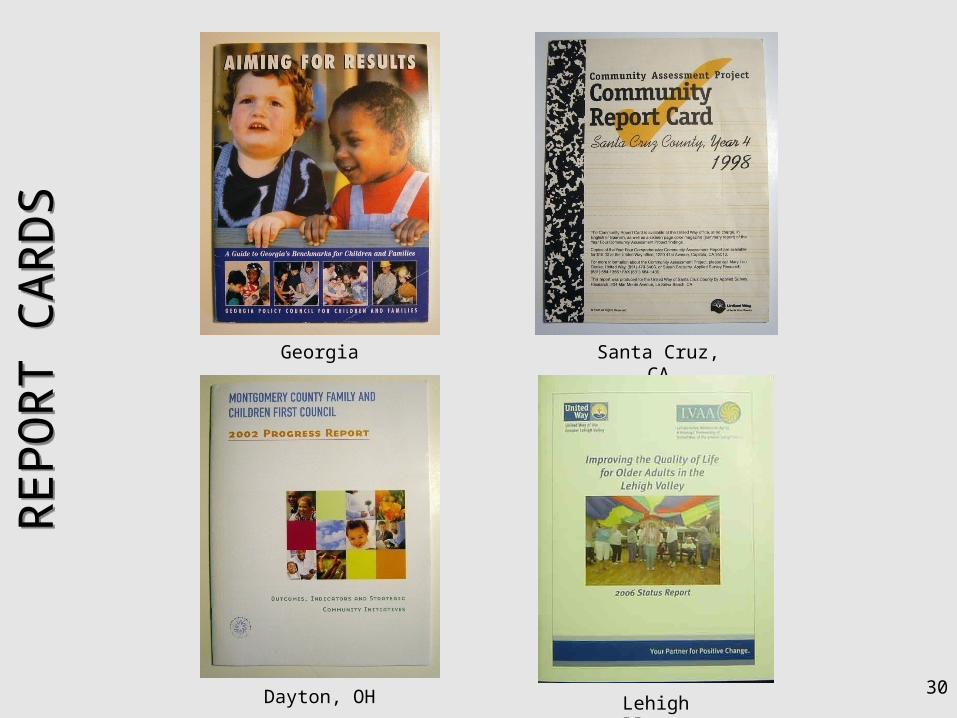
30
Georgia
Lehigh Valley, PADayton, OH
Santa Cruz, CA
RE
PO
RT
CA
RD
SR
EP
OR
T C
AR
DS
30
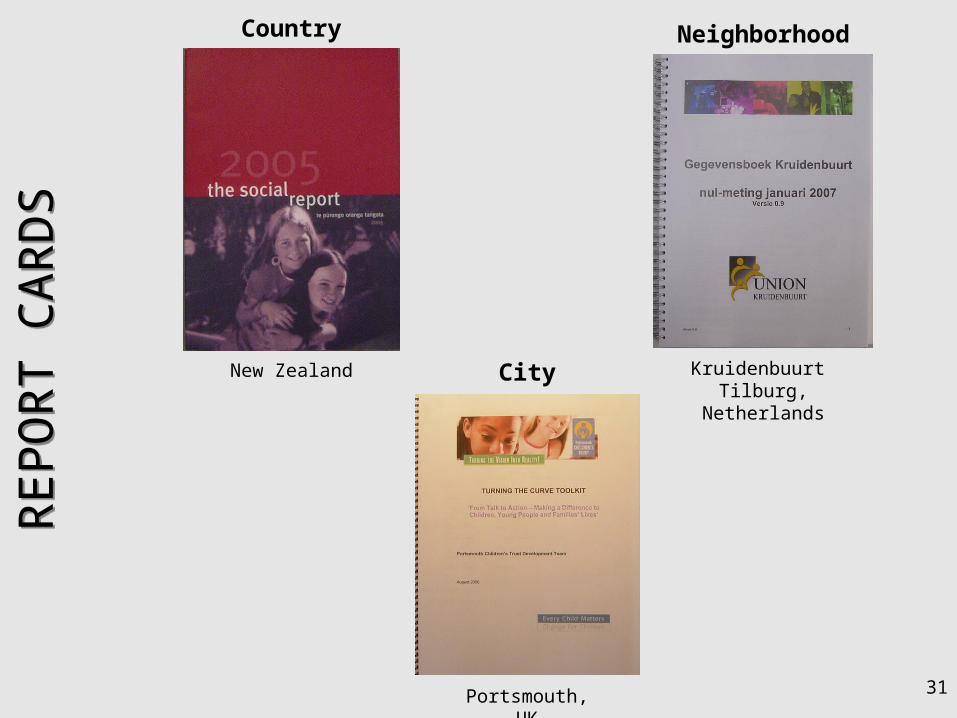
31
New Zealand Kruidenbuurt Tilburg,
Netherlands
Portsmouth, UK
Country Neighborhood
City
RE
PO
RT
CA
RD
SR
EP
OR
T C
AR
DS
31
3232
3333
3434
35
The Power of RBA Thinking:
Turning the Curve
35
36
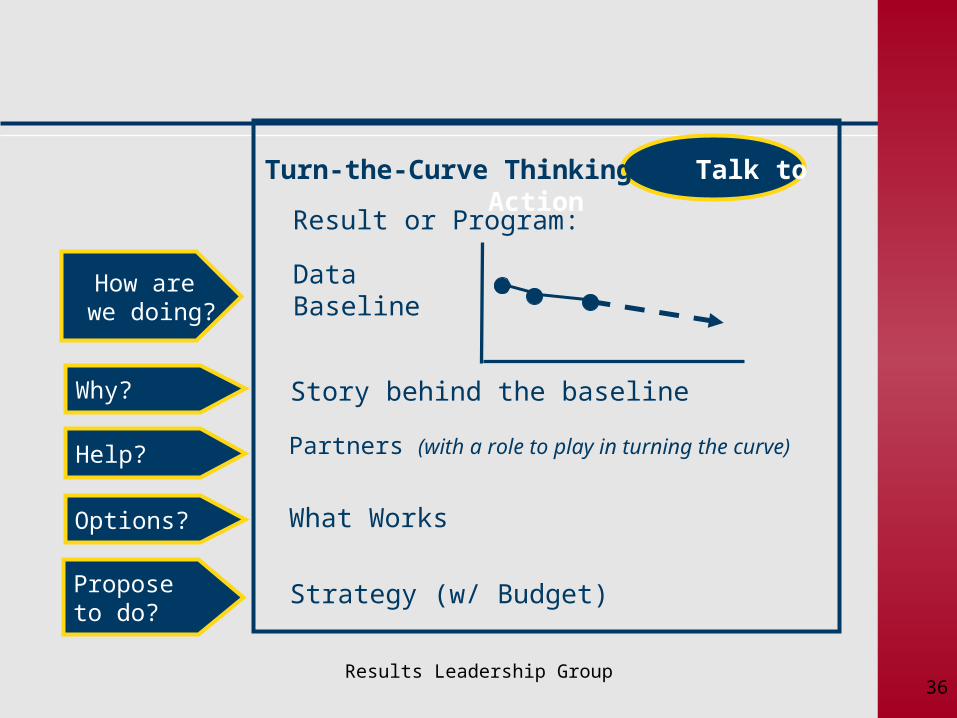
Story behind the baseline
Partners (with a role to play in turning the curve)
What Works
Strategy (w/ Budget)
Result or Program:
DataBaseline
How are we doing?
Why?
Help?
Options?
Propose to do?
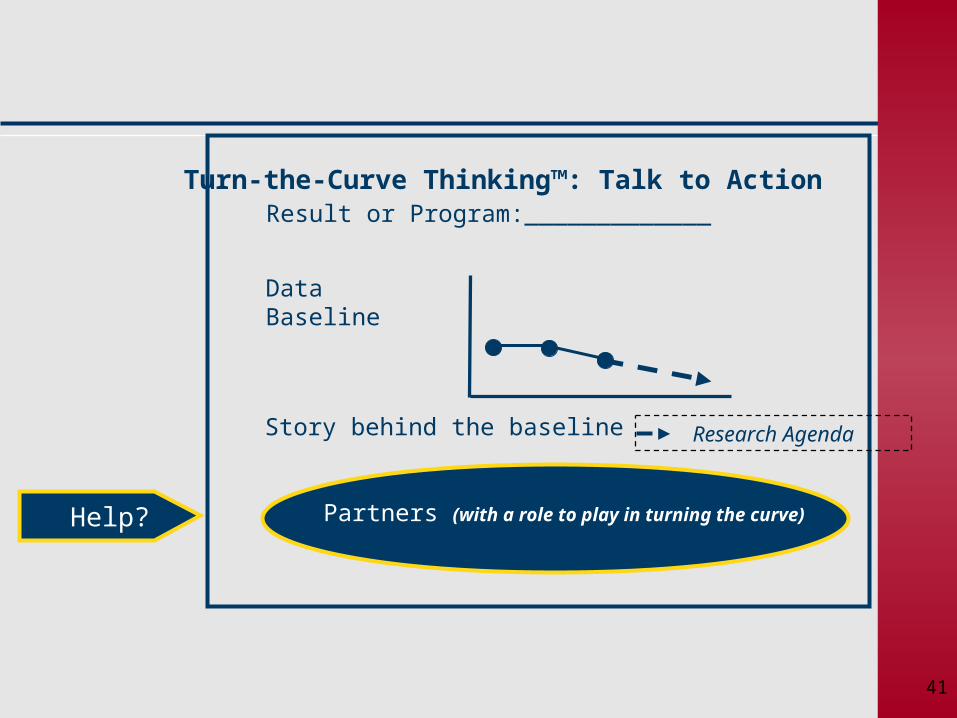
Turn-the-Curve Thinking™: Talk to Action
36Results Leadership Group
37
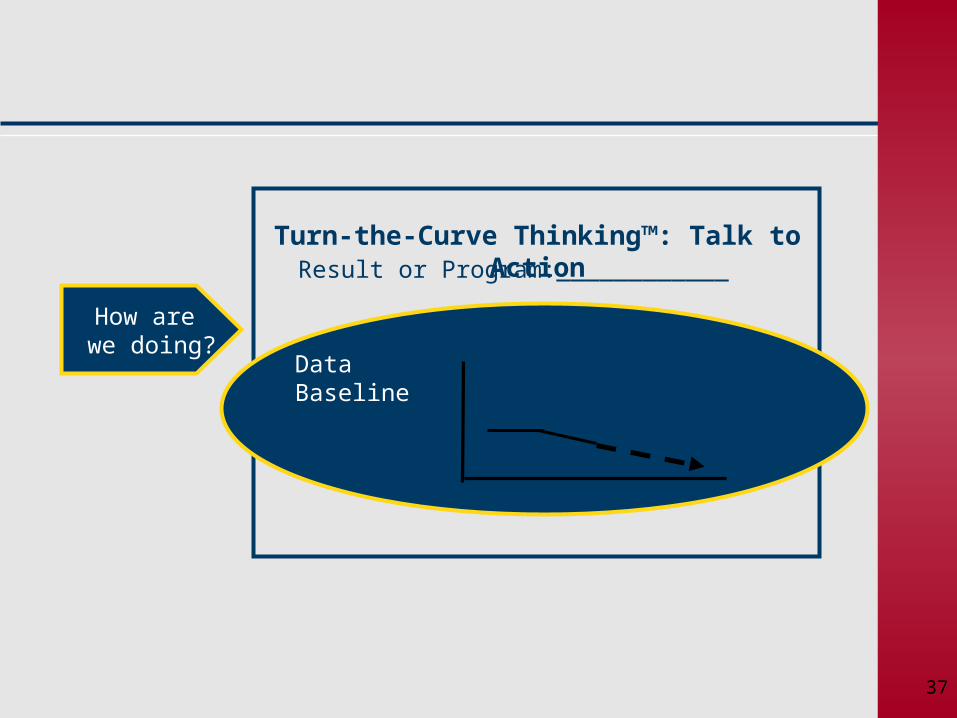
Result or Program:____________Turn-the-Curve Thinking™: Talk to Action
Data Baseline
How are we doing?
37
38
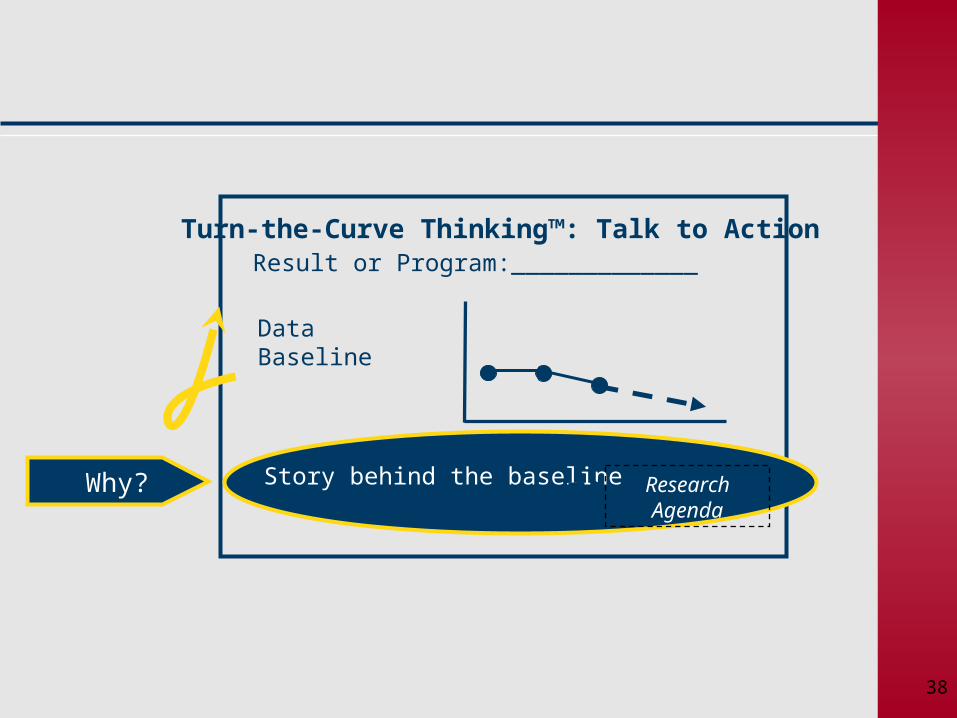
Data Baseline
Result or Program:_____________Turn-the-Curve Thinking™: Talk to Action
Story behind the baseline Research Agenda Why?
38
39
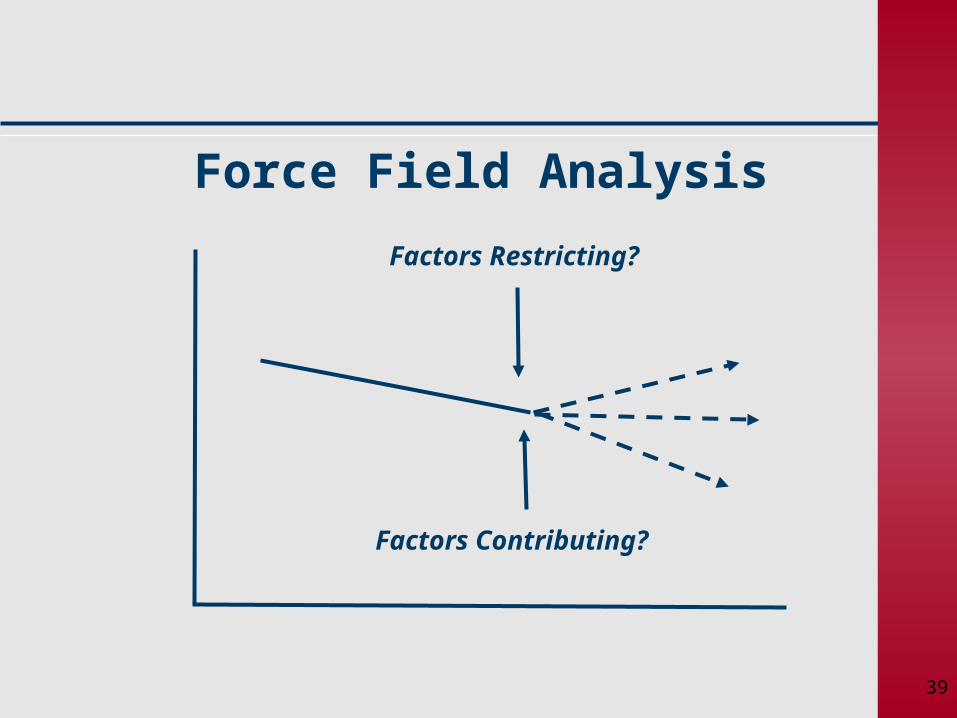
Force Field Analysis
Factors Contributing?
Factors Restricting?
39
40
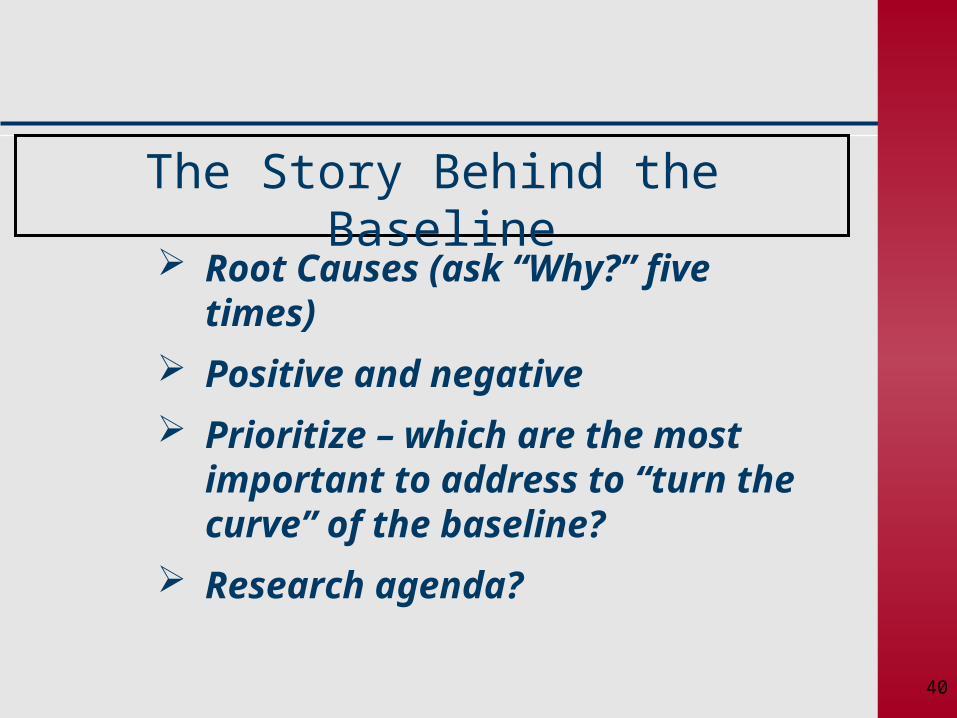
The Story Behind the Baseline
Root Causes (ask “Why?” five times)
Positive and negative
Prioritize – which are the most important to address to “turn the curve” of the baseline?
Research agenda?
40
41
DataBaseline
Story behind the baseline
Result or Program:_____________
Research Agenda
Turn-the-Curve Thinking™: Talk to Action
Partners (with a role to play in turning the curve)Help?
41
42
Partners Who are partners who may have
a role to play in turning the curve?
Does the story behind the curve suggest any new partners?
42
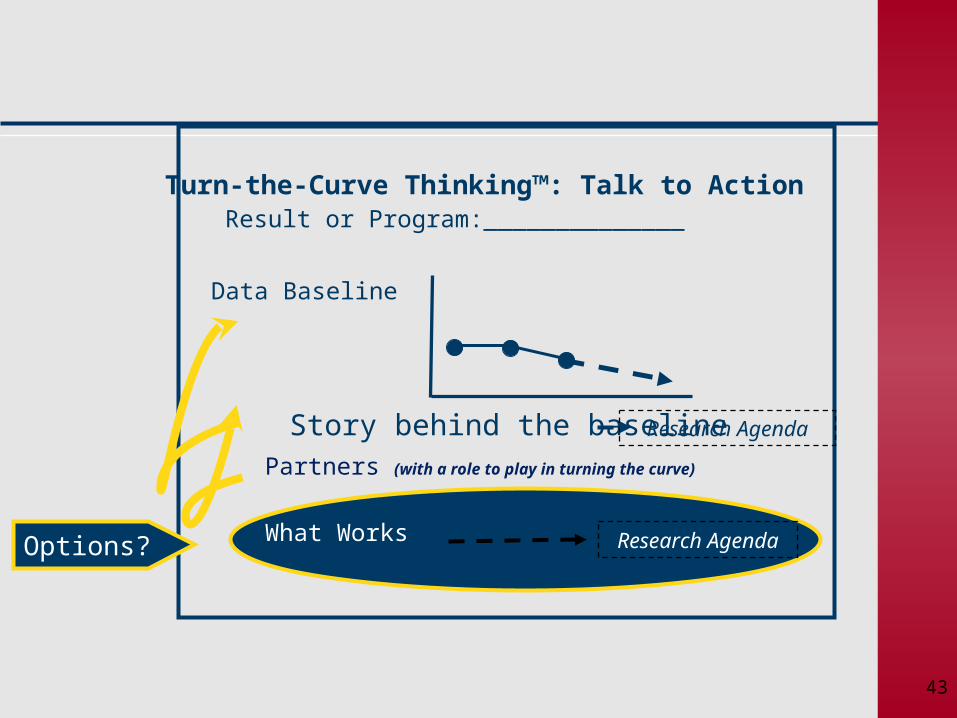
43
Data Baseline
Story behind the baselinePartners (with a role to play in turning the curve)
Result or Program:______________
Research Agenda
Turn-the-Curve Thinking™: Talk to Action
What Works Research AgendaOptions?
43
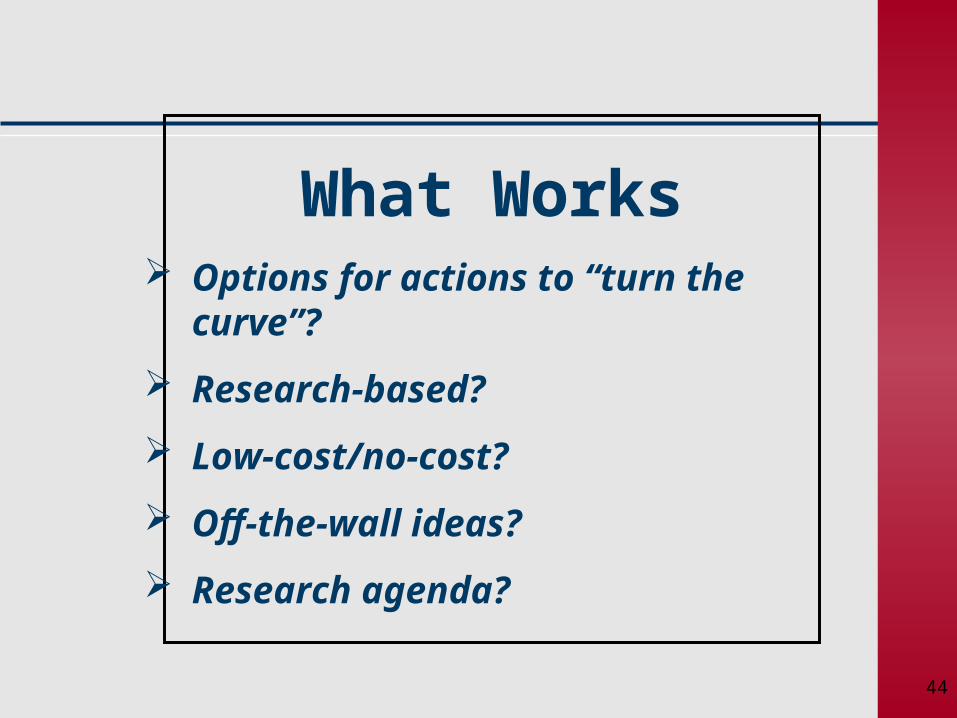
44
What Works Options for actions to “turn the
curve”?
Research-based?
Low-cost/no-cost?
Off-the-wall ideas?
Research agenda?
44
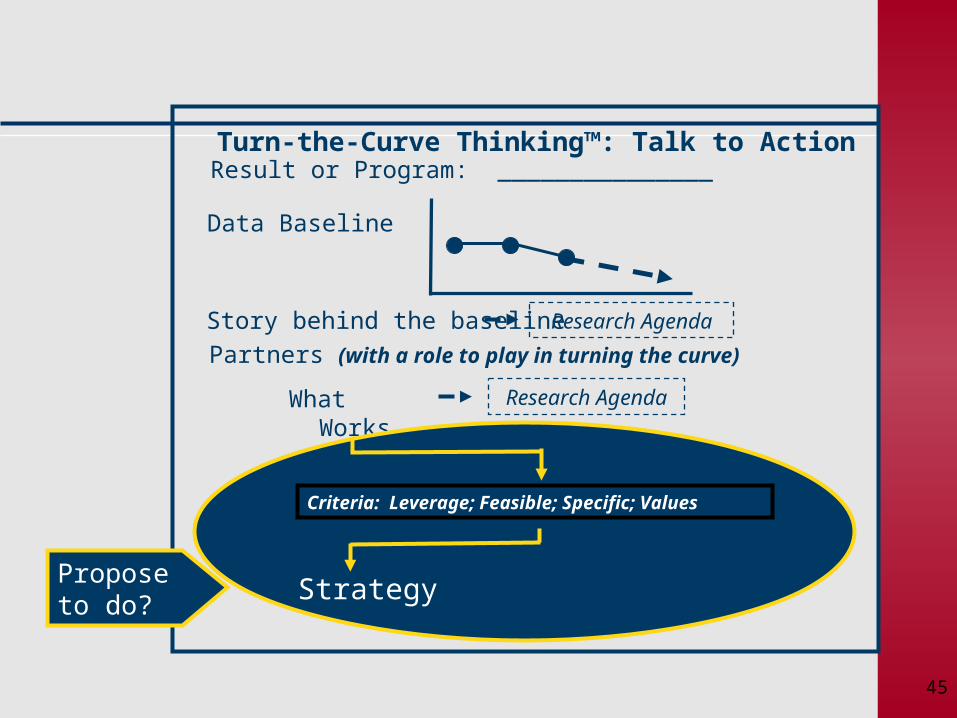
45
Data Baseline
Story behind the baseline
Partners (with a role to play in turning the curve)
What Works
Result or Program: _______________
Research Agenda
Research Agenda
Turn-the-Curve Thinking™: Talk to Action
Criteria: Leverage; Feasible; Specific; Values
StrategyPropose to do?
45
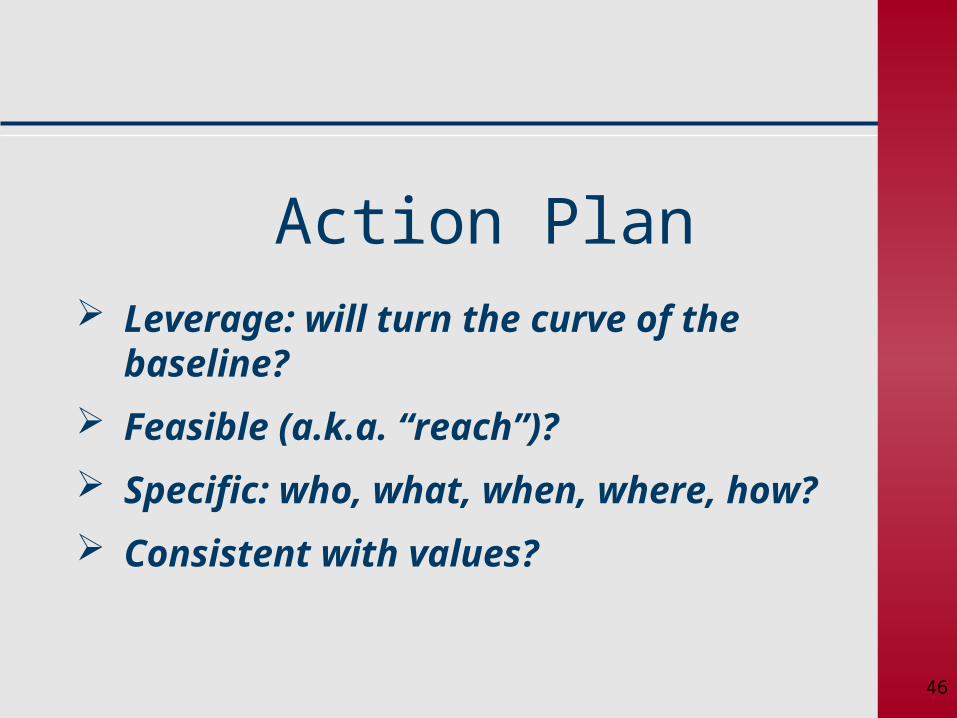
46
Action Plan Leverage: will turn the curve of the
baseline?
Feasible (a.k.a. “reach”)?
Specific: who, what, when, where, how?
Consistent with values?
46
I N
N O
V A
T I
O N
Turn the Curve Exercise
48
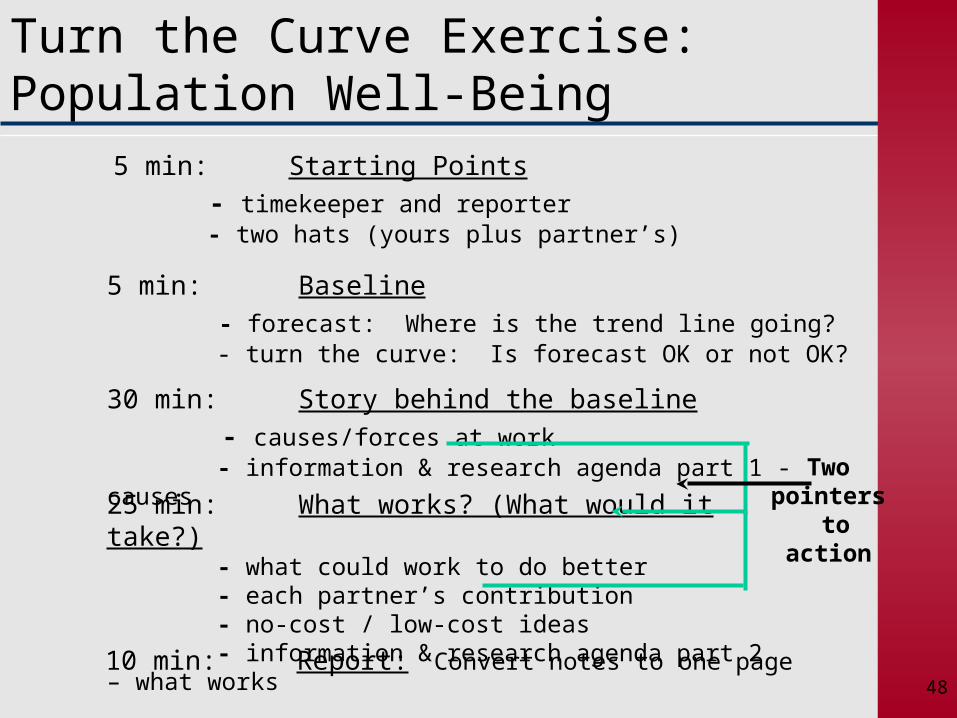
Turn the Curve Exercise: Population Well-Being
5 min: Starting Points - timekeeper and reporter - two hats (yours plus partner’s)
5 min: Baseline - forecast: Where is the trend line going? - turn the curve: Is forecast OK or not OK?
30 min: Story behind the baseline - causes/forces at work - information & research agenda part 1 - causes
25 min: What works? (What would it take?) - what could work to do better
- each partner’s contribution - no-cost / low-cost ideas - information & research agenda part 2 – what works
10 min: Report: Convert notes to one page
Two pointers to action
48
49
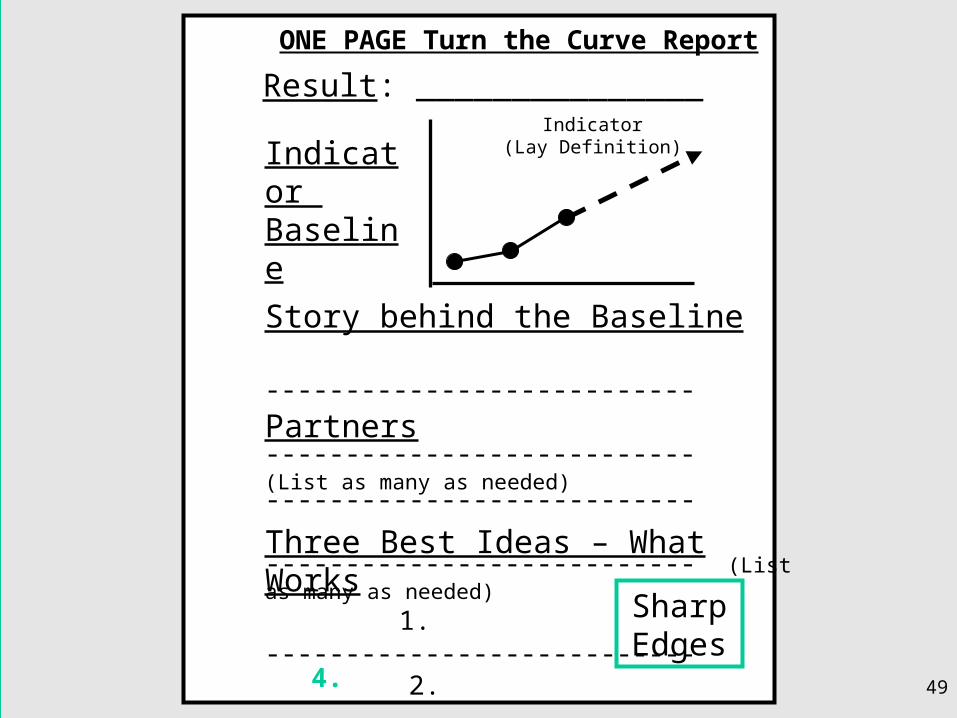
ONE PAGE Turn the Curve Report
Result: _______________Indicator
(Lay Definition)Indicator Baseline
Story behind the Baseline --------------------------- --------------------------- (List as many as needed)
Partners --------------------------- --------------------------- (List as many as needed)
Three Best Ideas – What Works 1. --------------------------- 2. --------------------------- 3. ---------No-cost / low-cost ---------Off the Wall
SharpEdges
4. 49
I N
N O
V A
T I
O N
Performance AccountabilityFor Services, Agencies and Service Systems
51
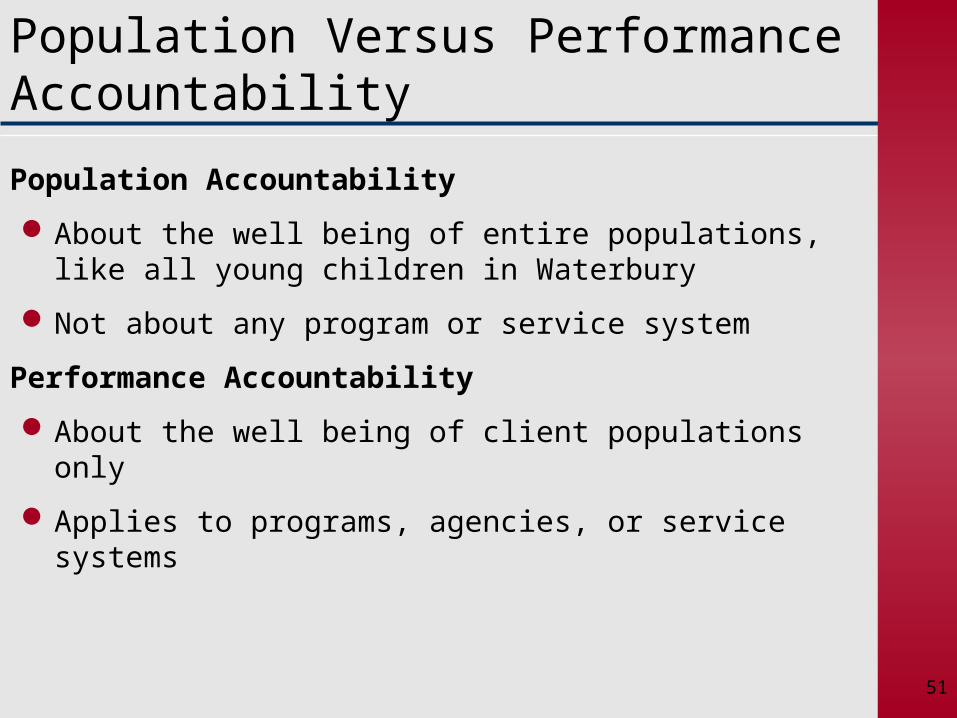
Population Versus Performance Accountability
Population Accountability
About the well being of entire populations, like all young children in Waterbury
Not about any program or service system
Performance Accountability
About the well being of client populations only
Applies to programs, agencies, or service systems
51
52
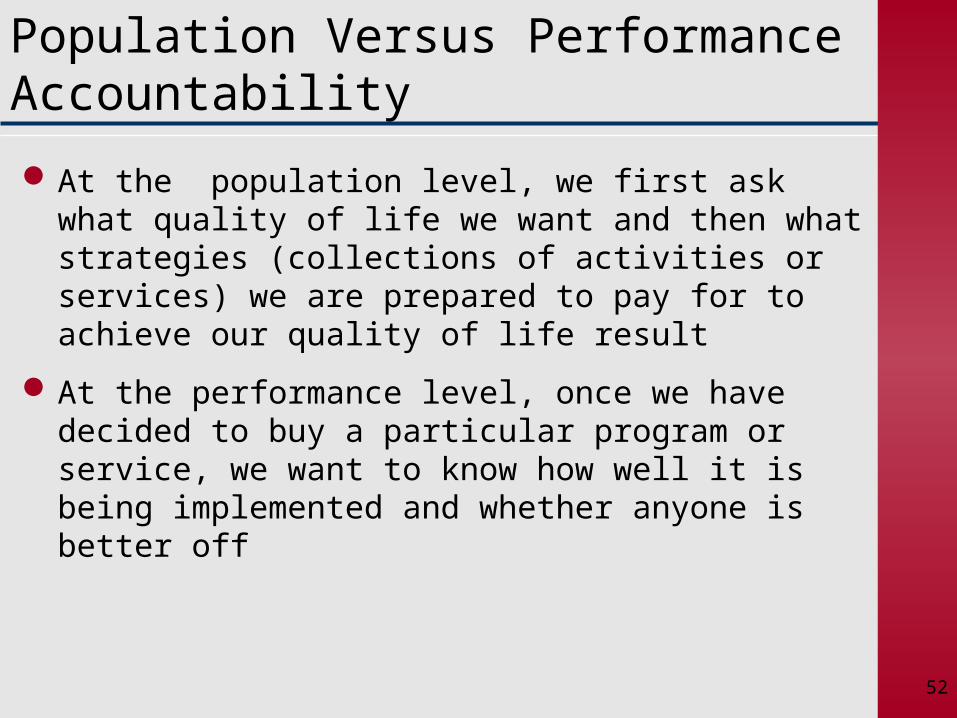
Population Versus Performance Accountability
At the population level, we first ask what quality of life we want and then what strategies (collections of activities or services) we are prepared to pay for to achieve our quality of life result
At the performance level, once we have decided to buy a particular program or service, we want to know how well it is being implemented and whether anyone is better off
52
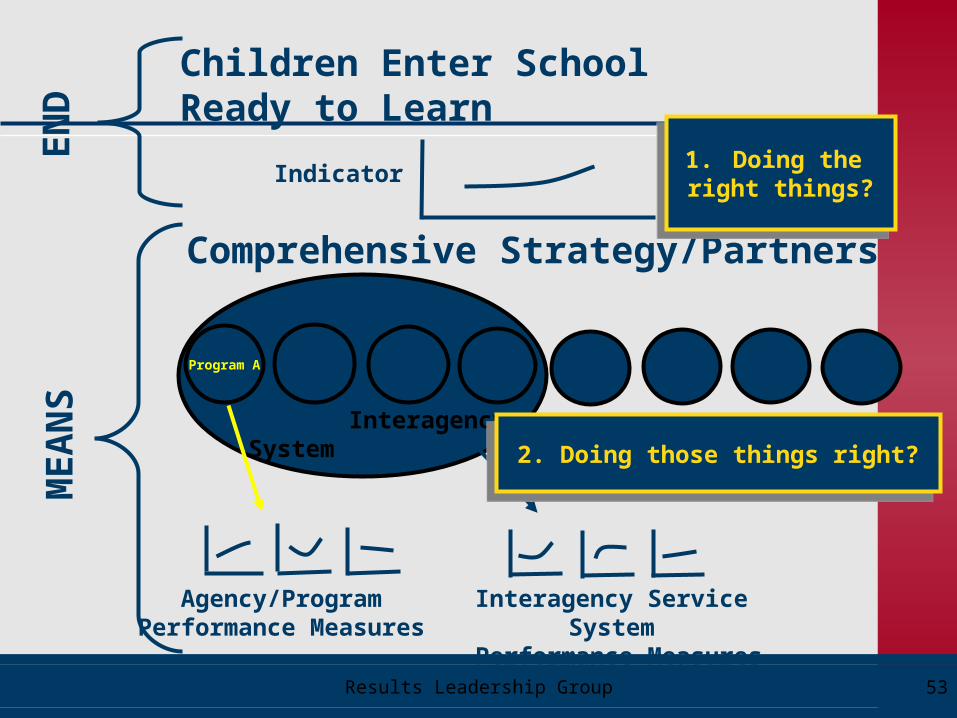
53
Interagency System
Program A
Comprehensive Strategy/Partners
Agency/ProgramPerformance Measures
Interagency Service System Performance Measures
EN
DM
EA
NS
Indicator
Children Enter School Ready to Learn
Results Leadership Group
1. Doing the right things?
1. Doing the right things?
2. Doing those things right?2. Doing those things right?
53
54
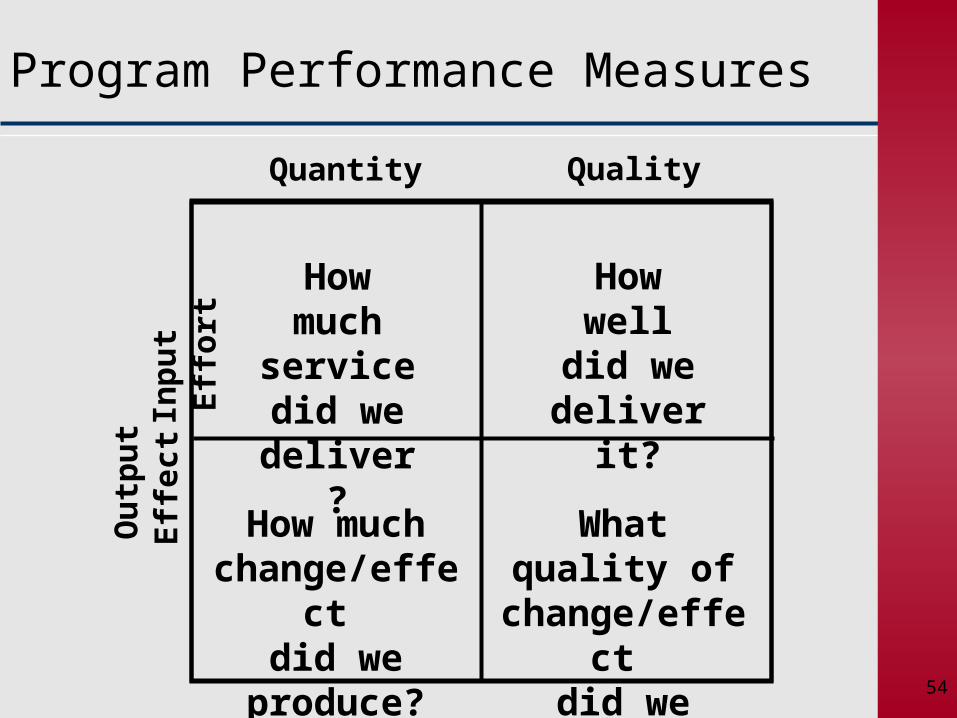
Program Performance Measures
How much service did we deliver?
How welldid we
deliver it?
How much change/effect
did we produce?
What quality of change/effect
did we produce?
Quantity Quality
E
ffect
Ef
fort
Out
put
Inpu
t
54
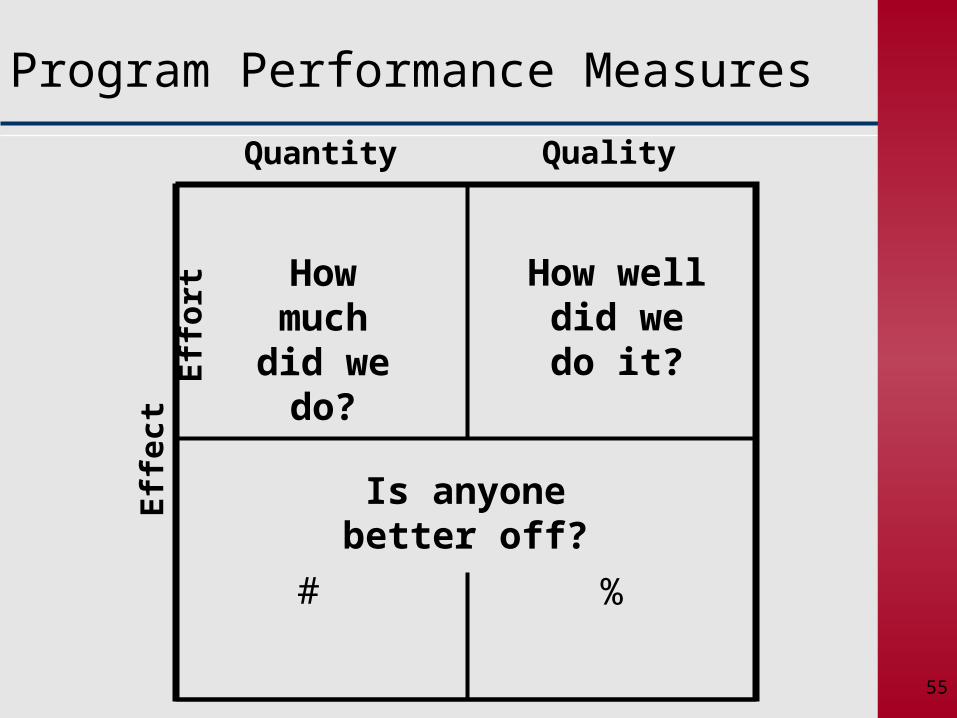
55
How much did we do?
How welldid we do it?
Is anyonebetter off?
Quantity Quality
E
ffect
Ef
fort
# %
Program Performance Measures
55
56
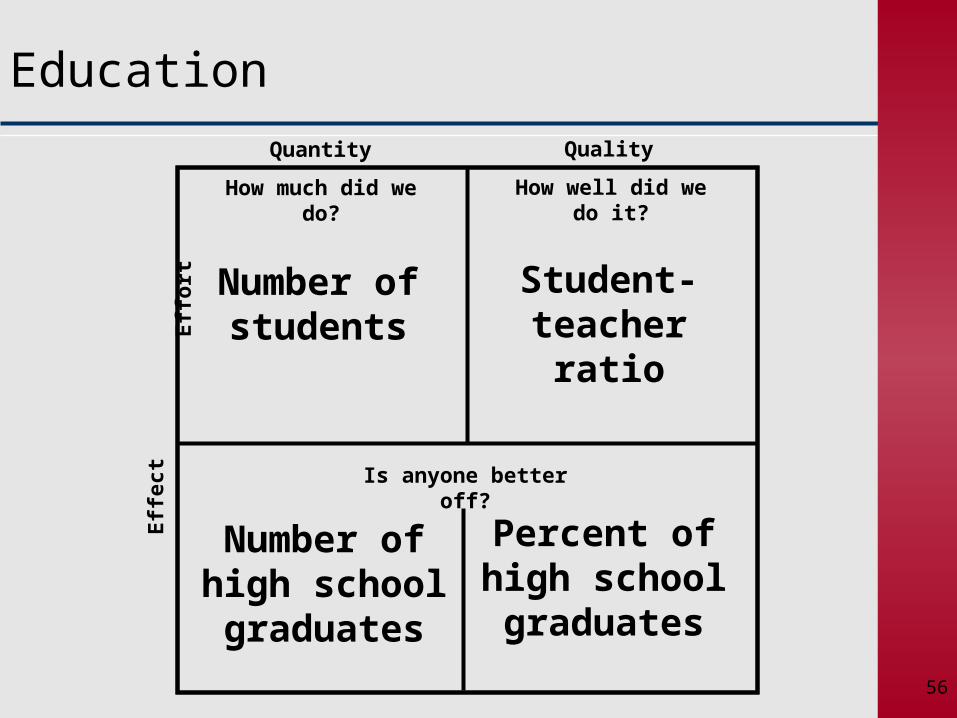
Education
How much did we do? How well did we do it?
Is anyone better off?
Quantity Quality
E
ffect
Effo
rt Number ofstudents
Student-teacherratio
Number ofhigh schoolgraduates
Percent ofhigh schoolgraduates
56
57
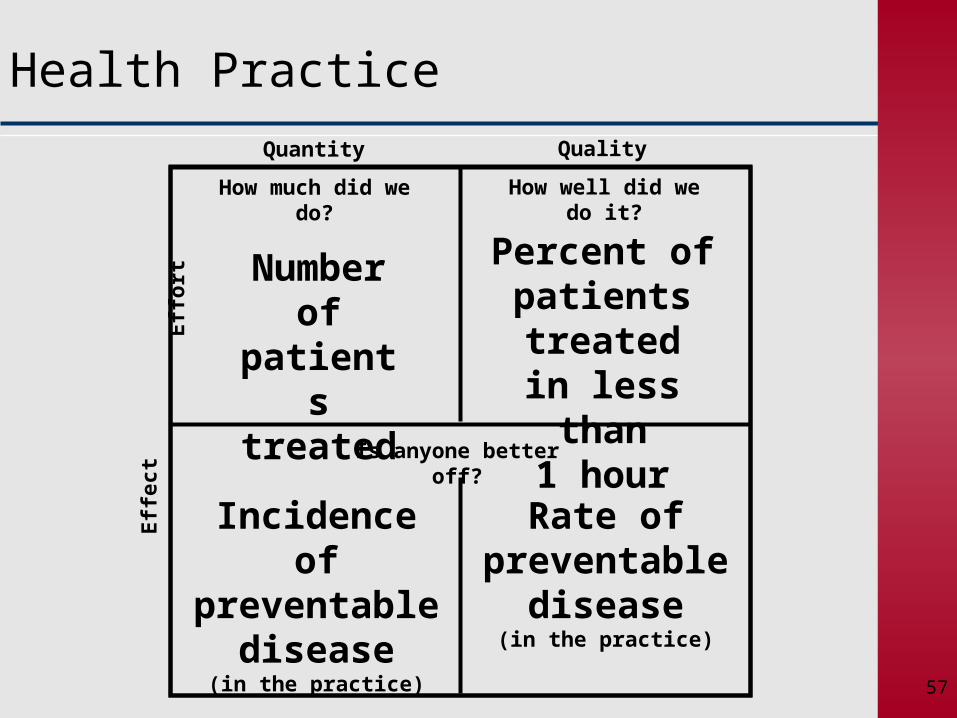
Health Practice
How much did we do? How well did we do it?
Is anyone better off?
Number ofpatientstreated
Percent ofpatients treated
in less than1 hour
Incidence ofpreventable
disease(in the practice)
Rate ofpreventable
disease(in the practice)
Quantity Quality
E
ffect
Effo
rt
57
58
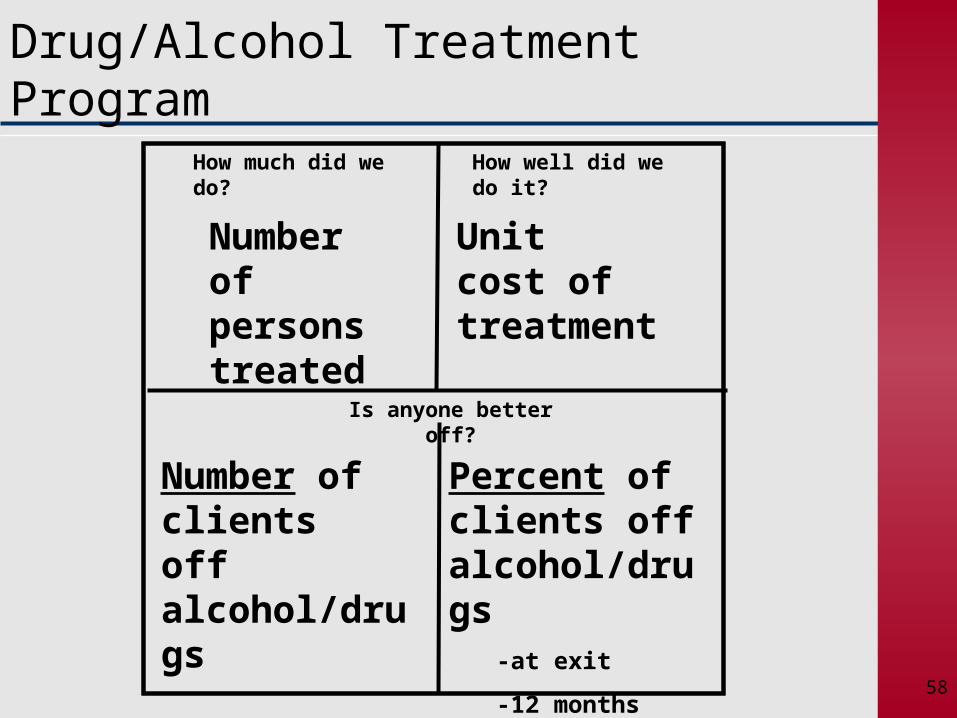
Drug/Alcohol Treatment Program
How much did we do? How well did we do it?
Is anyone better off?
Number ofpersonstreated
Unitcost oftreatment
Number of clientsoff alcohol/drugs
Percent of clients off alcohol/drugs
-at exit
-12 months post-exit
58
59
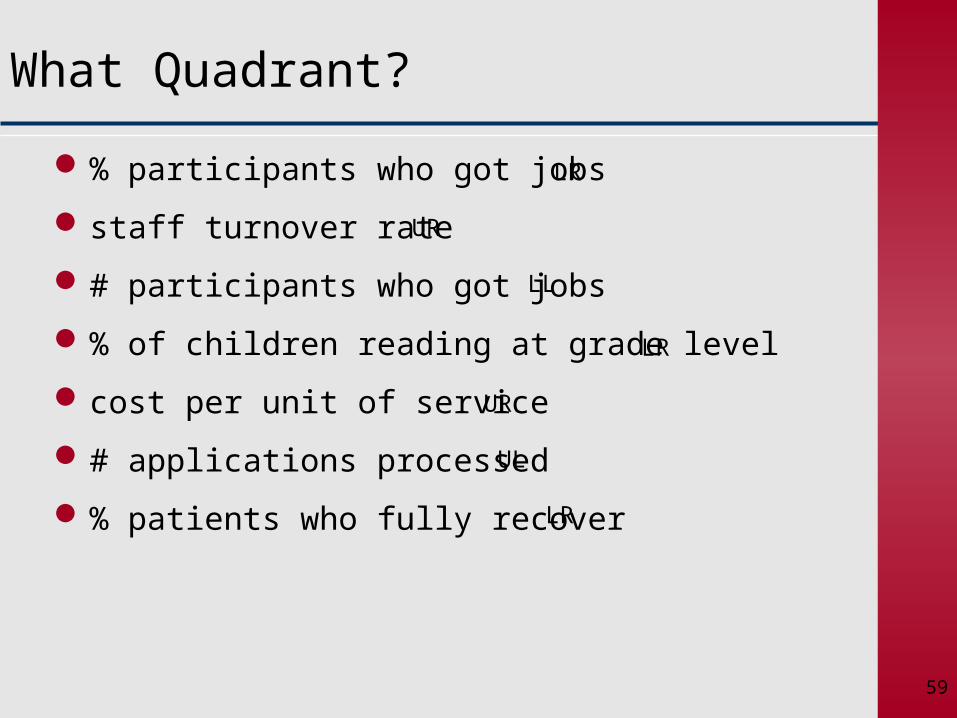
What Quadrant?
% participants who got jobs
staff turnover rate
# participants who got jobs
% of children reading at grade level
cost per unit of service
# applications processed
% patients who fully recover
LL
UR
LR
LR
UR
UL
LR
59
60
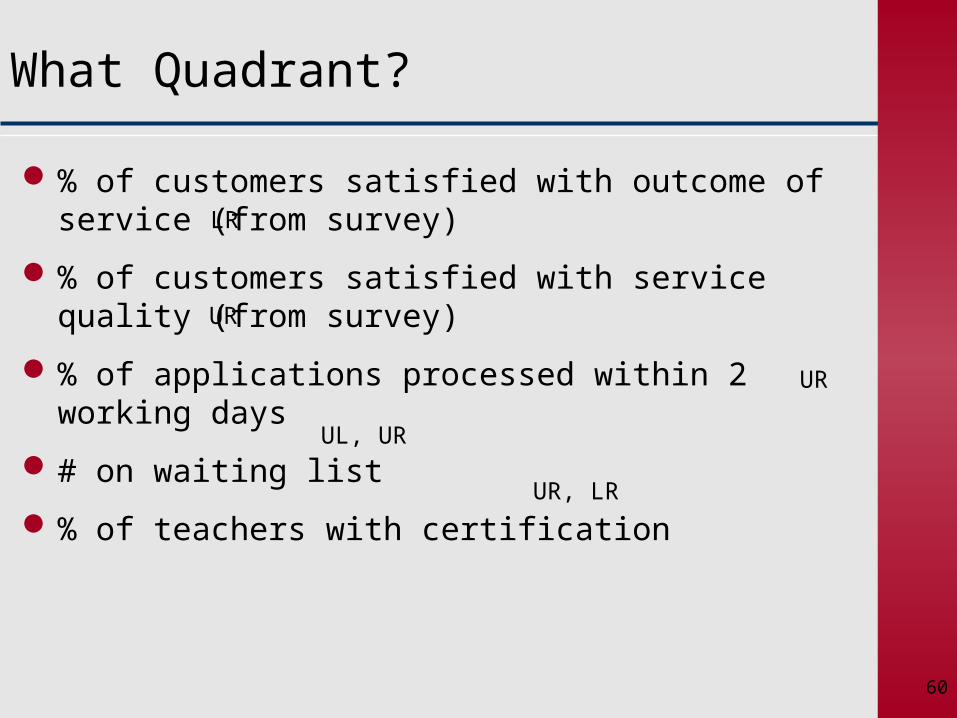
What Quadrant?
% of customers satisfied with outcome of service (from survey)
% of customers satisfied with service quality (from survey)
% of applications processed within 2 working days
# on waiting list
% of teachers with certification
LR
UR
UR
UL, UR
UR, LR
60
61
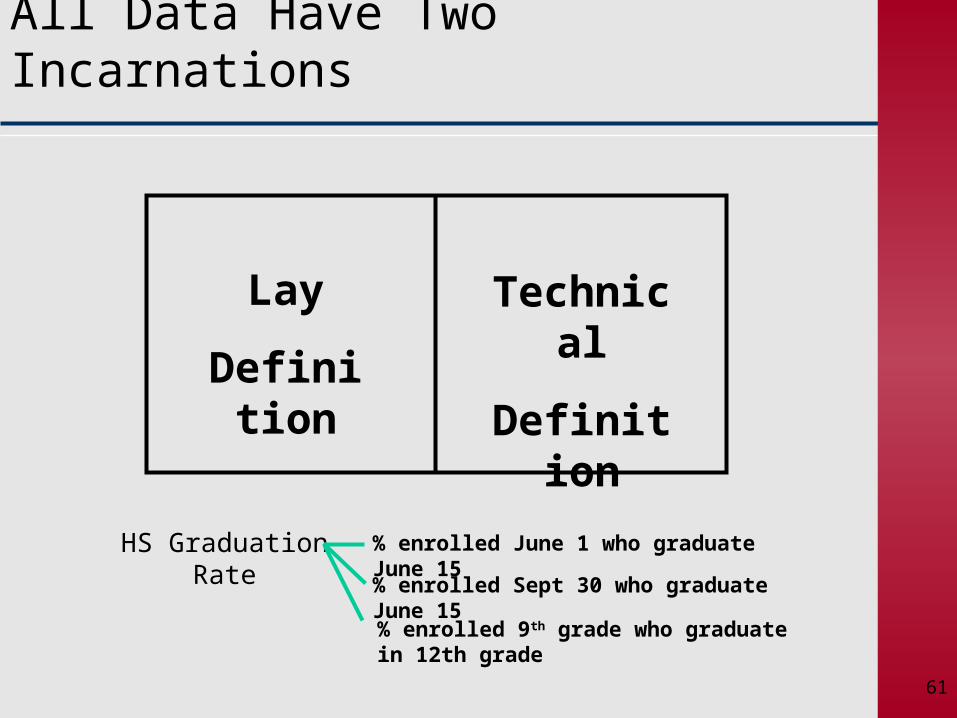
All Data Have Two Incarnations
Lay
Definition
Technical
Definition
HS Graduation Rate % enrolled June 1 who graduate June 15
% enrolled Sept 30 who graduate June 15
% enrolled 9th grade who graduate in 12th grade
61
62
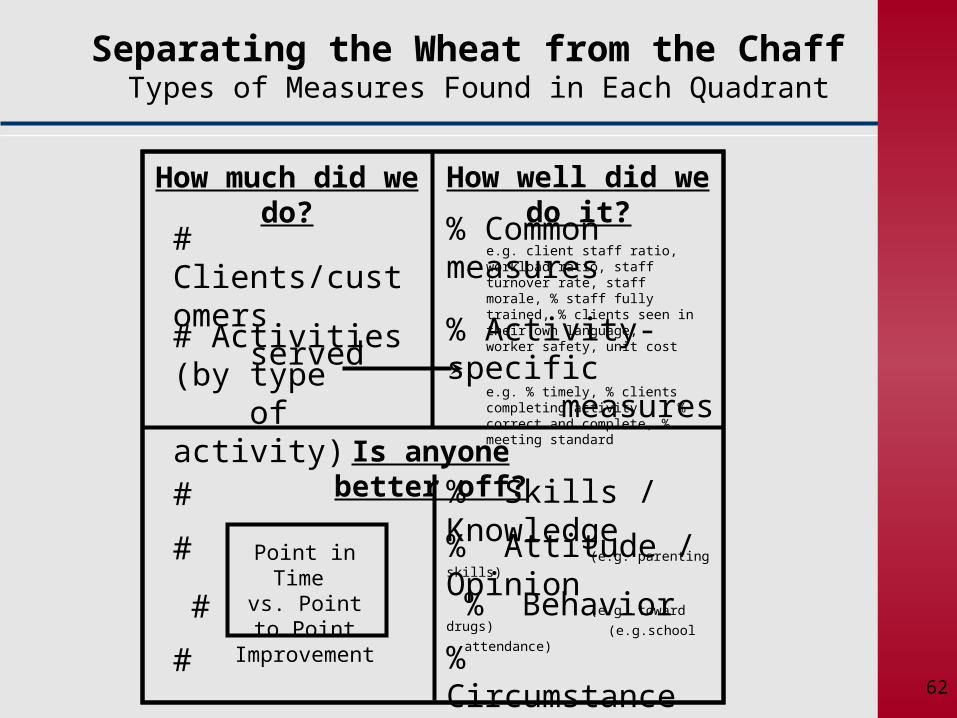
Separating the Wheat from the Chaff Types of Measures Found in Each Quadrant
How much did we do? How well did we do it?
Is anyone better off?
# Clients/customers served
# Activities (by type of activity)
% Common measurese.g. client staff ratio, workload ratio, staffturnover rate, staff morale, % staff fully trained, % clients seen in their own language,worker safety, unit cost
% Skills / Knowledge (e.g. parenting skills)
#
% Attitude / Opinion (e.g. toward drugs)
#
% Behavior (e.g.school attendance)
#
% Circumstance (e.g. working, in stable housing)
#
% Activity-specific measures
e.g. % timely, % clients completing activity, % correct and complete, % meeting standard
Point in Time vs. Point to Point
Improvement
62
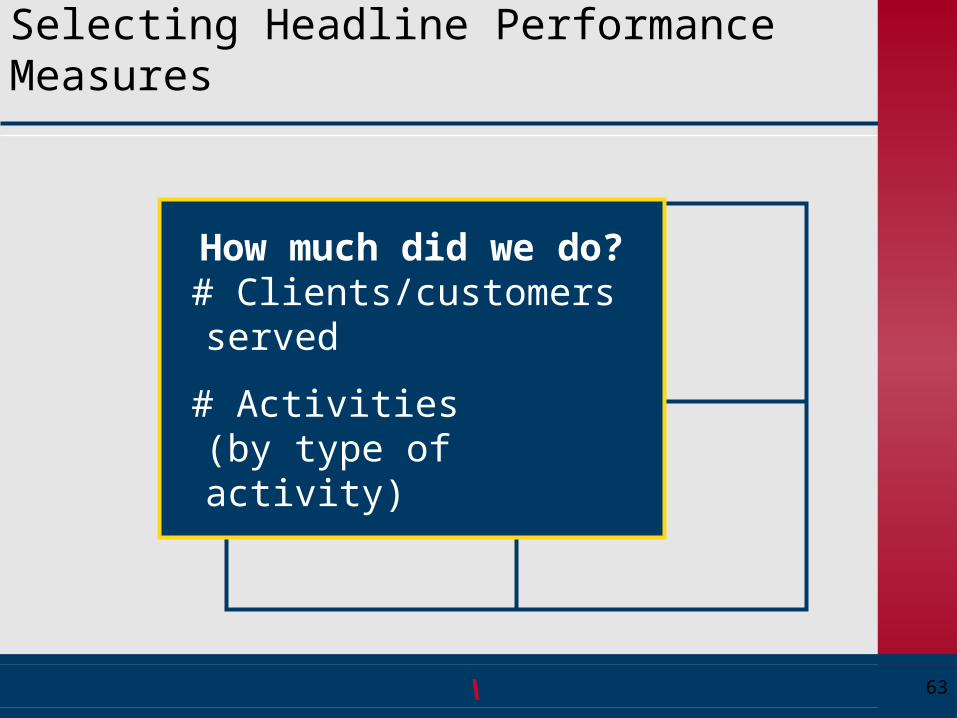
63
How much did we do? # Clients/customers served
# Activities (by type of activity)
\ 63
Selecting Headline Performance Measures
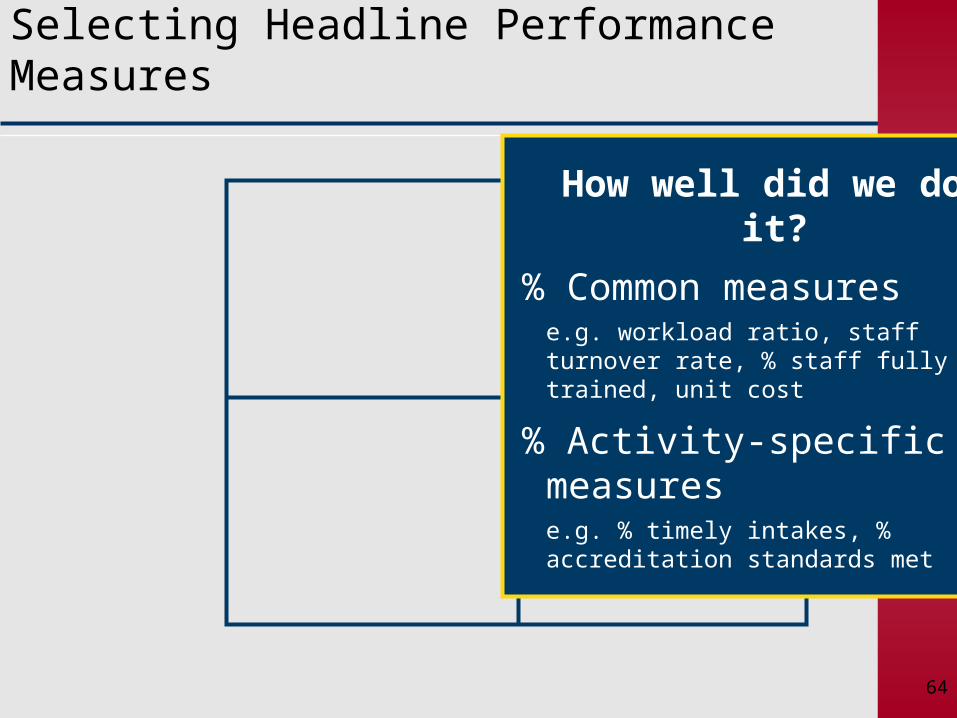
64
How well did we do it?
% Common measurese.g. workload ratio, staff turnover rate, % staff fully trained, unit cost
% Activity-specific measurese.g. % timely intakes, % accreditation standards met
64
Selecting Headline Performance Measures
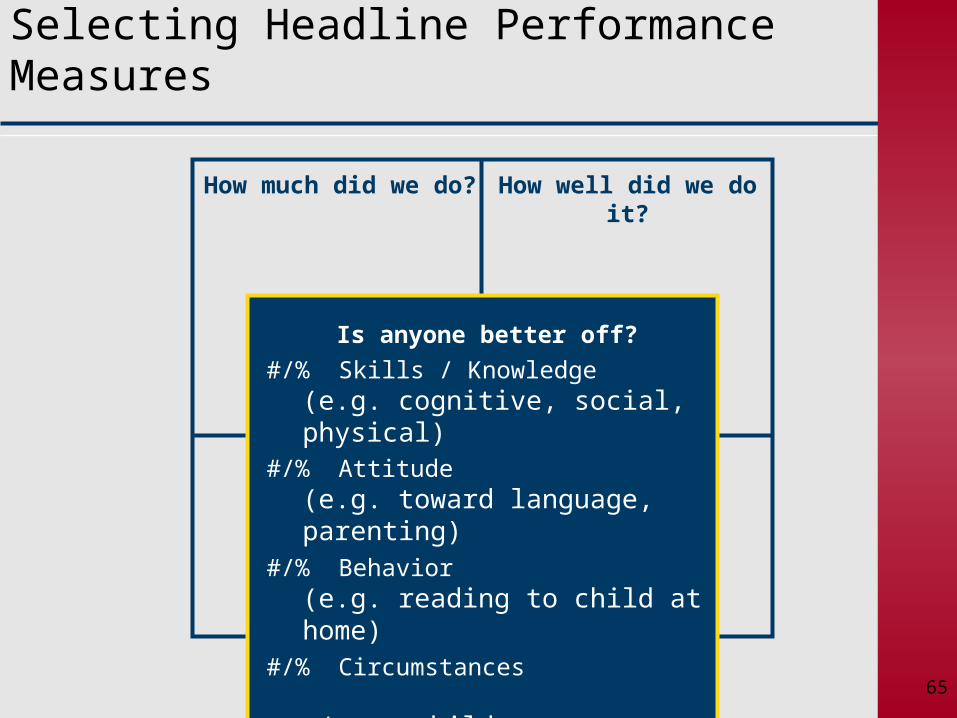
65
How well did we do it?
Is anyone better off?
#/% Skills / Knowledge(e.g. cognitive, social, physical)
#/% Attitude(e.g. toward language, parenting)
#/% Behavior(e.g. reading to child at home)
#/% Circumstances (e.g. child care, transportation)
How much did we do?
65
Selecting Headline Performance Measures
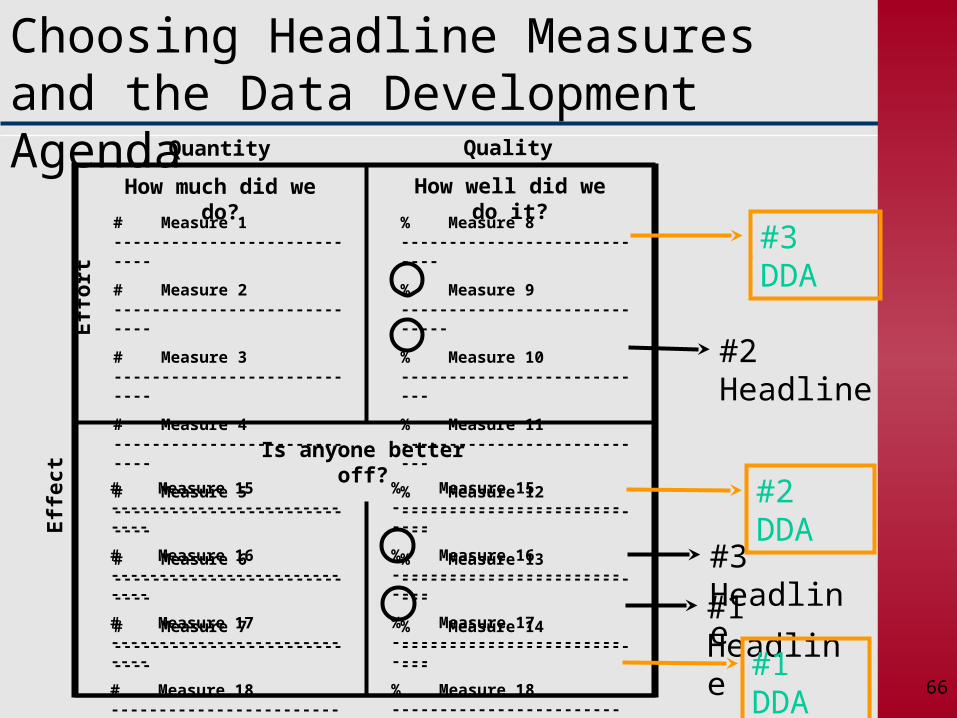
66
Choosing Headline Measures and the Data Development Agenda
How much did we do? How well did we do it?
Is anyone better off?
Quantity Quality
Effe
ct
E
ffort
# Measure 1 ----------------------------
# Measure 2 ----------------------------
# Measure 3 ----------------------------
# Measure 4 ----------------------------
# Measure 5 ----------------------------
# Measure 6 ----------------------------
# Measure 7 ----------------------------
#1 Headline
#2 Headline
#3 Headline
#1 DDA
#2 DDA
#3 DDA% Measure 8 ----------------------------
% Measure 9 -----------------------------
% Measure 10 ---------------------------
% Measure 11 ---------------------------
% Measure 12 ---------------------------
% Measure 13 ---------------------------
% Measure 14 ---------------------------
# Measure 15 ----------------------------
# Measure 16 ----------------------------
# Measure 17 ----------------------------
# Measure 18 ----------------------------
# Measure 19 ----------------------------
# Measure 20 ----------------------------
# Measure 21 ----------------------------
% Measure 15 ----------------------------
% Measure 16 ----------------------------
% Measure 17 ----------------------------
% Measure 18 ----------------------------
% Measure 19 ----------------------------
% Measure 20 ----------------------------
% Measure 21 ----------------------------
66
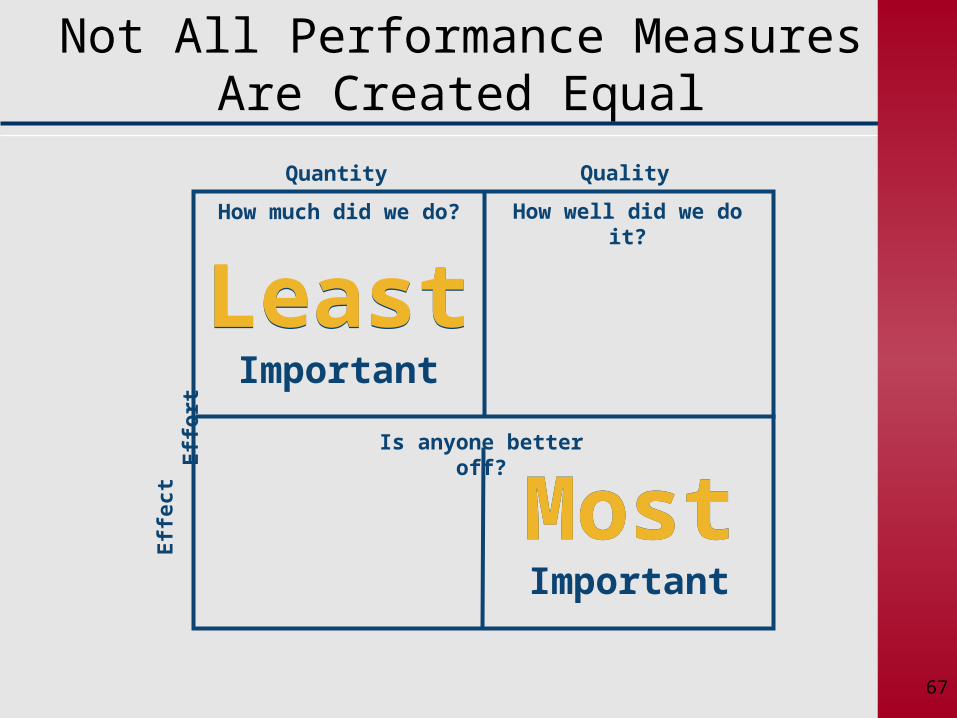
67
How much did we do?
Not All Performance Measures Are Created Equal
How well did we do it?
Is anyone better off?
LeastImportant
Quantity QualityE
ffec
t
Eff
ort
MostImportant
Least
Most
67
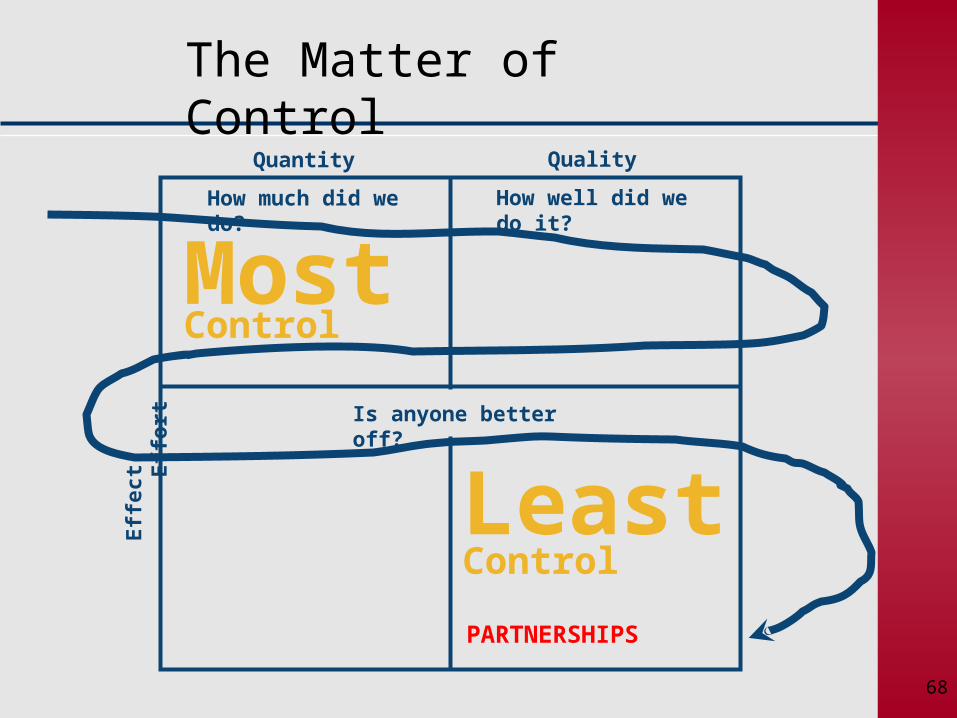
68
How much did we do?
The Matter of Control
How well did we do it?
Is anyone better off?
Quantity QualityE
ffec
t
E
ffo
rt
LeastControl
PARTNERSHIPS
MostControl
68

69
LR
UR
69
7070
71
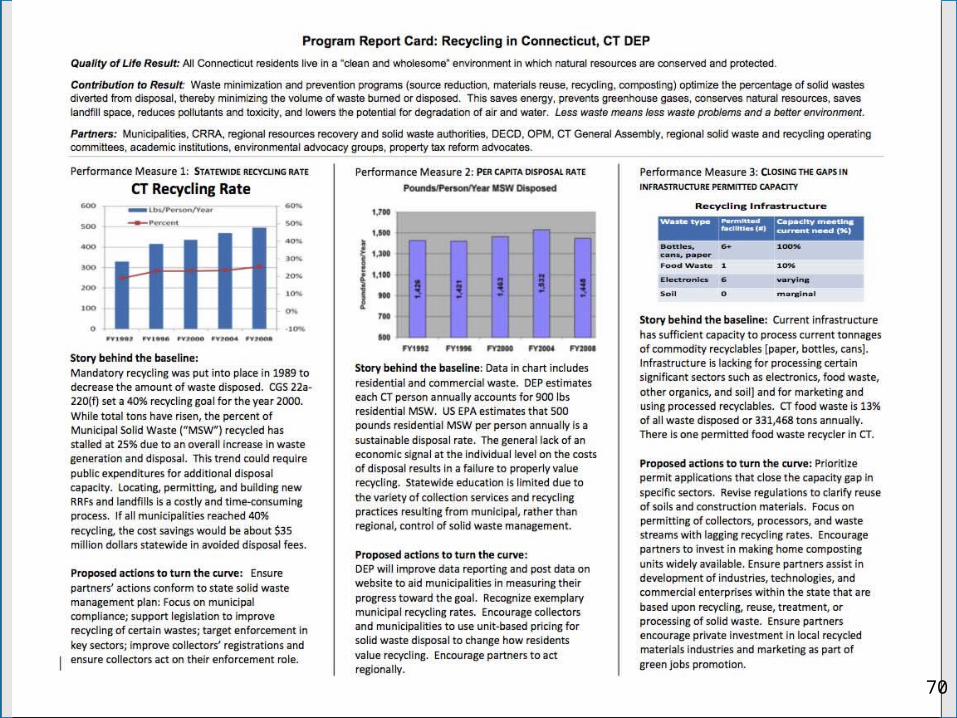
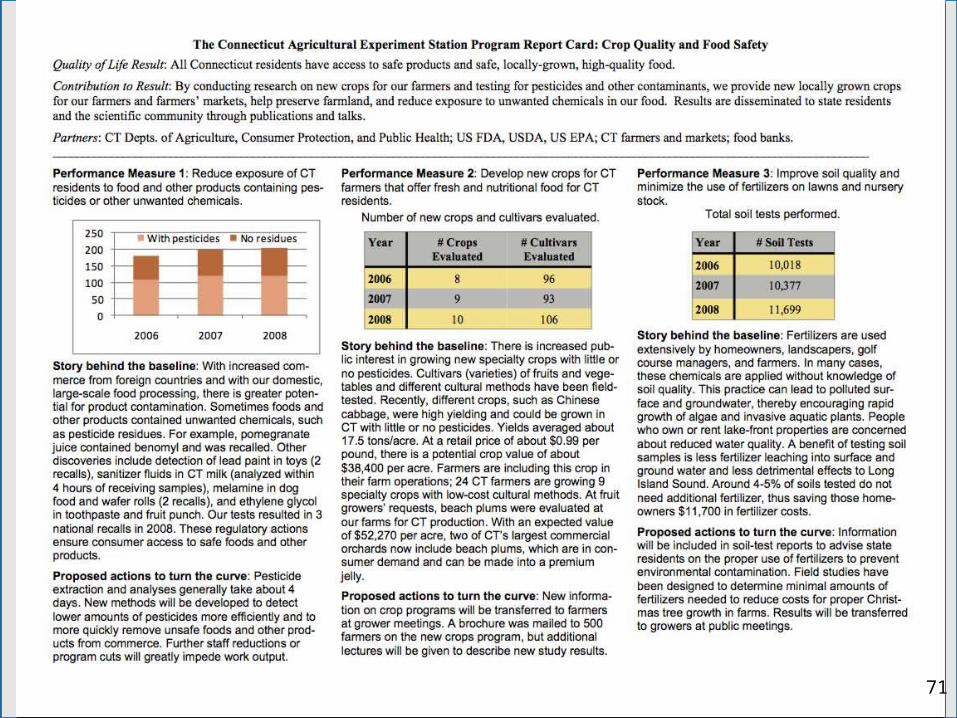
Report Cards for the Connecticut General Assembly
71
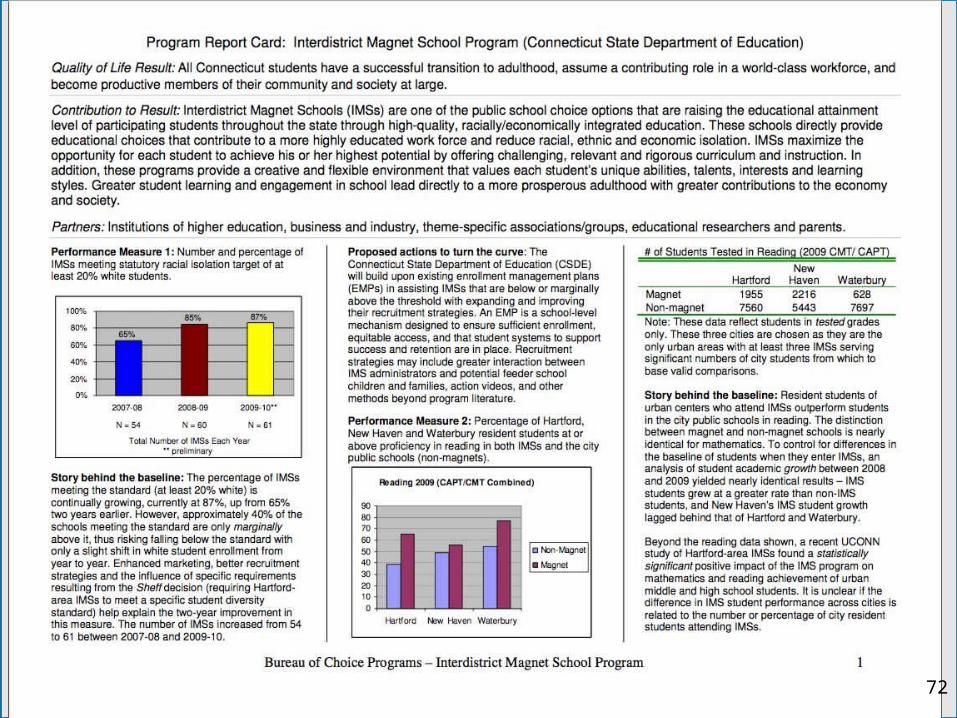
72
Report Cards for the Connecticut General Assembly
72
I N
N O
V A
T I
O NHow Population and
Performance AccountabilityFIT TOGETHER
74
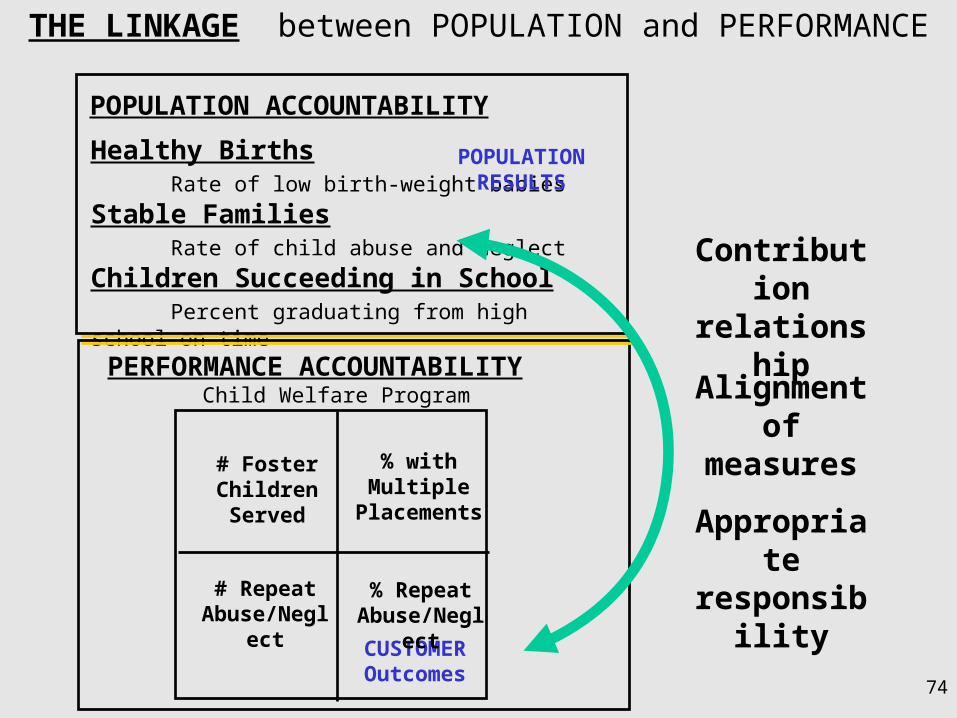
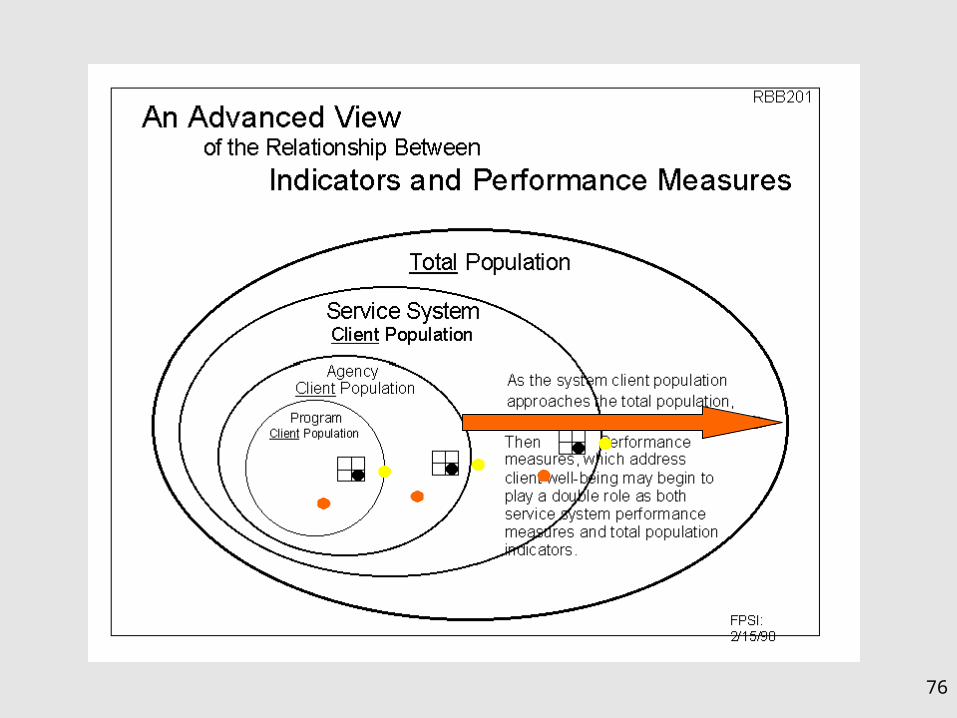
THE LINKAGE between POPULATION and PERFORMANCE
POPULATION ACCOUNTABILITY
Healthy Births Rate of low birth-weight babiesStable Families Rate of child abuse and neglectChildren Succeeding in School Percent graduating from high school on time
Contributionrelationship
Alignmentof measures
Appropriateresponsibility
Child Welfare Program
CUSTOMEROutcomes
POPULATIONRESULTS
# Foster ChildrenServed
% withMultiple
Placements
# RepeatAbuse/Neglect
% RepeatAbuse/Neglect
PERFORMANCE ACCOUNTABILITY
74
75
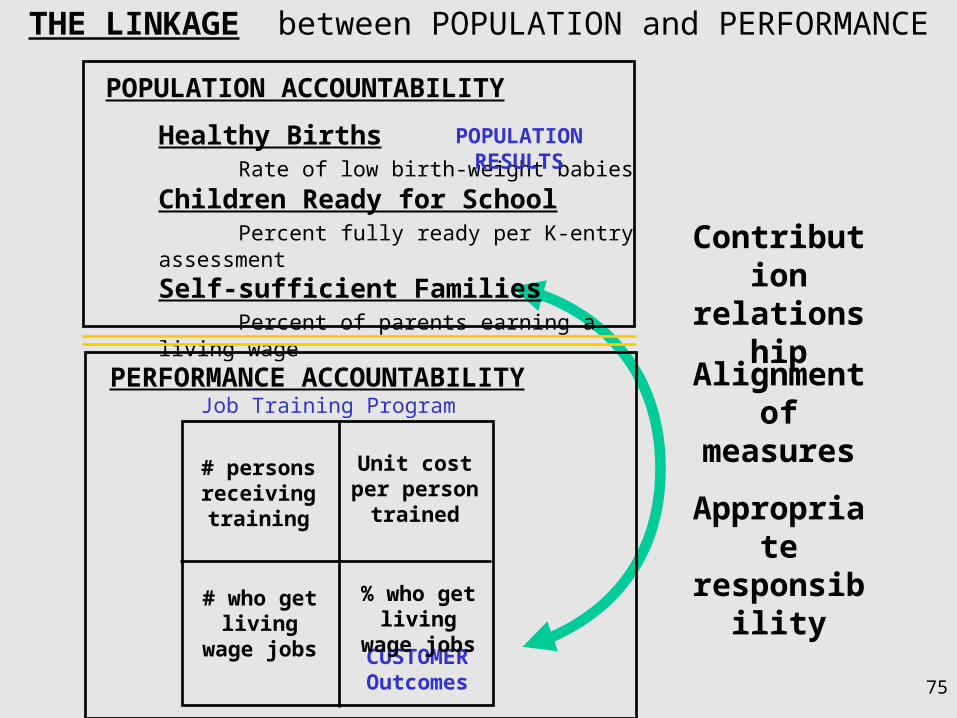
THE LINKAGE between POPULATION and PERFORMANCE
Contributionrelationship
Alignmentof measures
Appropriateresponsibility
POPULATION ACCOUNTABILITY
Healthy Births Rate of low birth-weight babiesChildren Ready for School Percent fully ready per K-entry assessmentSelf-sufficient Families Percent of parents earning a living wage
CUSTOMEROutcomes
# personsreceivingtraining
Unit costper person
trained
# who getliving wage jobs
% who getliving wage jobs
PERFORMANCE ACCOUNTABILITY
POPULATIONRESULTS
Job Training Program
75
7676
I N
N O
V A
T I
O N
Performance Measurement Exercise
78
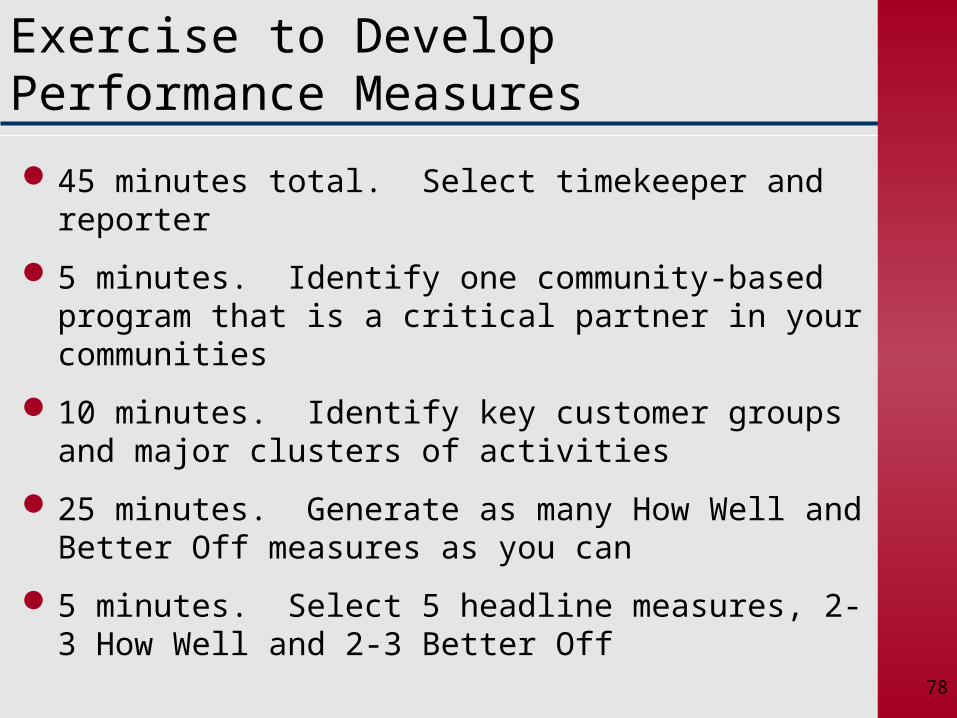
Exercise to Develop Performance Measures
45 minutes total. Select timekeeper and reporter
5 minutes. Identify one community-based program that is a critical partner in your communities
10 minutes. Identify key customer groups and major clusters of activities
25 minutes. Generate as many How Well and Better Off measures as you can
5 minutes. Select 5 headline measures, 2-3 How Well and 2-3 Better Off
78
I N
N O
V A
T I
O N
Data Display Principles
80
Important Data Display Principles
Show the data
Engage the viewer in thinking about substance rather than about the method, graphic design, or technology used to produce the graphic display
Avoid distorting what the data have to say
Make large data sets coherent
– Reveal data at several levels of detail, from a broad overview to a fine structure (drill-down approaches)
Encourage the eyes to compare different pieces of data
*Adapted from Tufte, 1982 80
81
Some Key Design Principles
Organization of reports should be driven by the audience and use of the report
Level of detail should also vary based on audience and intended use of report. This includes:
– How many and what kind of indicators and performance measures to include
– What kinds of comparisons to include
– How much detail is directly accessible in the report
Don’t bury people in data. For community reports, the concept of headline indicators and performance measures is crucial
81
82
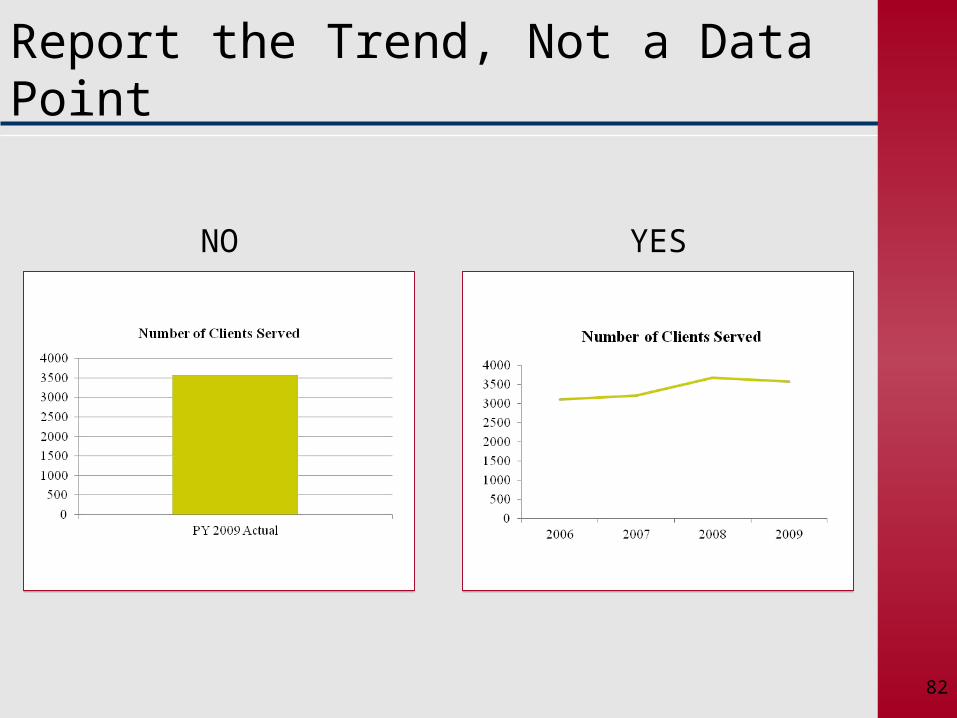
Report the Trend, Not a Data Point
NO YES
82
83
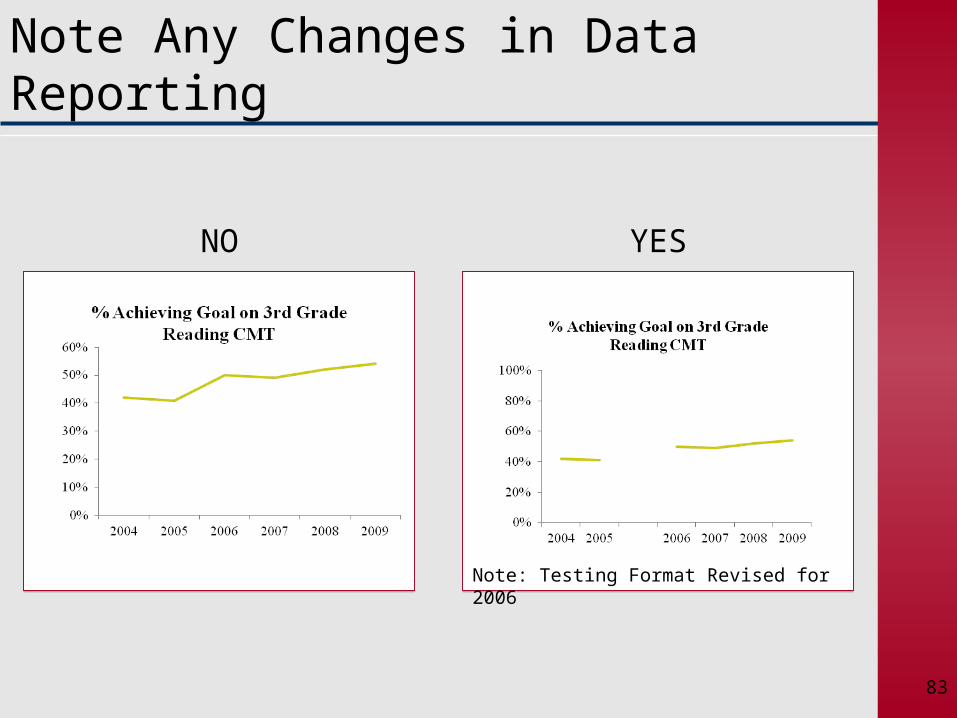
Note Any Changes in Data Reporting
Note: Testing Format Revised for 2006
NO YES
83
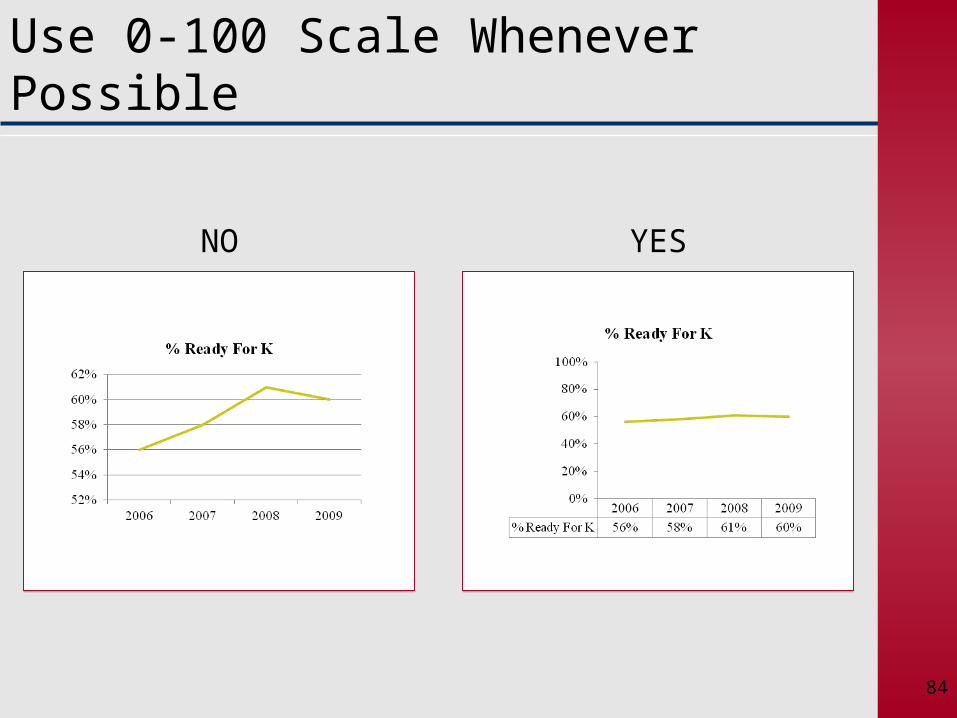
84
NO YES
Use 0-100 Scale Whenever Possible
84
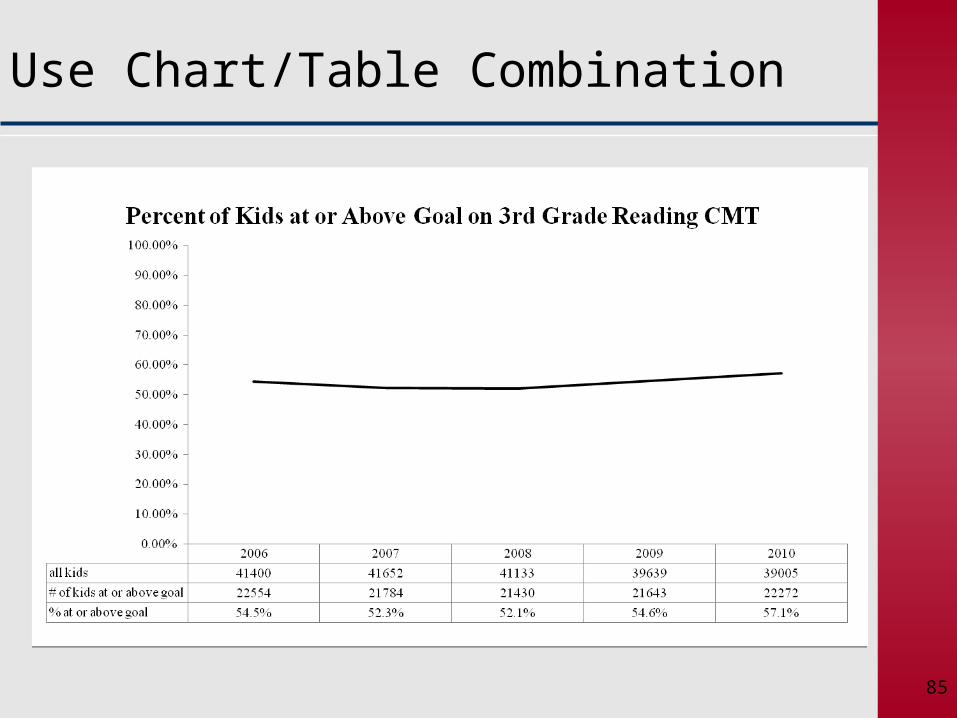
85
Use Chart/Table Combination
85
86
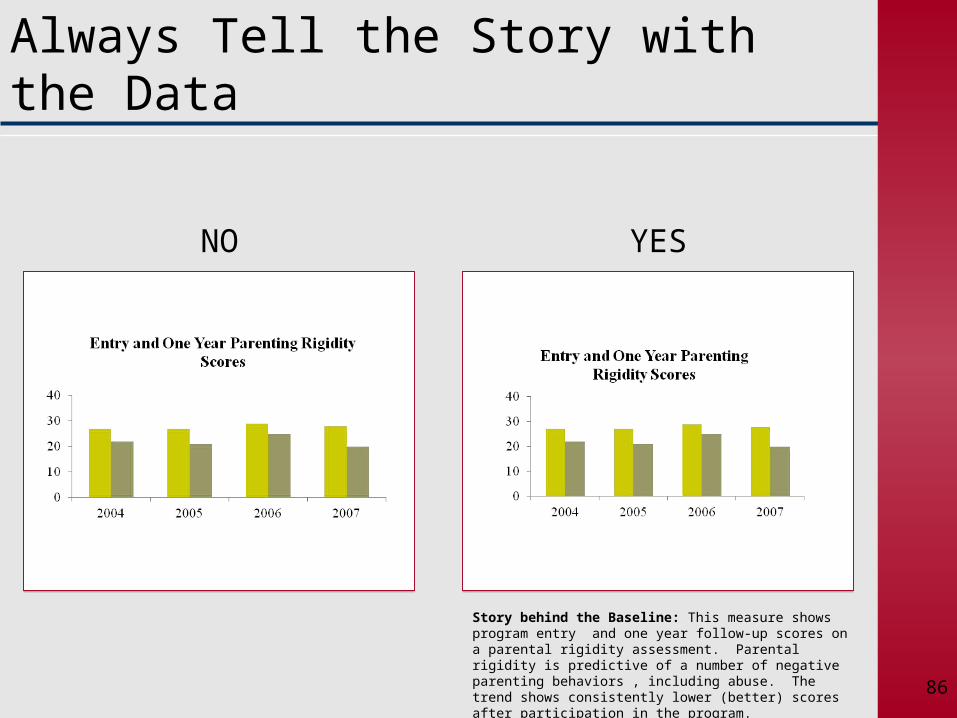
NO YES
Always Tell the Story with the Data
Story behind the Baseline: This measure shows program entry and one year follow-up scores on a parental rigidity assessment. Parental rigidity is predictive of a number of negative parenting behaviors , including abuse. The trend shows consistently lower (better) scores after participation in the program.
86
87
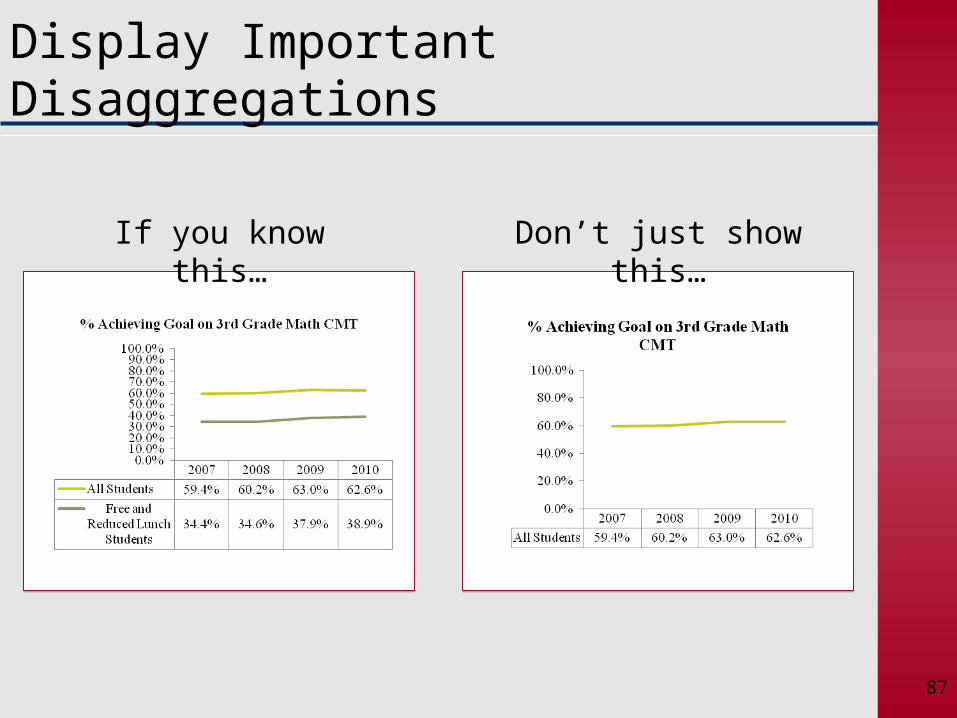
If you know this… Don’t just show this…
Display Important Disaggregations
87
88
Other Critical Comparisons
To a standard or expectation
To a previous point in time
To another place or group of places
To similar, but not exactly the same, programs
88
89
How RBA Is Being Used in Connecticut
Connecticut legislature
State agencies
Communities
Non-profits
Funders
Connecticut RBA Practitioners Network
89

I N
N O
V A
T I
O N
IN CLOSING
91
““If you do what you always did…
you will getwhat you always got.”
Kenneth W. JenkinsPresident, Yonkers NY NAACP
91
92
Remember…
A lone amateur built the Ark.
A large group of professionals built the Titanic.
— Dave Barry
Never Be Afraid To Try Something New.
92
93
Thank You
93
Barry [email protected]
(860) 659-8743
Bennett [email protected]
(860) 324-3555
(860) 478-7847
www.charteroakgroup.com