Raymond James...Raymond James 40th Annual Institutional Investors Conference Forward Looking...
12
1 Raymond James 40 th Annual Institutional Investors Conference
Transcript of Raymond James...Raymond James 40th Annual Institutional Investors Conference Forward Looking...
1
Raymond James40th Annual Institutional Investors Conference

Forward Looking Statements andNon-GAAP Financial Measures
This presentation may contain certain forward-looking statements provided by Company management.
These statements are intended to be covered by the safe-harbor provisions of the Private Securities
Litigation Reform Act of 1995. Forward-looking statements include all statements that do not relate solely to
historical or current facts, including statements regarding future operations, financial results, cash flows,
costs and cost management initiatives, capital structure management, growth rates, and operational and
strategic initiatives, and can also be identified by the use of words like “may,” “believe,” “will,” “expect,”
“project,” “estimate,” “anticipate,” “intend,” “plan,” “initiative,” “continue” or words or phrases of similar
meaning. These forward-looking statements speak only as of the date hereof and are based on our current
plans and expectations and are subject to a number of known and unknown uncertainties and risks, many of
which are beyond our control. These risks and uncertainties are described under headings such as “Risk
Factors” in our annual report on Form 10-K for the year ended December 31, 2018 and other reports filed
with the Securities and Exchange Commission. As a consequence, current plans, anticipated actions and
future financial position and results of operations may differ significantly from those expressed in any
forward-looking statements in today’s presentation. You are cautioned not to unduly rely on such forward-
looking statements when evaluating the information presented and we do not intend to update any of these
forward-looking statements.
The presentation may contain certain non-GAAP measures, including Adjusted EBITDA.
The Company’s earnings releases for the quarter and year ended December 31, 2018, and similar earnings
releases for the prior three December 31st year ends, located on the Company’s investor relations page at
www.hcahealthcare.com, include reconciliations of certain non-GAAP financial measures with the most
directly comparable financial measure calculated in accordance with GAAP. These non-GAAP
financial measures should not be considered alternatives to the GAAP financial measures.
References to “Company” used herein refer to HCA Healthcare, Inc.
and its affiliates, unless otherwise stated or indicated by context.
2

AcuteCare
179Hospitals
Licensed
Beds
47k
Ambulatory Services
123ASCs
GI Centers
19
Access Centers
130Urgent Care
Centers
FSERs
84
Physicians
Physician
Clinics*
Active Medical
Staff
~38k
~1,250
Diversified Mix of Facilities, Services, and Settings
3
*Inclusive of Urgent Care Center countFigures as of December 31, 2018

Strong Market Share
HCA market share ranks 1st or 2nd in 27 of 38 studied marketsHCA’s Enterprise Market Share: 24.7%
Same Store. Composition Market (In Market + In Migration). | Statistics are based on inpatient discharge data for the most recently available periods for 38 defined markets. | Analysis includes data from 32 markets through Q2 ’18, 2 markets through Q1 ’18 (SC), and 4 markets through Q4 ’17(CA).
24.7%
San Jose
19.2%
Southern
California
24.0%
Las
Vegas
28.3%
Salt
Lake
19.9%Denver
32.9%
El PasoEl Paso
26.7%
Wichita
37.9%
Kansas
City
22.2%
Austin
41.4%
San
Antonio
34.1%
DFW
17.8%
McAllen
15.1%
Houston
17.6%
Nashville
36.0%
Northern
Virginia
11.4%
South
Florida
23.3%
Richmond
38.1%
Tampa/
St. Pete
30.2%
SWVA
30.4%
Myrtle
Beach
37.9%
Charleston
24.8%
Orlando
11.5%Jacksonville
20.1%
4
Same Store. Composition Market (In Market + In Migration). | Statistics are based on inpatient discharge data for the most recently available periods for 38 defined markets. | Analysis includes data from 32 markets through Q2 ’18, 2 markets through Q1 ’18 (SC), and 4 markets through Q4 ’17(CA).

Deep and
Experienced
LeadershipStrong
Operating
Culture
Scale
Diversified
Portfolio
Financial
Strength
Sources of Differentiation
5

Local Sustainable
Growth
Operational Excellence
Coordination Across
Continuum
Access and Convenience
ComprehensiveService
Lines
Strong Physician
Relationships
Provider System of Choice
6

Nashville, TN Market
Hospital Campuses 13
Imaging Centers 21
Ambulatory Surgery Centers 4
Health Parks 7TriStar Medical Group
Locations 59
Freestanding ERs 3
CareNow Urgent Care Centers 12
Transfer Center 1
Figures as of June 30, 2018
2
3
5
3
3
5
7
2
Comprehensive Access Across the Continuum
7

Admissions
5 year CAGR1 2.8%
20182 2.00M
2018 over PY3 3.5%
EquivalentAdmissions
5 year CAGR1 3.8%
20182 3.42M
2018 over PY3 4.1%
Surgeries
5 year CAGR1 1.8%
20182 1.52M
2018 over PY3 2.6%
EmergencyRoom Visits
5 year CAGR1 4.7%
20182 8.76M
2018 over PY3 1.6%
1 Percentages represent 5 year CAGR: 2013 – 2018
2 Values represent end of year 2018
3 Percentages represent 2018 over PY
Revenue
5 year CAGR1 6.4%
20182 $46.68B
2018 over PY3 7.0%
Consistent Top Line Growth
8
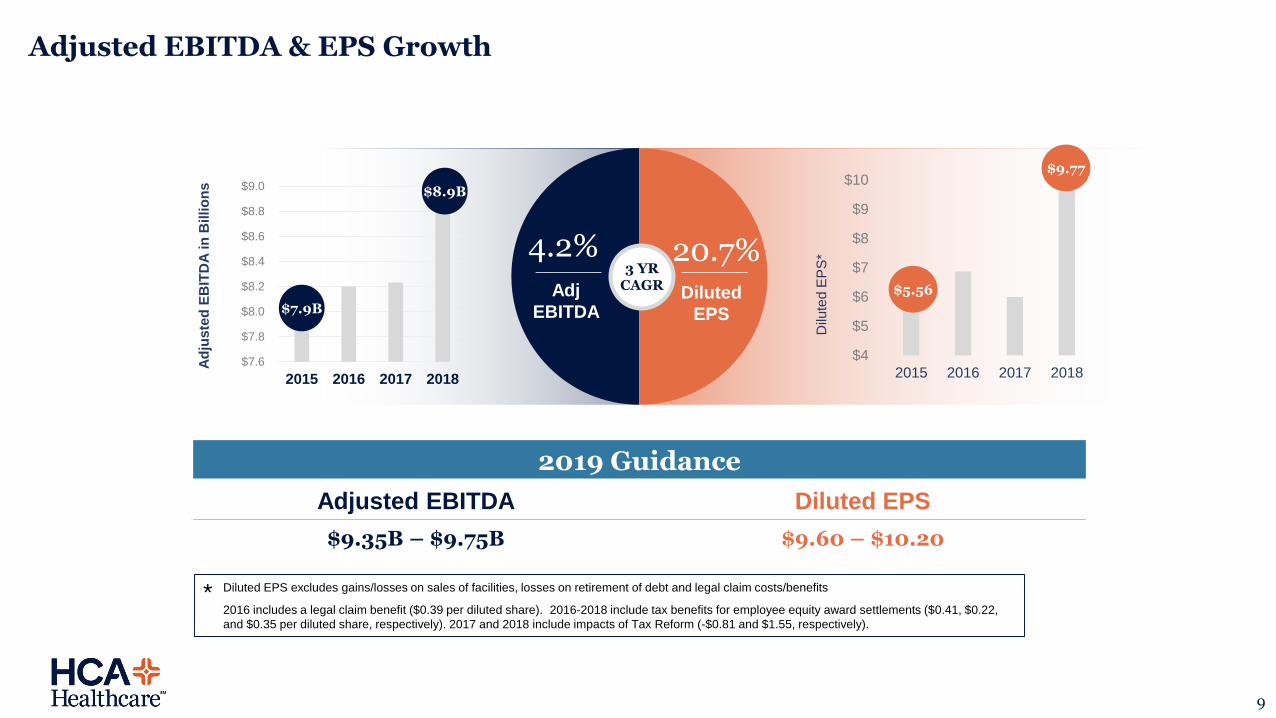
2019 Guidance
Adjusted EBITDA Diluted EPS
$9.35B – $9.75B $9.60 – $10.20
$7.6
$7.8
$8.0
$8.2
$8.4
$8.6
$8.8
$9.0
2015 2016 2017 2018
Ad
jus
ted
EB
ITD
A in
Billio
ns
$7.9B
$8.9B
$4
$5
$6
$7
$8
$9
$10
2015 2016 2017 2018
Dilu
ted
EP
S*
$9.77
$5.56
4.2% 20.7%Adj
EBITDADiluted
EPS
3 YRCAGR
Diluted EPS excludes gains/losses on sales of facilities, losses on retirement of debt and legal claim costs/benefits
2016 includes a legal claim benefit ($0.39 per diluted share). 2016-2018 include tax benefits for employee equity award settlements ($0.41, $0.22,
and $0.35 per diluted share, respectively). 2017 and 2018 include impacts of Tax Reform (-$0.81 and $1.55, respectively).
*
Adjusted EBITDA & EPS Growth
9

Deploying a Balanced Allocation of Capital
$37.9B
Cash Flow from Operations
$19.1BCapital
Expenditures
Investing in Growth
$6.6BAcquisition
Capital
Delivering Shareholder
Value
$3.2BSpecial
Dividends
$487MQuarterly
Dividends*
$12.5BShare
RepurchasesCash Flows provided by Operations and primary uses of Cash Flows from March 2011 IPO through December 2018.
*HCA began paying a regular, quarterly dividend the 1st quarter of 2018
10

Committed to Ensuring Capacity and Access$25.6B Invested since the 2011 IPO
Annual Capital Investment
* Projected pipeline does not include any acquisition-related capacity | ** 2011 includes $351M in Capital Investment incurred prior to the March 2011 IPO
$0.0 $0.5 $1.0 $1.5 $2.0 $2.5 $3.0 $3.5 $4.0 $4.5 $5.0
2018
2017
2016
2015
2014
2013
2012
2011**
PP&E AcquisitionIn Billions
1,059
2019 Pipeline*
Inpatient Beds
477ER Beds
11

Sources of Differentiation
Improve Our Business
Drive Growth
Speed to Market
Support Execution
Capital
Innovation
Economiesof Scale
12