RAY: SLUM FREE CITY PLANNINGmohua.gov.in/upload/uploadfiles/files/55Bellary_KRN_sfcp...RAY: SLUM...
129
RAJIV AWAS YOJANA SLUM FREE CITY PLAN OF ACTION BELLARY DRAFT Regional Centre for Urban and Environmental Studies Osmania University, Hyderabad Sponsored by Ministry of Urban Development, Govt. of India
Transcript of RAY: SLUM FREE CITY PLANNINGmohua.gov.in/upload/uploadfiles/files/55Bellary_KRN_sfcp...RAY: SLUM...

RAJIV AWAS YOGANA
SLUM FREE CITY PLAN
PLAN OF ACTION
BELLARY
State Urban Development Authority
Government of Karnataka
RAJIV AWAS YOJANA
SLUM FREE CITY PLAN OF ACTION
BELLARY
DRAFT
Regional Centre for Urban and Environmental Studies
Osmania University, Hyderabad
Sponsored by
Ministry of Urban Development, Govt. of India

RAY: SLUM FREE CITY PLANNING BELLARY
2
Regional Centre for Urban and Environmental studies
SLUM FREE CITY PLANNING:
BELLARY

RAY: SLUM FREE CITY PLANNING BELLARY
i
Regional Centre for Urban and Environmental studies
LIST OF TABLES.......................................................................................................................... iv
LIST OF CHARTS ......................................................................................................................... iv
LIST OF MAPS ............................................................................................................................... v
LIST OF PICTURES ..................................................................................................................... vi
ACRONYMS ................................................................................................................................ viii
EXECUTIVE SUMMARY............................................................................................................. xi
PREAMBLE .................................................................................................................................. xii
CHAPTER 1 - OVERVIEW ........................................................................................................... 1
1.1. Introduction of the city ............................................................................................................ 1
a. Bellary City Profile .................................................................................................................. 1
b. Housing Scenario ..................................................................................................................... 7
1.2 Diagnostic Assessment of slums................................................................................................. 9
a. Listing of slums – number, status, tenability, and tenure status ............................................... 11
b. Physical profile ...................................................................................................................... 16
c. Social Profile ......................................................................................................................... 22
d. Economic profile.................................................................................................................... 26
e. Infrastructure ......................................................................................................................... 28
CHAPTER 2 – SLUM REHABILITATION STRATEGY .......................................................... 50
2.1. Surveys, Investigations & Consultations............................................................................... 58
a. Introduction ........................................................................................................................... 58
b. GIS mapping .......................................................................................................................... 59
c. MIS….. .................................................................................................................................. 59
d. Stakeholder Consultation ....................................................................................................... 60
2.2. Slum Categorization .............................................................................................................. 60
a. Tenability .............................................................................................................................. 60
b. Abutting Land use .................................................................................................................. 62
c. Land tenure of slums .............................................................................................................. 62
d. Ownership of Land Status ...................................................................................................... 64
e. Density .................................................................................................................................. 66
f. Land value ............................................................................................................................. 68
CONTENTS

RAY: SLUM FREE CITY PLANNING BELLARY
ii
Regional Centre for Urban and Environmental studies
2.3. Slum Rehabilitation Framework ........................................................................................... 68
a. Observations / Findings of Analysis of Existing Situation ....................................................... 68
b. Physical requirements for Housing ......................................................................................... 75
c. Physical requirements for Infrastructure ................................................................................. 77
d. Implementation Plan .............................................................................................................. 78
e. Modalities / Approach ............................................................................................................ 82
2.4. Investment Requirements ...................................................................................................... 84
a. Housing ................................................................................................................................. 84
b. Infrastructure ......................................................................................................................... 84
c. Operation & maintenance ....................................................................................................... 86
2.5. Capacity Building .................................................................................................................. 87
a. Slum dwellers ........................................................................................................................ 87
b. Intermediaries ........................................................................................................................ 87
c. Government stakeholders ....................................................................................................... 87
CHAPTER 3 - SLUM PREVENTION STRATEGY ................................................................... 89
3.1. Housing Stock Assessment .................................................................................................... 90
a. Population Projections ........................................................................................................... 90
b. Household requirements ......................................................................................................... 90
c. Infrastructure requirements .................................................................................................... 91
d. Land requirements ................................................................................................................. 91
3.2. Implementation Plan ............................................................................................................. 92
a. Options for Generating Stock ................................................................................................. 92
b. Targets & Timelines............................................................................................................. 101
3.3. Investment requirements ..................................................................................................... 102
a. Housing ............................................................................................................................... 102
b. Infrastructure ....................................................................................................................... 102
c. Operation & Maintenance .................................................................................................... 104
3.4. Slum Prevention Reforms ................................................................................................... 105
3.5. Capacity Building ................................................................................................................ 106
CHAPTER 4 – ROAD MAP ....................................................................................................... 109
4.1. Touchstone Principles.......................................................................................................... 109
a. Institutional Framework ....................................................................................................... 109
b. Assessment of Implementation Options ................................................................................ 110

RAY: SLUM FREE CITY PLANNING BELLARY
iii
Regional Centre for Urban and Environmental studies
4.2. Financing Plan ..................................................................................................................... 110
a. Summary of Investments ...................................................................................................... 110
b. Financing Structure .............................................................................................................. 111
c. Strategy for Sustenance ........................................................................................................ 112
d. ULB Finances ...................................................................................................................... 112
e. Earmarking for Slum Rehabilitation & Prevention Strategy .................................................. 112
f. Community Participation ..................................................................................................... 112
4.3. Monitoring & Review .......................................................................................................... 112
4.4. Reforms ................................................................................................................................ 113
LIST OF ANNEXURES .............................................................................................................. 114

RAY: SLUM FREE CITY PLANNING BELLARY
iv
Regional Centre for Urban and Environmental studies
Table 1- 1: Existing Scenario of the ULB at a Glance 4 Table 1- 2: Land use Details (2006 and 2021) 5 Table 1- 3: Receipts and Expenditure for the Year 2010-11 7 Table 1- 4: Distribution of slums according to number, status, tenability, tenure 11 Table 1- 5: Summary of slums – Area, Location, Abutting land use & Flood vulnerability 16 Table 1- 6: Population & Health 22 Table 1- 7: School dropouts 25 Table 1- 8: Current Water Supply Statistics 28 Table 1- 9: Current Sanitation Statistics 31 Table 1- 10: Solid waste management (Existing Situation) 35 Table 1- 11: Current Statistics of Roads and street lights 38 Table 1- 12: Distance from nearest Pre-Primary School 42 Table 1- 13: Distance from nearest Primary School 43 Table 1- 14: Distance from nearest High School 43 Table 1- 15: Distance from nearest Health facilities 45 Table 1- 16: Social welfare facilities 47
Table 2- 1: Tenability of Slums ........................................................................................... 60 Table 2- 2: Notification Status / land use ............................................................................. 62 Table 2- 3: Land tenure Status ............................................................................................. 62 Table 2- 4: Ownership of Land Status ................................................................................. 64 Table 2- 5: Land Ownership / Notification Status ................................................................ 64 Table 2- 6: Land Ownership / Area ..................................................................................... 64 Table 2- 7: Density / Mode of Development ........................................................................ 66 Table 2- 8: Water Supply details ......................................................................................... 69 Table 2- 9: Sanitation details ............................................................................................... 70 Table 2- 10: Solid waste management details ...................................................................... 71 Table 2- 11: Roads and Street lights details ......................................................................... 72 Table 2- 12: Slum deficiency and vulnerability matrix ......................................................... 74 Table 2- 13: Housing requirements ...................................................................................... 75 Table 2- 14: Physical Infrastructure requirements ................................................................ 77 Table 2- 15: Social Infrastructure requirements ................................................................... 78 Table 2- 16: Slums to be covered under RAY from 2012 – 2017 ......................................... 79 Table 2- 17: Investment requirements for Housing (in INR/ Lakhs) ..................................... 84 Table 2- 18: Investment requirements for Infrastructure (in INR/ Lakhs) ............................. 84 Table 2- 19: Sector Wise Estimated Cost (In INR / Lakhs) .................................................. 85 Table 2- 20: Estimated Operation and Maintenance Cost (In INR / Lakhs) .......................... 86
Table 3- 1: Projected population for 5 years ........................................................................ 90 Table 3- 2: Housing requirement for 5 years ........................................................................ 90 Table 3- 3: Infrastructure requirement for slum prevention from 2012-2017 ........................ 91 Table 3- 4: Targets & Timelines ........................................................................................ 101 Table 3- 5: Costing for projected households (In INR / Lakhs) .......................................... 102 Table 3- 6: Estimated Infrastructure Cost for Projected Households (in INR /Lakhs) ......... 103 Table 3- 7: Estimated O & M cost for projected households (In INR / lakhs) ..................... 104
Table 4- 1: Summary of Investments for 2012-2017 .......................................................... 110
LLIISSTT OOFF CCHHAARRTTSS
LLIISSTT OOFF TTAABBLLEESS

RAY: SLUM FREE CITY PLANNING BELLARY
v
Regional Centre for Urban and Environmental studies
Chart 1- 1: Tenability of Slums ........................................................................................... 12
Chart 1- 2: Ownership of land ............................................................................................. 12
Chart 1- 3: Age of the Slums ............................................................................................... 14
Chart 1- 4: Physical location of slums ................................................................................. 17
Chart 1- 5: Area of slums .................................................................................................... 18
Chart 1- 6: Existing housing condition ................................................................................ 19
Chart 1- 7: Population details based on different social categories ....................................... 24
Chart 1- 8: Classification of illiterates ................................................................................. 24
Chart 1- 9: Occupational status of slums.............................................................................. 27
Chart 1- 10: Monthly Income of Households ....................................................................... 27
Chart 1- 11: Type of sanitation facility ................................................................................ 34
Chart 2- 1: Slum Rehabilitation Strategy ............................................................................. 51
Chart 2- 2: Mode of Development ....................................................................................... 52
Chart 2- 3: Model Deficiency matrix ................................................................................... 54
Chart 2- 4: Detailed Methodology ....................................................................................... 56
Chart 2- 5: Agencies & Stakeholders involved .................................................................... 58
Chart 2- 6: Modalities & Approach ..................................................................................... 82
Chart 3- 1: Costing for Projected Households .................................................................... 102
Chart 4- 1 Institutional setup for Slum free cities ............................................................... 109
Chart 4- 2: Financing Structure ......................................................................................... 111
LLIISSTT OOFF MMAAPPSS

RAY: SLUM FREE CITY PLANNING BELLARY
vi
Regional Centre for Urban and Environmental studies
Map 1- 1: Location of slums in Bellary city ......................................................................... 10
Map 1- 2: Land Ownership in slums .................................................................................... 13
Map 1- 3: Notified and Non – Notified slums in Bellary City .............................................. 15
Map 1- 4: Housing situation of slums .................................................................................. 20
Map 1- 5: Population classification in Slums ....................................................................... 23
Map 1- 6: Slums connected to city-wide water supply system .............................................. 29
Map 1- 7: Slums connected to city-wide sewerage system ................................................... 32
Map 1- 8: Slums connected to city-wide Storm water drainage system ................................ 33
Map 1- 9: Frequency of garbage clearance .......................................................................... 36
Map 1- 10: Condition of Approach roads ............................................................................ 39
Map 1- 11: Availability of street lights ................................................................................ 41
Map 1- 12: Availability of primary schools ......................................................................... 44
Map 1- 13: Availability of Primary health centres ............................................................... 46
Map 1- 14: Availability of Community hall ......................................................................... 48
Map 2- 1: Tenability Analysis of Slums .............................................................................. 61
Map 2- 2: Tenure status of slums......................................................................................... 63
Map 2- 3: Land ownership of slums .................................................................................... 65
Map 2- 4: Density of Dwelling unit in slums ....................................................................... 67
Map 2- 5: Mode of development in slums............................................................................ 76
Map 2- 6: Model layout....................................................................................................... 82
Map 3- 1: Proposed layout for Korachegere Bandimot area ................................................. 94
Map 3- 2: Proposed layout for Vinayaka nagara 2nd
Phase ................................................... 97
Map 3- 3: Proposed layout for Mahanandi kottam
(Ambedkar nagar) ............................................................................................................. 100
LLIISSTT OOFF PPIICCTTUURREESS

RAY: SLUM FREE CITY PLANNING BELLARY
vii
Regional Centre for Urban and Environmental studies
Picture 1- 1: Bellary City Fort ............................................................................................... 1
Picture 1- 2: Bellary location map ......................................................................................... 2
Picture 1- 3: Bellary in the past ............................................................................................. 3
Picture 1- 4: A mining site in Bellary ................................................................................... 3
Picture 1- 5: Bellary fort........................................................................................................ 3
Picture 1- 6: Housing condition in Andral slum ..................................................................... 8
Picture 1- 7: Semi pucca housing in B.Gonal slum ................................................................ 8
Picture 1- 8: Katcha housing in Bandimot slum ..................................................................... 8
Picture 1- 9: Pucca housing in Kaakarla thota slum ............................................................... 8
Picture 1- 10: Katcha house in Radhakeishna nagar ............................................................... 8
Picture 1- 11: Pucca house at Mundargi ................................................................................. 8
Picture 1- 12: Along the railway line, Guggarahatti honnali road ........................................... 9
Picture 1- 13: Water logging, Nagulacheruvu ........................................................................ 9
Picture 1- 14: Along the HT lines, B Gonal slum ................................................................... 9
Picture 1- 15: Along the Major Transport alignment, Bandimot area.................................... 14
Picture 1- 16: Along the major Nallah ................................................................................. 14
Picture 1- 17: Beside of Agriculture lands, Mundargi .......................................................... 14
Picture 1- 18: Location of Bellary Slum along Industries ..................................................... 17
Picture 1- 19: Storm water drain at Anjanappa nagar slum ................................................... 18
Picture 1- 20: Water body in Basavanakunta slum ............................................................... 18
Picture 1- 21: Canal at Shanthi nagar slum ......................................................................... 18
Picture 1- 22: Water logging at Andral ................................................................................ 18
Picture 1- 23: Existing housing condition in the slums ......................................................... 19
Picture 1- 24: Semi pucca house in Mundargi ...................................................................... 21
Picture 1- 25:Semi pucca house in Millerpet no-I ................................................................ 21
Picture 1- 26: Pucca House Under Costruction, Kaakarlathota ............................................. 21
Picture 1- 27: Pucca House at Cheluvadikeri Bandimot area ................................................ 21
Picture 1- 28: Bisalahalli (Harijanakere) .............................................................................. 22
Picture 1- 29: Vinayaka nagar 2 nd phase ............................................................................ 22
Picture 1- 30: Self employment in Bandimot area slum ....................................................... 26
Picture 1- 31: Animal husbendary in Cheluvadhikeri bandimot area .................................... 26
Picture 1- 32: Skill employment in Jagruthi nagar 2 nd phase .............................................. 26
Picture 1- 33: Shop in Bandimot area slum .......................................................................... 27
Picture 1- 34: Bangles business Cheluvadhi keri Bandomot area ......................................... 27
RAY: SLUM FREE CITY PLANNING BELLARY
viii
Regional Centre for Urban and Environmental studies
Picture 1- 35: Small shop in Cheluvadhi keri slum .............................................................. 27
Picture 1- 36: Hand pump in Miller pet - II slum ................................................................. 30
Picture 1- 37: Individual tap in Guggarahotti honnal road slum........................................... 30
Picture 1- 38: Storm water drain in Millerpet-I .................................................................... 31
Picture 1- 39: Storm water drain at Andral slum .................................................................. 31
Picture 1- 40: Sewer lines passing through centre of the road, Andral Harizankeri .............. 31
Picture 1- 41: Drainage situation in Budubudu keri Bandimot area ...................................... 34
Picture 1- 42: Drainage situation in Andral slum ................................................................. 34
Picture 1- 43: Open defecation in B Gonal slum .................................................................. 35
Picture 1- 44: Community toilets in Budubudu keri (Bandimot area) ................................... 35
Picture 1- 45: Garbage disposal in Miller pet -II slum .......................................................... 37
Picture 1- 46: Garbage disposal in D.C.Colony slum ........................................................... 37
Picture 1- 47: Approach road, Cheluvadhikeri ..................................................................... 40
Picture 1- 48: Internal road in Andral .................................................................................. 40
Picture 1- 49: Street lights in Andral ................................................................................... 40
Picture 1- 50: Street lights along the road, B.Gonal ............................................................. 40
Picture 1- 51: Anganwadi at D.C colony slum ..................................................................... 42
Picture 1- 52: Primary school at Mundargi slum ................................................................. 42
Picture 1- 53: Primary school at D.C. Colony slum .............................................................. 43
Picture 1- 54: High school at Guggarahatti honnali road ...................................................... 43
Picture 1- 55: Govt. Hospital at Alagappa Beedi .................................................................. 45
Picture 1- 56: Clinic in Rani Garden ................................................................................... 45
Picture 1- 57: D.C. Camp belagal road ................................................................................ 47
Picture 1- 58: Dr. Vishnu vardhan Udyanvan, Vinayaka nagar 2nd phase ............................ 47
Picture 1- 59:Vinayakanagar 2nd
Phase ................................................................................ 66
Picture 1- 60: Condition of Sanganakkal road slum ............................................................. 66
Picture 1- 61: Condition of Shanthi nagar slum ................................................................... 66
Picture 2- 1: Enumerators collecting information from community officers ......................... 59
Picture 2- 2: Spatial Linking of Data ................................................................................... 59
Picture 2- 3: Stakeholder consultation ................................................................................. 60
Picture 2- 4: Proposed layout for a single block ................................................................................................................... 81
AACCRROONNYYMMSS

RAY: SLUM FREE CITY PLANNING BELLARY
ix
Regional Centre for Urban and Environmental studies
AKM – Asha Kirana Mahithi
BCC – Bellary City Corporation
BSUP – Basic Services for Urban Poor
BBMP - Bruhat Bangalore Mahanagara palike
BUDA – Bellary Urban Development Authority
CBD – Central Business District
CBO – Community Based Organization
CCA – Compensatory City Allowance
CDP - City Development Plan
CDS - Community Development Societies
CGG - Centre for Good Governance
CO – Community Officer
DPR – Detailed Project Report
DU - Dwelling Unit
DMA – Directorate of Municipal Administration
EWS - Economic weaker section
FSI - Floor Space Index
GIS – Geographical Information System
HHs - Households
HRA – House Rent Allowance
HUDCO – Housing and Urban Development Corporation Ltd
IHSDP – Integrated Housing and Slum Development Program
JnNURM – Jawaharlal Nehru National Urban Renewal Mission
LDPE - Low Density Polyethylene
LIG - Low Income Group
MIS – Management Information System
MoHUPA – Ministry of Housing and Urban Poverty Alleviation
NCR – National Capital Region
NGO's – Non-Governmental Organizations
NHC - Neighborhood Communities

RAY: SLUM FREE CITY PLANNING BELLARY
x
Regional Centre for Urban and Environmental studies
NHG - Neighborhood Groups
NNRC – National Network Resource Centre
NOAPS –National Old Age Pension Scheme
O&M – Operation & Maintenance
PO - Planning Officer
PoA - Plan of Action
PPP - Public Private Partnership
RAY – Rajiv Awas Yojana
RCUES - Regional Centre for Urban and Environmental Studies
RCV - Resident Community Volunteers
SFPoA – Slum Free Plan of Action
SJSRY – Swarna Jayanti Shahari Rozgar Yojana
SLNA - State Level Nodal Agency
SLSC - State Level Scrutinize Committee
STEP UP - Skill Training for Employment Promotion amongst Urban Poor
TDR - Transferable Development Rights
TPIMA - Third Party Inspection and Monitoring Agency
UCDN - Urban Community Development Network
UDPFI - Urban Development Plan Formulation and Implementation
ULB - Urban Local Body
USHA - Urban Statistics for Human Resource & Assessments
UWESP - Urban Women Employment & Self help Programme

RAY: SLUM FREE CITY PLANNING BELLARY
xi
Regional Centre for Urban and Environmental studies
EEXXEECCUUTTIIVVEE SSUUMMMMAARRYY
The Government of India unveiled a holistic mission “Rajiv Awas Yojana” (RAY) to
envision a Slum free India, benefiting about 81 million urban poor with affordable housing, decent
and dignified living environment and well developed basic amenities. Achieving Slum Free India,
though appears to be a very difficult exercise, MoHUPA has categorized the tasks and sub tasks in
such a manner, providing a clear roadmap for the state governments to follow certain methodology
and process in conducting the categorical steps. Slum Free City Planning is a holistic mission to
eradicate poverty, systematize the squatter and hazardous settlements, integrate the plan with other
poverty alleviation schemes and make them as regular engines of both socio-economic and
sustainable development.
The key aspect of Slum Free City Planning comprises mainly of Urban Planning, Law and
Legislation, MIS, GIS, Provision of Land, Community Participation, Stakeholder Convergence,
Project Management and Capacity Building. The process starts with conducting slum survey and
updating MIS database, preparation of the city and slum level maps in GIS, integration of spatial and
non-spatial data, analysis of the existing situation of slums, preparation of slum specific proposals,
involve the community from the inception of project, preparation of DPR, project monitoring and
implementation to achieve Slum Free India.
The Ministry of Housing and Urban Poverty Alleviation (MoHUPA), issued guidelines on
RAY for preparation of State Slum-free Plan of Action (SFPOA), Community Mobilization, MIS and
GIS. The states have to pass legislation for the assignment of property rights to the slum dwellers, and
take steps to prevent new slums.
This report is “Plan of Action” for Bellary slums which includes preparation of Geo-
referenced city base map satellite imagery, identifying and demarcating slums and surrounding vacant
lands, analyzing the slum profile features, finding infrastructure gap assessment, line estimates and
detailed city/slum level analysis. The report provides a gross understanding of slum situation in the
city, categorizes the slums, recommended mode of development for each slum, and majorly phasing
the slum development for the next coming five years. The first year prioritized slums have been
finalized by conducting various stakeholder meetings under the leadership of “Municipal
commissioner”, Bellary city Corporation. The report aims to summarize, analyze the slum situation
and propose a roadmap to reach slum free Bellary.
Slum Free Bellary
Bellary is endowed with rich mineral resources yet considered to be an industrially backward
area which has therefore lead for the formation of slums. It has 67 slums with 16,408 households; a
housing deficit of 9, 835 households. From amenities view, 55% of slums do not have access to
drinking water sources and 7% households lack connectivity to storm water drainage system and
38% with no underground sewer system. On the demographic front, BPL population forms 91% of
the total population where 29% belongs to SC. The plan of action provides line estimates for housing
and infrastructure gaps and proposes civic amenities as per RAY guidelines and the report calls for an
approval and action to prepare DPR‟s for first year phased slums.

RAY: SLUM FREE CITY PLANNING BELLARY
xii
Regional Centre for Urban and Environmental studies
PPRREEAAMMBBLLEE
The Rationale and the Philosophy behind the Rajiv Awas Yojana (RAY)
Section I – Preamble & Overview

RAY: SLUM FREE CITY PLANNING BELLARY
xiii
Regional Centre for Urban and Environmental studies
(i) An estimated 26 per cent of urban population (810 lakhs in 2004-05) still subsists on incomes that
are below the poverty line. Eighty percent of their meager earnings go towards food and energy,
leaving very little for meeting the costs of living in an increasingly monetized society. The majority of
them live in slums and squatter settlements, in inhuman conditions that deny them dignity, shelter,
security, and the right to basic civic amenities or social services, in an environment in which crime,
ill-health and disease frequently raise demands that draw them deeper into vulnerability and poverty.
The statistics already reveal that about a quarter of the country‟s urban population lives in notified and
non-notified slums , specifically higher in metro cities, is an indication of iniquitous and exclusionary
urban planning system, urban land management practices and land legislation that have not been able
to adapt themselves to the pace or profile of indigenous urban growth; or to create space within the
formal system of planned living and working spaces to accommodate the informal working classes.
As urbanization grows, and the projected share of urban households rises in the next two decades
from the current 28% to 50% of the country‟s population, the slums are expected to grow, seriously
crippling the productive capacities of a growing number of people by the denial of basic services,
shelter and security, increasing inequity and retarding the productive potential of urban areas.
(ii) Thus, both for considerations of social and economic growth - and the Constitutional mandate - it
is necessary to break away from past trends and practices and to take decisive action for inclusive
urban development that acknowledges the presence of the poor in cities, recognizes their contribution
as essential to the city‟s functioning, and redresses the fundamental reasons for inequity that ties them
down to poverty.
(iii)The Jawaharlal Nehru National Urban Renewal Mission (JnNURM) with its separate sub-mission
on the urban poor comprising of the Basic Services for Urban Poor (BSUP) and the Integrated
Housing and Slum Development Programme (IHSDP) has been successful in achieving the
overarching aim of focusing State attention on the problems of inequity in urban areas, and drawing
budgetary resources to the welfare of the urban poor. There is an increasing assumption of
responsibility towards the slum dwellers, and their entitlement to conditions conducive to a dignified
quality of life. Simultaneously, there is an acceptance at policy level, both in the State and the
municipality, that the emergence of new slums can be prevented only by increasing the availability of
affordable housing, which in turn requires that the market distorting shortages of land and housing be
corrected.
(iv)The foundation laid by the above initiatives now needs to be built upon, by unlocking the potential
of the most important asset in the context of slums in cities i.e. land, through assigning legal property
rights to the urban poor. It is in this regard that the scheme introduces a bold new vision and a new
direction to policy, viz., a Slum free India, in which those who live in slums are enabled to aspire for
formal acceptance in urban areas by the assignment of property rights to them over their dwelling
space. As demonstrated in many countries across the globe moving the urban poor from the informal
to the formal economy is also an investment in deepening democracy and strengthening the legal
order; thereby widening society„s interest in peace and stability.

RAY: SLUM FREE CITY PLANNING BELLARY
1
Regional Centre for Urban and Environmental studies
CCHHAAPPTTEERR 11 -- OOVVEERRVVIIEEWW
1.1. Introduction of the city
The state of Karnataka is one of the prominent states in the Southern region of India with
Bengaluru as its capital, falling under „A‟ category1 and Bellary classified as „C-Class‟ city for HRA
category. Being the district head quarters, Bellary City Municpal Council came into existence in the
year 1867 later it is upgraded as Bellary City Corporation on 28th September 2004,with a total of 35
wards. Smt. S.Parvathi Indushekhar is the present Mayor, leading a band of 34 councillors . The
city administration is headed by D.L.Narayana (KAS officer) as the Commissioner of Municipal
administration.
The present report is the tentative Plan of Action for Slum Free City under the scheme of
Rajiv Awaz Yozana (RAY) sponsored by the Ministry of Housing and Urban Poverty Alleviation
(MoHUPA), Govt. of India. The city of Bellary is selected as one of the Pilot Cities for the
development of both notified (56) and non-notified slums (11) as part of inclusive growth. The report
is structured with prime objective of addressing the existing slums as curative step and also to ensure
slum free Bellary as a preventive measure. The report contains 4 sections namely, Preamble and
Overview, Slum Rehabilitation Strategy, Slum Prevention Strategy and Road Map respectively.
This report is accompanied by annexure I & II where the first and second contains the data tables and
analysis of each slum profile comprising of socio economic, household and livelihood information,
gap assessment and proposed line estimates. The present report therefore needs to be referred with
annexure I & II.
a. Bellary City Profile
Bellary city is situated in the Karnataka State border adjoining Andhra Pradesh. The state capital
Bengaluru is 305 Km away from bellary. The city has a jurisdiction over an area of 81.95 Sq.Kms
with a population of about 3.17 Lakhs as per 2001 census and 4.09 Lakhs as per 2011 census.
Bellary takes its name from the word Balari which refers to goddess Durugamma as this goddess
had manifested herself in the town. With the commencement of construction of several steel plants in
the district, the city promises to be "The Jamshedpur of Karnataka" in the 21st Century. The city was
ruled by dynasties such as the Sathavahanas, Kadamabas, Chalukyas, Rashtrakutas, Gangas,
Chalukyas of Kalyana, KalaChuryas & Hoysalas and
thereafter it became the territory of Vijaynagar rulers. The
city also has significant small-scale industrial activity and is
one of the major centres of Jeans manufacturing in the
country, and it is the second largest city in Asia in
manufacturing ready-made garments.
1 According to India report 2008, Indian cities are classified into A (A1,A2,..), B and C based on grant for HRA and CCA on the recommendations of 5th Pay Commission , which essentially classifies these cities based on cost of living and Census 2001.
Picture 1- 1: Bellary City Fort

RAY: SLUM FREE CITY PLANNING BELLARY
2
Regional Centre for Urban and Environmental studies
Location
Picture 1- 2: Bellary location map
Road
Bellary is well connected by road to different parts of Karnataka, Andhra Pradesh, Maharashtra
and Goa. The following are the major highways passing through the city:
National Highway 63
State Highway 19
State Highway 132
The city is served by the North East Karnataka Road Transport Corporation (NEKRTC), offering
travel services to almost all parts of Karnataka, many parts of Andhra Pradesh, Chennai, Pune and
many parts of Maharashtra.
Railway
[Currently, two railway stations are serving the city, one is the city station (Bellary Junction) and other
is the Cantonment station (Cantonment). Bellary is well connected by Rail to Bangalore, Raichur,
Anantapur, Hindupur, Tirupati, Hubli, Guntakal, Adoni, Guntur, Vijayawada, Howrah, Pune, etc.
Guntakal is an important junction near Bellary from where trains to Delhi, Chennai, and Mumbai and
to most of the places in India are available.
Air
Bellary Airport: The civilian Bellary Airport, located at the far end of the Cantonment area,
linking Bellary with Bangalore, Goa and other nearby destinations.
Vidyanagar Airport: Bellary is currently served by Vidyanagar Airport, located at 40
kilometres from Bellary. Bangalore based Charter airline, Taneja Aerospace and Aviation Ltd
(TAAL), operate sightseeing charter flights to Hampi and Mysore since October 2002.
International Airport: A new international airport is being planned by the Infrastructure
Development Corporation of Karnataka (IDECK) Nodal agency has identified 1,000 acres
(4.0 km2) for the airport.

RAY: SLUM FREE CITY PLANNING BELLARY
3
Regional Centre for Urban and Environmental studies
History
Bellary, headquarters city of Bellary district is a seat of
the district administration. In one of the lithic inscriptions dating
back to 1131 A.D found at byloor, the name “Ballare” is found.
In several later inscriptions also, found at Sindigeri, Kolur,
Kurugodu, etc., the world “Ballare” has been used. In 3-Hoysala
inscriptures “Ballare” is mentioned as one of the places captured
by the Hoysala King Vishnuvardharna.
The place referred to therein as Ballare is “Bellary” of the present
day. Referring to traditional account according to which the
origin of the name is connected with the defeat and death of Bala,
a demon king, who was harasing Devekanyas in the hands of
indra The place where he was slain came to be known as “Bala-
hari” meaning „The Defeat of Bala‟.
It could be also Bala+Ari (means enemy of Bala). Even today the name is written and
pronounced in Kannada as “Ballari”. In 1808 AD, the ceded districts were split into Bellary and
Kadapa districts, and in 1867 AD, the Bellary Municipal Council was created. Further in 1882 AD,
Anantapuram district was carved out of the Bellary District. The Maratha princely state of Sandur
was surrounded by Bellary district. In 1901 AD, Bellary was the seventh largest town in Madras
Presidency, and was one of the chief military stations in Southern India, garrisioned by British and
native Indian troops under the British Indian Government. The town included a civil railway station to
the east of the Bellary Fort, the cantonment and its railway station on the west, the Cowl Bazar and
the suburbs of 'Bruce-pettah' (currently spelt Brucepet) and 'Mellor-pettah', named after two British
officers once stationed in the town.
Bellary Fort is built on top of Ballari Gudda or the Fort Hill. The
Fort was built round the hill during Vijayanagara times by Hande
Hanumappa Nayaka. Hyder Ali, who took possession of the Fort
from the Hande Nayaka family in 1769, got the fort renovated and
modified with the help of a French engineer. The lower fort was
added by Hyder Ali around the eastern half of the hill. The fort
was classified as 1st class by the British Administration. This fort
gave Bellary its ancient importance, and led to its selection by the
British rulers as the site of a cantonment.
Geography
Bellary is situated on the eastern side of Karnataka State lies in between the meridians of 140 13‟ and
150 50‟ North Latitude and 75
0 40‟ and 77
0 11‟ East Longitude. The Altitude of the place is 449.0
meters above the MSL (mean sea level).
Picture 1- 3: Bellary in the past
Picture 1- 4: A mining site in Bellary
Picture 1- 5: Bellary fort

RAY: SLUM FREE CITY PLANNING BELLARY
4
Regional Centre for Urban and Environmental studies
Bellary surrounded by Raichur on the North, Haveri on the west, Chitradurga and Davanagere
districts on the South and Ananthpur and Kurnool districts of Andhra Pradesh on the East.The
Important rivers of the district are Thungabudra and its tributaries, the Hagari and Chikka hagari.
The most prevalent soil of the area as well in the region is black cotton soil which is the result of
disintegration of Horne-blend schist which are the derivations of old volcanic flows of metamorphic
lava. However, sandy, light grey, reddish & brown soil also occurs in the area. Major portion of the
area is with black & red soil. The soil is rich in calcium & poor in Nitrogen phosphate & potash. The
excessive salt content in the soil has led the area into poor yield & not suitable for good irrigation.
Climate and Rainfall
Bellary has a semi arid climate. As the city lies in the rain shadow region of the Western Ghats, it
receives little rain from the southwest monsoon. Temperatures remain high throughout the year, but
the months from March to June are especially hot, with high temperatures reaching 45 °C (110 °F)
frequently. The months from November to February are relatively mild, with average temperatures of
around 22 °C (71 °F). The city receives about 24 inches (610 mm) of rain every year mainly in the
months from August to October.
Overview of the Urban Local Body (ULB)
Bellary is governed by a number of local bodies, the prime being Bellary City Corporation
and Bellary Urban Development Authority, where the former is responsible for civic administration
and the latter for master planning of the city. Currently the total area under Municipal Corporation of
Bellary jurisdiction is 81.95 sq km. Water supply and sewage system is maintained by city
Corporation. Likewise power supply is provided by Karnataka Power Corporation and other
infrastructure under Karnataka Public Works Department.
Bellary City had a population 3, 17,500 in 2001 and is the 8th largest city in Karnataka State.
It is functioning as one of the District Head Quarters in the State for Civil administration .It is one of
the educational centers, as well as an important Trading and Industrial centre. As the result of all
these facilities and services, Bellary is showing signs of accelerated developments, there by
intensifying the need for properly controlled urban development. Bellary city alone accounts for 16
% of the urban population of the District as per 2001 census and holds a unique position in view of its
historical importance, as an Industrial base.
Presented below is a table 1-1, which shows an overview of Bellary demographic facts:
Table 1- 1: Existing Scenario of the ULB at a Glance
S.No Indicator Details
1. Location (Longitude and Latitude) 14
0 13‟ and 15
0 50‟ &
750 40‟ and 77
0 11‟ E
2. Area (in Sq. Km) 81.95
3. Demography – Population
2001 Population 3,17,500
2011 Population 4,09,644
2021 Population (Projected) 5,00,500
2031 Population (projected) 5,92,000

RAY: SLUM FREE CITY PLANNING BELLARY
5
Regional Centre for Urban and Environmental studies
4. Average household 2001 5
5. No. of Municipal Wards 35
6. No. of Slums 67
Notified 56
Non-notified 11
7. Slum population 81,635
8. No of households in slums 16408
9. Percentage of Slum population covered in ULB 20%
Source: Census 2011, Annexure - I – AKM data
The total population of Bellary city for the year 2001 was 3.17 Lakhs where it has shown a
constant increase in the population with varying rate of growth from decade to decade. Bellary
accounts for 20% of the urban population of the district as per 2001 census and holds a unique
position in view of its historical importance as an administrative & business centre. Having crossed
the three lakh population Bellary local body acquired the status of Maha Nagara Palike. The city of
Bellary has a uniquely different growth character, complemented by floating population from
surrounding areas for occupational reasons, tourist traffic as a result of its heritage value, and special
events.
As seen in table 1-1, of 4.09 lakhs people in Bellary, 20% of the population currently lives in
67 slums, covering an area of 1.93 Sq. Km spread over ULB, State government, Central government
and private lands. Location wise, around 44 slums are located in the core area are characterized by
closely knit clusters while in fringe areas, the settlements are found scattered all over the city.
Land use
The salient characteristics of land use for Bellary in 2006 and projected land use for 2021 are
presented in table 1-2:
Table 1- 2: Land use Details (2006 and 2021)
Category Area in Ha.
( 2006)
% Development
Area( 2006)
Area in
Ha.(2021)
% Developed
Area(2021)
Residential 1443.21 41.40 5310.71 44.36
Commercial 186.25 5.34 722.56 6.04
Industrial 279.24 8.01 1682.76 14.06
Park, open spaces & Burial ground 329.18 9.44 1563.73 13.06
Public and Semi-Public 347.94 9.98 746.63 6.23
Transportation & Communication 661.38 18.98 1689.34 14.11
Public utilities 163.40 4.69 181.06 1.51
Monument 75.20 2.16 75.33 0.63
Total 3485.80 11972.12
Source: Bellary Master plan 2021

RAY: SLUM FREE CITY PLANNING BELLARY
6
Regional Centre for Urban and Environmental studies
The area under commercial use is 186.25 hectares which is 5.34% of the total developed area.
The city is an important commercial centre in the state, but there is no organized central business area.
The business activity is observed mainly around bus stand, along Bangalore Road, Brahmin Street and
Kalamma Street. There is a regulated market with godown facility located in the outskirts along the
Bangalore Road. Retail commercial activities are concentrated in the Brucepet area. The whole sale
activity is predominant along south of Bangalore road, Car street etc.
The total area under Industrial use is 279.24 hectare i.e., 8.01% of the total development in industrial
activity, the Bellary spinning and Weaving mills, BSAL factory & industries on Anantapur road,
KIADB Industrial estate at Mundargi village limits on Bangalore road are the predominant industrial
area in the city. There are few oil and Cotton Ginning and Pressing Mills of medium size located in
the city. Few agricultural based industries are also located along Siruguppa road.
The total area under Public and Semi - Public use is 347.94 hectares which is 9.98% of the total built
up area. It includes Religious buildings, Government and Semi-Government Offices. Most of the
Government offices are inside fort, while the most of the educational institutions are located in the
Cantonment and Fort Area. Due to increase in the activities of mining, Commerce and other
developments several new office establishments both in Public and Private Sector are established and
they are scattered located in the city, as such causing inconvenience to the public.
The area covered under Parks, Open space & Burial ground is 329.18 hectares, which is 9.44% of the
total built up area. It highlights that the area under this use is meager compared to the total area of the
city. Most of the area is occupied by hillocks, water sheet and burial grounds. Due to scanty rainfall
most of the areas which could be developed as parks have a deserted look.
The area covered for Traffic &Transportation is 661.38 hectares, which is 18.98% of the total
developed area. The area under this use is the areas covered by Roads, streets, bus stand, Railway
tracks and Railway stations, AIR, Telephone exchange, Aerodrome etc.
Municipal finance
Resource mobilization and financial stability is of paramount importance for any city‟s
health and plays a vital role in the development. The source of revenue for BMC is primarily
categorized into tax and non tax based. The tax based revenues mainly includes revenues collected
from property tax, advertisement, professional and terminal taxes. While the non tax based revenue
comprises of rentals from municipal properties, service user charges, and penalties. The following
table 1-3 presents a comparison of the receipts and expenditure of Bellary for the years 2010-2011.

RAY: SLUM FREE CITY PLANNING BELLARY
7
Regional Centre for Urban and Environmental studies
Table 1- 3: Receipts and Expenditure for the Year 2010-11
Particulars 2010-11 Rs. Lakh
INCOME
1. Tax Income 791.15
(% of Own revenues) 44.50
2. Non-Tax Income 986.60
(% of Own revenues) 55.50
3. Own Source Income (1+2) 1777.76
(% of Total Income) 45.45
4. Assigned Revenues from the State 10.11
5. State Transfers / Grants 2123.38
6. Total Income (3+4+5) 3911.25
EXPENDITURE
7. Salaries & Establishment 746.24
8. Operations & Maintenance 2115.17
9. Depreciation
10. Depreciation 1745.48
11. Others 519.54
12. Total Revenue Expenditure (7+8+9+10) 5126.43
Revenue Surplus / (Deficit) (6-11) -1215.18
Source: Bellary City Municipal Corporation
As per Bellary City Municipal Corporation report, it was given that there has been no increase
in the revenue sources of BMC in terms of tax revenues and non-tax revenues. Out of total revenues
of BMC, grants from the government are 54. % and balance 46% is from tax and non-tax revenues.
As indicated above, the expenditure on human resources constitute nearly 22% of total expenditure of
the corporation.
b. Housing Scenario
During 1981 there were only 15 Number of slum in the city with the population of 10,635 persons
living in those slums. But there are 59 slums in the city during 2006 which is indicator of demand for
housing for EWS. Analysis also clearly indicates almost 86.12% of the slum area is on Govt. &
Municipal owned lands which are more vulnerable for such unplanned development. Necessary action
need to be taken by the respective agencies to stop development of slum areas there by creating
hygiene living standards in the city.
RAY: SLUM FREE CITY PLANNING BELLARY
8
Regional Centre for Urban and Environmental studies
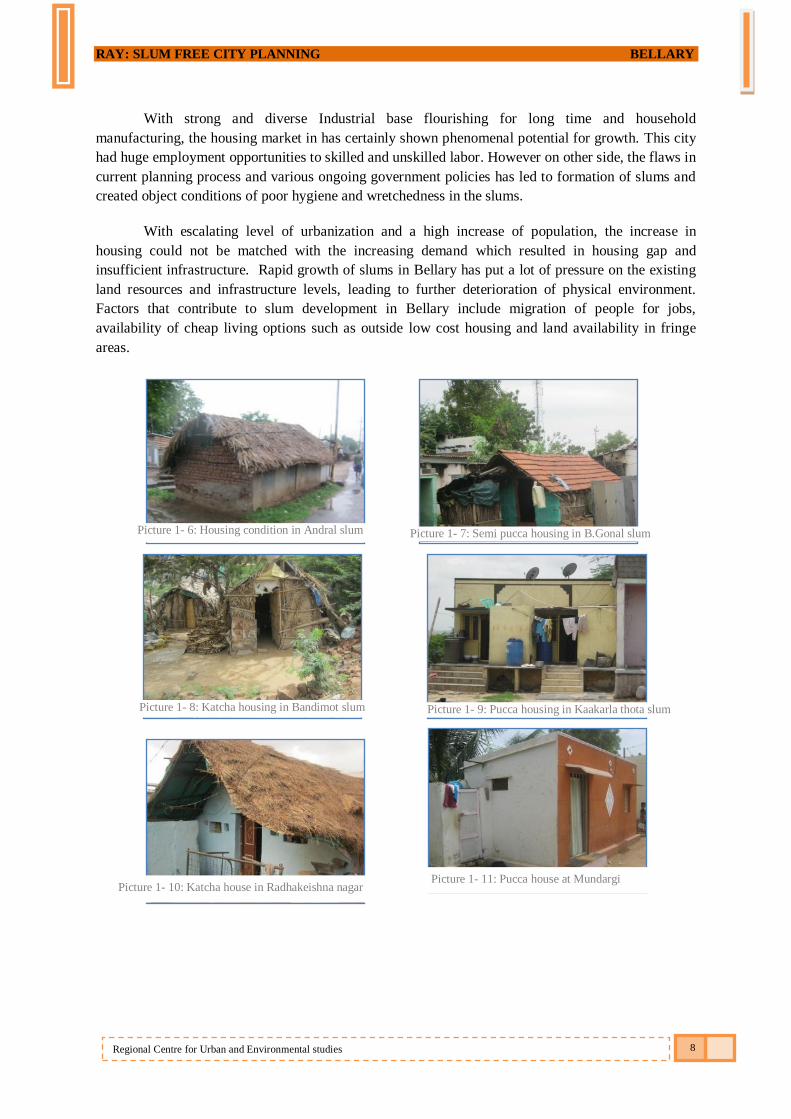
With strong and diverse Industrial base flourishing for long time and household
manufacturing, the housing market in has certainly shown phenomenal potential for growth. This city
had huge employment opportunities to skilled and unskilled labor. However on other side, the flaws in
current planning process and various ongoing government policies has led to formation of slums and
created object conditions of poor hygiene and wretchedness in the slums.
With escalating level of urbanization and a high increase of population, the increase in
housing could not be matched with the increasing demand which resulted in housing gap and
insufficient infrastructure. Rapid growth of slums in Bellary has put a lot of pressure on the existing
land resources and infrastructure levels, leading to further deterioration of physical environment.
Factors that contribute to slum development in Bellary include migration of people for jobs,
availability of cheap living options such as outside low cost housing and land availability in fringe
areas.
Picture 1- 7: Semi pucca housing in B.Gonal slum Picture 1- 6: Housing condition in Andral slum
Picture 1- 8: Katcha housing in Bandimot slum
Picture 1- 10: Katcha house in Radhakeishna nagar
Picture 1- 9: Pucca housing in Kaakarla thota slum
Picture 1- 11: Pucca house at Mundargi

RAY: SLUM FREE CITY PLANNING BELLARY
9
Regional Centre for Urban and Environmental studies
1.2 Diagnostic Assessment of slums
The living conditions in slums represent the pathetic conditions of urban poor. Individuals
and communities living in slums face serious challenges in their efforts to survive. Severe
inadequacies in access to water, sanitation, shelter, health and education has deprived slum dwellers
of some of the most basic amenities. For assessing the current situation of slums, appropriate
indicators are required to understand the depth of problems. These indicators are derived from RAY
guidelines wherein a detailed household/livelihood survey was conducted to identify slums which are
characterized by poor quality of housing and poor infrastructure. The following sections provide
insights into the real picture of slums.
With increase in population of the city, housing needs grew, which could not be met by
formal housing market. Migrant population, which could not avail the facilities of formal housing
market, satisfied their needs by occupying vacant lands and resulted in formation of slums and more
number of squatter settlements. Slum locations are spread all over the city but major concentrations
can be found in the old city area, near large scale industries especially mining. The main factor
attributing to this concentration is proximity to work place, and religious centre. The existing base of
the city creates opportunities for employment generation, especially for unskilled labor. With the
overcrowding of slums, there is a general deterioration of the living environment and tremendous
pressure on the city infrastructure and resources.
The existing scenario in Bellary has got two distinct dimensions- housing and infrastructure.
Such a high residential density coupled with acute shortage and dilapidation of housing stock marred
with extremely poor infrastructural conditions necessitates redevelopment and renewal works so as to
improve the habitability of these areas for the urban poor.
Bellary City has a total of 67 slums, where most of these are built on lands under Urban
Local body ownership. Over 40% of slums have existed more than 30 years in the city due to the fact
that Bellary has been one of the continuously inhabited cities in India. The total slum population is
81,875 which are about 19.09% of the total city population. 94% of slums are found to be located
along nallahs, 3% are located along major drains and 1% along eater bodies thereby vulnerable to
natural disasters. Likewise, 2% of slums are located along the major transport alignment (as seen in
map1-1).
Picture 1- 14: Along the HT
lines, B Gonal slum
Picture 1- 12: Along the railway
line, Guggarahatti honnali road Picture 1- 13: Water logging,
Nagulacheruvu

RAY: SLUM FREE CITY PLANNING BELLARY
10
Regional Centre for Urban and Environmental studies
Map 1- 1: Location of slums in Bellary city
RAY: SLUM FREE CITY PLANNING BELLARY
11
Regional Centre for Urban and Environmental studies
As evident in Map1-1, 66% of the slums are located in the core area of the city while
remaining 34% in fringe area. The abutting land use surrounding slums is predominantly residential in
nature, followed by commercial use.
The City wise, ward wise and slum wise descriptive details are provided in Annexure-IA.
a. Listing of slums – number, status, tenability, and tenure status
For the purpose of analyzing existing situation, the following variables mentioned in RAY
guidelines were studied in report:
Land tenability
Land tenure status
Ownership of the land
Age of slums
Using the above variables, the settlements in each slum that are characterized by poor
physical and socio-economic conditions, irrespective of land tenure status and ownership have been
identified through primary surveys. The following table 1-4 summarizes the aspects crucial for
determining the current status of Bellary slums.
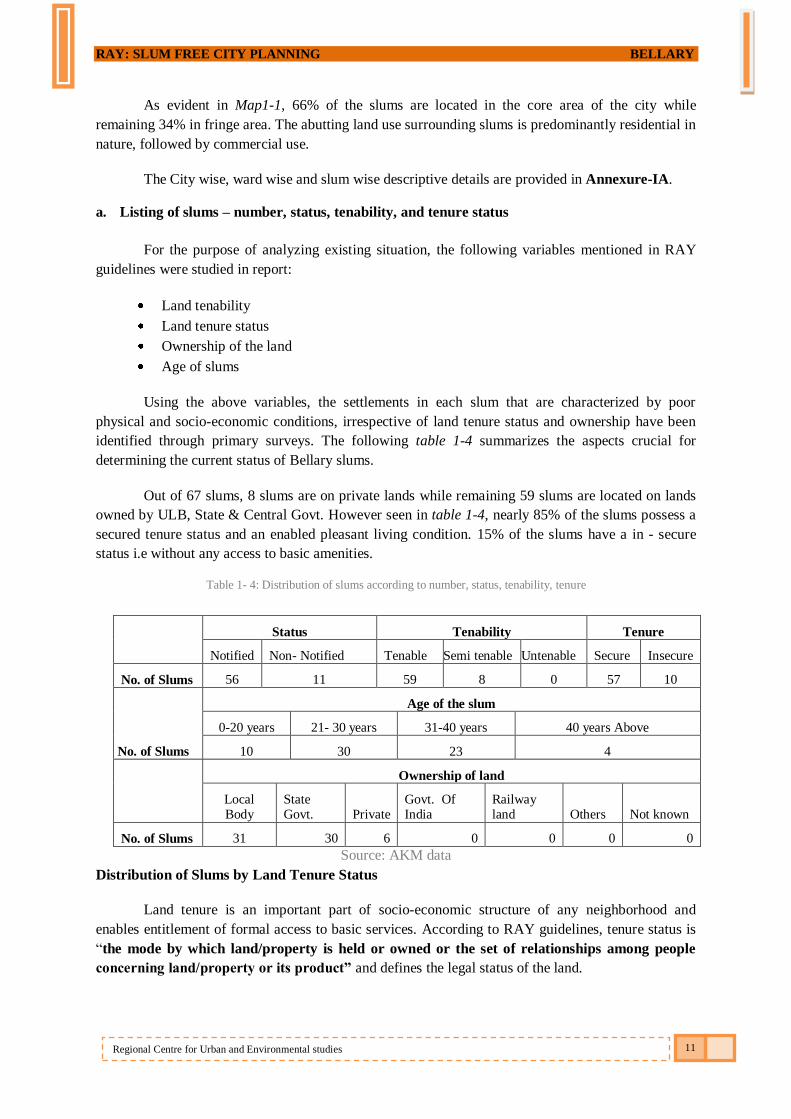
Out of 67 slums, 8 slums are on private lands while remaining 59 slums are located on lands
owned by ULB, State & Central Govt. However seen in table 1-4, nearly 85% of the slums possess a
secured tenure status and an enabled pleasant living condition. 15% of the slums have a in - secure
status i.e without any access to basic amenities.
Table 1- 4: Distribution of slums according to number, status, tenability, tenure
Status Tenability Tenure
Notified Non- Notified Tenable Semi tenable Untenable Secure Insecure
No. of Slums 56 11 59 8 0 57 10
No. of Slums
Age of the slum
0-20 years 21- 30 years 31-40 years 40 years Above
10 30 23 4
Ownership of land
Local Body
State Govt. Private
Govt. Of India
Railway land Others Not known
No. of Slums 31 30 6 0 0 0 0
Source: AKM data
Distribution of Slums by Land Tenure Status
Land tenure is an important part of socio-economic structure of any neighborhood and
enables entitlement of formal access to basic services. According to RAY guidelines, tenure status is
“the mode by which land/property is held or owned or the set of relationships among people
concerning land/property or its product” and defines the legal status of the land.

RAY: SLUM FREE CITY PLANNING BELLARY
12
Regional Centre for Urban and Environmental studies
As seen in the table 1-4, 85% of the slums are secured and have access to basic amenities and
in possession of certificates while 15% of slums are unsecured, which needs regularization. While
identified slums have some security of tenure and fall under the purview of municipal service
provision, the unidentified slums fall outside the net of formal service provision.
Distribution of Slums by Tenability Status
The land status of all listed slums/informal settlements
are classified by the ULB as either Tenable2 , Semi tenable
3 or
Untenable in order to determine whether the land is fit for
human habitation and void of health hazards (RAY Guidelines).
Chart-1-1 indicates that the current tenability status for
67 slums as identified has been presented where 88% of the
slums are found to be tenable. While the remaining 12% slums
are semi tenable, thus proving to be unsafe due to the reason that
the slum lands are either earmarked for any major public
facilities. This is very small in number; hence viable solution can
be arrived in consultation with ULB
Distribution of slums by Land Ownership
As seen in Chart 1-2, it is observed that over 46% of the slum lands belong to ULB and 45%
under State Govt. The remaining 9% of the slums is built on the lands that fit in the ownership of
Private.
Mentioned earlier, 9% of the slums are on private
lands do hold possession certificates and are still
eligible for slum redevelopment programmes
considering the varying economic status of those
dwellers.
2 According to RAY, Tenable slums means all slums which are not located on hazardous locations suitable for human habitation and the land not earmarked for any major public facilities and therefore it can be regularized in the same location. 3 Semi tenable slums as per planning guideline are those slums which are located on land zoned for non-residential uses, as
prescribed by the Master Plan.
Chart 1- 2: Ownership of land
Chart 1- 1: Tenability of Slums

RAY: SLUM FREE CITY PLANNING BELLARY
13
Regional Centre for Urban and Environmental studies
Map 1- 2: Land Ownership in slums

RAY: SLUM FREE CITY PLANNING BELLARY
14
Regional Centre for Urban and Environmental studies
Distribution of slums by Age of the Slums
Age of the slum is one of the important
information to assess the condition of a slum in
any city. Considering the fact that Bellary
being one of the oldest mining area for
availibility of mineral respouces, has 40% of
slums into existence over 30 years while
remaning 60% of slums less than the 30 years
(seen in chart 1-3).
Notification of the slums
According to National Sample Survey Organization, areas notified as slums by the respective
municipalities, corporations, local bodies or development authorities were treated as “notified slums”,
tends to receive higher level of services and those unrecognized by the local bodies were considered
as “non-notified slums”. As per AKM, currently 56 slums are notified by ULB to avail higher level of
basic services and eligible any other redevelopment programs.
As seen in Map 1-3, 11 slums marked in red color indicates that these are not yet notified, which
requires ULB to ascertain that these slums are to be provided with amenities.
Picture 1- 15: Along the Major Transport alignment, Bandimot area
Picture 1- 16: Along the major Nallah
Picture 1- 17: Beside of Agriculture lands, Mundargi
Chart 1- 3: Age of the Slums

RAY: SLUM FREE CITY PLANNING BELLARY
15
Regional Centre for Urban and Environmental studies
Map 1- 3: Notified and Non – Notified slums in Bellary City
Please refer Annexure-1A, for a detailed slum wise description of each indicator in table 1-4.

RAY: SLUM FREE CITY PLANNING BELLARY
16
Regional Centre for Urban and Environmental studies
b. Physical profile
Slums and squatter settlements in Bellary are found all over the city however established
mostly near places of employment. The general composition of majority of slums comprises of
scheduled caste, and other backward classes, thus forming the weaker section of the society. From
habitation point of view, slums located in the low lying areas, along open drains/nallah, tank beds and
hazardous/toxic sites are susceptible to inundation, and other forms of disasters.
The slum concentration in these areas has not only led to poor living conditions for the slum
dwellers but also responsible for the general deterioration of the living environment in the city. This is
primarily due to lack of proper infrastructure services in these areas and considering the fact that most
of these slums are overcrowded, there is always constant pressure on the city infrastructure and
resources. In this section, the following set of variables were measured to assess the existing housing
scenario in terms of the structures, its type, access to electricity and other related issues so as to bring
out the deficiencies:
Location of slums and its areas
Flood prone slums
Abutting land use
Housing type
Table 1- 5: Summary of slums – Area, Location, Abutting land use & Flood vulnerability
Area
Below 10,000 Sq.mt 10,000 to
20,000 Sq.mt 20,000 to
40,000 Sq.mt 40,000 to 60,000
Sq.mt 60,000 to
80,000 Sq.mt 80,000 Above Sq.mt
No. of
Slums 12 19 19 10 5 2
Slums Located in
Core Fringe
No. of
Slums 44 23
Physical location of slum
Along Nallah
(Major Storm
water Drain)
Along
Other
Drains
Along Major
Transport
Alignment
Along River /
Water Body
Bank
Others
(Hazardous or
Objectionable)
Others (Non -
Hazardous / Non-
objectionable)
No. of
Slums 63 2 1 1 0 0
Whether the Slum is prone to flooding due to rains?
Not prone Up to 15 days 15-30 Days More than a Month
No. of
Slums 67 0 0 0
Type of Area surrounding Slum
Residential Industrial Commercial Institutional Other
No. of
Slums 59 2 1 0 5
Source: AKM data

RAY: SLUM FREE CITY PLANNING BELLARY
17
Regional Centre for Urban and Environmental studies
Distribution of Slums by Physical Location
Out of 67 slums, 44 slums are found in the core area and remaining 23 in the urban fringe
areas near agricultural lands. With respect to the physical location of the slums, around 2% of slums
are located along the major transport alignment such as National Highways while 94% along the open
and storm water drains. On other side, 1% slums are found to be located along the river as well as on
the river beds. All slums are located on the sites of non hazardous / non objectionable areas yet the
slums located along drains may lead to vulnerability and cause for increase in diseases due to
contaminated water or over flowing of drains etc. These slums require special attention before
undertaking any development, the beneficiaries cooperating and their livelihoods are of paramount
importance.
Chart 1- 4: Physical location of slums
Picture 1- 18: Location of Bellary Slum along Industries

RAY: SLUM FREE CITY PLANNING BELLARY
18
Regional Centre for Urban and Environmental studies
Distribution by Slum Area
According to AKM, slum population constitutes
20% of the total City population while the total slum area
(1.93 Sq.Km) is about 2.3 % of the total city area (81.45
Sq.Km). Nearly 18% of slum areas are found to be less
than 0.01 Sq.Km and 82% of slums having areas greater
than 0.01 Sq.Km. The area of the slums under the
ownership of private agencies is 0.18 Sq.Km, and 1.7
Sq.km is under ownership of ULB & State Govt.
Flood Prone Slums
As indicated in table 1-5, though slums were located along the major nallahs or drains, they
are not vulnerable to floods. Yet few households were being affected due to the overflowing of drains
in rainy season (As seen pictures below).
Picture 1- 19: Storm water drain at Anjanappa nagar slum Picture 1- 20: Water body in Basavanakunta slum
Picture 1- 21: Canal at Shanthi nagar slum
Picture 1- 22: Water logging at Andral
Chart 1- 5: Area of slums

RAY: SLUM FREE CITY PLANNING BELLARY
19
Regional Centre for Urban and Environmental studies
Distribution of slums by abutting land use
Looking into the abutting land use, the table 1-5 reveals that 88% of the slums are surrounded
by residential land use, followed by industrial uses (3%) such as small scale industrial units
(Radhakrishna nagar slum) and handloom units in the city. In addition 1 slum is around commercial
use like wholesale businesses. Of the 23 slums located in the fringe areas, 74% of the slums are
bounded by residential and remaining 26% surrounded by others (industrial and commercial) land use
respectively.
Distribution of slums by housing structure
One of the prime indicators to assess the existing condition of a slum is housing. In order to
understand the degree of living conditions, data on the kind of houses that the slum households live is
collected to examine the housing scenario. For analysis purpose, the dwelling units were classified
into pucca, semi-pucca and katcha, based on the kind of roofing and wall materials used.
Chart 1- 6: Existing housing condition
It is evident in chart 1-6, 34% of the dwelling units built is semi pucca and 22% units are
katcha in nature with remaining 44% to be pucca houses. With respect to electricity connection,
nearly 89% of dwelling units have access to electricity where 91% of pucca houses; 89% of semi
pucca and 86% of katcha houses have access to the same connection. Yet there is a shortfall of 11%
of the total houses that needs to be connected to electricity, indicating the pathetic status of the slum
dwellers.
Picture 1- 23: Existing housing condition in the slums
The following map shows housing type:

RAY: SLUM FREE CITY PLANNING BELLARY
20
Regional Centre for Urban and Environmental studies
Map 1- 4: Housing situation of slums

RAY: SLUM FREE CITY PLANNING BELLARY
21
Regional Centre for Urban and Environmental studies
The above map depicts the current housing structure condition in the slums of Bellary. For
analytical purpose, semi pucca and katcha houses were considered exclusively to determine the
housing shortage and the need to implement suitable housing redevelopment programmes. If the semi
pucca + katcha houses were greater than 75% then it is considered poor housing in awful state which
needs to be addressed immediately or rebuilt. In the same way if the semi pucca + katcha houses were
less than 75% then it is assumed that housing condition not as good as pucca houses. As per the data
results, it was found that 20 slums have semi pucca + katcha houses more than 75% while 47 slums in
the latter category. Since Bellary is main center for industrial activities and greater influx of floating
population, there has been massive dependence on existing congested housing and infrastructure thus
leading to poorly maintained crammed houses and unhygienic conditions in the slums.
Based on the income levels and the affordability levels of the households, the kind of housing
is determined and varies accordingly. Similarly in Bellary , 45% of the pucca houses are built using
wall materials of burnt bricks, stones, cement concrete, timber, and roofing of reinforced brick
concrete and reinforced cement concrete, PCC flooring. While semi pucca houses have walls made
up of pucca material but roof is made up of the material other than those used for pucca house and
katcha houses are usually found to be built using make shift material like sandstone tiles, thatches,
loosely packed stones, and temporary tents.
Although most of the houses are pucca in nature, it is irony that these are in a dilapidated
condition and in need of up gradation. Due to lack of choice, and security, the dwellers are forced to
live and work in informal settlements and earn on a daily basis.
For slum wise details, please refer Annexure-1B on housing structure.
Picture 1- 24: Semi pucca house in Mundargi
Picture 1- 25:Semi pucca house in Millerpet no-I
Picture 1- 26: Pucca House Under Costruction, Kaakarlathota
Picture 1- 27: Pucca House at Cheluvadikeri Bandimot area

RAY: SLUM FREE CITY PLANNING BELLARY
22
Regional Centre for Urban and Environmental studies
c. Social Profile
According the “Asha Kirana Mahithi” 2011 data, the total population in 67 slums is 81635 with
total number of 16408 households, comprising 20 % of total city households. Of the total slum
population, 91% are below poverty line (BPL) with 14969 households.
Table 1- 6: Population & Health
Indicators SCs STs OBCs Others Total Minorities
Total slum population 23450 11721 28696 17768 81635 39109
Total Households 4568 2372 5805 3663 16408 7535
Total BPL population 21506 10946 26067 15931 74450 34578
Total BPL Households 4192 2209 5259 3269 14929 6815
No. of women headed households 935 475 902 605 2917 1290
No. of persons older than 65 years 78 30 83 38 229 113
No. of child labors 2804 1364 4344 2043 10555 5926
No. of physical handicapped persons 93 34 65 45 237 85
No. of mentally challenged persons 53 27 36 21 137 59
No. of persons with HIV - AIDs 66 47 212 102 427 234
No. of persons with tuberculosis 5 0 3 7 15 4
No. of Persons with Respiratory
Diseases including Asthma 10 3 13 10 36 14
No. of Persons with Other Chronic
Diseases 3 2 15 6 26 6
Source: AKM data
Total population
Seen in table 1-6, around 18% of the household population forms the women- headed
households with OBC caste women being in lead. Similarly 13% of the total population in the slums
belongs to Child laborers and 47% of the total population falls under minority category.
Picture 1- 28: Bisalahalli (Harijanakere)
Picture 1- 29: Vinayaka nagar 2 nd phase
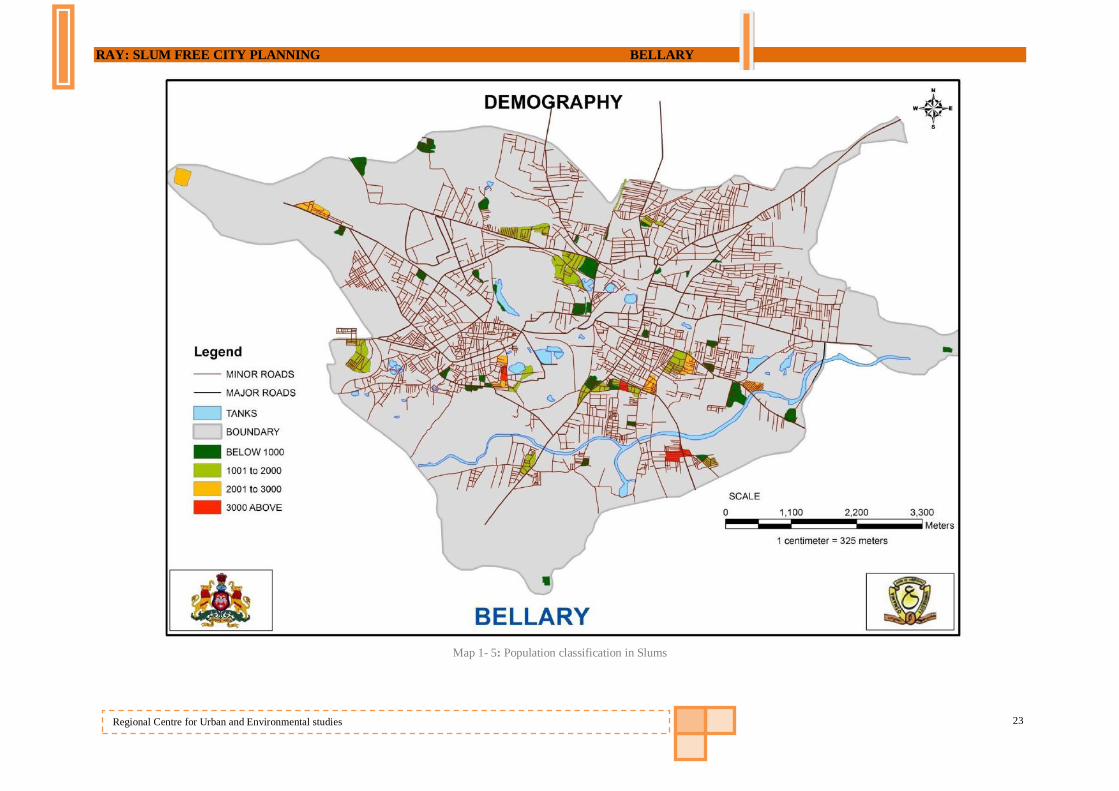
RAY: SLUM FREE CITY PLANNING BELLARY
23
Regional Centre for Urban and Environmental studies
Map 1- 5: Population classification in Slums

RAY: SLUM FREE CITY PLANNING BELLARY
24
Regional Centre for Urban and Environmental studies
2345021506
4568 4192
11721 10946
2372 2209
2869626067
5805 5259
1776815931
3663 3269
Total population BPL population Total HHs BPL HHs
Demographic profile
SC s STs OBCs Others
As seen in Map 1-5, the slums have been classified into 4 equal class intervals where it is
observed that the slums marked in red color have population more than 3000 persons and mostly
located along the Nallahs. The population distribution in the slums is found to be varying as low as
261 persons to a highest value of 3793 persons.
Seen in Annexure - 1C for year 2011 demographic details, Cheluvaadikere is having the
maximum slum population (3793) and BPL population (3422). Of the total 67 slums, 5 slums are
highly dense wherein the highest density is found in Cheluvaadikere. Comparing the density results, it
is observed that 40 slums have low density and 22 slums were moderately dense.
Distribution of slum households by Caste/Different social groups
Chart 1- 7: Population details based on different social categories
Seen in chart 1-6 for different social categories, SCs and OBCs are found to be in larger number
comprising of 64% of the total population and 64% under BPL when compared to other groups in the
67 slums respectively (seen in table 1-6). According to different social categories, it is observed that
12 % of SC population constitutes the Child Labor and 15% under OBCs. 29% of the BPL population
in slums is SCs & 35% comprises of OBCs and the remaining 36% belong to STs and others.
Distribution of slum households by Minority groups
Of the total slum households, 46% forms the minority group with a BPL population of 34578
persons. For women headed category, 18% of the households belong to the women headed
households while 15% of the minority population belongs to child laborers.
Literacy rate
Of the total slum population, 78% are literates and the
remaining 22% are illiterates in which 44% are male and 56%
are females. According to different social categories, SC
population has an illiteracy rate of 30%, followed by OBC
group with 33% of illiterate persons. Similarly, under BPL
category, the percent of illiterates is found to be 23% of the
total BPL population.
Chart 1- 8: Classification of illiterates

RAY: SLUM FREE CITY PLANNING BELLARY
25
Regional Centre for Urban and Environmental studies
School Dropouts
According to Planning Commission, though most States of India have done well in enrolling
more and more children in schools, their inability to retain them has been a problem. The dropout rate
was least for those belonging to the highest income group and maximum for those from the lowest
income group and EWS. Children from poorer sections of the society drop out in the early stages of
education due to the fact that either the children or their parents were not interested and nearly as
many were on account of economic considerations, compulsion to work for wages or looking after
younger siblings.
As per AKM, it is found that 0.16% (134 persons) of the slum population were school
dropouts with 52% of males and 48% females under it. As mentioned above, the 0.16% school
dropout belongs to the age groups of 6-14 years hence can be partly attributed as one of the reasons
for the 13% of child labor in the slums of Bellary city. It is also found that child labor is prevalent in
industry in the form of unskilled labor. Hence mitigation measures needs to be taken through
implementation of education policy programmes and provision of elementary education to the
deprived groups.
Table 1- 7: School dropouts
Source: AKM data
Number of Slums by Disability Status and senior citizens
As Per AKM, the physically challenged population comprises 0.3% of the total slum
population, with SC group forming the highest under social groups. Similarly the mentally challenged
persons constitute 0.002% of the total population in Bellary slums. Hence employment provisions
needs to be made for those physically challenged person who are skilled enough.
In Bellary Slums, it was found 0.3% of the total constitutes the senior citizens where in SC
group accounts for 34%. For the well being of these citizens, it is essential to make due concessions
and provision of adequate social facilities for the senior citizens in Bellary slums. In addition, eligible
aged persons and senior persons in BPL families that can hardly support the aged should be entitled to
National Old Aged Pension Scheme (NOAPS).
Number of households by Health Condition
Poor water and unsanitary conditions leads to adverse effects on health of households living
in the slums. Given the fact that Bellary is substantially known for its Mineral resources, it is quite
apparent that the slums have evolved around these industries or mining areas hence characterized by
poor/crammed housing conditions, lack of good sanitation and contaminated water supply. Due to
contamination of water and outlet of effluents into the river, thus the households are exposed to skin
irritation, respiratory problems and other diseases.
Indicated in table 1- 6, 0.5% of the slum population is found to be having HIV/AIDS while
0.02% of the population is suffering with Tuberculosis and 0.04% with respiratory problems.
For slum wise details, please refer Annexure-1C on social profile.
School Dropouts
Male (No.) Female (No.)
70 64

RAY: SLUM FREE CITY PLANNING BELLARY
26
Regional Centre for Urban and Environmental studies
d. Economic profile
The significant sectoral composition of economic base & structural changes take place within
different periods influencing the city growth which cannot be denied. Due to its advantageous
geographical location and availability of abundant mineral resources, Bellary has become the basis for
a strong economical growth. The core economic activities in Bellary had primarily been trade and
commerce, manufacturing of jeans, textiles & garments and others. The real estate prices have already
started to shoot as more and more industries are finding their way into this city.
Till 1994 handful of mining companies operated here including state owned NMDC. Later
Govt. issued mining licenses to many private operators. Mining Industry boomed with surge in Iron
Ore prices due to demand from emerging China. Despite the availability of minerals in large
quantities, it is considered to be an industrially backward district. There are 23 units of large and
medium scale industries in this district with an investment of Rs.447.76 crores employing around
9,222 persons. At present it occupies ninth place in the state. The district will therefore come under
heavy pressure on basic infrastructure such as power, communication, health, education and police
stations which again invite heavy investment to create the needed infrastructure. Urgent action is
needed to pool the resources under various sectors such as District Sector, State sector, Border Area
Development, HKDB etc., and prepare a perspective plan to the emerging challenges.
Overall employment and unemployment table is shown in Annexure -1D
Livelihood profile
Two types of labor exist in all economies: skilled and unskilled. Skilled labor is the portion
of workers in an economy that have specific, technical industry skills relating to business and the
extraction of minerals. Engineers, accountants and scientists are a few examples of skilled labor.
Unskilled labor is the cheaper and less technical portion of the workforce that makes up a large part of
an economy's labor market. This workforce plays the important part of performing daily production
tasks that do not require technical abilities.
As indicated in AKM, 22% of slum population is illiterate with lack of skill and professional
training, making it difficult for them to obtain skilled employment opportunities in Bellary, hence end
up doing low or moderately paid jobs on a daily basis.
The composition of work force conveys a picture of quality of life, associates with their social
and economic activities. With respect to slums, the development plan also documents that 90% of the
households are employed and remaining 10% as unemployed. The unemployment in slum dwellers
can be potentially mitigated by implementing schemes such as SJSRY, STEP UP and other livelihood
oriented training programmes initiated by Govt. of India.
Picture 1- 30: Self employment in
Bandimot area slum
Picture 1- 31: Animal husbendary in
Cheluvadhikeri bandimot area
Picture 1- 32: Skill employment in
Jagruthi nagar 2 nd phase

RAY: SLUM FREE CITY PLANNING BELLARY
27
Regional Centre for Urban and Environmental studies
Chart 1- 10: Monthly Income of Households
566 237 775 6102952
11268
Less than
Rs. 500
Rs. 500 to
Rs. 1000
Rs.1000
to Rs.
1500
Rs. 1500
to Rs.
2000
Rs. 2000
to Rs.
3000
More
than Rs.
3000
Monthly Income No. of
Households
Majority of the working population in the slums is engaged in large scale industries,
construction, wholesale business; home based small businesses, rickshaw pullers and Auto drivers. On
the other hand, women in the families are majorly involved in domestic help and cottage industries.
On the other hand, slums households located in urban fringe are involved as agricultural laborers due
to the presence of agricultural lands in close proximity.
Distribution of slums households by Occupation Status
As per AKM, it is inferred that 30% of households are
found to be working as casual laborers and 12% on regular
wage basis as they are unskilled. 16% are found to be working
on a monthly salary, indicating a secured position.
As per the recent AKM, 46% of the slum households
do not have opportunities towards sustainable occupation and
secure incomes. This situation of slum livelihoods need to be
taken into consideration in future development programmes as
there is a dire need for an enhanced productivity in the city.
Picture 1- 33: Shop in Bandimot area slum
Picture 1- 34: Bangles business Cheluvadhi keri Bandomot area
The above images shows work force category in Slums
Monthly Income by Households
The monthly income of 4 % households ranges between Rs.1500 to Rs.2000 and above
Rs.3000 is 69%. The percentage of households that earn less than Rs. 1500 is 9%, indicating that
30% households belong to casual labor.
Further, the livelihood pattern
has become indefinite and irregular for
the households, where only 69% of
them are earning more than Rs.3000/-
per month. In addition, it is also
observed that child labor number is
rapidly increasing where a need is felt
to curtail it.
Picture 1- 35: Small shop in Cheluvadhi keri slum
Chart 1- 9: Occupational status of slums

RAY: SLUM FREE CITY PLANNING BELLARY
28
Regional Centre for Urban and Environmental studies
There is urgency in creating economic assistance which can include training, job placements,
credit and technical support to small and marginal businesses, creating new society –owned
enterprises, providing micro-finance facilities and loans for housing and financial assistance such as
subsidies for building materials. There is ample scope for programmes like SJSRY projects to be
launched particularly STEP UP, UCDN, UWESP in most of the slums as part of livelihood promotion
and leads to enhanced productivity.
For slum wise details, please refer Annexure-1D on Economic profile.
e. Infrastructure
Sustainable growth of a city depends on its infrastructure facilities. Lack of infrastructure and
institutional mechanism can lead to collapse of urban system in a city. Access to basic services has
now become a criterion for identification of the poor areas in a city. The responsibility for urban
service provision in an equitable manner lies with the ULB, where an increasing gap in service levels
and the difficulties in providing the same are prevalent. Information on access to services in terms of
Physical Infrastructure of Bellary city has been collected and a brief analysis on the current status of
Water Supply, sewerage, Storm Water drainage and Solid Waste Management. The numbers indicated
in the table 1-8 to 1-16 are based on AKM data for 67 slums.
Water Supply
Water supply system to the city of Bellary was first implemented in the year 1924 from Hagari
River which is 14 Kms away from the city. Since then a few other schemes have also been
commissioned from time to time i.e., in the year 1964, Moka water supply scheme was commissioned
In the year 1992 an Augmentation of water supply scheme to Bellary city was commissioned to cater
the increasing water demand of the city. The present population of the city is about 3, 17,500 and
present normal water supply is 120 LPCD. After implementing the scheme per capita supply level
will be to 135 LPCD.
Table 1- 8: Current Water Supply Statistics
Source: AKM data
Connectivity to City Wide Water Supply System
Most of the slum households either have direct access to services or access them through
community or common facilities. Of the total slums, 93% of it is fully connected to the city wide water supply system; 6% is partially connected. The remaining 1% of slums is not having
connectivity to city water supply system.
The map1-6 shows the number of slums that are connected to city wide water supply system.
Connectivity to City-wide Water Supply System
No. of Slums Fully connected Partially connected Not connected
62 4 1
Source Individual
tap
Public
tap
Tube well/Bore
well/ Hand pump
Open
well
Tank/
Pond Water tanker Others
No. of
households 7475 7490 567 78 35 1 762
Existing
Situation
No. of individual taps No. of public taps No. of tube wells / bore wells/ hand
pumps
7623 608 93
Duration of water supply
Less than 1
hour daily 1-2 hrs daily
More
than 2 hrs daily Once a week Twice a week
Not
regular No supply
57 0 0 2 8 0 0

RAY: SLUM FREE CITY PLANNING BELLARY
29
Regional Centre for Urban and Environmental studies
Map 1- 6: Slums connected to city-wide water supply system

RAY: SLUM FREE CITY PLANNING BELLARY
30
Regional Centre for Urban and Environmental studies
Existing Sources of Drinking Water
Over 46 % of 7475 households have individual water supply connections where protected
drinking water is being supplied to 4684 households by Urban Local Body. Hence a significant 54 %
of the households do not have access to drinking water and dependent on public water taps, tube
wells, open wells, hand pump and water tanker. In a slum it is observed that on an average about 20
households are sharing one public tap.
Duration of Piped Water Supply
The duration of water supply usually is once in a day or once in couple of days where 85% of
the slums have access to piped water supply between 1 to 2 hours or more on a daily basis.
Approximately 10 slums (15%) do not have water supply connection on a regular or non regular basis,
thus there is a need felt to improve the services.
Despite the connectivity to city wide water supply system, the major problem is observed to
be is the poor quality of water. This is due to the discharge of waste from mining industry, and
garbage disposal near public utilities. Even after treatment, the quality of water is still found to be
poor; which needs to be addressed immediately.
Sanitation
Sanitation and sewerage systems are not only the basic necessities of life, but they are also
crucial for achieving the goal of “Health for All”. Increased sanitation coverage is directly linked to
improvement of health status. Lack of sanitation is a universal problem when it comes to Slums and is
markedly less than access to other basic services. While, it is worthwhile to note that the proportion of
people having access to sanitation in urban areas is considerably greater when compared to their rural
counterparts, however the problems are more exacerbated in slums.
KUWS & DB, Bellary has prepared a UGD scheme for the Bellary city And Government of
Karnataka has accorded approval vide G.O no - UDD/1/UDS/2000-01 Dated 18-04-2000 to the UGD
scheme phase -II. The cost of the project was 57.53 crores.
Urban sanitation is perceived as being important because of the health factor. In case of
slums, it is observed that sanitation facilities are worst and in pathetic condition. A comprehensive
view of the sanitary facilities as well as current sewerage system in the slums is shown in table 1-9:
Picture 1- 36: Hand pump in Miller pet - II slum
Picture 1- 37: Individual tap in Guggarahotti honnal road slum

RAY: SLUM FREE CITY PLANNING BELLARY
31
Regional Centre for Urban and Environmental studies
Table 1- 9: Current Sanitation Statistics
Storm water
Drainage
Underground Drainage/
Sewer Lines
Digester Not Connected to
Sewer or Digester
No. of HHs having access to
6707 6340 3345 8662
Connectivity to City-wide Storm-water Drainage System
No. of Slums Fully connected Partially connected Not connected
51 11 5
Connectivity to City-wide Sewerage System
No. of Slums Fully connected Partially connected Not connected
51 10 6
No. of
H.Hs
Latrine Facility used by the households
Public/Community Shared Latrine Own Latrine Open
defecation Septic tank/ flush
Service latrine
Pit Septic tank/ flush
Service latrine
Pit Septic tank/ flush
Service
latrine
Pit
5059 0 808 389 0 1457 5588 0 1305 1802
Source: AKM data
Connectivity to City wide Trunk Sewerage System
76% of the slums are fully connected to city wide sewerage system while 15% is partially
connected to the system. Even though 91% of the slums are connected to city wide sewerage system
yet 9% needs to be upgraded. The map1-7 presents the status of the slums that connected to city wide
sewerage system.
Connectivity to City wide Storm water drainage
Similarly 16% of the slums are partially connected to the storm water drainage, 76% is fully
linked to the system but 8% of the slums are not covered by the city wide system. Given the situation,
it is necessary to improve the system as well as provide newer connections before it infiltrates into the
environment. The map1-8 presents the status of the slums that connected to city wide sewerage
system.
Picture 1- 38: Storm water drain in Millerpet-I
Picture 1- 39: Storm water drain at Andral slum
Picture 1- 40: Sewer lines passing through centre of the road, Andral
Harizankeri

RAY: SLUM FREE CITY PLANNING BELLARY
32
Regional Centre for Urban and Environmental studies
Map 1- 7: Slums connected to city-wide sewerage system

RAY: SLUM FREE CITY PLANNING BELLARY
33
Regional Centre for Urban and Environmental studies
Map 1- 8: Slums connected to city-wide Storm water drainage system

RAY SLUM FREE CITY PLANNING BELLARY
34
Regional Centre for Urban and Environmental studies
5059
0
808
389
0
1457
5588
0
1305
1802
Septic tank/Flush
Service Latrine
Pit
Septic tank/ Flush
Service Latrine
Pit
Septic tank/ Flush
Service Latrine
Pit
Pu
bli
c/C
o
mm
un
ity
La
trin
e
Sh
ared
La
trin
e
Ow
n
La
trin
e
Op
en
Def
eca
tion
Sanitation Facility
Drainage and Sewerage facility
As per AKM, it was found that 41% of 6707 households have storm water drainage while
39% has underground sewer lines and 20% of the households are connected to digester. Even though
34% of the households in the slums have some form of drainage and sewerage facility, still 66% of
the households are not connected to a sewerage system. Due to absence of a system, the gray water
and waste water from houses are directly dumped into the open nallah or nearby open drains along
with solid waste, makes it overloaded and choked. Due to this discarding, water logging in the slums
areas is prevalent and in turn has direct consequences on the health of households (Seen in pictures 1-
26 & 1-27).
Picture 1- 41: Drainage situation in Budubudu keri
Bandimot area
Picture 1- 42: Drainage situation in Andral slum
Distribution of Households by use of different type of Toilet facilities
Chart 1- 11: Type of sanitation facility
In Bellary, there exist three different systems of sanitation covered in 67 slums namely,
Public, shared and own. Under each category, there are different toilet facilities in use such as pit,
septic tank/flush and service toilet system. In slums when there is inadequate toilet facilities, open
defecation has become prevalent and leading to unhygienic conditions. As evident in the above chart
1-11, overall 42% of the households use own latrins of which 34% of households use Septic tank , 8%
use pit system and 36% use public toilet system. About 11% of the households do not have any kind
of toilet facility and hence opt for open defecation on vacant lands , thus polluting surface water.

RAY SLUM FREE CITY PLANNING BELLARY
35
Regional Centre for Urban and Environmental studies
Picture 1- 43: Open defecation in B Gonal slum
Picture 1- 44: Community toilets in Budubudu keri (Bandimot area)
Even though 78% of the households have access to some form of toilet, it is believed the
exisitng toilet system is considered to be of primitive stage with no proper maintenance and lacks
general hygienic condition, further deteriorating the environment.
Solid waste management
Well functioning and safe solid waste management system in slum is vital so as to minimize the health hazards and environmental pollution caused by solid waste. In many areas, garbage
disposal services are jagged and sometimes not available. People are forced to live in such
environment and definitely a solution has to be put in place to efficiently, safely and properly dispose of their solid waste.
The table 1-10 gives an overall picture of the current situation of solid waste management.
Table 1- 10: Solid waste management (Existing Situation)
Source: AKM data
Frequency of Solid waste disposal
45% of slums have daily clearance of garbage, 39% once in 2 days and 16% once in a week
due to inadequate collection of solid waste.
The map 1-9 shows the frequency of the solid waste clearance in the next page.
No. of Slums
Frequency of garbage disposal
Daily 30
Once in 2 days 26
Once in a week 11
Once in 15 days 0
No collection 0
Arrangement for Garbage Disposal
Municipal staff 35
Municipal Contractor 19
Residents themselves 1
Others 12
No arrangement 0
Frequency of Clearance of Open Drains
Daily 9
Once in 2 days 38
Once in a week 19
Once in 15 days 1
No clearance 0

RAY SLUM FREE CITY PLANNING BELLARY
36
Regional Centre for Urban and Environmental studies
Map 1- 9: Frequency of garbage clearance

RAY SLUM FREE CITY PLANNING BELLARY
37
Regional Centre for Urban and Environmental studies
As evident in the map, the slums marked in red color represent the ones not covered with
clearance of solid waste disposal on a regular or non regular basis.
Arrangement of Garbage Disposal
As seen in the table 1-10, it is found that 52% of the solid waste disposal is handled by the
municipal staff and 28% of the disposal arrangement is through hired municipal contractors. In areas
where there is lack of solid waste disposal or collection, the arrangement is taken care by the
residents/dwellers of those slums, constituting 1%. Around 18% of slums have inadequate and
untimely collection of solid waste which reflects the necessity for increased staff and regular
clearance to avoid any further unsanitary conditions.
Solid waste management (includes collection transportation and disposal of waste) is a
responsibility of Mahanagara Palike of Bellary. The city is divided into 6 sanitary divisions. The
Mahanagara Palike owns 3 tractors and 2 mini lorries and 3 trippers and 6 dumper placers, 1 Jindal
dumper placer and 1 compact container motor transports solid waste of the city to the disposal site.
The Mahanagara Palike has provided about 101-dumper placer container, 11 compact
containers and 50 compact containers are yet to be procured. The dustbins are inadequate in Nos. and
over flow in most places. At present the city‟s solid waste is disposed at one place, Compost yard on
Rupanagudi road. A land filling site is to an extent of 16.32 acres at Bisilahalli Sy. No. 147, behind
BSAL has already been acquired but approach road is under litigation. The city corporation has to
take further necessary action to dispose of the waste generated in the city scientifically.
Due to inadequate capacity of solid waste collection and irregular collection and lack of
disposal sites the garbage is disposed into open drains or nallah. Sometimes it is burnt in open yards
on main highway causing unsanitary conditions in some areas. No proper mechanism of solid waste
disposal exists.
Picture 1- 45: Garbage disposal in Miller pet -II slum
Picture 1- 46: Garbage disposal in D.C.Colony slum
Frequency of Clearance of Open drains
It is found from the AKM data, that 13% of the slums have daily clearance of the open drain,
57% of slums once in 2 days; and 29% have it cleared once a week. It is analyzed that 1% of the
slums are not sufficiently covered with clearance of the open drains, further deteriorating
environmental conditions and contaminating the ground water.
For slum wise details, please refer Annexure-1E on Water supply, Sanitation & Solid waste details.

RAY SLUM FREE CITY PLANNING BELLARY
38
Regional Centre for Urban and Environmental studies
Roads and Street lights
The City Municipality is maintaining about 479 Kms. One N.H.63 passes through the city and is
maintained by National Highway department and state high way No: 19, 128 and 132 & major district
roads are being maintained by the public works department. In general, the existing width of roads does not cope up with present intensity of traffic, which requires improvement and widening.
It was observed that majority of road corridors in the city of Bellary suffer from inadequacies in the transportation system, such as capacity constraints in the road network, poor definition of road
hierarchy, encroachments, on street parking, mixed traffic, lack of pedestrian facilities and other street
furniture.
Lack of connecting roads with other parts in the city and within the slums causes greater
inconvenience and affecting the transport connectivity. This is one of the fundamental issues that is
generally neglected in slum developments and needs thorough planning and execution.
The following table 1 – 11 as extracted from AKM presents the existing condition of road network.
Table 1- 11: Current Statistics of Roads and street lights
No. of Slums
Approach Road/Lane/Constructed Path to the Slum
Motorable pucca 15
Motorable katcha 27
Non-Motorable pucca 24
Non-Motorable katcha 1
Distance from the nearest Motorable Road
Less than 0.5 km 26
0.5 to 1.0 km 29
1.0 km to 2.0 km 12
2.0 km to 5.0 km 0
more than 5.0 km 0
Internal Road
Motorable pucca 7
Motorable katcha 29
Non-Motorable pucca 30
Non-Motorable katcha 1
Whether Street light facility is available in the Slum
Yes 67
No 0 Source: AKM data
Nature of Approach Road
By and large, 22% of slums are provided with Motorable pucca roads and 40% are katcha in
nature. On the other side, 1% of the slums have non Motorable katcha road, making the transportation
access difficult, there is a need to upgrade. The following map shows the type of approach road
provided to the slums:
The map 1-10 shows the type of approach road provided to the slums:

RAY SLUM FREE CITY PLANNING BELLARY
39
Regional Centre for Urban and Environmental studies
Map 1- 10: Condition of Approach roads

RAY SLUM FREE CITY PLANNING BELLARY
40
Regional Centre for Urban and Environmental studies
Distance from nearest Motorable road
Around 39% of the slums have access to the nearest Motorable road within 0.5 Km and 43%
between 0.5 Km to 1 Km. For 18% of the slums, the nearest approach road is at the distance of more
than 1 Km.
Type of Internal road
10% of the slums have Motorable pucca internal roads while 43% have katcha internal roads.
Around 46% of the slums lack in proper internal roads with BT surface.
Street Lighting
According to the AKM, All slums have street lighting facilities, yet which are not in working
condition and found to be insufficient. There are not enough street lighting facilities, hence it is
essential to increase number of street lights to prevent accidents and other inconveniences.
Picture 1- 47: Approach road, Cheluvadhikeri
Picture 1- 48: Internal road in Andral
Picture 1- 49: Street lights in Andral
Picture 1- 50: Street lights along the road, B.Gonal

RAY SLUM FREE CITY PLANNING BELLARY
41
Regional Centre for Urban and Environmental studies
Map 1- 11: Availability of street lights
For slum wise details, please refer Annexure-1F on Roads &Street lights.

RAY SLUM FREE CITY PLANNING BELLARY
42
Regional Centre for Urban and Environmental studies
Social infrastructure
The quality of life in any urban centre depends upon the availability of and accessibility to
quality social infrastructure. Development of social infrastructure includes education, health, social
welfare, livelihood centers and recreational facilities, instrumental in contributing to substantial
improvements in physical quality of life, which in turn, initiates and accelerates economic
development in a city. The following are a list of elements that forms the social infrastructure:
Educational facilities
Health facilities
Community halls & rooms
Livelihood centers
Youth centers
Social welfare facilities
Old age homes
Night shelter
Parks
Public utilities such as fire services
Following section details out the current level of social infrastructure available as well as
accessible to the slum households.
Educational facilities
Picture 1- 51: Anganwadi at D.C colony slum
Picture 1- 52: Primary school at Mundargi slum
Table 1- 12: Distance from nearest Pre-Primary School
Distance Within the
slum area < 0.5KM
0.5 to 1.0
KM 1.0-2.0 KM
More than 2
Km
Pre- Primary Schools (Anganwadi)
No. of slums 56 8 1 0 2
Pre- Primary Schools (Municipal)
No of slums 10 0 1 0 56
Pre- Primary Schools (Private)
No of slums 29 11 5 1 21
Source: AKM data

RAY SLUM FREE CITY PLANNING BELLARY
43
Regional Centre for Urban and Environmental studies
As indicated in table 1-12, for slum households, the nearest distance to pre-primary schools
run by different agencies are located maximum within the slums and 0.5 Km away from the slums.
Around 2 slums do not have access to Pre-primary schools when the distance is more than 2 Km.
Table 1- 13: Distance from nearest Primary School
Distance Within the
slum area < 0.5KM 0.5 to 1.0 KM 1.0-2.0 KM
More than 2
Km
Primary Schools (State Government)
No of slums 41 12 2 1 11
Primary Schools (Municipal) No of slums 10 2 2 0 53
Primary Schools (Private)
No of slums 26 15 3 4 19
Source: AKM data
As indicated in table 1-13, for slum households, the nearest distance to primary schools run
by different agencies are located maximum within the slums and 0.5 KM away from the slums. About
7 slums have primary schools run by different agencies are located between distances of 0.5 km to 1.0
km away from the slums. Seen in map-12, the areas marked in red color show that 11 slums do not
have access to state govt. primary schools when the distance is more than 2 Km.
Picture 1- 53: Primary school at D.C. Colony slum
Picture 1- 54: High school at Guggarahatti honnali road
Table 1- 14: Distance from nearest High School
Source: AKM data
As indicated in table 1-14, for slum households, the nearest distance to primary schools run
by different agencies are located maximum within the slums and 0.5 KM away from the slums. About
11 slums have primary schools run by different agencies within a distance of 0.5 km to 1.0 km from
the slums. Around 19 slums do not have access to state government run High schools when the
distance is more than 2Km
Distance Within the
slum area
<
0.5KM
0.5 to 1.0
KM
1.0-2.0
KM More than 2 Km
High Schools (State Government)
No of slums 25 12 4 7 19
High Schools (Municipal)
No of slums 11 2 1 2 51
High Schools (Private)
No of slums 17 9 6 4 31

RAY SLUM FREE CITY PLANNING BELLARY
44
Regional Centre for Urban and Environmental studies
Map 1- 12: Availability of primary schools

RAY SLUM FREE CITY PLANNING BELLARY
45
Regional Centre for Urban and Environmental studies
Health facilities
Many of the health problems in urban slums stem from the lack of access to or demand for
basic amenities. Basic service provisions are either absent or inadequate in slums. Lack of drinking
water, clean, sanitary environment and adequate housing and garbage disposal pose series of threats to
the health of slum dwellers, women and children in particular, as they spend most of their time in and
around the unhygienic environment. Inadequate nutritional intake due to non-availability of
subsidized ration or availability of poor quality to ration makes the slum dwellers prone to large
number of infections and lack of education or information, further aggravates the situation.
As per AKM, 24% of the slums do not have primary health facilities for more than 2 Km.
93% of the slums don‟t have any health facilities, 79% constitute private clinics, 27% forms registered
practitioner. Health as well as medical facilities is provided and is serving the ailing people belonging
to the slum areas item wise particulars are shown in table1-15.
Picture 1- 55: Govt. Hospital at Alagappa Beedi
Picture 1- 56: Clinic in Rani Garden
Table 1- 15: Distance from nearest Health facilities
Distance Within the
slum area
<
0.5KM
0.5 to 1.0
KM 1.0-2.0 KM
More than 2
Km
Urban Health post
No. of Slums 2 14 14 13 24
Primary Health Centre
No. of Slums 9 19 12 11 16
Government Hospital
No. of Slums 19 6 16 15 11
Maternity Centre
No. of Slums 20 11 18 8 10
Private Clinic
No. of Slums 19 18 12 5 13
Registered Medical Practitioner (RMP)
No. of Slums 8 9 2 0 48
Ayurvedic Doctor/Vaidya
No. of Slums 30 5 1 0 31
Source: AKM data
As indicated in table 1-15, for slum households, the nearest distance to primary health care
centers is located maximum within the slums and 0.5 KM away from the slums. While for
Government Hospitals, approximately 11 slums have access to the hospital within 1.0 - 2.0 Km.

RAY SLUM FREE CITY PLANNING BELLARY
46
Regional Centre for Urban and Environmental studies
Map 1- 13: Availability of Primary health centres

RAY SLUM FREE CITY PLANNING BELLARY
47
Regional Centre for Urban and Environmental studies
Social welfare facilities
Similar to the above sections in social infrastructure, the following table 1-16 presents
available social welfare facilities in 67 slums:
Table 1- 16: Social welfare facilities
Availability of Facilities within Slum No. of slums
Community Hall 25
Livelihood/Production Centre 1
Vocational training/Training-cum-production Centre 4
Street Children Rehabilitation Centre 0
Night Shelter 0
Old Age Home 1
Social Welfare facilities No. of Holders
Old Age Pensions (No. of Holders) 229
Widow Pensions (No. of Holders) 178
Disabled Pensions (No. of Holders) 60
General Insurance (No. covered) 273
Health Insurance (No. covered) 29
Self Help Groups/DWCUA Groups in Slum 110
Thrift and Credit Societies in Slum 414
Slum-dwellers Association No. of slums
Yes 63
No 4
Youth Associations 13
Women‟s Associations/ Mahila Samithis 62
Source: AKM data
25 slums out of 67 have facility of community halls; 6% of the slums do not have slum
dwellers association however 99% of the slums have women‟s associations to empower women with
home based employment. In addition, the slums do have self groups as well as credit societies.
Picture 1- 57: D.C. Camp belagal road
Picture 1- 58: Dr. Vishnu vardhan Udyanvan, Vinayaka nagar 2nd phase

RAY SLUM FREE CITY PLANNING BELLARY
48
Regional Centre for Urban and Environmental studies
For slum wise details, please refer Annexure-IF on Social Infrastructure.
Map 1- 14: Availability of Community hall

RAY SLUM FREE CITY PLANNING BELLARY
49
Regional Centre for Urban and Environmental studies
Section II – Slum Rehabilitation Strategy

RAY SLUM FREE CITY PLANNING BELLARY
50
Regional Centre for Urban and Environmental studies
CCHHAAPPTTEERR 22 –– SSLLUUMM RREEHHAABBIILLIITTAATTIIOONN SSTTRRAATTEEGGYY
Introduction
The major factors that influence the design of upgrading programs are scale of the problem,
the severity of conditions, tenure, and relevant support for social and economic development,
community participation, the institutional framework, the financial structure, political will, and good
governance. As part of community up-gradation, there are factors that need to be considered in the
planning and implementation of initiatives. Most of the up-gradation programmes undertaken
throughout the world are one of three types: provision of basic infrastructure to the community,
tenure security, and comprehensive up-gradation. The appropriateness of their use is driven by the
status of existing conditions in the slums.
First component is provision of basic infrastructure to the slum households. Improvement of
basic services is necessary when the environmental conditions and physical infrastructure are poor,
but tenure is relatively secure. For improving the services, both the physical and social infrastructure
elements such as sanitation, water supply, drainage, and often some community facilities are taken
into account. This type of program tends to cost less per capita than more complex programs. The
improvements can be financed easily by a program like RAY.
The second component is the incremental buildup of tenure security when the land tenure
status is found to be insecure. In these circumstances, lack of tenure is a threat to the security of
livelihoods, and a significant barrier to households investing in upgrading their own homes. The threat
of forced evictions also looms over such settlements. In such cases rapid tenure regularization may
lead to increased land values and, as a consequence, market driven displacement of beneficiaries. An
incremental approach based on a „continuum of land rights‟ and flexible tenure arrangements would
be recommended. Temporary occupancy rights, lease agreements, possession rights, anti-eviction
rights are among flexible and effective tenure systems that do not place unrealistic demands on local
governments with weak resources, do not disrupt municipal land markets, and provide beneficiaries
with adequate and incremental security of tenure. When and where it becomes appropriate and
affordable, lot titling through the sale or allotment of land should be considered as a way of providing
the strongest form of tenure security.
The third type of upgrading program – a mixture of the previous two – is comprehensive
upgrading. It combines both provision of basic infrastructure and tenure security. It is appropriate
where environmental conditions and physical infrastructure is poor, where population densities are
high, and where tenure is insecure.
The comprehensive upgrading program is relatively complex and time-consuming because it
has more administrative requirements, implicates more stakeholders, and depends on greater
community involvement.
In order to best apply RAY objectives and create Bellary a Slum free city, an imperative slum
rehabilitation strategy would be necessary depending on the expected outcomes from the findings or
analysis of existing slum situation in a city.

RAY SLUM FREE CITY PLANNING BELLARY
51
Regional Centre for Urban and Environmental studies
The rehabilitation strategy comprises of several components such as:
Physical targets – relocation, in-situ and up gradation
Law and legislation for slum dwellers
Stakeholder/ community participation
Financial framework
Institutional mechanism
The following flowchart details the rehabilitation proposed for Slum free Bellary.
Chart 2- 1: Slum Rehabilitation Strategy
a) Physical targets
For slum rehabilitation, the top most priority would be given to the redevelopment/
rehabilitation of identified slums and measures to prevent future slums. The following three options of
redevelopment that is categorized based on housing tenure, tenability, physical location, density and
ownership:
Relocation mode
Depending on the physical location of slums such as hazardous sites and
environmental conditions and where there is no alternative
Involves communities in identification of alternative sites
Ensures that education, health, transport, basic services and infrastructure and
provided before relocation
Physical targets
Law and legislation
Stakeholder & Community participation
Financial plan
Institutional Mechanism
• Relocation
• In-situ development
• Up-Gradation
• Formulation of Draft law
•PPP Model
Slum Rehabilitation strategy

RAY SLUM FREE CITY PLANNING BELLARY
52
Regional Centre for Urban and Environmental studies
In situ slum redevelopment mode
Involves redevelopment of whole site to provide more living space and improved
environmental conditions such as those in high density areas.
Provision of transit accommodation and including of all residents, especially the
extremely poor critical to success
In this mode, new mixed-use mixed income communities can be created with a viable
cross-subsidy model, which is a function of local land values, socio-economic needs
and general context of the area.
In situ slum Up-gradation mode
Involves a mixture of provision or upgrading of service and infrastructure levels,
incremental housing improvements or selective replacement of katcha houses
The following chart presents the recommended mode of development for 5 years in order to
make Bellary a slum free city.
b) Law and legislation
An appropriate legislation is a necessity to achieve and implement the development strategies
formulated for Slum Free Bellary. RAY promises a secured housing, provision of urban basic services
helps the slums to become “slum free” through rehabilitation strategy. Legislation forms an important
tool for Govt. to assign property rights, provide basic services and achieve the holistic mission of
RAY. Hence, suitable implementable and customized legislation forms an integral part of Slum
rehabilitation strategy.
6
4
4
13
4
16
6
10
1
3
Insitu
Upgradation
Insitu
Upgradation
Insitu
Upgradation
Insitu
Upgradation
Insitu
Upgradation
Ist
Yea
r2
nd
Ye
ar3r
d Y
ear
4th
Yea
r5t
h Y
ear
Mode of development
No of slums
Chart 2- 2: Mode of Development

RAY SLUM FREE CITY PLANNING BELLARY
53
Regional Centre for Urban and Environmental studies
c) Stakeholder/ community participation
It has been proved by several previous schemes for slum development that community
/stakeholder participation is a key aspect in implementing rehabilitation strategy to achieve Slum Free
Bellary. Community Participation calls for a strong and active participatory chain which would be
involved throughout the implementation of RAY starting from surveys until project implementation
and monitoring. This particular strategy would actually make the slum dwellers realize the motive
behind the programme as an opportunity to raise their standard of living, achieve higher dignity and
provide better facilities for present as well as future families. Community participation strategy is a
promising bridge between the governments and the beneficiaries to understand the mutual benefits of
the programme.
d) Financial framework
RAY has posed a significant challenge to the state, ULB and beneficiaries by announcing its
50% contribution towards the project. This calls for development of exclusive financial development
strategy to meet the remaining 50% finances through various sources and mechanism. The
alternatives as proposed by Govt. of India.
The development strategy has been finalized after careful observations/scores that have been
evolved through derived matrix preparation according to the Govt. of India guidelines. The strategy
would enable the most needed slums to be taken care in first year in a strategic manner and continue
to do so in the coming five years. The strategically financial framework would enable the project
implementation smoothly without any finance hurdle.
e) Institutional mechanism
RAY is a challenging task right from policy making until project implementation and
monitoring. However the city should comprise of several teams which have to be coordinated within
each other and successfully channelize step by step. The roles vary from Center, State, ULB, Slum
clearance boards, RAY technical cell, NGO's and other associated agencies. The city should be able to
actively involve the various agencies with various tasks as the programme advances yearly. There has
to be hiring done at necessary levels/positions to complete coordination cycle. Hence institutional
mechanism enables and proves to be a significant strategy for slum rehabilitation.
It is a necessary exercise to assess the existing slums to propose for a development strategy. A
matrix analysis was prepared for Bellary slums to identify the level of urban services. The matrix
details the deficiency in the overall infrastructure and housing services among the slums.
Deficiency Matrix
According to RAY guidelines, a deficiency matrix for the existing slums is prepared using the
scoring and ranking method. The matrix is based on three important parameters: Housing,
Infrastructure and Tenure. Within these, Housing and Infrastructure are the physical parameters that
are directly related to the existing quality of the housing condition.

RAY SLUM FREE CITY PLANNING BELLARY
54
Regional Centre for Urban and Environmental studies
For evaluating infrastructure, individual scores are assigned to indicate the levels based on various
parameters such as:
Water supply
Score 1- 60% or more of household have individual connection and
Score 2- Less than 60% of households having individual connections.
Drainage
Score 1- 60% or more in-slum drains are covered and / or pucca drains
Score 2- Less than 60% in-slums drains are covered and/or pucca drains
Solid waste management
Score 1- Every day/alternate removal
Score 2- Removal of waste in frequent/once in fifteen days
Sanitation
Score 1- 60% or more having individual toilet unit (with toilet seats)
Score 2- Less than 60% use individual toilets
Road
Score 1: 60% or more of the in-slum roads have a min of 3 m width
Score 2: Less than 60% of the in-slum roads are of 3 m width.
Once the individual scores are obtained, a total score is stipulated and if the overall score of
the infrastructure is less than 7, it is considered good infrastructure and greater than 7 is bad
infrastructure. Based on which 38 slums were found to be having better infrastructure levels while 29
slums had lower levels of infrastructure, needing further improvement.
Similarly for housing, it is assessed by considering:
Structural condition
o Score 1: semi pucca + katcha houses < 60%
o Score 2: semi pucca + katcha houses > 60%
Age of the slum
Chart 2- 3: Model Deficiency matrix

RAY SLUM FREE CITY PLANNING BELLARY
55
Regional Centre for Urban and Environmental studies
Space Per Person
o Score 1: 60% or more houses having > or equal to 3 Sq.m per person
o Score 2: Less than 60% houses having > or equal to 3 Sq.m per person
For Tenure status of the land - secured and in-secured
Score :1 For secured status
o Registered (including ownership, leasehold and use/occupancy rights)
o Unregistered but documented (e.g. rental, rent to buy, unregistered leases, etc)
o Group/family/household rights Unregistered & undocumented
Score :2 For Unsecured status
o Documented (e.g. written agreements between irregular owners and tenants, de facto
recognition, illegal subdivisions, customary rights, tenancy at will, etc)
o Undocumented
Density
Based on the above individual scores, a final composite score for each slum is calculated
using the parameters of security of tenure, housing condition and the infrastructure level. Once the
score is obtained, the slums are then classified into:
Good housing with good infrastructure;
Good housing with bad infrastructure;
Bad housing with good infrastructure
Bad housing with bad infrastructure;
In reference to RAY guidelines, settlements without any security of tenure are considered
most vulnerable and therefore should be given priority in selection for improvement. In addition,
settlements with bad housing bad infrastructure are also given priority for choosing the most
appropriate development options. With the above classification method, suitable mode of
development is selected for each slum. Once all the slums are synthesized and assigned with overall
score, the slums will be categorized further based on the degree of deficiency for the three modes of
redevelopment.

RAY SLUM FREE CITY PLANNING BELLARY
56
Regional Centre for Urban and Environmental studies
Detail Methodology Diagram
Chart 2- 4: Detailed Methodology

RAY SLUM FREE CITY PLANNING BELLARY
57
Regional Centre for Urban and Environmental studies
With respect to Bellary, the above methodology in chart 2-4 is being followed for preparation of Slum
Free City Plan, starting with:
Step-1: Establishment of a slum free technical cell at the state nodal agency level for city for
planning, documentation, capacity building and monitoring the POA through selection of
professionals from various departments and disciplines.
Step-2: Preparation of city and slum profiles involves collection of secondary information
such as CARTOSAT II images and relevant slum information. Next preparation of base maps
to an appropriate scale using GIS application. In addition, identification and inventory of all
slum clusters along with inventory of all possible vacant lands in each zone and that could be
used for slum redevelopment/ rehabilitation development purposes
Step-3A: Socio Economic Survey in slum areas: reputed NGO/CBOs were selected for
conducting socio economic surveys and data validation. Identification of survey personnel
from nearest slums with local knowledge and extensive training to be provided for survey
personnel by the local organizations on survey formats as specified by MoHUPA.
[
Step-3B: Preparation of GIS based maps involves mobilization of GIS team and training,
acquiring Satellite images for the cities and creating geo-databases with required spatial
layers such as roads, buildings, land use and capturing utilities. In addition, involves
preparation of base maps, thematic maps and slum maps.
Step-4: MIS & Data Entry involves collection of data of slum dwellers, compilation and
collation of primary data, preparation of a robust Slum-wise, City and State Slum Survey
Database and Baseline Reports. In addition, the MIS team is responsible for identifying data
gaps validation, resend them to the concerned authorities and updating the database.
[
Step-5: Ground Mapping involves survey personnel team to map the parcels, capture
utilities and updating the revised slum maps.
Step-6: Verification and Validation by Independent Agency on socio-economic, spatial
data and base maps on a random basis.
[[
Step-7: MIS includes Integration of Slum MIS with GIS Maps to enable the preparation
of GIS-enabled MIS maps for the preparation of meaningful Slum Development Plans and
Slum-free City.
Step-8: Data analysis and decision for Slum Redevelopment Plan based on models like
PPP development, infrastructure provision only, community-based development through
involvement of the community mobilization and dialogue for deciding the model to be
adopted.
Step-9: Micro level planning & organizing workshops with community stakeholders for
prioritization of slums and the mode of development.

RAY SLUM FREE CITY PLANNING BELLARY
58
Regional Centre for Urban and Environmental studies
Step-10: Plan Preparation- Prioritization and phasing of slums and works including line
estimates for 1st year slums.
Step-11: ULB Approval involves prioritization and phasing of slum rehabilitation models.
Step-12: Preparation of Slum-free City Plan and DPR should include strategies for the
prevention of future slums, including reservation of land and housing for the urban poor. The
Plan should contain timeline of activities for achieving slum-free city, phasing information
and financial estimates against each of the activities.
Step-13: Obtaining approvals from ULB and other concerned authorities
Step-14: Obtaining approval of SLSC/SLNA/MoHUPA
Step 15 & 16: tendering process, implementation of proposals and appointing of TPIMA
team
Step 17: Impact Assessment
Step-18: Revisions and rectifications of the strategies, reforms.
2.1. Surveys, Investigations & Consultations
a. Introduction
Listing of Surveys and Timelines (annexure)
Directorate of Municipal Administration (DMA) is the nodal agency to implement „Rajiv
Awas Yojana‟ in the State. As per the directions of Government of India, Slum Survey & Mapping
Process has started in Karnataka from 14.07.2009. Initially DMA has identified 2073 Notified Slums
& 1495 Non-notified Slums in 214 Urban Local Bodies. Various meetings were conducted by calling
different para-statal agencies to discuss the required methodology for
conducting surveys and initiate the steps of RAY. A State Level Workshop
was conducted on 26.11.2009 by calling all the Deputy
Commissioners /Project Directors/
Commissioners /Chief Officers/ Master Trainers.
Several discussions were held at length and in
depth about the conduction of surveys and to
finalize a methodology. The following institutional methodology has
been adopted for the state.
Chart 2- 5: Agencies & Stakeholders involved

RAY SLUM FREE CITY PLANNING BELLARY
59
Regional Centre for Urban and Environmental studies
Agencies (including procurement process) & Stakeholders involved
DMA has been the Nodal agency to monitor the quantity
and quality of surveys performed by individual cities.
Commissioners and deputy commissioners have established a
system where in a Project Officer has taken in charge for one
district, a project officer for a ULB and number of supervisors for
quality and quantity check upon the enumerators who have done
the surveys.
Member of Self Help Groups constituted under
SJSRY/Urban Sthree Shakthi Scheme & Anganwadi Teachers
with minimum qualification of SSLC were taken as Enumerators
to collect information and to fill up the survey forms. A set of
two Enumerators to cover 20-22 households in a day for every 300 to 400 households one set of
enumerator was appointed. The various stakeholders involved in the process comprised of NHG‟s,
NHC‟s, CDS and reputed NGO‟s working in the local areas.
b. GIS mapping
Methodology: Karnataka State Remote Sensing
Applications Center (KSRSAC) has been awarded the job of
GIS Mapping. The satellite images were acquired for all
cities and digitization of city and slum boundaries are in
process. KSRSAC is the only stakeholder involved in
preparation of GIS maps for the state and it directly reports
to DMA.
c. MIS
Methodology: DMA has initiated a project division under the operation of Municipal Reforms Cell
(MRC), which has performed the operations of MIS. Data Entry has been done at ULB level and
ported the data to the main server at MRC. A routine checkup of data has been performed and
uploaded in a web tool specially prepared for RAY project called Asha Kirana Mahithi (AKM) @
http://www.mrc.gov.in/akm. Every ULB has given a USER Name & PASSWORD to access their
data from the Central Server. The front and back end of the web tool is Java and Oracle. Once the data
is frozen and migrated to centralized data base at MRC, any editing of data will be done by the Project
Director, DUDC in case of Town Panchayath, Town Municipal Council, and City Municipal Council
and by Commissioners in case of City Corporations. In case of BBMP it will be done by Zonal
Commissioners. AKM web tool has the synchronizing database structure with that of national MIS
database prepared by Centre for Good Governance (CGG), so that at any required time, database can
be transferred to the national tool.
Picture 2- 1: Enumerators collecting information from community officers
Picture 2- 2: Spatial Linking of Data

RAY SLUM FREE CITY PLANNING BELLARY
60
Regional Centre for Urban and Environmental studies
d. Stakeholder Consultation
The stakeholder consultations are done at 3 stages:
1) City level consultation: This is the first stage of stake
holder meeting where the city level data is analyzes
and the major problems in the city are discussed with
sectoral officials like water supply, sanitation, slum
clearance board, etc.
2) Slum level consultation: At this stage the slum
dwellers play a key role in explain the existing
situation of slums and in giving the correct picture of
the basic employment and other details of the slums.
3) Official meeting: At this stage of meeting the proposals of the development are discussed in
detail with the commissioner, urban poverty alleviation cell, slum clearance board and other
officials concerned...
Once a development option is chosen for a particular slum habitation, the implementation structures
are to be decided based on the extent of public, community and private involvement. It is envisaged
that for any of the implementation structures chosen, the community and the implementing ULB will
have overarching roles as set out below. The same would need to be taken into account while
formulating the implementation options.
2.2. Slum Categorization
The Categorization of Slums is done based on the scoring and ranking method where certain
parameters are taken into account to identify the deficiencies and make suitable decisions. The three
important parameters that play equal role in determining the slums that are deficient are Housing,
Infrastructure and Tenure status. In this section, the following parameters such as Tenability,
Abutting Land use, Tenure status, Ownership of the land, density and land value are being
discussed.
a. Tenability
As a first step, the slums and vacant lands will be categorized as tenable, or untenable.
Untenable slums will be only those which are 'unsafe' or 'health hazard' to the inhabitants or to their
neighborhoods, even if redeveloped. Such untenable sites or portions will be earmarked for relocation
to other redevelopment/vacant sites, preferably within the same zone.
Table 2- 1: Tenability of Slums
Source: Guide lines for preparation slum free city of action 2011
Of 67 slums identified, 88% of the slums are found to be tenable while 12% to be semi-
tenable. Due to surrounding land use non-residential uses and any other land reservation. In order to
make these slums tenable it is recommended to change in present land use zoning be made however it
will be decided competent authority. For visual illustration of tenability analysis of slums, Please
refer Map 2-1 and for slum wise details refer Annexure – IA.
Tenable Semi - Tenable Un- Tenable
No of Slums 59 8 0
Picture 2- 3: Stakeholder consultation
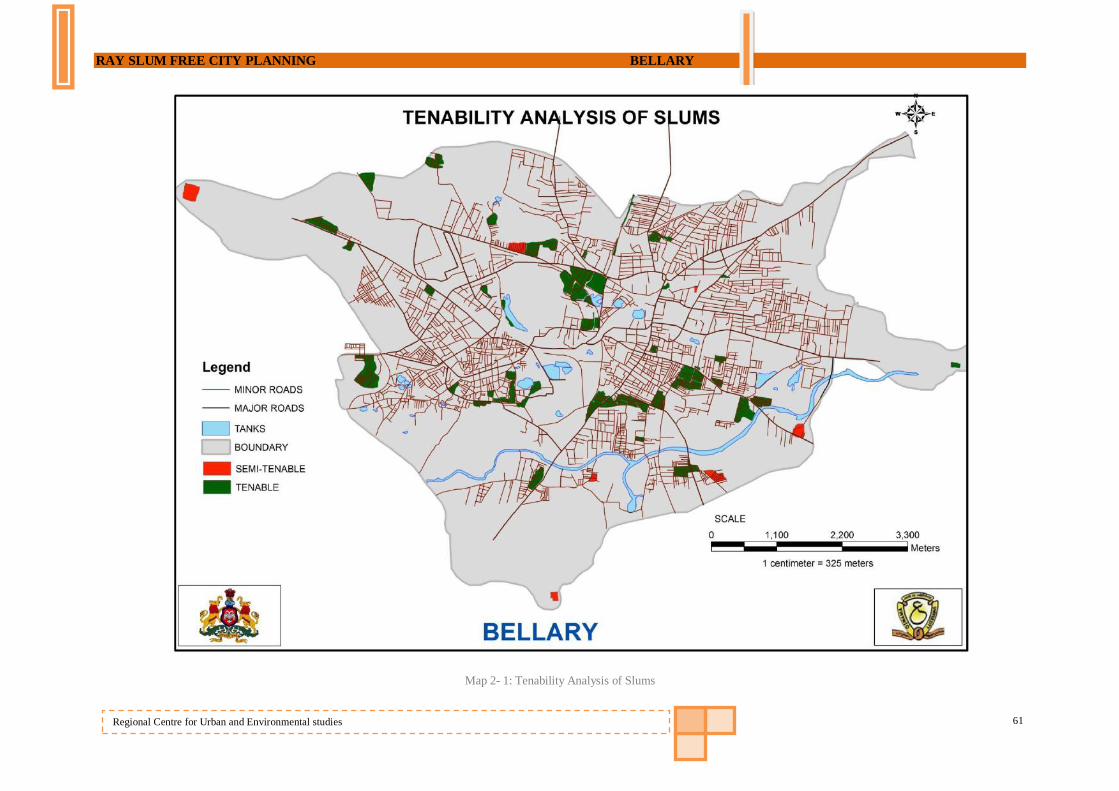
RAY SLUM FREE CITY PLANNING BELLARY
61
Regional Centre for Urban and Environmental studies
Map 2- 1: Tenability Analysis of Slums

RAY SLUM FREE CITY PLANNING BELLARY
62
Regional Centre for Urban and Environmental studies
b. Abutting Land use
Table 2- 2: Notification Status / land use
Legal
Status/
Land use
Notified Non - Notified Slums in
category as %
of Total
Number of
Slums
Households in
category in %
terms of Total
Number of
slum
Households
No of
slums
No of
Households
No of
slums
No of
Households
Residential 50 13293 9 1411 88% 90%
Commercial 0 0 1 67 2% 0%
Institutional 0 0 0 0 0% 0%
Industrial 2 542 0 0 3% 3%
Others 4 1043 1 52 7% 7%
Total 56 14878 11 1530 100% 100%
Source: Guide lines for preparation slum free city of action 2011
From table 2-2, it is established that 90% of the households are surrounded by the residential
use, followed by 3% under Industrial and 7% by others. The slums and vacant lands will need to be
further classified into sub-categories based on the land ownership information and land value (market
price) to decide the redevelopment model to be followed for each slum pocket within the zone.
c. Land tenure of slums
Table 2- 3: Land tenure Status
Source: AKM data
As seen in the above table 2-3, 25% of the slum households have registered with possession
certificates while 40% are registered and have pattas for their respective lands. On the contrary, 6% of
the households are not registered and hence live on encroached lands of private as well as public
owned the remaining of the slums are rental and others.
For visual illustration of tenure status of slums, please refer map 2-2.
Land tenure
Status Pattas
Possession
certificate)
Encroached
public land
Encroached
private land
On
Rent Others
No of HH's 6549 4071 492 551 4635 110

RAY SLUM FREE CITY PLANNING BELLARY
63
Regional Centre for Urban and Environmental studies
Map 2- 2: Tenure status of slums

RAY SLUM FREE CITY PLANNING BELLARY
64
Regional Centre for Urban and Environmental studies
d. Ownership of Land Status
The categorization based on land ownership of slums can be used in assigning strategies for
development and priorities for implementation under various strategies for development. The
following table 2-4: classifies the legal status of the slum households based on the ownership and land
tenure status.
Table 2- 4: Ownership of Land Status
Ownership of Land/ Notification Status ULB State government Private
Registered (No. of HH)
Pattas 4335 2113 101
Possession certificate 1884 1760 427
Un – Registered (No. of
HH)
Encroached 229 512 302
On Rent 3108 1401 126
Others 67 39 4
Source: Guide lines for preparation slum free city of action 2011
The above table indicates that 65% of total households have registered and the remaining
35% are not registered with any agency. Under the ownership of ULB, 38% of the households are
registered and 21% are unregistered. Similarly 3% are registered and 3% households are
unregistered, belong to the private ownership of the land. Overall under the state Govt. owned lands,
36% belong to registered and unregistered. Speaking of ownership, ULB ownership is termed to be
the highest with 59% of the households under it. Still 35% of the households need a secured status in
order to avail better infrastructure.
Table 2- 5: Land Ownership / Notification Status
Ownership of Land / Legal Status ULB State
government Private
Notified Slums 27 23 6
Non - Notified Slums 4 7 0
Source: AKM data
As seen in the above table 2-5, 9% of the slums are under the ownership of Private agencies
and 46% built on lands owned by ULB, thus making it the largest owner.
Table 2- 6: Land Ownership / Area
Source: AKM data
As far as land covered by respective agencies, it is found that ULB holds the highest percent
(56%) owning the lands under slums.
Land Ownership /
Area ULB
State
government Private
Area 56% 40% 4%

RAY SLUM FREE CITY PLANNING BELLARY
65
Regional Centre for Urban and Environmental studies
Map 2- 3: Land ownership of slums

RAY SLUM FREE CITY PLANNING BELLARY
66
Regional Centre for Urban and Environmental studies
e. Density
In this context, due consideration will have to be given to existing density of each slum
pocket within a zone, in order to propose a suitable development option. Based on Section-I data
analysis, the classification of the slums is based on the values of density where:
Low where density is less than 120 dwelling unit per hectare
Medium where density ranges from 120- 250 dwelling unit per hectare
High where density is greater than 250 dwelling unit per hectare
The following table 2- 7 presents the mode of development and additional accommodation of
density for the slums based on its classification:
Table 2- 7: Density / Mode of Development
Density / Mode of Development Low Density Medium Density High Density
Relocation ( No of Slums ) 0 0 0
In - Situ ( No of Slums ) 13 8 0
Up gradation ( No of Slums ) 27 14 5
Total 40 22 5
Source: Guide lines for preparation slum free city of action 2011
As per the prioritization, it was found that 5 slums have high density while 22 slums are
moderately dense and the remaining pretty low. Under the category of low density, 13 slums have
been chosen for In - Situ and 27 slums for up-gradation. At the same time, 14 slums which are
moderately dense have selected for up-gradation mode. On other side, 5 of the highly dense slums
have selected for up-gradation.
Picture 1- 59:Vinayakanagar 2nd Phase
Picture 1- 60: Condition of Sanganakkal road slum
Picture 1- 61: Condition of Shanthi nagar slum

RAY SLUM FREE CITY PLANNING BELLARY
67
Regional Centre for Urban and Environmental studies
For slum wise details please refer Annexure-II D Map 2- 4: Density of Dwelling unit in slums

RAY SLUM FREE CITY PLANNING BELLARY
68
Regional Centre for Urban and Environmental studies
f. Land value
For Bellary City, the land values will be determined with reference to the slum and it is case
specific and based on the mode of development, which will be calculated during preparation of DPR.
At this is stage, it might be difficult to determine the land value as it is expected to vary in concord
with market prices.
2.3. Slum Rehabilitation Framework
According to RAY guidelines, preparation of housing condition & infrastructure deficiency
and tenure insecurity matrix for all slum settlements is based on scoring and ranking. The matrix is
based on three important parameters: Housing, Infrastructure and Tenure. Within these, Housing and
Infrastructure are the physical parameters that are directly related to the existing quality of the housing
condition, while land tenure defines the legal status of land ownership.
In this section, the following infrastructure components were considered for calculating
deficiency from the existing data:
• Percentage of households not covered with piped water supply
• Percentage of households that are not covered with sewerage system and storm water
drainage system
• Percentage of households that do not have any form of solid waste clearance
• Percentage of households not covered with toilets
• Percentage deficiency in availability of street lights
a. Observations / Findings of Analysis of Existing Situation
Housing
40% of the slums have been into existence for more than 30 years in the city without dated
infrastructure
85% of the slum lands are secured and have access to basic amenities and in possession of
certification while 15% of the slums are still unsecured, which needs regularization.
As far as electricity connection is concerned, nearly 11% of the total households do not have
electricity connection.
Even though 44% of the houses are pucca in nature, but most of them are found to be in
dilapidated condition.56% of the houses are found to be semi pucca & Katcha in nature and
most vulnerable to any kind of disaster.
Demography & Employment
Nearly 91% of the total slum population is below poverty line (BPL) with 14929 households.
On minority group front, it is observed that 47% of the total population constitutes the
mentioned group with 57% of Child Laborers. It is also observed that 13% of the child labor
falls under school dropouts.
23% of the BPL population falls under illiterate category

RAY SLUM FREE CITY PLANNING BELLARY
69
Regional Centre for Urban and Environmental studies
22% of the notified slum households are still un-employed.
30% of the households are found to be working as casual laborers and 12% on regular wage
basis as they are unskilled. Therefore, nearly 46% of the poor households do not have access
to a dependable occupation and secure incomes. Further, the livelihood pattern has been
become indefinite and irregular for the households, where only 69% of them are earning more
than Rs.3000/- per month.
Water Supply
Table 2- 8: Water Supply details
Notified Slums Non Notified
Slums Total % HH's of
total
Households No of
slums
No of
HH's
No of
slums
No of
HH's
No of
slums
No of
HH's
Connectivity to Water Supply
Fully 53 14332 9 1330 62 15662 96%
Partially 2 306 2 200 4 506 3%
Not Connected 1 240 0 0 1 240 1%
Total 56 14878 11 1530 67 16408
Duration of Water Supply
daily Less than 1 hr 56 14878 1 67 57 14945 91%
daily 1-2 hrs 0 0 0 0 0 0 0%
Daily more than 2 hrs 0 0 0 0 0 0 0%
Once a week 0 0 2 312 2 312 2%
Twice a week 0 0 8 1151 8 1151 7%
Not regular 0 0 0 0 0 0 0%
No Supply 0 0 0 0 0 0 0%
Total 56 14878 11 1530 67 16408
Source of Drinking Water
Individual tap 56 6832 10 643 66 7475 46%
Public tap 56 6697 11 793 67 7490 46%
Tube wells/Bore well/hand
pump 53 541 10 26 63 567 3%
Open well 29 70 4 8 33 78 0%
Tank/pond 6 34 1 1 7 35 0%
River/canal/lake/spring 0 0 0 0 0 0 0%
Others 51 703 7 59 58 762 5%
Water tanker 1 1 0 0 1 1 0%
Total 252 14878 43 1530 295 16408
Source: AKM data
Of the total households, 95% are fully connected to city wide water supply system. With
respect to drinking water sources 46% of the households have individual taps as primary source and
54% of the households are dependent on public water taps, tube wells, open wells, hand pump water
tanker and other sources. Yet there is a short fall of 54% of households that needs to be addressed for
the provision of individual taps. Regardless of the connectivity to city wide water supply system, the
major problem in Bellary slums is poor quality of water due to waste disposal and contamination of
leaked water pipes.

RAY SLUM FREE CITY PLANNING BELLARY
70
Regional Centre for Urban and Environmental studies
Sanitation
Table 2- 9: Sanitation details
Notified Slums Non Notified
Slums Total % HH's
of total Househo
lds
No of
slums
No of
HH's
No of
slums
No of
HH's
No of
slums
No of
HH's
Connectivity to wide Sewerage system
Fully 43 11998 8 874 51 12872 78%
Partially 8 2009 2 604 10 2613 16%
Not Connected 5 871 1 52 6 923 6%
Total 56 14878 11 1530 67 16408
Connectivity to Storm water drainage
Fully 45 12820 6 674 51 13494 82%
Partially 7 1319 4 804 11 2123 13%
Not Connected 4 739 1 52 5 791 5%
Total 56 14878 11 1530 67 16408
Drainage and Sewerage Facility
Access to storm water drainage 54 5647 11 1060 65 6707 27%
Access to underground
drainage/sewer line 53 5367 11 973 64 6340 25%
Access to digester 47 2647 11 698 58 3345 13%
Not connected to sewer or
digester 56 8226 11 436 67 8662 35%
Total 210 21887 44 3167 254 25054
Latrine Facilities
Public/Community latrine-Septic
tank/flush 44 4765 9 294 53 5059 31%
Public/ Community latrine-
Service latrine 0 0 0 0 0 0 0%
Public/ Community latrine-Pit 32 741 5 67 37 808 5%
Shared latrine -Septic tank/flush/ 42 353 8 36 50 389 2%
Shared latrine- Service latrine 0 0 0 0 0 0 0%
Shared latrine-Pit 43 1264 9 193 52 1457 9%
Own latrine -Septic tank/flush/ 56 4893 10 695 66 5588 34%
Own latrine- Service latrine 0 0 0 0 0 0 0%
Own Latrine-Pit 52 1168 9 137 61 1305 8%
Open Defecation 27 1694 6 108 33 1802 11%
Total 296 14878 56 1530 352 16408
Source: AKM data
Of 67 slums, 94% of households are connected while 6% are not connected to city wide
sewerage system.
With regards to storm water drainage, 95% of households are connected and 5% of the slums
are not connected to city wide system.
For drainage and sewerage facility, 27% of households have Underground drainage / Sewer
lines and 25% have storm water drainage system. 13% of households are provided with

RAY SLUM FREE CITY PLANNING BELLARY
71
Regional Centre for Urban and Environmental studies
digester system. Hence there is a deficiency in overall sewerage and storm water drainage
system which needs to be upgraded to a more complete as well as sustainable underground
drainage system.
35% of the total slum households has neither digester nor sewer lines.
11% do not have proper individual toilet systems in their houses hence resulting in open
defecation.
Solid waste management
Table 2- 10: Solid waste management details
Notified Slums Non Notified
Slums Total % HH's of
total
Households No of
slums
No of
HH's
No of
slums
No of
HH's
No of
slums
No of
HH's
Arrangement of Garbage Disposal
Municipal Staff 28 8113 7 909 35 9022 55%
Municipal Contractor 15 3426 4 621 19 4047 25%
Residents themselves 1 174 0 0 1 174 1%
Others 12 3165 0 0 12 3165 19%
No Arrangements 0 0 0 0 0 0 0%
Total 56 14878 11 1530 67 16408
Frequency of Garbage Disposal
Daily 20 5936 10 1404 30 7340 45%
Once in 2 days 25 6974 1 126 26 7100 43%
Once in a week 11 1968 0 0 11 1968 12%
Once in 15 days 0 0 0 0 0 0 0%
Not Collected 0 0 0 0 0 0 0%
Total 56 14878 11 1530 67 16408
Frequency of clearance of open drains
Daily 9 2935 0 0 9 2935 17.2%
Once in 2 days 29 8347 9 1135 38 9482 58%
Once in a week 17 3464 2 395 19 3859 24%
Once in 15 days 1 132 0 0 1 132 0.8%
Not Collected 0 0 0 0 0 0 0%
Total 56 14878 11 1530 67 16408
Source: AKM data31286
19% of households lack in arrangement for regular garbage collection. In areas where there is
lack of solid waste disposal or collection, the arrangement is taken care by the slum dwellers,
constituting 1% of the total.
12% of slum households are not adequately covered with solid waste disposal.
24% of slum households lack in frequent clearance of open drains, further deterioration of
environmental conditions and there by contaminating the ground water quality.

RAY SLUM FREE CITY PLANNING BELLARY
72
Regional Centre for Urban and Environmental studies
Roads and street lighting
Table 2- 11: Roads and Street lights details
Notified Slums Non Notified
Slums Total % HH's of
total
Households No of
slums
No of
HH's
No of
slums
No of
HH's
No of
slums
No of
HH's
Approach Road/Lane/Constructed Path to the slum
Motorable Pucca 9 2690 6 1144 15 3834 23%
Motorable Katcha 23 6157 4 286 27 6443 39%
Non Motorable Pucca 24 6031 0 0 24 6031 37%
Non Motorable Katcha 0 0 1 100 1 100 1%
Total 56 14878 11 1530 67 16408
Internal Road
Motorable Pucca 5 1687 2 228 7 1915 12%
Motorable Katcha 21 5296 8 1250 29 6546 40%
Non Motorable Pucca 29 7820 1 52 30 7872 48%
Non Motorable Katcha 1 75 0 0 1 75 0%
Total 56 14878 11 1530 67 16408
Distance from Nearest Motorable Road
Less than 0.5 Km 17 3602 9 1154 26 4756 29%
0.5-1 Km 27 8400 2 376 29 8776 53%
1-2 Km 12 2876 0 0 12 2876 18%
2-5Km 0 0 0 0 0 0 0%
>5 Km 0 0 0 0 0 0 0%
Total 56 14878 11 1530 67 16408
Availability of Street Light
Yes 56 14878 11 1530 67 16408 100%
Source: AKM data
23% of slums have Motorable pucca roads and 39% with Motorable katcha roads; 37% of
households have non Motorable approach roads, which need to be upgraded.
48% of slums are lack in proper internal roads with BT surface.
In case of street lighting facility, all slums have street lights and Yet they are not in good
condition and not sufficient as per the requirement, hence Street lights are essential to prevent
any kind of accidents and other inconveniences.

RAY SLUM FREE CITY PLANNING BELLARY
73
Regional Centre for Urban and Environmental studies
Slum Deficiency matrix and Development Options
With reference to process for generating deficiency matrix in Chapter -2 and based on the
data analysis, 67 slums in Bellary City have been categorized based on housing condition and the
infrastructure levels. As a result, the existing condition is assessed in the following way:
• Good housing with good infrastructure
• Good housing with bad infrastructure
• Bad housing with good infrastructure
• Bad housing with bad infrastructure
Given in RAY guidelines, settlements without any security of tenure are most vulnerable and
therefore should be given priority in selection for improvement / Up gradation. In addition,
settlements with bad housing and infrastructure should also be the priority for selecting appropriate
mode of development options.
As mentioned earlier, to obtain the above result, it is necessary to evaluate each parameter
using the following criterions;
Water supply
Score 1- 60% or more of household have individual connection and
Score 2- Less than 60% of households having individual connections.
Drainage4
Score 1- 60% or more in-slum drains are covered and / or Pucca drains
Score 2- Less than 60% in-slums drains are covered and/or Pucca drains
Solid waste management
Score 1- Every day/alternate removal
Score 2- Removal of waste in frequent/once in fifteen days
Sanitation
Score 1- 60% or more having individual toilet unit (with toilet seats)
Score 2- Less than 60% use individual toilets
Roads5
Score 1: 60% or more of the in-slum roads have a min of 3 m width
Score 2: Less than 60% of the in-slum roads are of 3 m width.
Once the individual scores are obtained, a total score is stipulated and if the overall score of
the infrastructure is less than 7, it is considered good infrastructure and greater than 7 is bad
infrastructure. Based on which 38 slums were found to be having better infrastructure levels while 29
slums had lower levels of infrastructure, needing further improvement. Similarly for housing, it is
assessed by considering:
Similarly for housing, it is assessed by using the following variables:
Structural condition
Score 1: semi pucca + katcha houses < 60%
Score 2: semi pucca + katcha houses > 60%
4 Running length of existing Sewer lines is not available. 5 Since data for current width of roads are not available; condition of roads is taken into account.

RAY SLUM FREE CITY PLANNING BELLARY
74
Regional Centre for Urban and Environmental studies
Age of the slum
Density for housing Units
Score 1: 60% or more houses having > or equal to 3 Sq.m per person
Score 2: Less than 60% houses having > or equal to 3 Sq.m per person
Tenure status of the land - secured and in-secured
o Score1: For secured status
- Registered (including ownership, leasehold and use/occupancy rights)
- Unregistered but documented (e.g. rental, rent to buy, unregistered leases, etc)
- Group/family/household rights Unregistered & undocumented
o Score 2: For Unsecured status
- Documented (e.g. written agreements between irregular owners and tenants, de
facto recognition, illegal subdivisions, customary rights, tenancy at will, etc)
- Undocumented
The following table 2-12 presents the tenure status with reference to housing and infrastructure
conditions: Table 2- 12: Slum deficiency and vulnerability matrix
Secure Tenure Non - Secure
% of Security 85% 15%
Status of tenure No of slums
Secure tenure
Good housing Good infrastructure 9
Good housing Bad infrastructure 1
Bad housing Good infrastructure 36
Bad housing Bad infrastructure 11
Non - Secure tenure
Good housing Good infrastructure 1
Good housing Bad infrastructure 0
Bad housing Good infrastructure 6
Bad housing Bad infrastructure 3
Source: Guidelines for preparation of slum free plan of action-2011
As seen above, 85% of the slums are secured and the remaining 15 % is not secured. Fewer
than 15% of the good housing and infrastructure, (90% of the secured slums and 10% of the in-
secured slums) are found to be having good levels of both housing and infrastructure. On the other
hand, 21% of the slums (78% under secured and 22% in-secured) are found to be having bad housing
and poor infrastructure. Hence, those slums with bad housing and bad infrastructure as well as in-
secured are considered as a priority for redevelopment model.
In addition to the above characteristics additional parameters such as land ownership, housing
densities and land values has been consider to evaluate development option for each slums. Based on
data findings, it is observed that only for 1 slum the current land tenure status is secured with good
housing and infrastructure however the ground reality shows that these slums still requires Up-
gradation of existing housing and infrastructure.
For more details, Please refer Annexure-2D for slum wise evaluation index and choice of
development modes.

RAY SLUM FREE CITY PLANNING BELLARY
75
Regional Centre for Urban and Environmental studies
b. Physical requirements for Housing
As seen in earlier section, the variables of tenure status, tenability, density, housing type,
housing condition and age of the structure has been considered to calculate the housing deficiency. To
determine the mode of development for the identified slums based on their deficiencies, it was
decided to use the following criterions has been taken into account:
Relocation of slums
Physical location of slums - along nallah and on hazardous sites
Flood prone – water logging for a month or more
Land ownership under local bodies; earmarked land use zones in master plan
Slums in close proximity to High Transmission lines such as 220 KV
In-situ
Semi pucca and katcha houses greater than 75%
Up-gradation of slums
Semi pucca and katcha houses less than 75%
Table 2- 13: Housing requirements
Mode of
development Hazardous
Non-Hazardous
Semi-Pucca + Katcha
houses > 75%
Semi-Pucca + Katcha
houses < 75%
Relocation In – Situ Up-Gradation
No. of Slums 0 21 46
No. Households 0 4661 5174
Housing Deficit 9835
From the Table 2-13, it was identified that there is a housing deficit of 9835households in 67
slums. From development point of view, 21 slums are found to be having semi pucca and katcha
houses greater than 75%, hence considered for In-Situ development while 46 slums with semi pucca
and katcha houses less than 75% for slum up gradation. As per the data findings, 21 slums were found
to be hazardous in nature hence considered for In-Situ mode of development; and 45 slums for slum
Upgradation.

RAY SLUM FREE CITY PLANNING BELLARY
76
Regional Centre for Urban and Environmental studies
Map 2- 5: Mode of development in slums

RAY SLUM FREE CITY PLANNING BELLARY
77
Regional Centre for Urban and Environmental studies
c. Physical requirements for Infrastructure
With reference to RAY and UDPFI guidelines, additional requirement for the existing slums
have been calculated for each element where the following assumptions were made in terms of:
Water supply
For sub line running length, 98% of the total internal roads were considered
Raising main length = total households x 3m (In – Situ )
Raising main length = Proposed taps x 3m (Up gradation )
Proposed number of taps = total households - Existing taps
For every 2500 population, an overhead tank of capacity 1 lakh litre
Sanitation
Additional length of underground sewer lines and Storm water drainage line=80% of the total
road length
Proposed toilets = Total households- Existing individual toilets (Up gradation)
Solid waste management
For every 30 households = 1 garbage bin
Street lighting
For every 30 m = 1 street light/light pole
Roads
Approach road = 2% of the total road length with a width of 4.5 m
Internal roads = 98% of the total road length with a width of 3 m
The following tables 2- 14 and 2- 15 presents the proposed requirements for each element of the
physical and social infrastructure that needs to be implemented.
Table 2- 14: Physical Infrastructure requirements
Sl. No Sector Unit Proposed
1
Water Supply
System
Running length of sub line (KM) 46.70
Raising Main (KM) 31.82
No. of individual taps 8785
Overhead water tanks 22
2
Sanitation
Length of Underground Drainage/Sewer
Lines (KM)
69.41
Length of storm water Drainage Lines (KM) 30.26
No. of individual toilets 6390
3 Solid waste
management
No. of Bins 323
4 Roads
Total length of Approach roads in Kms 1.53
Total length of Internal roads in Kms 69.43
5 Street Lighting No. street lights 1995
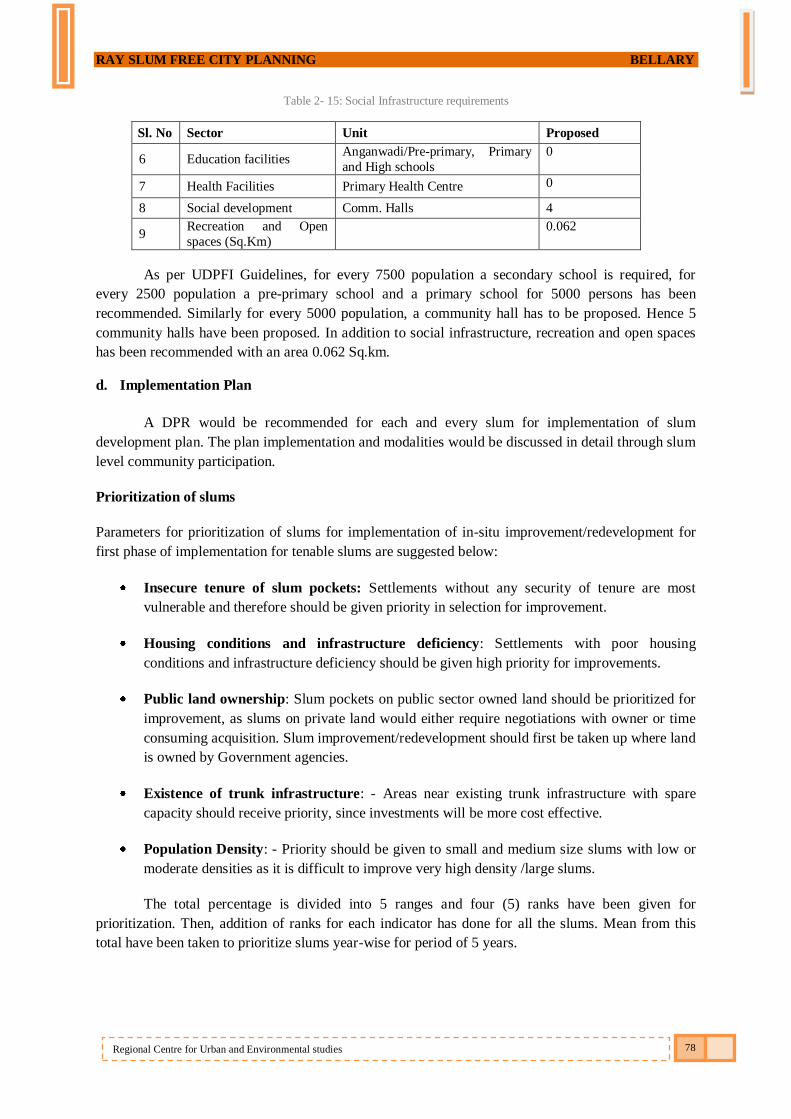
RAY SLUM FREE CITY PLANNING BELLARY
78
Regional Centre for Urban and Environmental studies
Table 2- 15: Social Infrastructure requirements
Sl. No Sector Unit Proposed
6 Education facilities Anganwadi/Pre-primary, Primary
and High schools
0
7 Health Facilities Primary Health Centre 0
8 Social development Comm. Halls 4
9 Recreation and Open
spaces (Sq.Km)
0.062
As per UDPFI Guidelines, for every 7500 population a secondary school is required, for
every 2500 population a pre-primary school and a primary school for 5000 persons has been
recommended. Similarly for every 5000 population, a community hall has to be proposed. Hence 5
community halls have been proposed. In addition to social infrastructure, recreation and open spaces
has been recommended with an area 0.062 Sq.km.
d. Implementation Plan
A DPR would be recommended for each and every slum for implementation of slum
development plan. The plan implementation and modalities would be discussed in detail through slum
level community participation.
Prioritization of slums
Parameters for prioritization of slums for implementation of in-situ improvement/redevelopment for
first phase of implementation for tenable slums are suggested below:
Insecure tenure of slum pockets: Settlements without any security of tenure are most
vulnerable and therefore should be given priority in selection for improvement.
Housing conditions and infrastructure deficiency: Settlements with poor housing
conditions and infrastructure deficiency should be given high priority for improvements.
Public land ownership: Slum pockets on public sector owned land should be prioritized for
improvement, as slums on private land would either require negotiations with owner or time
consuming acquisition. Slum improvement/redevelopment should first be taken up where land
is owned by Government agencies.
Existence of trunk infrastructure: - Areas near existing trunk infrastructure with spare
capacity should receive priority, since investments will be more cost effective.
Population Density: - Priority should be given to small and medium size slums with low or
moderate densities as it is difficult to improve very high density /large slums.
The total percentage is divided into 5 ranges and four (5) ranks have been given for
prioritization. Then, addition of ranks for each indicator has done for all the slums. Mean from this
total have been taken to prioritize slums year-wise for period of 5 years.

RAY SLUM FREE CITY PLANNING BELLARY
79
Regional Centre for Urban and Environmental studies
All the slums in the ULB are proposed to be covered under RAY in the phased manner
indicated in the Table 2 - 16. As mentioned above, three different mode of development has been
chosen to improve the existing slum conditions as well prevent future growth of the same. The
following gives a brief these modes and its characteristics:
Relocation
Depending on the location and where there is no alternative
Involves communities in identification of alternative sites
Ensures that education, health, transport, basic services and infrastructure and provided before
relocation
In situ
Involves redevelopment of whole site to provide more living space and improved
environmental conditions such as those in high density areas.
Provision of transit accommodation and including of all residents, especially the extremely
poor critical to success
Slum Up gradation
Involves a mixture of provision or upgrading of service and infrastructure levels, incremental
housing improvements or selective replacement of katcha houses
The following table 2-16 gives a brief picture of the year wise phasing of development that needs to
be taken up to improve the living conditions of the already existing slums for the next 5 years
Table 2- 16: Slums to be covered under RAY from 2012 – 2017
Source: Guidelines for preparation of slum free plan of action-2011
Year of Development Period No of the Slums Mode of Development
I 2012-13
0 Relocation
6 In - Situ Development
4 Up gradation
Total 10
II 2013-14
0 Relocation
4 In - Situ Development
13 Up gradation
Total 17
III 2014-15
0 Relocation
4 In - Situ Development
16 Up gradation
Total 20
IV 2015-16
0 Relocation
6 In - Situ Development
10 Up gradation
Total 16
V 2016-17
0 Relocation
1 In - Situ Development
3 Up gradation
Total 4
Total 5 Years 67

RAY SLUM FREE CITY PLANNING BELLARY
80
Regional Centre for Urban and Environmental studies
Under Private
In situ redevelopment + Incentive FSI or TDR
In-situ improvement/Upgradation with but with consent of the owner and purchase of
property rights by the occupants TDR to owner
In situ with land sharing
In situ development + Incentive FSI or TDR
Under State Govt. and Urban local body
In situ redevelopment with densification
In situ redevelopment with densification and credit support to households
In situ redevelopment by public agency and credit support /TDR
In situ redevelopment by public agency/PPP
Redevelopment by group housing with densification including remunerative use of land
Proposed Housing
To make Bellary a slum free city, there is a need to redevelop housing for 9858 households as
estimated. Based on the physical location, ULB land ownership and surrounding land use, two slums
have been chosen to replicate the future development and improved livelihood in terms of housing
layout shown with all services. The layouts developed are in accordance with byelaws, JNNURM
standards and facilitated with infrastructure services. According to Norms and Standards of Municipal
Basic Services in India given by Jawaharlal Nehru National Urban Renewal Mission (JNNURM) for
Housing, each flat has a plinth area of 330.60 square feet including common area.
Proposed Layout
All proposed housing units will be are facilitated with a living room, a bedroom, kitchen and
toilet with total covered area with provision of 8 nos. houses has been kept on each floor to minimize
the common area. The proposed structure would consist of ground +1, with 15% ground coverage and
a proposed density of 100 dwelling units per acre.
The following table and plan provides brief specification of a single unit:
Item Dimension
Living room 11.63 Sq.m
Bed room 7.68 Sq. m
Kitchen 3.4 Sq.m
Bath 1.85 Sq.m
W.C 0.9 Sq.m
Passage in front of Bath & W.C 0.68 Sq.m
Total area 26.14 Sq. m

RAY SLUM FREE CITY PLANNING BELLARY
81
Regional Centre for Urban and Environmental studies
Infrastructure
Provision for individual sump tank, over head LDPE tanks and pumps with all accessories
will be made available to each of the building blocks for water supply arrangement.
Construction
The type of construction will vary with several factors like soil conditions, local requirements
and cost of the land. Generally in the smaller towns, which basically have rural culture, multistoried
buildings are not acceptable but with circumstances, G+3 has been proposed for slums where ever
required. The type of housing would generally be small but independent houses/ combined houses
with some free space around the houses. Given the occupation status of the slum households, some of
them might have push carts or some of them may use this space for cottage industries or vegetable
gardening.
Structure wise, a permanent housing unit with a plinth area of 330.60 Square feet will be
constructed. The walls shall be built with solid concrete blocks and slabs shall be RCC. Ready mixed
concrete shall be used in all RCC elements of the building for quality assurance and providing a
smooth finish to the surface requiring less finishing.
The specifications and plan of single block are as follows:
Description Unit
Area of Block 2670.40 sq. ft.
No.of Dwelling Units per block 6
Corridor width 7 Ft
Stair case 45 Sq.Ft
Area of layout 3.5 Ha
No of Blocks 46
No of Dwelling units (46*18) = 828
Picture 2- 4: Proposed layout for a single block

RAY SLUM FREE CITY PLANNING BELLARY
82
Regional Centre for Urban and Environmental studies
e. Modalities / Approach
A gap is sometimes called "the space between where we are and where we want to be." A gap
analysis helps bridge that space by highlighting which requirements are being met and which are not.
The tool provides a foundation for measuring the investment of time, money and human resources
that's required to achieve a particular outcome.
Chart 2- 6: Modalities & Approach
Map 2- 6: Model layout

RAY SLUM FREE CITY PLANNING BELLARY
83
Regional Centre for Urban and Environmental studies
Slum Up-gradation / Redevelopment Options
With spatial analysis and situation assessment done as above, a participative process will need to be
undertaken with slum communities with assistance from NGOs/CBOs active in the area of slum
housing/ redevelopment to identify the possible development options. The table 2-16 provides an
indicative list of alternative development options and implementation modalities. The dialogue for
choice of the model will also explore the possibilities of relocating slum households from high
density/untenable slums to low-density tenable slums within the same zone. The following physical
development options are possible
i. Slum Improvement: Extending infrastructure in the slums where residents have themselves
constructed incremental housing.
ii. Slum Up gradation: Extending infrastructure in the slums along with facilitation of housing unit
up gradation, to support incremental housing.
iii. Slum Redevelopment: In-situ redevelopment of the entire slum after demolition of the existing
built structures
iv. Slum Resettlement: In case of untenable slums to be rehabilitated on alternative site
Potential for Private Sector Participation
Private sector participation can be envisaged in redevelopment of slums where reasonable
returns are expected for the investor. In order to assess the potential for PPP, ULB will need to map
and tabulate land values in immediate environs of all slum pockets.
Outputs of the Slum Redevelopment Plans
Development options and cost of each option for different categories of slums, which are to be
proposed and vetted by community.
Identification of options for development model proposed for each slum.
Selection of development model for the slums to be followed by project development in
consultation with the communities
Identification of resettlement pockets
Identification of slums to be densified
Creation of vacant land,
Identification of TDR loading corridors
Integrated infrastructure planning including the identification of trunk infrastructure
alignments and capacities(existing & proposed)
In relation to slum pockets
Analysis of slums with low densities to assess slum pockets with possibility of densification to
rehabilitate households from other slum pockets and creating vacant land pockets
Exploring relocating possibility of untenable slums in nearby (within the zone) vacant pockets/
existing low density slum keeping their relation to employment centers
Outputs
Development Options for different categories of slums
Implementation Structure.

RAY SLUM FREE CITY PLANNING BELLARY
84
Regional Centre for Urban and Environmental studies
2.4. Investment Requirements
Accurate assessment of investment requirements and devising a suitable financing strategy
are the key components for any sustainable slum rehabilitation program. It is of vital importance that implementing bodies recognize and measure the various costs of developing infrastructure and
housing, including the costs for subsequent maintenance of the same. The success of the slum
rehabilitation program would depend on matching the investment needs with the vibrancy/buoyancy
of the various elements of the proposed finances. The following section describes the costs projected for various sectors from 2012-2017.
a. Housing
Based on the mode of development, the slums in view of housing condition, and physical
location, has been categorized accordingly. The following table 2 -17 presents the required cost for
each type of development for the identified slums.
Table 2- 17: Investment requirements for Housing (in INR/ Lakhs)
Hazardous Non-Hazardous
Semi-Pucca + Katcha
houses More than 75%
Semi-Pucca + Katcha houses
Less than 75%
Mode of development Relocation In – Situ Up-Gradation
No. of Slums 0 26 46
No. Households 0 4661 5174
Housing Deficit 9835
Cost(Lakhs) 0.00 14714.43 11399.80
Total Cost(lakhs) 26114.23
As illustrated in table 2-17, 56% of the total estimated costs is allocated for In situ mode of development while 44% for slum up-gradation in Bellary City. For calculation purpose, costing per
unit @ 2.9 lakh per house has been taken for katcha houses and @ 1.45 lakhs per house for Semi-
pucca houses have been taken into view for the first year. Additionally for a duration of 5 years, an increase of 5% in the costs has been assumed with due consideration to changing market rate.
b. Infrastructure
This section covers the existing physical and social infrastructure and also the requirements for the same in all slums of the ULB including perspective plan for 5 years. Taking into account the
additional requirement as mentioned in tables 2-12 and 2-13, the costing has been calculated for each
sector shown in table 2-18.
Table 2- 18: Investment requirements for Infrastructure (in INR/ Lakhs)
S. No Sector Sector / Unit Cost for 2012-17 (Rs. In Lakhs)
Physical Infrastructure
1
Water Supply
System
Running length of sub line (KM) 184.53
Raising Main (KM) 60.49
No. of individual taps 0
Overhead water tanks 365.83
Sub Total 610.85
2
Sanitation
Length of Underground Sewer Line(KM) 1095.39
Length of storm water Drainage Lines (KM) 478.06
No. of individual toilets 769.76
Sub Total 2343.21
3 Solid waste
management
No. of Bins 28.32
Sub Total 28.32
4 Roads Length of main roads in Kms(Proposed) 79.12

RAY SLUM FREE CITY PLANNING BELLARY
85
Regional Centre for Urban and Environmental studies
Length of internal roads in Kms (Proposed) 1772.89
Sub Total 1852.01
5 Street Lighting No. street lights 241.23
Sub Total 241.23
Total Physical Infrastructure 5075.62
Social Infrastructure
6 Education
facilities
Anganwadi/Pre-primary schools 0.00
Primary school 0.00
High school 0.00
Sub Total 0.00
7 Health
Facilities
Primary Health Centre 0.00
Maternity Centre 0.00
Sub Total 0.00
8 Social
development
Comm. Halls 20.70
Recreation and Open spaces (sq Kms) 177.55
Sub total 198.24
Total Social Infrastructure 198.24
Grand total Cost (Physical + Social ) Infrastructure 5273.86
From the table 2-18, it is observed that total cost estimates for physical and social
infrastructure is Rs. 52.74 Crores where physical infrastructure is estimated for Rs.50.75 Crores and
for social infrastructure it is around Rs.1.98 Crores.
The following table 2 -19 presents sector wise cost estimated for five years (2012-17) by
taking into consideration the cost calculated for the additional provisions/requirements, mentioned in
earlier section:
Table 2- 19: Sector Wise Estimated Cost (In INR / Lakhs)
Sector
Estimated
Cost for
2012-13
Estimated
Cost for
2013-14
Estimated
Cost for
2014-15
Estimated
Cost for
2015-16
Estimated
Cost for
2016-17
Total Project
Cost for 5 years
(Rs. In INR /
lakhs)
Housing 4012.15 5783.98 7695.78 7467.90 1154.43 26114.23
Water Supply 34.79 147.97 215.12 181.59 31.39 610.85
Sanitation 236.96 580.20 851.30 521.37 153.38 2343.21
Solid waste management 2.80 6.80 10.05 7.59 1.07 28.31
Roads 158.8 387.03 657.32 525.46 123.38 1851.99
Street Lighting 18.81 67.57 72.52 67.49 14.84 241.23
Education 0.00 0.00 0.00 0.00 0.00 0.00
Health 0.00 0.00 0.00 0.00 0.00 0.00
Social development 23.01 46.10 69.61 48.16 11.37 198.24
Others 668.34 1040.59 1417.02 1309.42 220.12 4655.49
Grand Total 5155.66 8060.24 10988.72 10128.98 1709.98 36043.58
As seen above, the total cost projected for 5 years is Rs. 360.44 crores, in which 72% is
allocated for housing with top priority; 14% for physical infrastructure and 1% for social
infrastructure. Among physical infrastructure elements, due priority is given for sanitation for the next
5 years followed by roads. The above cost includes additional financing costs such as the
rehabilitation costs, DPR, O& M, pre construction and others.

RAY SLUM FREE CITY PLANNING BELLARY
86
Regional Centre for Urban and Environmental studies
In the first year of development, 6 slums (963 housing deficit) have been tentatively proposed
for in-situ development with estimated cost of Rs. 35.16 crores and 4 slums (598 housing deficit)
proposed for Up gradation with estimated cost of Rs. 16.53 crores, on the lands belonging to the State
Government, Local body, Private construction of 1561 houses with required infrastructure.
c. Operation & maintenance
In general, operation and maintenance costs form a sizeable share of a slum redevelopment
budget. In case of Bellary slums, O& M costs makes up 13% of the total estimated cost for each year.
The following list of related costs that will be incurred during the implementation of a slum
rehabilitation/redevelopment includes:
Pre cost Construction (1% of Housing)
Temporary accommodation (5%)
A& OE (2.5%)
O&M (2.5%)
DPR (1%)
Project Implementation (1%)
Capacity Building (1%)
Offsite cost (1%)
Table 2- 20: Estimated Operation and Maintenance Cost (In INR / Lakhs)
Year Wise
Tempora
ry
accommo
dation
A & OE
(Acquired
&
operating
expenses)
O & M
DPR
Prep. ,
IEC
Project
prepara
tion
Capacit
y
building
Offset
costing
Pre cost
construc
tion
Annual
Estimated
O&M (In
INR /Lakhs)
Ist Year
224.37 112.18 112.18 44.87 44.87 44.87 44.87 40.12 668.35
IInd
Year 350.98 175.49 175.49 70.20 70.20 70.20 70.20 57.84 1040.59
IIIrd
Year 478.59 239.30 239.30 95.72 95.72 95.72 95.72 76.96 1417.03
IVth
Year 440.98 220.48 220.48 88.20 88.20 88.20 88.20 74.67 1309.41
Vth
Year 74.49 37.25 37.25 14.90 14.90 14.90 14.90 11.54 220.13
Grand
Total
1569.41 784.7 784.7 313.89 313.89 313.89 313.89 261.13 4655.5
Depending upon the mode of development, the operation and maintenance costs will vary for
the slums. Seen in table 2-20, the O & M cost catering to the housing and infrastructure investment
requirements as set out earlier includes 8 sectors where 46.55 crores has been estimated for a period
of 5 years. Of the total estimated costs, 34% is allocated for temporary accommodation for slum
dwellers and 17% for acquiring and operation expenses. Moreover, the initial costs such as
preparation of project, DPR and pre construction expenses alone constitute 19%.

RAY SLUM FREE CITY PLANNING BELLARY
87
Regional Centre for Urban and Environmental studies
2.5. Capacity Building
Through the medium of ULB and community organizations, SJSRY Schemes will be
integrated with MoHUPA.
a. Slum dwellers
Slum dwellers also act as stakeholders in planning for slums as they understand the slums,
strategies implemented in those slums and future requirements. Hence they should be trained in
developing their respective slums; otherwise the aims of SJSRY will not be fulfilled.
b. Intermediaries
CO’s, CBO’s and community volunteers are the Intermediary stakeholders to train the
trainer‟s. Capacity building for them is convincing & managing the slum association to accept
proposals. Training and adequate guidance to the CBO‟s and the community volunteers can be
organized by the concerned cells/agencies/lead NGO to build common understanding on their role and
purpose of data collection for the SFCP. The capacity building activities can also be undertaken by the
National Network Resource Centre‟s (NNRCs), empanelled by the Mo/HUPA.
It is expected that the SFCPoA is prepared with active participation of community during the
planning process. To enable the same suitable structures (cooperatives/ societies) might need to be
formed, where necessary. The communities would need to demonstrate willingness to adopt the
implementation option, plan for livelihood/ economic activities within the slum. Communities are also
expected to assist in generating the beneficiary contribution.
c. Government stakeholders
Being the main sponsor of the RAY scheme, ULB would prepare the SFCPoA as a first step
to clearly articulate the action plan for making the city “slum free”. During the preparation of Slum
Free City Plan of Action, ULB would continuously consult with the community in the planning
process. During the process, ULB would categorize and prioritize for rehabilitation/ redevelopment,
and would provide/ facilitate provision of infrastructure. ULB, in consultation with the community,
will also allot dwelling units and enable provision of the legal titles to the beneficiaries.

RAY SLUM FREE CITY PLANNING BELLARY
88
Regional Centre for Urban and Environmental studies
Section – III -Slum Prevention Strategy

RAY SLUM FREE CITY PLANNING BELLARY
89
Regional Centre for Urban and Environmental studies
CCHHAAPPTTEERR 33 -- SSLLUUMM PPRREEVVEENNTTIIOONN SSTTRRAATTEEGGYY
Strategy for prevention of slums in future will include prevention of encroachments and
illegal structures and further supply of affordable housing on the other. The plan of action should
encompass proposed action to be undertaken by the city to commensurate the lands and promote the
construction of affordable housing in consonance with the housing demand. City-wide policies for
slum prevention should include:
Inventory of Vacant and underutilized lands through GIS mapping
Assessment of Housing demand for current slum population and future using Master Plan
estimated values
Formulation of demand side as well as supply housing strategies through exploration for various
development options such as PPP model, direct subsidies and incentives
Land Reservation/Land pooling
• Reservation of 20-25% of developed land for EWS/LIG housing
• Land assembly mechanisms and policy obstacles to land supply
• Ensure continuous supply of developed land for EWS/LIG housing
Allocation of land to various organizations
• In new cases where land is allotted to various organizations or institutions by the government
for development of work space, or industries, or institutions etc., there shall be reservation of
land for economically weaker sections and low income groups of persons in respect of all
municipalities, municipal corporations and urban development authorities.
• In respect of land where it has already been allotted, the unutilized portion may be reserved
for economically weaker sections
New Housing
• Availability of public owned vacant lands
• Incentives provided to private sector
• Availability of housing finance to be ensured for low income groups through public agencies
and retail finance.
Rental
• Decide eligibility of tenants
• Standards for rental housing
• Decide for rental housing policy for rents, modalities for allotment, evictions
• Mechanisms for maintenance and management
• Incentives for rental housing

RAY SLUM FREE CITY PLANNING BELLARY
90
Regional Centre for Urban and Environmental studies
3.1. Housing Stock Assessment
a. Population Projections
Population projection is important and basic requirement for the provision of basic services to
the people. It is also required to plan for service provision and revenue realization from the users in a
city, which is the direct function of the population and population growth. Given the fact that Bellary
being a tourist attraction and one of the oldest inhabited cities, an increase of the population at 1%
growth rate is taken into consideration to forecast the population from 2012-17.
Table 3- 1: Projected population for 5 years
At the end of five years, a total population of 86,039 is estimated for 67 slums in Bellary City.
b. Household requirements
Table 3- 2: Housing requirement for 5 years
Similar to estimated population in slums, the additional requirement of households in the
slums has been projected for a 5 year period assuming a growth rate of 1%. Assuming that the growth
rate would be constant for every year, an increase of 833 households has been projected for five years
(seen in table 3-2).
Population projection
Year Projected population Projected population
2012-2013 816 82691
2013-2014 825 83516
2014-2015 833 84349
2015-2016 841 85190
2016-2017 849 86039
Total 4164 -------
Projection
Year Households
2012-2013 163
2013-2014 165
2014-2015 167
2015-2016 168
2016-2017 170
Total 833

RAY SLUM FREE CITY PLANNING BELLARY
91
Regional Centre for Urban and Environmental studies
c. Infrastructure requirements
Using the model layout costs for proposed infrastructure elements has been calculated. The
proposed dwelling units are 833 which indicate 1 model layouts are required for future demand.
Hence the infrastructure requirement is indicated in the table 3-3:
Table 3- 3: Infrastructure requirement for slum prevention from 2012-2017
Sl. No Sector Unit Requirement for
Slum prevention
Physical Infrastructure
1 Water Supply
System
Running length of sub line (KM) 12.29
Raising Main (KM) 2
No. of individual taps 833
Overhead water tanks 2
2 Sanitation
Length of Underground Drainage
/Sewer Lines (KM) 10.24
Length of storm water Drainage
Lines (KM) 10.24
No. of individual toilets 0
3 Solid waste management
NO. of Bins 28
4 Roads
Total length of Approach roads
(4.5 mts wide ) 0.25
Total length of Internal roads
(3.0 mts wide) 12.54
5 Street Lighting No. street lights 426
Social Infrastructure
6 Education
facilities
Pre-primary schools 2
Primary school 1
Secondary school 1
7 Health Facilities Primary Health Centers 0
Maternity Centre 0
8
Social and
community
utilities
Community rooms 1
Comm. Halls 0
Parks & Play grounds (Sq. KM) 0.0032
d. Land requirements
Land requirement is estimated as per the spatial analysis of slums in the city. The location of
high density slums is identified, city is divided into zones and land requirement for each zone is
indicated for accommodating future population.

RAY SLUM FREE CITY PLANNING BELLARY
92
Regional Centre for Urban and Environmental studies
3.2. Implementation Plan
a. Options for Generating Stock
Public Private Partnership
The rationale behind creating public-private partnerships is that the private sector typically has
access to upfront capital and a track record of delivering products efficiently, while the public
sector/state/central Govt. controls the regulating environment and, occasionally, crucial resources
needed to implement a project, such as land. The proposed layout plan is an alternative to develop the
3 slums, however it has to be approved by MCC & get community consensus from the residents. The
layouts are subjected to change with respect to the inputs / insights provided by MCC & Stakeholders.
The following illustrates three different slums chosen for PPP model wherein the housing type with
infrastructure has been proposed.
KORACHEGERI BANDIMOT AREA
Korachegeri Bandimot Area is one among the 44 slums located in the Core area of Bellary City.
It has a total population of 725 with 126 households and an area of 17766.05 Sq.m. Under the
ownership of Bellary City Corporation, Korachegeri Bandimot Area slum is located in the Core area
and surrounded by residential use. Of the 126 houses, 38% are semi pucca and 54% are katcha in
nature. As far as water supply is concerned, 67% of the slum is not covered. Due to lack of well built
housing structures and inadequate physical infrastructure, there is a need to improve the living
conditions in Korachegeri Bandimot Area slum.
PROPOSALS
Based on the above information, in situ mode of development has been recommended to make
the areas habitable and for provision of tenure rights to the slum dwellers. As part of in situ
development, 132 dwelling units have been proposed with each unit of area 331.50 Sq.ft and
comprises of living room, single bedroom, a kitchen and toilet .The following gives a description of a
single housing unit:
Description Dimensions (Feet)
Bed room 9.0 x9.0
Living 8.0 x 17.0
Toilet 6.0x5.0
Kitchen 7.0x5.6
Balcony 6.6x7.5
Total area of
Dwelling unit
331.50 (Sq.ft)
Specifications for Doors & Windows in a single Dwelling unit:
Description Dimensions (Feet)
Doors D 1 3.11 x 6.5
D2 3.30x 6.5
Windows 3.3x4.11
ventilators 1.12x4.11

RAY SLUM FREE CITY PLANNING BELLARY
93
Regional Centre for Urban and Environmental studies
Housing plan:
Per block 12 dwelling units (DU) has been proposed with a total area of 2636.10 sq. ft. A total of
11 blocks has been proposed preferred floors to be G+1 for each. The specifications and plan of a
single block has been shown below:
Area of Block – 2636.10 sq ft.
No. of Dwelling Units – 6 per Floor ,Total 12 units
Corridor
Stair case
BLOCK CONSTRUCTION SPECIFICATIONS:
S.No Description Units
1 Earth Work Excavation for RCC footing 3.28‟ depth
2 CC 1:4:8 for footing 4‟‟ thick
3 VRCC footing M20 5‟X5‟X12‟‟thick
4 VRCC columns M20 9‟‟ x12‟‟ size
5 VRCC Plinth beam M20 9‟‟x 12‟‟ size
6 PCC BED for plinth beam 4‟‟ depth
7 Earth Filling to foundation & Basement 1‟5‟‟ Depth
8 40x15x22.5 cms CC solid Blocks for Walls 9‟3‟‟ height
9 40x10x22.5 cms CC solid Blocks for partition walls 9‟3‟‟ & 6‟10‟‟ height
10 VRCC M20 for lintel 9‟‟ Width
11 VRCC roof Slab M20 4‟‟ Thick
12 Ceiling plastering CM 1:4 of 2‟8‟‟thick
13 Wall plastering inside CM1:4 of 2‟8‟‟ thick
14 Wall plastering outside CM1:3 of 4‟‟ thick
15 MS hallow Door with shutters for main Door & Bedroom 2‟11‟‟ X 6‟5‟‟ & 2‟5‟‟x 6‟5‟‟
16 NCL Windows & Ventilators 2‟11‟‟ x 6‟5‟‟ ,1‟11‟x 6‟5‟‟ etc
17 Acrylic Emulsion Paint Inside walls & Ceiling
18 Acrylic Emulsion Paint outside
19 Flooring Inside houses
20 Internal Electrification Provided
21 Internal Sanitation Provided
22 Internal Water supply Provided
23 Painting to Doors & Windows Provided
24 Rooftop Plastering Provided
25 Staircase Provided
Source: 25th Revised Edition Estimation and Costing in Civil Engineering. (By B.N. DUTTA)
LAND USE
According to the land value records available at Bellary City Corporation, it has been decided
the price per Square feet is Rs 1500 per for residential while for commercial it is Rs 2200 per Sq.ft.
The following table presents the proposed land use for Korachegeri Bandimot Area Slum:
Description Area (Sq.ft)
Slum Area 4.39 Acres
Proposed Slum Area 58794.00
Residential area 33090.00
Commercial 50358.00
Park 13250.00
Roads 21035.00

RAY SLUM FREE CITY PLANNING BELLARY
94
Regional Centre for Urban and Environmental studies
To encourage future development in the slum, a Public-Private partnership has been chosen for
mixed land use where 33090.00 Sq.ft of land for regular residential and 50358.00 Sq.ft of land is
allocated for Commercial space and 11% for roads has been reserved. Under this model, potential
business opportunities can be created as well as better access to improved infrastructure, thus
fostering Korachegeri Bandimot Area slum development in the long run.
PHYSICAL INFRASTRUCTURE
Roads - B.T. are proposed as per the requirement
Surface / storm water drains -RCC U-Shape drains are proposed on both sides of the road to
drain out the Surface water as per the site requirement.
Sewerage -Provision for sewerage distribution system has been made and the same will be
connected to main Sewer line nearby wherever sewer facility is available.
Water Supply -water supply distribution network linked to city wide has been proposed as per
the requirement and individual sumps and overhead tanks have also been proposed.
Electricity -Lump sum provision for layout electrification has been made along with provision
for individual house connection. Obtaining the electricity Service Connection will be the
responsibility of the dweller and observing the necessary formalities by metering. The houses will
be provided with internal and external wiring for getting service connection from the electricity
authorities concerned.
The following page presents the model layout for Korachegeri Bandimot Area slum:
Map 3- 1: Proposed layout for Korachegere Bandimot area

RAY SLUM FREE CITY PLANNING BELLARY
95
Regional Centre for Urban and Environmental studies
VINAYAKA NAGAR 2ND
PHASE
Vinayaka nagar 2nd
phase is one among the 23 slums located in the Fringe area of Bellary City. It
has a total population of 390 with 82 households and an area of 18110.83 Sq.m. Under the ownership
of Bellary City Corporation, Vinayaka nagar 2nd
phase slum is located in the Fringe area and
surrounded by residential use. Of the 82 houses, 34% are Semi pucca and 61% are katcha. Due to lack
of well built housing structures and inadequate physical infrastructure, there is a need to improve the
living conditions in Vinayaka nagar 2nd
phase Slum.
PROPOSALS
Based on the above information, in situ mode of development has been recommended to make
the areas habitable and for provision of tenure rights to the slum dwellers. As part of in situ
development, 84 dwelling units have been proposed with each unit of area 331.50 Sq.ft and comprises
of living room, single bedroom, a kitchen and toilet .The following gives a description of a single
housing unit:
Description Dimensions (Feet)
Bed room 9.0 x9.0
Living 8.6 x 17.0
Toilet 6.0x5.0
Kitchen 7.0x5.6
Wash area 10.0x2.6
Total area of Dwelling unit 331.50 (Sq.ft)
Specifications for Doors & Windows in a single Dwelling unit:
Description Dimensions (Feet)
Doors D 1 3.11 x 6.5
D2 3.30x 6.5
Windows 3.3x4.11
ventilators 1.12x4.11
Housing plan:
Per block 6 dwelling units (DU) has been proposed with a total area of 2636.10 sq. ft. A total of
14 blocks has been proposed preferred to be Ground floor. The specifications and plan of a single
block has been shown below:
Area of Block – 2636.10 sq ft.
No. of Dwelling Units – 6 per floor ,
Corridor – 1‟ wide
Stair case

RAY SLUM FREE CITY PLANNING BELLARY
96
Regional Centre for Urban and Environmental studies
Block construction specifications:
S.No Description Units
1 Earth Work Excavation for RCC footing 3.28‟ depth
2 CC 1:4:8 for footing 4‟‟ thick
3 VRCC footing M20 5‟X5‟X12‟‟thick
4 VRCC columns M20 9‟‟ x12‟‟ size
5 VRCC Plinth beam M20 9‟‟x 12‟‟ size
6 PCC BED for plinth beam 4‟‟ depth
7 Earth Filling to foundation & Basement 1‟5‟‟ Depth
8 40x15x22.5 cms CC solid Blocks for Walls 9‟3‟‟ height
9 40x10x22.5 cms CC solid Blocks for partition walls 9‟3‟‟ & 6‟10‟‟ height
10 VRCC M20 for lintel 9‟‟ Width
11 VRCC roof Slab M20 4‟‟ Thick
12 Ceiling plastering CM 1:4 of 2‟8‟‟thick
13 Wall plastering inside CM1:4 of 2‟8‟‟ thick
14 Wall plastering outside CM1:3 of 4‟‟ thick
15 MS hallow Door with shutters for main Door & Bedroom 2‟11‟‟ X 6‟5‟‟ & 2‟5‟‟x 6‟5‟‟
16 NCL Windows & Ventilators 2‟11‟‟ x 6‟5‟‟ ,1‟11‟x 6‟5‟‟ etc
17 Acrylic Emulsion Paint Inside walls & Ceiling
18 Acrylic Emulsion Paint outside
19 Flooring Inside houses
20 Internal Electrification Provided
21 Internal Sanitation Provided
22 Internal Water supply Provided
23 Painting to Doors & Windows Provided
24 Rooftop Plastering Provided
25 Staircase Provided
Source: 25th Revised Edition Estimation and Costing in Civil Engineering. (By B.N. DUTTA)
LAND USE:
According to the land value records available at Bellary Corporation, it has been decided the
price per Square feet is Rs 1500 per for residential while for commercial it is Rs 2200 per Sq.ft. The
following table presents the proposed land use Vinayaka nagar 2nd
phase Slum:
Description Area (Sq.ft)
Slum Area 4.47Acres
Proposed Slum Area 37414.00
Commercial use 48522.00
Park 15881.00
Roads 42602.00
To encourage future development in the slum, a Public-Private partnership has been chosen for
mixed land use where 48522.00 Sq.ft of land is allocated for commercial space and 22% for roads has
been reserved .Under this model, potential business opportunities can be created as well as better
access to improved infrastructure, thus fostering Vinayaka nagar 2nd
phase slum development in the
long run.

RAY SLUM FREE CITY PLANNING BELLARY
97
Regional Centre for Urban and Environmental studies
PHYSICAL INFRASTRUCTURE
Roads - B.T. are proposed as per the requirement
Surface / storm water drains -RCC U-Shape drains are proposed on both sides of the road to
drain out the Surface water as per the site requirement.
Sewerage -Provision for sewerage distribution system has been made and the same will be
connected to main Sewer line nearby wherever sewer facility is available.
Water Supply -water supply distribution network linked to city wide has been proposed as per
the requirement and individual sumps and overhead tanks have also been proposed.
Electricity -Lump sum provision for layout electrification has been made along with provision
for individual house connection. Obtaining the electricity Service Connection will be the
responsibility of the dweller and observing the necessary formalities by metering. The houses will
be provided with internal and external wiring for getting service connection from the electricity
authorities concerned.
The following page presents the model layout for Vinayaka nagar 2nd
phase slum:
Map 3- 2: Proposed layout for Vinayaka nagara 2nd Phase

RAY SLUM FREE CITY PLANNING BELLARY
98
Regional Centre for Urban and Environmental studies
MAHANANDI KOTTAM (AMBEDKAR NAGAR)
Mahanandi Kottam (Ambedkar nagar) is one among the 44 slums located in the Core area of
Bellary City. It has a total population of 1026 with 189 households and an area of 10362.39 Sq.m.
Under the ownership of Bellary City Corporation, Mahanandi Kottam (Ambedkar nagar) slum is
located in the Core area and surrounded by residential use. Of the 189 houses, 81% are Semi pucca
and 11% are katcha. Due to lack of well built housing structures and inadequate physical
infrastructure, there is a need to improve the living conditions in Mahanandi Kottam (Ambedkar
nagar) Slum.
PROPOSALS
Based on the above information, in situ mode of development has been recommended to make
the areas habitable and for provision of tenure rights to the slum dwellers. As part of in situ
development, 192 dwelling units have been proposed with each unit of area 331.50 Sq.ft and
comprises of living room, single bedroom, a kitchen and toilet .The following gives a description of a
single housing unit:
Description Dimensions (Feet)
Bed room 9.0 x9.0
Living 8.6 x 17.0
Toilet 6.0x5.0
Kitchen 7.0x5.6
Balcony 10.0x2.6
Total area of Dwelling unit 331.50 (Sq.ft)
Specifications for Doors & Windows in a single Dwelling unit:
Description Dimensions (Feet)
Doors D 1 3.11 x 6.5
D2 3.30x 6.5
Windows 3.3x4.11
ventilators 1.12x4.11
Housing plan:
Per block 24 dwelling units (DU) has been proposed with a total area of 2636.10 sq. ft. A total of
8 blocks has been proposed preferred floors to be G+3 for each. The specifications and plan of a
single block has been shown below:
Area of Block – 2636.10 sq ft.
No. of Dwelling Units– 6 per floor , total 24 units
Corridor – 6‟ wide
Stair case

RAY SLUM FREE CITY PLANNING BELLARY
99
Regional Centre for Urban and Environmental studies
Block construction specifications:
S.No Description Units
1 Earth Work Excavation for RCC footing 3.28‟ depth
2 CC 1:4:8 for footing 4‟‟ thick
3 VRCC footing M20 5‟X5‟X12‟‟thick
4 VRCC columns M20 9‟‟ x12‟‟ size
5 VRCC Plinth beam M20 9‟‟x 12‟‟ size
6 PCC BED for plinth beam 4‟‟ depth
7 Earth Filling to foundation & Basement 1‟5‟‟ Depth
8 40x15x22.5 cms CC solid Blocks for Walls 9‟3‟‟ height
9 40x10x22.5 cms CC solid Blocks for partition walls 9‟3‟‟ & 6‟10‟‟ height
10 VRCC M20 for lintel 9‟‟ Width
11 VRCC roof Slab M20 4‟‟ Thick
12 Ceiling plastering CM 1:4 of 2‟8‟‟thick
13 Wall plastering inside CM1:4 of 2‟8‟‟ thick
14 Wall plastering outside CM1:3 of 4‟‟ thick
15 MS hallow Door with shutters for main Door &
Bedroom
2‟11‟‟ X 6‟5‟‟ & 2‟5‟‟x 6‟5‟‟
16 NCL Windows & Ventilators 2‟11‟‟ x 6‟5‟‟ ,1‟11‟x 6‟5‟‟ etc
17 Acrylic Emulsion Paint Inside walls & Ceiling
18 Acrylic Emulsion Paint outside
19 Flooring Inside houses
20 Internal Electrification Provided
21 Internal Sanitation Provided
22 Internal Water supply Provided
23 Painting to Doors & Windows Provided
24 Rooftop Plastering Provided
25 Staircase Provided
Source: 25th Revised Edition Estimation and Costing in Civil Engineering. (By B.N. DUTTA)
LAND USE:
According to the land value records available at Bellary Corporation, it has been decided the price per
Square feet is Rs 1500 per for residential while for commercial it is Rs 2200 per Sq.ft. The following
table presents the proposed land use Mahanandi Kottam (Ambedkar nagar) Slum:
Description Area (Sq.ft)
Slum Area 2.56Acres
Proposed Slum Area 85520.00
Commercial use 66864.00
Park 12660.00
Roads 28115.00
To encourage future development in the slum, a Public-Private partnership has been chosen for
mixed land use where 66864.00 Sq.ft of land is allocated for commercial space and 25% for roads has
been reserved .Under this model, potential business opportunities can be created as well as better
access to improved infrastructure, thus fostering Mahanandi Kottam (Ambedkar nagar) slum
development in the long run.

RAY SLUM FREE CITY PLANNING BELLARY
100
Regional Centre for Urban and Environmental studies
PHYSICAL INFRASTRUCTURE
Roads - B.T. are proposed as per the requirement
Surface / storm water drains -RCC U-Shape drains are proposed on both sides of the road to
drain out the Surface water as per the site requirement.
Sewerage -Provision for sewerage distribution system has been made and the same will be
connected to main Sewer line nearby wherever sewer facility is available.
Water Supply -water supply distribution network linked to city wide has been proposed as per
the requirement and individual sumps and overhead tanks have also been proposed.
Electricity -Lump sum provision for layout electrification has been made along with provision
for individual house connection. Obtaining the electricity Service Connection will be the
responsibility of the dweller and observing the necessary formalities by metering. The houses will
be provided with internal and external wiring for getting service connection from the electricity
authorities concerned.
Map 3- 3: Proposed layout for Mahanandi kottam (Ambedkar nagar)
The following page presents the model layout for Mahanandi Kottam (Ambedkar nagar) slum:
Rental Housing
Rental housing shall be developed in partnership with the private sector and ULBs may determine
rents to be paid by the households. Families may also contribute to a maintenance fund. Both amounts
shall be based on an assessment of affordability by the ULB. Developers, where applicable, may be
permitted to collect rentals to recover the cost of construction in BOT arrangements, as appropriate.
Maintenance charges may be collected by the cooperative/Resident Welfare Association/land trust, as
the case may be. The following are the list of options available under rental housing:
a) Rental housing by employers/industries/SEZ - Employees housing for high paid employees
b) Rental housing by employers/industries/SEZ - Employees housing for low paid employees
c) Dormitory housing
d) Subsidy housing / FAR incentive
e) Others –Group Housing

RAY SLUM FREE CITY PLANNING BELLARY
101
Regional Centre for Urban and Environmental studies
b. Targets & Timelines
Table 3- 4: Targets & Timelines
As seen in the above table, for 67 slums in Bellary city, 21 slums for in-situ mode of
development and 46 for up-gradation programme based on assessment of the living conditions in
those areas. Given the magnitude of problems faced, the slums have been prioritized and to be
implemented year wise respectively.
Once the redevelopment process is initiated, it is imperative that slum wise targets should be set
and adhered in order for the rehabilitation process to be accomplished within the set time frame. For
this to happen, it is necessary that there needs to be high level coordinating mechanism between wide
group of stakeholders such as Govt. officials, professionals from different disciplines, NGOs/CBOs,
and slum dwellers
Year of Development Period No of the Slums Mode of Development
I 2012-13
0 Relocation
6 In - Situ Development
4 Up gradation
Total 10
II 2013-14
0 Relocation
4 In - Situ Development
13 Up gradation
Total 17
III 2014-15
0 Relocation
4 In - Situ Development
16 Up gradation
Total 20
IV 2015-16
0 Relocation
6 In - Situ Development
10 Up gradation
Total 16
V 2016-17
0 Relocation
1 In - Situ Development
3 Up gradation
Total 4
Total 5 Years 67

RAY SLUM FREE CITY PLANNING BELLARY
102
Regional Centre for Urban and Environmental studies
163 165 167 168 170
474.88 504.43 534.53 566.87 599.80
2011-2012 2012-2013 2013-2014 2014-2015 2015-2016
Costing for projected
Households
Households Estimated Cost(lakhs)
3.3. Investment requirements
a. Housing
The following table and chart shows the finance for projected households for 5 years (2012-2017).
Table 3- 5: Costing for projected households (In INR / Lakhs)
Costing for projected households
Year Households Estimated cost ( In Lakhs)
2012-2013 163 474.88
2013-2014 165 504.43
2014-2015 167 534.53
2015-2016 168 566.87
2016-2017 170 599.80
Total 833 2680.52
As seen in the above chart, an increase of 833 households is expected, for which the estimated
costs for 5 years is Rs.2680.52 lakhs with an increase of 5%(construction inflation cost) per year.
b. Infrastructure
For the purpose of calculations, the following factors were taken into consideration:
For sanitation, the total city wide trunk is considered to be as 1% of the total project cost
For roads, costs was calculated for non Motorable pucca and katcha roads at the new
formation costs, while for Motorable katcha the costs was calculated at re-carpeting and
repair rates.
The following table 3 – 6 shows the estimated costs for physical infrastructure components for a
period of 5 years (2012-2017).
Chart 3- 1: Costing for Projected Households

RAY SLUM FREE CITY PLANNING BELLARY
103
Regional Centre for Urban and Environmental studies
Table 3- 6: Estimated Infrastructure Cost for Projected Households (in INR /Lakhs)
Sl. No Sector Unit
Estimated Cost
for 2012-17
(Rs. in Lakhs)
Physical Infrastructure
1 Water Supply
System
Running length of sub line (KM) 44.24
Rising Main (KM) 3.48
No. of individual taps 0.00
Overhead water tanks 24.98
2 Sanitation
Length of Underground Drainage/Sewer Lines
(KM) 147.46
Length of storm water Drainage Lines (KM) 147.46
No. of individual toilets 0.00
3 Solid waste
management No. of Bins 2.22
4 Roads Total length of Approach roads (4.5 mts wide ) 2.75
Total length of Internal roads (3.0 mts wide) 100.32
5 Street
Lighting No. street lights 46.90
Physical Infrastructure 519.81
Social Infrastructure
6 Education
facilities
Pre-primary schools 4.9
Primary school 2.0
Secondary school 3.9
7 Health
Facilities
Primary Health Centers 0.0
Maternity Centre 0
8 Social &
community
utilities
Community rooms 3.96
Comm. Halls 0.0
Recreation & Open spaces (Sq. KM) 0.0085
Social infrastructure 14.75
Total ( Physical + Social Infrastructure ) 534.55

RAY SLUM FREE CITY PLANNING BELLARY
104
Regional Centre for Urban and Environmental studies
c. Operation & Maintenance
The following table shows the estimated costs for additional components and operation and
maintenance for Bellary slums for a period of 5 years (2012-2017):
Table 3- 7: Estimated O & M cost for projected households (In INR / lakhs)
Operation and Maintenance Estimated cost (In Lakhs)
Year
A&
OE
(2.5%)
O&M
(2.5%)
DPR
(1%)
Project
Implemen
tation
(1%)
Offsite
costing
(1%)
Pre
construction
cost (1% in
Housing)
Annual
Estimated O
& M (In
INR/Lakhs)
2012-13 16.08 16.08 6.43 6.43 6.43 4.75 56.20
2013-14 16.08 16.08 6.43 6.43 6.43 5.04 56.49
2014-15 16.08 16.08 6.43 6.43 6.43 5.35 56.80
2015-16 16.08 16.08 6.43 6.43 6.43 5.67 57.12
2016-17 16.08 16.08 6.43 6.43 6.43 6.00 57.45
Grand
Total 80.40 80.40 32.15 32.15 32.15 26.81 284.06
A total of 284.06 lakhs has been estimated for the additional costs that are going to be
incurred during and after the implementation of the project.
Housing + Infrastructure +Operation and Maintenance = 2680.52+534.55+284.06
= 3499.12 Lakhs
The total of 3499.26 Lakhs has been estimated tentatively for proposed development.

RAY SLUM FREE CITY PLANNING BELLARY
105
Regional Centre for Urban and Environmental studies
3.4. Slum Prevention Reforms
For any city, preventing the formation of newer slums is quite critical and pretty much the same as
dealing with the existing slums. A key component in preventing future slums is the availability of
developed lands at affordable prices, set aside for meeting the needs of the urban poor. To prevent
further growth of slums and improve the social status of existing ones along with reconstruction, the
states need to make the following provisions in terms of amendments to certain legislations,
reservation of lands, as well as formulate newer laws such as:
Assignment of property rights
The property rights shall not be assigned to the slum dwellers in the slum Areas notified and
located on any of the following categories:
Objectionable government lands, such as tank beds, burial grounds, solid waste land fill
cities etc., central government, defense , industrial units, disputed lands, protected monuments, public
sector lands and other lands which are specified by government for a specific purpose and usage.
The legal title should be entitled either on the woman or jointly with the main male
householder, provided it should be made on the house or the land and it must be alienable as per the
transfer of title to state after a certain period.
Formation of Slum Redevelopment Authorities
A slum redevelopment authority is to be created at state level with induction of members from
various departments. The role of the authority would be to provide guidance in identification of slums,
formulate policies and programmes for redevelopment and rehabilitation of slums, special zoning
regulations and to administer the funds released by govt. of India, state govt. and other agencies. On
similar lines of the slum redevelopment authority at state level, a district level authority can be formed
to function as well as monitor the slum rehabilitation for each district.
Land Acquisition
Just in case where no suitable government or ULB lands are available, suitable private Patta lands
are identified for rehabilitation of slum areas. In process, the competent authority shall take action for
acquisition of lands under the provisions of land acquisition act, 1894.
Land pooling
In land pooling/town planning scheme, the owner or developer undertaking the development shall
reserve and earmark the land in the proportions of 5% for the economically weaker sections (EWS)
and 5% of land for low income group persons for housing purpose. In case of vertical development,
20% of built up space shall be earmarked for EWS and low income groups.
Once implemented, in the long term, availability of affordable land /housing will discourage
squatting by poor on public lands and create slum free cities. It will also sustainably reduce urban
poverty levels by providing legal access to better services and economic opportunities.

RAY SLUM FREE CITY PLANNING BELLARY
106
Regional Centre for Urban and Environmental studies
Transferable Development Rights (TDR) /Incentive Zoning
TDR is aimed at providing to a land owner /builder additional FAR in another property/part of the
city in exchange for presently occupied land so that the land could be consolidated. This method has
been extensively used in other parts of India.
Microfinance for shelter up-gradation
To make cities slum free, it is necessary to build partnerships with Self Help Groups and Micro
Finance Institutions both formal and informal to help poor access money to purchase land /houses.
Often Financial Institutions prefer to provide loans through NGOs, who works as intermediaries, to
disburse loan to beneficiaries. State/ city administration can facilitate this process by standing
guarantee or by framing appropriate regulations so that benefits of these transactions reach the target
group.
Other legislations
o Under the 7- Point Charter of JNNURM in order to make serviced land available for the poor
for the future and to prevent slums – there is a necessity to reserve 10%--25% of the land for
every new public/private housing projects.
o Amendment to enactments to enable revision of population density norms, FAR, land use, etc.
and to allow private sector participation wherever reasonably possible.
o When growth rate of a city deviates from the expected, it is necessary to amend the legislation
under which land is obtained for expansion of urban areas and to enable creation of new
rental housing stock.
o Extension of basic network services including health and education to slum settlements
through national sanitation and health related programmes
o Provision of skills and training and nonwage, self employment assistance, the self-
employment component in the SJSRY
o Changes in Master Plans that allows for slum renewal and redevelopment, legislation and
building byelaws
ULB’s role
The implementing agency/ULB would need to continue fiscal reforms that have already been
initiated under the JNNURM and other relevant schemes. Approach to financing of the ULB
contribution would need to be a combination of initiatives that ring-fence and maximize internal
accruals, and developing a framework for sustainable community participation/unlocking other
sources of revenues.
3.5. Capacity Building
With the launch of RAY, capacity building efforts received a significant boost in terms of scale as
well as scope. It is usually focused on provision of technical assistance, training and knowledge
support to enable implementation of programmes and related components. Through incremental
approach and comprehensive framework, capacity building requires in selecting the appropriate mode
of training and should imply the flow of ideas, systems and processes, knowledge management
through the creation of networks of sector managers for sharing emerging trends, ideas and best
practices towards implementing slum free cities.

RAY SLUM FREE CITY PLANNING BELLARY
107
Regional Centre for Urban and Environmental studies
At State level,
The state needs to prepare state specific capacity building strategy should map existing
arrangements/requirements/gap analysis/identify specific measures for strengthening existing facilities
and expertise. This framework should incentivize knowledge and skill development and provide an
environment for the use of skills acquired.
At ULB level,
Given the legal implications, it is essential for ULB staff to improve levels of performance in
order to reduce evasion. Hence to gain expected outcomes, it is necessary for orienting ULB
personnel to the role expected out of them in the context of rising expectations from the citizens in
terms of service delivery, greater transparency and accountability etc.
At NGO’s level,
Implementation of projects and reforms involves increased stakeholders participation among the
general public, NGOs and the private sector. There is a need to create forums where different
stakeholders can articulate their demands for better service delivery and governance levels.
Slum dwellers
Slum dwellers also act as stakeholders in planning for slums as they understand the slums,
strategies implemented in those slums and future requirements. Hence they should be trained in
developing their respective slums, otherwise the aims of SJSRY staff not be fulfilled.
An amount up to 5% of the total annual allocation of RAY scheme will be set aside for capacity
building activities, of which 1% would be utilized by the Centre, 4% by the States/UTs. In addition,
up to 5% of the total scheme allocation will be earmarked for preparatory activities regarding
development of Slum-Free City Plans including pilot projects, preparation of DPRs, community
mobilization, IEC, planning and administrative expenses for both the Centre and the States/UTs and
creation of institutional space and capacities.

RAY SLUM FREE CITY PLANNING BELLARY
108
Regional Centre for Urban and Environmental studies
SSeeccttiioonn –– IIVV ––RRooaadd MMaapp

RAY SLUM FREE CITY PLANNING BELLARY
109
Regional Centre for Urban and Environmental studies
DMA
Commissioner Deputy
Commissioner
Project Officer(for
district)
Nodal Officer(ULB)
Enumerators
Supervisors
NHG, NHC, CDS
CCHHAAPPTTEERR 44 –– RROOAADD MMAAPP
4.1. Touchstone Principles
As per the report, the money for slum improvement has been mainly spent under four schemes
namely,
• Slum Improvement Scheme;
• Swaran Jayanti Shahri Rozgar Yojana;
• National Slum Development Program; and
• Valmiki Awas Yojna.
Since RAY is embarked as path breaking scheme towards Slum free India, there is a need to
integrate with other established national as well as state level programmes and Govt. organizations
such as HUDCO in terms of harnessing technical as well as financial support through moderation in
credit Availability for the Urban Poor for Housing.
a. Institutional Framework
A number of agencies are responsible for various activities pertaining to housing for urban
poor. Although it is primarily the responsibility of the ULB, other departments/ agencies such as the
Urban Development Department, Town Planning Department, Slum Redevelopment Board, Housing
Board and NGOs, all have a role to play in provision of housing and infrastructure services to the
urban poor.
The following institutional methodology has been adopted for the state.
The institutional responsibility for slum improvement vests with the Directorate of
Municipal Administration (DMA), the apex policy making and monitoring agency for urban areas
in the state. It executes various government schemes for urban renewal like – Balmiki Ambedkar
Awas Yojana, Integrated Urban Slum Sewerage Plan, National Slum Development Program, and
Golden Jubilee Urban Employment Scheme etc. DMA executes all its programs using beneficiaries
for prioritization of needs and execution of schemes.
Chart 4- 1 Institutional setup for Slum free cities

RAY SLUM FREE CITY PLANNING BELLARY
110
Regional Centre for Urban and Environmental studies
In case of Rajiv Awas Yojana, DMA is the nodal agency at state level to implement surveys
for the scheme. Initially the survey was taken up under USHA programme, which had similar survey
format of RAY. Various meetings were conducted by calling different para-statal agencies to discuss
the required methodology for conducting surveys and initiate the steps for survey. Several
discussions were held at length and depth about the conduction of surveys and to finalize a
methodology. DMA as State level authority has been the Nodal agency to monitor the quantity and
quality of surveys performed by individual cities. DMA is headed by Commissioner who is in charge
for one city, a nodal officer for a ULB and number of supervisors for quality and quantity check upon
the enumerators who have completed the surveys.
b. Assessment of Implementation Options
The assessment for implementing a mode of development for any slum in Bellary city would be
based on the prevailing land value. The implementation could be both public and private depending
on the public and stakeholders consensus with due approval of the city with respect to its land
ownership and project implementation.
4.2. Financing Plan
a. Summary of Investments
Table 4- 1: Summary of Investments for 2012-2017
Sector Total Project Cost for
existing slums
Housing 26114.23
Water Supply 610.85
Sanitation 2343.21
Solid waste management 28.32
Roads 1852.01
Street Lighting 241.23
Education 0.00
Health 0.00
Social development 198.24
Others 4655.5
Total 36043.58
To make slum free city Bellary the overall cost is estimated tentatively at a value of 360.44 Crores.
For slum wise line estimates please refer annexure 2E

RAY SLUM FREE CITY PLANNING BELLARY
111
Regional Centre for Urban and Environmental studies
b. Financing Structure
Implementing slum free cities requires the concerned authorities to develop a legal framework
based policy for internal earmarking of funds, ensuring the preparation of separate budget for urban
poor, creating BSUP Fund etc.
Chart 4- 2: Financing Structure
Central Share
Speaking of the Govt. of India share in RAY project funding, 50% of the cost for provision of
basic civic and social infrastructure and housing, including rental housing,- and transit housing for in-
situ redevelopment -in slums would be borne by the Centre, including O&M of assets created under
RAY scheme.The remaining half required the states or ULBs to use PPP models innovatively to
generate resources for slum housing through land use concessions, etc to the private industry partners,
and use of the central share as viability gap funding. States which demonstrate an innovative use of
PPP models resulting in utilization of less than the specified central share of 50% in any project shall
be incentivized by allowing them to use this saving in other projects in the city.
An amount of nearly 5% of the total annual allocation would be set aside for capacity
building activities, of which 1% would be utilized by the Centre, 4% by the States/UTs. In addition,
up to 5% of the total scheme allocation will be earmarked for, preparatory activities regarding
development of Slum-Free City Plans including pilot projects, preparation of DPRs, Community
mobilization, IEC, planning and administrative expenses.
Beneficiary Contribution
In order to ensure the communities interest and active participation, financial contribution by
the beneficiaries is considered to be critical. As specified, the share of beneficiary contribution in the
housing sector is anticipated to be a minimum of 12% of total cost and 10% in case of different social
groups and other weaker sections. Options such as aggregation of loans to a community of
beneficiaries wherever feasible, will be encouraged. Adequate security and credit enabling structures
for such participation including mortgage insurance would need to be structured and made available
to the beneficiaries. The option of linking to the Mortgage Risk Guarantee Fund (MRGF) to which the
State has to contribute could be explored.
There are various initiatives that can be undertaken by the States/ ULBs to facilitate
beneficiary contribution and to make finances available during the 5 year span of the RAY scheme.
These include the following:
Facilitating long-term concessional interest rate/differential interest rates to the beneficiaries
Access to microfinance and alternate funding options
Rajiv Awas Shelter Fund, to be used:
To keep the slum/urban poor beneficiary from turning defaulter due to unemployment, death
or other genuine distress and thereby risk forfeiture of dwelling unit and foreclosure on loan
To share the lender‟s costs of servicing the loan.
50% Central Government share
50% State Government, benefi
ciary, ULB, bank and other financial
agencies

RAY SLUM FREE CITY PLANNING BELLARY
112
Regional Centre for Urban and Environmental studies
c. Strategy for Sustenance
Local bodies need to explore options for raising finance through other avenues such as PPP,
shared mortgage and pooled financing mechanisms. For sustenance, it is essential for a ULB to
prioritize in a way that the maximum benefit is derived for the investments proposed to be made for
implementing development works and service delivery for slums. This can be achieved only through
beneficiary participation and consensus.
d. ULB Finances
To undertake financing for slum rehabilitation, ULBs need to adopt a different approach or a
well designed strategy for financing by:
Internal earmarking of funds for RAY in the municipal budgets., allocation of
available surplus for slum rehabilitation under RAY
Earmarking of property taxes, trade license fee, hawker-license fees, SWM cess etc.,
Share of other devolutions, whenever applicable
Proceeds from PPP projects
Unlocking alternate revenues, using land based instruments such as FSI, TDR, land
banking etc.
The reforms/other initiatives that ULBs would need to evaluate include the following:
Setting up of a revolving fund for continued O & M of the infrastructure & housing
Evaluate and converge with other existing schemes, as applicable.
e. Earmarking for Slum Rehabilitation & Prevention Strategy
For all new housing projects developed by public or private agencies, it would be mandatory
to construct houses for LIG/EWS groups. Suitable amendment may be made to State/local enactments
for this purpose. The percentage of housing units to be earmarked for LIG/EWS in apartments or
group housing projects in large and small cities will be between 20-25% as prescribed under RAY. In
case of vertical development, 20% of built up space shall be earmarked for economically weaker
sections and low income groups of persons.
f. Community Participation
Community participation is critical for a successful slum rehabilitation and development.
ULBs need to ensure that appropriate community processes and organization of community structures
for planning and implementation of housing and upgrading projects. In addition, the local bodies need
to facilitate Area and Ward Committees with representation of slum communities, in accordance with
the Community Participation Law for participatory area and ward level planning and monitoring.
4.3. Monitoring & Review
RAY would be monitored at three levels: City, State and Government of India. The following
agencies and departments would be monitoring at their respective levels:
Ministry of Housing and Urban Poverty Alleviation will periodically monitor the scheme.
State Nodal Agency would send Quarterly Progress Report (on-line) to the Ministry of
Housing and Urban Poverty Alleviation. Upon completion of a project, the State Nodal
Agency, through the State Government, would submit completion report to the Central
Government.
Central Sanctioning-cum-Monitoring Committee will meet as often as required to sanction and
review/monitor the progress of projects sanctioned under the Mission.

RAY SLUM FREE CITY PLANNING BELLARY
113
Regional Centre for Urban and Environmental studies
Monitoring of quality of projects executed by the implementing agencies in the States/Cities
will be facilitated through independent quality control/ assurance/ third party teams at various
levels that may be outsourced to specialized/technical agencies.
Monitoring of projects by States/Urban Local Bodies by conducting Social Audit in
conformity with guidelines to be prescribed, right from the stage of project preparation.
The processes of implementation will be monitored by undertaking concurrent evaluation
through reputed independent institutions to ensure that corrections to distortions, oversights or
shortcomings can be made in time.
4.4. Reforms
A draft slum free act has been already in place in state of Karnataka. ULB/State Govt.
agencies need to suggest the sequencing of steps and timelines to be adopted during implementation
of slum redevelopment programmes for a period of five years.

RAY SLUM FREE CITY PLANNING BELLARY
114
Regional Centre for Urban and Environmental studies
LLIISSTT OOFF AANNNNEEXXUURREESS
SLUM PROFILE
Annexure 1A
Annexure 1B
Annexure 1C
Annexure 1D
Annexure 1E
Annexure 1F
Annexure 2A
Annexure 2B
Annexure 2C
Annexure 2D
Annexure 2E
(DATA ANALYSIS AND PROPOSALS)