
Raw cow milk Chemical “Reference” Methods - icar.org · Estonia Eesti Pollumajandusloomade...
46
ICAR PROFICIENCY TEST - MARCH 2018 Chemical “Reference” Methods Raw cow milk
-
Upload
truongdieu -
Category
Documents
-
view
219 -
download
0
Transcript of Raw cow milk Chemical “Reference” Methods - icar.org · Estonia Eesti Pollumajandusloomade...
ICAR PROFICIENCY TEST - MARCH 2018
Chemical “Reference” Methods
Raw cow milk
ICAR Proficiency Test (PT) Chemical “Reference” methods – March 2018
Table of contents
1. Introduction
2. Your performances analysis
3. Control Charts
4. ICAR Statistical Elaboration
Fat (reference-chemical methods)
Protein (reference-chemical methods)
Lactose (reference-chemical methods)
Urea (reference-chemical methods)
Somatic Cell (microscopic and fluoro-optoelectronic method)
ICAR Proficiency Test (PT) Chemical “Reference” methods – March 2018
1. Introduction
Dear Participant,
Thank you for participating in the ICAR Proficiency Test (PT) March 2018 !
This is the fifth round that ICAR organized sine 2016 !!!
In this report you will find sections 2 and 3 which are dedicated to “your” quality assurance management and section 4 dedicated to the “general” statistical elaboration for each parameter.
The proficiency test is a tool to help evaluate the performance of the laboratory process and to support your laboratory quality assurance system. It’s aim is to provide independent data for you to monitor, evaluate and ultimately improve your processes as you see fit.
From the analyses of the data received we have identified some aspects that if evaluated and managed may serve to improve some control steps of your quality management ISO 17025.
When the PT samples arrive to your laboratory they can be viewed as being from a ‘customer’ that is asking you to provide timely, precise and accurate results.
In tables A,B,C,D,E,F,G if all the information is reported correctly from the participant, then the cells are filled in green, otherwise they are highlighted in red for your attention, so you can review and verify any causal reasons internally. The control charts, will help you to follow your performance over the time.
A) In table A you find your participation codes and the information if all the results from the samples received, have been sent to the PT provider.
B) In table B is indicated if the results have been sent on time.
C) In table C is indicated if the results have been reported in the correct unit of measurements.
D) It is the ranking of your laboratory. The values of table 1 for each parameter are reported. In table F the ranking of your lab will be green if the mean of difference and standard deviation of difference value are in the box of figure 2 of each parameter. Limits are only indicative and so far do not constitute standard values; they indicate what is normally reachable by labs for their self evaluation. According the results obtained the MA SC will decide eventually to revise. During the meeting of Milk Analyses Sub Committee held in Copenhagen in June 2016 the experts decided to update the limit of the box to evaluate the accuracy.
E) Here are reported the samples that resulted outlier for your participation code for Cochran and/or Grubbs test
F) The evaluation of repeatability of the results should be one of the first controls before communication of the data. In table F the absolute difference between replicates is compared with the repeatability limit of the relevant “reference” method indicated. If one or more results have a result out of the limit, the cell is in red. It may be that you have deployed a chemical method that is different from the reference method indicated. If the repeatability is bigger it will be evaluated internally with the precision of the specific method used. You can find all the detailed information of your data in Table II in the section Statistical elaboration for each parameter.
G) In table G the results of your Z-ScorePT (standard deviation calculated on this proficiency test) and the Z-ScoreFIX
(standard deviation of the reference method) are summarized. If you have obtained all the -2<Z-Score results<+2 the cell will be filled in green. If you have obtained one or more results in the moderate or poor performance range the cells will be filled in yellow or red respectively.
ICAR Proficiency Test (PT) Chemical “Reference” methods – March 2018
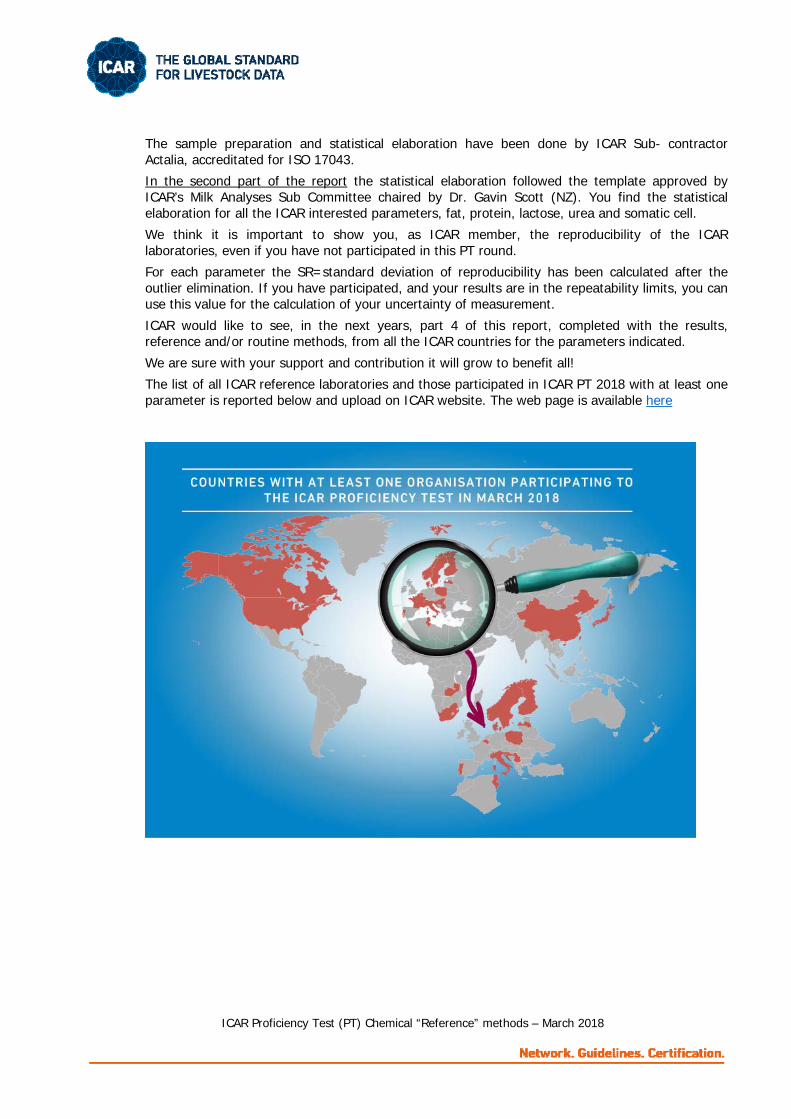
The sample preparation and statistical elaboration have been done by ICAR Sub- contractor Actalia, accreditated for ISO 17043.
In the second part of the report the statistical elaboration followed the template approved by ICAR’s Milk Analyses Sub Committee chaired by Dr. Gavin Scott (NZ). You find the statistical elaboration for all the ICAR interested parameters, fat, protein, lactose, urea and somatic cell.
We think it is important to show you, as ICAR member, the reproducibility of the ICAR laboratories, even if you have not participated in this PT round.
For each parameter the SR=standard deviation of reproducibility has been calculated after the outlier elimination. If you have participated, and your results are in the repeatability limits, you can use this value for the calculation of your uncertainty of measurement.
ICAR would like to see, in the next years, part 4 of this report, completed with the results, reference and/or routine methods, from all the ICAR countries for the parameters indicated.
We are sure with your support and contribution it will grow to benefit all!
The list of all ICAR reference laboratories and those participated in ICAR PT 2018 with at least one parameter is reported below and upload on ICAR website. The web page is available here
ICAR Proficiency Test (PT) “Reference” methods – March 2018
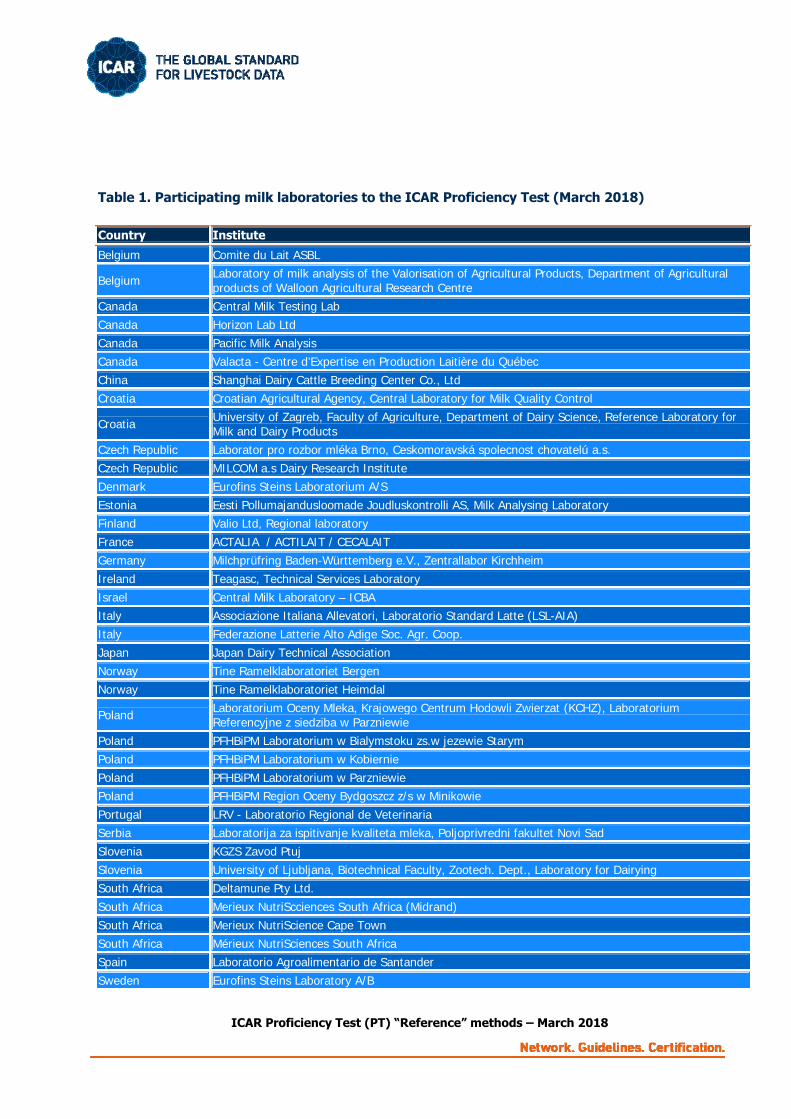
Table 1. Participating milk laboratories to the ICAR Proficiency Test (March 2018) Country Institute
Belgium Comite du Lait ASBL
Belgium Laboratory of milk analysis of the Valorisation of Agricultural Products, Department of Agricultural products of Walloon Agricultural Research Centre
Canada Central Milk Testing Lab Canada Horizon Lab Ltd Canada Pacific Milk Analysis Canada Valacta - Centre d’Expertise en Production Laitière du Québec China Shanghai Dairy Cattle Breeding Center Co., Ltd Croatia Croatian Agricultural Agency, Central Laboratory for Milk Quality Control
Croatia University of Zagreb, Faculty of Agriculture, Department of Dairy Science, Reference Laboratory for Milk and Dairy Products
Czech Republic Laborator pro rozbor mléka Brno, Ceskomoravská spolecnost chovatelú a.s. Czech Republic MILCOM a.s Dairy Research Institute Denmark Eurofins Steins Laboratorium A/S Estonia Eesti Pollumajandusloomade Joudluskontrolli AS, Milk Analysing Laboratory Finland Valio Ltd, Regional laboratory France ACTALIA / ACTILAIT / CECALAIT Germany Milchprüfring Baden-Württemberg e.V., Zentrallabor Kirchheim Ireland Teagasc, Technical Services Laboratory Israel Central Milk Laboratory – ICBA Italy Associazione Italiana Allevatori, Laboratorio Standard Latte (LSL-AIA) Italy Federazione Latterie Alto Adige Soc. Agr. Coop. Japan Japan Dairy Technical Association Norway Tine Ramelklaboratoriet Bergen Norway Tine Ramelklaboratoriet Heimdal
Poland Laboratorium Oceny Mleka, Krajowego Centrum Hodowli Zwierzat (KCHZ), Laboratorium Referencyjne z siedziba w Parzniewie
Poland PFHBiPM Laboratorium w Bialymstoku zs.w jezewie Starym Poland PFHBiPM Laboratorium w Kobiernie Poland PFHBiPM Laboratorium w Parzniewie Poland PFHBiPM Region Oceny Bydgoszcz z/s w Minikowie Portugal LRV - Laboratorio Regional de Veterinaria Serbia Laboratorija za ispitivanje kvaliteta mleka, Poljoprivredni fakultet Novi Sad Slovenia KGZS Zavod Ptuj Slovenia University of Ljubljana, Biotechnical Faculty, Zootech. Dept., Laboratory for Dairying South Africa Deltamune Pty Ltd. South Africa Merieux NutriScciences South Africa (Midrand) South Africa Merieux NutriScience Cape Town South Africa Mérieux NutriSciences South Africa Spain Laboratorio Agroalimentario de Santander Sweden Eurofins Steins Laboratory A/B
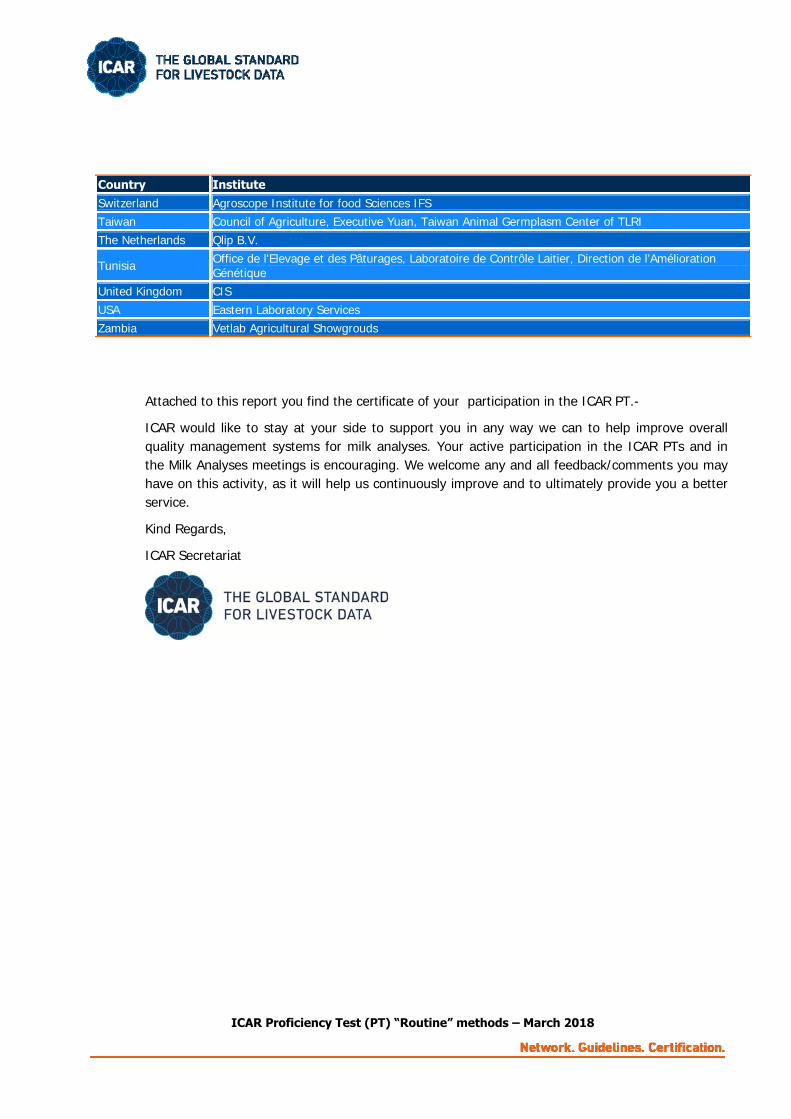
ICAR Proficiency Test (PT) “Routine” methods – March 2018
Country Institute Switzerland Agroscope Institute for food Sciences IFS Taiwan Council of Agriculture, Executive Yuan, Taiwan Animal Germplasm Center of TLRI The Netherlands Qlip B.V.
Tunisia Office de l'Elevage et des Pâturages, Laboratoire de Contrôle Laitier, Direction de l’Amélioration Génétique
United Kingdom CIS USA Eastern Laboratory Services Zambia Vetlab Agricultural Showgrouds
Attached to this report you find the certificate of your participation in the ICAR PT.-
ICAR would like to stay at your side to support you in any way we can to help improve overall quality management systems for milk analyses. Your active participation in the ICAR PTs and in the Milk Analyses meetings is encouraging. We welcome any and all feedback/comments you may have on this activity, as it will help us continuously improve and to ultimately provide you a better service.
Kind Regards,
ICAR Secretariat
DETERMINATION of FAT in RAW (cow) MILK - page 1/8
ICAR
PROFICIENCY TESTING SCHEME
---------
March 2018
Raw Milk
Determination of FAT CONTENT
Röse Gottlieb method
Sending date of statistical treatment : 3th April 2018
Frame of activity : ICAR Milk Analyses Sub Committee (MA SC)ICAR Staff Silvia Orlandini [email protected] [email protected]
Proficiency test accreditated ISO 17043
ACCRÉDITATION N° 1-2473 PORTÉE DISPONIBLE SUR WWW.COFRAC.FR
DETERMINATION of FAT in RAW (cow) MILK - page 1/8 DETERMINATION of FAT in RAW (cow) MILK - page 2/8
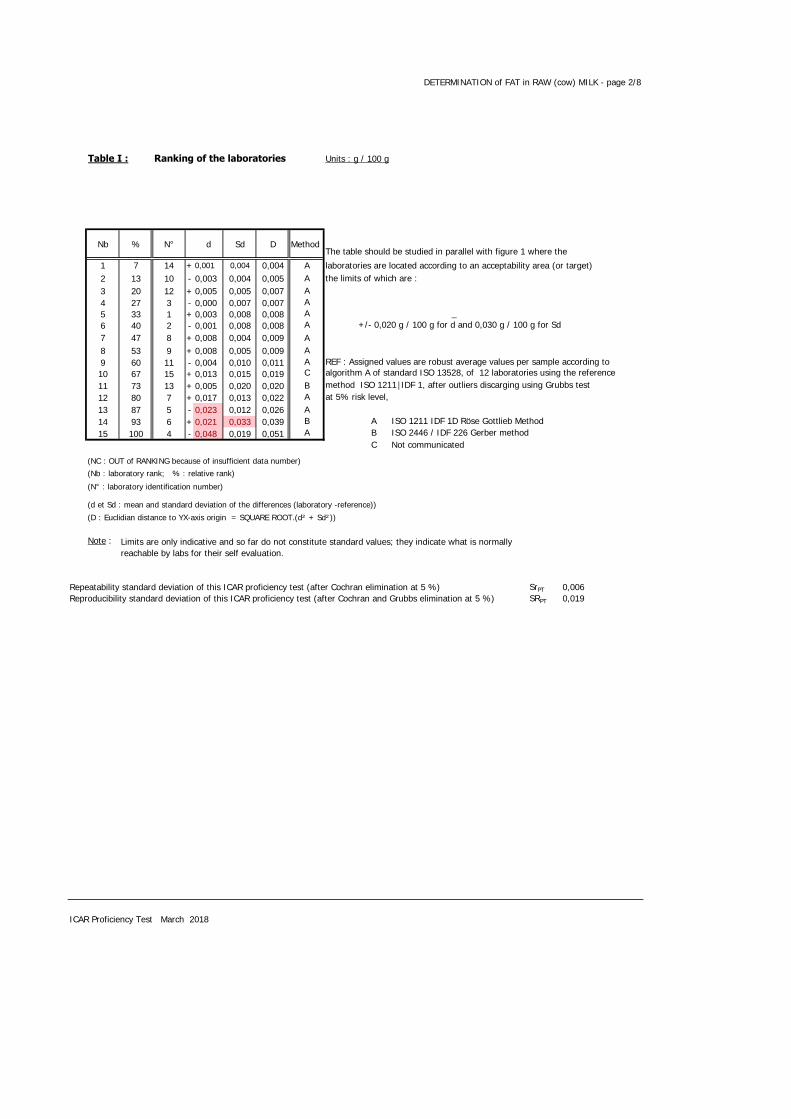
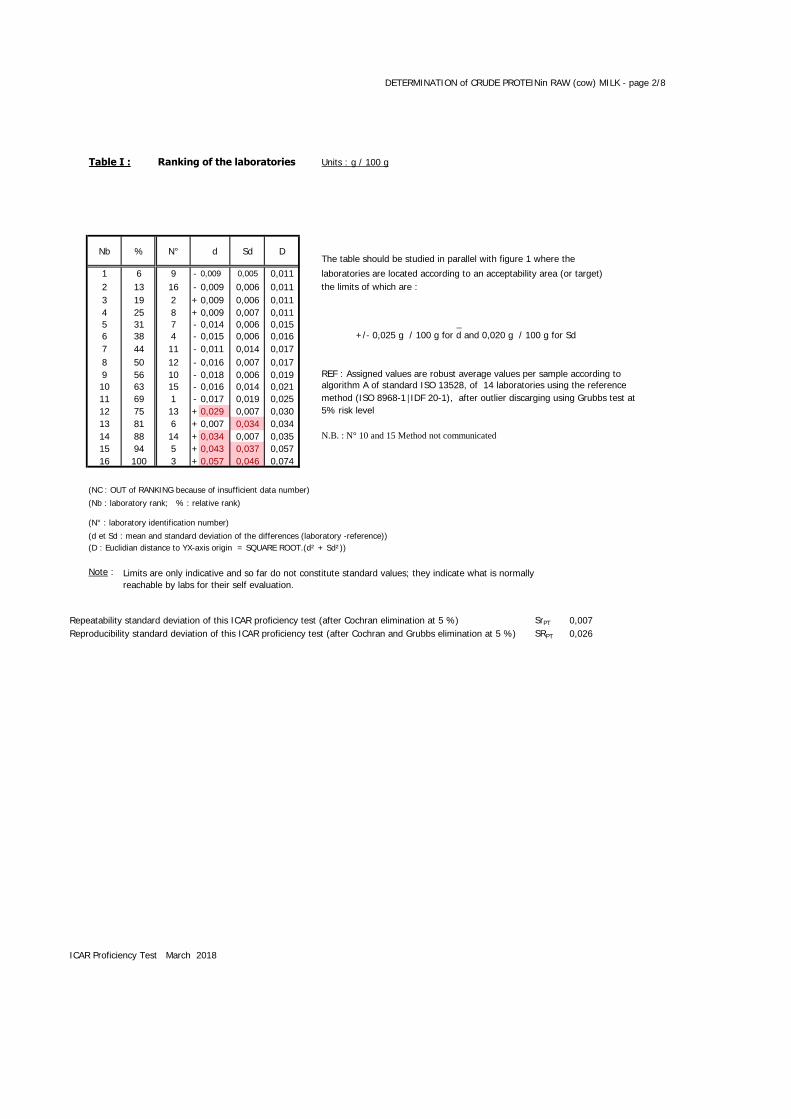
Table I : Ranking of the laboratories Units : g / 100 g
Nb % N° d Sd D MethodThe table should be studied in parallel with figure 1 where the
1 7 14 + 0,001 0,004 0,004 A laboratories are located according to an acceptability area (or target)2 13 10 - 0,003 0,004 0,005 A the limits of which are :3 20 12 + 0,005 0,005 0,007 A4 27 3 - 0,000 0,007 0,007 A5 33 1 + 0,003 0,008 0,008 A _6 40 2 - 0,001 0,008 0,008 A +/- 0,020 g / 100 g for d and 0,030 g / 100 g for Sd7 47 8 + 0,008 0,004 0,009 A8 53 9 + 0,008 0,005 0,009 A9 60 11 - 0,004 0,010 0,011 A REF : Assigned values are robust average values per sample according to10 67 15 + 0,013 0,015 0,019 C algorithm A of standard ISO 13528, of 12 laboratories using the reference 11 73 13 + 0,005 0,020 0,020 B method ISO 1211│IDF 1, after outliers discarging using Grubbs test 12 80 7 + 0,017 0,013 0,022 A at 5% risk level,13 87 5 - 0,023 0,012 0,026 A14 93 6 + 0,021 0,033 0,039 B A ISO 1211 IDF 1D Röse Gottlieb Method15 100 4 - 0,048 0,019 0,051 A B ISO 2446 / IDF 226 Gerber method
C Not communicated
(NC : OUT of RANKING because of insufficient data number)(Nb : laboratory rank; % : relative rank)
(N° : laboratory identification number)
(d et Sd : mean and standard deviation of the differences (laboratory -reference))
(D : Euclidian distance to YX-axis origin = SQUARE ROOT.(d² + Sd²))
Note : Limits are only indicative and so far do not constitute standard values; they indicate what is normally reachable by labs for their self evaluation.
Repeatability standard deviation of this ICAR proficiency test (after Cochran elimination at 5 %) SrPT 0,006Reproducibility standard deviation of this ICAR proficiency test (after Cochran and Grubbs elimination at 5 %) SRPT 0,019
ICAR Proficiency Test March 2018
DETERMINATION of FAT in RAW (cow) MILK - page 2/8 DETERMINATION of FAT in RAW (cow) MILK - page 3/8
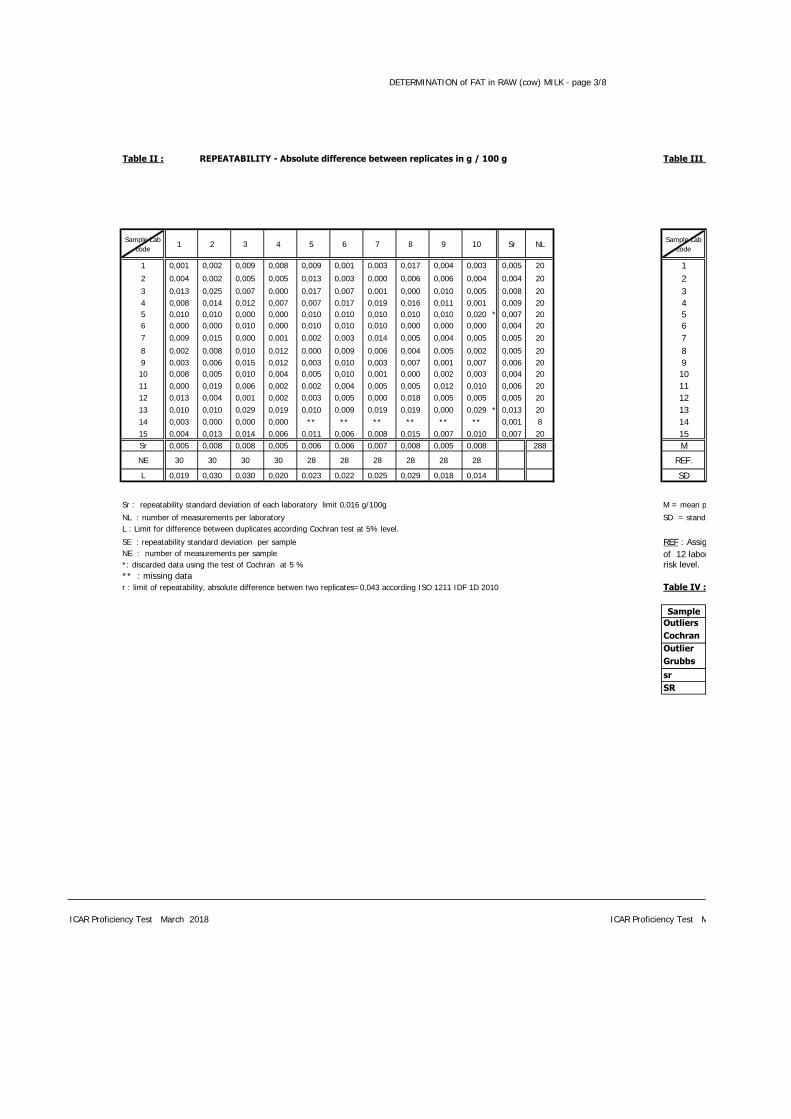
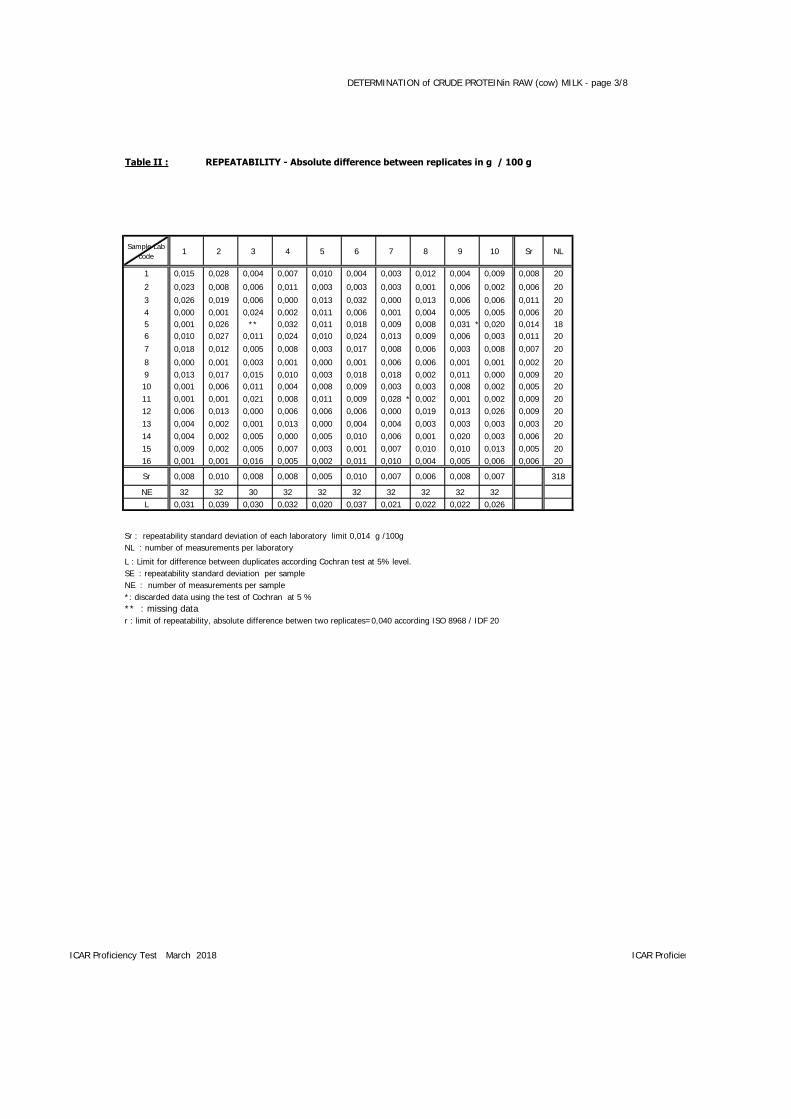
Table II : REPEATABILITY - Absolute difference between replicates in g / 100 g Table III :
Sample Lab code
1 2 3 4 5 6 7 8 9 10 Sr NL Sample Lab code
1 0,001 0,002 0,009 0,008 0,009 0,001 0,003 0,017 0,004 0,003 0,005 20 12 0,004 0,002 0,005 0,005 0,013 0,003 0,000 0,006 0,006 0,004 0,004 20 23 0,013 0,025 0,007 0,000 0,017 0,007 0,001 0,000 0,010 0,005 0,008 20 34 0,008 0,014 0,012 0,007 0,007 0,017 0,019 0,016 0,011 0,001 0,009 20 45 0,010 0,010 0,000 0,000 0,010 0,010 0,010 0,010 0,010 0,020 * 0,007 20 56 0,000 0,000 0,010 0,000 0,010 0,010 0,010 0,000 0,000 0,000 0,004 20 67 0,009 0,015 0,000 0,001 0,002 0,003 0,014 0,005 0,004 0,005 0,005 20 78 0,002 0,008 0,010 0,012 0,000 0,009 0,006 0,004 0,005 0,002 0,005 20 89 0,003 0,006 0,015 0,012 0,003 0,010 0,003 0,007 0,001 0,007 0,006 20 910 0,008 0,005 0,010 0,004 0,005 0,010 0,001 0,000 0,002 0,003 0,004 20 1011 0,000 0,019 0,006 0,002 0,002 0,004 0,005 0,005 0,012 0,010 0,006 20 1112 0,013 0,004 0,001 0,002 0,003 0,005 0,000 0,018 0,005 0,005 0,005 20 1213 0,010 0,010 0,029 0,019 0,010 0,009 0,019 0,019 0,000 0,029 * 0,013 20 1314 0,003 0,000 0,000 0,000 ** ** ** ** ** ** 0,001 8 1415 0,004 0,013 0,014 0,006 0,011 0,006 0,008 0,015 0,007 0,010 0,007 20 15Sr 0,005 0,008 0,008 0,005 0,006 0,006 0,007 0,008 0,005 0,008 288 M
NE 30 30 30 30 28 28 28 28 28 28 REF.
L 0,019 0,030 0,030 0,020 0,023 0,022 0,025 0,029 0,018 0,014 SD
Sr : repeatability standard deviation of each laboratory limit 0,016 g/100g M = mean per sample
NL : number of measurements per laboratory SD = standard deviation per sampleL : Limit for difference between duplicates according Cochran test at 5% level.
SE : repeatability standard deviation per sample REF : Assigned values are robust average values per sample according to algorithm A of standard ISO 13528,NE : number of measurements per sample of 12 laboratories using the reference method ISO 1211│IDF 1, after outliers discarging using Grubbs test at 5 % *: discarded data using the test of Cochran at 5 % risk level.** : missing datar : limit of repeatability, absolute difference betwen two replicates=0,043 according ISO 1211 IDF 1D 2010 Table IV :
Sample
Outliers
Cochran
Outlier
Grubbs
sr
SR
ICAR Proficiency Test March 2018 ICAR Proficiency Test March 2018
DETERMINATION of FAT in RAW (cow) MILK - page 3/8 DETERMINATION of FAT in RAW (cow) MILK - page 4/8
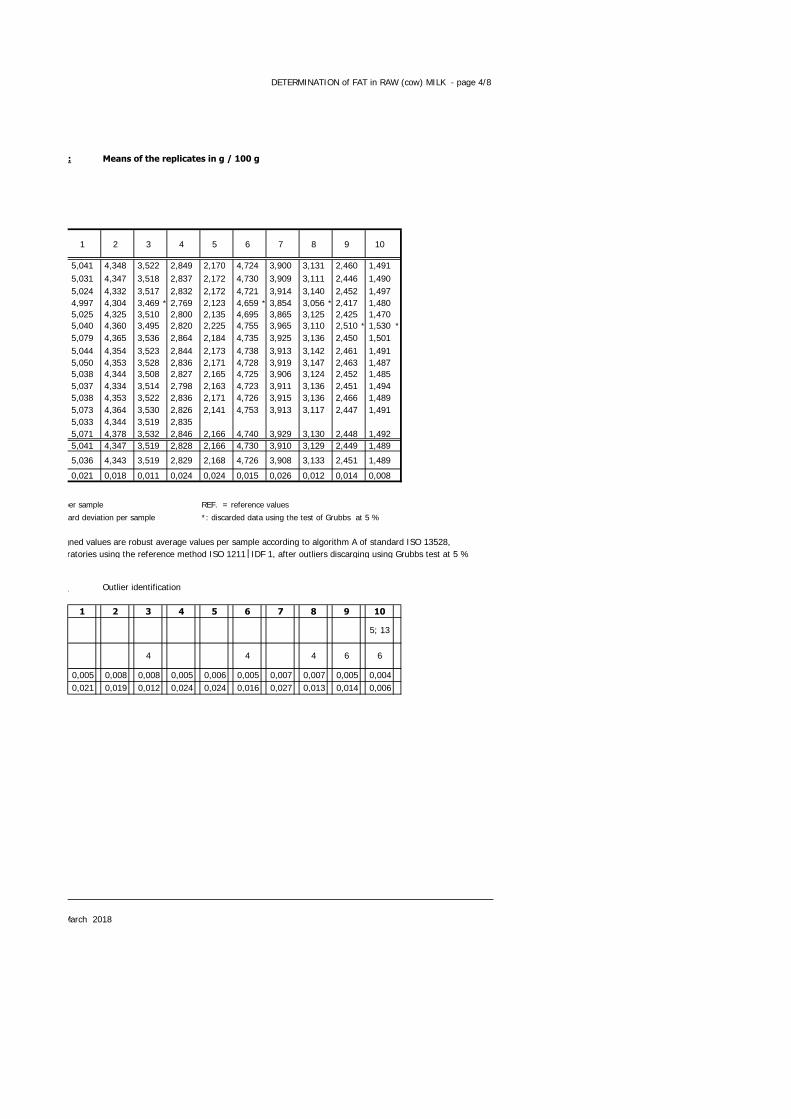
Table III : Means of the replicates in g / 100 g
1 2 3 4 5 6 7 8 9 10
5,041 4,348 3,522 2,849 2,170 4,724 3,900 3,131 2,460 1,4915,031 4,347 3,518 2,837 2,172 4,730 3,909 3,111 2,446 1,4905,024 4,332 3,517 2,832 2,172 4,721 3,914 3,140 2,452 1,4974,997 4,304 3,469 * 2,769 2,123 4,659 * 3,854 3,056 * 2,417 1,4805,025 4,325 3,510 2,800 2,135 4,695 3,865 3,125 2,425 1,4705,040 4,360 3,495 2,820 2,225 4,755 3,965 3,110 2,510 * 1,530 *
5,079 4,365 3,536 2,864 2,184 4,735 3,925 3,136 2,450 1,5015,044 4,354 3,523 2,844 2,173 4,738 3,913 3,142 2,461 1,4915,050 4,353 3,528 2,836 2,171 4,728 3,919 3,147 2,463 1,4875,038 4,344 3,508 2,827 2,165 4,725 3,906 3,124 2,452 1,4855,037 4,334 3,514 2,798 2,163 4,723 3,911 3,136 2,451 1,4945,038 4,353 3,522 2,836 2,171 4,726 3,915 3,136 2,466 1,4895,073 4,364 3,530 2,826 2,141 4,753 3,913 3,117 2,447 1,4915,033 4,344 3,519 2,8355,071 4,378 3,532 2,846 2,166 4,740 3,929 3,130 2,448 1,4925,041 4,347 3,519 2,828 2,166 4,730 3,910 3,129 2,449 1,489
5,036 4,343 3,519 2,829 2,168 4,726 3,908 3,133 2,451 1,489
0,021 0,018 0,011 0,024 0,024 0,015 0,026 0,012 0,014 0,008
M = mean per sample REF. = reference values
SD = standard deviation per sample *: discarded data using the test of Grubbs at 5 %
REF : Assigned values are robust average values per sample according to algorithm A of standard ISO 13528,of 12 laboratories using the reference method ISO 1211│IDF 1, after outliers discarging using Grubbs test at 5 %
Table IV : Outlier identification
1 2 3 4 5 6 7 8 9 10
0,005 0,008 0,008 0,005 0,006 0,005 0,007 0,007 0,005 0,0040,021 0,019 0,012 0,024 0,024 0,016 0,027 0,013 0,014 0,006
ICAR Proficiency Test March 2018
4 6 6
5; 13
44
DETERMINATION of FAT in RAW (cow) MILK - page 4/8 DETERMINATION of FAT in RAW (cow) MILK - page 5/8
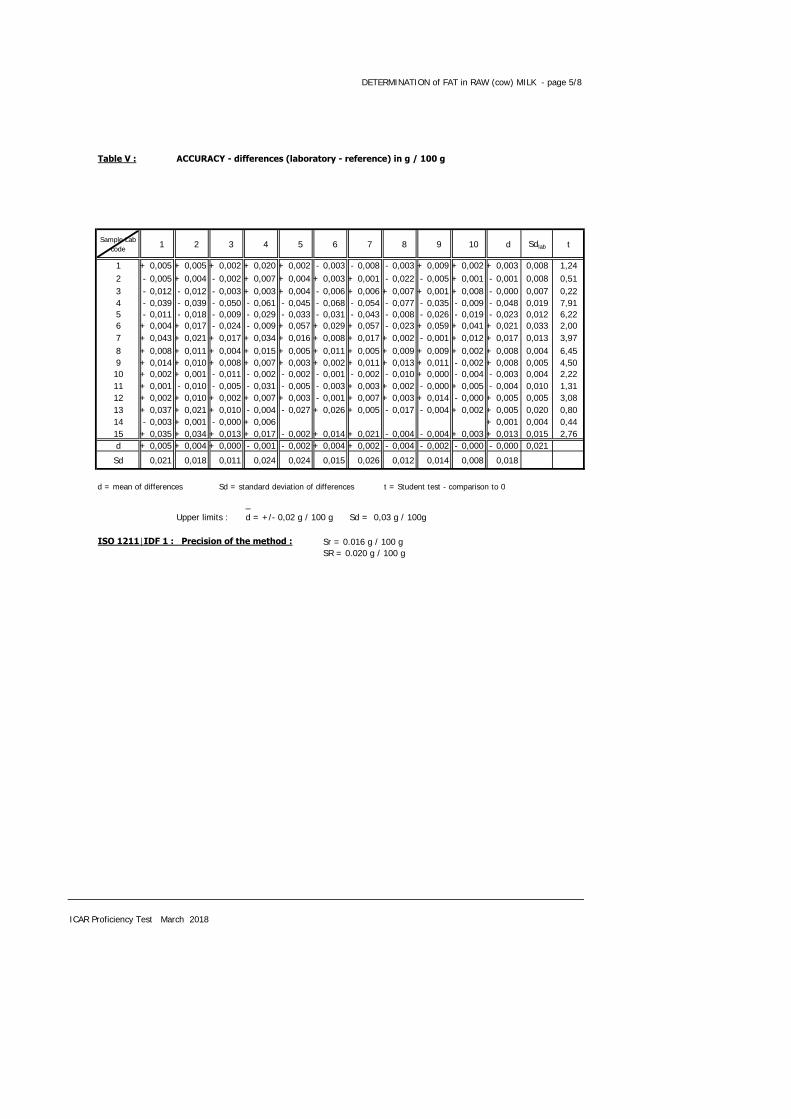
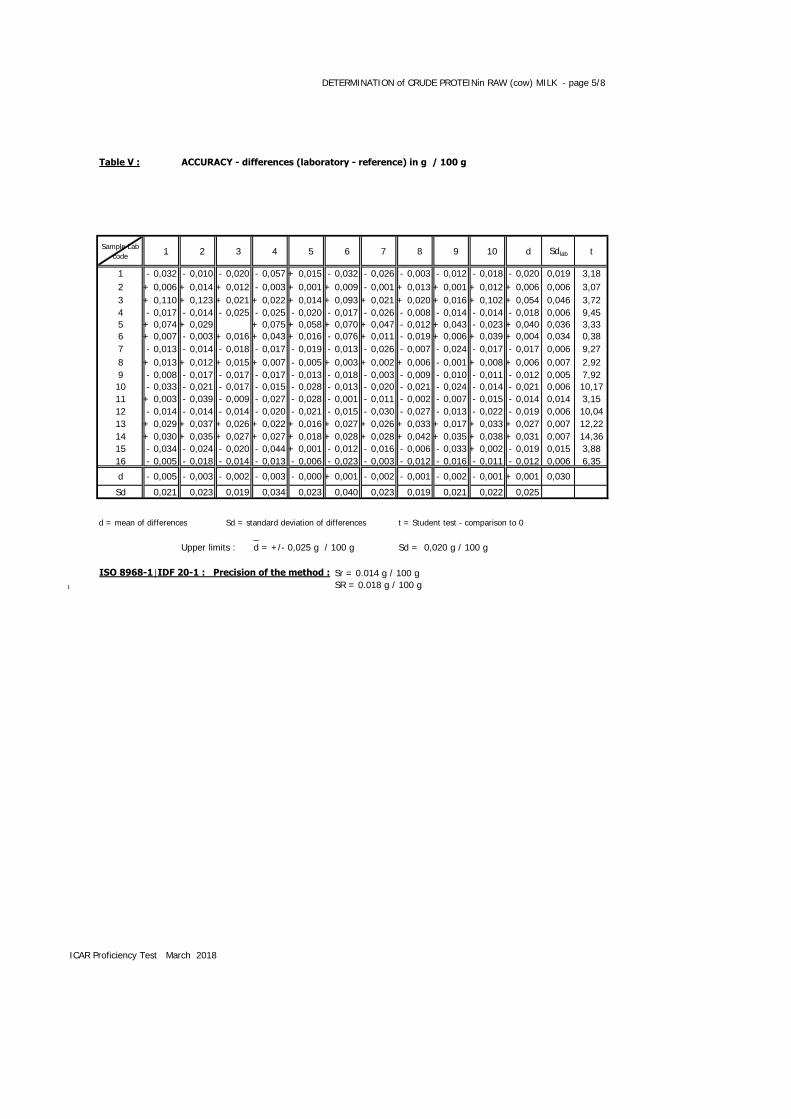
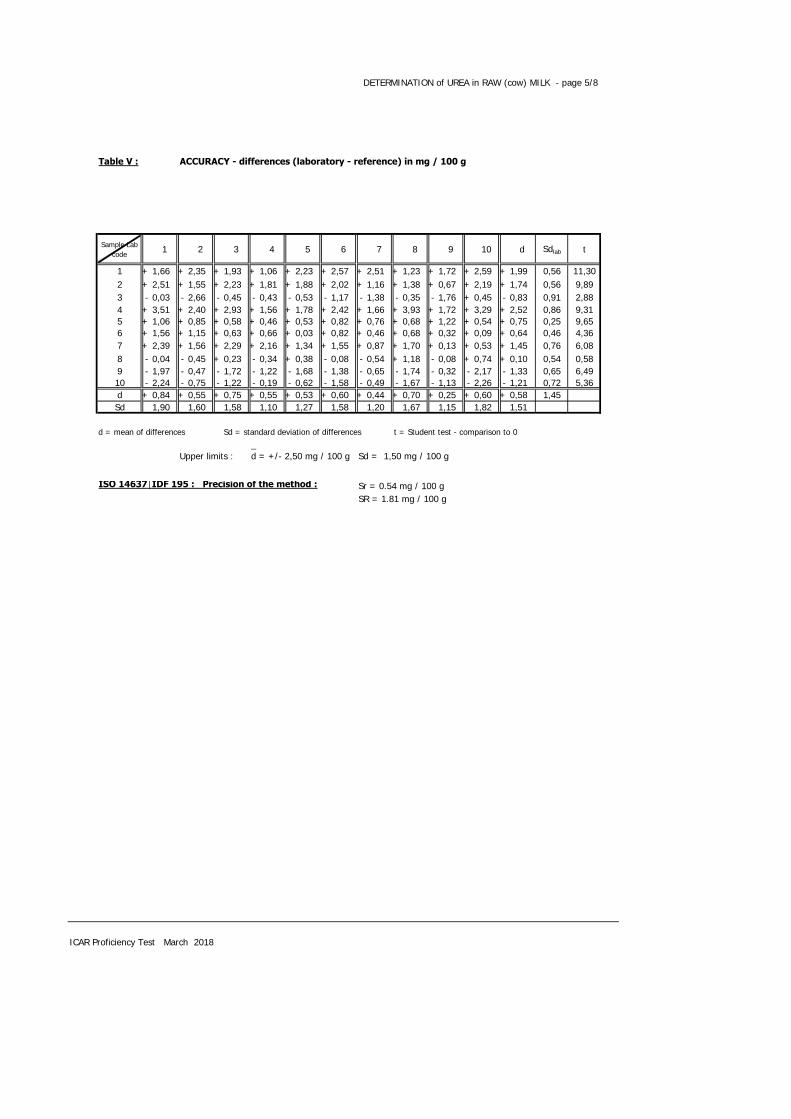
Table V : ACCURACY - differences (laboratory - reference) in g / 100 g
Sample Lab code 1 2 3 4 5 6 7 8 9 10 d Sdlab t
1 + 0,005 + 0,005 + 0,002 + 0,020 + 0,002 - 0,003 - 0,008 - 0,003 + 0,009 + 0,002 + 0,003 0,008 1,242 - 0,005 + 0,004 - 0,002 + 0,007 + 0,004 + 0,003 + 0,001 - 0,022 - 0,005 + 0,001 - 0,001 0,008 0,513 - 0,012 - 0,012 - 0,003 + 0,003 + 0,004 - 0,006 + 0,006 + 0,007 + 0,001 + 0,008 - 0,000 0,007 0,224 - 0,039 - 0,039 - 0,050 - 0,061 - 0,045 - 0,068 - 0,054 - 0,077 - 0,035 - 0,009 - 0,048 0,019 7,915 - 0,011 - 0,018 - 0,009 - 0,029 - 0,033 - 0,031 - 0,043 - 0,008 - 0,026 - 0,019 - 0,023 0,012 6,226 + 0,004 + 0,017 - 0,024 - 0,009 + 0,057 + 0,029 + 0,057 - 0,023 + 0,059 + 0,041 + 0,021 0,033 2,007 + 0,043 + 0,021 + 0,017 + 0,034 + 0,016 + 0,008 + 0,017 + 0,002 - 0,001 + 0,012 + 0,017 0,013 3,978 + 0,008 + 0,011 + 0,004 + 0,015 + 0,005 + 0,011 + 0,005 + 0,009 + 0,009 + 0,002 + 0,008 0,004 6,459 + 0,014 + 0,010 + 0,008 + 0,007 + 0,003 + 0,002 + 0,011 + 0,013 + 0,011 - 0,002 + 0,008 0,005 4,5010 + 0,002 + 0,001 - 0,011 - 0,002 - 0,002 - 0,001 - 0,002 - 0,010 + 0,000 - 0,004 - 0,003 0,004 2,2211 + 0,001 - 0,010 - 0,005 - 0,031 - 0,005 - 0,003 + 0,003 + 0,002 - 0,000 + 0,005 - 0,004 0,010 1,3112 + 0,002 + 0,010 + 0,002 + 0,007 + 0,003 - 0,001 + 0,007 + 0,003 + 0,014 - 0,000 + 0,005 0,005 3,0813 + 0,037 + 0,021 + 0,010 - 0,004 - 0,027 + 0,026 + 0,005 - 0,017 - 0,004 + 0,002 + 0,005 0,020 0,8014 - 0,003 + 0,001 - 0,000 + 0,006 + 0,001 0,004 0,4415 + 0,035 + 0,034 + 0,013 + 0,017 - 0,002 + 0,014 + 0,021 - 0,004 - 0,004 + 0,003 + 0,013 0,015 2,76d + 0,005 + 0,004 + 0,000 - 0,001 - 0,002 + 0,004 + 0,002 - 0,004 - 0,002 - 0,000 - 0,000 0,021
Sd 0,021 0,018 0,011 0,024 0,024 0,015 0,026 0,012 0,014 0,008 0,018
d = mean of differences Sd = standard deviation of differences t = Student test - comparison to 0
_Upper limits : d = +/- 0,02 g / 100 g Sd = 0,03 g / 100g
ISO 1211│IDF 1 : Precision of the method : Sr = 0.016 g / 100 gSR = 0.020 g / 100 g
ICAR Proficiency Test March 2018
DETERMINATION of FAT in RAW (cow) MILK - page 5/8 DETERMINATION of FAT in RAW (cow) MILK - page 6/8
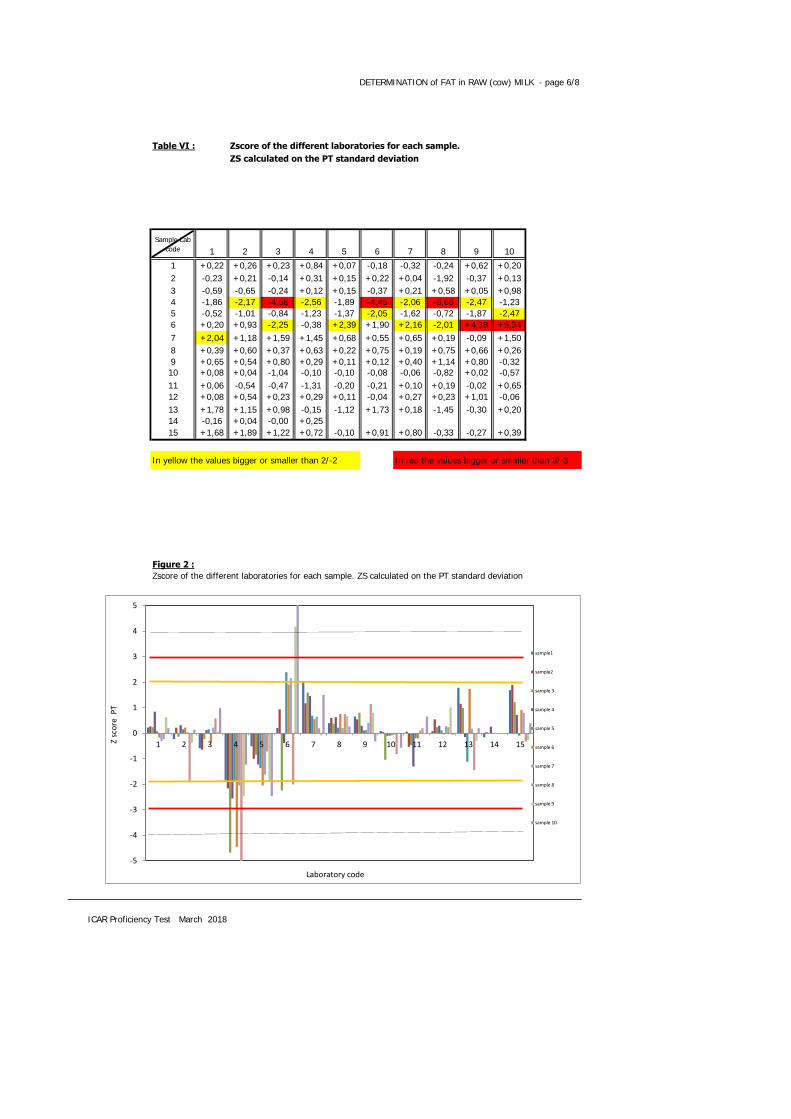
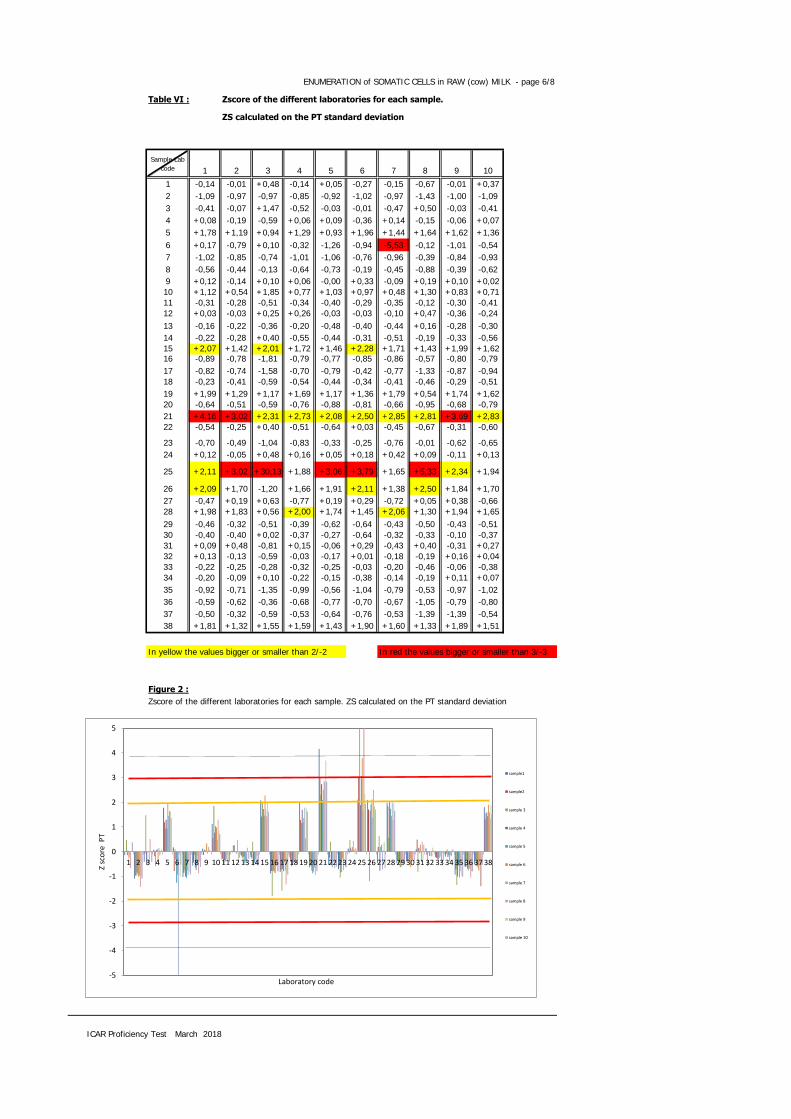
Table VI : Zscore of the different laboratories for each sample.
ZS calculated on the PT standard deviation
Sample Lab code 1 2 3 4 5 6 7 8 9 10
1 +0,22 +0,26 +0,23 +0,84 +0,07 -0,18 -0,32 -0,24 +0,62 +0,202 -0,23 +0,21 -0,14 +0,31 +0,15 +0,22 +0,04 -1,92 -0,37 +0,133 -0,59 -0,65 -0,24 +0,12 +0,15 -0,37 +0,21 +0,58 +0,05 +0,984 -1,86 -2,17 -4,68 -2,56 -1,89 -4,46 -2,06 -6,66 -2,47 -1,235 -0,52 -1,01 -0,84 -1,23 -1,37 -2,05 -1,62 -0,72 -1,87 -2,476 +0,20 +0,93 -2,25 -0,38 +2,39 +1,90 +2,16 -2,01 +4,18 +5,347 +2,04 +1,18 +1,59 +1,45 +0,68 +0,55 +0,65 +0,19 -0,09 +1,508 +0,39 +0,60 +0,37 +0,63 +0,22 +0,75 +0,19 +0,75 +0,66 +0,269 +0,65 +0,54 +0,80 +0,29 +0,11 +0,12 +0,40 +1,14 +0,80 -0,3210 +0,08 +0,04 -1,04 -0,10 -0,10 -0,08 -0,06 -0,82 +0,02 -0,5711 +0,06 -0,54 -0,47 -1,31 -0,20 -0,21 +0,10 +0,19 -0,02 +0,6512 +0,08 +0,54 +0,23 +0,29 +0,11 -0,04 +0,27 +0,23 +1,01 -0,0613 +1,78 +1,15 +0,98 -0,15 -1,12 +1,73 +0,18 -1,45 -0,30 +0,2014 -0,16 +0,04 -0,00 +0,2515 +1,68 +1,89 +1,22 +0,72 -0,10 +0,91 +0,80 -0,33 -0,27 +0,39
In yellow the values bigger or smaller than 2/-2 In red the values bigger or smaller than 3/-3
Figure 2 :
Zscore of the different laboratories for each sample. ZS calculated on the PT standard deviation
ICAR Proficiency Test March 2018
-5
-4
-3
-2
-1
0
1
2
3
4
5
1 2 3 4 5 6 7 8 9 10 11 12 13 14 15Z sc
ore
PT
Laboratory code
sample1
sample2
sample 3
sample 4
sample 5
sample 6
sample 7
sample 8
sample 9
sample 10

DETERMINATION of FAT in RAW (cow) MILK - page 6/8 DETERMINATION of FAT in RAW (cow) MILK - page 7/8
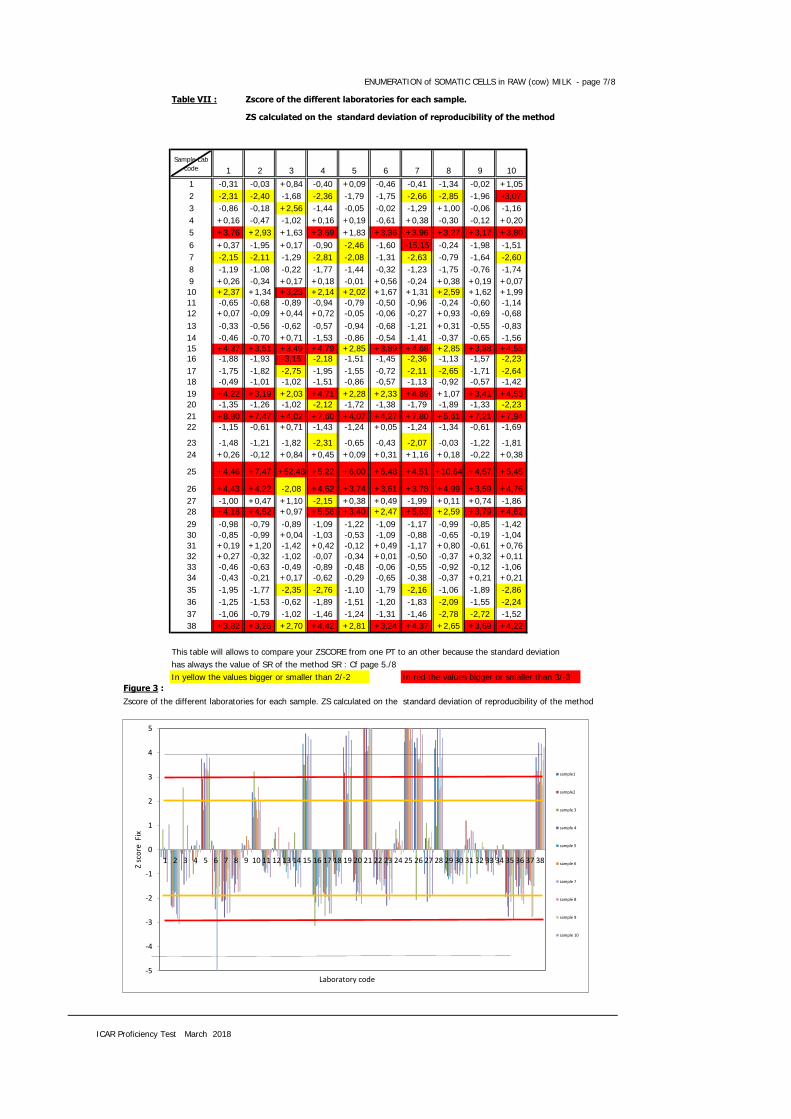
Table VII : Zscore of the different laboratories for each sample.
ZS calculated on the standard deviation of reproducibility of the method
Sample Lab code 1 2 3 4 5 6 7 8 9 10
1 +0,23 +0,24 +0,12 +1,00 +0,08 -0,13 -0,42 -0,14 +0,44 +0,082 -0,24 +0,19 -0,08 +0,37 +0,18 +0,17 +0,06 -1,12 -0,26 +0,053 -0,62 -0,59 -0,13 +0,15 +0,18 -0,28 +0,28 +0,33 +0,04 +0,384 -1,94 -1,96 -2,50 -3,03 -2,27 -3,38 -2,72 -3,87 -1,74 -0,475 -0,54 -0,91 -0,45 -1,45 -1,64 -1,56 -2,14 -0,42 -1,31 -0,956 +0,21 +0,84 -1,20 -0,45 +2,86 +1,44 +2,86 -1,17 +2,94 +2,057 +2,13 +1,06 +0,85 +1,72 +0,81 +0,42 +0,86 +0,11 -0,06 +0,588 +0,41 +0,54 +0,20 +0,75 +0,26 +0,57 +0,26 +0,43 +0,46 +0,109 +0,68 +0,49 +0,42 +0,35 +0,13 +0,09 +0,53 +0,66 +0,56 -0,1210 +0,09 +0,04 -0,56 -0,12 -0,12 -0,06 -0,08 -0,48 +0,01 -0,2211 +0,06 -0,49 -0,25 -1,55 -0,24 -0,16 +0,13 +0,11 -0,01 +0,2512 +0,08 +0,49 +0,12 +0,35 +0,13 -0,03 +0,36 +0,13 +0,71 -0,0213 +1,86 +1,04 +0,52 -0,18 -1,34 +1,32 +0,23 -0,84 -0,21 +0,0814 -0,17 +0,04 -0,00 +0,3015 +1,76 +1,71 +0,65 +0,85 -0,12 +0,69 +1,06 -0,19 -0,19 +0,15
This table will allows to compare your ZSCORE from one PT to an other because the standard deviation
has always the value of SR of the method SR=0,02
In yellow the values bigger or smaller than 2/-2 In red the values bigger or smaller than 3/-3
Figure 3 :
Zscore of the different laboratories for each sample. ZS calculated on the standard deviation of reproducibility of the method
ICAR Proficiency Test March 2018
-5
-4
-3
-2
-1
0
1
2
3
4
5
1 2 3 4 5 6 7 8 9 10 11 12 13 14 15
Z sc
ore
Fix
Laboratory code
sample1
sample2
sample 3
sample 4
sample 5
sample 6
sample 7
sample 8
sample 9
sample 10
DETERMINATION of FAT in RAW (cow) MILK - page 7/8 DETERMINATION of FAT in RAW (cow) MILK - page 8/8
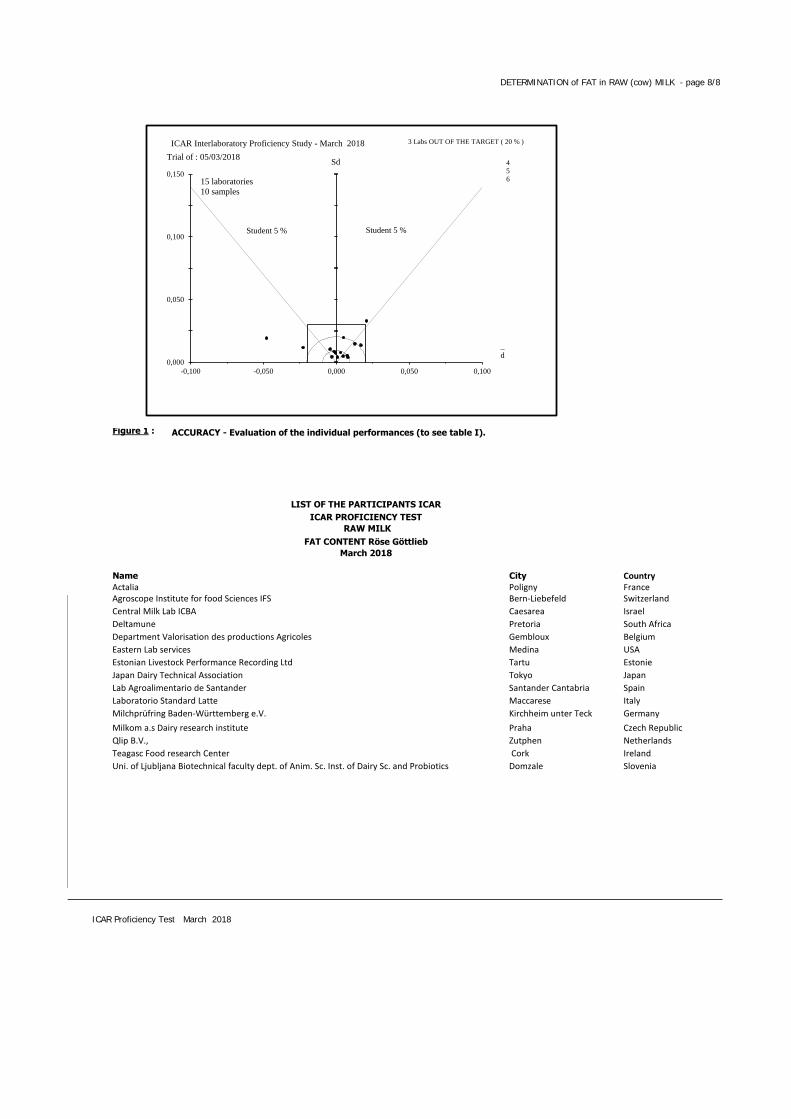
Figure 1 : ACCURACY - Evaluation of the individual performances (to see table I).
LIST OF THE PARTICIPANTS ICAR
ICAR PROFICIENCY TEST
RAW MILK
FAT CONTENT Röse Göttlieb
March 2018
Name City CountryActalia Poligny FranceAgroscope Institute for food Sciences IFS Bern-Liebefeld Switzerland
Central Milk Lab ICBA Caesarea Israel
Deltamune Pretoria South Africa
Department Valorisation des productions Agricoles Gembloux Belgium
Eastern Lab services Medina USA
Estonian Livestock Performance Recording Ltd Tartu Estonie
Japan Dairy Technical Association Tokyo Japan
Lab Agroalimentario de Santander Santander Cantabria Spain
Laboratorio Standard Latte Maccarese Italy
Milchprüfring Baden-Württemberg e.V. Kirchheim unter Teck Germany
Milkom a.s Dairy research institute Praha Czech Republic
Qlip B.V., Zutphen Netherlands
Teagasc Food research Center Cork Ireland
Uni. of Ljubljana Biotechnical faculty dept. of Anim. Sc. Inst. of Dairy Sc. and Probiotics Domzale Slovenia
ICAR Proficiency Test March 2018
0,000
0,050
0,100
0,150
-0,100 -0,050 0,000 0,050 0,100
Sd
Student 5 % Student 5 %
_
d
Trial of : 05/03/2018
15 laboratories
10 samples
3 Labs OUT OF THE TARGET ( 20 % )
4
5
6
ICAR Interlaboratory Proficiency Study - March 2018

DETERMINATION of CRUDE PROTEINin RAW (cow) MILK - page 1/8
ICAR
PROFICIENCY TESTING SCHEME
---------
March 2018
Raw Milk
Determination of CRUDE PROTEIN CONTENT
KJELDAHL Method
Sending date of statistical treatment : 3th April 2018
Frame of activity : ICAR Milk Analyses Sub Committee (MA SC)ICAR Staff Silvia Orlandini [email protected] [email protected]
Proficiency test accreditated ISO 17043
ACCRÉDITATION N° 1-2473 PORTÉE DISPONIBLE SUR WWW.COFRAC.FR
DETERMINATION of CRUDE PROTEINin RAW (cow) MILK - page 1/8 DETERMINATION of CRUDE PROTEINin RAW (cow) MILK - page 2/8
Table I : Ranking of the laboratories Units : g / 100 g
Nb % N° d Sd DThe table should be studied in parallel with figure 1 where the
1 6 9 - 0,009 0,005 0,011 laboratories are located according to an acceptability area (or target)2 13 16 - 0,009 0,006 0,011 the limits of which are :3 19 2 + 0,009 0,006 0,0114 25 8 + 0,009 0,007 0,0115 31 7 - 0,014 0,006 0,015 _6 38 4 - 0,015 0,006 0,016 +/- 0,025 g / 100 g for d and 0,020 g / 100 g for Sd7 44 11 - 0,011 0,014 0,0178 50 12 - 0,016 0,007 0,0179 56 10 - 0,018 0,006 0,019 REF : Assigned values are robust average values per sample according to10 63 15 - 0,016 0,014 0,021 algorithm A of standard ISO 13528, of 14 laboratories using the reference 11 69 1 - 0,017 0,019 0,025 method (ISO 8968-1│IDF 20-1), after outlier discarging using Grubbs test at12 75 13 + 0,029 0,007 0,030 5% risk level13 81 6 + 0,007 0,034 0,03414 88 14 + 0,034 0,007 0,035 N.B. : N° 10 and 15 Method not communicated
15 94 5 + 0,043 0,037 0,05716 100 3 + 0,057 0,046 0,074
(NC : OUT of RANKING because of insufficient data number)
(Nb : laboratory rank; % : relative rank)
(N° : laboratory identification number)
(d et Sd : mean and standard deviation of the differences (laboratory -reference))(D : Euclidian distance to YX-axis origin = SQUARE ROOT.(d² + Sd²))
Note : Limits are only indicative and so far do not constitute standard values; they indicate what is normally reachable by labs for their self evaluation.
Repeatability standard deviation of this ICAR proficiency test (after Cochran elimination at 5 %) SrPT 0,007Reproducibility standard deviation of this ICAR proficiency test (after Cochran and Grubbs elimination at 5 %) SRPT 0,026
ICAR Proficiency Test March 2018
DETERMINATION of CRUDE PROTEINin RAW (cow) MILK - page 2/8 DETERMINATION of CRUDE PROTEINin RAW (cow) MILK - page 3/8
Table II : REPEATABILITY - Absolute difference between replicates in g / 100 g
Sample Lab code
1 2 3 4 5 6 7 8 9 10 Sr NL
1 0,015 0,028 0,004 0,007 0,010 0,004 0,003 0,012 0,004 0,009 0,008 20
2 0,023 0,008 0,006 0,011 0,003 0,003 0,003 0,001 0,006 0,002 0,006 20
3 0,026 0,019 0,006 0,000 0,013 0,032 0,000 0,013 0,006 0,006 0,011 204 0,000 0,001 0,024 0,002 0,011 0,006 0,001 0,004 0,005 0,005 0,006 205 0,001 0,026 ** 0,032 0,011 0,018 0,009 0,008 0,031 * 0,020 0,014 186 0,010 0,027 0,011 0,024 0,010 0,024 0,013 0,009 0,006 0,003 0,011 207 0,018 0,012 0,005 0,008 0,003 0,017 0,008 0,006 0,003 0,008 0,007 20
8 0,000 0,001 0,003 0,001 0,000 0,001 0,006 0,006 0,001 0,001 0,002 209 0,013 0,017 0,015 0,010 0,003 0,018 0,018 0,002 0,011 0,000 0,009 2010 0,001 0,006 0,011 0,004 0,008 0,009 0,003 0,003 0,008 0,002 0,005 2011 0,001 0,001 0,021 0,008 0,011 0,009 0,028 * 0,002 0,001 0,002 0,009 2012 0,006 0,013 0,000 0,006 0,006 0,006 0,000 0,019 0,013 0,026 0,009 2013 0,004 0,002 0,001 0,013 0,000 0,004 0,004 0,003 0,003 0,003 0,003 2014 0,004 0,002 0,005 0,000 0,005 0,010 0,006 0,001 0,020 0,003 0,006 2015 0,009 0,002 0,005 0,007 0,003 0,001 0,007 0,010 0,010 0,013 0,005 2016 0,001 0,001 0,016 0,005 0,002 0,011 0,010 0,004 0,005 0,006 0,006 20
Sr 0,008 0,010 0,008 0,008 0,005 0,010 0,007 0,006 0,008 0,007 318
NE 32 32 30 32 32 32 32 32 32 32L 0,031 0,039 0,030 0,032 0,020 0,037 0,021 0,022 0,022 0,026
Sr : repeatability standard deviation of each laboratory limit 0,014 g /100gNL : number of measurements per laboratory
L : Limit for difference between duplicates according Cochran test at 5% level.SE : repeatability standard deviation per sampleNE : number of measurements per sample*: discarded data using the test of Cochran at 5 %** : missing datar : limit of repeatability, absolute difference betwen two replicates=0,040 according ISO 8968 / IDF 20
ICAR Proficiency Test March 2018 ICAR Proficiency Test March 2018
DETERMINATION of CRUDE PROTEINin RAW (cow) MILK - page 3/8 DETERMINATION of CRUDE PROTEINin RAW (cow) MILK - page 4/8
Table III : Means of the replicates in g / 100 g
Sample Lab code 1 2 3 4 5 6 7 8 9 10
1 3,718 3,538 3,267 2,856 2,751 3,623 3,449 3,090 2,821 3,2842 3,755 3,562 3,299 2,910 2,737 3,664 3,474 3,105 2,834 3,3143 3,860 * 3,672 * 3,308 2,935 2,750 3,748 3,496 3,113 2,849 3,404 *4 3,732 3,535 3,262 2,888 2,716 3,638 3,448 3,085 2,819 3,2885 3,824 * 3,578 2,988 2,794 3,725 3,522 3,081 2,876 3,2796 3,757 3,546 3,303 2,956 2,752 3,579 3,485 3,074 2,839 3,3417 3,737 3,534 3,269 2,896 2,717 3,642 3,448 3,086 2,809 3,2858 3,763 3,560 3,302 2,920 2,731 3,658 3,477 3,099 2,832 3,3109 3,741 3,532 3,270 2,896 2,723 3,637 3,471 3,084 2,823 3,29010 3,717 3,527 3,270 2,898 2,707 3,642 3,454 3,072 2,809 3,28711 3,752 3,510 3,278 2,886 2,707 3,654 3,464 3,091 2,826 3,28712 3,735 3,535 3,273 2,893 2,715 3,640 3,445 3,066 2,820 3,27913 3,779 3,585 3,313 2,935 2,752 3,682 3,501 3,126 2,850 3,33414 3,779 3,583 3,314 2,940 2,754 3,683 3,503 3,134 2,868 3,34015 3,715 3,525 3,267 2,869 2,737 3,643 3,459 3,087 2,800 3,30316 3,744 3,531 3,273 2,900 2,730 3,632 3,471 3,081 2,817 3,290
M 3,745 3,545 3,285 2,910 2,736 3,656 3,473 3,092 2,831 3,301
REF. 3,749 3,548 3,287 2,913 2,736 3,655 3,475 3,093 2,833 3,302SD 0,021 0,023 0,019 0,034 0,023 0,040 0,023 0,019 0,021 0,022
M = mean per sample REF. = reference valuesSD = standard deviation per sample *: discarded data using the test of Grubbs 5 %
REF : Assigned values are robust average values per sample according to algorithm A of standard ISO 13528,of 14 laboratories using the reference method ISO 8968-1│IDF 20-1, after outliers discarging using Grubbs test at 5 % risk level.
Table IV : Outlier identification
Sample 1 2 3 4 5 6 7 8 9 10
Outliers
Cochran
Outlier
Grubbs
sr 0,007 0,010 0,008 0,008 0,005 0,010 0,005 0,006 0,006 0,007SR 0,022 0,024 0,020 0,034 0,023 0,041 0,024 0,020 0,018 0,023
ICAR Proficiency Test March 2018
3; 5 3
11
3
5
DETERMINATION of CRUDE PROTEINin RAW (cow) MILK - page 4/8 DETERMINATION of CRUDE PROTEINin RAW (cow) MILK - page 5/8
Table V : ACCURACY - differences (laboratory - reference) in g / 100 g
Sample Lab code 1 2 3 4 5 6 7 8 9 10 d Sdlab t
1 - 0,032 - 0,010 - 0,020 - 0,057 + 0,015 - 0,032 - 0,026 - 0,003 - 0,012 - 0,018 - 0,020 0,019 3,182 + 0,006 + 0,014 + 0,012 - 0,003 + 0,001 + 0,009 - 0,001 + 0,013 + 0,001 + 0,012 + 0,006 0,006 3,073 + 0,110 + 0,123 + 0,021 + 0,022 + 0,014 + 0,093 + 0,021 + 0,020 + 0,016 + 0,102 + 0,054 0,046 3,724 - 0,017 - 0,014 - 0,025 - 0,025 - 0,020 - 0,017 - 0,026 - 0,008 - 0,014 - 0,014 - 0,018 0,006 9,455 + 0,074 + 0,029 + 0,075 + 0,058 + 0,070 + 0,047 - 0,012 + 0,043 - 0,023 + 0,040 0,036 3,336 + 0,007 - 0,003 + 0,016 + 0,043 + 0,016 - 0,076 + 0,011 - 0,019 + 0,006 + 0,039 + 0,004 0,034 0,387 - 0,013 - 0,014 - 0,018 - 0,017 - 0,019 - 0,013 - 0,026 - 0,007 - 0,024 - 0,017 - 0,017 0,006 9,278 + 0,013 + 0,012 + 0,015 + 0,007 - 0,005 + 0,003 + 0,002 + 0,006 - 0,001 + 0,008 + 0,006 0,007 2,929 - 0,008 - 0,017 - 0,017 - 0,017 - 0,013 - 0,018 - 0,003 - 0,009 - 0,010 - 0,011 - 0,012 0,005 7,9210 - 0,033 - 0,021 - 0,017 - 0,015 - 0,028 - 0,013 - 0,020 - 0,021 - 0,024 - 0,014 - 0,021 0,006 10,1711 + 0,003 - 0,039 - 0,009 - 0,027 - 0,028 - 0,001 - 0,011 - 0,002 - 0,007 - 0,015 - 0,014 0,014 3,1512 - 0,014 - 0,014 - 0,014 - 0,020 - 0,021 - 0,015 - 0,030 - 0,027 - 0,013 - 0,022 - 0,019 0,006 10,0413 + 0,029 + 0,037 + 0,026 + 0,022 + 0,016 + 0,027 + 0,026 + 0,033 + 0,017 + 0,033 + 0,027 0,007 12,2214 + 0,030 + 0,035 + 0,027 + 0,027 + 0,018 + 0,028 + 0,028 + 0,042 + 0,035 + 0,038 + 0,031 0,007 14,3615 - 0,034 - 0,024 - 0,020 - 0,044 + 0,001 - 0,012 - 0,016 - 0,006 - 0,033 + 0,002 - 0,019 0,015 3,8816 - 0,005 - 0,018 - 0,014 - 0,013 - 0,006 - 0,023 - 0,003 - 0,012 - 0,016 - 0,011 - 0,012 0,006 6,35
d - 0,005 - 0,003 - 0,002 - 0,003 - 0,000 + 0,001 - 0,002 - 0,001 - 0,002 - 0,001 + 0,001 0,030
Sd 0,021 0,023 0,019 0,034 0,023 0,040 0,023 0,019 0,021 0,022 0,025
d = mean of differences Sd = standard deviation of differences t = Student test - comparison to 0
_Upper limits : d = +/- 0,025 g / 100 g Sd = 0,020 g / 100 g
ISO 8968-1│IDF 20-1 : Precision of the method : Sr = 0.014 g / 100 gof 14 laboratories using the reference method ISO 8968-1│IDF 20-1, after outliers discarging using Grubbs test at 5 % SR = 0.018 g / 100 g
ICAR Proficiency Test March 2018
DETERMINATION of CRUDE PROTEINin RAW (cow) MILK - page 5/8 DETERMINATION of CRUDE PROTEINin RAW (cow) MILK - page 6/8
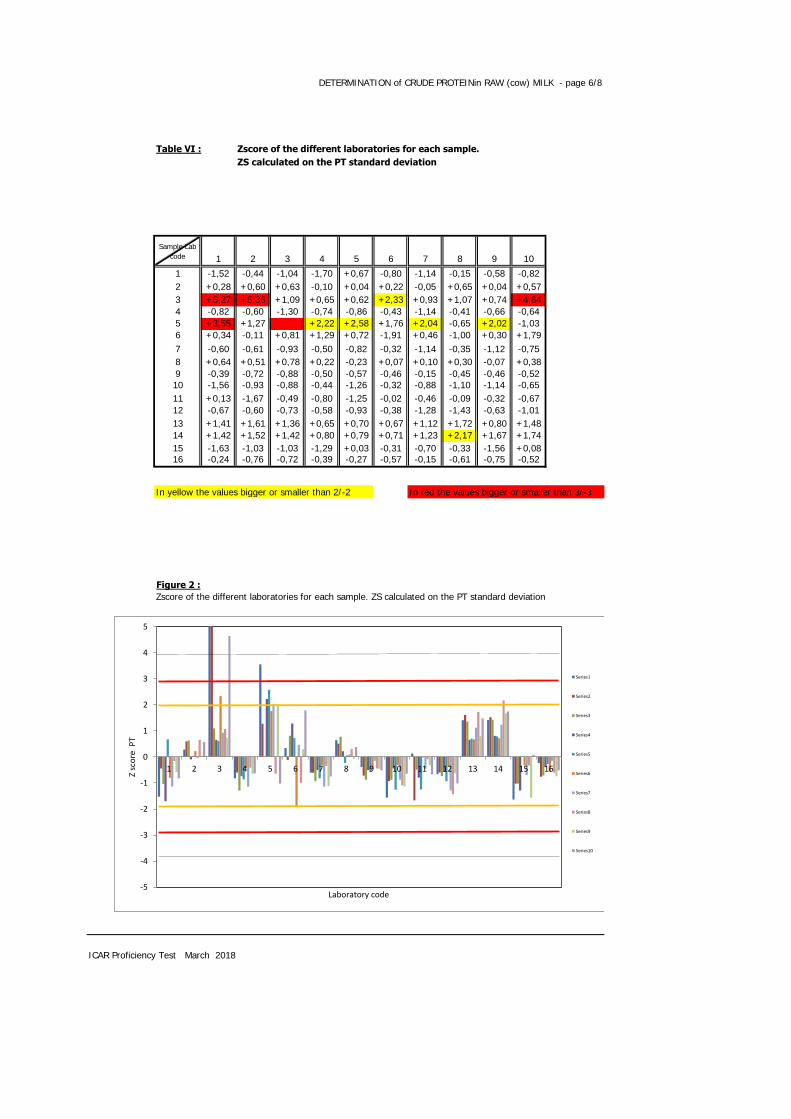
Table VI : Zscore of the different laboratories for each sample.
ZS calculated on the PT standard deviation
Sample Lab code 1 2 3 4 5 6 7 8 9 10
1 -1,52 -0,44 -1,04 -1,70 +0,67 -0,80 -1,14 -0,15 -0,58 -0,822 +0,28 +0,60 +0,63 -0,10 +0,04 +0,22 -0,05 +0,65 +0,04 +0,573 +5,27 +5,36 +1,09 +0,65 +0,62 +2,33 +0,93 +1,07 +0,74 +4,644 -0,82 -0,60 -1,30 -0,74 -0,86 -0,43 -1,14 -0,41 -0,66 -0,645 +3,55 +1,27 +2,22 +2,58 +1,76 +2,04 -0,65 +2,02 -1,036 +0,34 -0,11 +0,81 +1,29 +0,72 -1,91 +0,46 -1,00 +0,30 +1,797 -0,60 -0,61 -0,93 -0,50 -0,82 -0,32 -1,14 -0,35 -1,12 -0,758 +0,64 +0,51 +0,78 +0,22 -0,23 +0,07 +0,10 +0,30 -0,07 +0,389 -0,39 -0,72 -0,88 -0,50 -0,57 -0,46 -0,15 -0,45 -0,46 -0,5210 -1,56 -0,93 -0,88 -0,44 -1,26 -0,32 -0,88 -1,10 -1,14 -0,6511 +0,13 -1,67 -0,49 -0,80 -1,25 -0,02 -0,46 -0,09 -0,32 -0,6712 -0,67 -0,60 -0,73 -0,58 -0,93 -0,38 -1,28 -1,43 -0,63 -1,0113 +1,41 +1,61 +1,36 +0,65 +0,70 +0,67 +1,12 +1,72 +0,80 +1,4814 +1,42 +1,52 +1,42 +0,80 +0,79 +0,71 +1,23 +2,17 +1,67 +1,7415 -1,63 -1,03 -1,03 -1,29 +0,03 -0,31 -0,70 -0,33 -1,56 +0,0816 -0,24 -0,76 -0,72 -0,39 -0,27 -0,57 -0,15 -0,61 -0,75 -0,52
In yellow the values bigger or smaller than 2/-2 In red the values bigger or smaller than 3/-3
Figure 2 :
Zscore of the different laboratories for each sample. ZS calculated on the PT standard deviation
ICAR Proficiency Test March 2018
-5
-4
-3
-2
-1
0
1
2
3
4
5
1 2 3 4 5 6 7 8 9 10 11 12 13 14 15 16
Z sc
ore
PT
Laboratory code
Series1
Series2
Series3
Series4
Series5
Series6
Series7
Series8
Series9
Series10
DETERMINATION of CRUDE PROTEINin RAW (cow) MILK - page 6/8 DETERMINATION of CRUDE PROTEINin RAW (cow) MILK - page 7/8
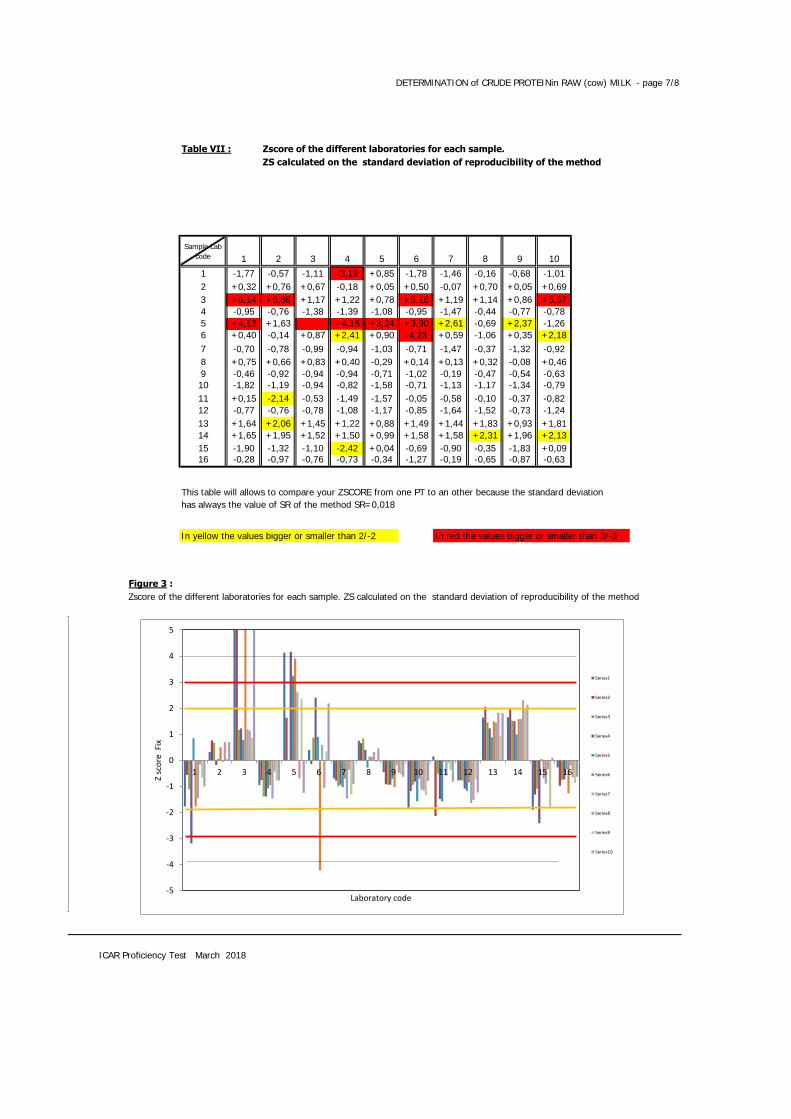
Table VII : Zscore of the different laboratories for each sample.
ZS calculated on the standard deviation of reproducibility of the method
Sample Lab code 1 2 3 4 5 6 7 8 9 10
1 -1,77 -0,57 -1,11 -3,19 +0,85 -1,78 -1,46 -0,16 -0,68 -1,012 +0,32 +0,76 +0,67 -0,18 +0,05 +0,50 -0,07 +0,70 +0,05 +0,693 +6,14 +6,86 +1,17 +1,22 +0,78 +5,18 +1,19 +1,14 +0,86 +5,674 -0,95 -0,76 -1,38 -1,39 -1,08 -0,95 -1,47 -0,44 -0,77 -0,785 +4,13 +1,63 +4,16 +3,24 +3,90 +2,61 -0,69 +2,37 -1,266 +0,40 -0,14 +0,87 +2,41 +0,90 -4,23 +0,59 -1,06 +0,35 +2,187 -0,70 -0,78 -0,99 -0,94 -1,03 -0,71 -1,47 -0,37 -1,32 -0,928 +0,75 +0,66 +0,83 +0,40 -0,29 +0,14 +0,13 +0,32 -0,08 +0,469 -0,46 -0,92 -0,94 -0,94 -0,71 -1,02 -0,19 -0,47 -0,54 -0,6310 -1,82 -1,19 -0,94 -0,82 -1,58 -0,71 -1,13 -1,17 -1,34 -0,7911 +0,15 -2,14 -0,53 -1,49 -1,57 -0,05 -0,58 -0,10 -0,37 -0,8212 -0,77 -0,76 -0,78 -1,08 -1,17 -0,85 -1,64 -1,52 -0,73 -1,2413 +1,64 +2,06 +1,45 +1,22 +0,88 +1,49 +1,44 +1,83 +0,93 +1,8114 +1,65 +1,95 +1,52 +1,50 +0,99 +1,58 +1,58 +2,31 +1,96 +2,1315 -1,90 -1,32 -1,10 -2,42 +0,04 -0,69 -0,90 -0,35 -1,83 +0,0916 -0,28 -0,97 -0,76 -0,73 -0,34 -1,27 -0,19 -0,65 -0,87 -0,63
This table will allows to compare your ZSCORE from one PT to an other because the standard deviation has always the value of SR of the method SR=0,018
In yellow the values bigger or smaller than 2/-2 In red the values bigger or smaller than 3/-3
Figure 3 :
Zscore of the different laboratories for each sample. ZS calculated on the standard deviation of reproducibility of the method
ICAR Proficiency Test March 2018
-5
-4
-3
-2
-1
0
1
2
3
4
5
1 2 3 4 5 6 7 8 9 10 11 12 13 14 15 16
Z sc
ore
Fix
Laboratory code
Series1
Series2
Series3
Series4
Series5
Series6
Series7
Series8
Series9
Series10
DETERMINATION of CRUDE PROTEINin RAW (cow) MILK - page 7/8 DETERMINATION of CRUDE PROTEINin RAW (cow) MILK - page 8/8
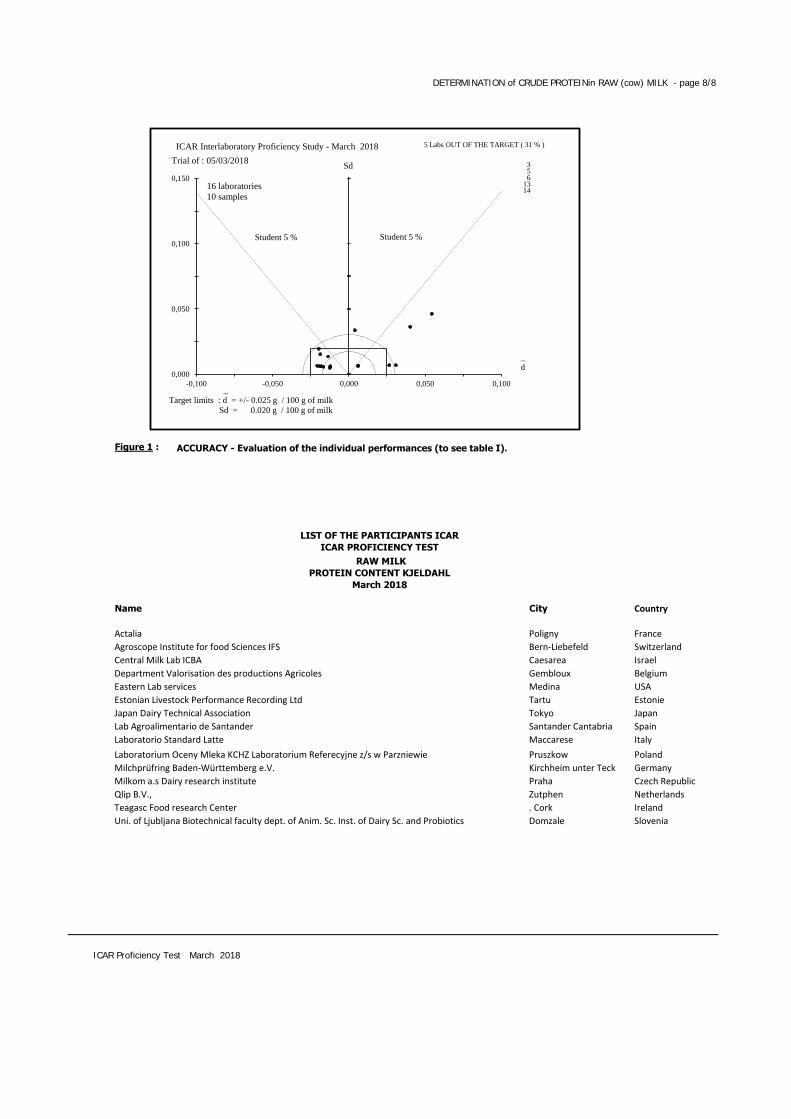
Figure 1 : ACCURACY - Evaluation of the individual performances (to see table I).
LIST OF THE PARTICIPANTS ICAR
ICAR PROFICIENCY TEST
RAW MILK
PROTEIN CONTENT KJELDAHL
March 2018
Name City Country
Actalia Poligny France
Agroscope Institute for food Sciences IFS Bern-Liebefeld Switzerland
Central Milk Lab ICBA Caesarea Israel
Department Valorisation des productions Agricoles Gembloux Belgium
Eastern Lab services Medina USA
Estonian Livestock Performance Recording Ltd Tartu Estonie
Japan Dairy Technical Association Tokyo Japan
Lab Agroalimentario de Santander Santander Cantabria Spain
Laboratorio Standard Latte Maccarese Italy
Laboratorium Oceny Mleka KCHZ Laboratorium Referecyjne z/s w Parzniewie Pruszkow Poland
Milchprüfring Baden-Württemberg e.V. Kirchheim unter Teck Germany
Milkom a.s Dairy research institute Praha Czech Republic
Qlip B.V., Zutphen Netherlands
Teagasc Food research Center . Cork Ireland
Uni. of Ljubljana Biotechnical faculty dept. of Anim. Sc. Inst. of Dairy Sc. and Probiotics Domzale Slovenia
ICAR Proficiency Test March 2018
0,000
0,050
0,100
0,150
-0,100 -0,050 0,000 0,050 0,100
Sd
Student 5 % Student 5 %
_
Target limits : d = +/- 0.025 g / 100 g of milk
Sd = 0.020 g / 100 g of milk
_
d
Trial of : 05/03/2018
16 laboratories
10 samples
5 Labs OUT OF THE TARGET ( 31 % )
3 5 6
13 14
ICAR Interlaboratory Proficiency Study - March 2018
DETERMINATION of LACTOSE in RAW (cow) MILK - page 1/8
ICAR
PROFICIENCY TESTING SCHEME
---------
March 2018
Raw Milk
Determination of LACTOSE CONTENT
Repeatability standard deviation of this ICAR proficiency test (after Cochran elimination at 5 %)
Sending date of statistical treatment : 3th April 2018 Reproducibility standard deviation of this ICAR proficiency test (after Cochran and Grubbs elimination at 5 %)
Frame of activity : ICAR Milk Analyses Sub Committee (MA SC)ICAR Staff Silvia Orlandini [email protected] [email protected]
ICAR Proficiency Test March 2018
ACCRÉDITATION N° 1-2473 PORTÉE DISPONIBLE SUR WWW.COFRAC.FR
DETERMINATION of LACTOSE in RAW (cow) MILK - page 1/8 DETERMINATION of LACTOSE in RAW (cow) MILK - page 2/8
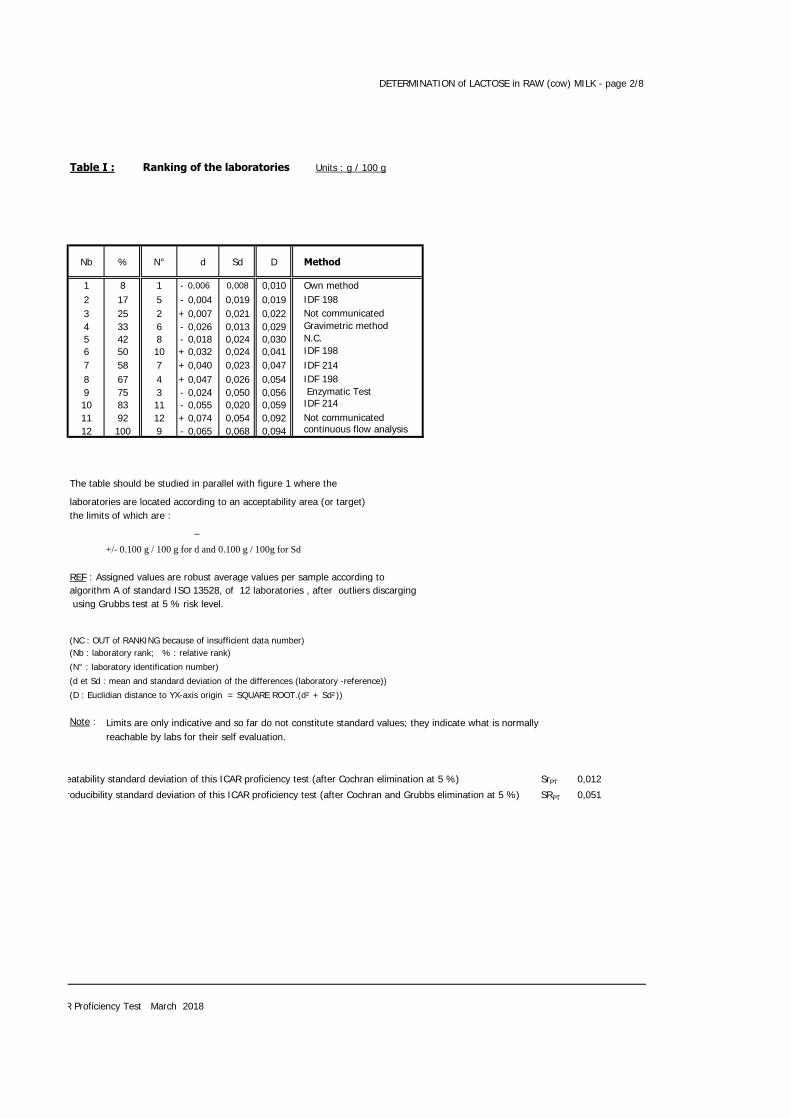
Table I : Ranking of the laboratories Units : g / 100 g
Nb % N° d Sd D Method
1 8 1 - 0,006 0,008 0,010 Own method2 17 5 - 0,004 0,019 0,019 IDF 1983 25 2 + 0,007 0,021 0,022 Not communicated4 33 6 - 0,026 0,013 0,029 Gravimetric method5 42 8 - 0,018 0,024 0,030 N.C.6 50 10 + 0,032 0,024 0,041 IDF 1987 58 7 + 0,040 0,023 0,047 IDF 2148 67 4 + 0,047 0,026 0,054 IDF 1989 75 3 - 0,024 0,050 0,056 Enzymatic Test 10 83 11 - 0,055 0,020 0,059 IDF 21411 92 12 + 0,074 0,054 0,092 Not communicated12 100 9 - 0,065 0,068 0,094 continuous flow analysis
The table should be studied in parallel with figure 1 where the
laboratories are located according to an acceptability area (or target)the limits of which are :
_
+/- 0.100 g / 100 g for d and 0.100 g / 100g for Sd
REF : Assigned values are robust average values per sample according toalgorithm A of standard ISO 13528, of 12 laboratories , after outliers discarging using Grubbs test at 5 % risk level.
(NC : OUT of RANKING because of insufficient data number)(Nb : laboratory rank; % : relative rank)
(N° : laboratory identification number)
(d et Sd : mean and standard deviation of the differences (laboratory -reference))
(D : Euclidian distance to YX-axis origin = SQUARE ROOT.(d² + Sd²))
Note : Limits are only indicative and so far do not constitute standard values; they indicate what is normally reachable by labs for their self evaluation.
Repeatability standard deviation of this ICAR proficiency test (after Cochran elimination at 5 %) SrPT 0,012
Reproducibility standard deviation of this ICAR proficiency test (after Cochran and Grubbs elimination at 5 %) SRPT 0,051
ICAR Proficiency Test March 2018
DETERMINATION of LACTOSE in RAW (cow) MILK - page 2/8 DETERMINATION of LACTOSE in RAW (cow) MILK - page 3/8
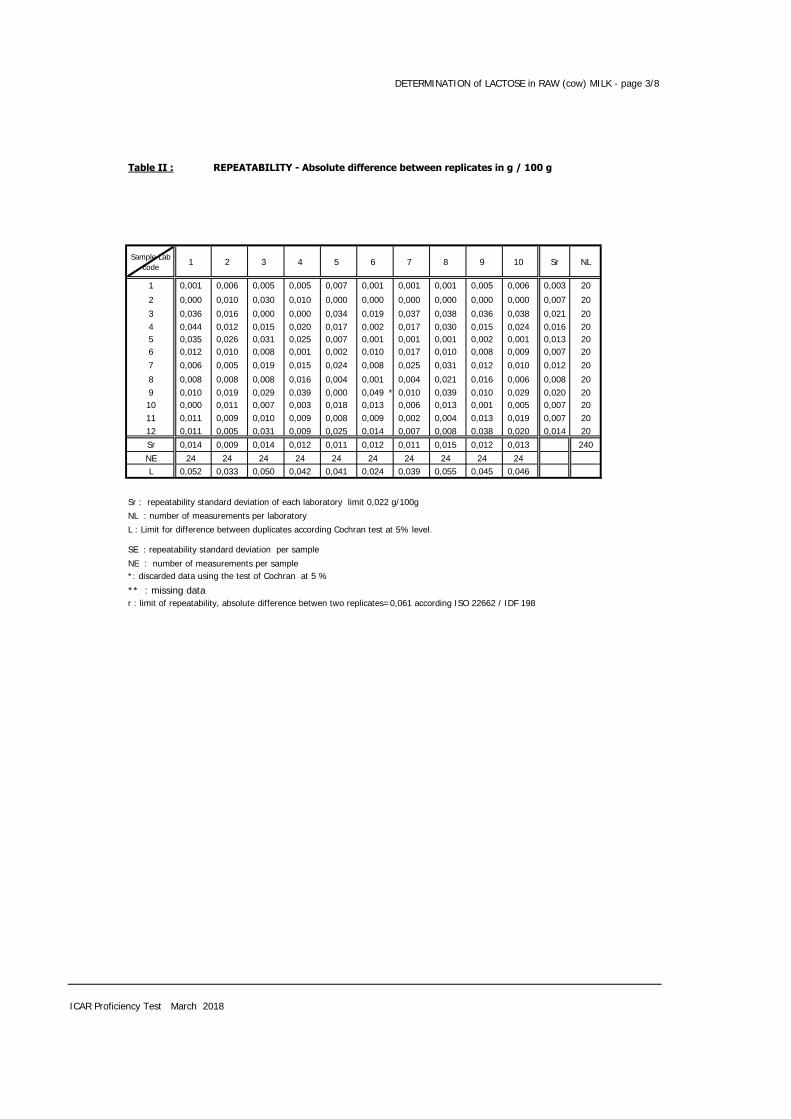
Table II : REPEATABILITY - Absolute difference between replicates in g / 100 g
Sample Lab code
1 2 3 4 5 6 7 8 9 10 Sr NL
1 0,001 0,006 0,005 0,005 0,007 0,001 0,001 0,001 0,005 0,006 0,003 20
2 0,000 0,010 0,030 0,010 0,000 0,000 0,000 0,000 0,000 0,000 0,007 20
3 0,036 0,016 0,000 0,000 0,034 0,019 0,037 0,038 0,036 0,038 0,021 204 0,044 0,012 0,015 0,020 0,017 0,002 0,017 0,030 0,015 0,024 0,016 205 0,035 0,026 0,031 0,025 0,007 0,001 0,001 0,001 0,002 0,001 0,013 206 0,012 0,010 0,008 0,001 0,002 0,010 0,017 0,010 0,008 0,009 0,007 207 0,006 0,005 0,019 0,015 0,024 0,008 0,025 0,031 0,012 0,010 0,012 20
8 0,008 0,008 0,008 0,016 0,004 0,001 0,004 0,021 0,016 0,006 0,008 209 0,010 0,019 0,029 0,039 0,000 0,049 * 0,010 0,039 0,010 0,029 0,020 2010 0,000 0,011 0,007 0,003 0,018 0,013 0,006 0,013 0,001 0,005 0,007 2011 0,011 0,009 0,010 0,009 0,008 0,009 0,002 0,004 0,013 0,019 0,007 2012 0,011 0,005 0,031 0,009 0,025 0,014 0,007 0,008 0,038 0,020 0,014 20Sr 0,014 0,009 0,014 0,012 0,011 0,012 0,011 0,015 0,012 0,013 240NE 24 24 24 24 24 24 24 24 24 24L 0,052 0,033 0,050 0,042 0,041 0,024 0,039 0,055 0,045 0,046
Sr : repeatability standard deviation of each laboratory limit 0,022 g/100g
NL : number of measurements per laboratory
L : Limit for difference between duplicates according Cochran test at 5% level.
SE : repeatability standard deviation per sample
NE : number of measurements per sample*: discarded data using the test of Cochran at 5 %
** : missing datar : limit of repeatability, absolute difference betwen two replicates=0,061 according ISO 22662 / IDF 198
ICAR Proficiency Test March 2018
DETERMINATION of LACTOSE in RAW (cow) MILK - page 3/8 DETERMINATION of LACTOSE in RAW (cow) MILK - page 4/8
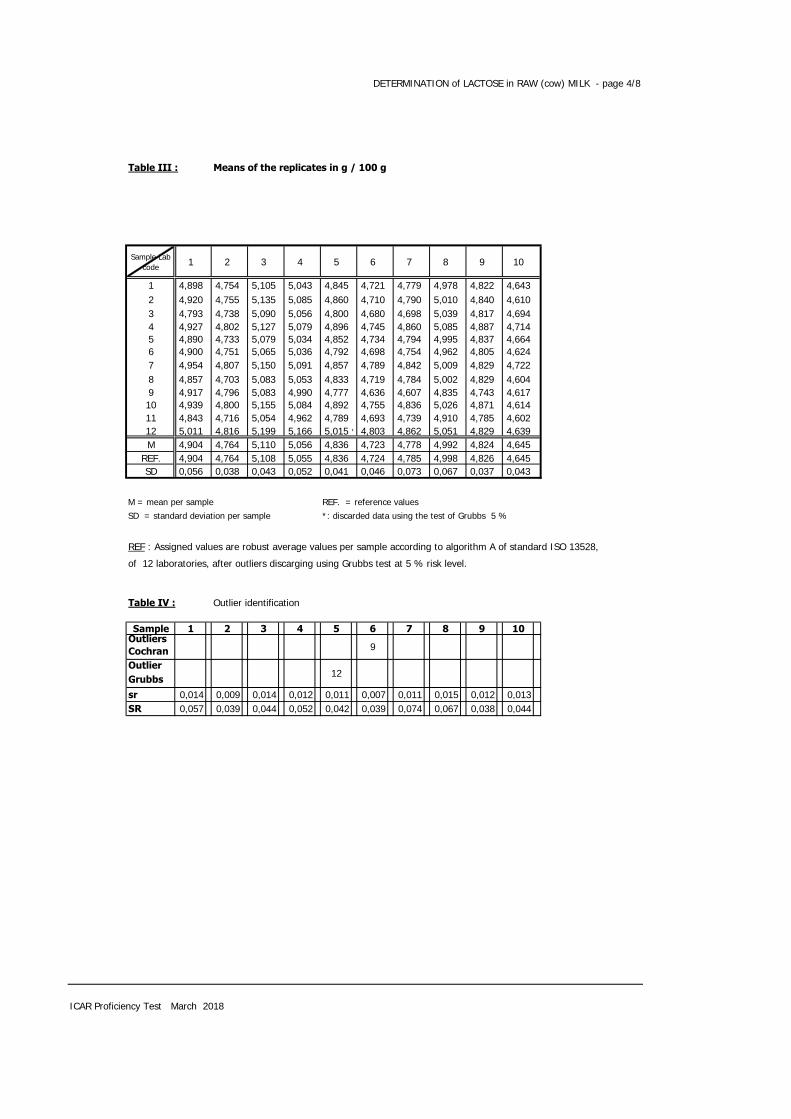
Table III : Means of the replicates in g / 100 g
Sample Lab code 1 2 3 4 5 6 7 8 9 10
1 4,898 4,754 5,105 5,043 4,845 4,721 4,779 4,978 4,822 4,6432 4,920 4,755 5,135 5,085 4,860 4,710 4,790 5,010 4,840 4,6103 4,793 4,738 5,090 5,056 4,800 4,680 4,698 5,039 4,817 4,6944 4,927 4,802 5,127 5,079 4,896 4,745 4,860 5,085 4,887 4,7145 4,890 4,733 5,079 5,034 4,852 4,734 4,794 4,995 4,837 4,6646 4,900 4,751 5,065 5,036 4,792 4,698 4,754 4,962 4,805 4,6247 4,954 4,807 5,150 5,091 4,857 4,789 4,842 5,009 4,829 4,7228 4,857 4,703 5,083 5,053 4,833 4,719 4,784 5,002 4,829 4,6049 4,917 4,796 5,083 4,990 4,777 4,636 4,607 4,835 4,743 4,61710 4,939 4,800 5,155 5,084 4,892 4,755 4,836 5,026 4,871 4,61411 4,843 4,716 5,054 4,962 4,789 4,693 4,739 4,910 4,785 4,60212 5,011 4,816 5,199 5,166 5,015 * 4,803 4,862 5,051 4,829 4,639M 4,904 4,764 5,110 5,056 4,836 4,723 4,778 4,992 4,824 4,645
REF. 4,904 4,764 5,108 5,055 4,836 4,724 4,785 4,998 4,826 4,645SD 0,056 0,038 0,043 0,052 0,041 0,046 0,073 0,067 0,037 0,043
M = mean per sample REF. = reference values
SD = standard deviation per sample *: discarded data using the test of Grubbs 5 %
REF : Assigned values are robust average values per sample according to algorithm A of standard ISO 13528,
of 12 laboratories, after outliers discarging using Grubbs test at 5 % risk level.
Table IV : Outlier identification
Sample 1 2 3 4 5 6 7 8 9 10Outliers
Cochran
Outlier
Grubbs
sr 0,014 0,009 0,014 0,012 0,011 0,007 0,011 0,015 0,012 0,013SR 0,057 0,039 0,044 0,052 0,042 0,039 0,074 0,067 0,038 0,044
ICAR Proficiency Test March 2018
12
9
DETERMINATION of LACTOSE in RAW (cow) MILK - page 4/8 DETERMINATION of LACTOSE in RAW (cow) MILK - page 5/8
Table V : ACCURACY - differences (laboratory - reference) in g / 100 g
Sample Lab code 1 2 3 4 5 6 7 8 9 10 d Sdlab t
1 - 0,007 - 0,010 - 0,004 - 0,012 + 0,009 - 0,004 - 0,006 - 0,020 - 0,005 - 0,002 - 0,006 0,008 2,582 + 0,016 - 0,009 + 0,027 + 0,030 + 0,024 - 0,014 + 0,005 + 0,012 + 0,014 - 0,035 + 0,007 0,021 1,063 - 0,111 - 0,026 - 0,018 + 0,001 - 0,036 - 0,045 - 0,087 + 0,041 - 0,009 + 0,049 - 0,024 0,050 1,524 + 0,023 + 0,038 + 0,018 + 0,024 + 0,060 + 0,021 + 0,075 + 0,087 + 0,060 + 0,069 + 0,047 0,026 5,865 - 0,015 - 0,031 - 0,030 - 0,021 + 0,016 + 0,009 + 0,009 - 0,003 + 0,011 + 0,018 - 0,004 0,019 0,626 - 0,004 - 0,013 - 0,043 - 0,019 - 0,044 - 0,026 - 0,031 - 0,036 - 0,021 - 0,022 - 0,026 0,013 6,507 + 0,050 + 0,042 + 0,041 + 0,036 + 0,021 + 0,065 + 0,057 + 0,011 + 0,003 + 0,077 + 0,040 0,023 5,428 - 0,047 - 0,061 - 0,025 - 0,002 - 0,003 - 0,006 - 0,001 + 0,004 + 0,003 - 0,041 - 0,018 0,024 2,379 + 0,013 + 0,032 - 0,026 - 0,065 - 0,059 - 0,088 - 0,178 - 0,163 - 0,084 - 0,029 - 0,065 0,068 3,0010 + 0,035 + 0,035 + 0,046 + 0,029 + 0,056 + 0,030 + 0,051 + 0,028 + 0,044 - 0,032 + 0,032 0,024 4,1711 - 0,061 - 0,048 - 0,054 - 0,093 - 0,046 - 0,031 - 0,046 - 0,088 - 0,041 - 0,043 - 0,055 0,020 8,6512 + 0,106 + 0,051 + 0,090 + 0,111 + 0,179 + 0,079 + 0,077 + 0,053 + 0,003 - 0,006 + 0,074 0,054 4,36d - 0,000 - 0,000 + 0,002 + 0,001 + 0,000 - 0,001 - 0,007 - 0,006 - 0,002 + 0,000 + 0,000 0,052Sd 0,056 0,038 0,043 0,052 0,041 0,046 0,073 0,067 0,037 0,043 0,051
d = mean of differences Sd = standard deviation of differences t = Student test - comparison to 0
_Upper limits : d = +/- 0.100 g / 100g Sd = 0.100 g / 100g
ISO 22662│IDF 198 : Precision of the method : Sr = 0.022 g / 100 gSR = 0.047 g / 100 g
ICAR Proficiency Test March 2018
DETERMINATION of LACTOSE in RAW (cow) MILK - page 5/8 DETERMINATION of LACTOSE in RAW (cow) MILK - page 6/8
Table VI : Zscore of the different laboratories for each sample.
ZS calculated on the PT standard deviation
Sample Lab code 1 2 3 4 5 6 7 8 9 10
1 -0,12 -0,26 -0,08 -0,24 +0,22 -0,08 -0,09 -0,30 -0,13 -0,052 +0,28 -0,24 +0,63 +0,58 +0,59 -0,31 +0,07 +0,19 +0,37 -0,813 -1,99 -0,68 -0,42 +0,02 -0,86 -0,96 -1,19 +0,62 -0,25 +1,144 +0,40 +0,99 +0,43 +0,47 +1,46 +0,45 +1,01 +1,31 +1,62 +1,605 -0,27 -0,81 -0,69 -0,41 +0,39 +0,20 +0,12 -0,05 +0,29 +0,436 -0,08 -0,34 -1,00 -0,37 -1,06 -0,56 -0,43 -0,54 -0,58 -0,507 +0,88 +1,10 +0,96 +0,69 +0,52 +1,40 +0,77 +0,16 +0,07 +1,788 -0,85 -1,59 -0,58 -0,04 -0,06 -0,12 -0,01 +0,06 +0,07 -0,959 +0,23 +0,83 -0,59 -1,25 -1,43 -1,91 -2,43 -2,45 -2,26 -0,6610 +0,62 +0,92 +1,08 +0,55 +1,37 +0,66 +0,69 +0,42 +1,19 -0,7311 -1,09 -1,25 -1,26 -1,79 -1,12 -0,68 -0,62 -1,32 -1,11 -0,9912 +1,89 +1,34 +2,10 +2,13 +4,35 +1,70 +1,04 +0,80 +0,07 -0,14
In yellow the values bigger or smaller than 2/-2 In red the values bigger or smaller than 3/-3
Figure 2 :
Zscore of the different laboratories for each sample. ZS calculated on the PT standard deviation
ICAR Proficiency Test March 2018
-5
-4
-3
-2
-1
0
1
2
3
4
5
1 2 3 4 5 6 7 8 9 10 11 12Z sc
ore
PT
Laboratory code
sample1
sample2
sample 3
sample 4
sample 5
sample 6
sample 7
sample 8
sample 9
sample 10
DETERMINATION of LACTOSE in RAW (cow) MILK - page 6/8 DETERMINATION of LACTOSE in RAW (cow) MILK - page 7/8
Table VII : Zscore of the different laboratories for each sample.
ZS calculated on the standard deviation of reproducibility of the method
Sample Lab code 1 2 3 4 5 6 7 8 9 10
1 -0,15 -0,22 -0,08 -0,26 +0,19 -0,08 -0,14 -0,43 -0,10 -0,042 +0,33 -0,19 +0,57 +0,64 +0,52 -0,30 +0,11 +0,26 +0,29 -0,753 -2,37 -0,56 -0,39 +0,02 -0,76 -0,95 -1,86 +0,88 -0,20 +1,044 +0,48 +0,81 +0,39 +0,51 +1,27 +0,44 +1,59 +1,86 +1,28 +1,475 -0,32 -0,66 -0,63 -0,45 +0,34 +0,20 +0,18 -0,07 +0,23 +0,396 -0,10 -0,28 -0,92 -0,41 -0,93 -0,56 -0,67 -0,76 -0,45 -0,467 +1,05 +0,90 +0,88 +0,76 +0,46 +1,38 +1,20 +0,23 +0,06 +1,648 -1,01 -1,30 -0,53 -0,04 -0,06 -0,12 -0,02 +0,08 +0,06 -0,879 +0,28 +0,68 -0,54 -1,37 -1,25 -1,88 -3,79 -3,46 -1,78 -0,6110 +0,73 +0,75 +0,99 +0,61 +1,20 +0,65 +1,09 +0,59 +0,94 -0,6711 -1,30 -1,03 -1,15 -1,97 -0,98 -0,67 -0,97 -1,87 -0,88 -0,9112 +2,26 +1,09 +1,92 +2,35 +3,81 +1,68 +1,63 +1,13 +0,06 -0,13
This table will allows to compare your ZSCORE from one PT to an other because the standard deviation has always the value of SR of the method SR=0,047
In yellow the values bigger or smaller than 2/-2 In red the values bigger or smaller than 3/-3
Figure 3 :
Zscore of the different laboratories for each sample. ZS calculated on the standard deviation of reproducibility of the method
ICAR Proficiency Test March 2018
-5
-4
-3
-2
-1
0
1
2
3
4
5
1 2 3 4 5 6 7 8 9 10 11 12
Z sc
ore
Fix
Laboratory code
sample1
sample2
sample 3
sample 4
sample 5
sample 6
sample 7
sample 8
sample 9
sample 10
DETERMINATION of LACTOSE in RAW (cow) MILK - page 7/8 DETERMINATION of LACTOSE in RAW (cow) MILK - page 8/8
Figure 1 : ACCURACY - Evaluation of the individual performances (to see table I).
LIST OF THE PARTICIPANTS ICAR
ICAR PROFICIENCY TEST
RAW MILK
LACTOSE CONTENT
March 2018
Agroscope Institute for food Sciences IFS Bern-LiebefeldSwitzerlandDepartment Valorisation des productions Agricoles Gembloux BelgiumEstonian Livestock Performance Recording Ltd Tartu EstonieJapan Dairy Technical Association Tokyo JapanLab Agroalimentario de Santander Santander CantabriaSpainLaboratorium Oceny Mleka KCHZ Laboratorium Referecyjne z/s w Parzniewie Pruszkow Poland
Milchprüfring Baden-Württemberg e.V. Kirchheim unter TeckGermanyMilkom a.s Dairy research institute Praha Czech RepublicQlip B.V., Zutphen NetherlandsTeagasc Food research Center . Cork IrelandUni. of Ljubljana Biotechnical faculty dept. of Anim. Sc. Inst. of Dairy Sc. and Probiotics Domzale SloveniaValacta Quebec Canada
ICAR Proficiency Test March 2018
0,000
0,150
0,300
0,450
-0,300 -0,150 0,000 0,150 0,300
Sd
Student 5 % Student 5 %
_
d
Trial of : 05/03/2018
12 laboratories
10 samples
0 Labs OUT OF THE TARGET ( 0 % )
ICAR Interlaboratory Proficiency Study - March 2018
DETERMINATION of UREA in RAW (cow) MILK - page 1/8
ICAR
PROFICIENCY TESTING SCHEME
---------
March 2018
Raw Milk
Determination of UREA CONTENT
Sending date of statistical treatment : 3th April 2018
Frame of activity : ICAR Milk Analyses Sub Committee (MA SC)ICAR Staff Silvia Orlandini [email protected] [email protected]
ICAR Proficiency Test March 2018
ACCRÉDITATION N° 1-2473 PORTÉE DISPONIBLE SUR WWW.COFRAC.FR
DETERMINATION of UREA in RAW (cow) MILK - page 1/8 DETERMINATION of UREA in RAW (cow) MILK - page 2/8
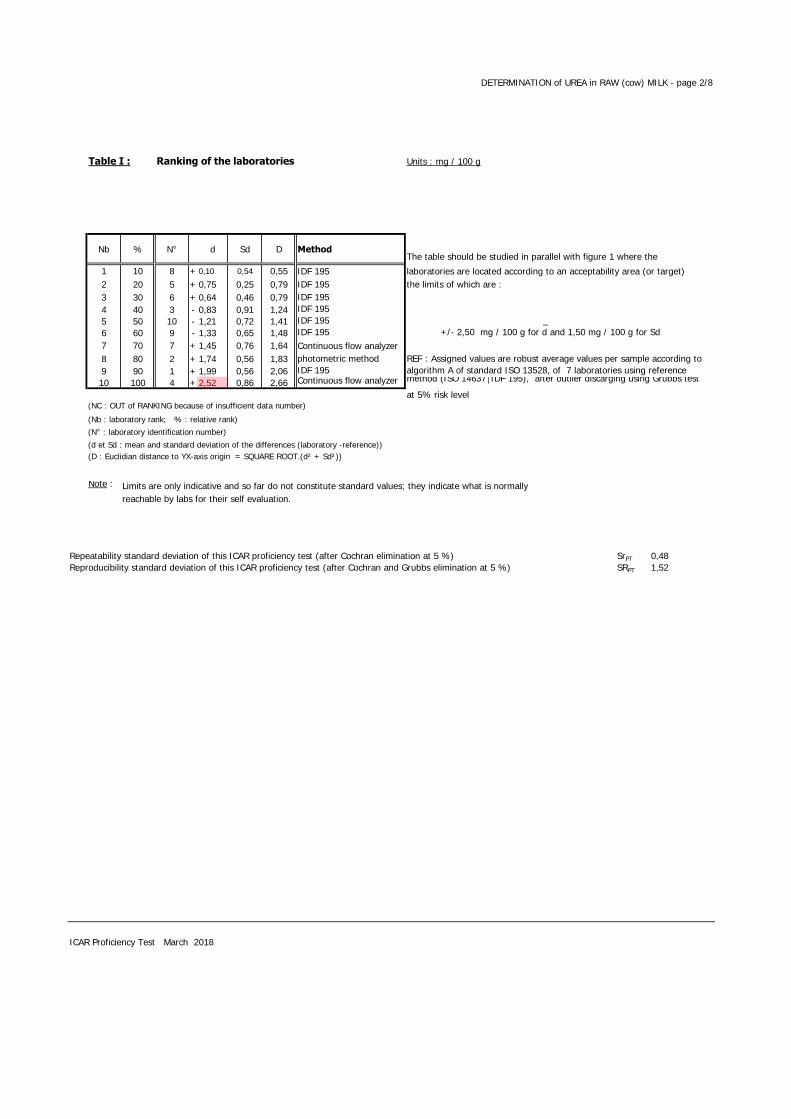
Table I : Ranking of the laboratories Units : mg / 100 g
Nb % N° d Sd D MethodThe table should be studied in parallel with figure 1 where the
1 10 8 + 0,10 0,54 0,55 IDF 195 laboratories are located according to an acceptability area (or target)2 20 5 + 0,75 0,25 0,79 IDF 195 the limits of which are :3 30 6 + 0,64 0,46 0,79 IDF 1954 40 3 - 0,83 0,91 1,24 IDF 1955 50 10 - 1,21 0,72 1,41 IDF 195 _6 60 9 - 1,33 0,65 1,48 IDF 195 +/- 2,50 mg / 100 g for d and 1,50 mg / 100 g for Sd7 70 7 + 1,45 0,76 1,64 Continuous flow analyzer8 80 2 + 1,74 0,56 1,83 photometric method REF : Assigned values are robust average values per sample according to9 90 1 + 1,99 0,56 2,06 IDF 195 algorithm A of standard ISO 13528, of 7 laboratories using reference 10 100 4 + 2,52 0,86 2,66 Continuous flow analyzer method (ISO 14637│IDF 195), after outlier discarging using Grubbs test
at 5% risk level(NC : OUT of RANKING because of insufficient data number)
(Nb : laboratory rank; % : relative rank)(N° : laboratory identification number)
(d et Sd : mean and standard deviation of the differences (laboratory -reference))(D : Euclidian distance to YX-axis origin = SQUARE ROOT.(d² + Sd²))
Note : Limits are only indicative and so far do not constitute standard values; they indicate what is normally reachable by labs for their self evaluation.
Repeatability standard deviation of this ICAR proficiency test (after Cochran elimination at 5 %) SrPT 0,48Reproducibility standard deviation of this ICAR proficiency test (after Cochran and Grubbs elimination at 5 %) SRPT 1,52
ICAR Proficiency Test March 2018
DETERMINATION of UREA in RAW (cow) MILK - page 2/8 DETERMINATION of UREA in RAW (cow) MILK - page 3/8
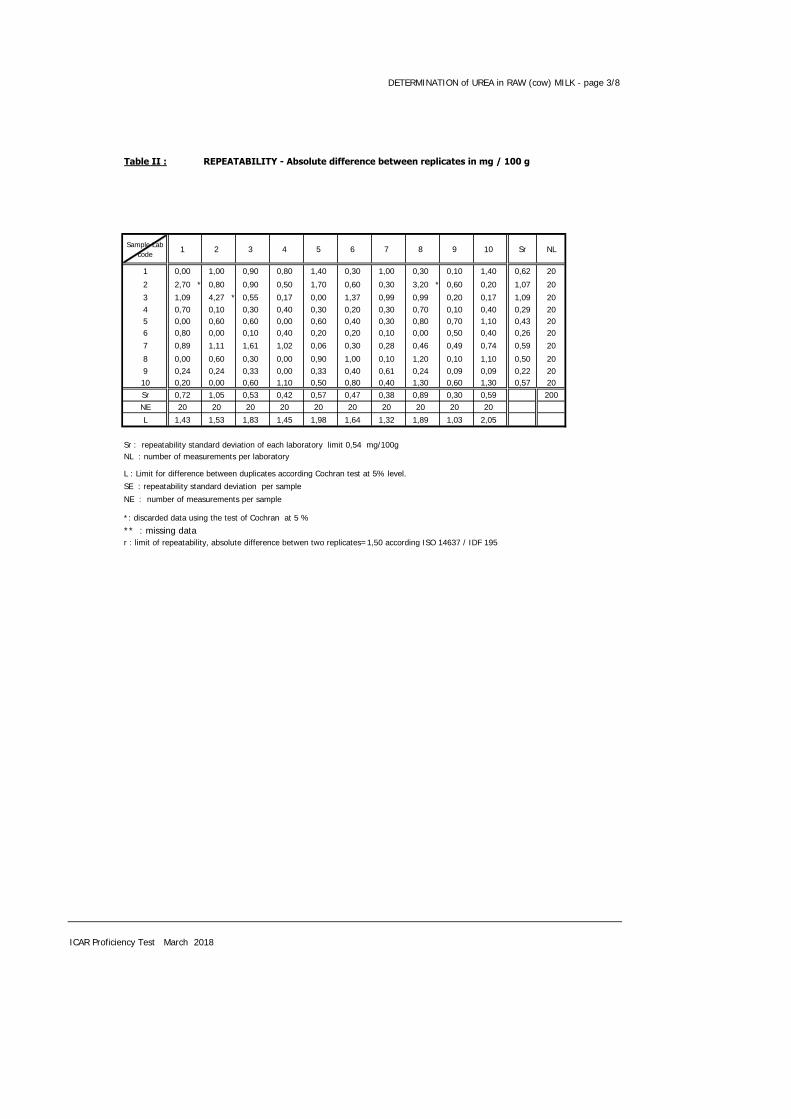
Table II : REPEATABILITY - Absolute difference between replicates in mg / 100 g
Sample Lab code
1 2 3 4 5 6 7 8 9 10 Sr NL
1 0,00 1,00 0,90 0,80 1,40 0,30 1,00 0,30 0,10 1,40 0,62 20
2 2,70 * 0,80 0,90 0,50 1,70 0,60 0,30 3,20 * 0,60 0,20 1,07 20
3 1,09 4,27 * 0,55 0,17 0,00 1,37 0,99 0,99 0,20 0,17 1,09 204 0,70 0,10 0,30 0,40 0,30 0,20 0,30 0,70 0,10 0,40 0,29 205 0,00 0,60 0,60 0,00 0,60 0,40 0,30 0,80 0,70 1,10 0,43 206 0,80 0,00 0,10 0,40 0,20 0,20 0,10 0,00 0,50 0,40 0,26 20
7 0,89 1,11 1,61 1,02 0,06 0,30 0,28 0,46 0,49 0,74 0,59 20
8 0,00 0,60 0,30 0,00 0,90 1,00 0,10 1,20 0,10 1,10 0,50 209 0,24 0,24 0,33 0,00 0,33 0,40 0,61 0,24 0,09 0,09 0,22 2010 0,20 0,00 0,60 1,10 0,50 0,80 0,40 1,30 0,60 1,30 0,57 20Sr 0,72 1,05 0,53 0,42 0,57 0,47 0,38 0,89 0,30 0,59 200NE 20 20 20 20 20 20 20 20 20 20
L 1,43 1,53 1,83 1,45 1,98 1,64 1,32 1,89 1,03 2,05
Sr : repeatability standard deviation of each laboratory limit 0,54 mg/100gNL : number of measurements per laboratory
L : Limit for difference between duplicates according Cochran test at 5% level.
SE : repeatability standard deviation per sample
NE : number of measurements per sample
*: discarded data using the test of Cochran at 5 %
** : missing datar : limit of repeatability, absolute difference betwen two replicates=1,50 according ISO 14637 / IDF 195
ICAR Proficiency Test March 2018
DETERMINATION of UREA in RAW (cow) MILK - page 3/8 DETERMINATION of UREA in RAW (cow) MILK - page 4/8
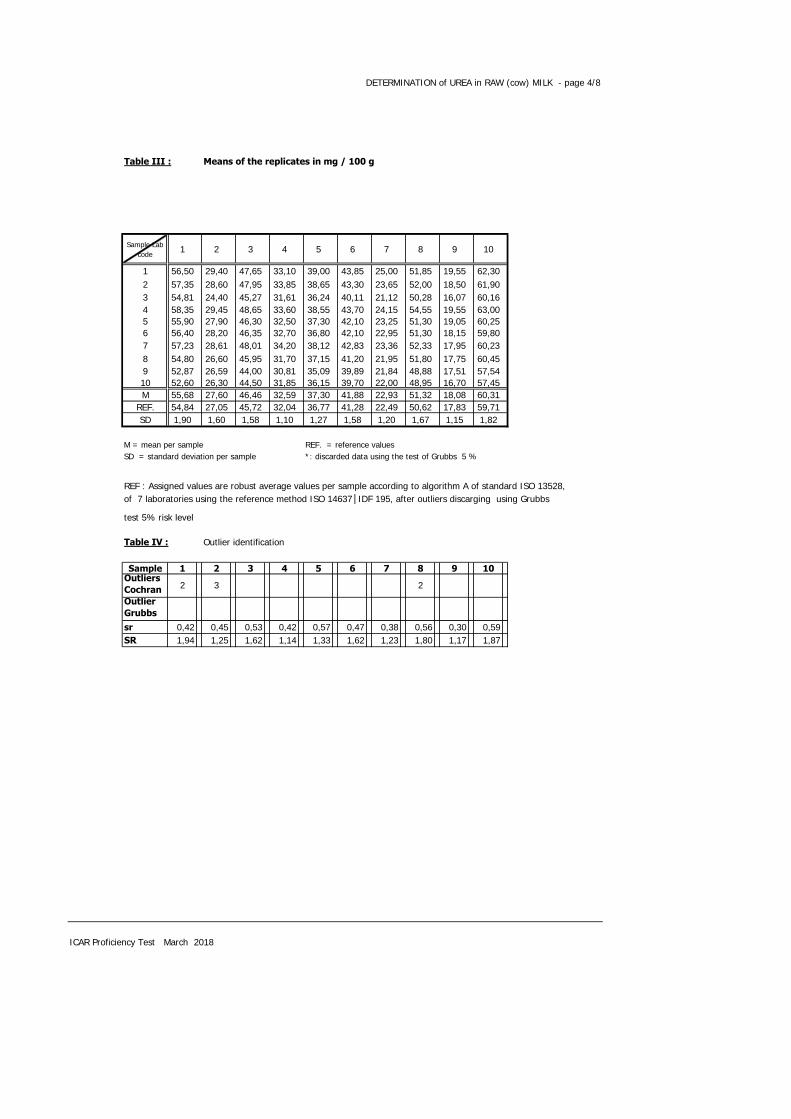
Table III : Means of the replicates in mg / 100 g
Sample Lab code 1 2 3 4 5 6 7 8 9 10
1 56,50 29,40 47,65 33,10 39,00 43,85 25,00 51,85 19,55 62,302 57,35 28,60 47,95 33,85 38,65 43,30 23,65 52,00 18,50 61,903 54,81 24,40 45,27 31,61 36,24 40,11 21,12 50,28 16,07 60,164 58,35 29,45 48,65 33,60 38,55 43,70 24,15 54,55 19,55 63,005 55,90 27,90 46,30 32,50 37,30 42,10 23,25 51,30 19,05 60,256 56,40 28,20 46,35 32,70 36,80 42,10 22,95 51,30 18,15 59,807 57,23 28,61 48,01 34,20 38,12 42,83 23,36 52,33 17,95 60,238 54,80 26,60 45,95 31,70 37,15 41,20 21,95 51,80 17,75 60,459 52,87 26,59 44,00 30,81 35,09 39,89 21,84 48,88 17,51 57,5410 52,60 26,30 44,50 31,85 36,15 39,70 22,00 48,95 16,70 57,45M 55,68 27,60 46,46 32,59 37,30 41,88 22,93 51,32 18,08 60,31
REF. 54,84 27,05 45,72 32,04 36,77 41,28 22,49 50,62 17,83 59,71SD 1,90 1,60 1,58 1,10 1,27 1,58 1,20 1,67 1,15 1,82
M = mean per sample REF. = reference valuesSD = standard deviation per sample *: discarded data using the test of Grubbs 5 %
REF : Assigned values are robust average values per sample according to algorithm A of standard ISO 13528,of 7 laboratories using the reference method ISO 14637│IDF 195, after outliers discarging using Grubbs
test 5% risk level
Table IV : Outlier identification
Sample 1 2 3 4 5 6 7 8 9 10Outliers
Cochran
Outlier
Grubbs
sr 0,42 0,45 0,53 0,42 0,57 0,47 0,38 0,56 0,30 0,59SR 1,94 1,25 1,62 1,14 1,33 1,62 1,23 1,80 1,17 1,87
ICAR Proficiency Test March 2018
22 3
DETERMINATION of UREA in RAW (cow) MILK - page 4/8 DETERMINATION of UREA in RAW (cow) MILK - page 5/8
Table V : ACCURACY - differences (laboratory - reference) in mg / 100 g
Sample Lab code 1 2 3 4 5 6 7 8 9 10 d Sdlab t
1 + 1,66 + 2,35 + 1,93 + 1,06 + 2,23 + 2,57 + 2,51 + 1,23 + 1,72 + 2,59 + 1,99 0,56 11,302 + 2,51 + 1,55 + 2,23 + 1,81 + 1,88 + 2,02 + 1,16 + 1,38 + 0,67 + 2,19 + 1,74 0,56 9,893 - 0,03 - 2,66 - 0,45 - 0,43 - 0,53 - 1,17 - 1,38 - 0,35 - 1,76 + 0,45 - 0,83 0,91 2,884 + 3,51 + 2,40 + 2,93 + 1,56 + 1,78 + 2,42 + 1,66 + 3,93 + 1,72 + 3,29 + 2,52 0,86 9,315 + 1,06 + 0,85 + 0,58 + 0,46 + 0,53 + 0,82 + 0,76 + 0,68 + 1,22 + 0,54 + 0,75 0,25 9,656 + 1,56 + 1,15 + 0,63 + 0,66 + 0,03 + 0,82 + 0,46 + 0,68 + 0,32 + 0,09 + 0,64 0,46 4,367 + 2,39 + 1,56 + 2,29 + 2,16 + 1,34 + 1,55 + 0,87 + 1,70 + 0,13 + 0,53 + 1,45 0,76 6,088 - 0,04 - 0,45 + 0,23 - 0,34 + 0,38 - 0,08 - 0,54 + 1,18 - 0,08 + 0,74 + 0,10 0,54 0,589 - 1,97 - 0,47 - 1,72 - 1,22 - 1,68 - 1,38 - 0,65 - 1,74 - 0,32 - 2,17 - 1,33 0,65 6,4910 - 2,24 - 0,75 - 1,22 - 0,19 - 0,62 - 1,58 - 0,49 - 1,67 - 1,13 - 2,26 - 1,21 0,72 5,36d + 0,84 + 0,55 + 0,75 + 0,55 + 0,53 + 0,60 + 0,44 + 0,70 + 0,25 + 0,60 + 0,58 1,45Sd 1,90 1,60 1,58 1,10 1,27 1,58 1,20 1,67 1,15 1,82 1,51
d = mean of differences Sd = standard deviation of differences t = Student test - comparison to 0
_Upper limits : d = +/- 2,50 mg / 100 g Sd = 1,50 mg / 100 g
ISO 14637│IDF 195 : Precision of the method : Sr = 0.54 mg / 100 gSR = 1.81 mg / 100 g
ICAR Proficiency Test March 2018
DETERMINATION of UREA in RAW (cow) MILK - page 5/8 DETERMINATION of UREA in RAW (cow) MILK - page 6/8
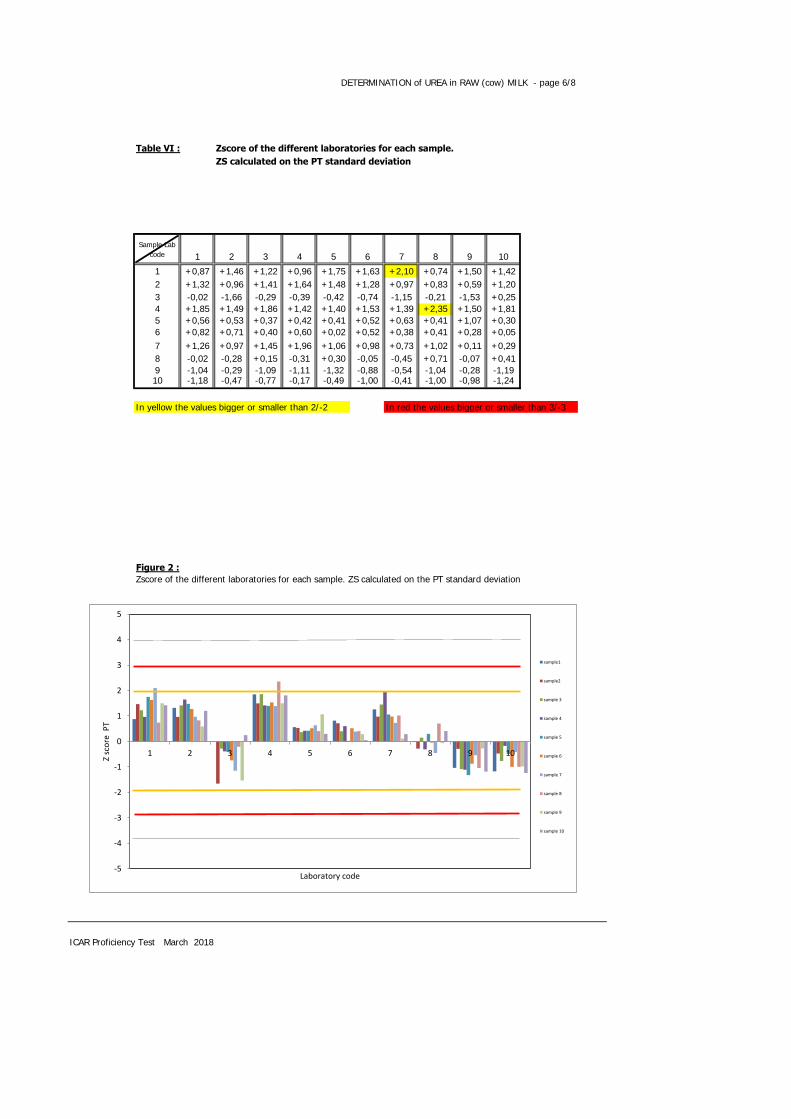
Table VI : Zscore of the different laboratories for each sample.
ZS calculated on the PT standard deviation
Sample Lab code 1 2 3 4 5 6 7 8 9 10
1 +0,87 +1,46 +1,22 +0,96 +1,75 +1,63 +2,10 +0,74 +1,50 +1,422 +1,32 +0,96 +1,41 +1,64 +1,48 +1,28 +0,97 +0,83 +0,59 +1,203 -0,02 -1,66 -0,29 -0,39 -0,42 -0,74 -1,15 -0,21 -1,53 +0,254 +1,85 +1,49 +1,86 +1,42 +1,40 +1,53 +1,39 +2,35 +1,50 +1,815 +0,56 +0,53 +0,37 +0,42 +0,41 +0,52 +0,63 +0,41 +1,07 +0,306 +0,82 +0,71 +0,40 +0,60 +0,02 +0,52 +0,38 +0,41 +0,28 +0,057 +1,26 +0,97 +1,45 +1,96 +1,06 +0,98 +0,73 +1,02 +0,11 +0,298 -0,02 -0,28 +0,15 -0,31 +0,30 -0,05 -0,45 +0,71 -0,07 +0,419 -1,04 -0,29 -1,09 -1,11 -1,32 -0,88 -0,54 -1,04 -0,28 -1,1910 -1,18 -0,47 -0,77 -0,17 -0,49 -1,00 -0,41 -1,00 -0,98 -1,24
In yellow the values bigger or smaller than 2/-2 In red the values bigger or smaller than 3/-3
Figure 2 :
Zscore of the different laboratories for each sample. ZS calculated on the PT standard deviation
ICAR Proficiency Test March 2018
-5
-4
-3
-2
-1
0
1
2
3
4
5
1 2 3 4 5 6 7 8 9 10
Z sc
ore
PT
Laboratory code
sample1
sample2
sample 3
sample 4
sample 5
sample 6
sample 7
sample 8
sample 9
sample 10
DETERMINATION of UREA in RAW (cow) MILK - page 6/8 DETERMINATION of UREA in RAW (cow) MILK - page 7/8
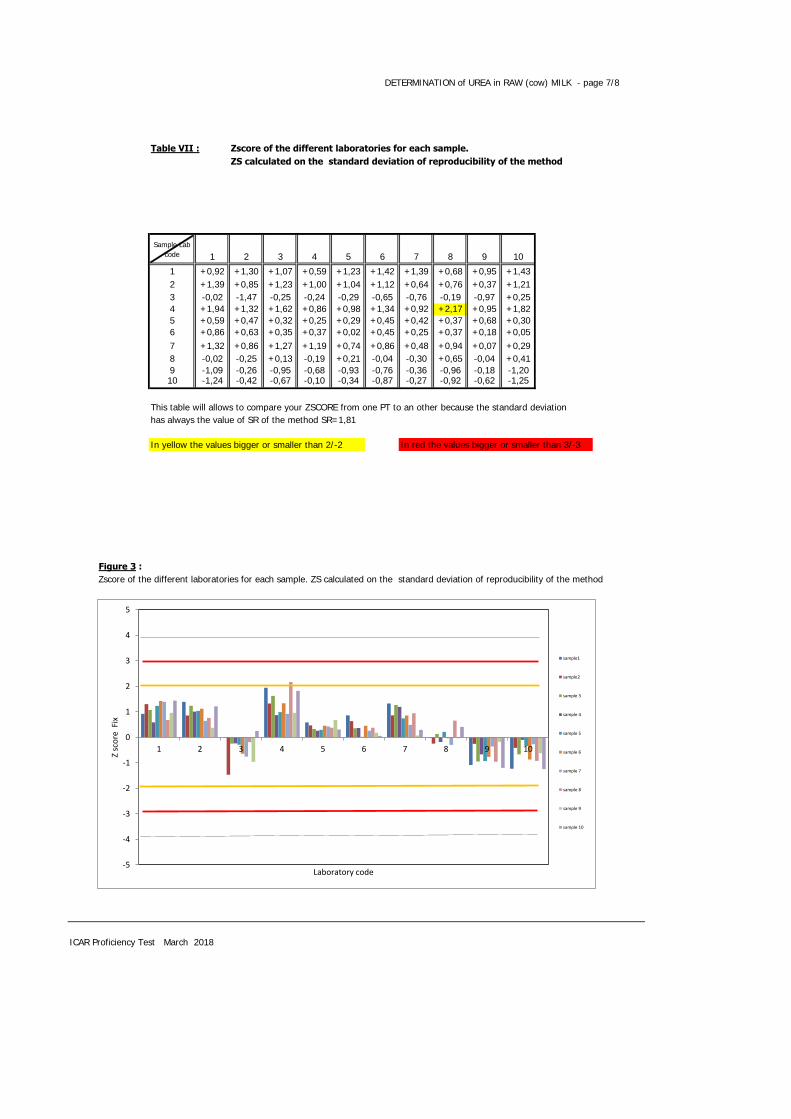
Table VII : Zscore of the different laboratories for each sample.
ZS calculated on the standard deviation of reproducibility of the method
Sample Lab code 1 2 3 4 5 6 7 8 9 10
1 +0,92 +1,30 +1,07 +0,59 +1,23 +1,42 +1,39 +0,68 +0,95 +1,432 +1,39 +0,85 +1,23 +1,00 +1,04 +1,12 +0,64 +0,76 +0,37 +1,213 -0,02 -1,47 -0,25 -0,24 -0,29 -0,65 -0,76 -0,19 -0,97 +0,254 +1,94 +1,32 +1,62 +0,86 +0,98 +1,34 +0,92 +2,17 +0,95 +1,825 +0,59 +0,47 +0,32 +0,25 +0,29 +0,45 +0,42 +0,37 +0,68 +0,306 +0,86 +0,63 +0,35 +0,37 +0,02 +0,45 +0,25 +0,37 +0,18 +0,057 +1,32 +0,86 +1,27 +1,19 +0,74 +0,86 +0,48 +0,94 +0,07 +0,298 -0,02 -0,25 +0,13 -0,19 +0,21 -0,04 -0,30 +0,65 -0,04 +0,419 -1,09 -0,26 -0,95 -0,68 -0,93 -0,76 -0,36 -0,96 -0,18 -1,2010 -1,24 -0,42 -0,67 -0,10 -0,34 -0,87 -0,27 -0,92 -0,62 -1,25
This table will allows to compare your ZSCORE from one PT to an other because the standard deviation has always the value of SR of the method SR=1,81
In yellow the values bigger or smaller than 2/-2 In red the values bigger or smaller than 3/-3
Figure 3 :
Zscore of the different laboratories for each sample. ZS calculated on the standard deviation of reproducibility of the method
ICAR Proficiency Test March 2018
-5
-4
-3
-2
-1
0
1
2
3
4
5
1 2 3 4 5 6 7 8 9 10
Z sc
ore
Fix
Laboratory code
sample1
sample2
sample 3
sample 4
sample 5
sample 6
sample 7
sample 8
sample 9
sample 10
DETERMINATION of UREA in RAW (cow) MILK - page 7/8 DETERMINATION of UREA in RAW (cow) MILK - page 8/8
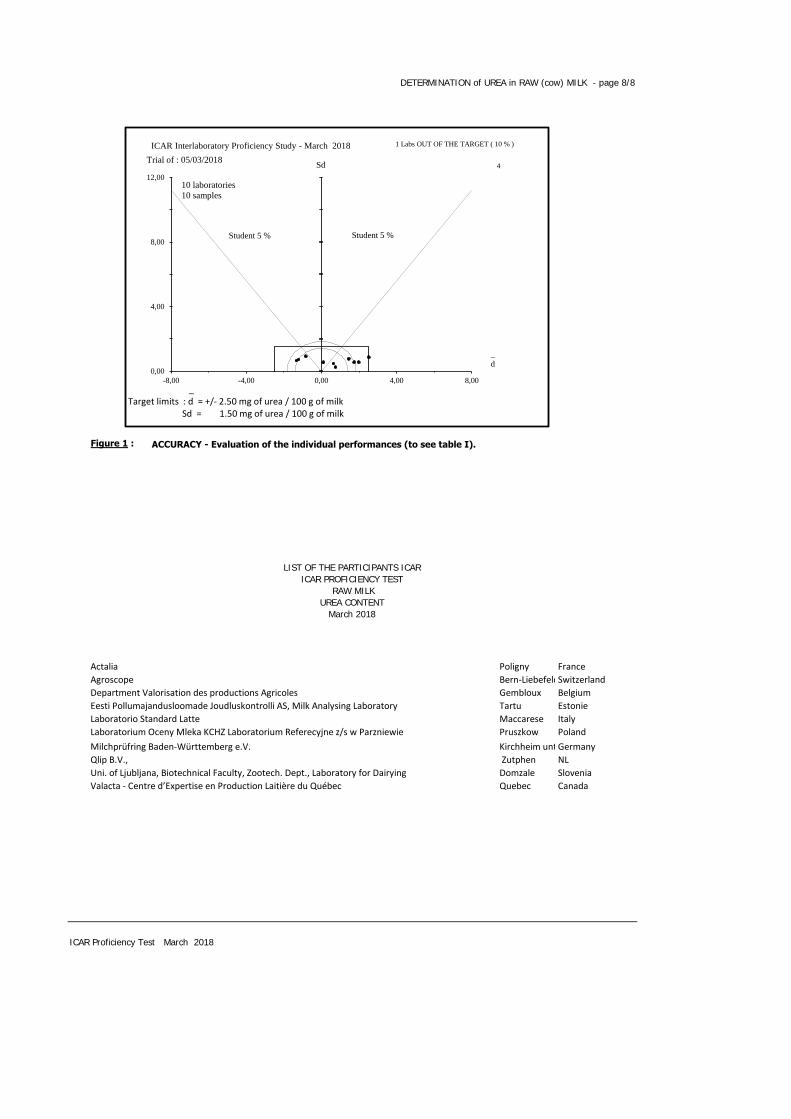
Figure 1 : ACCURACY - Evaluation of the individual performances (to see table I).
LIST OF THE PARTICIPANTS ICARICAR PROFICIENCY TEST
RAW MILKUREA CONTENT
March 2018
Actalia Poligny France
Agroscope Bern-LiebefeldSwitzerland
Department Valorisation des productions Agricoles Gembloux Belgium
Eesti Pollumajandusloomade Joudluskontrolli AS, Milk Analysing Laboratory Tartu Estonie
Laboratorio Standard Latte Maccarese Italy
Laboratorium Oceny Mleka KCHZ Laboratorium Referecyjne z/s w Parzniewie Pruszkow Poland
Milchprüfring Baden-Württemberg e.V. Kirchheim unter TeckGermany
Qlip B.V., Zutphen NL
Uni. of Ljubljana, Biotechnical Faculty, Zootech. Dept., Laboratory for Dairying Domzale Slovenia
Valacta - Centre d’Expertise en Production Laitière du Québec Quebec Canada
ICAR Proficiency Test March 2018
0,00
4,00
8,00
12,00
-8,00 -4,00 0,00 4,00 8,00
Sd
Student 5 % Student 5 %
_ Target limits : d = +/- 2.50 mg of urea / 100 g of milk Sd = 1.50 mg of urea / 100 g of milk
_
d
Trial of : 05/03/2018
10 laboratories
10 samples
1 Labs OUT OF THE TARGET ( 10 % )
4
ICAR Interlaboratory Proficiency Study - March 2018

ENUMERATION of SOMATIC CELLS in RAW (cow) MILK - page 1/8
ICAR
PROFICIENCY TESTING SCHEME
---------
March 2018
Raw Milk
Enumeration of SOMATIC CELLS
Sending date of statistical treatment : 3th April 2018
Frame of activity : ICAR Milk Analyses Sub Committee (MA SC)ICAR Staff Silvia Orlandini [email protected] [email protected]
ACCRÉDITATION N° 1-2473 PORTÉE DISPONIBLE SUR WWW.COFRAC.FR
Proficiency test accreditated ISO 17043
ENUMERATION of SOMATIC CELLS in RAW (cow) MILK - page 1/8 ENUMERATION of SOMATIC CELLS in RAW (cow) MILK - page 2/8
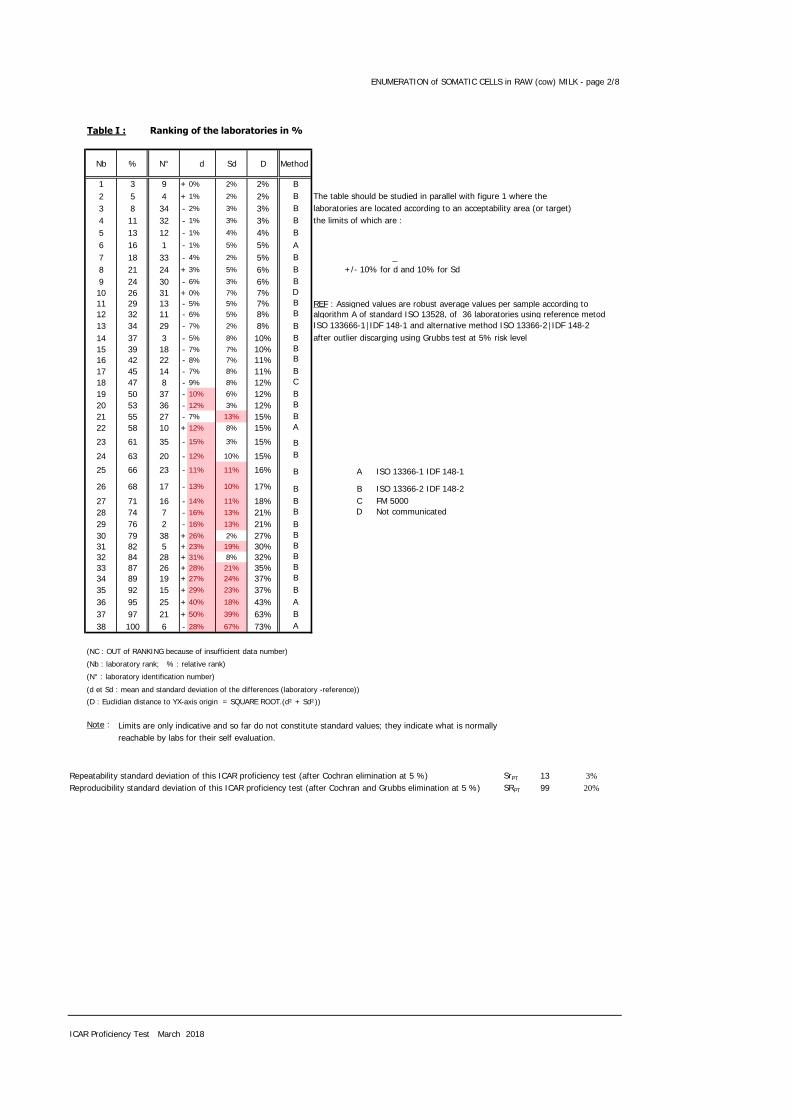
Table I : Ranking of the laboratories in %
Nb % N° d Sd D Method
1 3 9 + 0% 2% 2% B2 5 4 + 1% 2% 2% B The table should be studied in parallel with figure 1 where the3 8 34 - 2% 3% 3% B laboratories are located according to an acceptability area (or target)4 11 32 - 1% 3% 3% B the limits of which are :5 13 12 - 1% 4% 4% B6 16 1 - 1% 5% 5% A7 18 33 - 4% 2% 5% B _8 21 24 + 3% 5% 6% B +/- 10% for d and 10% for Sd9 24 30 - 6% 3% 6% B10 26 31 + 0% 7% 7% D11 29 13 - 5% 5% 7% B REF : Assigned values are robust average values per sample according to12 32 11 - 6% 5% 8% B algorithm A of standard ISO 13528, of 36 laboratories using reference metod 13 34 29 - 7% 2% 8% B ISO 133666-1│IDF 148-1 and alternative method ISO 13366-2│IDF 148-214 37 3 - 5% 8% 10% B after outlier discarging using Grubbs test at 5% risk level15 39 18 - 7% 7% 10% B16 42 22 - 8% 7% 11% B17 45 14 - 7% 8% 11% B18 47 8 - 9% 8% 12% C19 50 37 - 10% 6% 12% B20 53 36 - 12% 3% 12% B21 55 27 - 7% 13% 15% B22 58 10 + 12% 8% 15% A
23 61 35 - 15% 3% 15% B
24 63 20 - 12% 10% 15% B
25 66 23 - 11% 11% 16% B A ISO 13366-1 IDF 148-1
26 68 17 - 13% 10% 17% B B ISO 13366-2 IDF 148-227 71 16 - 14% 11% 18% B C FM 500028 74 7 - 16% 13% 21% B D Not communicated29 76 2 - 16% 13% 21% B30 79 38 + 26% 2% 27% B31 82 5 + 23% 19% 30% B32 84 28 + 31% 8% 32% B33 87 26 + 28% 21% 35% B34 89 19 + 27% 24% 37% B35 92 15 + 29% 23% 37% B36 95 25 + 40% 18% 43% A37 97 21 + 50% 39% 63% B38 100 6 - 28% 67% 73% A
(NC : OUT of RANKING because of insufficient data number)
(Nb : laboratory rank; % : relative rank)
(N° : laboratory identification number)
(d et Sd : mean and standard deviation of the differences (laboratory -reference))
(D : Euclidian distance to YX-axis origin = SQUARE ROOT.(d² + Sd²))
Note : Limits are only indicative and so far do not constitute standard values; they indicate what is normally reachable by labs for their self evaluation.
Repeatability standard deviation of this ICAR proficiency test (after Cochran elimination at 5 %) SrPT 13 3%
Reproducibility standard deviation of this ICAR proficiency test (after Cochran and Grubbs elimination at 5 %) SRPT 99 20%
ICAR Proficiency Test March 2018
ENUMERATION of SOMATIC CELLS in RAW (cow) MILK - page 2/8 ENUMERATION of SOMATIC CELLS in RAW (cow) MILK - page 3/8
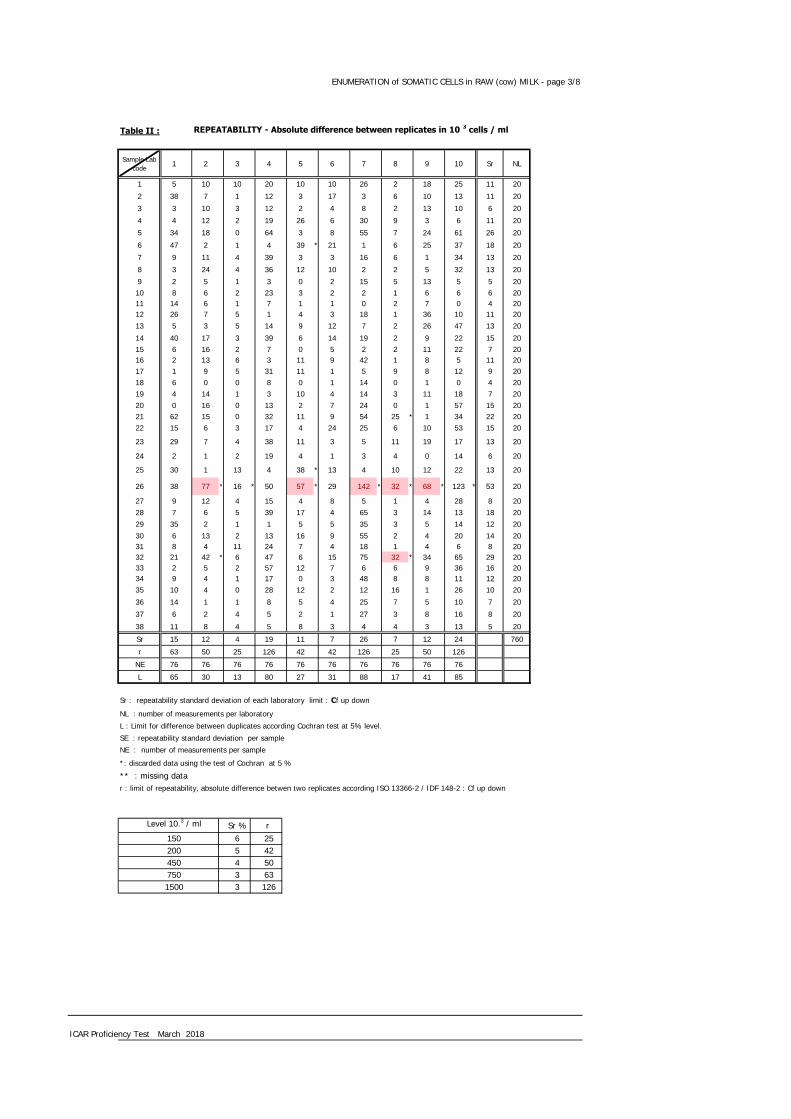
Table II : REPEATABILITY - Absolute difference between replicates in 10 3 cells / ml
Sample Lab code
1 2 3 4 5 6 7 8 9 10 Sr NL
1 5 10 10 20 10 10 26 2 18 25 11 20
2 38 7 1 12 3 17 3 6 10 13 11 20
3 3 10 3 12 2 4 8 2 13 10 6 20
4 4 12 2 19 26 6 30 9 3 6 11 20
5 34 18 0 64 3 8 55 7 24 61 26 20
6 47 2 1 4 39 * 21 1 6 25 37 18 20
7 9 11 4 39 3 3 16 6 1 34 13 20
8 3 24 4 36 12 10 2 2 5 32 13 20
9 2 5 1 3 0 2 15 5 13 5 5 2010 8 6 2 23 3 2 2 1 6 6 6 2011 14 6 1 7 1 1 0 2 7 0 4 2012 26 7 5 1 4 3 18 1 36 10 11 2013 5 3 5 14 9 12 7 2 26 47 13 20
14 40 17 3 39 6 14 19 2 9 22 15 2015 6 16 2 7 0 5 2 2 11 22 7 2016 2 13 6 3 11 9 42 1 8 5 11 2017 1 9 5 31 11 1 5 9 8 12 9 2018 6 0 0 8 0 1 14 0 1 0 4 2019 4 14 1 3 10 4 14 3 11 18 7 2020 0 16 0 13 2 7 24 0 1 57 15 2021 62 15 0 32 11 9 54 25 * 1 34 22 2022 15 6 3 17 4 24 25 6 10 53 15 20
23 29 7 4 38 11 3 5 11 19 17 13 20
24 2 1 2 19 4 1 3 4 0 14 6 20
25 30 1 13 4 38 * 13 4 10 12 22 13 20
26 38 77 * 16 * 50 57 * 29 142 * 32 * 68 * 123 * 53 20
27 9 12 4 15 4 8 5 1 4 28 8 2028 7 6 5 39 17 4 65 3 14 13 18 2029 35 2 1 1 5 5 35 3 5 14 12 2030 6 13 2 13 16 9 55 2 4 20 14 2031 8 4 11 24 7 4 18 1 4 6 8 2032 21 42 * 6 47 6 15 75 32 * 34 65 29 2033 2 5 2 57 12 7 6 6 9 36 16 2034 9 4 1 17 0 3 48 8 8 11 12 2035 10 4 0 28 12 2 12 16 1 26 10 20
36 14 1 1 8 5 4 25 7 5 10 7 20
37 6 2 4 5 2 1 27 3 8 16 8 20
38 11 8 4 5 8 3 4 4 3 13 5 20
Sr 15 12 4 19 11 7 26 7 12 24 760
r 63 50 25 126 42 42 126 25 50 126
NE 76 76 76 76 76 76 76 76 76 76
L 65 30 13 80 27 31 88 17 41 85
Sr : repeatability standard deviation of each laboratory limit : Cf up down
NL : number of measurements per laboratory
L : Limit for difference between duplicates according Cochran test at 5% level.
SE : repeatability standard deviation per sample
NE : number of measurements per sample
*: discarded data using the test of Cochran at 5 %
** : missing datar : limit of repeatability, absolute difference betwen two replicates according ISO 13366-2 / IDF 148-2 : Cf up down
Level 10.3 / ml Sr % r 150 6 25200 5 42450 4 50750 3 631500 3 126
ICAR Proficiency Test March 2018
ENUMERATION of SOMATIC CELLS in RAW (cow) MILK - page 3/8 ENUMERATION of SOMATIC CELLS in RAW (cow) MILK - page 4/8
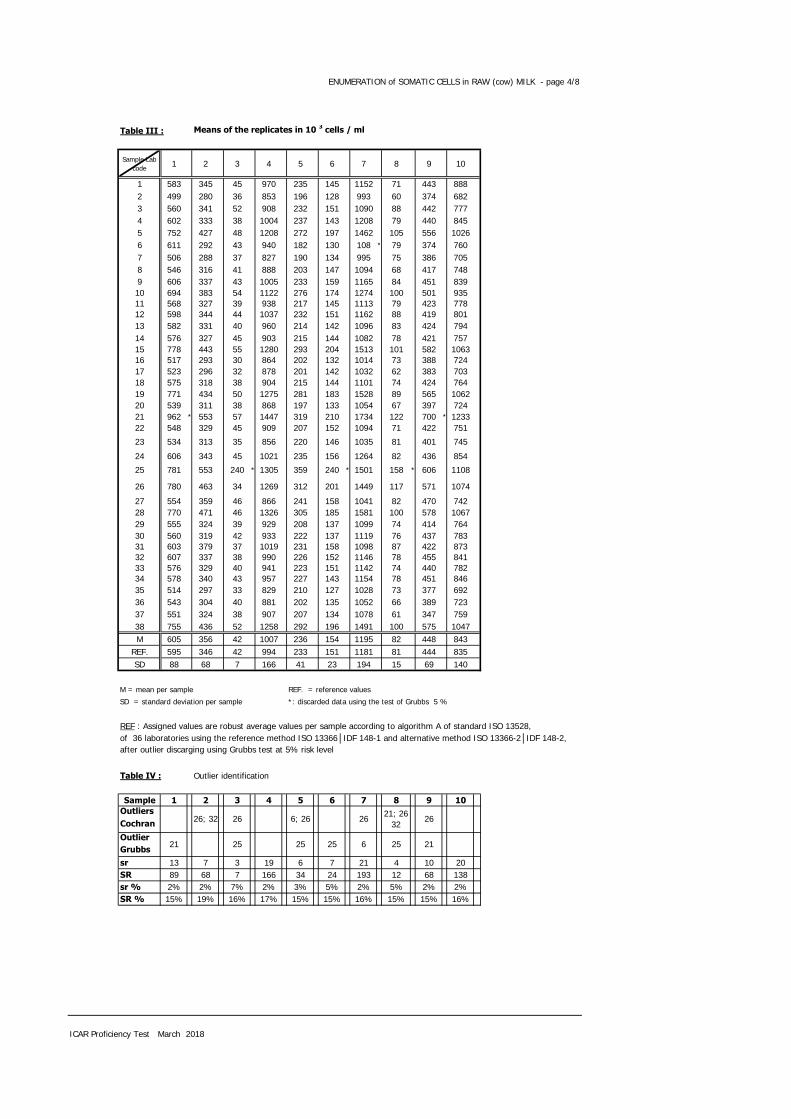
Table III : Means of the replicates in 10 3 cells / ml
Sample Lab code 1 2 3 4 5 6 7 8 9 10
1 583 345 45 970 235 145 1152 71 443 8882 499 280 36 853 196 128 993 60 374 6823 560 341 52 908 232 151 1090 88 442 7774 602 333 38 1004 237 143 1208 79 440 8455 752 427 48 1208 272 197 1462 105 556 10266 611 292 43 940 182 130 108 * 79 374 7607 506 288 37 827 190 134 995 75 386 7058 546 316 41 888 203 147 1094 68 417 7489 606 337 43 1005 233 159 1165 84 451 83910 694 383 54 1122 276 174 1274 100 501 93511 568 327 39 938 217 145 1113 79 423 77812 598 344 44 1037 232 151 1162 88 419 80113 582 331 40 960 214 142 1096 83 424 79414 576 327 45 903 215 144 1082 78 421 75715 778 443 55 1280 293 204 1513 101 582 106316 517 293 30 864 202 132 1014 73 388 72417 523 296 32 878 201 142 1032 62 383 70318 575 318 38 904 215 144 1101 74 424 76419 771 434 50 1275 281 183 1528 89 565 106220 539 311 38 868 197 133 1054 67 397 72421 962 * 553 57 1447 319 210 1734 122 700 * 123322 548 329 45 909 207 152 1094 71 422 751
23 534 313 35 856 220 146 1035 81 401 745
24 606 343 45 1021 235 156 1264 82 436 854
25 781 553 240 * 1305 359 240 * 1501 158 * 606 1108
26 780 463 34 1269 312 201 1449 117 571 1074
27 554 359 46 866 241 158 1041 82 470 74228 770 471 46 1326 305 185 1581 100 578 106729 555 324 39 929 208 137 1099 74 414 76430 560 319 42 933 222 137 1119 76 437 78331 603 379 37 1019 231 158 1098 87 422 87332 607 337 38 990 226 152 1146 78 455 84133 576 329 40 941 223 151 1142 74 440 78234 578 340 43 957 227 143 1154 78 451 84635 514 297 33 829 210 127 1028 73 377 69236 543 304 40 881 202 135 1052 66 389 72337 551 324 38 907 207 134 1078 61 347 75938 755 436 52 1258 292 196 1491 100 575 1047M 605 356 42 1007 236 154 1195 82 448 843
REF. 595 346 42 994 233 151 1181 81 444 835SD 88 68 7 166 41 23 194 15 69 140
M = mean per sample REF. = reference values
SD = standard deviation per sample *: discarded data using the test of Grubbs 5 %
REF : Assigned values are robust average values per sample according to algorithm A of standard ISO 13528,of 36 laboratories using the reference method ISO 13366│IDF 148-1 and alternative method ISO 13366-2│IDF 148-2,after outlier discarging using Grubbs test at 5% risk level
Table IV : Outlier identification
Sample 1 2 3 4 5 6 7 8 9 10
Outliers
Cochran
Outlier
Grubbs
sr 13 7 3 19 6 7 21 4 10 20SR 89 68 7 166 34 24 193 12 68 138sr % 2% 2% 7% 2% 3% 5% 2% 5% 2% 2%SR % 15% 19% 16% 17% 15% 15% 16% 15% 15% 16%
ICAR Proficiency Test March 2018
25 6 25 21
21; 2632
26
21 25 25
26; 32 26 6; 26 26
ENUMERATION of SOMATIC CELLS in RAW (cow) MILK - page 4/8 ENUMERATION of SOMATIC CELLS in RAW (cow) MILK - page 5/8
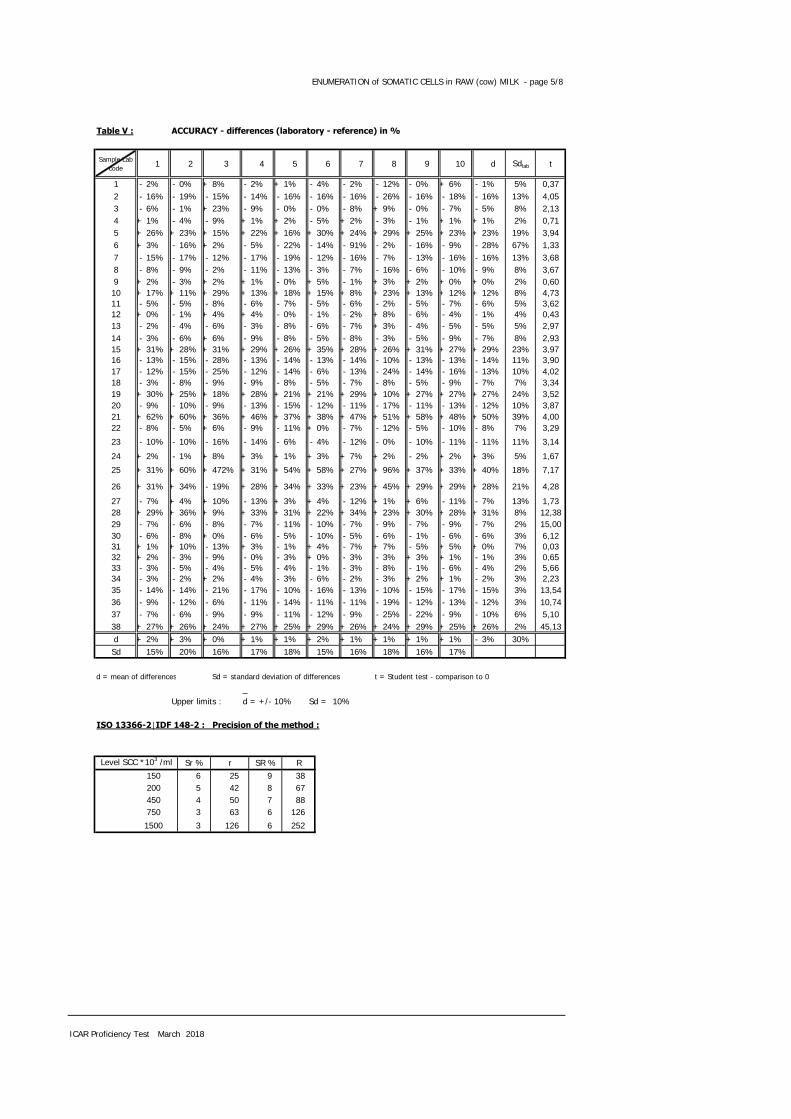
Table V : ACCURACY - differences (laboratory - reference) in %
Sample Lab code 1 2 3 4 5 6 7 8 9 10 d Sdlab t
1 - 2% - 0% + 8% - 2% + 1% - 4% - 2% - 12% - 0% + 6% - 1% 5% 0,372 - 16% - 19% - 15% - 14% - 16% - 16% - 16% - 26% - 16% - 18% - 16% 13% 4,053 - 6% - 1% + 23% - 9% - 0% - 0% - 8% + 9% - 0% - 7% - 5% 8% 2,134 + 1% - 4% - 9% + 1% + 2% - 5% + 2% - 3% - 1% + 1% + 1% 2% 0,715 + 26% + 23% + 15% + 22% + 16% + 30% + 24% + 29% + 25% + 23% + 23% 19% 3,946 + 3% - 16% + 2% - 5% - 22% - 14% - 91% - 2% - 16% - 9% - 28% 67% 1,337 - 15% - 17% - 12% - 17% - 19% - 12% - 16% - 7% - 13% - 16% - 16% 13% 3,688 - 8% - 9% - 2% - 11% - 13% - 3% - 7% - 16% - 6% - 10% - 9% 8% 3,679 + 2% - 3% + 2% + 1% - 0% + 5% - 1% + 3% + 2% + 0% + 0% 2% 0,6010 + 17% + 11% + 29% + 13% + 18% + 15% + 8% + 23% + 13% + 12% + 12% 8% 4,7311 - 5% - 5% - 8% - 6% - 7% - 5% - 6% - 2% - 5% - 7% - 6% 5% 3,6212 + 0% - 1% + 4% + 4% - 0% - 1% - 2% + 8% - 6% - 4% - 1% 4% 0,4313 - 2% - 4% - 6% - 3% - 8% - 6% - 7% + 3% - 4% - 5% - 5% 5% 2,9714 - 3% - 6% + 6% - 9% - 8% - 5% - 8% - 3% - 5% - 9% - 7% 8% 2,9315 + 31% + 28% + 31% + 29% + 26% + 35% + 28% + 26% + 31% + 27% + 29% 23% 3,9716 - 13% - 15% - 28% - 13% - 14% - 13% - 14% - 10% - 13% - 13% - 14% 11% 3,9017 - 12% - 15% - 25% - 12% - 14% - 6% - 13% - 24% - 14% - 16% - 13% 10% 4,0218 - 3% - 8% - 9% - 9% - 8% - 5% - 7% - 8% - 5% - 9% - 7% 7% 3,3419 + 30% + 25% + 18% + 28% + 21% + 21% + 29% + 10% + 27% + 27% + 27% 24% 3,5220 - 9% - 10% - 9% - 13% - 15% - 12% - 11% - 17% - 11% - 13% - 12% 10% 3,8721 + 62% + 60% + 36% + 46% + 37% + 38% + 47% + 51% + 58% + 48% + 50% 39% 4,0022 - 8% - 5% + 6% - 9% - 11% + 0% - 7% - 12% - 5% - 10% - 8% 7% 3,29
23 - 10% - 10% - 16% - 14% - 6% - 4% - 12% - 0% - 10% - 11% - 11% 11% 3,14
24 + 2% - 1% + 8% + 3% + 1% + 3% + 7% + 2% - 2% + 2% + 3% 5% 1,67
25 + 31% + 60% + 472% + 31% + 54% + 58% + 27% + 96% + 37% + 33% + 40% 18% 7,17
26 + 31% + 34% - 19% + 28% + 34% + 33% + 23% + 45% + 29% + 29% + 28% 21% 4,28
27 - 7% + 4% + 10% - 13% + 3% + 4% - 12% + 1% + 6% - 11% - 7% 13% 1,7328 + 29% + 36% + 9% + 33% + 31% + 22% + 34% + 23% + 30% + 28% + 31% 8% 12,3829 - 7% - 6% - 8% - 7% - 11% - 10% - 7% - 9% - 7% - 9% - 7% 2% 15,0030 - 6% - 8% + 0% - 6% - 5% - 10% - 5% - 6% - 1% - 6% - 6% 3% 6,1231 + 1% + 10% - 13% + 3% - 1% + 4% - 7% + 7% - 5% + 5% + 0% 7% 0,0332 + 2% - 3% - 9% - 0% - 3% + 0% - 3% - 3% + 3% + 1% - 1% 3% 0,6533 - 3% - 5% - 4% - 5% - 4% - 1% - 3% - 8% - 1% - 6% - 4% 2% 5,6634 - 3% - 2% + 2% - 4% - 3% - 6% - 2% - 3% + 2% + 1% - 2% 3% 2,2335 - 14% - 14% - 21% - 17% - 10% - 16% - 13% - 10% - 15% - 17% - 15% 3% 13,5436 - 9% - 12% - 6% - 11% - 14% - 11% - 11% - 19% - 12% - 13% - 12% 3% 10,7437 - 7% - 6% - 9% - 9% - 11% - 12% - 9% - 25% - 22% - 9% - 10% 6% 5,1038 + 27% + 26% + 24% + 27% + 25% + 29% + 26% + 24% + 29% + 25% + 26% 2% 45,13d + 2% + 3% + 0% + 1% + 1% + 2% + 1% + 1% + 1% + 1% - 3% 30%Sd 15% 20% 16% 17% 18% 15% 16% 18% 16% 17%
d = mean of differences Sd = standard deviation of differences t = Student test - comparison to 0
_Upper limits : d = +/- 10% Sd = 10%
ISO 13366-2│IDF 148-2 : Precision of the method :
6 25 9 385 42 8 674 50 7 883 63 6 126
3 126 6 252
ICAR Proficiency Test March 2018
750
1500
150200450
Level SCC *103 /ml Sr % r SR % R
ENUMERATION of SOMATIC CELLS in RAW (cow) MILK - page 5/8 ENUMERATION of SOMATIC CELLS in RAW (cow) MILK - page 6/8
Table VI : Zscore of the different laboratories for each sample.
ZS calculated on the PT standard deviation
Sample Lab code 1 2 3 4 5 6 7 8 9 10
1 -0,14 -0,01 +0,48 -0,14 +0,05 -0,27 -0,15 -0,67 -0,01 +0,372 -1,09 -0,97 -0,97 -0,85 -0,92 -1,02 -0,97 -1,43 -1,00 -1,093 -0,41 -0,07 +1,47 -0,52 -0,03 -0,01 -0,47 +0,50 -0,03 -0,414 +0,08 -0,19 -0,59 +0,06 +0,09 -0,36 +0,14 -0,15 -0,06 +0,075 +1,78 +1,19 +0,94 +1,29 +0,93 +1,96 +1,44 +1,64 +1,62 +1,366 +0,17 -0,79 +0,10 -0,32 -1,26 -0,94 -5,53 -0,12 -1,01 -0,547 -1,02 -0,85 -0,74 -1,01 -1,06 -0,76 -0,96 -0,39 -0,84 -0,938 -0,56 -0,44 -0,13 -0,64 -0,73 -0,19 -0,45 -0,88 -0,39 -0,629 +0,12 -0,14 +0,10 +0,06 -0,00 +0,33 -0,09 +0,19 +0,10 +0,0210 +1,12 +0,54 +1,85 +0,77 +1,03 +0,97 +0,48 +1,30 +0,83 +0,7111 -0,31 -0,28 -0,51 -0,34 -0,40 -0,29 -0,35 -0,12 -0,30 -0,4112 +0,03 -0,03 +0,25 +0,26 -0,03 -0,03 -0,10 +0,47 -0,36 -0,2413 -0,16 -0,22 -0,36 -0,20 -0,48 -0,40 -0,44 +0,16 -0,28 -0,3014 -0,22 -0,28 +0,40 -0,55 -0,44 -0,31 -0,51 -0,19 -0,33 -0,5615 +2,07 +1,42 +2,01 +1,72 +1,46 +2,28 +1,71 +1,43 +1,99 +1,6216 -0,89 -0,78 -1,81 -0,79 -0,77 -0,85 -0,86 -0,57 -0,80 -0,7917 -0,82 -0,74 -1,58 -0,70 -0,79 -0,42 -0,77 -1,33 -0,87 -0,9418 -0,23 -0,41 -0,59 -0,54 -0,44 -0,34 -0,41 -0,46 -0,29 -0,5119 +1,99 +1,29 +1,17 +1,69 +1,17 +1,36 +1,79 +0,54 +1,74 +1,6220 -0,64 -0,51 -0,59 -0,76 -0,88 -0,81 -0,66 -0,95 -0,68 -0,7921 +4,16 +3,02 +2,31 +2,73 +2,08 +2,50 +2,85 +2,81 +3,69 +2,8322 -0,54 -0,25 +0,40 -0,51 -0,64 +0,03 -0,45 -0,67 -0,31 -0,60
23 -0,70 -0,49 -1,04 -0,83 -0,33 -0,25 -0,76 -0,01 -0,62 -0,6524 +0,12 -0,05 +0,48 +0,16 +0,05 +0,18 +0,42 +0,09 -0,11 +0,13
25 +2,11 +3,02 +30,13 +1,88 +3,06 +3,79 +1,65 +5,33 +2,34 +1,94
26 +2,09 +1,70 -1,20 +1,66 +1,91 +2,11 +1,38 +2,50 +1,84 +1,7027 -0,47 +0,19 +0,63 -0,77 +0,19 +0,29 -0,72 +0,05 +0,38 -0,6628 +1,98 +1,83 +0,56 +2,00 +1,74 +1,45 +2,06 +1,30 +1,94 +1,6529 -0,46 -0,32 -0,51 -0,39 -0,62 -0,64 -0,43 -0,50 -0,43 -0,5130 -0,40 -0,40 +0,02 -0,37 -0,27 -0,64 -0,32 -0,33 -0,10 -0,3731 +0,09 +0,48 -0,81 +0,15 -0,06 +0,29 -0,43 +0,40 -0,31 +0,2732 +0,13 -0,13 -0,59 -0,03 -0,17 +0,01 -0,18 -0,19 +0,16 +0,0433 -0,22 -0,25 -0,28 -0,32 -0,25 -0,03 -0,20 -0,46 -0,06 -0,3834 -0,20 -0,09 +0,10 -0,22 -0,15 -0,38 -0,14 -0,19 +0,11 +0,0735 -0,92 -0,71 -1,35 -0,99 -0,56 -1,04 -0,79 -0,53 -0,97 -1,0236 -0,59 -0,62 -0,36 -0,68 -0,77 -0,70 -0,67 -1,05 -0,79 -0,8037 -0,50 -0,32 -0,59 -0,53 -0,64 -0,76 -0,53 -1,39 -1,39 -0,5438 +1,81 +1,32 +1,55 +1,59 +1,43 +1,90 +1,60 +1,33 +1,89 +1,51
In yellow the values bigger or smaller than 2/-2 In red the values bigger or smaller than 3/-3
Figure 2 :
Zscore of the different laboratories for each sample. ZS calculated on the PT standard deviation
ICAR Proficiency Test March 2018
-5
-4
-3
-2
-1
0
1
2
3
4
5
1 2 3 4 5 6 7 8 9 10 11 12 13 14 15 16 17 18 19 20 21 22 23 24 25 26 27 28 29 30 31 32 33 34 35 36 37 38
Z sc
ore
PT
Laboratory code
sample1
sample2
sample 3
sample 4
sample 5
sample 6
sample 7
sample 8
sample 9
sample 10
ENUMERATION of SOMATIC CELLS in RAW (cow) MILK - page 6/8 ENUMERATION of SOMATIC CELLS in RAW (cow) MILK - page 7/8
Table VII : Zscore of the different laboratories for each sample.
ZS calculated on the standard deviation of reproducibility of the method
Sample Lab code 1 2 3 4 5 6 7 8 9 10
1 -0,31 -0,03 +0,84 -0,40 +0,09 -0,46 -0,41 -1,34 -0,02 +1,052 -2,31 -2,40 -1,68 -2,36 -1,79 -1,75 -2,66 -2,85 -1,96 -3,073 -0,86 -0,18 +2,56 -1,44 -0,05 -0,02 -1,29 +1,00 -0,06 -1,164 +0,16 -0,47 -1,02 +0,16 +0,19 -0,61 +0,38 -0,30 -0,12 +0,205 +3,76 +2,93 +1,63 +3,59 +1,83 +3,36 +3,96 +3,27 +3,17 +3,806 +0,37 -1,95 +0,17 -0,90 -2,46 -1,60 -15,15 -0,24 -1,98 -1,517 -2,15 -2,11 -1,29 -2,81 -2,08 -1,31 -2,63 -0,79 -1,64 -2,608 -1,19 -1,08 -0,22 -1,77 -1,44 -0,32 -1,23 -1,75 -0,76 -1,749 +0,26 -0,34 +0,17 +0,18 -0,01 +0,56 -0,24 +0,38 +0,19 +0,0710 +2,37 +1,34 +3,23 +2,14 +2,02 +1,67 +1,31 +2,59 +1,62 +1,9911 -0,65 -0,68 -0,89 -0,94 -0,79 -0,50 -0,96 -0,24 -0,60 -1,1412 +0,07 -0,09 +0,44 +0,72 -0,05 -0,06 -0,27 +0,93 -0,69 -0,6813 -0,33 -0,56 -0,62 -0,57 -0,94 -0,68 -1,21 +0,31 -0,55 -0,8314 -0,46 -0,70 +0,71 -1,53 -0,86 -0,54 -1,41 -0,37 -0,65 -1,5615 +4,37 +3,51 +3,49 +4,79 +2,85 +3,89 +4,68 +2,85 +3,88 +4,5516 -1,88 -1,93 -3,15 -2,18 -1,51 -1,45 -2,36 -1,13 -1,57 -2,2317 -1,75 -1,82 -2,75 -1,95 -1,55 -0,72 -2,11 -2,65 -1,71 -2,6418 -0,49 -1,01 -1,02 -1,51 -0,86 -0,57 -1,13 -0,92 -0,57 -1,4219 +4,22 +3,19 +2,03 +4,71 +2,28 +2,33 +4,89 +1,07 +3,41 +4,5320 -1,35 -1,26 -1,02 -2,12 -1,72 -1,38 -1,79 -1,89 -1,33 -2,2321 +8,80 +7,47 +4,02 +7,60 +4,07 +4,27 +7,80 +5,61 +7,21 +7,9422 -1,15 -0,61 +0,71 -1,43 -1,24 +0,05 -1,24 -1,34 -0,61 -1,69
23 -1,48 -1,21 -1,82 -2,31 -0,65 -0,43 -2,07 -0,03 -1,22 -1,8124 +0,26 -0,12 +0,84 +0,45 +0,09 +0,31 +1,16 +0,18 -0,22 +0,38
25 +4,46 +7,47 +52,48 +5,22 +6,00 +6,48 +4,51 +10,64 +4,57 +5,45
26 +4,43 +4,22 -2,08 +4,62 +3,74 +3,61 +3,78 +4,99 +3,59 +4,7627 -1,00 +0,47 +1,10 -2,15 +0,38 +0,49 -1,99 +0,11 +0,74 -1,8628 +4,18 +4,52 +0,97 +5,56 +3,40 +2,47 +5,63 +2,59 +3,79 +4,6229 -0,98 -0,79 -0,89 -1,09 -1,22 -1,09 -1,17 -0,99 -0,85 -1,4230 -0,85 -0,99 +0,04 -1,03 -0,53 -1,09 -0,88 -0,65 -0,19 -1,0431 +0,19 +1,20 -1,42 +0,42 -0,12 +0,49 -1,17 +0,80 -0,61 +0,7632 +0,27 -0,32 -1,02 -0,07 -0,34 +0,01 -0,50 -0,37 +0,32 +0,1133 -0,46 -0,63 -0,49 -0,89 -0,48 -0,06 -0,55 -0,92 -0,12 -1,0634 -0,43 -0,21 +0,17 -0,62 -0,29 -0,65 -0,38 -0,37 +0,21 +0,2135 -1,95 -1,77 -2,35 -2,76 -1,10 -1,79 -2,16 -1,06 -1,89 -2,8636 -1,25 -1,53 -0,62 -1,89 -1,51 -1,20 -1,83 -2,09 -1,55 -2,2437 -1,06 -0,79 -1,02 -1,46 -1,24 -1,31 -1,46 -2,78 -2,72 -1,5238 +3,82 +3,26 +2,70 +4,42 +2,81 +3,24 +4,37 +2,65 +3,69 +4,22
This table will allows to compare your ZSCORE from one PT to an other because the standard deviation has always the value of SR of the method SR : Cf page 5./8In yellow the values bigger or smaller than 2/-2 In red the values bigger or smaller than 3/-3
Figure 3 :
Zscore of the different laboratories for each sample. ZS calculated on the standard deviation of reproducibility of the method
ICAR Proficiency Test March 2018
-5
-4
-3
-2
-1
0
1
2
3
4
5
1 2 3 4 5 6 7 8 9 10 11 12 13 14 15 16 17 18 19 20 21 22 23 24 25 26 27 28 29 30 31 32 33 34 35 36 37 38
Z sc
ore
Fix
Laboratory code
sample1
sample2
sample 3
sample 4
sample 5
sample 6
sample 7
sample 8
sample 9
sample 10
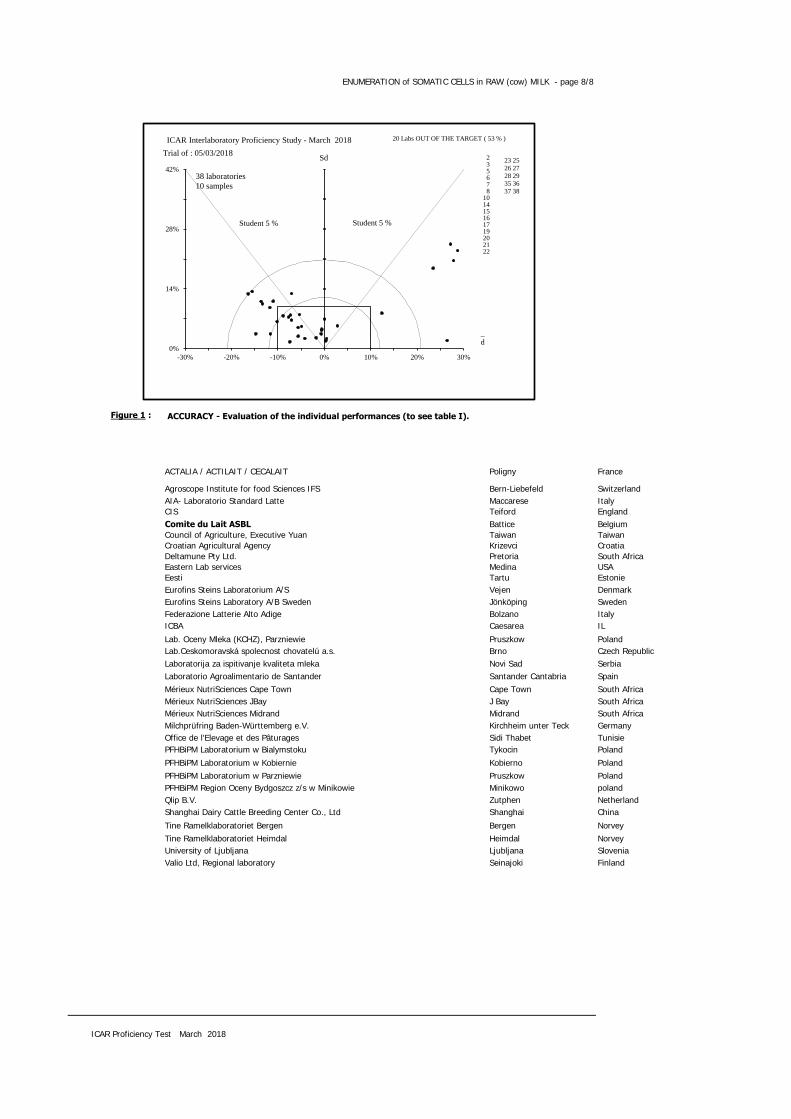
ENUMERATION of SOMATIC CELLS in RAW (cow) MILK - page 7/8 ENUMERATION of SOMATIC CELLS in RAW (cow) MILK - page 8/8
Figure 1 : ACCURACY - Evaluation of the individual performances (to see table I).
ACTALIA / ACTILAIT / CECALAIT Poligny France
Agroscope Institute for food Sciences IFS Bern-Liebefeld SwitzerlandAIA- Laboratorio Standard Latte Maccarese ItalyCIS Teiford EnglandComite du Lait ASBL Battice BelgiumCouncil of Agriculture, Executive Yuan Taiwan TaiwanCroatian Agricultural Agency Krizevci CroatiaDeltamune Pty Ltd. Pretoria South AfricaEastern Lab services Medina USAEesti Tartu EstonieEurofins Steins Laboratorium A/S Vejen DenmarkEurofins Steins Laboratory A/B Sweden Jönköping SwedenFederazione Latterie Alto Adige Bolzano ItalyICBA Caesarea IL
Lab. Oceny Mleka (KCHZ), Parzniewie Pruszkow PolandLab.Ceskomoravská spolecnost chovatelú a.s. Brno Czech RepublicLaboratorija za ispitivanje kvaliteta mleka Novi Sad SerbiaLaboratorio Agroalimentario de Santander Santander Cantabria SpainMérieux NutriSciences Cape Town Cape Town South AfricaMérieux NutriSciences JBay J Bay South AfricaMérieux NutriSciences Midrand Midrand South AfricaMilchprüfring Baden-Württemberg e.V. Kirchheim unter Teck GermanyOffice de l'Elevage et des Pâturages Sidi Thabet TunisiePFHBiPM Laboratorium w Bialymstoku Tykocin Poland
PFHBiPM Laboratorium w Kobiernie Kobierno PolandPFHBiPM Laboratorium w Parzniewie Pruszkow PolandPFHBiPM Region Oceny Bydgoszcz z/s w Minikowie Minikowo polandQlip B.V. Zutphen NetherlandShanghai Dairy Cattle Breeding Center Co., Ltd Shanghai China
Tine Ramelklaboratoriet Bergen Bergen NorveyTine Ramelklaboratoriet Heimdal Heimdal NorveyUniversity of Ljubljana Ljubljana SloveniaValio Ltd, Regional laboratory Seinajoki Finland
ICAR Proficiency Test March 2018
0%
14%
28%
42%
-30% -20% -10% 0% 10% 20% 30%
Sd
Student 5 % Student 5 %
_
d
Trial of : 05/03/2018
38 laboratories
10 samples
20 Labs OUT OF THE TARGET ( 53 % )
2 3 5 6 7 8
10 14 15 16 17 19 20 21 22
23 25
26 27
28 29
35 36
37 38
ICAR Interlaboratory Proficiency Study - March 2018


![FROM MACHINE LEARNING, TO DEEP LEARNING - icar.org jeremy howard.pdf · Keratosis] where here we improve it to 60% ... Resume screening Training recommendation Employee churn Talent](https://static.fdocuments.in/doc/165x107/5e09f74821555b3b1f749546/from-machine-learning-to-deep-learning-icarorg-jeremy-keratosis-where-here.jpg)