Raven's test performance of sub-Saharan Africans: · PDF fileRaven's test performance of...
17
Raven's test performance of sub-Saharan Africans: Average performance, psychometric properties, and the Flynn Effect Jelte M. Wicherts a, ⁎, Conor V. Dolan a , Jerry S. Carlson b , Han L.J. van der Maas a a Department of Psychology, Psychological Methods, University of Amsterdam, Roetersstraat 15, 1018 WB Amsterdam, The Netherlands b University of California, Riverside, United States abstract article info Article history: Received 19 May 2009 Received in revised form 19 November 2009 Accepted 3 December 2009 Keywords: Black–White differences Cognitive abilities Cross-cultural comparison Measurement equivalence Measurement invariance This paper presents a systematic review of published data on the performance of sub-Saharan Africans on Raven's Progressive Matrices. The specific goals were to estimate the average level of performance, to study the Flynn Effect in African samples, and to examine the psychometric meaning of Raven's test scores as measures of general intelligence. Convergent validity of the Raven's tests is found to be relatively poor, although reliability and predictive validity are comparable to western samples. Factor analyses indicate that the Raven's tests are relatively weak indicators of general intelligence among Africans, and often measure additional factors, besides general intelligence. The degree to which Raven's scores of Africans reflect levels of general intelligence is unknown. Average IQ of Africans is approximately 80 when compared to US norms. Raven's scores among African adults have shown secular increases over the years. It is concluded that the Flynn Effect has yet to take hold in sub-Saharan Africa. © 2009 Elsevier Inc. All rights reserved. 1. Introduction In 2007, Nobel laureate James Watson sparked controversy by expressing his gloom about the future of Africa in the light of the finding that sub-Saharan Africans have lower average IQ test scores than the peoples in the other parts of the world (The Sunday Times, October, 14, 2007). Although some scientists responded that his statements were “unsupported by science” (Federation of American Scientists, press release, October, 18, 2007), others responded more positively (Malloy, 2008; Rushton & Jensen, 2008). Notably, Lynn and Vanhanen (2002, 2006) collated the results of more than 50 published studies in which western IQ tests were administered to Africans. They concluded that the average IQ of the populations of sub-Saharan Africa in terms of UK norms lies below 70 (Lynn, 2006; Rushton & Jensen, 2005). Malloy (2008) also reviewed the literature on this issue and arrived at a similar conclusion. According to Rushton and Jensen (2009), this low average IQ suggests that African adults have the cognitive ability of an aver- age 11-year-old white teenager. This assertion strikes us as unlikely and so the work by Lynn and Vanhanen and others raises the following questions: (1) Is their estimate of the average IQ of sub-Saharan Africans accurate? (2) How should we interpret IQ test performance of Africans? (3) Is IQ test performance of Africans a cause for concern about the prospects of sub-Saharan Africa? The aim of the present paper is to address these questions by presenting a balanced and critical evaluation of the present body of results of IQ testing in sub-Saharan Africa. To estimate average IQ in countries all over the world, Lynn (and Vanhanen) 1 drew mainly on published data from Raven's Coloured Progressive Matrices (CPM; J. C. Raven, 1956) and the Standard Progressive Matrices (SPM; J. C. Raven, 1960). The Raven's tests are generally considered to be good non-verbal indicators of gen- eral intelligence or g (Carroll, 1993; Jensen, 1998), at least in western samples, and have often been administered in sub-Saharan Africa. For instance, Fahrmeier (1975) collected CPM data of schooled and unschooled Nigerian children. Lynn (and Vanhanen) compared their CPM scores to British norms 2 and calculated an average IQ of about 69 (Lynn, 2006; Lynn & Vanhanen, 2002). In another study conducted in Nigeria, Wober (1969) administered the SPM twice to a group of male factory workers. Lynn (and Vanhanen) compared their pretest scores to British norms, and concluded that their average IQ was below 65. Learning and Individual Differences 20 (2010) 135–151 ⁎ Corresponding author. Tel.: + 31 205257067; fax: + 31 206390026. E-mail address: [email protected] (J.M. Wicherts). 1 Whenever we refer to “Lynn (and Vanhanen)” in this paper, we refer to Lynn and Vanhanen (2002, 2006) and to Lynn (2006), because the literature reviews in these three books overlap strongly. We refer to specific books whenever necessary. 2 The estimation of IQ is described as follows: “Around 1973, data for the Coloured Progressive Matrices for a sample of 375 6–13 year-olds were collected by Fahrmeier (1975). In relation to the 1979 British standardization of the Standard Progressive Matrices, the mean IQ is 70. Because of the 6-year interval between the two data collections, this needs to be reduced to 69” (Lynn & Vanhanen, 2002, p. 215). Lynn (and Vanhanen) probably used a table provided on page 60 of the SPM manual (J. C. Raven et al., 1996) to convert raw CPM scores to raw SPM scores, to compare these CPM scores to British SPM norms of 1979. Note that their downward correction for outdated norms is an error because the norms are more recent than the test scores in Fahrmeier's sample. Hence, according to the appropriate use of this correction (i.e., 2 IQ points per decade), the IQ should have been raised by one point, not lowered by one. 1041-6080/$ – see front matter © 2009 Elsevier Inc. All rights reserved. doi:10.1016/j.lindif.2009.12.001 Contents lists available at ScienceDirect Learning and Individual Differences journal homepage: www.elsevier.com/locate/lindif
Transcript of Raven's test performance of sub-Saharan Africans: · PDF fileRaven's test performance of...

Learning and Individual Differences 20 (2010) 135–151
Contents lists available at ScienceDirect
Learning and Individual Differences
j ourna l homepage: www.e lsev ie r.com/ locate / l ind i f
Raven's test performance of sub-Saharan Africans: Average performance,psychometric properties, and the Flynn Effect
Jelte M. Wicherts a,⁎, Conor V. Dolan a, Jerry S. Carlson b, Han L.J. van der Maas a
a Department of Psychology, Psychological Methods, University of Amsterdam, Roetersstraat 15, 1018 WB Amsterdam, The Netherlandsb University of California, Riverside, United States
⁎ Corresponding author. Tel.: +31 205257067; fax: +E-mail address: [email protected] (J.M. Wicherts)
1041-6080/$ – see front matter © 2009 Elsevier Inc. Aldoi:10.1016/j.lindif.2009.12.001
a b s t r a c t
a r t i c l e i n f oArticle history:Received 19 May 2009Received in revised form 19 November 2009Accepted 3 December 2009
Keywords:Black–White differencesCognitive abilitiesCross-cultural comparisonMeasurement equivalenceMeasurement invariance
This paper presents a systematic review of published data on the performance of sub-Saharan Africans onRaven's ProgressiveMatrices. The specific goalswere to estimate the average level of performance, to study theFlynn Effect in African samples, and to examine the psychometricmeaning of Raven's test scores asmeasures ofgeneral intelligence. Convergent validity of the Raven's tests is found to be relatively poor, although reliabilityand predictive validity are comparable to western samples. Factor analyses indicate that the Raven's tests arerelativelyweak indicators of general intelligence amongAfricans, and oftenmeasure additional factors, besidesgeneral intelligence. The degree to which Raven's scores of Africans reflect levels of general intelligence isunknown. Average IQ of Africans is approximately 80 when compared to US norms. Raven's scores amongAfrican adults have shown secular increases over the years. It is concluded that the Flynn Effect has yet to takehold in sub-Saharan Africa.
31 206390026..
1 Whenever we reVanhanen (2002, 20three books overlap
2 The estimation oProgressive Matrices(1975). In relationMatrices, the meancollections, this nee(and Vanhanen) proRaven et al., 1996) tCPM scores to Britisoutdated norms is anFahrmeier's sample.IQ points per decadone.
l rights reserved.
© 2009 Elsevier Inc. All rights reserved.
fer to “Lynn (and Vanhanen)” in this paper, we refer to Lynn and06) and to Lynn (2006), because the literature reviews in thesestrongly. We refer to specific books whenever necessary.f IQ is described as follows: “Around 1973, data for the Colouredfor a sample of 375 6–13 year-olds were collected by Fahrmeier
to the 1979 British standardization of the Standard ProgressiveIQ is 70. Because of the 6-year interval between the two datads to be reduced to 69” (Lynn & Vanhanen, 2002, p. 215). Lynnbably used a table provided on page 60 of the SPM manual (J. C.o convert raw CPM scores to raw SPM scores, to compare these
1. Introduction
In 2007, Nobel laureate James Watson sparked controversy byexpressing his gloomabout the future of Africa in the light of the findingthat sub-Saharan Africans have lower average IQ test scores than thepeoples in the other parts of the world (The Sunday Times, October,14, 2007). Although some scientists responded that his statementswere“unsupported by science” (Federation of American Scientists, pressrelease, October, 18, 2007), others responded more positively (Malloy,2008; Rushton & Jensen, 2008). Notably, Lynn and Vanhanen (2002,2006) collated the results of more than 50 published studies in whichwestern IQ testswere administered to Africans. They concluded that theaverage IQ of the populations of sub-Saharan Africa in terms of UKnorms lies below 70 (Lynn, 2006; Rushton & Jensen, 2005). Malloy(2008) also reviewed the literature on this issue and arrived at a similarconclusion. According to Rushton and Jensen (2009), this low averageIQ suggests that African adults have the cognitive ability of an aver-age 11-year-old white teenager. This assertion strikes us as unlikelyand so the work by Lynn and Vanhanen and others raises the followingquestions: (1) Is their estimate of the average IQof sub-SaharanAfricansaccurate? (2) How shouldwe interpret IQ test performance of Africans?(3) Is IQ test performance of Africans a cause for concern about theprospects of sub-Saharan Africa? The aim of the present paper is toaddress these questions by presenting a balanced and critical evaluationof the present body of results of IQ testing in sub-Saharan Africa.
To estimate average IQ in countries all over the world, Lynn (andVanhanen)1 drew mainly on published data from Raven's ColouredProgressive Matrices (CPM; J. C. Raven, 1956) and the StandardProgressive Matrices (SPM; J. C. Raven, 1960). The Raven's testsare generally considered to be good non-verbal indicators of gen-eral intelligence or g (Carroll, 1993; Jensen, 1998), at least in westernsamples, and have often been administered in sub-Saharan Africa.For instance, Fahrmeier (1975) collected CPM data of schooled andunschooled Nigerian children. Lynn (and Vanhanen) compared theirCPM scores to British norms2 and calculated an average IQ of about 69(Lynn, 2006; Lynn & Vanhanen, 2002). In another study conducted inNigeria, Wober (1969) administered the SPM twice to a group of malefactory workers. Lynn (and Vanhanen) compared their pretest scoresto British norms, and concluded that their average IQ was below 65.
h SPM norms of 1979. Note that their downward correction forerror because the norms are more recent than the test scores in
Hence, according to the appropriate use of this correction (i.e., 2e), the IQ should have been raised by one point, not lowered by
3 At a time when the current manuscript was ready for submission, reviewers of ourother paper in Intelligence demanded that we include in that paper some data on themean performance of Africans on the Raven's from the current review. We view bothstudies as replications of the same issue and report the main results in the currentpaper.
136 J.M. Wicherts et al. / Learning and Individual Differences 20 (2010) 135–151
On the basis of these convenience samples, Lynn and Vanhanen(2002) claimed that the average IQ in Nigeria is below 70.
Lynn (and Vanhanen)'s work on IQ of Africans is often taken at facevalue (e.g., Herrnstein & Murray, 1994; Sarich & Miele, 2004; Skuyet al., 2002; Te Nijenhuis, De Jong, Evers, & van der Flier, 2004), evenby their critics (e.g., MacEachern, 2006). The estimates of the averageIQ of Africans are accorded a central role in the discussion on Black–White differences in IQ by Rushton and Jensen (2005, 2008, 2009),and these estimates feature in several evolutionary theories ofintelligence (Kanazawa, 2004; Lynn, 2006; Rushton, 2000). Moreover,Lynn and Vanhanen's (2002, 2006) estimates of “national IQ” (i.e., anestimate of the average IQ of nations' inhabitants) have been used inat least twenty-five scientific studies (e.g., Barber, 2005; Dickerson,2006; Gelade, 2008a,b; Jones & Schneider, 2006; Kanazawa, 2006,2008; Ram, 2007; Rindermann, 2007, 2008a,b; Templer, 2008;Templer & Arikawa, 2006). Nevertheless, the work by Lynn (andVanhanen) has also drawn criticism (Barnett & Williams, 2004; Ervik,2003; Hunt & Carlson, 2007; Hunt & Sternberg, 2006). One pointof critique is that Lynn and Vanhanen's estimate of average IQ amongAfricans is primarily based on convenience samples, and not onsamples representative of the relevant populations (Barnett &Williams, 2004; Hunt & Sternberg, 2006). For example, the samplesof Fahrmeier (N=375) and Wober (N=86) were neither intended,nor can be considered, to be representative of the entire populationof Nigeria, a country of over 130 million inhabitants.
Lynn (and Vanhanen) did not take into account a sizeable portionof the relevant literature on IQ testing in sub-Saharan Africa. Forinstance, they did not consider other potentially relevant studies withthe Raven's tests in Nigeria that indicated that average IQ in thiscountry is considerably higher than 70 (Maqsud, 1980a,b; Okunrotifa,1976). Perhaps the most important drawback of Lynn (and Vanha-nen)'s reviews of the literature is that they are unsystematic. Forexample, nowhere in their reviews do they provide details concerningtheir literature search strategy, nor did they explicate the inclusionand exclusion criteria that they employed in selecting studies. It iswell known that unsystematic literature reviews may lead to biasedresults (Cooper, 1998). The first aim of our review is to estimate thecurrent level of average IQ of Africans on the basis of the Raven's testsby systematic literature review.
Because mean IQ levels in many western populations have shownmarked increases over the course of the twentieth century (Flynn,2006; Neisser, 1998), the interpretation of average IQ test scores ofpopulations must be put into historical context. The scores on theRaven's tests have shown strong increases, a.k.a. Flynn Effects, in thedeveloped world (Brouwers, van de Vijver, & van Hemert, 2009).Although there is some indication of a similar secular trend in IQs onthe CPM in Kenya in recent years (Daley, Whaley, Sigman, Espinosa, &Neumann, 2003), little is known about the Flynn Effect in sub-SaharanAfrica. The second aimof our review is therefore to determinewhetherthere has been a FlynnEffect on theRaven's tests in sub-SaharanAfrica.We note that the environmental variables that have been advancedas causes of the Flynn Effect in developed nations, such as improve-ments in nutrition and health (e.g., Lynn, 1990), and increases ineducational opportunity and attainment (Ceci, 1991) are open toimprovement in sub-Saharan Africa.
IQs do not necessarily equal a particular level of general intel-ligence or g (Bartholomew, 2004), as it is necessary to consider theissue of validity in interpreting an observed score as an indicationof the position on a latent variable such as g. Several authors havequestioned whether IQs of Africans are valid and comparable toscores in western samples in terms of general intelligence (Barnett &Williams, 2004; Ervik, 2003; Hunt & Carlson, 2007; Hunt & Sternberg,2006). Some (e.g., Berry, 1974) reject the very possibility of obtaininga valid measure of g in sub-Saharan Africa with western IQ tests,while others (e.g., Herrnstein & Murray, 1994; Lynn, 2006; Rushton &Jensen, 2005) consider this relatively unproblematic. This issue is
related to our third question: what is the psychometric meaningof Africans' scores on the Raven's tests, and to what degree can weinterpret these scores in terms of the cognitive abilities that thesetests purport to measure? To this end, we consider studies thataddress the validity and reliability of these tests. We also consider thepsychometric issue of measurement invariance (Mellenbergh, 1989;Millsap & Everson, 1993), which is crucial (e.g., Byrne et al., 2009)to the comparability of test scores across cultural groups in terms oflatent variables, such as general intelligence.
Our paper is organized as follows. In Section 2, we present theresults of a systematic review of the literature on the average per-formance of Africans on the basis of the Raven's tests. In Section 3, weconsider whether there has been a Flynn Effect among Africans onthese tests. Note that in Sections 2 and 3, we describe the meanperformance and trends in the IQ metric. We do this to ensure con-sistency with the literature, but our use of the IQ metric should notbe taken to imply that we consider scores on the Raven's tests ofAfricans valid indicators of general intelligence. In Section 4, we collatethe results of studies that have addressed the validity the Raven's testsas measures of general intelligence or g in African samples. In thissection,we view g in terms of Jensen's (1998) factor analytic definition(cf. Bartholomew, 2004), which is closely related to other views onintelligence (Carroll, 1993; McGrew, 2005). We do this because thisdefinition is amendable to psychometric modeling, but we recognizethat the interpretation of g remains open to debate (Bartholomew,Deary, & Lawn, 2009; van der Maas et al., 2006). Hence, Section 4 isnot concerned with the nature of g itself, but rather provides anempirical test of the prediction from the g theory (Jensen, 1980, 1998)that Raven's tests are valid indicators of g among Africans (Lynn, 2006;Lynn & Vanhanen, 2006; Rushton & Jensen, 2005; Rushton & Jensen,2009; Rushton & Skuy, 2000).
2. Is average IQ of Africans really below 70?
In a previous study (Wicherts, Dolan, & van der Maas, 2010),we considered the IQ test performance of Africans on several westernIQ tests and found that their average IQ is appreciably higher thanLynn (and Vanhanen)'s estimates suggest.3 In the current study, weattempted to locate all the published data of Africans on the Raven'stests. We explicitly discuss the criteria we used for inclusion andexclusion of particular studies. Our specific aims are to estimate theaverage IQ of African samples on the SPM and CPM. In Section 3, wedetermine whether a Flynn Effect is present in African populations.Our literature review also provided us with the opportunity to con-sider the psychometric properties of the Raven's tests in Africansamples, which we address in Section 4. Note that our review of theliterature and our estimates of average IQ are concerned with theoverall Black population of sub-Saharan Africa. This necessarilyrepresents a crude generalization that can not do justice to the widecultural, social, and economic variation in sub-Saharan Africa. Weconduct more fine grained analyses whenever possible.
2.1. Method
2.1.1. Selection biasIt is well known that convenience samples may produce biased
results. In estimating average scores of the population of (countriesin) sub-Saharan Africa, Lynn (and Vanhanen) used published studies,which included small convenience samples (e.g., Fahrmeier, 1975;Wober, 1966) and large representative samples (e.g., Costenbader &

137J.M. Wicherts et al. / Learning and Individual Differences 20 (2010) 135–151
Ngari, 2001; MacArthur, Irvine, & Brimble, 1964). In estimatingthe average IQ of Africans, they assigned equal weight to both typesof sample. Because in most cases representative samples are muchlarger than convenience samples, one straightforward, albeit partial,solution to the issue of selection bias is to weight average IQs bysample size. An additional reason to do so, is that the effect of sam-pling variability decreases as sample size increases. We include in ourreview both convenience and representative samples, but specificallyconsider the latter type of samples.
2.1.2. Search of studiesBesides considering the sources used by Lynn (and Vanhanen)
and Malloy (2008), we located studies in which the SPM or CPMwere administered in African samples. To this end, we submitted acombination of various search terms to PsycINFO. These included“Raven”, “SPM”, “CPM”, “progressive matrices”, “IQ”, “intelligence”,“cognitive ability”, “abilities” combined with the words “Africa”,“African”, and the names and adjectives of all countries in the con-tinent (e.g., “Nigeria” or “Nigerian”).We also located additional papersin the reference lists of the papers that we found. In addition, weidentified in Web of Science all articles (from 1988 to 2006) referringto the various SPM and CPM manuals. This resulted in about 2500papers concerning the SPM/CPM. The titles and authors' names ofall these papers were scanned for relevance. We used only books,papers, or reports that were available through the IBL system in theNetherlands, a system connecting 400 Dutch libraries. Although ourapproach resulted in a large number of studies of the SPM and CPM inAfrica, it is conceivable that we missed other studies.
2.1.3. Exclusion criteriaThe following exclusion criteria were employed in the selection
of studies. First, we excluded samples that are clearly abnormal, suchas a sample of physically handicapped adults (Osuji, 1985). Further-more, the condition of administration of the tests should reasonablyapproximate those stipulated in the test manual. For instance, weexcluded the SPM scores of Zindi's (1994) sample of Zimbabweanschool children, because the SPM was not administered in its entirety(36 of the 60 items were administered), and because it is unclearhow Zindi arrived at his IQ estimate of 70. We also disregardedKlingelhofer's study using a large sample of secondary school studentsfrom Tanzania, because Klingelhofer imposed a time limit on theSPM (a non-standard condition). He did so explicitly to “[preclude]some of the kinds of comparisons that have marked the literature”(Klingelhofer, 1967, p. 206).Whenever tests were administered twice,we used the pretest scores. Although the potential unfamiliarityof some African test-takers with cognitive testing may render theirscores on a retest more valid (Laroche, 1959; Wober, 1969), retesteffects make it difficult to compare the mean results from retests towestern norms that were based on a single test administration. Wedid not assign IQ values to studies in which the SPM or CPM did notmeet basic psychometric standards, as will be discussed in the resultssection. For instance, the test–retest reliability in Wober's sample ofNigerian factory workers was 0.59, i.e., below the 0.80 typically foundwith the SPM (J. C. Raven, Court, & Raven, 1996), and the correlationbetween pretest SPM scores and educational attainment did notdeviate significantly from zero (see also Wober, 1966). Accordingly,we discarded this sample in estimating the average IQ on the Raven'stests.
It is quite likely that African test-takers experience mundaneproblems thatmay lead to an underestimation of their latent cognitiveability, such as the misunderstanding of instructions (Irvine, 1966;Kendall, Verster, & Von Mollendorf, 1988), or suboptimal testingconditions (Sternberg, 2004). For instance, in the Fahrmeier's studywith the CPM in Nigeria, “childrenwere tested on porches, in entrancerooms, or under trees” (Fahrmeier, 1975, p. 282) by untrainedpersonnel. This runs counter to the official guidelines: “The person
to be tested is seated comfortably opposite the psychologist at a tableabout 2 feet wide” (J. C. Raven, 1956, p. 13, italics added). As non-standard test settings may depress performance, we excluded fromour review the studies in which such effects were obvious. However,not all data sources included sufficient information to establishwhether testing conditions were acceptable. We stress, therefore, theimportance of exercising care in interpreting the IQs of Africans,which we provide below.
We only used data sets from sources, which included sufficientdescriptive statistics. We thus excluded a large number of studies inwhich raw means, medians, or percentile scores were absent. Weexcluded CPMdata of age ranges for which no British norms exist. Thiscriterion resulted in the exclusion of several studies in which theCPMwas administered to adolescents and adults (Berlioz, 1955; Berry,1966; Binnie Dawson, 1984; Boissiere, Knight, & Sabot, 1985; Kendall,1976; Sternberg et al., 2001). Lynn (and Vanhanen) andMalloy (2008)assigned average IQs below 70 to these samples (cf. Herrnstein &Murray, 1994). However, there are no (British) CPM norms above theage of 11. Lynn (and Vanhanen) (R. Lynn, personal communication,June 22, 2006) employed a table from the SPM manual (J. C. Ravenet al., 1996)withwhich CPMscores can be converted to SPM scores (cf.Lynn, 1997). These approximate SPM scores can be compared to adultnorms, allowing a rough estimate of IQ. However, thismethoddoes notresult in accurate estimates of IQ, because the CPM is too easy fornormal test-takers above the age of 11. The resulting ceiling effectmakes it difficult to get an above-average SPM norms IQ on the CPM(e.g., for young adults, a score of 34 out of 36 corresponds to an IQ of93). This virtually guarantees an underestimation of IQ with the CPMin samples above the age of 11, particularly in adults. The drawbacks ofthis conversion method are evidenced by the fact that it accords anaverage IQ of 75 to a carefully selected norm sample of 894 normaladults from Italy and San Marino (Measso et al., 1993). Because thisconversion method does not result in reasonable IQ estimates, we didnot consider mean IQs based on CPM scores of adults and adolescents.Appendix B (Section 6.2) provides an overviewof all excluded samples(for which sufficient descriptive statistics were available), togetherwith the reasons for exclusion. Obviously, the use of alternative in-clusion criteria may result in different estimates of the average IQ.Below,we evaluate the effects of our choices to exclude samples on theultimate estimate.
2.1.4. Converting raw scores to IQSPM and CPM raw scores need to be converted to percentile
scores given in British norm tables. These percentile score are thentransformed to standard IQs (M=100 and SD=15). Details of thisconversion method and a discussion of its problems are given inAppendix A (Section 6.1). For the data collected up to 1965 (i.e., themidpoint of various SPM/CPM standardizations), we used older normtables (J. C. Raven, 1956, 1960). For more recent samples (after 1965),we used recent norm tables (J. Raven, 2000; J. C. Raven, Court, & Raven,1990; J. C. Raven et al., 1996). We provide IQ estimates with and with-out a Flynn Effect correction for outdated norms. This correction forthe Flynn Effect is consistent with Lynn (and Vanhanen)'s correction.
2.2. Results
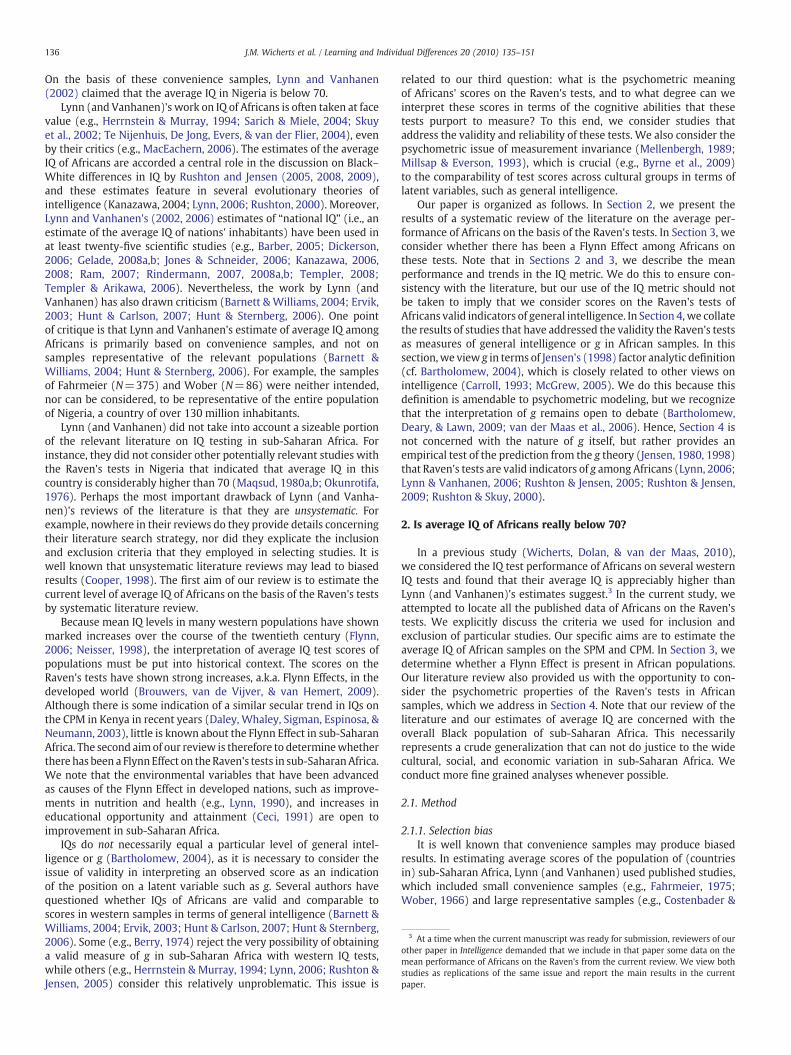
2.2.1. Raven's Standard Progressive MatricesTable 1 gives average SPM scores and corresponding IQs in 40
samples of Africans, totaling 15,408 cases. The table includes thecountry of origin, a short description of the sample, the sample size,the approximate or reported year of testing, the age range or averageage, the percentage of formally schooled (i.e., more than 3 years ofeducation) persons in each sample, the average raw score, our IQestimates, and the IQ estimates provided by Lynn (2006). The aver-age IQ per sample varies between 69 and 97 compared to an aver-age IQ of 100 in Great Britain. Combining these averages results in an
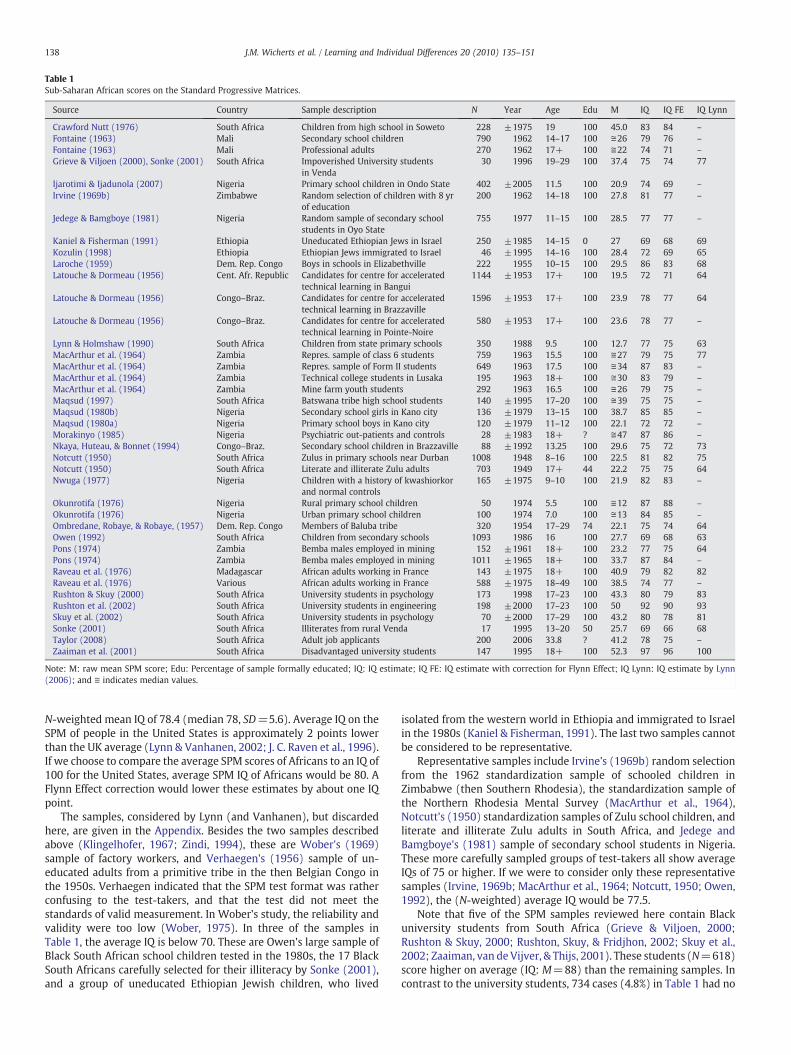
Table 1Sub-Saharan African scores on the Standard Progressive Matrices.
Source Country Sample description N Year Age Edu M IQ IQ FE IQ Lynn
Crawford Nutt (1976) South Africa Children from high school in Soweto 228 ±1975 19 100 45.0 83 84 –
Fontaine (1963) Mali Secondary school children 790 1962 14–17 100 ≅26 79 76 –
Fontaine (1963) Mali Professional adults 270 1962 17+ 100 ≅22 74 71 –
Grieve & Viljoen (2000), Sonke (2001) South Africa Impoverished University studentsin Venda
30 1996 19–29 100 37.4 75 74 77
Ijarotimi & Ijadunola (2007) Nigeria Primary school children in Ondo State 402 ±2005 11.5 100 20.9 74 69 –
Irvine (1969b) Zimbabwe Random selection of children with 8 yrof education
200 1962 14–18 100 27.8 81 77 –
Jedege & Bamgboye (1981) Nigeria Random sample of secondary schoolstudents in Oyo State
755 1977 11–15 100 28.5 77 77 –
Kaniel & Fisherman (1991) Ethiopia Uneducated Ethiopian Jews in Israel 250 ±1985 14–15 0 27 69 68 69Kozulin (1998) Ethiopia Ethiopian Jews immigrated to Israel 46 ±1995 14–16 100 28.4 72 69 65Laroche (1959) Dem. Rep. Congo Boys in schools in Elizabethville 222 1955 10–15 100 29.5 86 83 68Latouche & Dormeau (1956) Cent. Afr. Republic Candidates for centre for accelerated
technical learning in Bangui1144 ±1953 17+ 100 19.5 72 71 64
Latouche & Dormeau (1956) Congo–Braz. Candidates for centre for acceleratedtechnical learning in Brazzaville
1596 ±1953 17+ 100 23.9 78 77 64
Latouche & Dormeau (1956) Congo–Braz. Candidates for centre for acceleratedtechnical learning in Pointe-Noire
580 ±1953 17+ 100 23.6 78 77 –
Lynn & Holmshaw (1990) South Africa Children from state primary schools 350 1988 9.5 100 12.7 77 75 63MacArthur et al. (1964) Zambia Repres. sample of class 6 students 759 1963 15.5 100 ≅27 79 75 77MacArthur et al. (1964) Zambia Repres. sample of Form II students 649 1963 17.5 100 ≅34 87 83 –
MacArthur et al. (1964) Zambia Technical college students in Lusaka 195 1963 18+ 100 ≅30 83 79 –
MacArthur et al. (1964) Zambia Mine farm youth students 292 1963 16.5 100 ≅26 79 75 –
Maqsud (1997) South Africa Batswana tribe high school students 140 ±1995 17–20 100 ≅39 75 75 –
Maqsud (1980b) Nigeria Secondary school girls in Kano city 136 ±1979 13–15 100 38.7 85 85 –
Maqsud (1980a) Nigeria Primary school boys in Kano city 120 ±1979 11–12 100 22.1 72 72 –
Morakinyo (1985) Nigeria Psychiatric out-patients and controls 28 ±1983 18+ ? ≅47 87 86 –
Nkaya, Huteau, & Bonnet (1994) Congo–Braz. Secondary school children in Brazzaville 88 ±1992 13.25 100 29.6 75 72 73Notcutt (1950) South Africa Zulus in primary schools near Durban 1008 1948 8–16 100 22.5 81 82 75Notcutt (1950) South Africa Literate and illiterate Zulu adults 703 1949 17+ 44 22.2 75 75 64Nwuga (1977) Nigeria Children with a history of kwashiorkor
and normal controls165 ±1975 9–10 100 21.9 82 83 –
Okunrotifa (1976) Nigeria Rural primary school children 50 1974 5.5 100 ≅12 87 88 –
Okunrotifa (1976) Nigeria Urban primary school children 100 1974 7.0 100 ≅13 84 85 –
Ombredane, Robaye, & Robaye, (1957) Dem. Rep. Congo Members of Baluba tribe 320 1954 17–29 74 22.1 75 74 64Owen (1992) South Africa Children from secondary schools 1093 1986 16 100 27.7 69 68 63Pons (1974) Zambia Bemba males employed in mining 152 ±1961 18+ 100 23.2 77 75 64Pons (1974) Zambia Bemba males employed in mining 1011 ±1965 18+ 100 33.7 87 84 –
Raveau et al. (1976) Madagascar African adults working in France 143 ±1975 18+ 100 40.9 79 82 82Raveau et al. (1976) Various African adults working in France 588 ±1975 18–49 100 38.5 74 77 –
Rushton & Skuy (2000) South Africa University students in psychology 173 1998 17–23 100 43.3 80 79 83Rushton et al. (2002) South Africa University students in engineering 198 ±2000 17–23 100 50 92 90 93Skuy et al. (2002) South Africa University students in psychology 70 ±2000 17–29 100 43.2 80 78 81Sonke (2001) South Africa Illiterates from rural Venda 17 1995 13–20 50 25.7 69 66 68Taylor (2008) South Africa Adult job applicants 200 2006 33.8 ? 41.2 78 75 –
Zaaiman et al. (2001) South Africa Disadvantaged university students 147 1995 18+ 100 52.3 97 96 100
Note: M: raw mean SPM score; Edu: Percentage of sample formally educated; IQ: IQ estimate; IQ FE: IQ estimate with correction for Flynn Effect; IQ Lynn: IQ estimate by Lynn(2006); and ≅ indicates median values.
138 J.M. Wicherts et al. / Learning and Individual Differences 20 (2010) 135–151
N-weighted mean IQ of 78.4 (median 78, SD=5.6). Average IQ on theSPM of people in the United States is approximately 2 points lowerthan the UK average (Lynn & Vanhanen, 2002; J. C. Raven et al., 1996).If we choose to compare the average SPM scores of Africans to an IQ of100 for the United States, average SPM IQ of Africans would be 80. AFlynn Effect correction would lower these estimates by about one IQpoint.
The samples, considered by Lynn (and Vanhanen), but discardedhere, are given in the Appendix. Besides the two samples describedabove (Klingelhofer, 1967; Zindi, 1994), these are Wober's (1969)sample of factory workers, and Verhaegen's (1956) sample of un-educated adults from a primitive tribe in the then Belgian Congo inthe 1950s. Verhaegen indicated that the SPM test format was ratherconfusing to the test-takers, and that the test did not meet thestandards of valid measurement. In Wober's study, the reliability andvalidity were too low (Wober, 1975). In three of the samples inTable 1, the average IQ is below 70. These are Owen's large sample ofBlack South African school children tested in the 1980s, the 17 BlackSouth Africans carefully selected for their illiteracy by Sonke (2001),and a group of uneducated Ethiopian Jewish children, who lived
isolated from the western world in Ethiopia and immigrated to Israelin the 1980s (Kaniel & Fisherman, 1991). The last two samples cannotbe considered to be representative.
Representative samples include Irvine's (1969b) random selectionfrom the 1962 standardization sample of schooled children inZimbabwe (then Southern Rhodesia), the standardization sample ofthe Northern Rhodesia Mental Survey (MacArthur et al., 1964),Notcutt's (1950) standardization samples of Zulu school children, andliterate and illiterate Zulu adults in South Africa, and Jedege andBamgboye's (1981) sample of secondary school students in Nigeria.These more carefully sampled groups of test-takers all show averageIQs of 75 or higher. If we were to consider only these representativesamples (Irvine, 1969b; MacArthur et al., 1964; Notcutt, 1950; Owen,1992), the (N-weighted) average IQ would be 77.5.
Note that five of the SPM samples reviewed here contain Blackuniversity students from South Africa (Grieve & Viljoen, 2000;Rushton & Skuy, 2000; Rushton, Skuy, & Fridjhon, 2002; Skuy et al.,2002; Zaaiman, van de Vijver, & Thijs, 2001). These students (N=618)score higher on average (IQ: M=88) than the remaining samples. Incontrast to the university students, 734 cases (4.8%) in Table 1 had no

Table 2Sub-Saharan African scores on the coloured Progressive Matrices.
Source Country Sample description N Year Age Edu M IQ IQFE IQ Lynn
Aboud et al. (1991) Ethiopia Children in an orphanage in Jimma 134 ±1989 5–11 100 13.56 72 71 –
Ayalew (2005) Ethiopia Rural children ±108 1994 7–11 ? 14.2 72 70 –
Costenbader & Ngari (2001) Kenya Representative sample of school children 1222 ±1998 6–10 100 15.86 82 79 75Daley et al. (2003) Kenya Children from rural district of Embu 118 1984 7.5 100 12.82 75 75 76Daley et al. (2003) Kenya Children from rural district of Embu 537 1998 7.5 100 17.31 90 87 89Fahrmeier (1975) Nigeria Schooled and unschooled children 334 ±1973 6–11 57 11.42 68/NA 70/NA 69Fontaine (1963) Mali Children in rural and urban primary schools 746 1962 9–11 100 17.40 78 75 –
Heady (2003) Ghana Representative population sample 589 1988 9–11 82 15.80 72 71 62Jinabhai et al. (2004) South Africa Children from 11 rural primary schools
in poor Vulamehlo district806 ±2002 8–10 100 13.9 72 68 67
Kashala et al. (2005) Dem. Rep. Congo Schoolchildren with ADHD and normal controls 183 2003 8.5 100 15 79 74 –
Knoetze et al. (2005) South Africa Xhosa-speaking primary school students inperi-urban Eastern Cape
172 ±2002 7.5–11 100 17.21 77 73 –
Okonji (1974) Nigeria Children in private school in Lagos 73 1972 8–11 100 23.52 94 96 –
Ombredane et al. (1956) Dem. Rep. Congo Children of “very underdeveloped”Asalampasu tribe
151 ±1955 6–11 79 14.50 76 76 –
Tzuriel & Kaufman (1999) Ethiopia Ethiopian Jews immigrated to Israel 29 ±1992 6–7 100 15.60 94 92 –
Veii & Everatt (2005) Namibia Bilingual primary schoolchildren 116 ±2002 7–11 100 15.8 77 74 –
Wolff et al. (1995) Eritrea Orphans and refugee children during war 148 1990 4–7 NA 12.4 87 85 –
Note: Edu: Percentage of sample formally educated; M: raw mean CPM score; IQ: IQ estimate; IQ FE: IQ estimate with correction for Flynn Effect; IQ Lynn: IQ estimate by Lynn(2006); and NA: not applicable.
5 Lynn (2006) states that the 1907 primary school students tested with the CPM inUganda (Heyneman & Jamison, 1980) are 11 years old, but most of these students arearound 13. It is important to note that the score reported in Lynn's source (Heyneman& Jamison, 1980) is based on the correct number out of 33 instead of 36 items(Heyneman, 1975), but Lynn's source does not mention this. The first three items wereused for instruction, so the average score needs to be raised by 3 points (these itemstypically have p-values of 1). If we add three points to the score and employ the CPM
139J.M. Wicherts et al. / Learning and Individual Differences 20 (2010) 135–151
formal schooling (defined as 3 years of education or less). These 734uneducated test-takers had an N-weighted average IQ of approxi-mately 71, which is considerably below the overall average. Note thatthe SPM may lack validity in test-takers without formal schooling(Dague, 1972), but lower scores among non-schooled test-takers mayalso reflect lower ability. One may want to correct for thisunderrepresentation of unschooled persons, as the percentage ofunschooled young people is around 20%4 in sub-Saharan Africa. Arough stratification for educational level can be achieved by adding2900 fictional uneducated cases with an IQ of 71 to the total sample.This lowers the average IQ by one point to 77.2, which is almost equalto the estimate based on only the representative samples.
2.2.2. Coloured Progressive MatricesTable 2 includes the results from the 16 samples in which the CPM
was administered to African children (total N=5466). The averageIQs vary from 68 to 94. The N-weighted average of the twelve samplesequals 78.1, (median 78, SD=6.5). If we exclude Fahrmeier's (1975)study, in which the CPM was administered in a non-standard fashion,we arrive at an average IQ of 78.7 (median 78, SD=6.1). Therefore,the average IQ of children in sub-Saharan Africa on the CPM appearsto be 78 or 79. When compared to an average IQ of 100 for the US, thisIQ among sub-Saharan African children equals 80 or 81. With a FlynnEffect correction of 2 IQ points per decade, these average IQs should belowered by 2.5 points.
Besides the Fahrmeier sample, the samples that scored relativelylowly are the children from poor rural areas tested by Jinabhai et al.(2004), a sample of Ethiopian orphans (Aboud, Samuel, Hadera, &Addus,1991), and the representative sample of Ghanaian children (Glewwe& Jacoby, 1992; Heady, 2003). The low average IQ of the orphans isperhaps due to the harsh circumstances that such children often en-counter (but see Wolff, Tesfai, Egasso, & Aradom, 1995). Moreover,average IQ in rural areas is often lower than it is in urban areas (e.g.,Loehlin, 2000). However, the low average IQ of the representativesample of children in Ghana is unexpected, given that Ghana is rela-tively well-developed (UN Development Programme, 2005). The lowscores may be explained in part by the fact that the tests wereadministered in the children's houses. As the principle investigator putit: “[the test-takers] may have been sitting in a chair or even on theground” while taking the tests (P. Glewwe, personal communication,
4 Based on UNESCO estimates of gross enrollment ratio in primary education overthe period 1970–2003.
January, 17, 2006). This may have lowered the scores. Two recentrepresentative standardization samples in Kenya (Costenbader & Ngari,2001) and South Africa (Knoetze, Bass, & Steele, 2005) show average IQsof around 80.
Of the total of 5318 children of school-age, about 793 children(15%) did not attend school. This is slightly below the averagepopulation estimates of school attendance in current day sub-SaharanAfrica. The number of rural children and urban children in the samplesin Table 2 appears to roughly reflect the population distribution insub-Saharan Africa. Finally, of the 16 samples considered, we considerfour to be representative for a given population. Although definitivestatements require completely stratified random population samples,the data in Table 2 provide a reasonable estimate of average IQ ofAfrican children on the CPM.
Because of a lack of sound UK norms for these groups, we did notconsider several adult and adolescent samples that were administeredthe CPM. These samples were considered by Lynn (and Vanhanen)whoaccorded lowmean IQs to these samples. It is certainly the case that theadult samples studied by Berry (1966) and others (Berlioz, 1955; BinnieDawson, 1984; Kendall, 1976) showed low CPM averages as comparedto western samples (Measso et al., 1993). In two studies with the CPM(Berry, 1966; Binnie Dawson, 1984), the authors deliberately sampledadultswith very little knowledge of western culture. The representativesamples of wage laborers from Nairobi and Dar es Salaam (Boissiereet al., 1985) scored roughly equal to a sample of adults from Italy andSanMarino aged40–59 (Measso et al., 1993),whichdoes not lendmuchcredibility to the lowestimate of theirmean IQbyLynn(andVanhanen).Even if we had included these adult and adolescent samples, average IQbased on the CPM scores in sub-Saharan Africa would not change verymuch. The reason is that most of these low scoring samples are small,whereas the carefully selected large sample (N=1907) of adolescentsin Uganda (Heyneman & Jamison, 1980) showed an average scoreequivalent to an average IQ above 79.5
to SPM conversion (J. C. Raven et al., 1996), we can compare scores to the SPM normtable for the correct age range. This results in a rough estimate of an average IQ of 79.Due to the ceiling effect discussed earlier, this figure is likely to be too low.
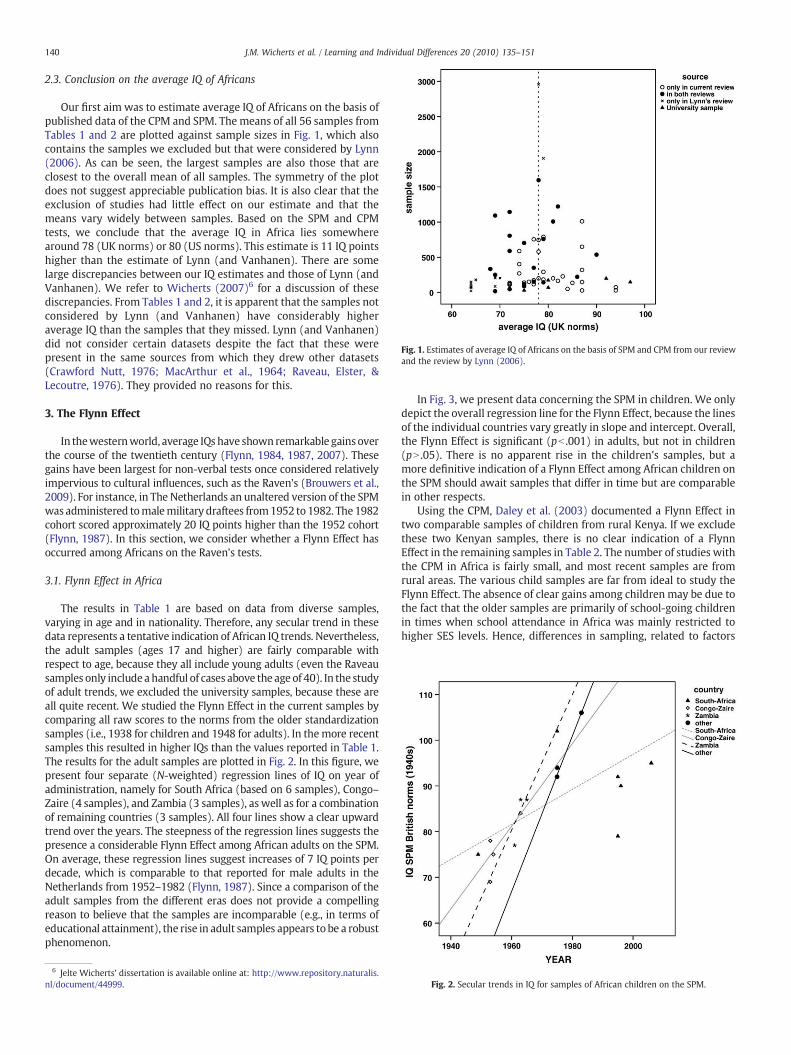
Fig. 1. Estimates of average IQ of Africans on the basis of SPM and CPM from our reviewand the review by Lynn (2006).
140 J.M. Wicherts et al. / Learning and Individual Differences 20 (2010) 135–151
2.3. Conclusion on the average IQ of Africans
Our first aim was to estimate average IQ of Africans on the basis ofpublished data of the CPM and SPM. The means of all 56 samples fromTables 1 and 2 are plotted against sample sizes in Fig. 1, which alsocontains the samples we excluded but that were considered by Lynn(2006). As can be seen, the largest samples are also those that areclosest to the overall mean of all samples. The symmetry of the plotdoes not suggest appreciable publication bias. It is also clear that theexclusion of studies had little effect on our estimate and that themeans vary widely between samples. Based on the SPM and CPMtests, we conclude that the average IQ in Africa lies somewherearound 78 (UK norms) or 80 (US norms). This estimate is 11 IQ pointshigher than the estimate of Lynn (and Vanhanen). There are somelarge discrepancies between our IQ estimates and those of Lynn (andVanhanen). We refer to Wicherts (2007)6 for a discussion of thesediscrepancies. From Tables 1 and 2, it is apparent that the samples notconsidered by Lynn (and Vanhanen) have considerably higheraverage IQ than the samples that they missed. Lynn (and Vanhanen)did not consider certain datasets despite the fact that these werepresent in the same sources from which they drew other datasets(Crawford Nutt, 1976; MacArthur et al., 1964; Raveau, Elster, &Lecoutre, 1976). They provided no reasons for this.
3. The Flynn Effect
In thewesternworld, average IQs have shownremarkable gainsoverthe course of the twentieth century (Flynn, 1984, 1987, 2007). Thesegains have been largest for non-verbal tests once considered relativelyimpervious to cultural influences, such as the Raven's (Brouwers et al.,2009). For instance, in The Netherlands an unaltered version of the SPMwas administered tomalemilitary draftees from1952 to1982. The1982cohort scored approximately 20 IQ points higher than the 1952 cohort(Flynn, 1987). In this section, we consider whether a Flynn Effect hasoccurred among Africans on the Raven's tests.
3.1. Flynn Effect in Africa
The results in Table 1 are based on data from diverse samples,varying in age and in nationality. Therefore, any secular trend in thesedata represents a tentative indication of African IQ trends. Nevertheless,the adult samples (ages 17 and higher) are fairly comparable withrespect to age, because they all include young adults (even the Raveausamples only includeahandful of cases above the age of 40). In the studyof adult trends, we excluded the university samples, because these areall quite recent. We studied the Flynn Effect in the current samples bycomparing all raw scores to the norms from the older standardizationsamples (i.e., 1938 for children and 1948 for adults). In themore recentsamples this resulted in higher IQs than the values reported in Table 1.The results for the adult samples are plotted in Fig. 2. In this figure, wepresent four separate (N-weighted) regression lines of IQ on year ofadministration, namely for South Africa (based on 6 samples), Congo–Zaire (4 samples), and Zambia (3 samples), as well as for a combinationof remaining countries (3 samples). All four lines show a clear upwardtrend over the years. The steepness of the regression lines suggests thepresence a considerable Flynn Effect among African adults on the SPM.On average, these regression lines suggest increases of 7 IQ points perdecade, which is comparable to that reported for male adults in theNetherlands from 1952–1982 (Flynn, 1987). Since a comparison of theadult samples from the different eras does not provide a compellingreason to believe that the samples are incomparable (e.g., in terms ofeducational attainment), the rise in adult samples appears to be a robustphenomenon.
6 Jelte Wicherts' dissertation is available online at: http://www.repository.naturalis.nl/document/44999.
In Fig. 3, we present data concerning the SPM in children. We onlydepict the overall regression line for the Flynn Effect, because the linesof the individual countries vary greatly in slope and intercept. Overall,the Flynn Effect is significant (pb .001) in adults, but not in children(pN .05). There is no apparent rise in the children's samples, but amore definitive indication of a Flynn Effect among African children onthe SPM should await samples that differ in time but are comparablein other respects.
Using the CPM, Daley et al. (2003) documented a Flynn Effect intwo comparable samples of children from rural Kenya. If we excludethese two Kenyan samples, there is no clear indication of a FlynnEffect in the remaining samples in Table 2. The number of studies withthe CPM in Africa is fairly small, and most recent samples are fromrural areas. The various child samples are far from ideal to study theFlynn Effect. The absence of clear gains among children may be due tothe fact that the older samples are primarily of school-going childrenin times when school attendance in Africa was mainly restricted tohigher SES levels. Hence, differences in sampling, related to factors
Fig. 2. Secular trends in IQ for samples of African children on the SPM.
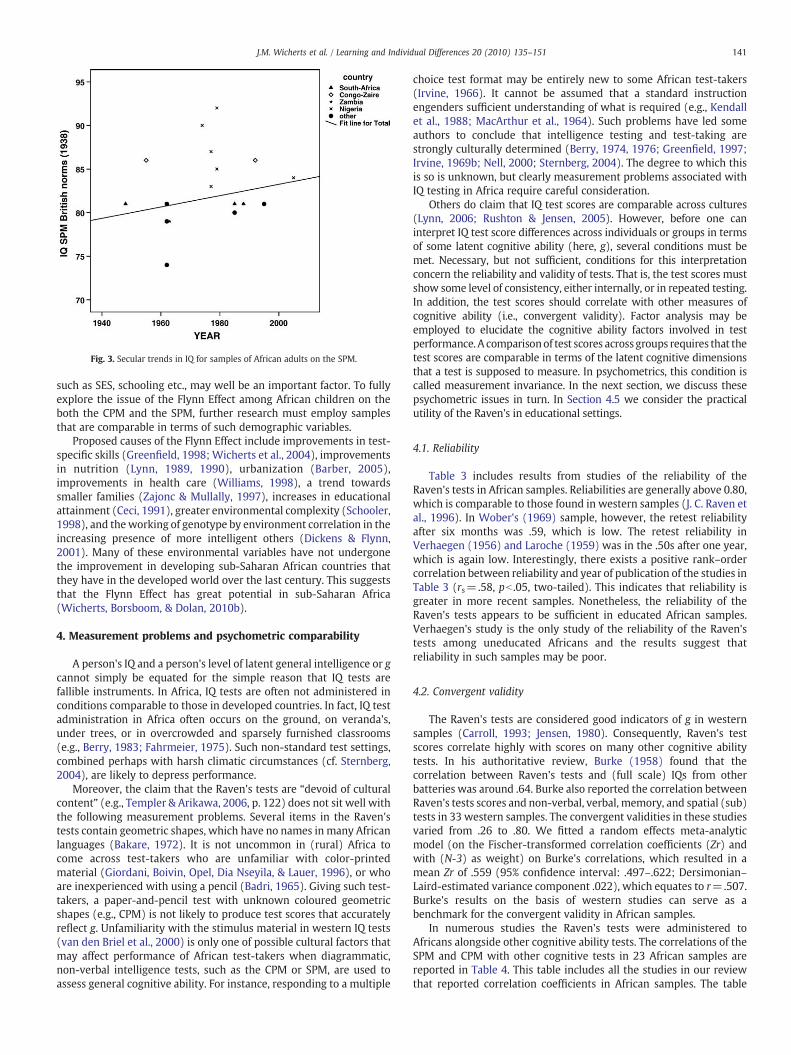
Fig. 3. Secular trends in IQ for samples of African adults on the SPM.
141J.M. Wicherts et al. / Learning and Individual Differences 20 (2010) 135–151
such as SES, schooling etc., may well be an important factor. To fullyexplore the issue of the Flynn Effect among African children on theboth the CPM and the SPM, further research must employ samplesthat are comparable in terms of such demographic variables.
Proposed causes of the Flynn Effect include improvements in test-specific skills (Greenfield, 1998; Wicherts et al., 2004), improvementsin nutrition (Lynn, 1989, 1990), urbanization (Barber, 2005),improvements in health care (Williams, 1998), a trend towardssmaller families (Zajonc & Mullally, 1997), increases in educationalattainment (Ceci, 1991), greater environmental complexity (Schooler,1998), and theworking of genotype by environment correlation in theincreasing presence of more intelligent others (Dickens & Flynn,2001). Many of these environmental variables have not undergonethe improvement in developing sub-Saharan African countries thatthey have in the developed world over the last century. This suggeststhat the Flynn Effect has great potential in sub-Saharan Africa(Wicherts, Borsboom, & Dolan, 2010b).
4. Measurement problems and psychometric comparability
A person's IQ and a person's level of latent general intelligence or gcannot simply be equated for the simple reason that IQ tests arefallible instruments. In Africa, IQ tests are often not administered inconditions comparable to those in developed countries. In fact, IQ testadministration in Africa often occurs on the ground, on veranda's,under trees, or in overcrowded and sparsely furnished classrooms(e.g., Berry, 1983; Fahrmeier, 1975). Such non-standard test settings,combined perhaps with harsh climatic circumstances (cf. Sternberg,2004), are likely to depress performance.
Moreover, the claim that the Raven's tests are “devoid of culturalcontent” (e.g., Templer & Arikawa, 2006, p. 122) does not sit well withthe following measurement problems. Several items in the Raven'stests contain geometric shapes, which have no names in many Africanlanguages (Bakare, 1972). It is not uncommon in (rural) Africa tocome across test-takers who are unfamiliar with color-printedmaterial (Giordani, Boivin, Opel, Dia Nseyila, & Lauer, 1996), or whoare inexperienced with using a pencil (Badri, 1965). Giving such test-takers, a paper-and-pencil test with unknown coloured geometricshapes (e.g., CPM) is not likely to produce test scores that accuratelyreflect g. Unfamiliarity with the stimulus material in western IQ tests(van den Briel et al., 2000) is only one of possible cultural factors thatmay affect performance of African test-takers when diagrammatic,non-verbal intelligence tests, such as the CPM or SPM, are used toassess general cognitive ability. For instance, responding to a multiple
choice test format may be entirely new to some African test-takers(Irvine, 1966). It cannot be assumed that a standard instructionengenders sufficient understanding of what is required (e.g., Kendallet al., 1988; MacArthur et al., 1964). Such problems have led someauthors to conclude that intelligence testing and test-taking arestrongly culturally determined (Berry, 1974, 1976; Greenfield, 1997;Irvine, 1969b; Nell, 2000; Sternberg, 2004). The degree to which thisis so is unknown, but clearly measurement problems associated withIQ testing in Africa require careful consideration.
Others do claim that IQ test scores are comparable across cultures(Lynn, 2006; Rushton & Jensen, 2005). However, before one caninterpret IQ test score differences across individuals or groups in termsof some latent cognitive ability (here, g), several conditions must bemet. Necessary, but not sufficient, conditions for this interpretationconcern the reliability and validity of tests. That is, the test scores mustshow some level of consistency, either internally, or in repeated testing.In addition, the test scores should correlate with other measures ofcognitive ability (i.e., convergent validity). Factor analysis may beemployed to elucidate the cognitive ability factors involved in testperformance. A comparisonof test scores across groups requires that thetest scores are comparable in terms of the latent cognitive dimensionsthat a test is supposed to measure. In psychometrics, this condition iscalled measurement invariance. In the next section, we discuss thesepsychometric issues in turn. In Section 4.5 we consider the practicalutility of the Raven's in educational settings.
4.1. Reliability
Table 3 includes results from studies of the reliability of theRaven's tests in African samples. Reliabilities are generally above 0.80,which is comparable to those found in western samples (J. C. Raven etal., 1996). In Wober's (1969) sample, however, the retest reliabilityafter six months was .59, which is low. The retest reliability inVerhaegen (1956) and Laroche (1959) was in the .50s after one year,which is again low. Interestingly, there exists a positive rank–ordercorrelation between reliability and year of publication of the studies inTable 3 (rs=.58, pb .05, two-tailed). This indicates that reliability isgreater in more recent samples. Nonetheless, the reliability of theRaven's tests appears to be sufficient in educated African samples.Verhaegen's study is the only study of the reliability of the Raven'stests among uneducated Africans and the results suggest thatreliability in such samples may be poor.
4.2. Convergent validity
The Raven's tests are considered good indicators of g in westernsamples (Carroll, 1993; Jensen, 1980). Consequently, Raven's testscores correlate highly with scores on many other cognitive abilitytests. In his authoritative review, Burke (1958) found that thecorrelation between Raven's tests and (full scale) IQs from otherbatteries was around .64. Burke also reported the correlation betweenRaven's tests scores and non-verbal, verbal, memory, and spatial (sub)tests in 33 western samples. The convergent validities in these studiesvaried from .26 to .80. We fitted a random effects meta-analyticmodel (on the Fischer-transformed correlation coefficients (Zr) andwith (N-3) as weight) on Burke's correlations, which resulted in amean Zr of .559 (95% confidence interval: .497–.622; Dersimonian–Laird-estimated variance component .022), which equates to r=.507.Burke's results on the basis of western studies can serve as abenchmark for the convergent validity in African samples.
In numerous studies the Raven's tests were administered toAfricans alongside other cognitive ability tests. The correlations of theSPM and CPM with other cognitive tests in 23 African samples arereported in Table 4. This table includes all the studies in our reviewthat reported correlation coefficients in African samples. The table
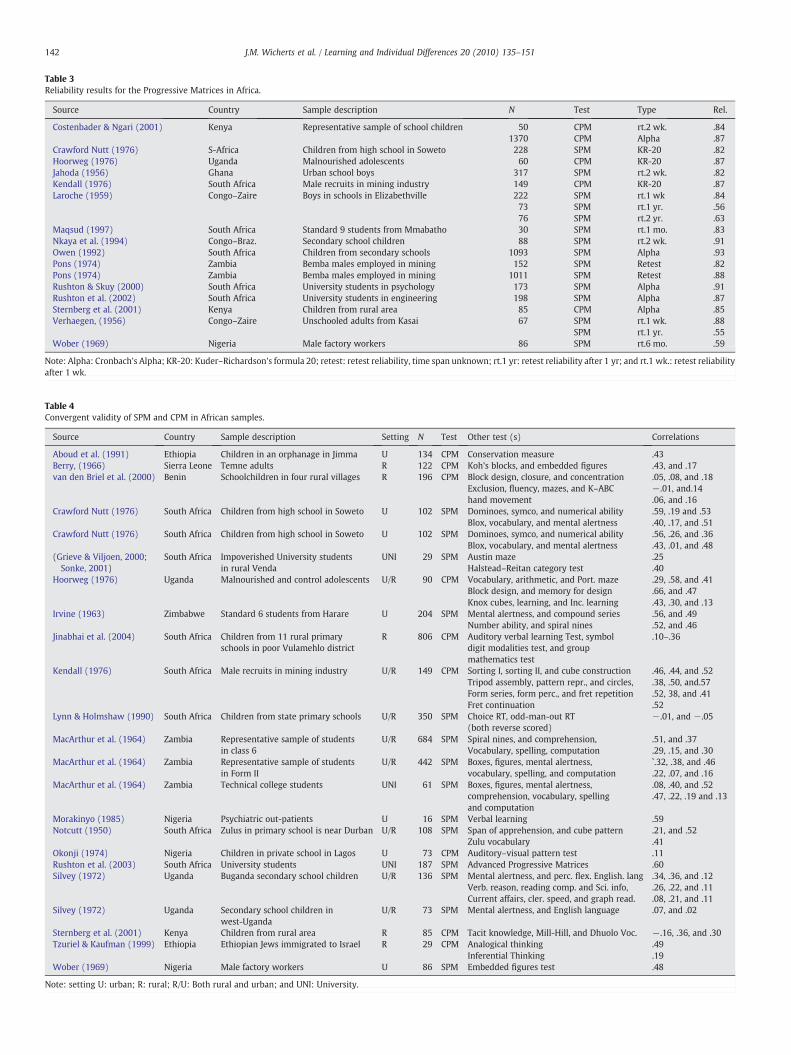
Table 3Reliability results for the Progressive Matrices in Africa.
Source Country Sample description N Test Type Rel.
Costenbader & Ngari (2001) Kenya Representative sample of school children 50 CPM rt.2 wk. .841370 CPM Alpha .87
Crawford Nutt (1976) S-Africa Children from high school in Soweto 228 SPM KR-20 .82Hoorweg (1976) Uganda Malnourished adolescents 60 CPM KR-20 .87Jahoda (1956) Ghana Urban school boys 317 SPM rt.2 wk. .82Kendall (1976) South Africa Male recruits in mining industry 149 CPM KR-20 .87Laroche (1959) Congo–Zaire Boys in schools in Elizabethville 222 SPM rt.1 wk .84
73 SPM rt.1 yr. .5676 SPM rt.2 yr. .63
Maqsud (1997) South Africa Standard 9 students from Mmabatho 30 SPM rt.1 mo. .83Nkaya et al. (1994) Congo–Braz. Secondary school children 88 SPM rt.2 wk. .91Owen (1992) South Africa Children from secondary schools 1093 SPM Alpha .93Pons (1974) Zambia Bemba males employed in mining 152 SPM Retest .82Pons (1974) Zambia Bemba males employed in mining 1011 SPM Retest .88Rushton & Skuy (2000) South Africa University students in psychology 173 SPM Alpha .91Rushton et al. (2002) South Africa University students in engineering 198 SPM Alpha .87Sternberg et al. (2001) Kenya Children from rural area 85 CPM Alpha .85Verhaegen, (1956) Congo–Zaire Unschooled adults from Kasai 67 SPM rt.1 wk. .88
SPM rt.1 yr. .55Wober (1969) Nigeria Male factory workers 86 SPM rt.6 mo. .59
Note: Alpha: Cronbach's Alpha; KR-20: Kuder–Richardson's formula 20; retest: retest reliability, time span unknown; rt.1 yr: retest reliability after 1 yr; and rt.1 wk.: retest reliabilityafter 1 wk.
Table 4Convergent validity of SPM and CPM in African samples.
Source Country Sample description Setting N Test Other test (s) Correlations
Aboud et al. (1991) Ethiopia Children in an orphanage in Jimma U 134 CPM Conservation measure .43Berry, (1966) Sierra Leone Temne adults R 122 CPM Koh's blocks, and embedded figures .43, and .17van den Briel et al. (2000) Benin Schoolchildren in four rural villages R 196 CPM Block design, closure, and concentration .05, .08, and .18
Exclusion, fluency, mazes, and K–ABChand movement
−.01, and.14.06, and .16
Crawford Nutt (1976) South Africa Children from high school in Soweto U 102 SPM Dominoes, symco, and numerical ability .59, .19 and .53Blox, vocabulary, and mental alertness .40, .17, and .51
Crawford Nutt (1976) South Africa Children from high school in Soweto U 102 SPM Dominoes, symco, and numerical ability .56, .26, and .36Blox, vocabulary, and mental alertness .43, .01, and .48
(Grieve & Viljoen, 2000;Sonke, 2001)
South Africa Impoverished University studentsin rural Venda
UNI 29 SPM Austin maze .25Halstead–Reitan category test .40
Hoorweg (1976) Uganda Malnourished and control adolescents U/R 90 CPM Vocabulary, arithmetic, and Port. maze .29, .58, and .41Block design, and memory for design .66, and .47Knox cubes, learning, and Inc. learning .43, .30, and .13
Irvine (1963) Zimbabwe Standard 6 students from Harare U 204 SPM Mental alertness, and compound series .56, and .49Number ability, and spiral nines .52, and .46
Jinabhai et al. (2004) South Africa Children from 11 rural primaryschools in poor Vulamehlo district
R 806 CPM Auditory verbal learning Test, symboldigit modalities test, and groupmathematics test
.10–.36
Kendall (1976) South Africa Male recruits in mining industry U/R 149 CPM Sorting I, sorting II, and cube construction .46, .44, and .52Tripod assembly, pattern repr., and circles, .38, .50, and.57Form series, form perc., and fret repetition .52, 38, and .41Fret continuation .52
Lynn & Holmshaw (1990) South Africa Children from state primary schools U/R 350 SPM Choice RT, odd-man-out RT(both reverse scored)
−.01, and −.05
MacArthur et al. (1964) Zambia Representative sample of studentsin class 6
U/R 684 SPM Spiral nines, and comprehension, .51, and .37Vocabulary, spelling, computation .29, .15, and .30
MacArthur et al. (1964) Zambia Representative sample of studentsin Form II
U/R 442 SPM Boxes, figures, mental alertness, `.32, .38, and .46vocabulary, spelling, and computation .22, .07, and .16
MacArthur et al. (1964) Zambia Technical college students UNI 61 SPM Boxes, figures, mental alertness,comprehension, vocabulary, spellingand computation
.08, .40, and .52
.47, .22, .19 and .13
Morakinyo (1985) Nigeria Psychiatric out-patients U 16 SPM Verbal learning .59Notcutt (1950) South Africa Zulus in primary school is near Durban U/R 108 SPM Span of apprehension, and cube pattern .21, and .52
Zulu vocabulary .41Okonji (1974) Nigeria Children in private school in Lagos U 73 CPM Auditory–visual pattern test .11Rushton et al. (2003) South Africa University students UNI 187 SPM Advanced Progressive Matrices .60Silvey (1972) Uganda Buganda secondary school children U/R 136 SPM Mental alertness, and perc. flex. English. lang .34, .36, and .12
Verb. reason, reading comp. and Sci. info, .26, .22, and .11Current affairs, cler. speed, and graph read. .08, .21, and .11
Silvey (1972) Uganda Secondary school children inwest-Uganda
U/R 73 SPM Mental alertness, and English language .07, and .02
Sternberg et al. (2001) Kenya Children from rural area R 85 CPM Tacit knowledge, Mill-Hill, and Dhuolo Voc. −.16, .36, and .30Tzuriel & Kaufman (1999) Ethiopia Ethiopian Jews immigrated to Israel R 29 CPM Analogical thinking .49
Inferential Thinking .19Wober (1969) Nigeria Male factory workers U 86 SPM Embedded figures test .48
Note: setting U: urban; R: rural; R/U: Both rural and urban; and UNI: University.
142 J.M. Wicherts et al. / Learning and Individual Differences 20 (2010) 135–151

143J.M. Wicherts et al. / Learning and Individual Differences 20 (2010) 135–151
includes the type of test used and an indicator of the setting of thestudy, i.e., Urban, Rural, or mixed Urban/Rural.
Some studies support the convergent validity of the SPM and CPMamong Africans. The highest correlation was found in a study at theUniversity of Witwatersrand in South Africa, where the SPM scorescorrelated .60 with the scores on SPM's more difficult counterpart, theAdvanced Progressive Matrices (APM). In a study among 85 adoles-cents in Kenya, CPM correlated reasonably well with two vocabularytests, but non-significantly with a test of practical intelligence(Sternberg et al., 2001). Moreover, SPM scores correlated considerablywith a verbal learning task among healthy and unhealthy adults inNigeria (Morakinyo, 1985), and with a perceptual learning potentialtest administered to 43 South African university students (Skuy et al.,2002). The latter data are not included in Table 4, because the precisecorrelation was not given. For this same reason, several additionalstudies were not included (Glewwe & Jacoby, 1992; Heyneman &Jamison, 1980; Kashala, Elgen, Sommerfeldt, Tylleskar, & Lundervold,2005; Munroe, Munroe, & Brasher, 1985; Veii & Everatt, 2005).
The results of several studies raise serious questions about theconvergent validity of the Raven's tests among Africans. In contrast toresults in Britain, Japan, and Hong Kong (cf. Lynn, 1991), Lynn andHolmshaw (1990) did not find the SPM scores in their sample of BlackSouth African children (N=350) to correlate significantly with thecognitive components of reaction time tasks. Similarly, correlations ofthe CPMwith other cognitive ability tests were generally below .40 intwo other studies (Jinabhai et al., 2004; Okonji, 1974). In a study of196 children in rural Benin, the CPM correlated quite lowly with sevenother cognitive tests (van den Briel et al., 2000).
Wefitteda randomeffectsmeta-analyticmodel to the correlations inTable 4, with (N-3) as weight. In studies that included more than onecorrelation, we used the mean correlation. The mean meta-analyticcorrelation was Zr=.328 (95% confidence interval: .250–.406), whichequates to r=.317. There was a clear indication of heterogeneity ofcorrelations: Q=123, DF=22, pb .001. Dersimonian–Laird estimate ofvariance was equal to .027. We found that the convergent validity inAfrican samples was significantly lower than the validity results in the33 western samples from Burke's (1958) literature review: Z=4.60,pb .001. As is the case with Burke's results, the results in Table 4 arebased on a mixture of homogeneous and heterogeneous samples ofschool children, university students, and adults. Hence, there is noreason to expect that restriction of range differs greatly between thewestern and the African studies. Fig. 4 depicts the transformed corre-
Fig. 4. Funnel plot of convergent validities in western and African samples.
lations against the inverse of the standard error for both the Africansamples and the western samples in Burke's study. The difference inconvergent validity of the SPM/CPM between African and westernsamples is quite large. The symmetry of both funnel plots does notsuggest any publication bias, nor does a formal test of publication bias(Sterne & Egger, 2005).
In a mixed model meta-regression of the statistics in Table 4, wefound that the Urban/Rural variable significantly predicted thevalidity coefficients (Z=2.69, pb .01). The average predicted Zr was.189 (r=.187) in the rural samples and .443 (r=.416) in urbansamples, with the coefficient in the mixed Rural/Urban samples inbetween (predicted Zr=.316, r=.306). Accordingly, we concludethat the convergent validity of the Raven's tests markedly lower inrural andmixed rural/urban African samples than in western samples.It is noteworthy that none of the studies in Table 4 involveduneducated test-takers. The validity of the Raven's tests amonguneducated test-takers remains to be studied, but is likely to be poor(Dague, 1972), particularly in light of the poor retest reliability foundby Verhaegen (1956).
4.3. Factor analytical results
In factor analyses with other cognitive ability tests, the Raven'stests usually have large g loadings (i.e., correlation with g; Carroll,1993). Jensen (1980, 1998) noted that the g loadings of Raven's testsare normally around .80, and that these tests measure g and little else.This means that the SPM and CPM usually do not load appreciably onfactors besides g. We now consider the factor analytic data that bearon the g loading and factorial purity of the SPM and CPM in Africa.
MacArthur (1973) factor analyzed data from two samples ofZambian teenagers who completed a large number of other cognitiveability tests including the SPM. His results showed that the five itemsets of the SPM loaded on two different factors in one sample (N=65)and on three different factors in another sample (N=65). Thissuggests that the SPM is neither unidimensional nor factorially pure inthese samples. Vernon (1950) reported on a factor analysis of scoreson 13 tests observed in a large number of African recruits. He foundthat the scores on a revised version of the SPM showed an unrotatedloading of .57 on the first factor, as well as a sizeable cross-loading of.34 on a second factor he interpreted in terms of physical factors andmanual dexterity. Claeys (1972) factor analyzed data from 101 first-grade teachers from Kinshasa, who completed a battery of 24 testsincluding the SPM, and found that the commonality of the SPM wasrather low (i.e., .38).
In order to study the g loading of the SPM and CPM in Africansamples, we ran exploratory factor analyses on the correlationmatrices in the ten African samples in which the CPM or SPM wasadministered with at least four other cognitive ability tests (cf.Table 4). Our choice of the number of factors (which varied from 2 to3) was based on the most parsimonious model that passed the exactfit test (pN .05). We used VARIMAX rotation. Table 5 includes thesummary results (detailed results are available on request). The CPMshowed a clear cross-loading in Hoorweg's data of Ugandan teenagers,which is consistent with Hoorweg's (1976) own analyses. InMacArthur's sample of technical college students, the g loading ofthe SPMwas .53, but the SPM also showed a sizeable loading of .35 ona spatial factor. This is in line with Irvine's (1969a) factor analyticstudy of these data. Likewise, in Kendall's sample the SPM loaded onthree factors, and in one of the two samples reported by CrawfordNutt, SPM again showed a cross-loading on a factor other than g.
The only two African samples in which the SPM lived up toexpectations were MacArthur's sample of Form II students and one ofthe two secondary school samples from Crawford Nutt's study. Inthese samples, the SPM did not show a cross-loading (cf. Irvine,1969a). In five of the ten samples, the SPM and CPM showed crossloadings on non-g factors, and in the sample of children from rural

Table 5Factor analysis results of SPM and CPM in African samples.
Source Country Sample description N Test h2 No of tests g Loading Loading 2nd fac. Loading 3rd fac.
van den Briel et al. (2000) Benin Schoolchildren in four rural villages 196 CPM .04 8 .11 .16 –
Crawford Nutt (1976) South Africa Children from high school in Soweto 102 SPM .50 5 .59 .38 –
Crawford Nutt (1976) South Africa Children from high school in Soweto 102 SPM .56 5 .74 .10 –
Hoorweg (1976) Uganda Malnourished and control adolescents 90 CPM .62 9 .70 .36 –
Irvine (1963) Zimbabwe Standard 6 students from Harare 204 SPM .49 5 .61 .35 –
Kendall (1976) South Africa Male recruits in mining industry 149 CPM .43 11 .43 .27 .42MacArthur et al. (1964) Zambia Representative sample of students in class 6 684 SPM .39 6 .62 .02 –
MacArthur et al. (1964) Zambia Representative sample of students in Form II 442 SPM .46 8 .65 .03 .18MacArthur et al. (1964) Zambia Technical college students 61 SPM .41 8 .53 .35 –
Silvey (1972) Uganda Buganda secondary school children 136 SPM .34 9 .56 .14 .09
Note: based on ML-exploratory factor analysis and varimax rotation; h2: communality; loadings larger than .25 in bold.
144 J.M. Wicherts et al. / Learning and Individual Differences 20 (2010) 135–151
Benin, the CPM completely failed to load on the dominant factor. Theaverage g loading in the nine samples was .55, which is considerablysmaller than the g loading of the Raven's in western samples (Jensen,1998). Combined, the results of these factor analyses do not supportthe assertion that the CPM and SPM are highly g-loaded tests amongAfrican test-takers. Moreover, it appears that in many Africansamples, the Raven's tests reflect other factors, in addition to g.
4.4. Measurement invariance
Good validity and reliability within cultural groups are necessary,but not sufficient, requirements for understanding group differencesin test performance. An additional necessary requirement is measure-ment invariance. Measurement invariance across groups implies thatthe relation between test scores and latent traits, which are supposedto underlie those scores, is identical across groups.7 Measurementinvariance is a starting point to understand the nature of group dif-ferences in test scores, so it is central to the question of the meaningof IQ of Africans. Measurement invariance can be tested by employinga measurement model in which this relation is explicitly modeled(Holland & Wainer, 1993; Meredith, 1993; Millsap & Everson, 1993).The relation between test scores and latent traits is central to thequestion of cross-cultural comparability of IQ test scores (e.g., Little,1997; Poortinga & van de Vijver, 1988). The lack of measurementinvariance suggests measurement bias, or, Differential Item Function-ing (DIF), as it is called in Item Response Theory (IRT) modeling. DIF issaid to be absent if, in a sufficiently restrictive measurement model(e.g., an unidimensional item response model), measurement para-meters linking ability to tests scores are equal across groups.
We came across one recent study that tested for DIF of the SPM inan African sample (Taylor, 2008). In this study, the SPM item scoresfrom200 Black South African job applicantswere tested for DIF againsta sample of 178 White South African job applicants. In total 4 of the60 items evidenced DIF, which the author deemed a small enoughnumber to accept measurement invariance. To our knowledge, this isthe only study that has used themethods of contemporary IRT to studyDIF of the Raven's in Africa. Other studies used older methods.
Ombredane et al., in a study of the item characteristics in theirsamples (Ombredane, 1957; Ombredane, Robaye, & Plumail, 1956),found that the CPM showed a relatively large number of Guttman errors(e.g., Meijer & Sijtsma, 2001), which means that responses to relativelyeasy items includedmoreerrors that those tomore difficult items. Irvine
7 Mellenbergh (1989) provided a general definition of measurement invariance thatis expressed in terms of the conditional distribution of manifest test scores Y, denotedby f(Y|.). According to this definition, measurement invariance with respect to v holdsif: f(Y|N, v)=f(Y|N), where N denotes the scores on the latent variable (i.e., latentability) underlying the manifest random variable Y (i.e., the measured variable), and vis a grouping variable, which defines the nature of groups (e.g., nationality). Oneimportant implication of this definition is that if measurement invariance holds, theexpected test score of a person with a certain latent ability (i.e., N) is independent ofgroup membership.
(1969b) conducted a factor analysis of SPM items, and concluded that,unlike in the western samples he studied, the SPM was notunidimensional in African samples. Combined with the factor analyticresults at the scale level, it is therefore quite likely that the Raven's testsmeasure other factors, in addition to g, in African samples.
In a series of studies, Rushton et al. (Rushton, 2002; Rushton &Skuy, 2000; Rushton, Skuy, & Bons, 2004; Rushton et al., 2002;Rushton, Skuy, & Fridjhon, 2003) studied whether the SPM and theAPM have similar item characteristics for Whites and Blacks in SouthAfrica (cf. Owen, 1992). Rushton et al. (2004) claim that these studiesestablish the construct validity for IQ tests among Africans. However,all but one study (Owen, 1992) involved university students, and aperusal of Tables 3, 4, and 5 indicates that the reliability andconvergent validity are relatively good among university samples. Itis unclear whether the results from university samples generalize tolower-scoring samples. More importantly, in none of the studies byOwen and Rushton et al. was DIF studied across groups. Instead, twosimple methods were employed to study bias of Raven's items. Thefirst method is based on the rank–order correlation between item p-values across groups. Rushton et al. and Owen reported correlations inthe .90s between item p-values betweenwestern and African samples.Earlier, Irvine (1966) had reported a correlation of only .695 betweenthe item p-values in British school children and p-values in a rep-resentative sample of 1600 pupils from then Rhodesia. However, it isimportant to note that this method (Thurstone, 1925), and variousrefinements (e.g., the Delta-Plot method; Angoff & Ford, 1972) havebeen criticized extensively in the psychometric literature for not beingsensitive to DIF (Lord, 1980; Shepard, Camilli, & Williams, 1985).
Rushton and colleagues used a second method in studying thecomparability of Raven's scores between African and western samples(Rushton, 2002; Rushton, Bons, Vernon, & Cvorovic, 2007; Rushton &Skuy, 2000; Rushton et al., 2004; Rushton et al., 2002, 2003). Thismethod involves correlating the vector of group differences in item's p-values with the vector of item–total correlations (i.e., point-biserial orbiserial item–total correlations). Wicherts and Johnson (2009) haveshown that this method does not address the issue of measurementinvariance. Finally, we were unable to find any studies of measurementinvariance of cognitive test batteries that included the Raven's tests.
In sum, although one study supported measurement invariance(Taylor, 2008), other studies paint a different picture (Irvine, 1966,1969a; Ombredane, 1957; Ombredane et al., 1956). Hence, there islittle empirical support for measurement invariance of the Raven'stests between African and western samples.
4.5. Criterion validity in educational settings
A lack of measurement invariance renders cross-cultural compar-isons of Raven's test scores problematic, but does not necessary meanthat the these tests have no practical utility in professional andeducational settings within African countries. In western samples,scores on the SPM and CPM predict test-takers' performance in school
145J.M. Wicherts et al. / Learning and Individual Differences 20 (2010) 135–151
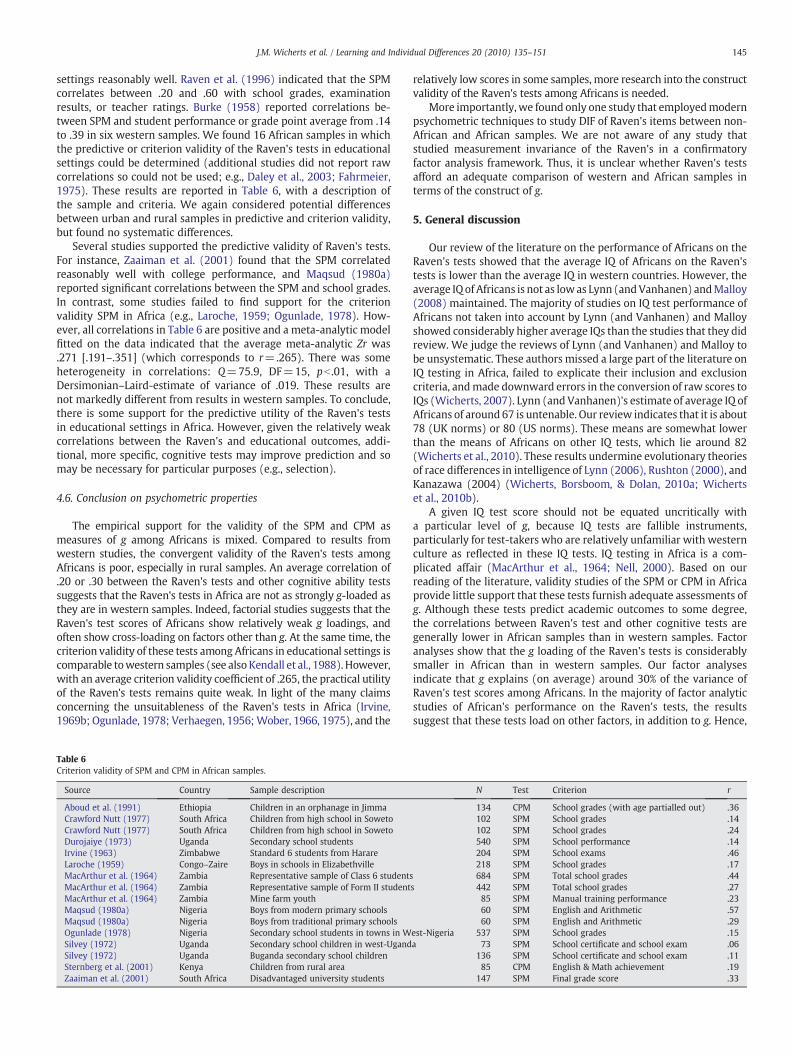
settings reasonably well. Raven et al. (1996) indicated that the SPMcorrelates between .20 and .60 with school grades, examinationresults, or teacher ratings. Burke (1958) reported correlations be-tween SPM and student performance or grade point average from .14to .39 in six western samples. We found 16 African samples in whichthe predictive or criterion validity of the Raven's tests in educationalsettings could be determined (additional studies did not report rawcorrelations so could not be used; e.g., Daley et al., 2003; Fahrmeier,1975). These results are reported in Table 6, with a description ofthe sample and criteria. We again considered potential differencesbetween urban and rural samples in predictive and criterion validity,but found no systematic differences.
Several studies supported the predictive validity of Raven's tests.For instance, Zaaiman et al. (2001) found that the SPM correlatedreasonably well with college performance, and Maqsud (1980a)reported significant correlations between the SPM and school grades.In contrast, some studies failed to find support for the criterionvalidity SPM in Africa (e.g., Laroche, 1959; Ogunlade, 1978). How-ever, all correlations in Table 6 are positive and a meta-analytic modelfitted on the data indicated that the average meta-analytic Zr was.271 [.191–.351] (which corresponds to r=.265). There was someheterogeneity in correlations: Q=75.9, DF=15, pb .01, with aDersimonian–Laird-estimate of variance of .019. These results arenot markedly different from results in western samples. To conclude,there is some support for the predictive utility of the Raven's testsin educational settings in Africa. However, given the relatively weakcorrelations between the Raven's and educational outcomes, addi-tional, more specific, cognitive tests may improve prediction and somay be necessary for particular purposes (e.g., selection).
4.6. Conclusion on psychometric properties
The empirical support for the validity of the SPM and CPM asmeasures of g among Africans is mixed. Compared to results fromwestern studies, the convergent validity of the Raven's tests amongAfricans is poor, especially in rural samples. An average correlation of.20 or .30 between the Raven's tests and other cognitive ability testssuggests that the Raven's tests in Africa are not as strongly g-loaded asthey are in western samples. Indeed, factorial studies suggests that theRaven's test scores of Africans show relatively weak g loadings, andoften show cross-loading on factors other than g. At the same time, thecriterion validity of these tests among Africans in educational settings iscomparable towestern samples (see alsoKendall et al., 1988). However,with an average criterion validity coefficient of .265, the practical utilityof the Raven's tests remains quite weak. In light of the many claimsconcerning the unsuitableness of the Raven's tests in Africa (Irvine,1969b; Ogunlade, 1978; Verhaegen, 1956;Wober, 1966, 1975), and the
Table 6Criterion validity of SPM and CPM in African samples.
Source Country Sample description
Aboud et al. (1991) Ethiopia Children in an orphanage in JimmaCrawford Nutt (1977) South Africa Children from high school in SowetoCrawford Nutt (1977) South Africa Children from high school in SowetoDurojaiye (1973) Uganda Secondary school studentsIrvine (1963) Zimbabwe Standard 6 students from HarareLaroche (1959) Congo–Zaire Boys in schools in ElizabethvilleMacArthur et al. (1964) Zambia Representative sample of Class 6 studentsMacArthur et al. (1964) Zambia Representative sample of Form II studentMacArthur et al. (1964) Zambia Mine farm youthMaqsud (1980a) Nigeria Boys from modern primary schoolsMaqsud (1980a) Nigeria Boys from traditional primary schoolsOgunlade (1978) Nigeria Secondary school students in towns in WSilvey (1972) Uganda Secondary school children in west-UgandSilvey (1972) Uganda Buganda secondary school childrenSternberg et al. (2001) Kenya Children from rural areaZaaiman et al. (2001) South Africa Disadvantaged university students
relatively low scores in some samples, more research into the constructvalidity of the Raven's tests among Africans is needed.
More importantly, we found only one study that employedmodernpsychometric techniques to study DIF of Raven's items between non-African and African samples. We are not aware of any study thatstudied measurement invariance of the Raven's in a confirmatoryfactor analysis framework. Thus, it is unclear whether Raven's testsafford an adequate comparison of western and African samples interms of the construct of g.
5. General discussion
Our review of the literature on the performance of Africans on theRaven's tests showed that the average IQ of Africans on the Raven'stests is lower than the average IQ in western countries. However, theaverage IQ of Africans is not as lowas Lynn (andVanhanen) andMalloy(2008) maintained. The majority of studies on IQ test performance ofAfricans not taken into account by Lynn (and Vanhanen) and Malloyshowed considerably higher average IQs than the studies that they didreview. We judge the reviews of Lynn (and Vanhanen) and Malloy tobe unsystematic. These authors missed a large part of the literature onIQ testing in Africa, failed to explicate their inclusion and exclusioncriteria, andmade downward errors in the conversion of raw scores toIQs (Wicherts, 2007). Lynn (and Vanhanen)'s estimate of average IQ ofAfricans of around 67 is untenable. Our review indicates that it is about78 (UK norms) or 80 (US norms). These means are somewhat lowerthan the means of Africans on other IQ tests, which lie around 82(Wicherts et al., 2010). These results undermine evolutionary theoriesof race differences in intelligence of Lynn (2006), Rushton (2000), andKanazawa (2004) (Wicherts, Borsboom, & Dolan, 2010a; Wichertset al., 2010b).
A given IQ test score should not be equated uncritically witha particular level of g, because IQ tests are fallible instruments,particularly for test-takers who are relatively unfamiliar with westernculture as reflected in these IQ tests. IQ testing in Africa is a com-plicated affair (MacArthur et al., 1964; Nell, 2000). Based on ourreading of the literature, validity studies of the SPM or CPM in Africaprovide little support that these tests furnish adequate assessments ofg. Although these tests predict academic outcomes to some degree,the correlations between Raven's test and other cognitive tests aregenerally lower in African samples than in western samples. Factoranalyses show that the g loading of the Raven's tests is considerablysmaller in African than in western samples. Our factor analysesindicate that g explains (on average) around 30% of the variance ofRaven's test scores among Africans. In the majority of factor analyticstudies of African's performance on the Raven's tests, the resultssuggest that these tests load on other factors, in addition to g. Hence,
N Test Criterion r
134 CPM School grades (with age partialled out) .36102 SPM School grades .14102 SPM School grades .24540 SPM School performance .14204 SPM School exams .46218 SPM School grades .17684 SPM Total school grades .44
s 442 SPM Total school grades .2785 SPM Manual training performance .2360 SPM English and Arithmetic .5760 SPM English and Arithmetic .29
est-Nigeria 537 SPM School grades .15a 73 SPM School certificate and school exam .06
136 SPM School certificate and school exam .1185 CPM English & Math achievement .19
147 SPM Final grade score .33
146 J.M. Wicherts et al. / Learning and Individual Differences 20 (2010) 135–151
there is a clear need for more work on the factorial structure of thesetests in African samples (Irvine, 1969a). Our psychometric findings donot sit well with the notion that the Raven's tests are culturally fair, sowe would recommend caution in the use of these tests with Africansfor selection purposes in education and the global labor market.
Although one study (Taylor, 2008) supported measurementinvariance of SPM items in an African and a non-African sampleusing an established psychometric method, such methods have beenrarely applied to study the psychometric meaning of Africans' scoreson the Raven's tests or other IQ tests (Wicherts et al., 2010).Most studies that used alternative methods to study psychometriccomparability of Raven's items showed mixed or inconclusive results.Without rigorous studies of measurement invariance, it remainsunknownwhether the low average performance on the SPM and CPMof Africans reflect g, measurement bias, test-specific abilities (e.g., testsophistication), lower-level abilities (e.g., spatial abilities), or a com-bination of such effects. The degree to which non-g effects may haveled to an underestimation of ability in sub-Saharan African samplesremains unknown. Given the very low scores in some African samples,we consider such an underestimation to be plausible. It is also note-worthy that several authors found that retesting may improve thevalidity of the Raven's tests (Laroche, 1959;Wober, 1969), so it wouldbe interesting to consider the validity of scores from retests in futurework (see also Skuy et al., 2002).
The true meaning of IQ differences between western and Africansamples can be addressed in carefully designed cross-cultural studiesthat employ appropriate psychometricmodeling.What is required is astudy in which testing conditions across groups are controlled, and inwhich it is ascertained that test instructions are clear to all test-takers.Dynamic assessment approaches (e.g., Carlson & Wiedl, 1979; Lidz &Elliott, 2000) may be useful in this regard. This study should involve abattery of tests, each of which can be studied for DIF. Then, one couldestablish by using psychometric modeling whether between-groupmean differences are on the (higher order) latent factor called g(Dolan, 2000; Dolan & Hamaker, 2001; Lubke, Dolan, & Kelderman,2001; Lubke, Dolan, Kelderman, & Mellenbergh, 2003). Suppose wecould establish that tests are fully measurement invariant, and thatbetween-group differences are mainly (or entirely) due to between-group differences in g. This opens the door to address the questionwhy groups differ with respect to the latent variable that we call g.Only after we have tackled the measurement problem, can we start tostudy the causes of group difference in g, rather than group dif-ferences with respect to sum scores on tests, whose meaning remainsambiguous.
Although the implications of our psychometric findings for thepotential of the Flynn Effect in sub-Saharan Africa remain unclear, theRaven's tests and other IQ tests have shown robust increases in manypopulations (Daley et al., 2003; Flynn, 2007). So suppose that therewerea well-validated IQ test that showed measurement invariant scoresbetween westerners and Africans. Even then, lower IQs of Africans stillwould not support Lynn and Vanhanen's (2002, 2006) assertion thatcountries in sub-Saharan Africa are poorly developed economicallybecause of their low “national IQ”. Wicherts, Borsboom, and Dolan(2010b) found that “national IQs” are rather strongly confounded withthe developmental status of countries. Given the well-documentedFlynn Effect, we know that “national IQs” are subject to change. Anaverage IQ around 80 among Africans may appear to be low, but from ahistorical perspective this average is not low at all. A representativesample of British adults, who took the SPM in 1948 would have anaverage IQ of 81 in terms of the British norms of 1992 (J. C. Raven, 1960;J. C. Raven et al., 1996). Using older British norms, the average IQ ofAfricanswould bemuch closer to 100. This is evident in Fig. 2, wherewecompared SPM scores of Africans to older norms. In this figure, theaverage IQ of several African samples is near or above 100.
Present-day sub-Saharan Africa is one of the poorest regions in theworld and the home to some of the world's most deprived children.
The majority of sub-Saharan children are chronically malnourished,not only from lack of food but particularly from food lacking vitalelements related to both physical growth and intellectual develop-ment. It has been estimated that up to 70% of rural children live inabsolute poverty and 90% suffer severe deprivation (Gordon, Nancy,Pantazis, Pemberton, & Townsend, 2003). A substantial number ofsub-Saharan African children are under-educated. According toGarcia, Gillian, and Dunkelberg (2008), only about 12% of sub-SaharanAfrican children have attended preschool, and this generally for wellless than a year. They note that children who do not attend or haveonly minimal experience in pre-primary school tend to do less well inprimary school than children who have had that experience. Further,it is important that the preschool experience be successful. Forexample, Jaramillo and Mingat (2008) have shown that children whohave a poor experience in preschool and have to repeat a year or partof a year have a high drop-out rate in primary school (r=−0.875).The probability of preschool without repetition and who completeprimary school is low but positive (r=0.209). With or withoutpreschool experience, approximately only fifty-five% of 10–14 year-olds in sub-Saharan Africa complete primary school.
It is widely agreed that education, or the lack of it, is among themost critical problems in developing countries and regions. Both thelength and quality of schooling are major factors contributing topersonal development and intellectual growth (Blair, Gamson, Thorne,& Baker, 2005; Cahen & Cohen, 1989; Cliffordson & Gustaffson,2008), and a region's economic development (Card, 1999; Hanushek &Kimko, 2000). For developing nations, investment in primary andsecondary education is particularly important and appears to be costeffective (Psacharopoulos & Patrinos, 2002).
Many of the variables that have been proposed as causes of theFlynn Effect (e.g., Barber, 2005; Ceci, 1991; Dickens & Flynn, 2001;Greenfield, 1998; Lynn, 1989; Schooler, 1998; Williams, 1998) haveyet to undergo improvement in developing sub-Saharan Africancountries that they have enjoyed in the developed world over the lastcentury. Because the environmental variables that potentially con-tribute to enhanced IQ have yet to improve in the countries of sub-Saharan Africa, we regard the Flynn Effect as still in its infancy.There is in fact a considerable empirical support that (mal)nutrition(Grantham-McGregor & Baker-Henningham, 2007; Sigman &Whaley,1998), health (Williams, 1998), sanitation (Boivin et al., 1993), andschooling (Ceci, 1991) have an effect on IQ. The UN have includedsuch variables in the so-calledMillenniumGoals, i.e., they are targetedfor improvement by 2015 (United Nations, 2005). The formulation ofthe Millennium Goals provides an interesting opportunity to evaluatethe effect of these factors on IQ levels in sub-Saharan Africa. There isnow a clear indication that the Flynn Effect seems to have come to ahalt in developed nations (Flynn, 2007). It is, therefore, reasonable tothink that as circumstances in sub-Saharan Africa improve, the IQgap between western samples and African samples will diminish.
The future will tell whether average IQ among sub-SaharanAfricans will show gains similar to those found in western countries.However, those who claim that IQ among Africans is low because ofgenetic or evolutionary factors (Kanazawa, 2008; Lynn, 2006; Rushton,2000; Templer & Arikawa, 2006), may wish to take into consider-ation the fact that African countries are underdeveloped (Wichertset al., 2010b). On the basis of our review, we cannot preclude thepossibility that genetic factors may play a role in the low IQ levelsamong Africans. However, to the best of our knowledge, heritability ofIQ within African populations has not been the subject of behaviorgenetic study. Given that heritability can vary as a function of thequality of environmental factors (e.g., SES see Turkheimer, Haley,Waldron, D'Onofrio, & Gottesman, 2003), it is quite possible thatheritability of IQ in African populations is lower than it is in the west.With respect to the role of genetic factors between populations(African vs. western), it is very difficult to progress beyond speculationin the light of ecological correlations, which do not necessarily support

147J.M. Wicherts et al. / Learning and Individual Differences 20 (2010) 135–151
causal interpretations. However, in view of the established potentialof the Flynn Effect, the collinearity among mean IQs and a varietyof socio-economic indices, and the developmental status of manyAfrican countries, we consider environmental factors to be of primaryimportance in the interpretation of current IQ levels among Africans.
The vast literature on IQ testing with the Raven's tests in Africadoes not support JamesWatson's pessimism concerning the prospectsof Africa. It is true that Africans show lower average IQs as comparedto contemporary western norms, although the IQ gap is substantiallysmaller than Lynn (and Vanhanen) have maintained. More impor-tantly, there is little scientific basis for the assertion that the observedlower IQs of Africans are evidence of lower levels of general in-
telligence or g. The validity of the Raven's tests among Africans needsto be studied further before these tests can be used to assess Africans'cognitive ability in educational and professional settings. There areseveral reasons to expect increases in IQ levels among sub-SaharanAfricans in the coming decades.
Acknowledgement
The preparation of this article was supported by VENI grant no.451-07-016 from the Netherlands Organization for Scientific Research(NWO) awarded to JMW.
Appendix A. Converting raw scores to IQs
For the SPM scores collected during the 1950 s and 1960 s, we used British norms of 1938 for children and 1940/1948 norms for adults (bothof which are given in: J. C. Raven, 1960). For the data collected after 1965 (i.e., the midpoint of various SPM/CPM standardizations), we usedBritish SPM norms of the 1979 standardization for children (J. Raven, 2000) and the 1992 standardization for adults (J. C. Raven et al., 1996).Likewise, we used the 1956 British norms (J. C. Raven, 1956) of the CPM for samples in the 1950 s and the first half of the 1960 s. For samples from1966 onwards, we employed the British CPM norms of 1982 (J. C. Raven et al., 1990). We provide IQ estimates with and without a correction forthe Flynn Effect. There are two reasons that a correction for the Flynn Effect may be unwarranted. First, the secular increase has not beendocumented in most African countries, and so we cannot reasonably correct for an effect, about which little is known in Africa. Second, we chosethe year of 1965 as a midpoint, so the upward and downward corrections would be approximately balanced. Nevertheless, we checked whetherthe Flynn Effect correctionmakes a difference. The correctionwe used is based on Lynn (and Vanhanen)'s approach in which British norms on theSPM and CPM should be lowered by 2 IQ points per decade when data are more recent than the UK standardization, or 2 points per decadeupwards when the data are older than the standardization (Lynn & Hampson, 1986).
Notwithstanding its perceived status as a good indicator of g (Jensen, 1998), it is important to note that Raven originally did not intend theProgressive Matrices test to be used as an IQ test. There are indeed several reasons for not converting Raven's scores to IQs. First, the ProgressiveMatrices are limited to a single test format. The test taker's unfamiliarity with this formatmay depress test performance. Second, in comparison toIQ batteries, such as the Wechsler scales (Wechsler, 1974, 1997), the number of items is relatively small in both the SPM (i.e., 60 items) and theCPM (i.e., 36 items). An additional problem arises in the translation from SPM/CPM raw scores to IQs in the extreme score ranges, where values inthe norm tables show large leaps for particular age groups.
In our calculation of average IQs based on raw SPM and CPM scores, we exercised the upmost care. We did all calculations twice to minimizecomputational errors. Becausemost of these norms tables do not give percentiles for all raw scores, some inter- and extrapolationwas necessary toarrive at percentile scores. In the few caseswhere a rawmean of a sub-samplewas below the 1st percentile, we assigned an IQ of 64 (similar to theapproach employed by Lynn & Vanhanen, 2002). In studies, where scores were reported for sub-samples, we first estimated IQs for the sub-samples, and then computed an N-weighted average of IQs for the entire sample. Whenever scores were given for a particular age range (e.g., 7–8 years), the average IQ was compared to the norms for the corresponding age groups (e.g., 7, 7½, 8, and 8½ year-olds). The average IQ was anaverage of these age-norms after weighing for sample size. If a data source indicated that the age distribution was peaked about a certain age, weadjusted our estimates accordingly. Our approach almost always resulted in an IQ estimate that was equal to the estimate that was based on theoverall average raw score of the sample,when compared to the norm that corresponded to the average age of the entire sample. If not, we took theaverage IQ of both approaches. From one source (Fontaine, 1963), we had to estimate the average age of child samples on the basis of school gradelevels. Where medians were given, we took the median as an estimate of the mean. In one source (Morakinyo, 1985), percentile scores werereported, sowe transformed these to approximate rawmeans in referring the scores to amore recent norm table. All steps in the estimation of IQsare available upon request to the first author. We note that in determining IQ, it is conceivable that the aggregation of raw scores from differenttest-takerswith varying ages does not necessarilymatch the average of IQs, when these are computed at the individual level. Both the first and thesecond author independently estimated percentile scores of 21 of the sub-samples that took either the SPMor the CPM. The inter-rater reliability ofthese sub-samples turned out to be 0.92. The inter-rater reliability of the nine IQ estimates on the basis of these sub-samples was 0.96, which issufficiently high for the current purposes. Nonetheless, the assignment of IQ values for the SPM and the CPM remains problematic, and the valueswe provide are only given in order to arrive at a rough estimate of average IQ.
Appendix B
An overview of excluded studies using the SPM or the CPM in Africa.
Source
Country Sample Reason for exclusion Test N IQ LynnAhmed (1989)
Sudan School children from Khartoum Khartoum is not part of sub-Saharan Africa SPM 100 72 Bellis et al. (1988) Mali Children and adults with cretinism Inappropriate sample, no appropriate CPM norms CPM 413 –Berlioz (1955)
Cameroon Specialized workmen No appropriate CPM norms for adults CPM 80 641Berry (1966)
Sierra Leone Temne adults No appropriate CPM norms for adults CPM 122 641Binnie Dawson (1984)
Sierra Leone Temne agriculturalists No appropriate CPM norms for adults CPM 22 641Boissiere et al. (1985)
Kenya Wage laborers No appropriate CPM norms for adults CPM 205 691Boissiere et al. (1985)
Tanzania Wage laborers No appropriate CPM norms for adults CPM 179 651Erwee (1981)
S–Africa University students Test not administered in its entirety SPM 110 –Heyneman & Jamison (1980)
Uganda Primary school students No appropriate CPM norms for this age group CPM 1907 732Hoorweg (1976)
Uganda Malnourished and controladolescentsNo appropriate CPM norms for this age group,inappropriate sample
CPM
90 –
A
148 J.M. Wicherts et al. / Learning and Individual Differences 20 (2010) 135–151
(continued)ppendix B (continued)
Source
Country Sample Reason for exclusion Test N IQ LynnIrvine (1963)
Zimbabwe Standard 6 children in Harare Time limit imposed, test coaching SPM 217 –Jahoda (1956)
Ghana Urban school boys Time limit imposed SPM 317 –(Jansen, Richter, & Griesel, 1992)
South Africa Street children living in a shelter No appropriate CPM norms for this age group CPM 44 –Jukes et al. (2006)
Gambia Teenagers from villages wheremalaria is commonNo appropriate CPM norms for this age group
CPM 579Test adapted
Kendall (1976) Mozambique Male novices No appropriate CPM norms for adults CPM 149 641Klingelhofer (1967)
Tanzania Secondary school students Time limit imposed to prevent comparison SPM 2959 78 Maqsud (2003) S–Africa Standard 7 pupils Group selected because of low scores on SPM SPM 40 –Morgaut (1959)
Various Adult workers SPM test not administered in its entirety SPM 5863 –Osuji (1985)
Nigeria Physically disabled adults Inappropriate sample SPM 330 –Pillay (2003)
S-Africa Mentally retarded children Inappropriate sample, raw mean score lacking CPM 50 –Silvey (1972)
Uganda Secondary school children Time limit imposed SPM 209 –Sternberg et al. (2001)
Kenya Children from rural area No appropriate CPM norms for this age group CPM 85 69 Verhaegen (1956) Congo–Zaire Unschooled adults from Kasai Test format was “rather confusing” to test-takers SPM 67 64 Wober (1969) Nigeria Male factory workers Reliability and validity insufficient SPM 86 64 Zindi (1994) Zimbabwe School children Test not fully administered, raw mean score lacking. SPM 204 70Notes. 1On the basis of a study in Italy and San Marino (Measso et al., 1993), underestimation of adult IQ with the CPM is approximately 25 IQ points; 2average IQ should beapproximately 79, cf. Footnote 5.
References
Aboud, F., Samuel,M.,Hadera,A.,&Addus,A. (1991). Intellectual, social, andnutritional statusof children in an Ethiopian orphanage. Social Science and Medicine, 33, 1275−1280.
Ahmed, R. A. (1989). The development of number, space, quantity, and reasoning conceptsin Sudanese schoolchildren. In L. L. Adler (Ed.), Cross cultural research in humandevelopment: Life span perspectives (pp. 17−26). New York, NY: Praeger Publishers.
Angoff, W. H., & Ford, S. F. (1972). Item–race interaction on a test of scholastic aptitude.Journal of Educational Measurement, 10, 95−105.
Ayalew, T. (2005). Parental preference, heterogeneity, and human capital inequality.Economic Development and Cultural Change, 53, 381−407.
Badri, M. B. (1965). The use of finger drawing in measuring the Goodenough quotient ofculturally deprived Sudanese children. Journal of Psychology, 59, 333−334.
Bakare, C. G.M. (1972). Social-class differences in the performance of Nigerian children onthe Draw-a-Man test. In L. J. Cronbach & P. J. Drenth (Eds.), Mental tests and culturaladaptation (pp. 355−363). The Hague, The Netherlands: Mouton.
Barber, N. (2005). Educational and ecological correlates of IQ: A cross-national investigation.Intelligence, 33, 273−284.
Barnett, S. M., & Williams, W. M. (2004). National intelligence and the emperor's newclothes. Contemporary Psychology, 49, 389−396.
Bartholomew, D. J. (2004). Measuring intelligence. Facts and fallacies. Cambridge, UK:Cambridge University Press.
Bartholomew, D. J., Deary, I. J., & Lawn, M. A. (2009). A new lease of life for Thomson'sbonds model of intelligence. Psychological Review, 116, 567−579.
Bellis, G., Chaventre, A., Roux, F., Bisset, J. P., Sammartino, A. E., Chastin, I., et al. (1988).Measurement of endemic cretinism in the region (Mali). Collegium Antropologicum,12, 237−245.
Berlioz, L. (1955). Study of the Progressive Matrices among Africans of Douala. Bulletindu C.E.R.P., 4, 33−44.
Berry, J.W. (1966). Temne and Eskimoperceptual skills. International Journal of Psychology,1, 207−229.
Berry, J. W. (1974). Radical cultural relativism and the concept of intelligence. In J. W.Berry & P. R. Dasen (Eds.), Culture and cognition: Readings in cross-cultural psychology(pp. 225−229). London: Methuen & Co Ltd.
Berry, J. W. (1976). Human ecology and cognitive style. Comparative studies in culturaland psychological adaptation. New York, NY: Sage Publications, Inc.
Berry, J. W. (1983). This week's citation classic. Current Contents, 24, 22.Binnie Dawson, J. L. (1984). Bio-social and endocrine bases of spatial ability. Psycholo-
gia: An International Journal of Psychology in the Orient, 27, 129−151.Blair, C., Gamson, D., Thorne, S., & Baker, D. (2005). Rising mean IQ: Cognitive
demand of mathematics education for young children, population exposure toformal schooling, and the neurobiology of the prefrontal cortex. Intelligence, 33,93−106.
Boissiere, M., Knight, J. B., & Sabot, R. H. (1985). Earnings, schooling, ability and cognitiveskills. American Economic Review, 75, 1016−1030.
Boivin, M. J., Giordani, B., Ndanga, K., Maky, M. M., Manzeki, K. M., Ngugu, N., et al.(1993). Effects of treatment for intestinal parasites and malaria on the cognitiveabilities of schoolchildren in Zaire, Africa. Health Psychology, 12, 220−226.
Brouwers, S. A., van de Vijver, F. J. R., & van Hemert, D. A. (2009). Variation in Raven'sProgressive Matrices scores across time and place. Learning and Individual Differences,19, 330−338.
Burke, H. R. (1958). Raven's Progressive Matrices: A review and critical evaluation. TheJournal of Genetic Psychology, 93, 199−228.
Byrne, B.M., Oakland, T., Leong, F. T. L., van deVijver, F. J. R., Hambleton, R. K., Cheung, F.M.,et al. (2009). A critical analysis of cross-cultural research and testing practices:Implications for improved education and training in psychology. Training and Educationin Professional Psychology, 3, 94−105.
Cahen, S., & Cohen, N. (1989). Age versus schooling effects on intelligence development.Child Development, 60, 1239−1249.
Card, D. (1999). The causal effect of education on earnings. In O. Aschenfelter & D.Card (Eds.), Handbook of labor economics, Vol. 3. (pp. 1801−1863). New York:Elsevier.
Carlson, J. S., & Wiedl, K. H. (1979). Toward a differential testing approach: Testing-the-limits employing the Raven matrices. Intelligence, 3, 323−344.
Carroll, J. B. (1993). Human cognitive abilities: A survey of factor-analytic studies.New York, NY: Cambridge University Press.
Ceci, S. J. (1991). How much does schooling influence general intelligence and itscognitive components? A reassessment of the evidence. Developmental Psychology,27, 703−722.
Claeys, W. (1972). The factor structure of intelligence among teachers in the Congo. In L. J.Cronbach&P. J. Drenth (Eds.),Mental tests and cultural adaptation (pp. 381−390). TheHague, The Netherlands: Mouton.
Cliffordson, C., & Gustaffson, J. -E. (2008). Effects of age and schooling on intellectualperformance: Estimates obtained from analysis of continuous variation in age andlength of schooling. Intelligence, 36, 143−152.
Cooper, H. (1998). Synthesizing research. A guide for literature review, 3rd ed. London,UK: Sage Publications.
Costenbader, V., & Ngari, S. M. (2001). A Kenya standardization of the Raven's ColouredProgressive Matrices. School Psychology International, 22, 258−268.
Crawford Nutt, D. H. (1976). Are black scores on Raven's Standard Progressive Matricesan artifact of method of test presentation? Psychologia Africana, 16, 201−206.
Crawford Nutt, D. H. (1977). The effect of educational level on the test scores of peoplein South Africa. Psychologia Africana, 17, 49−59.
Dague, P. (1972). Development, application and interpretation of tests for use inFrench-speaking black Africa andMadagascar. In L. J. Cronbach & P. J. Drenth (Eds.),Mental tests and cultural adaptation (pp. 63−74). The Hague, The Netherlands:Mouton.
Daley, T. C., Whaley, S. E., Sigman, M. D., Espinosa, M. P., & Neumann, C. (2003). IQ on therise: The Flynn effect in rural Kenyan children. Psychological Science, 14, 215−219.
Dickens, W. T., & Flynn, J. R. (2001). Heritability estimates versus large environmentaleffects: The IQ paradox resolved. Psychological Review, 108, 346−369.
Dickerson, R. E. (2006). Exponential correlation of IQ and the wealth of nations. Intel-ligence, 34, 291−295.
Dolan, C. V. (2000). Investigating Spearman's hypothesis by means of multi-groupconfirmatory factor analysis. Multivariate Behavioral Research, 35, 21−50.
Dolan, C. V., & Hamaker, E. L. (2001). Investigating Black–White differences in psychometricIQ:Multi-group confirmatory factor analyses of theWISC-R andK-ABC and a critique ofthemethod of correlated vectors. In F. Columbus (Ed.), Advances in psychology research,Vol. 6. (pp. 31−59). Huntington, NY: Nova Science Publishers, Inc.
Durojaiye, M. O. A. (1973). The role of non-cognitive factors in school learning ofUgandan secondary school pupils.West African Journal of Educational and VocationalMeasurement, 1, 35−39.
Ervik, A. O. (2003). Book review: IQ and the wealth of nations. The Economic Journal,113, 406−408.
Erwee, R. (1981). Cognitive functioning, achievement motivation and vocationalpreferences of Black university students. Psychologia Africana, 20, 29−51.
Fahrmeier, E. D. (1975). The effect of school attendance on intellectual development innorthern Nigeria. Child Development, 46, 281−285.
Flynn, J. R. (1984). The mean IQ of Americans: Massive gains 1932 to 1978. Psycholo-gical Bulletin, 95, 29−51.
Flynn, J. R. (1987). Massive IQ gains in 14 nations: What IQ tests really measure. Psy-chological Bulletin, 101, 171−191.
Flynn, J. R. (2006). The Flynn Effect: Rethinking intelligence andwhat affects it. In C. Flores-Mendoza & R. Colom (Eds.), Introduction to the psychology of individual differencesPorto Alegre, Brazil: ArtMed.
Flynn, J. R. (2007).What is intelligence? Beyond the Flynn Effect. Cambridge, UK: CambridgeUniversity Press.
Fontaine, C. (1963). Notes sur une experience d'application de tests au Mali. Revue dePsychologie Appliquee, 13, 235−246.

149J.M. Wicherts et al. / Learning and Individual Differences 20 (2010) 135–151
Garcia, M., Gillian, V., & Dunkelberg, E. (2008). The state of young children in Sub-Saharan Africa. In M. Garcia A. Pence & J. L. Evans (Eds.), Early childhood care anddevelopment in Sub-Saharan Africa (pp. 11−28).Washington, D.C.: TheWorld Bank.
Gelade, G. A. (2008). IQ, cultural values, and the technological achievement of nations.Intelligence, 36, 711−718.
Gelade, G. A. (2008). The geography of IQ. Intelligence, 36, 495−501.Giordani, B., Boivin, M. J., Opel, B., Dia Nseyila, D. N., & Lauer, R. E. (1996). Use of the K–ABC
with children in Zaire, Africa: An evaluation of the sequential–simultaneous processingdistinction within an intercultural context. International Journal of Disability, Develop-ment and Education, 43, 5−24.
Glewwe, P., & Jacoby, H. (1992). Estimating the determinants of cognitive achievementin low income countries Washington, DC: World Bank Document Number.
Gordon, D., Nancy, S., Pantazis, C., Pemberton, S., & Townsend, P. (2003). Child poverty inthe developing world. Bristol, U.K.: Policy Press.
Grantham-McGregor, S., & Baker-Henningham, H. (2007). Review of the evidence linkingprotein and energy to mental development. Public Health Nutrition, 87, 1191−1201.
Greenfield, P. M. (1997). You can't take it with you:Why ability assessments don't crosscultures. American Psychologist, 52, 1115−1124.
Greenfield, P. M. (1998). The cultural evolution of IQ. In U. Neisser (Ed.), The risingcurve: Long term gains in IQ and related measures (pp. 81−123). Washington, DC:American Psychological Association.
Grieve, K. W., & Viljoen, S. (2000). An exploratory study of the use of the Austin Maze inSouth Africa. South African Journal of Psychology, 30, 14−18.
Hanushek, E. A., & Kimko, D. D. (2000). Schooling, labor-force quality, and the growth ofnations. American Economic Review, 90, 1184−1208.
Heady, C. (2003). The effect of child labor on learning achievement.World Development,31, 385−398.
Herrnstein, R. J., & Murray, C. A. (1994). The bell curve: Intelligence and class structure inAmerican life. New York, NY: Free Press.
Heyneman, S. P. (1975). Influences on academic achievement in Uganda. A “ColemanReport” from a non-industrial society. Unpublished doctoral dissertation, Univer-sity of Chicago, Chicago, IL.
Heyneman, S. P., & Jamison, D. T. (1980). Student learning in Uganda. ComparativeEducational Review, 24, 207−220.
Holland, P. W. & Wainer, H. (Eds.). (1993). Differential item functioning Hillsdale, NJ:Lawrence Erlbaum Associates, Inc.
Hoorweg, J. (1976). Protein-energy malnutrition and intellectual abilities. A study ofteen-age Ugandan children. Unpublished Doctoral dissertation, Leiden University,Leiden, The Netherlands.
Hunt, E. B., & Carlson, J. S. (2007). Considerations relating to the study of groupdifferences in intelligence. Perspectives on Psychological Science, 2, 194−213.
Hunt, E. B., & Sternberg, R. J. (2006). Sorry, wrong numbers: An analysis of a study of acorrelation between skin color and IQ. Intelligence, 34, 131−137.
Ijarotimi, O. S., & Ijadunola, K. T. (2007). Nutritional status and intelligence quotient ofprimary school children in Akure community of Ondo State, Nigeria. TanzaniaHealth Research Bulletin, 9, 69−76.
Irvine, S. H. (1963). Selection of Africans for post primary education in SouthernRhodesia. Bulletin of the Inter-African Labour Institute, 11, 69−93.
Irvine, S. H. (1966). Towards a rationale for testing attainments and abilities in Africa.British Journal of Educational Psychology, 36, 24−32.
Irvine, S. H. (1969). Factor analysis of African abilities and attainments: Constructsacross cultures. Psychological Bulletin, 71, 20−32.
Irvine, S. H. (1969). Figural tests of reasoning in Africa. Studies in the use of Raven'sProgressive Matrices across cultures. International Journal of Psychology, 4, 217−228.
Jahoda, G. (1956). Assessment of abstract behavior in a non-western culture. Journal ofAbnormal and Social Psychology, 53, 237−243.
Jansen, P., Richter, L. M., & Griesel, R. D. (1992). Glue sniffing: A comparison study ofsniffers and non-sniffers. Journal of Adolescence, 15, 29−37.
Jaramillo, A., & Mingat, A. (2008). Early childhood care and education in sub-SaharanAfrica: What would it take to beat the millennium goals? In M. Garcia A. Pence &J. L. Evans (Eds.), Early childhood care and development in Sub-Saharan Africa(pp. 51−70). Washington, D.C.: The World Bank.
Jedege, R. O., & Bamgboye, E. A. (1981). Self-concepts of young Nigerian adolescents.Psychological Reports, 49, 451−454.
Jensen, A. R. (1980). Bias in mental testing. London: Methuen & Co., Ltd.Jensen, A. R. (1998). The g factor: The science of mental ability. Westport, CT, US:
Praeger Publishers/Greenwood Publishing Group, Inc.Jinabhai, C. C., Taylor, M., Rangongo, M. F., Mkhize, N. J., Anderson, S., Pillay, B. J., et al.
(2004). Investigating the mental abilities of rural Zulu primary school children inSouth Africa. Ethnicity and Health, 9, 17−36.
Jones, G., & Schneider, W. J. (2006). Intelligence, human capital, and economic growth:A Bayesian averaging of classical estimates (BACE) approach. Journal of EconomicGrowth, 11, 71−93.
Jukes,M. C. H., Pinder,M., Grigorenko, E. L., Smith,H. B.,Walraven,G.,Meier Bariau, E., et al.(2006). Long-term impact of malaria chemoprophylaxis on cognitive abilities andeducational attainment: Follow-up of a controlled trial. PLOS Clinical Trials, 1, e19.
Kanazawa, S. (2006). Mind the gap…in intelligence: Re-examining the relationshipbetween inequality and health. British Journal of Health Psychology, 11, 623−642.
Kanazawa, S. (2008). Temperature and evolutionary novelty as forces behind theevolution of general intelligence. Intelligence, 36, 99−108.
Kaniel, S., & Fisherman, S. (1991). Level of performance and distribution of errors in theProgressive Matrices test: A comparison of Ethiopian and Israeli adolescents. In-ternational Journal of Psychology, 26, 25−33.
Kashala, E., Elgen, I., Sommerfeldt, K., Tylleskar, T., & Lundervold, A. (2005). Cognition inAfrican children with attention-deficit hyperactivity disorder. Pediatric Neurology,33, 357−364.
Kendall, I. M. (1976). The predictive validity of a possible alternative to the classificationtest battery. Psychologia Africana, 16, 131−146.
Kendall, I. M., Verster, M. A., & Von Mollendorf, J. W. (1988). Test performance of Blacksin Southern Africa. In S. H. Irvine & J. W. Berry (Eds.), Human abilities in culturalcontext (pp. 299−339). New York, NY: Cambridge University Press.
Klingelhofer, E. L. (1967). Performance of Tanzanian secondary school pupils onthe Raven Standard Progressive Matrices Test. Journal of Social Psychology, 72,205−215.
Knoetze, J., Bass, N., & Steele, G. (2005). The Raven's Coloured Progressive Matrices:pilot norms for Xhosa-speaking primary school learners in pert-urban EasternCape. South African Journal of Psychology, 35, 175−194.
Kozulin, A. (1998). Profiles of immigrant students' cognitive performance on Raven'sProgressive Matrices. Perceptual and motor skills, 87, 1311−1314.
Laroche, J. L. (1959). Results from retesting Katanga children with the Raven's Matrix38. Bulletin du C.E.R.P., 8, 85−99.
Latouche, G. L. M., & Dormeau, G. (1956). La formation professionnelle rapide en AfriqueÉquatoriale Française [Fast vocational training in French Equatorial Africa]. Brazza-ville, Congo: Centre d' Étude des Problèmes du Travail.
Lidz, C. S. & Elliott, J. (Eds.). (2000). Dynamic assessment: Prevailing models andapplications Greenwich, CT: Elsevier.
Little, T. D. (1997). Mean and covariance structures (MACS) analyses of cross-cultural data: Practical and theoretical issues. Multivariate Behavioral Research,32, 53−76.
Loehlin, J. C. (2000). Group differences in intelligence. In R. J. Sternberg (Ed.), Handbookof intelligence (pp. 176−193). Cambridge, UK: Cambridge University Press.
Lord, F. M. (1980). Applications of item response theory to practical testing problems.Hillsdale, NJ: Lawrence Erlbaum Associates.
Lubke, G. H., Dolan, C. V., & Kelderman, H. (2001). Investigating group differences oncognitive tests using Spearman's hypothesis: An evaluation of Jensen's method.Multivariate Behavioral Research, 36, 299−324.
Lubke, G. H., Dolan, C. V., Kelderman, H., &Mellenbergh, G. J. (2003). On the relationshipbetween sources of within- and between-group differences and measurementinvariance in the common factor model. Intelligence, 31, 543−566.
Lynn, R. (1989). A nutrition theory of the secular increases in intelligence–positivecorrelations between height, head size and IQ.British Journal of Educational Psychology,59, 372−377.
Lynn, R. (1990). The role of nutrition in secular increases in intelligence. Personality andIndividual Differences, 11, 273−285.
Lynn, R. (1991). Race differences in intelligence: A global perspective.Mankind Quarterly,31, 255−296.
Lynn, R. (1997). Geographical variation in intelligence. In H. Nyborg (Ed.), The scientificstudy of human nature: Tribute to Hans J. Eysenck at eighty (pp. 259−281). Oxford,UK: Elsevier Science Ltd.
Lynn, R. (2006). Race differences in intelligence: An evolutionary analysis. Augusta, GA:Washington Summit Publishers.
Lynn, R., & Hampson, S. (1986). The rise of national intelligence: Evidence from Britain.Japan and the U.S.A. Personality and Individual Differences, 7, 23−32.
Lynn, R., & Holmshaw, M. (1990). Black–White differences in reaction times andintelligence. Social Behavior and Personality, 18, 299−308.
Lynn, R., & Vanhanen, T. (2002). IQ and the wealth of nations. Westport, CT: Praeger.Lynn, R., & Vanhanen, T. (2006). IQ and global inequality.Augusta, GA:Washington Summit
Publishers.MacArthur, R. S. (1973). Some ability patterns: Central Eskimos and Nsenga Africans.
International Journal of Psychology, 8, 239−247.MacArthur, R. S., Irvine, S. H., & Brimble, A. R. (1964). The Northern Rhodesia mental
ability survey. Lusaka, Zambia: Rhodes Livingstone Institute.MacEachern, S. (2006). Africanist archaeology and ancient IQ: Racial science and
cultural evolution in the twenty-first century. World Archaeology, 38, 72−92.Malloy, J. (2008). James Watson tells the inconvenient truth: Faces the consequences.
Medical Hypotheses, 70, 1081−1091.Maqsud, M. (1980). Personality and academic attainment of primary school children.
Psychological Reports, 46, 1271−1275.Maqsud, M. (1980). Relationship between sociometric status and moral judgment in
secondary school girls.WestAfrican Journal of Educational andVocationalMeasurement,5, 13−17.
Maqsud, M. (1997). Effects of metacognitive skills and nonverbal ability on academicachievement of high school pupils. Educational Psychology, 17, 387−397.
Maqsud,M. (2003). Effects ofmetacognitive instruction onmathematics achievement andattitude towards mathematics of low mathematics achievers. Educational Research,40, 237−243.
McGrew, K. S. (2005). The Cattell–Horn–Carroll theory of cognitive abilities. In D. P.Flanagan & P. Harrison (Eds.), Contemporary intellectual assessment: Theories, tests, andissues (pp. 136−181)., 2nd ed. New York, NY: Guilford Press.
Measso, G., Zappala, G., Cavarzeran, F., Crook, T. H., Romani, L., Pirozzolo, F. J., et al.(1993). Raven's Coloured Progressive Matrices: A normative study of a randomsample of healthy adults. Acta Neurologica Scandinavica, 88, 70−74.
Meijer, R. R., & Sijtsma, K. (2001). Evaluatingpersonfit.Applied PsychologicalMeasurement,25, 107−135.
Mellenbergh, G. J. (1989). Item bias and item response theory. International Journal ofEducational Research, 13, 127−143.
Meredith, W. (1993). Measurement invariance, factor analysis and factorial invariance.Psychometrika, 58, 525−543.
Millsap, R. E., & Everson, H. T. (1993). Methodology review: Statistical approaches forassessing measurement bias. Applied Psychological Measurement, 17, 297−334.
Morakinyo, O. (1985). The brain-fag syndrome in Nigeria: Cognitive deficits in anillness associated with study. British Journal of Psychiatry, 146, 209−210.
150 J.M. Wicherts et al. / Learning and Individual Differences 20 (2010) 135–151
Morgaut, M. E. (1959). Note sommaire sur quelques comparaisons psychologiquesentre des populations Africaines, Malgaches et Europeenes. Revue de PsychologieAppliquee, 9, 23−34.
Munroe, R. H.,Munroe, R. L., & Brasher, A. (1985). Precursors of spatial ability: A longitudinalstudy among the Logoli of Kenya. Journal of Social Psychology, 125, 23−33.
Neisser, U. (Ed.). (1998). The rising curve: Long-term gains in IQ and related measuresWashington, DC: American Psychological Association.
Nell, V. (2000). Cross-cultural neuropsychological assessment: Theory and practice.Mahwah, NJ: Lawrence Erlbaum Associates, Inc.
Nkaya, H. N., Huteau, M., & Bonnet, J. P. (1994). Retest effect on cognitive performanceon the Raven-38 Matrices in France and in the Congo. Perceptual and Motor Skills,78, 503−510.
Notcutt, B. (1950). The measurement of Zulu intelligence. Journal for Social Research, 1,195−206.
Nwuga, V. C. B. (1977). Effect of severe kwashiorkor on intellectual development amongNigerian children. The American Journal of Clinical Nutrition, 30, 1423−1430.
Ogunlade, J. O. (1978). The predictive validity of the Raven Progressive Matriceswith some Nigerian children. Educational and Psychological Measurement, 38,465−467.
Okonji, M. O. (1974). Predicting reading proficiency in some Nigerian primary schoolchildren.West-African Journal of Educational and Vocational Measurement, 2, 17−23.
Okunrotifa, P. O. (1976). A comparison of the entry behaviours of Nigerian rural andurban children in geography. West-African Journal of Educational and VocationalMeasurement, 3, 1−6.
Ombredane, A. (1957). Étude du comportement intellectual des noirs congolais [Astudy of intellectual behavior in Congo Negroes]. Psychologie Française, 1, 19.
Ombredane, A., Robaye, F., & Plumail, H. (1956). Results of a repeated administration ofthe color-matrix test to Congo Blacks. Bulletin du C.E.R.P., 5, 129−147.
Ombredane, A., Robaye, F., & Robaye, E. (1957). Experimental administration of theMatrix 38 intelligence test among 485 Baluba Blacks Brussels, Belgium: AcadémieRoyale des Sciences Coloniales Document Number.
Osuji, O. N. (1985). Personality factors in acceptance of loss among the physicallydisabled. Psychological Record, 35, 23−28.
Owen, K. (1992). The suitability of Raven's Standard Progressive Matrices for variousgroups in South Africa. Personality and Individual Differences, 13, 149−159.
Pillay, A. L. (2003). Social competence in rural and urban children with mentalretardation: Preliminary findings. South African Journal of Psychology, 33, 176−181.
Pons, A. L. (1974). Administration of tests outside cultures of their origin. Paperpresented at the 26th Annual congress of the South African Psychological Association,Johannesburg, South Africa.
Poortinga, Y. H., & van deVijver, F. J. R. (1988). Themeaning of itembias in ability tests. InS. H. Irvine & J. W. Berry (Eds.), Human abilities in cultural context (pp. 166−183).Cambridge, UK: Cambridge University Press.
Psacharopoulos, A., & Patrinos, H. A. (2002). Returns to investment in education: Afurther update. (World Bank policy research working paper no. 2881) Washington,D.C: The World Bank Document Number.
Ram, R. (2007). IQ and economic growth: Further augmentation of Mankiw–Romer–Weil model. Economics Letters, 94, 7−11.
Raveau, F. H.M., Elster, E., & Lecoutre, J. P. (1976). Migration and differential acculturation.Revue de Psychologie Appliquée, 25, 145−165.
Raven, J. (2000). The Raven's Progressive Matrices: Change and stability over cultureand time. Cognitive Psychology, 41, 1−48.
Raven, J. C. (1956). Guide to using the Coloured Progressive Matrices. London: H.K. Lewis& Co. Ltd.
Raven, J. C. (1960). Guide to the Standard Progressive Matrices. London: H.K. Lewis & Co.Ltd.
Raven, J. C., Court, J. H., & Raven, J. (1990). Manual for Raven's Coloured ProgressiveMatrices. Oxford, UK: Oxford Psychologists Press.
Raven, J. C., Court, J. H., & Raven, J. (1996). Manual for Raven's Progressive Matrices andvocabulary scales. Oxford, UK: Oxford Psychologists Press.
Rindermann, H. (2007). The g factor of international cognitive ability comparisons: Thehomogeneity of results in PISA, PIRLS and IQ tests across nations. European Journalof Personality, 21, 667−706.
Rindermann, H. (2008). Relevance of education and intelligence at the national level forthe economic welfare of people. Intelligence, 36, 127−142.
Rindermann, H. (2008). Relevance of education and intelligence for the politicaldevelopment of nations: Democracy, rule of law and political liberty. Intelligence,36, 306−322.
Rushton, J. P. (2000). Race, evolution, and behavior. A life history perspective Port Huron,MI: Charles Darwin Research Institute.
Rushton, J. P. (2002). Jensen effects and African/Coloured/Indian/White differences onRaven's Standard Progressive Matrices in South Africa. Personality and IndividualDifferences, 33, 1279−1284.
Rushton, J. P., Bons, T. A., Vernon, P. A., & Cvorovic, J. (2007). Genetic and environmentalcontributions to population group differences on the Raven's Progressive Matricesestimated from twins reared together and apart. Proceedings of the Royal Society: B,274, 1773−1777.
Rushton, J. P., & Jensen, A. R. (2005). Thirty years of research on race differences incognitive ability. Psychology, public policy, and law, 11, 235−294.
Rushton, J. P., & Jensen, A. R. (2008). James Watson's most inconvenient truth: Racerealism and the moralistic fallacy. Medical Hypotheses, 71, 629−640.
Rushton, J. P., & Jensen, A. R. (2009). Race and IQ: A theory-based review of the researchin Richard Nisbett's intelligence and how to get it. Unpublished working paper.University of Western Ontario.
Rushton, J. P., & Skuy, M. (2000). Performance on Raven's Matrices by African andWhiteuniversity students in South Africa. Intelligence, 28, 251−265.
Rushton, J. P., Skuy, M., & Bons, T. A. (2004). Construct validity of Raven's AdvancedProgressive Matrices for African and non-African engineering students in SouthAfrica. International Journal of Selection and Assessment, 12, 220−229.
Rushton, J. P., Skuy, M., & Fridjhon, P. (2002). Jensen effects among African, Indian andWhite engineering students in South Africa on Raven's Standard ProgressiveMatrices.Intelligence, 30, 409−423.
Rushton, J. P., Skuy, M., & Fridjhon, P. (2003). Performance on Raven's AdvancedProgressive Matrices by African, East Indian, and White engineering students inSouth Africa. Intelligence, 31, 123−137.
Sarich, V., & Miele, F. (2004). Race: The reality of human differences. Boulder, CO:WestviewPress.
Schooler, C. (1998). Environmental complexity and the FlynnEffect. InU.Neisser (Ed.), Therising curve: Long term gains in IQ and related measures (pp. 67−79).Washington, DC:American Psychological Association.
Shepard, L. A., Camilli, G., &Williams, D.M. (1985). Validity of approximation techniquesfor detecting item bias. Journal of Educational Measurement, 22, 77−105.
Sigman, M., & Whaley, S. E. (1998). The role of nutrition in the development ofintelligence. In U. Neisser (Ed.), The rising curve: Long-term gains in IQ and relatedmeasures (pp. 155−182). Washington, DC: American Psychological Association.
Silvey, J. (1972). Long-range prediction of educability and its determinants inEast Africa. In L. J. Cronbach & P. J. Drenth (Eds.), Mental tests and culturaladaptation (pp. 371−378). The Hague, The Netherlands: Mouton.
Skuy, M., Gewer, A., Osrin, Y., Khunou, D., Fridjhon, P., & Rushton, J. P. (2002). Effects ofmediated learning experience on Raven's matrices scores of African and non-African university students in South Africa. Intelligence, 30, 221−232.
Sonke, C. J. (2001). Cross-cultural differences on simple cognitive tasks. A psycho-physiological investigation. Unpublished Doctoral Thesis, Tilburg University,Tilburg, The Netherlands.
Sternberg, R. J. (2004). Culture and intelligence. American Psychologist, 59, 325−338.Sternberg, R. J., Nokes, C., Geissler, P. W., Prince, R., Okatcha, F., Bundy, D. A., et al.
(2001). The relationship between academic and practical intelligence: A case studyin Kenya. Intelligence, 29, 401−418.
Sterne, J. A. C., & Egger,M. (2005). Regressionmethods todetect publicationandother bias inmeta-analysis. In H. R. Rothstein A. J. Sutton & M. Borenstein (Eds.), Publication bias inmeta-analysis: Prevention, assessment and adjustments (pp. 99−110). New York: Wiley.
Taylor, N. (2008). Raven's Standard and Advanced Progressive Matrices among adultsin South-Africa. In J. Raven & J. Raven (Eds.), Uses and abused of intelligence. Studiesadvancing Spearman and Raven's quest for non-arbitrary metrics (pp. 371−391).Unionville, NY, US: Royal Fireworks Press.
Te Nijenhuis, J., De Jong, M. J., Evers, A., & van der Flier, H. (2004). Are cognitivedifferences between immigrant andmajority groups diminishing? European Journalof Personality, 18, 405−434.
Templer, D. I. (2008). Correlational and factor analytic support for Rushton's differentialK life history theory. Personality and Individual Differences, 45, 440−444.
Templer, D. I., & Arikawa, H. (2006). Temperature, skin color, per capita income, and IQ:An international perspective. Intelligence, 34, 121−139.
Thurstone, L. L. (1925). A method of scaling educational and psychological tests. Journalof Educational Psychology, 16, 263−278.
Turkheimer, E., Haley, A., Waldron, M., D'Onofrio, B., & Gottesman, I. I. (2003).Socioeconomic status modifies heritability of IQ in young children. PsychologicalScience, 14, 623−628.
Tzuriel, D., & Kaufman, R. (1999). Mediated learning and cognitive modifiability.Dynamic assessment of young Ethiopian immigrant children to Israel. Journal ofCross Cultural Psychology, 30, 359−380.
UN Development Programme. (2005). Human development report. New York, NY: UNDevelopment Programme.
United Nations. (2005). The millennium development goals report 2005. New York, NY:United Nations.
van den Briel, T., West, C. E., Bleichrodt, N., van de Vijver, F. J. R., Ategbo, E. A., & Hautvast,G. A. J. (2000). Improved iodine status is associated with improved mentalperformance of schoolchildren in Benin. American Journal of Clinical Nutrition, 72,1179−1185.
van der Maas, H. L. J., Dolan, C. V., Grasman, R. P. P. P., Wicherts, J. M., Huizenga,H. M., & Raijmakers, M. E. J. (2006). A dynamical model of general intelligence:The positive manifold of intelligence by mutualism. Psychological Review, 113,842−861.
Veii, K., & Everatt, J. (2005). Predictors of reading among Herero–English bilingualNamibian school children. Bilingualism: language and cognition, 8, 239−254.
Verhaegen, P. (1956). Utilité actuelle des tests pour l'étude psychologique desautochtones congolais [Current usability of tests for the psychological examinationof Congolese natives]. Revue de Psychologie Appliquée, 6, 139−151.
Vernon, P. E. (1950). The structure of human abilities. New York: John Wiley & Sons, Inc.Wechsler, D. (1974). WISC-R Manual. New York, NY: The Psychological Corporation.Wechsler, D. (1997).Wechsler adult intelligence scale-third edition. San Antonio, TX: The
Psychological Corporation.Wicherts, J. M. (2007). Group differences in intelligence group performance.
Unpublished doctoral dissertation, University of Amsterdam, Amsterdam.Wicherts, J. M., Borsboom, D., & Dolan, C. V. (2010). Evolution, brain size, and the
national IQ of peoples around 3000 years B.C.. Personality and Individual Differences,48, 104−106.
Wicherts, J. M., Borsboom, D., & Dolan, C. V. (2010). Why national IQs do not sup-port evolutionary theories of intelligence. Personality and Individual Differences,48, 91−96.
Wicherts, J. M., Dolan, C. V., Hessen, D. J., Oosterveld, P., van Baal, G. C.M., Boomsma, D. I.,et al. (2004). Are intelligence tests measurement invariant over time? Investigatingthe nature of the Flynn Effect. Intelligence, 32, 509−537.

151J.M. Wicherts et al. / Learning and Individual Differences 20 (2010) 135–151
Wicherts, J. M., Dolan, C. V., & van der Maas, H. L. J. (2010). A systematic literaturereview of the average IQ of sub-Saharan Africans. Intelligence, 38, 1−20.
Wicherts, J. M., & Johnson, W. (2009). Group differences in the heritability of items andtest scores. Proceedings of the Royal Society: B, 276, 2675−2683.
Williams, W. M. (1998). Are we raising smarter children today? School- and home-related influences on IQ. In U. Neisser (Ed.), The rising curve: Long term gains inIQ and related measures (pp. 125−154). Washington, DC: American PsychologicalAssociation.
Wober, M. (1966). Sensotypes. Journal of Social Psychology, 70, 181−189.Wober, M. (1969). Meaning and stability of Raven's matrices test among Africans.
International Journal of Psychology, 4, 229−235.
Wober, M. (1975). Psychology in Africa. London: International African Institute.Wolff, P. H., Tesfai, B., Egasso, H., & Aradom, T. (1995). The orphans of Eritrea: A
comparison study. Journal of Child Psychology and Psychiatry, 36, 633−644.Zaaiman, H., van de Vijver, F. J. R., & Thijs, G. (2001). Dynamic testing in selection for an
educational program: Assessing South African performance on the Raven ProgressiveMatrices. International Journal of Selection and Assessment, 9, 258−269.
Zajonc, R. B., & Mullally, P. R. (1997). Birth order: Reconciling conflicting effects.American Psychologist, 52, 685−699.
Zindi, F. (1994). Differences in psychometric performance. The Psychologist, 7, 549−552.