Rationale - Sapura Group of Companies · 2015-07-27 · Rationale Annual Report Strengthening Core...
120
Transcript of Rationale - Sapura Group of Companies · 2015-07-27 · Rationale Annual Report Strengthening Core...


Rationale
A n n u a l R e p o r t
Strengthening Core Business
The Sapura Industrial Annual Report 2015 cover design aptly brings about the convergence of ideological thrusts, through expressive and dynamic visual connotations of our core businesses, surrounded by explosive hues, to showcase a monolithic viewpoint, bound by common business idealism.
The fluidity of colour blending, made up of distinct Sapura’s blue and red, indicates our business malleability in strengthening our corporate intentions to be relevant and to stay ahead as one of Malaysia’s forerunners in industrial businesses.

A n n u A l R e p o R t 2 0 1 5
table of Contents notice of Annual general Meeting 4
Corporate profile 7
Financial highlights 8
Corporate information 9
Corporate Structure 10
Board of Directors 12
Directors’ profile 14
Chief executive officer’s profile 19
Chairman’s Statement 20
Corporate Social Responsibility – Reaching out 30
Corporate governance Statement 34
Audit Committee’s Report 39
Statement on Risk Management and internal Control 42
Additional Compliance information 44
Statement of Directors’ Responsibility in Respect of the Audited Financial Statements 45
Financial Statements 47
Analysis of Shareholdings 110
particulars of properties 112
proxy Form
1StRengthening CoRe BuSineSS

ouR ShAReD AttRiButeS
2
S A p u RA i n D u S t R i A l B e R h A D

A n n u A l R e p o R t 2 0 1 5
Over the years, our people have been defined by a common set of qualities - qualities that collectively differentiate us from our industry peers. They remind us of our heritage and form the foundation in us seeking new road to discover, fresh ideas to unravel - to serve and grow with our customers and stakeholders.
HONOURABLE • PROFESSIONAL • RESOURCEFUL • RESILIENT • AGILE
A n n u A l R e p o R t 2 0 1 5
3StRengthening CoRe BuSineSS

S A p u RA i n D u S t R i A l B e R h A D
4
NOTICE IS HEREBY GIVEN THAT the 39th Annual General Meeting of the Company will be held at the Multi-Purpose Hall, Ground Floor, Sapura @ Mines, No. 7, Jalan Tasik, The Mines Resort City, 43300 Seri Kembangan, Selangor Darul Ehsan on Tuesday, 30 June 2015 at 11.00 a.m. for the following purposes:
AGENDA
1. To receive the Audited Financial Statements together with the Directors’ and Auditors’ reports for the financial year ended 31 January 2015.
Please refer to Note 1
2. To approve payment of a final single tier dividend of 3 sen per ordinary share in respect of the financial year ended 31 January 2015.
Ordinary Resolution 1
3. To re-elect the following Directors who retire by rotation pursuant to Article 109 of the Articles of Association of the Company and being eligible, offer themselves for re-election:
(i) Tan Sri Dato’ Seri Shahril bin Shamsuddin Ordinary Resolution 2 (ii) Encik Md. Shah bin Hussin Ordinary Resolution 3
4. To reappoint the following Directors who retire pursuant to Section 129(6) of the Companies Act,1965 and being eligible, offer themselves for reappointment until the conclusion of the next Annual General Meeting:
(i) Tan Sri Dato’ Seri Ir. Shamsuddin bin Abdul Kadir Special Resolution 1
(ii) Dato’ Azlan bin Hashim Special Resolution 2
5. To reappoint Datuk Kisai bin Rahmat as an Independent Director pursuant to Recommendation 3.3 of the Malaysian Code on Corporate Governance 2012 until the conclusion of the next Annual General Meeting. Ordinary Resolution 4
6. To reappoint Messrs. Ernst & Young as Auditors of the Company until the conclusion of the next Annual General Meeting and to authorise the Directors to fix their remuneration. Ordinary Resolution 5
7. DIRECTORS’ FEES
To approve the Directors’ fees for the financial year ended 31 January 2015. Ordinary Resolution 6
notice of Annual general Meeting
8. AUTHORITY FOR DIRECTORS TO ISSUE SHARES UNDER SECTION 132D OF THE COMPANIES ACT, 1965
“THAT subject to the provisions of the Company’s Articles of Association and the Main Market Listing Requirements of Bursa Malaysia Securities Berhad (Bursa Malaysia), the Directors be and are hereby empowered, pursuant to Section 132D of the Companies Act, 1965, to issue shares in the Company at any time and upon such terms and conditions and for such purpose as the Directors may, in their absolute discretion deem fit, provided that the aggregate number of shares issued pursuant to this resolution does not exceed ten per centum (10%) of the total issued and paid-up share capital of the Company as at the date of such issuance and that the Directors be and are also empowered to obtain all necessary approvals from the relevant authorities for the issuance and the listing of and quotation for the additional shares so issued on Bursa Malaysia and that such authority shall continue to be in force until the conclusion of the next Annual General Meeting of the Company.”
Ordinary Resolution 7 Please refer to Note 6
NOTICE OF DIVIDEND ENTITLEMENT
NOTICE IS HEREBY GIVEN THAT a final single tier dividend of 3 sen per ordinary share in respect of the financial year ended 31 January 2015, if approved by the shareholders at the 39th Annual General Meeting, will be payable on 11 August 2015 to Depositors registered in the Record of Depositors at the close of business on 27 July 2015.
A Depositor shall qualify for entitlement only in respect of:
a) Shares transferred into the Depositor’s Securities Account before 4.00 p.m. on 27 July 2015 in respect of ordinary transfers; and
b) Shares bought on Bursa Malaysia Securities Berhad on a cum entitlement
basis according to the Rules of Bursa Malaysia Securities Berhad.
BY ORDER OF THE BOARD
LIYANA LEE BINTI ABDULLAH (MIA 10293)Company Secretary
Bandar Baru Bangi, Selangor Darul Ehsan8 June 2015

5StRengthening CoRe BuSineSS
Director of the Company in line with Recommendation 3.3 of the Malaysian Code on Corporate Governance 2012 until the conclusion of the next Annual General Meeting. Details of the Board’s justification and recommendation for the retention of Datuk Kisai bin Rahmat as an Independent Director are set out in the Corporate Governance Statement on page 35 of this Annual Report.
5. Directors’ Fees
The Directors’ fees for the financial year ended 31 January 2015 amounted to RM265,000.
6. Ordinary Resolution pursuant to Section 132D of the Companies Act, 1965
Subject to the Main Market Listing Requirements of Bursa Malaysia Securities Berhad, the proposed Ordinary Resolution 7 is for the purpose of granting a renewed mandate and if passed, would enable the Directors to issue up to a maximum of ten per centum (10%) of the total issued and paid-up share capital of the Company as at the date of such issuance (“Renewed Mandate”). The Renewed Mandate, unless revoked or varied at a general meeting, will expire at the conclusion of the next Annual General Meeting of the Company.
The Renewed Mandate will enable Directors to take swift action in case of a need for corporate exercises or fund raising activities or in the event business opportunities arise which involve issuance of new shares and to avoid delay and cost in convening general meetings to approve such issuance of shares. Proceeds raised from the corporate exercises or fund raising activities will be utilised for funding future investment projects, working capital and/or acquisitions.
As at the date of this Notice, no new shares were issued pursuant to the mandate granted to the Directors at the last Annual General Meeting held on 18 June 2014 which will lapse at the conclusion of the Annual General Meeting.
STATEMENT ACCOMPANYING NOTICE OF THE 39TH ANNUAL GENERAL MEETINGPursuant to Paragraph 8.27(2) of the Main Market Listing Requirements of Bursa Malaysia Securities Berhad
1. The Directors retiring by rotation and standing for re-election pursuant to Article 109 of the Company’s Articles of Association are:(i) Tan Sri Dato’ Seri Shahril bin Shamsuddin(ii) Encik Md. Shah bin Hussin
2. The Directors retiring and standing for reappointment in accordance with Section 129(6) of the Companies Act, 1965 are:(i) Tan Sri Dato’ Seri Ir. Shamsuddin bin Abdul Kadir(ii) Dato’ Azlan bin Hashim
3. The Director standing for reappointment in accordance with Recommendation 3.3 of the Malaysian Code on Corporate Governance 2012 is Datuk Kisai bin Rahmat.
4. Details of the above Directors who are standing for re-election and reappointment are provided for in the “Directors’ Profile” on pages 14 to 18 of this Annual Report. Details of their interests in the securities of the Company are set out in the “Analysis of Shareholdings” on page 110 of this Annual Report.
NOTES:
1. Audited Financial Statements
This Agenda is meant for discussion only as under the provisions of Section 169(1) of the Companies Act, 1965 and the Company’s Articles of Association, the Audited Financial Statements need not be approved by the shareholders and hence, the matter will not be put forward for voting.
2. Proxy Forms
A member whose name appears in the Record of Depositors of the Company as at 19 June 2015 shall be entitled to attend, speak and vote at this Meeting.
A member of the Company who is entitled to attend and vote at this Meeting is entitled to appoint not more than two (2) proxies to attend and vote on a show of hands or on a poll in his stead. A proxy may but need not be a member of the Company and a member may appoint any person to be his proxy without limitation as to the qualification of the proxy.
Where a member is an authorised nominee (as defined under the Securities Industry (Central Depositories) Act 1991), it may appoint at least one (1) proxy in respect of each securities account it holds with ordinary shares of the Company standing to the credit of the said securities account.
Where a member appoints two (2) proxies to attend and vote at the same meeting, such appointment shall be invalid unless he specifies the proportion of his shareholdings to be represented by each proxy.
An instrument appointing a proxy shall be in writing and in the case of an individual shall be signed by the appointor or by his attorney duly authorised in writing and in the case of a corporate member, shall be either under its Common Seal or signed by its attorney or an officer of the corporation duly authorised.
The instrument appointing a proxy must be deposited at the Registered Office of the Company at Lot 2 & 4, Jalan P/11, Seksyen 10, Kawasan Perindustrian Bangi, 43650 Bandar Baru Bangi, Selangor Darul Ehsan, not less than forty eight (48) hours before the time set for holding the Meeting or any adjournment thereof.
3. Corporate Representative
As an alternative to the appointment of a proxy, a corporate member may appoint its corporate representative to attend this Meeting pursuant to Sections 147(3) and (4) of the Companies Act, 1965. For this purpose and pursuant to Section 147(5) of the Companies Act, 1965, the corporate member shall provide a certificate under its common seal as prima facie evidence of appointment of the corporate representative. The corporate member may submit the certificate to the Registered Office of the Company prior to the commencement of this Meeting.
4. Proposed Reappointment of Independent Director
Datuk Kisai bin Rahmat’s cumulative 9 years term limit as Independent Director shall be due on 18 October 2015. The proposed Ordinary Resolution 4,
if passed, will allow him to be retained and to continue acting as an Independent
A n n u A l R e p o R t 2 0 1 5

6
S A p u RA i n D u S t R i A l B e R h A D
PRECISION MACHINING

A n n u A l R e p o R t 2 0 1 5
7StRengthening CoRe BuSineSS
Corporate profile
Sapura Industrial Berhad started its business in automotive components manufacturing in the early 1980s through an acquisition of a coil spring business from Henderson’s Ltd, Australia. Taking off from just the coil spring – Sapura Industrial has since expanded its business to include the manufacture of high value-added machined engine, transmission & brake components as well as stabiliser bars and chassis module assemblies for the automotive industry and cold drawn high-grade structured steel bars used in the automotive, electrical & electronics industries.
As the business expanded in tandem with Malaysia’s automotive industry, a holding company was established in 1994 under the name of Sapura Motors Berhad. The Company was subsequently listed on the Second Board of Bursa Malaysia Securities Berhad on 9 May 1997, before it was transferred to the Main Board on 14 January 2004. In August that same year, the Company assumed its present name of Sapura Industrial Berhad, to reflect its diverse business activities.
As the Company continues to evolve with the times, the one thing that has remained constant is our corporate core values. In every phase of Sapura Industrial Berhad’s transformation journey, these core values have been the driving force behind our success and form the basis of a performance-based culture. Today, Sapura Industrial has become a name synonymous with quality, reliability and service excellence and this has been borne out by the awards and accolades we have received from industry peers and giants in the automotive industry at home and abroad.
Sapura Industrial has earned its standing in the industry through sheer determination, far-sightedness and plain hard work. Backed by a solid track record and with all the prerequisites in place, Sapura Industrial is preparing for the next thrust forward. The Company is now set to take on the entrepreneurial challenge of carving out a larger presence in the international marketplace. The way to success is through our people and because of their dedication, professionalism and team work, we are confident we will grow our businesses and achieve further value for the benefit of all our stakeholders.

S A p u RA i n D u S t R i A l B e R h A D
8
Financial highlights
31 January
2011 2012 2013 2014 2015 Revenue (RM’mil) 284.6 284.8 265.7 274.3 232.7Profit after taxation (RM’mil) 20.5 22.0 12.1 18.0 8.0Profit attributable to owners of the parent (RM’mil) 20.5 22.0 13.5 18.2 8.2Shareholders’ fund/Equity (RM’mil) 77.4 89.4 85.5 100.3 100.3Basic earnings per share (sen) 28.23 30.27 18.54 25.07 11.33Diluted earnings per share (sen) 28.22 30.27 18.54 25.07 11.33Net asset per share attributable to owners of the parent (RM) 1.06 1.23 1.17 1.39 1.40 Number of ordinary shares at financial year end (‘mil) 72.8 72.8 72.8 72.8 72.8
274.3
284.8284.6
2011 2012 2013 2014 2015 2011 2012 2013 2014 2015
2011 2012 2013 2014 2015 2011 2012 2013 2014 2015
265.7
232.7
18.0
22.020.5
12.1
8.0
100.3 100.3
89.485.5 1.39
1.231.17
77.4
1.06
Revenue (RM’ Million)
Shareholders’ Fund/Equity (RM’ Million)
Profit After Taxation (RM’ Million)
net Asset per Share Attributable to owners of the parent (RM)
1.40

A n n u A l R e p o R t 2 0 1 5
9StRengthening CoRe BuSineSS
Corporate information
BOARD OF DIRECTORS
Tan Sri Dato’ Seri Ir. Shamsuddin bin Abdul KadirExecutive Chairman
Tan Sri Dato’ Seri Shahril bin ShamsuddinDeputy Chairman Non-Independent Non-Executive Director
Dato’ Shahriman bin ShamsuddinExecutive Director
Datuk Kisai bin RahmatIndependent Non-Executive Director
Dato’ Azlan bin HashimNon-Independent Non-Executive Director
Md. Shah bin HussinIndependent Non-Executive Director
Wan Ahamad Sabri bin Wan DaudIndependent Non-Executive Director
AUDIT COMMITTEE
Datuk Kisai bin RahmatDato’ Azlan bin HashimWan Ahamad Sabri bin Wan Daud
BOARD NOMINATION AND REMUNERATION COMMITTEE Datuk Kisai bin Rahmat Wan Ahamad Sabri bin Wan DaudMd. Shah bin Hussin
DIRECTOR IN CHARGE OF SHAREHOLDERS‘ COMMUNICATIONS
Datuk Kisai bin RahmatSenior Independent Non-Executive DirectorEmail : [email protected]
or
MAIL TO :Lot 2 & 4, Jalan P/11, Seksyen 10Kawasan Perindustrian Bangi43650 Bandar Baru BangiSelangor Darul Ehsan
COMPANY SECRETARY
Liyana Lee binti Abdullah(MIA 10293)
REGISTERED OFFICE
Lot 2 & 4, Jalan P/11, Seksyen 10Kawasan Perindustrian Bangi43650 Bandar Baru BangiSelangor Darul EhsanTel : +603-8925 6011Fax : +603-8925 8292
AUDITORS
Ernst & YoungChartered AccountantsLevel 23A, Menara MileniumJalan DamanlelaPusat Bandar Damansara50490 Kuala LumpurTel : +603-7495 8000Fax : +603-2095 9076/78
SHARE REGISTRAR
Tricor Investor Services Sdn. Bhd. Level 17, The Gardens North TowerMid Valley CityLingkaran Syed Putra59200 Kuala LumpurTel : +603-2264 3883Fax : +603-2282 1886
STOCK EXCHANGE LISTING
Main MarketBursa Malaysia Securities BerhadStock Name : SAPINDStock Code : 7811

S A p u RA i n D u S t R i A l B e R h A D
Corporate StructureAs at 11 May 2015
Sapura Industrial Berhad
International Autoparts Sdn. Bhd.
100% 100%
Sapura-Schulz Hydroforming Sdn. Bhd.(RM32 million)
Automotive Specialist Centre Sdn. Bhd.(RM1 million)
100%
Sapura Brake Technologies Sdn. Bhd.
(RM3 million)100%
Sapura Automotive Industries Sdn. Bhd.(RM7.1 million)
100%
100%Sapura Machining Corporation Sdn. Bhd.(RM15 million)
100% Asian Automotive Steels Sdn. Bhd.(RM4 million)
100%Sapura Technical Centre Sdn. Bhd.
100% Isencorp Sdn. Bhd.(RM500 thousand)
Subang Properties Sdn. Bhd.(RM184 thousand)
51.68%
10
(RM2 million)
Paid Up Capital : RM72.776 million
Awaltek Sdn. Bhd.(RM2)
75%
(RM4.5 million)

11StRengthening CoRe BuSineSS
A n n u A l R e p o R t 2 0 1 5
CHASSIS & MODULE ASSEMBLY

S A p u RA i n D u S t R i A l B e R h A D
12
TAN SRI DATO’ SERI IR. SHAMSUDDIN ABDUL KADIR Executive Chairman
TAN SRI DATO’ SERI SHAHRIL SHAMSUDDIN Deputy Chairman Non-Independent Non-Executive Director
DATO’ SHAHRIMAN SHAMSUDDIN Executive Director
Board of Directors

A n n u A l R e p o R t 2 0 1 5
13StRengthening CoRe BuSineSS
MD. SHAH HUSSIN Independent Non-Executive Director
DATUK KISAI RAHMAT Independent Non-Executive Director
DATO’ AZLAN HASHIM Non-Independent Non-Executive Director
WAN AHAMAD SABRI WAN DAUD Independent Non-Executive Director

S A p u RA i n D u S t R i A l B e R h A D
14
Directors’ profile
Tan Sri Dato’ Seri Ir. Shamsuddin bin Abdul Kadir, a Malaysian aged 83, was appointed to the Board of Sapura Industrial Berhad (SIB) as Non-Executive Director and Chairman on 12 March 1974. He was appointed as Executive Chairman on 26 June 2013.
Tan Sri Shamsuddin is the Chairman and Founder of the Sapura Group. Well into its 40th year, the Sapura Group has since diversified and currently participates in key industries through three public listed companies. Sapura Industrial Berhad started its business in automotive components manufacturing in the early 1980s when Tan Sri Shamsuddin first acquired the coil spring business from Henderson’s Ltd, Australia. SIB has since evolved into a leading player in the automotive industry.
Tan Sri Shamsuddin graduated from Brighton Technical College in the United Kingdom and began his career at Telekom Malaysia where he held several key positions. In 1975, he formed the Sapura Group which has since grown into a leading knowledge and technology company in Malaysia.
Tan Sri Shamsuddin’s strong commitment to life-long education led him to co-found the Universiti Tun Hussein Onn Malaysia Foundation where he had served as Chairman of Universiti Tun Hussein Onn Malaysia from 2001 to 2009 and was inaugurated as the Pro Chancellor in 2009. In 2007, University of Brighton, United Kingdom conferred the Honorary Degree of Doctor of Science to Tan Sri Shamsuddin in recognition of his outstanding contribution to engineering development in Malaysia and the development of the Brighton Alumni Association of Malaysia. For his numerous contributions, he has been awarded with Honorary Doctorates from various Malaysian universities.
Tan Sri Shamsuddin is a senior fellow of the Institution of Engineers Malaysia and Academy of Science Malaysia. In conjunction with UMNO’s 60th Anniversary Celebrations in 2006, Tan Sri Shamsuddin was conferred with the prestigious “Malay Personality of Distinction” award. In 2011, he received the “Jewels of Muslim World” award from OIC Today Magazine in collaboration with OIC International Business Centre, for his contributions in the development of the Malaysian and Muslim world economy.
TAN SRI DATO’ SERI IR. SHAMSUDDIN BIN ABDUL KADIRExecutive Chairman

A n n u A l R e p o R t 2 0 1 5
15StRengthening CoRe BuSineSS
Tan Sri Dato’ Seri Shahril Shamsuddin, a Malaysian aged 54, was appointed to the Board of Sapura Industrial Berhad as Non-Executive Director and Deputy Chairman on 2 December 1993 and 29 November 2002 respectively.
Tan Sri Shahril is also the President and Group Chief Executive Officer of Sapura Group, a long-established business in Malaysia since 1975 with a diversified portfolio ranging from education, aviation services, property development and management, industrial and automotive component manufacturing as well as secured communications technologies. He is also serving as President and Group Chief Executive Officer and Executive Director of SapuraKencana Petroleum Berhad and is a Non-Executive Director of Sapura Resources Berhad.
Tan Sri Shahril is a member of the Massachusetts Institute of Technology Sloan Asian Executive Board, a member of Universiti Teknologi Malaysia’s International Advisory Panel as well as an active participant of the World Economic Forum. He is also a member of Board of Trustees, Treasurer and Executive Committee member of the Perdana Leadership Foundation.
In recognition of his achievements and contributions to society, he has been awarded several major honours and titles. In November 2007, he was awarded the Legion d’ Honneur by the Republic of France. In 2009, he won the Malaysia Ernst & Young Entrepreneur of the Year award and in 2013 he was conferred an honorary doctorate in Technology Management by Universiti Teknologi Malaysia. Tan Sri Shahril was presented the Man of the Year Award 2014 by The Oil and Gas Year.
Tan Sri Shahril holds a MSc in Management of Technology from MIT Sloan School of Management and BSc in Industrial Technology from California Polytechnic State University.
TAN SRI DATO’ SERI SHAHRIL BIN SHAMSUDDINDeputy ChairmanNon-Independent Non-Executive Director

S A p u RA i n D u S t R i A l B e R h A D
16
Directors’ profile (cont’d)
Datuk Kisai bin Rahmat, a Malaysian aged 64, was first appointed to the Board of Sapura Industrial Berhad on 18 October 2006. Datuk Kisai is the Chairman of the Audit Committee and member of the Board Nomination and Remuneration Committee of Sapura Industrial Berhad.
Prior to joining Sapura Industrial Berhad, Datuk Kisai was the Executive Director, Engineering and Manufacturing for Proton Holdings Berhad and a Director of several Proton’s subsidiary companies including Lotus Group International Limited UK and Vina Star Motors Corporation Vietnam. At present, Datuk Kisai is the Vice Executive Chairman of Yasmin Jurumuda Sdn. Bhd.
Datuk Kisai holds a Master of Science in Industrial Engineering and Production Management from Cranfield Institute of Technology, England and a Bachelor of Science in Mechanical Engineering from University of Strathclyde, Scotland.
Dato’ Shahriman bin Shamsuddin, a Malaysian aged 46, was appointed to the Board of Sapura Industrial Berhad as an Executive Director on 29 January 2002.
Dato’ Shahriman began his career with Sapura Group in 1991 and has held a number of key senior positions within the Group. As the Managing Director of Sapura Resources Berhad, he manages a diversified portfolio which includes investment holdings, property investment, aviation and education. He is also a Director of SapuraKencana Petroleum Berhad, Sapura Technology Sdn. Bhd. and Sapura Holdings Sdn. Bhd.
Dato’ Shahriman holds a Master of Science in Engineering Business from Warwick University, U.K. and a Bachelor of Science in Industrial Technology from Purdue University, U.S.A.
DATO’ SHAHRIMAN BIN SHAMSUDDINExecutive Director
DATUK KISAI BIN RAHMATIndependent Non-Executive Director

A n n u A l R e p o R t 2 0 1 5
17StRengthening CoRe BuSineSS
Dato’ Azlan bin Hashim, a Malaysian aged 73, was first appointed to the Board of Sapura Industrial Berhad on 20 December 1996. Dato’ Azlan is a member of the Audit Committee of Sapura Industrial Berhad.
Dato’ Azlan is the Chairman of PT AmCapital Indonesia and the Deputy Chairman of AMMB Holdings Berhad. He is currently the Non-Executive Director of AmLabuan Holdings (L) (formerly known as AmInternational (L) Limited) and AmFraser International Pte Ltd. He also sits on the Boards of Metrod Holdings Berhad and Paramount Corporation Berhad.
Dato’ Azlan served with the Malayan Railways from 1966 to 1971 and was its Chief Accountant for 2 years. In 1972, he became a Partner of a public accounting firm, Azman Wong Salleh & Co. and was a Senior Partner of the firm prior to joining the Board of Amcorp Properties Berhad in 1982 to July 2007.
Dato’ Azlan is a Fellow of the Institute of Chartered Accountants (Ireland), Economic Development Institute (World Bank, Washington) and Institute of Bankers Malaysia. Dato’ Azlan is also a qualified Chartered Accountant registered with Malaysian Association of Certified Public Accountants (MACPA).
DATO’ AZLAN BIN HASHIM Non-Independent Non-Executive Director
Encik Md. Shah bin Hussin, a Malaysian aged 64, was first appointed to the Board of Sapura Industrial Berhad on 1 September 1997. He became a Non-Independent Non-Executive Director on 1 August 2009 and was appointed as Independent Non-Executive Director on 25 September 2013. Encik Md. Shah is a member of the Board Nomination and Remuneration Committee of Sapura Industrial Berhad.
Encik Md. Shah was the Managing Director of Sapura Industrial Berhad from 1997 to 2009. Prior to his appointment as Managing Director of Sapura Industrial Berhad, he was the Group General Manager of Sapura Industrial Berhad. He was formerly an Assistant General Manager of HICOM-Yamaha Manufacturing (M) Sdn Bhd, General Manager of Body Fashion (M) Sdn Bhd and H & R Johnson (M) Berhad.
Encik Md. Shah is a member of the Institute of Engineers, Malaysia since 1990. He holds a Master in Business Administration from Ohio University, U.S.A and a Bachelor of Science in Mechanical Engineering from West Virginia University, U.S.A.
MD. SHAH BIN HUSSIN Independent Non-Executive Director

S A p u RA i n D u S t R i A l B e R h A D
18
1. FAMILY RELATIONSHIP WITH DIRECTOR AND/OR SUBSTANTIAL SHAREHOLDERS
None of the directors and or the substantial shareholders of the Company have any family relationship with the other directors and/or substantial shareholders of the Company except for Tan Sri Dato’ Seri Ir. Shamsuddin bin Abdul Kadir who is the father to Tan Sri Dato’ Seri Shahril bin Shamsuddin and Dato’ Shahriman bin Shamsuddin.
2. CONFLICT OF INTEREST
None of the directors of the Company have any conflict of interest with the Company.
3. CONVICTIONS FOR OFFENCES
None of the directors of the Company have any conviction for offences within the past 10 years.
4. ATTENDANCE AT BOARD MEETINGS
The Board of Directors’ attendance record at Board Meetings held during the financial year ended 31 January 2015 can be found on page 36 of this Annual Report.
Encik Wan Ahamad Sabri bin Wan Daud, a Malaysian aged 60, was first appointed to the Board of Sapura Industrial Berhad on 9 March 2011. Encik Wan Ahamad Sabri is a member of the Audit Committee and Board Nomination and Remuneration Committee of Sapura Industrial Berhad.
Encik Wan Ahamad Sabri has over 30 years of experience in marketing and trading of non-ferrous metals, coal and minerals in the international market. He also has extensive international business contacts. He had served in various senior management positions within the MMC Group both locally and overseas. He is currently a Management Consultant of a company dealing in the sourcing of non-ferrous metals and mineral products.
Encik Wan Ahamad Sabri holds a Bachelor of Economics from University of Malaya.
WAN AHAMAD SABRI BIN WAN DAUDIndependent Non-Executive Director
Additional information on Board of Directors
Directors’ profile (cont’d)

A n n u A l R e p o R t 2 0 1 5
19StRengthening CoRe BuSineSS
Encik Helmi bin Sheikh Mahmood, a Malaysian aged 51, was appointed as the Chief Executive Officer of Sapura Industrial Berhad (SIB) on 1 October 2014.
Encik Helmi holds a Master of Science in Manufacturing Systems Engineering from Warwick University, United Kingdom and a Bachelor of Science in Mechanical Engineering from University of Tri-State, U.S.A.
Encik Helmi began his career as an Engineer in Sapura Machining Corporation Sdn Bhd, a subsidiary of SIB in 1994. With over 20 years of experience in the manufacturing sector he has held various senior positions in SIB Group since 2002, which includes General Manager of various subsidiaries and Chief Operating Officer of SIB Group effective 1 January 2012 before assuming his present position.
Currently Encik Helmi does not hold any directorship in other public companies.
Encik Helmi does not have any family relationship with any of the Directors and/or major shareholders of the Company nor has he any conflict of interests with the Company. He also has no conviction for offences within the past 10 years.
As at 11 May 2015 Encik Helmi holds 61,917 shares in the Company.
ENCIK HELMI BIN SHEIKH MAHMOODChief Executive Officer
Chief executive officer’s profile

20
Chairman’s Statement
Dear Shareholders,
The financial year ended 31 January 2015 (FY 2015) was a challenging one not only for Sapura Industrial Berhad (SIB or the Group) but for all players in the Malaysian automotive industry. The steep decline in oil prices in the second half of the year and the depreciating value of the Ringgit took its toll on many industry players.
Against the backdrop of a challenging macroeconomic environment, I am pleased to report that your Group was able to deliver a credible financial performance with a profit after tax (PAT) of RM8.0 million. The fact that we were able to perform better than many of our industry peers has reaffirmed the Group’s resilience in coping with adversity and the fundamental strength of its business model.
S A P u R A I n D u S T R I A l B e R h A D

A n n u A l R e p o R t 2 0 1 5
21StRengthening CoRe BuSineSS
In responding to changing market dynamics, the underlying momentum of our business remains robust and there are substantial growth opportunities that we can exploit to keep growing the value of the Group well into the future. As we move progressively to the global market-place, we will strengthen our core businesses to match international standards and deliver a targeted value proposition to satisfy the more discerning needs of our global customers.
In all that we strive to achieve, the guiding compass is our Mission: To be technology competent and distinctive in our area of business by providing solutions that exceed customers’ expectations through professional leadership and consistently deliver improved performance. We have the technology in place and more importantly, the collaborative teams of partners and people with the right skills and experience to take us to the next level.
On behalf of the Board of Directors, it is my pleasure to present this Annual Report and Audited Accounts of Sapura Industrial Berhad for FY 2015.
BUSINESS ENVIRONMENT
The global economy expanded at a moderate pace of 3.3% in 2014, with uneven growth across and within regions. Although the
Malaysian economy had been initially forecast to grow by 6.0% in 2014, (Source: Bank negara Malaysia 2014 Annual Report) the sharp decline in global crude oil prices and the depreciating Ringgit presented the Government with a fiscal deficit challenge.
Malaysia’s automotive industry is in a very dynamic phase of development, with the growing liberalisation of the industry in the post-AFTA (ASeAn Free Trade Agreement) regime and the release of the third edition of the national Automotive Policy (nAP 2014) in January 2014. Buoyed by Malaysia’s continued economic growth, stable employment, aggressive promotional campaigns by car dealers and the introduction of many new models, Total Industry Volume (TIV) continued its upward growth trajectory in 2014, albeit at a slower pace of 1.6% compared to 4.5% achieved in the previous year.
According to the Malaysian Automotive Association (MAA), the sales of new motor vehicles or TIV grew to 666,465 units in 2014, surpassing the previous 2013 record of 655,793 units. This has set a new all-time high record for the domestic automotive industry. The passenger vehicles segment grew 2.0% to 588,341 units from the previously recorded 576,657 units. however, total registration of commercial vehicles declined by 1.3% to 78,124 units.
Recipient of national excellence OSh Award 2014
Recipient of Perodua excellent Cost Reduction Contribution Vendor 2014

S A p u RA i n d u S t R i A l B e R h A d
22
As the liberalisation of the Malaysian automotive market continues to pick up pace, a key underlying trend is the growing strength of the non-national segment. According to the Malaysia Automotive Institute (MAI) Review and Insight, the national car makers’ share of the market has seen a steady decline over the years and in 2014, accounted for less than half of all cars sold during the year. non-national segment leaders such as Toyota, honda and nissan have been aggressively introducing new entry-level models at competitive prices, while european brands are also enjoying a renaissance in popularity. led by Volkswagen with its range of attractive and affordable new models, it has been registering significant growth since 2010. With the introduction of the new City and Jazz models, honda was the biggest gainer in 2014 with an increased market of 3.7%. Recent years have also witnessed a surge in popularity of hybrid vehicles, as a result of a government incentive scheme and the reduction in excise duties on sub-2,000cc hybrid vehicles.
FINANCIAL PERFORMANCE
Reflecting the challenges of the operating environment, Group revenue moderated to RM232.7 million for FY 2015. The 15% decline from RM274.3 million recorded the previous year was mainly due to lower domestic volume recorded for certain models. net profit for the year under review was posted at RM8.0 million, a drop of 50% from RM18.0 million recorded the previous corresponding period, mainly due to lower volume and product mix.
DIVIDEND
It has always been the Board’s objective to reward shareholders for their loyalty and in this respect, we are proud to maintain a consistent record of dividend payment for the past 8 years. For FY 2015, the Board has recommended a single tier final dividend of 3 sen per ordinary share totaling RM2,183,272, to be approved by shareholders at the forthcoming Annual General Meeting of the Company.
This is in addition to a single tier interim dividend of 3 sen per ordinary share that was paid on 22 January 2015. The total dividend pay-out for the year in review would be 6 sen per ordinary share.
SEGMENT REPORTING
Since its incorporation, SIB has evolved into a premier supplier of automotive parts and components to the automotive industry. From the start, we were only one of a handful of Tier-1 vendors among 200 motor vehicle components and parts manufacturers in the country. With the collaboration of our technical partners throughout the Asia-Pacific region and the euro Zone we have now moved on to be one of the leading players in the Malaysian automotive landscape. All of our manufacturing divisions have been accredited to internationally recognised quality management systems such as ISO 9001, TS 16949 and ISO 14001 and OhSAS 18001 for environment management systems. These have become an international reference for quality requirements.
When looked at in totality, FY 2015 was a satisfactory year for all three business segments, having achieved an overall utilisation rate of 80%. Our continual efforts in meeting quality and safety standards have been recognised not only by the national car makers but also local original equipment manufacturers (OeMs) operating in the country. This has enabled the Group to win a number of industry awards and accolades and in FY 2015, SIB was the winner of two important awards. The first award was from Perodua for being an “excellent Cost Reduction Contribution Vendor 2014”. We also received the “national excellence Occupational Safety and health Award 2014” from the Ministry of human Resource in recognition of our efforts in implementing an effective safety management system and our safety record.
We strive for performance at every level as an integral part of our corporate philosophy. This means a focus on technology, collaboration,
problem-solving, safety and meeting the needs of our growing customer base. It goes without saying that performance includes delivering growth, increasing shareholder returns whilst behaving responsibly towards the community and the environment.
Precision MachiningThe Group is a manufacturer of high-value precision parts that include engine, transmission and brake related components for the automotive industry. We have invested in the latest testing equipment to ensure we meet the strictest quality standards, without compromising on cost-effectiveness and efficiency. In Malaysia, we are an established supplier of critical safety items such as brake disc fronts, brake drum rears and front hubs with an anti-lock braking system (ABS) to the domestic market. Our customer base includes the national car makers and also many of the OeMs with operations in Malaysia such as honda and Mazda.
Chassis and Module Assembly Our chassis and module assembly operations are the biggest contributor to Group revenue and rank us among the top three local companies in the market. Working closely with our technical partners such as Japan’s Advics Co. ltd and Korea Delphi Automotive Systems Corporation (KDAC), we have also established ourselves as one of the major brake systems and modular suppliers in Malaysia.
Chairman’s Statement (cont’d)

A n n u A l R e p o R t 2 0 1 5
23StRengthening CoRe BuSineSS
During the year, we were appointed by a local company, Go Automobile Manufacturing Sdn Bhd (GAM), as one of the assemblers for energy efficient Vehicles (eeV) at the Gurun Industrial estate in Kedah. GAM obtained the country’s first eeV manufacturing licence in January 2014 and is collaborating with Great Wall Motor Company limited (Great Wall) of China to undertake the eeV project.
under the distributorship agreement with Great Wall, GAM is producing competitive eco-friendly vehicles in market segments once dominated by Japanese and Korean car manufacturers. It will allow Malaysia to become a production hub for mass volume eeV vehicles, which will be sold in
domestic and ASeAn (Association of Southeast Asian nations) markets. The first production of compact SuVs rolled off the assembly line in november last year and has been exported to regional markets such as Thailand and Cambodia.
Hot and Cold FormingWe are a leading supplier of suspension systems in Malaysia, with a customer base that includes some of the biggest names in the auto manufacturing business such as Proton, Perodua, honda, Mazda, Volvo and Kayaba. From the production of high quality coil springs, strut assemblies and stabiliser bars, our expertise extends to design integration, working closely with the respective car manufacturers to meet their specific requirements. Apart from supplying the local market, we have expanded our customer base to export markets such as Thailand, India and ecuador.
leveraging on the knowledge and experience of our technical partners, we have consolidated and nurtured a technical base over the years. The Group now has the capabilities in its manufacturing process to use both hot and cold forming technology to produce advanced, high strength steel components that have become the staple of the modern automotive industry. hot and cold forming are two different metal forming processes at different temperatures that deliver similar results.
To meet the growing trend towards eeVs, we have also developed the in-house capabilities to produce hollow stabiliser bars for a vehicle’s suspension system. The primary advantage of hollow bars is that they weigh less being typically 40% to 50% lighter, while providing almost the same functionality as a conventional stabiliser bar. Weight is an important consideration for improved fuel economy, as a lighter vehicle can travel a greater distance for each litre of gasoline. STRENGTHENING CORE BUSINESSES
This is an exciting time for the automotive industry in Malaysia. In a rapidly evolving automotive landscape, the number of advances within the industry is truly remarkable, presenting both challenges and opportunities for SIB Group in equal measure. Our business model is designed to deliver sustainable growth, and as we move forward, we need to take a critical and holistic view of where we stand, so that we can build upon our position as a market leader, differentiate our brand perception and further unlock the value-creating potential of our businesses.
The Board believes we are already seeing the benefits of a far-reaching strategy outlined earlier to enhance our competitiveness. We are driven to continually improve our business fundamentals to enhance the robustness and quality of our

S A p u RA i n d u S t R i A l B e R h A d
24
core businesses from three main perspectives - Commercially, Technically and Operationally. Although we have made progress, we must continue to raise the bar to meet customer expectations and ensure profitable growth.
Commercial CompetitivenessWhen we started out, our focus was on the national car segment comprising Proton and Perodua. Five years ago, we started to diversify our customer base. From only two national customers, our client base has been expanded to include some of the biggest names in the global automotive business such as honda, Mazda, Suzuki, Mitsubishi and Volkswagen. having established our reputation supplying components to the local assembly plants of these international marques, the next step forward is to be included in their global sourcing programme.
however, to become a global supplier to the international marques is by no means an easy or straight-forward process. It involves several rounds of scrutiny by their own audit and quality teams to ensure that our plants, equipment, systems, processes and products meet their exacting standards and specifications. We have already started the process and having gone through several rounds of audits, we hope to be successfully accredited in order to achieve our goal to be a global supplier.
As the automotive industry continues to evolve due to shifts in consumer demand and expanded regulatory requirements, we need to work harder to drive innovation and increase our
product offerings to meet the requirements of the market. In tandem with the expanding range of our product offerings, we have enhanced our in-house capabilities in process and product technologies. For example, the development of a new cold coiling process has facilitated the development of a wide range of products for the local and export markets.
The world in which we do business is more global than ever before. To increase our sales volume and achieve greater economies of scale, we will also need to increase our export markets. The Group has already established a presence in regional markets such as Thailand, The Philippines and Indonesia, besides making inroads in markets further afield such as ecuador and India.
Technical Competitiveness Shifts in consumer demand and expanded regulatory requirements for safety and fuel economy are transforming the auto manufacturing industry. In order to address these transitions it is imperative that we enhance our in-house technical capabilities to keep pace with market demand. As a technology-driven company, we have covered a lot of ground. Over the years we have made steady progress up the value chain; from raw material processing we have now enhanced our capabilities to become a manufacturer of finished modules.
SIB aspires to be at the forefront of technology, and in this regard we have established collaborations with some of the foremost names in the auto industry to strengthen our core competencies.
Chairman’s Statement (cont’d)


S A p u RA i n d u S t R i A l B e R h A d
26
An important outgrowth of the changing auto business is the increased focus within the industry on research and development (R&D), which is essential to accelerate innovation and ensure business growth. SIB has its own R&D facility, which keeps us abreast with the latest technical and technological advances. Our R&D capabilities are nurtured as part of the Group’s Technical Development plan and our ultimate goal is to reach global competitiveness in product R&D. Although we are not there yet, we are proud of our homegrown capabilities in product design and analysis as well as the development of software to produce components with enhanced performance and features, such as hollow stabiliser bars mentioned earlier.
We also need to monitor developments and trends within the industry to ensure that we are not left behind. The industry is increasingly moving to the hybrid and electric vehicle segment, with green technology gaining prominence. In this regard, we are collaborating with universiti Malaysia Pahang (uMP) to look into the viability of producing components catering to this niche growing market.
Operational CompetitivenessPerformance is also measured in terms of our combined ability to execute our business strategy, innovate through processes and technology, and integrate across our portfolio to provide robust solutions to our customers. We not only subscribe to the ISO framework to embed quality in everything we do, but also practise other quality improvement initiatives such as Kaizen, Kanban and lean Production System. In our earlier days, SIB also benefited from the Malaysia Japan Automotive Industries Cooperation (MAJAICO) Programme that was initiated to help transform the Malaysian automotive industry into global players.
We are now aiming for accreditation to VDA (Verband der Automobilindustrie), which is
a German quality management standard initiated by the automotive industry. Based on ISO 9001:1994, the quality management system includes all elements of QS-9000. The VDA standard is broken into two parts covering Management and Products and Processes. Any company seeking certification must achieve at least 90% compliance in a formal quality audit. A VDA certification opens the door for the Group to supply to German automakers as well as facilitate entry into the euro Zone markets.
In acknowledging the important role played by our 100 over suppliers and vendors in our manufacturing processes, we will continue to invest in vendor development. As we strive to improve on quality and move up the value chain, we work closely with our vendors to earn accreditation to quality certifications such as ISO and TS 16949.
One of the main thrusts of nAP 2014 is to ensure the availability of a competent workforce at all levels to drive the development of the domestic automotive industry. each year, the Group sets aside approximately 1% of total emoluments for the training and development of its human capital. During FY 2015, various in-house and external courses were conducted for all levels of staff, which included courses on Advanced Product Quality Planning, Geometrical Dimensioning and Tolerancing, Root Cause
Analysis and VDA 6.3 awareness, to cite a few examples.
In striving for operational competitiveness, we continue to place emphasis on health, Safety and environment (hSe). In compliance with ISO 14001:2004, we ensure that all scheduled wastes (used oil, sludge, zinc phosphate, contaminated gloves and containers) produced at our manufacturing facilities are safely disposed by our licensed contractors. Our emphasis on hSe is also reflected in our training curriculum, with courses such as Management of ergonomic Issues in the Workplace, Forklift Operators & Safety Training and Schedule Waste Management. A relentless focus on the safety of our employees and all who work at SIB remains a top priority. In this regard, we are justifiably proud of our safety record both in terms of zero fatality and lost Time Incidents and these have been contributing factors that helped the Group win the national excellence Occupational Safety and health Award 2014.
We are reaping the rewards of measures taken in previous years to manage costs effectively by improving the process flows, operation rates and stock control in line with ‘supply as per production requirement’. Significant headway has been achieved, but we need to do more in the area of quality control. The objective is to achieve zero defects, reduce rejects and customer complaints.
Chairman’s Statement (cont’d)

A n n u A l R e p o R t 2 0 1 5
27StRengthening CoRe BuSineSS
OUTLOOK AND PROSPECTS
notwithstanding a backdrop of macro-economic uncertainty, the automotive business continues to be a growth industry both globally and domestically. Bank negara Malaysia projects that the global economy is expected to continue expanding at 3.5% in 2015, with uneven growth performances across the major economies. The Malaysian economy is expected to remain resilient in 2015 on a steady growth path of 4.5% to 5.5% (Source : Bank negara Malaysia Annual Report 2014). Growth will be supported mainly by a sustained expansion in domestic demand, strong domestic fundamentals and a resilient export sector.
According to the MAA, the key concerns affecting consumers at large will be the implementation of the Goods and Services Tax (GST) in April 2015, inflationary pressures and the tightening of lending guidelines, including hire purchase loans, in order to rein in household debts. As a result, customers will adopt a wait-and-see approach as they brace for a higher cost of living and uncertainties as to car prices as a result of GST implementation. however, MAA is of the view that the depreciation of the Ringgit will play a more significant role in determining car prices in the future, rather than the implementation of the GST. This is because most car companies are paying for completely-
knocked down (CKD) and completely built-up (CBu) vehicles taxes and other multi-sourcing parts in uS Dollar, which has appreciated by more than 10% as of March 2015.
For 2015, MAA forecasts that TIV will increase by 2% to 680,000 units. The passenger vehicle segment is projected to increase by 2.1% to 600,700 units, while the sales of commercial vehicles will grow by 1.5% to 79,300 units. MAA’s indicative forecast suggests that TIV volume will continue to grow by over 2% annually for the next four years.
Given the TIV uptrend, the Malaysian automotive sector has significant potential for future growth. under the nAP 2014, the Government is committed to promote a competitive and viable automotive sector and to become a regional hub for manufacturing, assembly and distribution for automotive vehicles. It is also committed to promote export-oriented Malaysian manufacturers as well as components and parts vendors.
The SIB Group is well positioned both financially and strategically to pursue its goal of profitable and sustainable long-term growth. We count among our many strengths, our innovative technologies, diverse product offering, continued operational excellence and most of all, our team of dedicated professionals working
together to fulfil our considerable potential and drive value for our shareholders. As we look forward to FY 2016, we have several priorities. The first is to ensure that our installed capacity is fully utilised so as to maximise our production potential and optimise costs. As mentioned earlier, we will also work more aggressively to expand our customer base both locally and abroad. In supply chain management, we will manage our performance more effectively so as to achieve greater productivity and meet global standards.
In an ever evolving business, we have no illusions that we have our work cut out for us in FY 2016. But we need to change in response to a dynamic and competitive business environment if we are not to be left behind. To stay ahead, we must be able to recognise changes in the operating environment so that appropriate entrepreneurial action can be taken in response to them.
APPRECIATION
I would like to begin by acknowledging the people who drive the Group forward every day. We have a great team of management and staff, distinguished by their dedication and loyalty to the Group. Their hard work has moved us forward with the promise of more to come.
We also appreciate the support of our customers, associates, business partners and the many government agencies we deal with. To our shareholders, particularly those who have been with us over the long term, we say thank you for believing in us.
last but not least, I wish to acknowledge my fellow members on the Board. Thank you for your service, dedication and guidance over the years.
We will continue to do our best to serve you well and live up to your expectations.
Tan Sri Dato’ Seri Ir. Shamsuddin bin Abdul Kadirexecutive Chairman

S A p u RA i n d u S t R i A l B e R h A dS A p u RA i n d u S t R i A l B e R h A d
28

A n n u A l R e p o R t 2 0 1 5
29StRengthening CoRe BuSineSS
A n n u A l R e p o R t 2 0 1 5
29StRengthening CoRe BuSineSS

S A p u RA i n d u S t R i A l B e R h A d
30
From our early days, the Sapura Group’s corporate social responsibility (CSR) programmes have always centred around our collective compassion for others. We believe that CSR extends beyond any corporate regulations, as it is something that we practise on a daily basis. It is a moral obligation to do whatever we can to improve the quality of life for our employees, their families as well as the local community and society as a whole. We never take CSR for granted and we place the highest priority
Corporate Social Responsibility – Reaching out
on helping people in need. A great deal of thought and effort have gone into translating this goal into the many CSR programmes that we undertake each year either as a Group or as individual companies.
Sapura Community. Formed as an employee welfare and social club, Sapura Community is a common thread that binds our people together as we realise our CSR objectives both internally and externally. It is a platform for our management and staff to come together and be engaged in welfare work, charity projects as well as a host of sports and recreation activities.
Sapura Flood Relief

A n n u A l R e p o R t 2 0 1 5
31StRengthening CoRe BuSineSS
Flood Relief Mission. When the worst floods in decades battered the east coast of Peninsular Malaysia in December 2014, the Group was quick to respond in setting up the Sapura Group Flood Relief Mission. Volunteers from the Group packed emergency flood relief supplies which included packages of basic food items for the various relief centres set up in the affected states. The Group also provided medical supplies as requested by medical volunteers as well as walkie-talkies for the emergency response team. All supplies were transported to relief centres in Kelantan, Terengganu as well as Pahang.
Sapura volunteers were also mobilised to assist in the clean-up efforts of schools and public areas after the floods had subsided. As it was also
the start of a new school term, we also helped families with school-going children with back-to-school necessities such as uniforms, shoes and stationery items.
The devastating floods of December 2014 also touched Sapura Industrial Berhad (SIB) in a personal way, with 48 staff members or their families among the flood victims. Affected families were given a token as financial assistance to alleviate their massive loss.
Inspiring Future Generations. As a Group that aspires towards excellence, Anugerah Cendekiawan Sapura honours the best and the brightest among the children of our employees. For the past five years, the award has been conferred to more than 300 students who have demonstrated tremendous potential in the Malaysian public examinations.
Anugerah Cendekiawan Sapura has now evolved to emphasise and encourage the development of holistic individuals who not only excel academically but also actively commits themselves in extra-curricular, society-engagement activities and displays strong leadership qualities.
To this end, Sapura Community introduced a new award aptly named Anugerah Cemerlang Siti Sapura. It is in honour of the late Puan Sri Siti Sapura Husin who was a great believer in nurturing the potential of our future generations.
In an effort to support our Sapura children, SIB also provides free tuition classes for students sitting for the Ujian Pencapaian Sekolah Rendah examinations.
Anugerah Cendekiawan Sapura
Sapura Community White Water Rafting

S A p u RA i n d u S t R i A l B e R h A d
32
Corporate Social Responsibility – Reaching out (cont’d)
Team Building. Sapura Community is also a medium where we organise
activities to promote the spirit of camaraderie and teamwork among
employees. Last year, employees across the Group participated in a White
Water Rafting Challenge that took place at Sungai Slim, Perak.
Disadvantaged Communities. Now into its third year, the Group continues
to support the MyKasih ‘Love My Neighbourhood’ Programme to benefit
some 300 disadvantaged households in Jerlun, Kedah. The unique feature
of the programme is that aid is disbursed to targeted beneficiaries through
a cashless payment system. At selected participating outlets, beneficiaries
can pay for their items electronically by using their MyKad.
This small contribution to their personal households is meant to assist in
purchasing much-needed basic food items for the families identified.
Sapura Foundations. Our two foundations, Yayasan Shamsuddin Abdul
Kadir and Yayasan Siti Sapura Husin continue to support underprivileged
communities including orphans, single mothers, the blind and other
disadvantaged groups.
While we continue to support various causes over the course of the year,
our longer-term projects are the true test of our commitment. Yayasan Siti
Sapura Husin together with Universiti Teknologi Petronas strive to develop
ipoh Resource Centre
Kampung Aji, perak Sapura Community Blood donation drive

A n n u A l R e p o R t 2 0 1 5
33StRengthening CoRe BuSineSS
surrounding communities with sustainable economic growth, social well-
being and nurture a knowledge-driven culture.
Our pilot project was launched in Kampung Aji, Perak to benefit single
mothers, the elderly and children. This project focuses on alleviating their
hardship from issues related to women exploitation, illiteracy, poverty and
breakdowns in the family unit.
The Kampung Aji project has since provided a platform for single mothers
to participate in activities which generate sustainable income for them.
A Tradition of Sharing. The Sapura Group has a long tradition of celebrating
and sharing the many festivities in the country with the less fortunate. Last
year, we were delighted to share the joys and bliss of Ramadhan and Syawal
with our employees and orphans from various homes around Selangor at
the Sapura Majlis Berbuka Puasa and Aidilfitri Open House.
During the month of Ramadhan, apart from monetary contributions to
mosques, a group of volunteers from SIB also visited the Persatuan Rumah
Amal Murni, in Kajang bearing gifts of electrical appliances as well as food
items.
A tradition of sharing extends to our own people and in SIB, we believe in
taking care of our own. Each month, we provide a stipend to the children
of employees who have passed away whilst in service. These children are
also given assistance to purchase books or uniforms at the start of the new
school year.
Moving forward. Our various community development and outreach
programmes are a manifestation of Sapura Group’s philosophy of sharing
its success with those in need. We have come a long way and our CSR
programmes will continue to evolve as we strive to empower individuals
and communities and support activities that deliver a meaningful and
sustainable impact.
Sapura group Aidilfitri open house
Aidilfitri With Young guests From desa Amal Jireh

S A p u RA i n d u S t R i A l B e R h A d
34
Corporate governance Statement
The Board recognises that corporate governance is about commitment to values and ethical conduct and thus, the Board is fully committed in ensuring that the interests of all stakeholders are not just safeguarded, but continually enhanced to ensure the sustainability and the long-term growth of the Group’s businesses. Accordingly, the stakeholders’ expectations must be assessed and managed, and not assumed.
This statement together with the Statement on Risk Management & Internal Control and the Audit Committee Report disclosed the manner in which the Company has adopted the principles and recommendations as set out in the Malaysian Code on Corporate Governance 2012. Where there are differences from the Recommendations of the Code, they are disclosed herein with explanations.
The Board is pleased to report to shareholders the manner in which the Company has applied the Code. A. DIRECTORS
The BoardThe Board is responsible and committed to adopting good corporate governance practices as part of its continuing obligations. In retaining full and effective control of the Group, it guides and monitors the affairs of the Group on behalf of shareholders. Its principal responsibilities as prescribed under the Code cover a review of the strategic plan and direction for the
Group, overseeing the conduct of the business operations of the Group, and evaluating whether these are being properly and effectively managed. It also includes identifying the principal risks affecting the Group, ensuring the implementation of appropriate systems to manage succession planning, developing and implementing an investor relations programme and shareholder communications policy, as well as reviewing the adequacy and the integrity of management information and internal controls system of the Group.
Board BalanceThe composition of the Company’s current Board of Directors is well balanced, with an effective mix of executive directors, independent and non-executive directors. The Board’s composition comprises two (2) executive directors, two (2) non-independent non-executive directors and three (3) independent non-executive directors. A brief profile of the directors is presented on pages 14 to page 18 of this Annual Report. The diverse backgrounds of the directors provides the Board with an effective mix of members with industry-specific knowledge and broad business and commercial experience.
The Board is mindful that the Code stipulates the requirement for majority Independent Directors if the Chairman holds an executive position. Members of the Board recognises the Chairman’s prominent role and contribution to the Company since the Company was set up. The Board is comfortable that there is no undue risk involved as all major matters are referred to the Board for consideration and approval. Furthermore, there are independent directors who are professionals of credibility and repute, who demonstrate independent judgment and objectivity in the Board’s deliberations.

A n n u A l R e p o R t 2 0 1 5
35StRengthening CoRe BuSineSS
The Board continually assesses the composition of its independent directors to ensure they have the appropriate balance of skills, expertise and experience to bring an independent view in the consideration of Board issues and provide the appropriate advice to maintain the highest level of corporate ethics.
The Board has identified Datuk Kisai bin Rahmat as the Senior Independent Non-Executive Director of the Board to whom any concerns on issues affecting the Company and the Group may be conveyed. Datuk Kisai bin Rahmat has been the Company’s Independent Director since 18 October 2006 and his cumulative (nine) 9 years term limit shall be due in October 2015.
Recommendation 3.2 of the Code states that the tenure of Independent Directors shall not exceed a cumulative term of nine (9) years. Following an assessment by the Board Nomination and Remuneration Committee (BNRC) and the Board, the Board recommends that Datuk Kisai bin Rahmat continues to serve as an Independent Director subject to shareholders’ approval at the forthcoming Annual General Meeting of the Company on the basis of the following justifications:-
i. His appointment is made in accordance with the requirements of the Main Market Listing Requirements of Bursa Malaysia Securities Berhad (MMLR) and therefore is able to bring independent and objective judgment to the Board;
ii. He is able to provide proper check and balance in the proceedings of the Board and the Committees;
iii. His vast experience in the industry and technical background allows him to participate actively and contribute during the deliberations or discussions at the Board and Committee meetings; and
iv. He exercises due care as Senior Independent Non-Executive Director of the Company and carries out his professional and fiduciary duties in the interest of the Company and shareholders.
In consideration of the above, the Board has concluded to seek shareholders’ approval to retain Datuk Kisai bin Rahmat as Independent Non-Executive Director of the Company at the forthcoming 39th Annual General Meeting.
The non-executive directors contribute significantly in areas such as policy and strategy, performance monitoring, allocation of resources as well as improving governance and controls. They also ensure that the strategies proposed by the management are fully discussed and examined, and take into account the long term interest not only of the shareholders, but also of employees, customers and suppliers. Together with the Chief Executive Officer who has an intimate knowledge of the business, the Board is constituted of individuals who are committed to business integrity and professionalism in all its activities.
The Board believes that new appointments to the Board should be based on candidates’ merits, but in line with the Code, the Board will consider females on the Board in due course to bring about a more diverse perspective.
Number of Directorship in Public Listed CompaniesThe directors of the Company do not hold more than five (5) directorships in public listed companies as prescribed by the MMLR. This ensures the Directors’ commitments, resources and time are focused for an effective input to the Board.
The Chairman and Chief Executive Officer (CEO)The roles and responsibilities of the Chairman are separate and distinct from those of the CEO to ensure that there is check and balance and authority at the helm. The Chairman is primarily responsible for leadership, effective conduct and workings of the Board whilst the CEO has the general responsibility of running the business on a day-to-day basis, ensuring business excellence and operational efficiency on behalf of the Board. He is responsible for implementing the policies and decisions of the Board, overseeing the operations as well as coordinating the development and implementation of business and corporate strategies. The CEO is supported by the Senior Management team and Group Functional teams with vast experience, skill and knowledge of the industry.
Board and Board Committee MeetingsThe Board ordinarily meets at least four (4) times a year at quarterly intervals, with additional meetings convened as and when deemed necessary. At each regularly scheduled meeting, there is a full financial and business review and discussions, including evaluating the performance to date against the

S A p u RA i n d u S t R i A l B e R h A d
36
annual budget and business plan previously approved by the Board for that year. During the current financial year under review, the Board held six (6) meetings. Details of attendance at Board meetings are as follows:-
No. Name of Directors Position Attendance
1. Tan Sri Dato’ Seri Ir. Shamsuddin Executive 4 out of 6 bin Abdul Kadir Chairman
2. Tan Sri Dato’ Seri Shahril bin Deputy 3 out of 6 Shamsuddin Chairman
3. Dato’ Shahriman bin Shamsuddin Executive 3 out of 6 Director
4. Dato’ Azlan bin Hashim Non-Independent 4 out of 6 Non-Executive
5. Datuk Kisai bin Rahmat Independent 6 out of 6 Non-Executive
6. Md. Shah bin Hussin Independent 6 out of 6 Non-Executive
7. Wan Ahamad Sabri bin Independent 6 out of 6 Wan Daud Non-Executive
To facilitate an effective discharge of responsibilities, dedicated Board Committees were established guided by clear terms of reference. The Board Committees are chaired by non-executive directors who exercise skillful leadership with in-depth knowledge of the relevant industry.
• AuditCommittee The primary objective of the Audit Committee is to assist the Board
of Directors in discharging its responsibilities relating to financial accounting and reporting matters. In compliance with the MMLR and the Code, the Audit Committee comprises three (3) directors, a majority of whom are independent non-executive directors:
Chairman : Datuk Kisai bin Rahmat (Senior Independent Non-Executive Director) Members : Dato’ Azlan bin Hashim (Non-Independent Non-Executive Director) Encik Wan Ahamad Sabri bin Wan Daud (Independent Non-Executive Director)
The terms of reference and the report of Audit Committee are set out on pages 39 to 41.
The Audit Committee held five (5) meetings during the financial year.
• BoardNominationandRemunerationCommittee The BNRC was set up with the primary responsibility of proposing and
recommending to the Board, candidates for directorships to be filled in the Board and Board Committees. The BNRC, in recommending candidates for appointment to the Board, assesses the candidates’ experience, background, capabilities and skills required by the Board. The Board believes that individuals with diverse backgrounds, independence, competencies and diversity represented on the Board could improve its effectiveness and bring differing perspectiveness in its deliberations and decision making processes.
The BNRC, in determining candidates for appointment to the Board Committees, considers various factors which includes time commitment of the Board Committee members in discharging their roles and responsibilities through attendance at their respective meetings.
The BNRC is also responsible to propose, consider and recommend to the Board the remuneration packages for the executive directors and the CEO. The remuneration of the executive directors and the CEO is competitive and attractive as it has been benchmarked against the industry.
Currently, the composition of the BNRC complies with the MMLR. The BNRC comprise wholly independent and non-executive directors.
Members : Datuk Kisai bin Rahmat (Senior Independent Non-Executive Director) Encik Wan Ahamad Sabri bin Wan Daud (Independent Non-Executive Director) Encik Md. Shah bin Hussin (Independent Non-Executive Director)
The above composition ensures that any decisions made are impartial and in the best interest of the Company without any element of fear or favour.
The BNRC held two (2) meetings during the financial year.
The proceedings and resolutions passed at each Board and Board Committee meeting are minuted and kept in the statutory register at the registered office of the Company. In the event of any potential conflict of interests, the directors in such a position will make a declaration to that effect as soon as practicable. The directors concerned will then abstain from any decision making process in which they are involved. .
Supply of InformationThe Board has unrestricted access to timely and accurate information necessary in the furtherance of their duties. The Company Secretary ensures that all Board meetings are furnished with proper agendas. Board papers, which include reports on group performance and major operational, financial, strategic and regulatory matters, are circulated to all the directors
Corporate governance Statement (cont’d)

A n n u A l R e p o R t 2 0 1 5
37StRengthening CoRe BuSineSS
not less than seven (7) days prior to the meeting, to allow the directors sufficient time for review. In most instances, senior management of the Company as well as external advisors are invited to be in attendance at Board meetings to provide fresh insights and to furnish clarification on issues that may be raised by the Board.
Company SecretaryThe Board is supported by a qualified Company Secretary who plays an advisory role to the Board in relation to the Board’s policies and procedures and ensures compliance with the relevant regulatory requirements, codes, guidance and legislations. The Directors have full and unrestricted access to the advice and services of the Company Secretary.
Independent Professional AdviceThere is a formal procedure sanctioned by the Board of Directors, whether as a full board or in their individual capacity to seek independent professional advice at the Group’s expense, where necessary and in furtherance of their duties.
Appointment to the BoardThe proposed appointment of new Board members are reviewed and assessed by the BNRC. Thereafter the BNRC submits its recommendation on the proposed appointment to the Board for approval. The BNRC’s primary role is to review the required mix of skills and experience of the directors on the Board, and determine the appropriate Board balance and size of non-executive directors. It will establish procedures and processes towards an annual assessment of the effectiveness of the Board as a whole, the committees of the Board and for assessing the contribution of each individual director. The Board is satisfied that the current composition of the Board brings the required mix of skills and experience required for the Board to function effectively.
Directors’ TrainingThe Board acknowledges that its directors must keep abreast of developments in the Group’s operating environment and business and will need to enhance their knowledge and business acumen to meet challenging commercial risks.
The Board endeavors to provide continual training and development of its current and new directors, by ensuring that the Directors participate in a specifically tailored training and induction program. During the financial year under review, members of the Board and Management team attended the following ‘in-house’ training programme :
• RiskManagementAndCrisisManagement• WhistleblowingAndCyberFraud• CommonMistakesMadeByDirectors• BoardroomEffectivenessAndAccountability• ChallengesInRelationToFinancialReporting
Re-election and Reappointment of DirectorsThe existing Company’s Articles of Association provides that all directors appointed by the Board are subject to election by the shareholders at their first annual general meeting and thereafter shall retire from office by rotation at least once in each three (3) years, but shall be eligible for re-election at each Annual General Meeting.
Any Directors aged 70 or above is subject to reappointment by shareholders on an annual basis in accordance with Section 129(6) of the Companies Act, 1965.
The Board makes recommendations concerning the re-election, reappointment and the continuation in office of any Director for shareholders’ approval at the Annual General Meeting. The profiles of the Directors seeking for re-election and reappointment as Directors are set out on page 14 and 17 of the Annual Report.
B. DIRECTORS’ REMUNERATION
Level and make-up of RemunerationThe BNRC is responsible for evaluating and recommending to the Board the level and make-up of the remuneration of the Executive Chairman, Executive Director and Chief Executive Officer, ensuring that they commensurate with the scope of responsibilities held in order to attract and retain the persons of necessary caliber, experience and quality needed to successfully lead the Company.
Remuneration ProcedureDuring the financial year, the remuneration package for the Executive Chairman, Executive Director and Chief Executive Officer was recommended by the BNRC and approved by the Board. Remuneration of the Non-Executive Directors is determined by the Board.
The directors’ fees are approved by shareholders at the Annual General Meeting. The details of the directors’ remuneration for the financial year ended 31 January 2015 are as follows:
Executive Non-Executive Total RM RM RM
Fees – 265,000 265,000
Salaries and other 2,891,000 – 2,891,000 emoluments
Bonus 575,000 – 575,000
Other emoluments – 49,000 49,000
Benefits-in-kind 19,196 – 19,196
Contributions to defined contribution plan 223,440 – 223,440
Total 3,708,636 314,000 4,022,636

S A p u RA i n d u S t R i A l B e R h A d
38
The number of directors whose remuneration fall into the following bands are as follows:
Bands Executive Non-Executive Total
Below RM50,000 – 2 2
RM50,001 – RM100,000 – 3 3
RM1,600,001 – RM 1,650,000 1 – 1
RM2,050,001– RM2,100,000 1 – 1
Total 2 5 7
C. SHAREHOLDERS
The Annual General MeetingThe Company has been using the Annual General Meetings as a platform for communicating with its shareholders. All shareholders are welcome to attend the Company’s Annual General Meeting and to actively participate in the proceedings. They are encouraged to give their views and suggestions for the benefit of the Company. Every opportunity is given to shareholders to ask questions and seek clarification on the business and performance of the Company.
Dialogue Between Companies and Investors The annual report and the quarterly announcements on the Group’s business, activities and financial performance are the primary mode of communication to all its shareholders.
The key objective of the Company’s dialogue with its shareholders at the Annual General Meeting is to provide an opportunity for a two-way communication process between the Company and its private and institutional investors. In a process of engaging our stakeholders, the Company is able to answer any questions that may be raised while gaining insights into their views and perspectives. At the Annual General Meeting, shareholders are also encouraged to ask questions about the resolutions being proposed as well as the Group’s operations in general.
The Company has established a website at www.sapuraindustrial.com.my where shareholders and stakeholders can access for information regarding Sapura Industrial Berhad Group.
In addition to the above, the Board has identified Datuk Kisai bin Rahmat as the Senior Independent Non-Executive Director to whom concerns from the shareholders can be conveyed. He may be contacted at [email protected].
D. ACCOUNTABILITY AND AUDIT
Financial ReportingThe Board is committed to provide a balanced and meaningful assessment of the Group’s financial performance and prospects. The usual channel for release of this information is through the audited financial statement, quarterly announcements and the Annual Report. In discharging its fiduciary responsibility, the Board is assisted by the Audit Committee whose primary responsibility is to oversee the Group’s financial reporting processes and ensure the quality of its financial reporting.
Risk Management and Internal ControlThe Board acknowledges its overall responsibility for maintaining a sound system of internal control and a risk management framework to safeguard shareholders’ investment and Group assets and for reviewing the effectiveness of these systems. The Statement on Risk Management and Internal Control is presented on page 42 of the Annual Report providing an overview of the risk management and status of internal control system within the Group.
Relationship with AuditorsThe Board, through the Board Audit Committee, maintains a formal and transparent professional relationship with both the Group internal and external auditors.
The function of the Audit Committee in relation to the external auditors and the number of meetings held since the previous financial year end as well as the attendance record of each member is shown in the Audit Committee’s Report on pages 39 to 41 of the Annual Report.
The membership of the Audit Committee, the terms of reference and a summary of the activities of the committee are presented in the Audit Committee’s Report on pages 39 to 41 of the Annual Report.
Directors’ Responsibility StatementThe Directors are required by the Companies Act, 1965 to ensure that financial statements prepared for each financial year give a true and fair view of the state of the affairs of the Company and the Group as at the end of the financial year and of the results and cash flow of the Group for the financial year.
Statement made in accordance with a resolution of the Board of Directors dated 5 May 2015.
Corporate governance Statement (cont’d)

A n n u A l R e p o R t 2 0 1 5
39StRengthening CoRe BuSineSS
Audit Committee’s Report
AuthorityThe Committee is authorised by the Board to investigate any activity within its terms of reference. It is authorised to seek information it requires from any employee and all employees are directed to co-operate with any request made by the Committee.
AccessThe Committee shall have unlimited access to all information and documents relevant to its activities, to the Internal and External Auditors, and to Senior Management of the Company and its subsidiaries. The Committee is also authorised to take such independent professional and legal advice, as it considers necessary.
MeetingsThe Audit Committee shall hold at least four (4) regular meetings per financial year, and such additional meetings as the chairperson shall decide in order to fulfil its duties and if requested to do so by any Committee member, the Management or the Internal or External Auditors. The Committee may invite any person to be in attendance to assist it in its deliberations. A quorum shall consist of a majority of Independent Committee members and shall not be less than two (2).
The Company Secretary or any person appointed by the Committee for this purpose shall act as Secretary of the Committee.
Duties and Responsibilities1. Review the adequacy and effectiveness of risk management, internal
control and governance system instituted in the Group.
2. Discuss with the External Auditors before the audit commences, the nature and scope of the audit.
3. Review with the External Auditors :
a. the audit plan;b. the evaluation of the system of internal accounting control;
andc. the audit report on the financial statements.
4. Review the assistance given by the Company’s officers to the External Auditors.
The Audit Committee of Sapura Industrial Berhad is pleased to present their report for the financial year ended 31 January 2015
COMPOSITION
The members of the Audit Committee during the financial year comprised the following Directors:
Datuk Kisai bin Rahmat, ChairmanIndependent Non-Executive Director
Dato’ Azlan bin Hashim, MemberNon-Independent Non-Executive Director
Wan Ahamad Sabri bin Wan Daud, MemberIndependent Non-Executive Director
TERMS OF REFERENCE
Size and CompositionThe Board shall by resolution appoint members of the Audit Committee, which shall comprise at least three (3) non-executive directors, the majority of whom shall be independent directors as defined under the Main Market Listing Requirements of Bursa Malaysia Securities Berhad (MMLR). At least one member of the Committee is an accountant and fulfils requirements of the MMLR.
The Committee shall elect a chairperson from among its members who is not an executive director or employee of the Company or any related corporation.
In the event of any vacancy in the Audit Committee resulting in non-compliance of the provisions of MMLR, the Board shall fill the vacancy within three (3) months.
Term of MembershipMembers of the Committee shall be appointed for an initial term of three (3) years after which they will be reappointed on such terms as may be determined by the Board of Directors.

S A p u RA i n d u S t R i A l B e R h A d
40
5. Review the adequacy of the scope, functions and resources of the internal audit function and that it has the necessary authority to carry out its work.
6. Review the internal audit programme, processes, the results of the internal audit programme, processes or investigation undertaken and whether or not appropriate action is taken on the recommendations of the internal audit function.
7. Review of the quarterly results and year end financial statements with the Management and the External Auditors prior to them being approved by the Board of Directors, focusing particularly on :
a. changes in or implementation of major accounting policy and practices;
b. significant and unusual events; andc. compliance with applicable approved accounting standards
and other legal and regulatory requirements.
8. Review of any related party transaction and conflict of interest situation that may arise within the Company and the Group including any transaction, procedure or course of conduct that raises questions of management integrity.
9. Consider any matters the External Auditors may wish to bring to the attention of the Directors or shareholders.
10. Consider the major findings of internal investigations and management’s response.
11. Review of any significant transactions which are not a normal part of the Company’s business.
12. To recommend to the Board the appointment and reappointment of the External Auditors and any question of their resignation or dismissal.
13. Such other responsibilities as may be agreed to by the Audit Committee and the Board of Directors.
MEETINGS HELD FOR THE FINANCIAL YEAR ENDED 31 JANUARY 2015
The Audit Committee held five (5) meetings during the financial year ended 31 January 2015 with the Head of Internal Audit and the Group Financial Controller cum Company Secretary in attendance. The Chief Executive Officer, External Auditors and the Head of the Auditee Companies were also invited to brief the Audit Committee on issues tabled for discussion.
The meetings were structured through distribution of relevant papers to members with sufficient notification.
Audit Committee Meeting AttendanceThere were five (5) meetings held during the financial year ended 31 January 2015 and the details of attendance are as follows:-
No. Name of Directors Attendance
1. Datuk Kisai bin Rahmat 5 out of 5 (Chairman, Independent)
2. Dato’ Azlan bin Hashim 5 out of 5 (Non-Independent)
3. Wan Ahamad Sabri bin Wan Daud 5 out of 5 (Independent)
Audit Committee’s Report (cont’d)

A n n u A l R e p o R t 2 0 1 5
41StRengthening CoRe BuSineSS
SUMMARY OF ACTIVITIES DURING THE FINANCIAL YEAR
The Committee carried out its duties in accordance with its terms of reference during the financial year.
The main activities undertaken by the Committee were as follows:
• ReviewedtheinternalauditplantoconfirmtheannualauditoftheGroup.
• ReviewedandappraisedtheauditreportsbytheInternalAuditors.• Reviewed and appraised the various corporate governance, risk
management and internal control systems.• Considered significant issues arising from the annual audit by the
External Auditor.• Reviewed the quarterly and year end financial statements before
recommending to the Board for approval to announce to Bursa Malaysia Securities Berhad.
• ReviewedtheExternalAuditor’sscopeofworkandauditplanforthefinancial year.
• Held separate meetings with the External Auditors, excludingthe attendance of the Management, to discuss any problems and reservations.
• Reviewed the adequacy and effectiveness of the governance andrisk management processes as well as the internal control system through risk assessment reports from the Group Risk Management Committee and the Internal Audit Department. Significant risk issues were summarised and communicated to the Board for consideration and resolution.
• ReviewedtherelatedpartytransactionsenteredintobytheGroup.• Recommended to the Management any improvement on internal
controls, procedures and systems of the Group.
The Audit Committee monitored the implementation of the audit recommendations in subsequent meetings to obtain assurances that all key risks and control concerns have been fully addressed.
The Audit Committee Chairman also continuously engaged with Senior Management and the auditors in order to be kept informed of matters affecting the Group. Through such engagements, relevant issues were brought to the attention of the Audit Committee in a timely manner.
INTERNAL AUDIT FUNCTION
The Audit Committee is supported by an in-house Internal Audit Department in the discharge of its duties and responsibilities. The Department provides independent and objective assurance on the adequacy and effectiveness of the risk management, internal control and governance processes. The purpose, authority and responsibility of Internal Audit Department are articulated in an Internal Audit Charter.
The Internal Audit Department reviewed and evaluated the adequacy and effectiveness of the internal control system to anticipate any potential risks and recommended improvements, where necessary. The Department also assessed:
a. the Group’s compliance to its established policies and procedures, guidelines and statutory requirements;
b. reliability and integrity of financial and operational information;c. safeguarding of assets; andd. operational effectiveness and efficiency.
The Management was required to explain any purported lack of compliance pursuant to the audit reports issued. The audit reports, incorporating relevant action plans agreed with the Management, were circulated to the respective Senior Management, Business Units Head and Group Financial Controller and were reviewed by the Audit Committee.
The Internal Audit Department also conducted several special assignments and investigations requested by Management. Validation of controls based on the key risk profile identified under the Enterprise - Wide Risk Management framework were also conducted in all subsidiaries to ensure those controls are in place and adequate. The resulting report was forwarded to the Management and Audit Committee for recommendations.
A follow-up audit review was also conducted to monitor and ensure that all audit recommendations have been effectively implemented.
There were no areas of the internal audit function which were outsourced. The total cost incurred for the internal audit function of the Group for the financial year was RM569,115.
DATUK KISAI BIN RAHMATChairmanAudit Committee

S A p u RA i n d u S t R i A l B e R h A d
42
Statement on Risk Management and internal Control
RISK MANAGEMENT
The Board regards risk management as an integral part of the Group’s business operations and has oversight over this critical area through the Audit Committee.
An Enterprise - Wide Risk Management framework through the application of the Corporate Risk Scorecard (CRS) has been established for Sapura Industrial Berhad. The risk assessment and findings were identified through a combination of interviews and a facilitated workshop. The process used in the interviews and workshop provided a structured approach to assist the Board in identifying, prioritising and managing the risks. This process has been in place through out the financial year under review and up to date of this report, and has been reviewed by the Board.
The Group will continue its focus on institutionalising risk management as a business culture within the Group.
INTERNAL CONTROL
The Audit Committee assists the Board in reviewing the adequacy and integrity of the system of internal control of the Group. The Audit Committee, assisted by the Internal Audit Department carries out regular and systematic review of the system of risk management and internal control of the Group and also the extent of compliance with the Group’s operating policies and procedures.
The Internal Audit Department carries out internal control reviews on the financial and operating activities of the Group based on an annual plan that was presented and approved by the Audit Committee.
The key elements of the framework of the internal control system of the Group are as follows:
• Allmajordecisionsrequire theapprovalof theBoardandareonlymade after appropriate in-depth analysis. The Board meets regularly on a quarterly basis, and reviews the financial and operational performance of the Group.
• AllDepartmentsandDivisionsoftheGrouphaveclearlydocumentedPolicies and Procedures incorporating control and scope of responsibilities.
Main Market Listing Requirements of Bursa Malaysia Securities Berhad requires the Board of Directors (the Board) to include in their annual report a statement about state of its internal control. The revised Malaysian Code on Corporate Governance (2012) requires the Board to maintain a sound risk management framework and internal control system to safeguard shareholders’ investment and the Group’s assets.
The Board is pleased to provide the following statement, which outlines the nature and scope of its risk management and internal control during the financial year under review and up to the date of approval of this statement for inclusion in the annual report.
RESPONSIBILITY
The Board acknowledges its overall responsibility for a sound system of risk management and internal control for the Group and for reviewing its adequacy, effectiveness and integrity so as to safeguard shareholders’ investment and the Group’s assets.
However, due to inherent limitations the Board recognises that such a system is designed to manage rather than eliminate the risks of failure in achieving business objectives and they can only provide reasonable and not absolute assurance against material misstatement, fraud or loss.
The Management is responsible for implementing the Board’s policies and procedures on risk and control by identifying and assessing the risks faced and in design, operation and monitoring of suitable internal control to mitigate and control these risks.
In pursuing its responsibility, the Board has an ongoing process for identifying, evaluating and managing significant risks faced by the Group, which has been in place for the financial year under review and up to the date of approval of this statement for inclusion in the annual report and is in accordance with the “Statement on Risk Management and Internal Control: Guidelines for Directors of Listed Issuers”.

A n n u A l R e p o R t 2 0 1 5
43StRengthening CoRe BuSineSS
ADEQUACY AND EFFECTIVENESS OF RISK MANAGEMENT AND INTERNAL CONTROL SYSTEM
The Chief Executive Officer and Group Financial Controller have provided assurance to the Board that the Group’s risk management and internal control systems are operating adequately and effectively in all material aspects, to ensure the achievement of its business objectives. Taking into consideration the assurance from the Management Team, the Board is of the view that the system of risk management and internal control is satisfactory and adequate to safeguard shareholders’ investment and the Group’s assets. The Group will continue to take measures to strengthen the internal control and risk management environment.
REVIEW OF THE STATEMENT BY EXTERNAL AUDITORS
The external auditors have reviewed this Statement on Risk Management and Internal Control in accordance with the Recommended Practice Guide 5 (Revised) issued by Malaysian Institute of Accountants for inclusion in this Annual Report and reported to the Board that nothing has come to their attention that causes them to believe that the statement is inconsistent with their understanding of the process adopted by the Board in reviewing the adequacy and effectiveness of risk management and internal control within the Group.
Recommended Practice Guide 5 (Revised) does not require the external auditors to form an opinion on the adequacy and effectiveness of the risk management and internal control systems of the Group.
Statement made in accordance with a resolution of the Board of Directors dated 5 May 2015.
• AmanualcalledtheLimitofAuthority(LOA)isusedthroughouttheGroup and set out the authority limits in the areas of corporate, operation, financial and human resource. The LOA prescribes limits of authority and prohibits unfettered power within the various levels of management and Group members. The LOA may be reviewed by the Board upon the recommendation of management, to ensure its provisions are effective in managing risk and are practical for implementation.
• The Internal Audit Department independently reviews the controlprocesses implemented by management and reports its findings and recommendations to the Audit Committee for presentation to the Board.
• TheAuditCommittee,onbehalfoftheBoard,regularlyreviewsandholds discussion with management on the action taken on internal control issues identified in various reports prepared by the Internal Audit Department, the external auditors and the management.
• AnAnnualBudgetandBusinessPlanispreparedandadoptedbytheBoard to facilitate the Group in its business and financial performance. The Board reviews and monitors the achievements of the Group’s performance on a quarterly basis.
• WeeklyGroupManagementCommitteeMeetingsattendedbySeniorManagement Team and chaired by the Chief Executive Officer to deliberate on business, financial and operational issues which include reviewing and approving all key business strategic measures and policies. Progress status of any internal control measures recommended to the business units during the course of internal audit was also reviewed.
• MonthlyOperationalPerformanceMeetingsatGroupandCompanylevels attended by respective Business Unit Heads and chaired by the Chief Executive Officer to review operational performance and issues including progress of ongoing initiatives.

S A p u RA i n d u S t R i A l B e R h A d
44
Additional Compliance informationpursuant to paragraph 9.25 of the Main Market listing Requirements of Bursa Malaysia Securities Berhad
7. NON-AUDIT FEES
Apart from the annual audit fees, there were non-audit fees amounting to Ringgit Malaysia Six Thousand (RM6,000) paid to Messrs Ernst & Young during the financial year under review.
8. PROFIT ESTIMATION, FORECAST OR PROJECTION There were no profit estimation, forecast or projection made or
released by the Company during the financial year under review.
9. PROFIT GUARANTEES
There were no profit guarantees given by the Company during the financial year under review.
10. IMPOSITION OF SANCTIONS AND/OR PENALTIES
There were no sanctions and/or penalties imposed on the Company and/or its subsidiaries, Directors or Management arising from any significant breach of rules/guidelines/legislations by any of the regulatory authorities.
11. VARIATION IN RESULTS There was no variation in results (differing by 10% or more) from
unaudited results announced.
1. MATERIAL CONTRACTS
There were no material contracts entered into by the Company and/or its subsidiary companies involving the Company’s directors and/or major shareholders’ interests either still subsisting at the end of financial year, or which were entered into since the end of the previous financial year.
2. MATERIAL CONTRACTS RELATED TO LOAN
There were no material contracts related to loans entered into by the Company and/or its subsidiary companies involving the Company’s directors and/or major shareholder’s interests during the financial year under review.
3. RECURRENT RELATED PARTY TRANSACTIONS ENTERED INTO DURING FINANCIAL YEAR ENDED 31 JANUARY 2015 PURSUANT TO SHAREHOLDERS’ MANDATE
Shareholder’s mandate was not required to be procured for recurrent related party transactions entered into during financial year ended 31 January 2015.
4. SHARE BUY-BACKS
There were no share buy-back exercises undertaken by the Company during the financial year under review.
5. OPTIONS, WARRANTS OR CONVERTIBLE SECURITIES
The Company has not issued any options, warrants or convertible securities during the financial year under review.
6. AMERICAN DEPOSITORY RECEIPT (ADR) OR GLOBAL DEPOSITORY RECEIPT (GDR)
There were no ADR or GDR programmes sponsored by the Company during the financial year under review.

A n n u A l R e p o R t 2 0 1 5
45StRengthening CoRe BuSineSS
Statement of directors’ Responsibility in Respect of the Audited Financial Statementspursuant to paragraph 15.26(a) of the Main Market listing Requirements of Bursa Malaysia Securities Berhad
The Directors are responsible for the preparation of the audited financial statements for each financial year in accordance with the applicable approved accounting standards in Malaysia and give a true and fair view of the state of affairs of the Group and of the Company at the end of the financial year and of the results and the cash flow of the Group and of the Company for the financial year.
In preparing the financial statements of the Group and of the Company, the Directors have adopted appropriate accounting policies and applied them consistently and prudently. The Directors have also ensured that those applicable accounting standards have been followed and confirmed that the financial statements have been prepared on a going concern basis.
The Directors are responsible for ensuring that the Company keeps accounting records which disclose with reasonable accuracy the financial position of the Group and of the Company and which enable them to ensure that the financial statements are in compliance with the provisions of the Companies Act, 1965.
The Directors are also responsible for taking such steps that are reasonably open to them to safeguard the assets of the Group and to prevent and detect fraud and other irregularities.

46
S A p u RA i n d u S t R i A l B e R h A d

A n n u A l R e p o R t 2 0 1 5
47StRengthening CoRe BuSineSS
Financial Statements
Directors’ Report 48
Statement by Directors 51
Statutory Declaration 51
Independent Auditors’ Report 52
Statements of Comprehensive Income 54
Statements of Financial Position 55
Consolidated Statement of Changes in Equity 56
Company Statement of Changes in Equity 57
Statements of Cash Flows 58
Notes to the Financial Statements 60
Supplementary Information - Breakdown of Retained 109 Profits/(Accumulated Losses) into Realised and Unrealised

S A p u RA i n d u S t R i A l B e R h A d
48
directors’ Report
The directors have pleasure in presenting their report together with the audited financial statements of the Group and of the Company for the financial year ended 31 January 2015.
PRINCIPAL ACTIVITIES
The principal activities of the Company are investment holding and the provision of management services to its subsidiaries.
The principal activities of the subsidiaries are described in Note 15 to the financial statements.
There have been no significant changes in the nature of the principal activities during the financial year.
RESULTS
Group Company RM RM
Profit net of tax 8,024,479 4,897,134
Attributable to:Owners of the parent 8,244,208 4,897,134Non-controlling interest (219,729 ) –
8,024,479 4,897,134
There were no material transfers to or from reserves or provisions during the financial year other than as disclosed in the financial statements.
In the opinion of the directors, the results of the operations of the Group and of the Company during the financial year were not substantially affected by any item, transaction or event of a material and unusual in nature.
DIVIDENDS
The amounts of dividends paid by the Company since 31 January 2014 were as follows:
RM
In respect of the financial year ended 31 January 2014:
Final single tier dividend of 8% on 72,775,737 ordinary shares, declared on 18 June 2014 and paid on 23 July 2014 5,822,059
In respect of the financial year ended 31 January 2015:
Interim single tier dividend of 3% on 72,775,737 ordinary shares, declared on 9 December 2014 and paid on 22 January 2015 2,183,272
At the forthcoming Annual General Meeting, a final single tier dividend in respect of the financial year ended 31 January 2015 of 3% on 72,775,737 ordinary shares, amounting to a dividend payable of RM2,183,272 (3 sen net per ordinary share) will be proposed for shareholders’ approval. The financial statements for the current financial year do not reflect this proposed dividend. Such dividend, if approved by the shareholders will be accounted for in equity as an appropriation of distributable reserves in the financial year ending 31 January 2016.

A n n u A l R e p o R t 2 0 1 5
49StRengthening CoRe BuSineSS
DIRECToRS
The names of the directors of the Company in office since the date of the last report and at the date of this report are:
Tan Sri Dato’ Seri Ir. Shamsuddin bin Abdul KadirTan Sri Dato’ Seri Shahril bin ShamsuddinDato’ Shahriman bin ShamsuddinDato’ Azlan bin HashimDatuk Kisai bin RahmatMd. Shah bin HussinWan Ahamad Sabri bin Wan DaudAzmi bin Hashim (alternate director to Dato’ Azlan bin Hashim)
DIRECToRS’ bENEfITS
Neither at the end of the financial year, nor at any time during that year, did there subsist any arrangement to which the Company was a party, whereby the directors might acquire benefits by means of the acquisition of shares in or debentures of the Company or any other body corporate.
Since the end of the previous financial year, no director has received or become entitled to receive a benefit (other than benefits included in the aggregate amount of emoluments received or due and receivable by the directors or the fixed salary of a full-time employee of the Company as shown in Note 9 to the financial statements or other than benefits included in remuneration as director and/or employee of related corporations) by reason of a contract made by the Company or a related corporation with any director or with a firm of which the director is a member, or with a company in which the director has a substantial financial interest, except as disclosed in Note 28 to the financial statements.
DIRECToRS’ INTERESTS
According to the register of directors’ shareholdings, the interests of directors in office at the end of the financial year in shares and options over shares in the Company and its related corporations during the financial year were as follows:
Number of ordinary shares of RM1 each At At 1.2.2014 Acquired Sold 31.1.2015
The Company
Sapura Industrial berhad
Direct interest:Tan Sri Dato’ Seri Ir. Shamsuddin bin Abdul Kadir 34,081,641 90,498 – 34,172,139Tan Sri Dato’ Seri Shahril bin Shamsuddin 1,426,875 – – 1,426,875Dato’ Shahriman bin Shamsuddin 663,175 – – 663,175Md. Shah bin Hussin (includes shares held by an associate) 90,498 – (90,498 ) –
None of the other directors in office at the end of the financial year had any interest in shares and options over shares in the Company or its related corporations during the financial year.

S A p u RA i n d u S t R i A l B e R h A d
50
oThER STATUToRy INfoRMATIoN
(a) Before the statements of comprehensive income and statements of financial position of the Group and of the Company were made out, the directors took reasonable steps:
(i) to ascertain that proper action had been taken in relation to the writing off of bad debts and the making of provision for doubtful debts and satisfied themselves that all known bad debts have been written off and that adequate provision had been made for doubtful debts; and
(ii) to ensure that any current assets which were unlikely to realise their values as shown in the accounting records in the ordinary course of business had been written down to an amount which they might be expected so to realise.
(b) At the date of this report, the directors are not aware of any circumstances which would render:
(i) the amount written off for bad debts or the amount of the provision for doubtful debts in the financial statements of the Group and of the Company inadequate to any substantial extent; and
(ii) the values attributed to the current assets in the financial statements of the Group and of the Company misleading.
(c) At the date of this report, the directors are not aware of any circumstances which have arisen which would render adherence to the existing method of valuation of assets or liabilities of the Group and of the Company misleading or inappropriate.
(d) At the date of this report, the directors are not aware of any circumstances not otherwise dealt with in this report or financial statements of the Group and of the Company which would render any amount stated in the financial statements misleading.
(e) As at the date of this report, there does not exist:
(i) any charge on the assets of the Group or of the Company which has arisen since the end of the financial year which secures the liabilities of any other person; or
(ii) any contingent liability of the Group or of the Company which has arisen since the end of the financial year.
(f) In the opinion of the directors:
(i) no contingent or other liability has become enforceable or is likely to become enforceable within the period of twelve months after the end of the financial year which will or may affect the abilities of the Group or of the Company to meet their obligations when they fall due; and
(ii) no item, transaction or event of a material and unusual nature has arisen in the interval between the end of the financial year and the date of this report which is likely to affect substantially the results of the operations of the Group or of the Company for the financial year in which this report is made.
AUDIToRS
The auditors, Ernst & Young, have expressed their willingness to continue in office.
Signed on behalf of the Board in accordance with a resolution of the directors dated on 5 May 2015.
DATuK KISAI BIN RAHMAT MD. SHAH BIN HuSSIN
directors’ Report (cont’d)

A n n u A l R e p o R t 2 0 1 5
51StRengthening CoRe BuSineSS
We, Datuk Kisai bin Rahmat and Md. Shah bin Hussin, being two of the directors of Sapura Industrial Berhad, do hereby state that, in the opinion of the directors, the accompanying financial statements set out on pages 54 to 109 are drawn up in accordance with Malaysian Financial Reporting Standards, International Financial Reporting Standards and the Companies Act, 1965 in Malaysia so as to give a true and fair view of the financial position of the Group and of the Company as at 31 January 2015 and of their financial performance and cash flows for the year then ended.
The information set out in Note 32 on page 109 to the financial statements have been prepared in accordance with the Guidance on Special Matter No.1, Determination of Realised and unrealised Profits or Losses in the Context of Disclosure Pursuant to Bursa Malaysia Securities Berhad Listing Requirements, issued by the Malaysian Institute of Accountants.
Signed on behalf of the Board in accordance with a resolution of the directors dated 5 May 2015.
DATuK KISAI BIN RAHMAT MD. SHAH BIN HuSSIN
I, Liyana Lee binti Abdullah, being the officer primarily responsible for the financial management of Sapura Industrial Berhad, do solemnly and sincerely declare that the accompanying financial statements set out on pages 54 to 109 are in my opinion correct, and I make this solemn declaration conscientiously believing the same to be true and by virtue of the provisions of the Statutory Declarations Act, 1960.
LIYANA LEE BINTI ABDuLLAH
Before me,
Statement by directorspursuant to Section 169(15) of the Companies Act, 1965
Statutory declarationpursuant to Section 169(16) of the Companies Act, 1965
Subscribed and solemnly declared by the abovenamed Liyana Lee binti Abdullah at Hentian Kajang in Selangor Darul Ehsan on 5 May 2015

S A p u RA i n d u S t R i A l B e R h A d
52
REPoRT oN ThE fINANCIAL STATEMENTS
We have audited the financial statements of Sapura Industrial Berhad, which comprise the statements of financial position as at 31 January 2015 of the Group and of the Company, and the statements of comprehensive income, statements of changes in equity and statements of cash flows of the Group and of the Company for the year then ended, and a summary of significant accounting policies and other explanatory information, as set out on pages 54 to 109.
Directors’ responsibility for the financial statements
The directors of the Company are responsible for the preparation of financial statements so as to give a true and fair view in accordance with Malaysian Financial Reporting Standards, International Financial Reporting Standards and the requirement of the Companies Act, 1965 in Malaysia. The directors are also responsible for such internal control as the directors determine is necessary to enable the preparation of financial statements that are free from material misstatement, whether due to fraud or error.
Auditors’ responsibility
Our responsibility is to express an opinion on these financial statements based on our audit. We conducted our audit in accordance with approved standards on auditing in Malaysia. Those standards require that we comply with ethical requirements and plan and perform the audit to obtain reasonable assurance whether the financial statements are free from material misstatement.
An audit involves performing procedures to obtain audit evidence about the amounts and disclosures in the financial statements. The procedures selected depend on our judgment, including the assessment of risks of material misstatement of the financial statements, whether due to fraud or error. In making those risk assessments, we consider internal control relevant to the entity’s preparation of financial statements that give a true and fair view in order to design audit procedures that are appropriate in the circumstances, but not for the purpose of expressing an opinion on the effectiveness of the entity’s internal control. An audit also includes evaluating the appropriateness of the accounting policies used and the reasonableness of accounting estimates made by the directors, as well as evaluating the overall presentation of the financial statements.
We believe that the audit evidence we have obtained is sufficient and appropriate to provide a basis for our audit opinion.
Opinion
In our opinion, the financial statements give a true and fair view of the financial position of the Group and of the Company as of 31 January 2015 and of its financial performance and cash flows for the year then ended in accordance with Malaysian Financial Reporting Standards, International Financial Reporting Standards and the requirements of the Companies Act, 1965 in Malaysia.
REPoRT oN oThER LEGAL AND REGULAToRy REqUIREMENTS
In accordance with the requirements of the Companies Act, 1965 in Malaysia, we also report the following:
(a) In our opinion, the accounting and other records and the registers required by the Act to be kept by the Company and its subsidiaries have been properly kept in accordance with the provisions of the Act.
(b) We are satisfied that the financial statements of the subsidiaries that have been consolidated with the financial statements of the Company are in form and content appropriate and proper for the purposes of the preparation of the consolidated financial statements and we have received satisfactory information and explanations required by us for those purposes.
(c) The auditors’ reports on the financial statements of the subsidiaries were not subject to any qualification and did not include any comment required to be made under Section 174(3) of the Act.
independent Auditors’ Reportto the members of Sapura industrial Berhad (incorporated in Malaysia)

A n n u A l R e p o R t 2 0 1 5
53StRengthening CoRe BuSineSS
oThER REPoRTING RESPoNSIbILITy
The supplementary information set out in Note 32 on page 109 is disclosed to meet the requirement of Bursa Malaysia Securities Berhad. The directors are responsible for the preparation of the supplementary information in accordance with Guidance on Special Matter No. 1, Determination of Realised and unrealised Profits or Losses in the Context of Disclosure Pursuant to Bursa Malaysia Securities Berhad Listing Requirements, as issued by the Malaysian Institute of Accountants (“MIA Guidance”) and the directive of Bursa Malaysia Securities Berhad. In our opinion, the supplementary information is prepared, in all material respects, in accordance with the MIA Guidance and the directive of Bursa Malaysia Securities Berhad.
oThER MATTERS
This report is made solely to the members of the Company, as a body, in accordance with Section 174 of the Companies Act, 1965 in Malaysia and for no other purpose. We do not assume responsibility to any other person for the content of this report.
ERNST & YOuNG MuHAMMAD AFFAN BIN DAuD AF: 0039 No. 3063/02/16(J)Chartered Accountants Chartered Accountant
Kuala Lumpur, Malaysia 5 May 2015

S A p u RA i n d u S t R i A l B e R h A d
54
Statements of Comprehensive incomeFor the year ended 31 January 2015
Group Company Note 2015 2014 2015 2014 RM RM RM RM
Revenue 4 232,714,779 274,305,874 23,069,367 30,002,751 Cost of sales (193,663,847 ) (220,333,143 ) – –
Gross profit 39,050,932 53,972,731 23,069,367 30,002,751 Other income 5 3,908,312 4,393,588 2,775,433 2,631,675 Administrative expenses (28,933,127 ) (31,090,740 ) (19,638,732 ) (23,162,613 ) Selling and marketing expenses (1,289,863 ) (1,259,116 ) (862,142 ) (817,301 )Other expenses (268,176 ) (306,319 ) (16,033 ) (23,630 )
Profit from operations 12,468,078 25,710,144 5,327,893 8,630,882 Finance costs 6 (1,698,741 ) (1,964,358 ) (430,759 ) (503,540 )
Profit before tax 7 10,769,337 23,745,786 4,897,134 8,127,342 Taxation 10 (2,744,858 ) (5,740,711 ) – –
Profit net of tax, representing total comprehensive income for the year 8,024,479 18,005,075 4,897,134 8,127,342 Profit attributable to: Owners of the parent 8,244,208 18,246,879 4,897,134 8,127,342 Non-controlling interests (219,729 ) (241,804 ) – –
8,024,479 18,005,075 4,897,134 8,127,342 Earnings per share attributable to owners of the parent (sen): Basic/diluted 11 11.33 25.07
The accompanying accounting policies and explanatory notes form an integral part of the financial statements.

A n n u A l R e p o R t 2 0 1 5
55StRengthening CoRe BuSineSS
Statements of Financial positionAs at 31 January 2015
Group Company Note 2015 2014 2015 2014 RM RM RM RM
Assets
Non-current assetsProperty, plant and equipment 13 90,844,661 86,813,672 16,492,501 16,479,199 Development expenditure 14 2,756,831 2,507,192 – – Investments in subsidiaries 15 – – 28,957,878 28,957,878
93,601,492 89,320,864 45,450,379 45,437,077
Current assetsInventories 16 22,326,210 26,243,867 – – Tax recoverable 2,277,950 67,589 – –Trade and other receivables 17 51,943,379 58,267,556 20,694,714 18,204,891 Other current assets 18 2,676,744 1,768,563 130,831 77,827 Dividend receivable – – 3,750,000 8,332,000 Cash and bank balances 19 6,316,001 17,749,078 144,269 180,390
85,540,284 104,096,653 24,719,814 26,795,108
Total assets 179,141,776 193,417,517 70,170,193 72,232,185
Equity and liabilities
Current liabilities Retirement benefit obligations 20 16,970 17,194 5,256 5,256 Income tax payable – 1,217,723 – – Trade and other payables 25 31,561,753 37,592,297 32,750,324 30,077,694 Loans and borrowings 22 22,430,812 33,702,803 2,480,297 4,157,662
54,009,535 72,530,017 35,235,877 34,240,612
Net current assets 31,530,749 31,566,636 (10,516,063 ) (7,445,504 )
Non-current liabilities Retirement benefit obligations 20 4,566,601 4,437,759 1,498,871 1,564,985 Financial guarantee 21 – – 218,713 372,878 Loans and borrowings 22 11,446,825 9,133,101 502,107 230,888 Deferred tax liabilities 24 8,818,671 7,035,644 – –
24,832,097 20,606,504 2,219,691 2,168,751
Total liabilities 78,841,632 93,136,521 37,455,568 36,409,363
Net assets 100,300,144 100,280,996 32,714,625 35,822,822
Equity attributable to owners of the parentShare capital 26 72,775,737 72,775,737 72,775,737 72,775,737 Share premium 2,200,126 2,200,126 2,200,126 2,200,126 Retained profits 26,703,194 26,464,317 (42,261,238 ) (39,153,041 )
101,679,057 101,440,180 32,714,625 35,822,822 Non-controlling interests (1,378,913 ) (1,159,184 ) – –
Total equity 100,300,144 100,280,996 32,714,625 35,822,822
Total equity and liabilities 179,141,776 193,417,517 70,170,193 72,232,185
The accompanying accounting policies and explanatory notes form an integral part of the financial statements.

S A p u RA i n d u S t R i A l B e R h A d
56
Attributable to owners of the parent Non-distributable Distributable Non- Share Share Retained controlling Total Note capital premium profit Total interests equity RM RM RM RM RM RM
As at 1 february 2013 72,775,737 2,200,126 10,400,710 85,376,573 (917,380 ) 84,459,193 Total comprehensive income for the year – – 18,246,879 18,246,879 (241,804 ) 18,005,075 Dividends on ordinary shares 12 – – (2,183,272 ) (2,183,272 ) – (2,183,272 )
At 31 January 2014 72,775,737 2,200,126 26,464,317 101,440,180 (1,159,184 ) 100,280,996 As at 1 february 2014 72,775,737 2,200,126 26,464,317 101,440,180 (1,159,184 ) 100,280,996 Total comprehensive income for the year – – 8,244,208 8,244,208 (219,729 ) 8,024,479 Dividends on ordinary shares 12 – – (8,005,331 ) (8,005,331 ) – (8,005,331 )
At 31 January 2015 72,775,737 2,200,126 26,703,194 101,679,057 (1,378,913 ) 100,300,144
The accompanying accounting policies and explanatory notes form an integral part of the financial statements.
Consolidated Statement of Changes in equityFor the year ended 31 January 2015
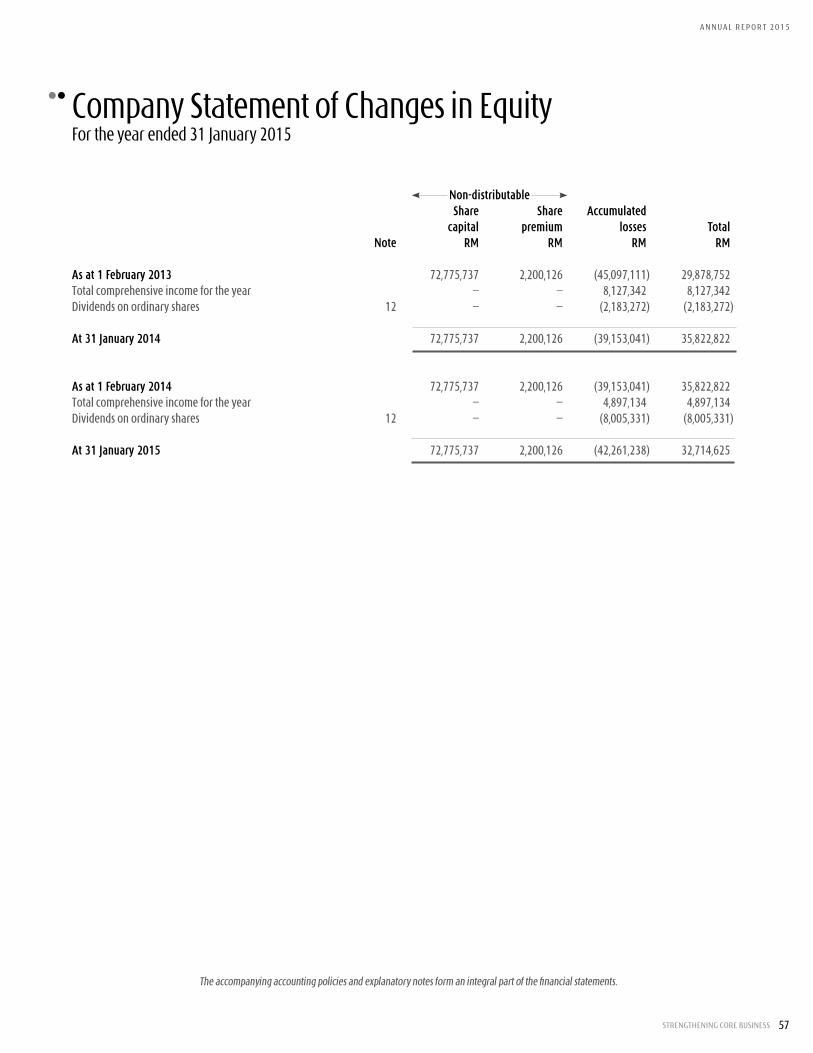
A n n u A l R e p o R t 2 0 1 5
57StRengthening CoRe BuSineSS
Non-distributable Share Share Accumulated capital premium losses Total Note RM RM RM RM
As at 1 february 2013 72,775,737 2,200,126 (45,097,111 ) 29,878,752 Total comprehensive income for the year – – 8,127,342 8,127,342 Dividends on ordinary shares 12 – – (2,183,272 ) (2,183,272 )
At 31 January 2014 72,775,737 2,200,126 (39,153,041 ) 35,822,822
As at 1 february 2014 72,775,737 2,200,126 (39,153,041 ) 35,822,822 Total comprehensive income for the year – – 4,897,134 4,897,134 Dividends on ordinary shares 12 – – (8,005,331 ) (8,005,331 )
At 31 January 2015 72,775,737 2,200,126 (42,261,238 ) 32,714,625
The accompanying accounting policies and explanatory notes form an integral part of the financial statements.
Company Statement of Changes in equityFor the year ended 31 January 2015

S A p u RA i n d u S t R i A l B e R h A d
58
Statements of Cash FlowsFor the year ended 31 January 2015
Group Company 2015 2014 2015 2014 RM RM RM RM
operating activitiesProfit before tax 10,769,337 23,745,786 4,897,134 8,127,342 Adjustments for: Depreciation of property, plant and equipment 11,731,358 15,632,042 780,740 826,202 Property, plant and equipment written off 86,200 230,111 18,556 7,937 Amortisation of development expenditure 745,597 888,710 – – Short term accumulating absences 8,924 (10,828 ) (2,652 ) 3,982 Interest income (272,877 ) (194,834 ) (159,738 ) (147,974 ) Impairment loss on other receivables – – 816,026 757,576 Write back of corporate guarantee – – (154,165 ) (148,404 ) Net unrealised loss on foreign exchange 43,476 401,031 – – Increase in liability for defined benefit plan 550,452 410,997 192,655 190,989 (Loss)/gain on disposal of property, plant and equipment 6,856 (43,606 ) 18,836 (16,745 ) Dividend income – – (3,750,000 ) (8,100,000 ) Inventories written off 604,308 179,137 – – Interest expense 1,698,741 1,964,358 430,759 503,540 Impairment loss on development expenditure – 34,584 – –
Operating profit before working capital changes 25,972,372 43,237,488 3,088,151 2,004,445 Decrease/(increase) in inventories 3,313,349 (2,171,227 ) – – Decrease/(increase) in trade and other receivables 6,272,727 (7,859,549 ) (3,288,539 ) (4,874,730 ) (Increase)/decrease in other current assets (960,581 ) 612,251 (347,853 ) 236,041 (Decrease)/increase in trade and other payables (6,816,588 ) 722,952 2,456,206 (306,021 )
Cash generated from/(used in) operations 27,781,279 34,541,915 1,907,965 (2,940,265 ) Interest paid (1,698,741 ) (1,964,358 ) (430,759 ) (503,540 ) Taxes paid (4,389,915 ) (5,600,699 ) – – Retirement benefits paid (421,834 ) (143,772 ) (258,769 ) (41,011 )
Net cash generated from/(used in) operating activities 21,270,789 26,833,086 1,218,437 (3,484,816 )

A n n u A l R e p o R t 2 0 1 5
59StRengthening CoRe BuSineSS
Group Company 2015 2014 2015 2014 RM RM RM RM
Investing activities Dividend received – – 8,100,000 9,900,000 Purchase of property, plant and equipment (15,056,771 ) (12,141,696 ) (106,029 ) (201,602 )Interest received 272,877 194,834 138,446 126,682 Proceeds from disposal of property, plant and equipment 38,862 410,007 24,502 18,251 Development expenditure incurred (995,236 ) (807,476 ) – –
Net cash (used in)/generated from investing activities (15,740,268 ) (12,344,331 ) 8,156,919 9,843,331
financing activitiesNet repayment of term loans (1,591,382 ) (7,852,539 ) (666,640 ) (1,333,344 )Net drawdown/(repayment) of short term borrowings (7,380,209 ) 3,957,952 (1,000,000 ) (2,800,000 )Net repayment of hire purchase and lease financing 218,949 (530,324 ) 260,494 (390,041 )Dividends on ordinary shares (8,005,331 ) (2,183,272 ) (8,005,331 ) (2,183,272 )
Net cash used in financing activities (16,757,973 ) (6,608,183 ) (9,411,477 ) (6,706,657 )
Net (decrease)/increase in cash and cash equivalents (11,227,452 ) 7,880,572 (36,121 ) (348,142 )Cash and cash equivalents at beginning of year 17,253,938 9,373,366 180,390 528,532
Cash and cash equivalents at end of year (Note 19) 6,026,486 17,253,938 144,269 180,390
The accompanying accounting policies and explanatory notes form an integral part of the financial statements.

S A p u RA i n d u S t R i A l B e R h A d
60
notes to the Financial Statements31 January 2015
1. CoRPoRATE INfoRMATIoN
Sapura Industrial Berhad (“the Company”) is a public limited liability company incorporated and domiciled in Malaysia, and is listed on the Main Market of Bursa Malaysia Securities Berhad (“Bursa Malaysia”). The registered office of the Company is located at Lot 2 & 4, Jalan P/11 Seksyen 10, Kawasan Perindustrian Bangi, 43650 Bandar Baru Bangi, Selangor.
The principal activities of the Company are investment holding and the provision of management services to its subsidiaries. The principal activities of the subsidiaries are disclosed in Note 15.
There have been no significant changes in the nature of the principal activities during the financial year.
2. SIGNIfICANT ACCoUNTING PoLICIES
2.1 basis of preparation
The financial statements of the Group and the Company have been prepared in accordance with Malaysian Financial Reporting Standards (“MFRS”) as issued by Malaysian Accounting Standards Board (“MASB”), International Financial Reporting Standards (“IFRS”) as issued by the International Accounting Standards Board, and the Companies Act, 1965 in Malaysia.
The financial statements of the Group and of the Company have been prepared under the historical cost basis except as disclosed in the accounting policies below.
The financial statements are presented in Ringgit Malaysia (“RM”) except when otherwise indicated.
As of 1 February 2014, the Group and the Company have adopted new, amendments and revised MFRS (collectively referred to as “pronouncements”) that have been issued by the Malaysian Accounting Standard Board (“MASB”) as described fully in Note 2.2.
2.2 Changes in accounting policies
On 1 February 2014, the Group and the Company adopted the following new and amended MFRS and IC Interpretations mandatory for annual financial periods beginning on or after 1 January 2014.
Effective for annual period beginning on or after
Description
Amendments to MFRS 132: Offsetting Financial Assets and Financial Liabilities 1 January 2014 Amendments to MFRS 10, MFRS 12 and MFRS 127: Investment Entities 1 January 2014 Amendments to MFRS 136: Recoverable Amount Disclosures for Non-Financial Assets 1 January 2014 Amendments to MFRS 139: Novation of Derivatives and Continuation of Hedge Accounting 1 January 2014 IC Interpretation 21 Levies 1 January 2014
The adoption of the above Amendments to MFRS and IC Interpretation did not have any significant financial impact to the Group and the Company.

A n n u A l R e p o R t 2 0 1 5
61StRengthening CoRe BuSineSS
2. SIGNIfICANT ACCoUNTING PoLICIES (CoNT’D)
2.3 New and revised pronouncements yet in effect
The following pronouncements that have been issued by the MASB will become effective in future financial reporting periods and have not been adopted by the Group and/or the Company:
Effective for annual periods beginning on or after 1 July 2014
Amendments to MFRS 3 Business Combinations (Annual Improvements 2010-2012 Cycle and 2011-2013 Cycle) Amendments to MFRS 8 Operating Segments (Annual Improvements 2010-2012 Cycle) Amendments to MFRS 13 Fair Value Measurement (Annual Improvements 2011-2013 Cycle)
Amendments to MFRS 116 Property, Plant and Equipment (Annual Improvements 2010-2012 Cycle Amendments to MFRS 119 Employee Benefits - Defined Benefit Plans: Employee Contributions Amendments to MFRS 124 Related Party Disclosures (Annual Improvements 2010-2012 Cycle) Amendments to MFRS 138 Intangible Assets (Annual Improvements 2010-2012 Cycle) Amendments to MFRS 140 Investment Property (Annual Improvements 2010-2013 Cycle)
Effective for annual periods beginning on or after 1 January 2016
Amendments to MFRS 5 Non-current Assets Held for Sale and Discontinued Operations (Annual Improvement 2012-2014 Cycle)
Amendments to MFRS 7 Financial Instruments: Disclosures (Annual Improvements 2012-2014 Cycle) Amendments to MFRS 10 Consolidated Financial Statements: Sale or Contribution of Assets between an Investor and its Associate or Joint Venture Amendments to MFRS 11 Joint Arrangements: Accounting for Acquisition of Interests in Joint Operations Amendments to MFRS 116 Property, Plant and Equipment: Clarification of Acceptable Methods of Depreciation and Amortisation
Amendments to MFRS 119 Employee Benefits (Annual Improvements 2012-2014 Cycle) Amendments to MFRS 127 Separate Financial Statements: Equity Method in Separate Financial Statements Amendments to MFRS 128 Amendments to MFRS 128 Investments in Associates and Joint Ventures: Sale or Contribution of Assets between an Investor and its Associate or Joint Venture Amendments to MFRS 134 Interim Financial Reporting (Annual Improvements 2012-2014 Cycle) Amendments to MFRS 138 Intangible Assets: Clarification of Acceptable Method of Depreciation and Amortisation
Amendments to MFRS 116 and MFRS 141 Agriculture: Bearer Plants Amendments to MFRS 101 Disclosure Initiatives
MFRS 14 Regulatory Deferral Accounts Amendments to MFRS 10, MFRS 12 Investment Entities: Applying the Consolidation Exception and MFRS 128
Effective for annual periods beginning on or after 1 January 2017
MFRS 15 Revenue from Contracts with Customers
Effective for annual periods beginning on or after 1 January 2018
MFRS 9 Financial Instruments (2014)
The adoption of the above pronouncements is not expected to have material impact on the financial statements of the Group and the Company.

S A p u RA i n d u S t R i A l B e R h A d
62
2. SIGNIfICANT ACCoUNTING PoLICIES (CoNT’D)
2.4 basis of consolidation
The consolidated financial statements comprise the financial statements of the Company and its subsidiaries as at the reporting date. The financial statements of the subsidiaries used in the preparation of the consolidated financial statements are prepared for the same reporting date as the Company. Consistent accounting policies are applied to like transactions and events in similar circumstances.
The Company controls an investee if and only if the Company has the following:
(i) Power over the investee (i.e. existing rights that give it the current ability to direct the relevant activities of the investee);
(ii) Exposure, or rights, to variable returns from its investment with the investee; and
(iii) The ability to use its power over the investee to affect its returns
When the Company has less than a majority of the voting rights of an investee, the Company considers the following in assessing whether or not the Company’s voting rights in an investee are sufficient to give it power over the investee:
(i) The size of the Company’s holding of voting rights relative to the size and dispersion of holdings of the other vote holders;
(ii) Potential voting rights held by the Company, other vote holders or other parties;
(iii) Rights arising from other contractual arrangements; and
(iv) Any additional facts and circumstances that indicate that the Company has, or does not have, the current ability to direct the relevant activities at the time that decisions need to be made, including voting patterns at previous shareholders’ meetings.
Subsidiaries are consolidated when the Company obtains control over the subsidiary and ceases when the Company loses control of the subsidiary. All intra-group balances, income and expenses and unrealised gains and losses resulting from intra-group transactions are eliminated in full.
Changes in the Group’s ownership interests in subsidiaries that do not result in the Group losing control over the subsidiaries are accounted for as equity transactions. The carrying amounts of the Group’s interests and the non-controlling interests are adjusted to reflect the changes in their relative interests in the subsidiaries. The resulting difference is recognised directly in equity and attributed to owners of the Company.
2.5 Transactions with non-controlling interests
Non-controlling interest at the reporting period, being the portion of the net assets of the subsidiaries attributable to equity interest that are not owned by the Company, whether directly or indirectly through subsidiaries, are presented in the consolidated statements of financial position and statement of changes in equity within equity, separately from equity attributable to the equity shareholders of the Company. Profit or loss and each component of other comprehensive income (OCI) are attributed to the equity holders of the parent of the Group and to the non-controlling interests, even if this results in the non-controlling interests having a deficit balance.
notes to the Financial Statements (cont’d)31 January 2015

A n n u A l R e p o R t 2 0 1 5
63StRengthening CoRe BuSineSS
2. SIGNIfICANT ACCoUNTING PoLICIES (CoNT’D)
2.6 Foreign currency
(a) functional and presentation currency
The individual financial statements of each entity in the Group are measured using the currency of the primary economic environment in which the entity operates (“the functional currency”). The consolidated financial statements are presented in Ringgit Malaysia, which is also the Company’s functional currency.
(b) foreign currency transactions
Transactions in foreign currencies are measured in the respective functional currencies of the Company and its subsidiaries and are recorded on initial recognition in the functional currencies at exchange rates approximating those ruling at the transaction dates. Monetary assets and liabilities denominated in foreign currencies are translated at the rate of exchange ruling at the reporting date. Non-monetary items denominated in foreign currencies that are measured at historical cost are translated using the exchange rates as at the dates of the initial transactions. Non-monetary items denominated in foreign currencies measured at fair value are translated using the exchange rates at the date when the fair value was determined.
Exchange differences arising on the settlement of monetary items or on translating monetary items at the reporting date are recognised in profit or loss except for exchange differences arising on monetary items that form part of the Group’s net investment in foreign operations, which are recognised initially in other comprehensive income and accumulated under foreign currency translation reserve in equity. The foreign currency translation reserve is reclassified from equity to profit or loss of the Group on disposal of the foreign operation.
Exchange differences arising on the translation of non-monetary items carried at fair value are included in profit or loss for the period except for the differences arising on the translation of non-monetary items in respect of which gains and losses are recognised directly in equity. Exchange differences arising from such non-monetary items are also recognised directly in equity.
2.7 Property, plant and equipment and depreciation
All items of property, plant and equipment are initially recorded at cost. The cost of an item of property, plant and equipment is recognised as an asset if, and only if, it is probable that future economic benefits associated with the item will flow to the Group and the Company and the cost of the item can be measured reliably.
Subsequent to recognition, property, plant and equipment are stated at cost less accumulated depreciation and accumulated impairment losses. When significant parts of property, plant and equipment are required to be replaced in intervals, the Group and the Company recognises such parts as individual assets with specific useful lives and depreciation, respectively. Likewise, when a major inspection is performed, its cost is recognised in the carrying amount of the property, plant and equipment as a replacement if the recognition criteria are satisfied. All other repair and maintenance costs are recognised in profit or loss as incurred.
Leasehold lands are depreciated over the period of the respective leases of 99 years. Depreciation is computed on a straight-line basis over the estimated useful lives of the assets at the following annual rates:
Buildings 2% Plant, machinery, electrical installation, factory equipment and application tools 10% to 33% Furniture, fixtures, office equipment, renovations, computers and motor vehicles 8% to 25%

S A p u RA i n d u S t R i A l B e R h A d
64
2. SIGNIfICANT ACCoUNTING PoLICIES (CoNT’D)
2.7 Property, plant and equipment and depreciation (cont’d)
The carrying values of property, plant and equipment are reviewed for impairment when events or changes in circumstances indicate that the carrying value may not be recoverable.
The residual value, useful life and depreciation method are reviewed at each financial year-end, and adjusted prospectively, if appropriate.
An item of property, plant and equipment is derecognised upon disposal or when no future economic benefits are expected from its use or disposal. Any gain or loss on derecognition of the asset is included in the profit or loss in the year the asset is derecognised.
2.8 Intangible assets
(a) Goodwill
Goodwill is initially measured at cost. Following initial recognition, goodwill is measured at cost less accumulated impairment losses.
For the purpose of impairment testing, goodwill acquired is allocated, from the acquisition date, to each of the Group’s cash-generating units that are expected to benefit from the synergies of the combination.
The cash-generating unit to which goodwill has been allocated is tested for impairment annually and whenever there is an indication that the cash-generating unit may be impaired, by comparing the carrying amount of the cash-generating unit, including the allocated goodwill, with the recoverable amount of the cash-generating unit. Where the recoverable amount of the cash-generating unit is less than the carrying amount, an impairment loss is recognised in the profit or loss. Impairment losses recognised for goodwill are not reversed in subsequent periods.
Where goodwill forms part of a cash-generating unit and part of the operation within that cash-generating unit is disposed of, the goodwill associated with the operation disposed of is included in the carrying amount of the operation when determining the gain or loss on disposal of the operation. Goodwill disposed of in this circumstance is measured based on the relative fair values of the operations disposed of and the portion of the cash-generating unit retained.
(b) Intangible asset - Development expenditure
Intangible assets acquired separately are measured initially at cost. The cost of intangible assets acquired in a business combination is their fair value as at the date of acquisition. Following initial acquisition, intangible assets are measured at cost less any accumulated amortisation and accumulated impairment losses.
Intangible assets with finite useful lives are amortised over the estimated useful lives and assessed for impairment whenever there is an indication that the intangible asset may be impaired. The amortisation period and the amortisation method are reviewed at least at each financial year-end. Changes in the expected useful life or the expected pattern of consumption of future economic benefits embodied in the asset is accounted for by changing the amortisation period or method, as appropriate, and are treated as changes in accounting estimates. The amortisation expense on intangible assets with finite lives is recognised in profit or loss.
Intangible assets with indefinite useful lives or not yet available for use are tested for impairment annually, or more frequently if the events and circumstances indicate that the carrying value may be impaired either individually or at the cash-generating unit level. Such intangible assets are not amortised. The useful life of an intangible asset with an indefinite useful life is reviewed annually to determine whether the useful life assessment continues to be supportable. If not, the change in useful life from indefinite to finite is made on a prospective basis.
Gains or losses arising from derecognition of an intangible asset are measured as the difference between the net disposal proceeds and the carrying amount of the asset and are recognised in profit or loss when the asset is derecognised.
notes to the Financial Statements (cont’d)31 January 2015

A n n u A l R e p o R t 2 0 1 5
65StRengthening CoRe BuSineSS
2. SIGNIfICANT ACCoUNTING PoLICIES (CoNT’D)
2.9 Impairment of non-financial assets
The Group and the Company assesses at each reporting date whether there is an indication that an asset may be impaired. If any such indication exists, or when an annual impairment assessment for an asset is required, the Group and the Company makes an estimate of the asset’s recoverable amount.
An asset’s recoverable amount is the higher of an asset’s fair value less costs to sell and its value in use. For the purpose of assessing impairment, assets are grouped at the lowest levels for which there are separately identifiable cash flows (cash-generating units (“CGu”)).
In assessing value in use, the estimated future cash flows expected to be generated by the asset are discounted to their present value using a pre-tax discount rate that reflects current market assessments of the time value of money and the risks specific to the asset. Where the carrying amount of an asset exceeds its recoverable amount, the asset is written down to its recoverable amount. Impairment losses recognised in respect of a CGu or groups of CGus are allocated first to reduce the carrying amount of any goodwill allocated to those units or groups of units and then, to reduce the carrying amount of the other assets in the unit or groups of units on a pro-rata basis. Impairment losses are recognised in profit or loss.
An assessment is made at each reporting date as to whether there is any indication that previously recognised impairment losses may no longer exist or may have decreased. A previously recognised impairment loss is reversed only if there has been a change in the estimates used to determine the asset’s recoverable amount since the last impairment loss was recognised. If that is the case, the carrying amount of the asset is increased to its recoverable amount. That increase cannot exceed the carrying amount that would have been determined, net of depreciation, had no impairment loss been recognised previously. Such reversal is recognised in profit or loss unless the asset is measured at revalued amount, in which case the reversal is treated as a revaluation increase. Impairment loss on goodwill is not reversed in a subsequent period.
2.10 Subsidiaries
Subsidiaries are entities controlled by the Company.
The financial statements of subsidiaries are included in the consolidated financial statements from the date that control commences until the date that control ceases.
Control exists when the Group is exposed,or has rights, to variable returns from its involvement with the entity and has the ability to affect those returns through its power over the entity. Potential voting rights are considered when assessing control when such rights are substantive. The Group considers it has de facto power over an investee when, despite not having the majority of voting rights, it has the current ability to direct the activities of the investee that significantly affect the investee’s return.
In the Company’s separate financial statements, investments in subsidiaries are accounted for at cost less any impairment charges. Dividends received from subsidiaries are recorded as a component of revenue in the Company’s profit or loss.
2.11 financial assets
Financial assets are recognised in the statements of financial position when, and only when, the Group and the Company become a party to the contractual provisions of the financial instrument.
When financial assets are recognised initially, they are measured at fair value, plus, in the case of financial assets not at fair value through profit or loss, directly attributable transaction costs.
The Group and the Company determine the classification of their financial assets at initial recognition, and the categories include financial assets at fair value through profit or loss, loans and receivables, held-to-maturity investments and available-for-sale financial assets. All the Group’s and Company’s financial assets are classified as loans and receivables.

S A p u RA i n d u S t R i A l B e R h A d
66
2. SIGNIfICANT ACCoUNTING PoLICIES (CoNT’D)
2.11 financial assets (cont’d)
Loans and receivables
Financial assets with fixed or determinable payments that are not quoted in an active market are classified as loans and receivables.
Subsequent to initial recognition, loans and receivables are measured at amortised cost using the effective interest method. Gains and losses are recognised in profit or loss when the loans and receivables are derecognised or impaired, and through the amortisation process.
Loans and receivables are classified as current assets, except for those having maturity dates later than 12 months after the reporting date which are classified as non-current.
A financial asset is derecognised when the contractual right to receive cash flows from the asset has expired. On derecognition of a financial asset in its entirety, the difference between the carrying amount and the sum of the consideration received and any cumulative gain or loss that had been recognised in other comprehensive income is recognised in profit or loss.
Regular way purchases or sales are purchases or sales of financial assets that require delivery of assets within the period generally established by regulation or convention in the marketplace concerned. All regular way purchases and sales of financial assets are recognised or derecognised on the trade date, the date that the Group and the Company commit to purchase or sell the asset.
The Group and the Company designate trade and other receivables and cash and bank balances as loans and receivables.
2.12 Impairment of financial assets
The Group and the Company assess at each reporting date whether there is any objective evidence that a financial asset is impaired.
(a) Trade and other receivables and other financial assets carried at amortised cost
To determine whether there is objective evidence that an impairment loss on financial assets has been incurred, the Group and the Company consider factors such as the probability of insolvency or significant financial difficulties of the debtor and default or significant delay in payments. For certain categories of financial assets, such as trade receivables, receivables that are assessed not to be impaired individually are subsequently assessed for impairment on a collective basis based on similar risk characteristics. Objective evidence of impairment for a portfolio of receivables could include the Group’s and the Company’s past experience of collecting payments, an increase in the number of delayed payments in the portfolio past the average credit period and observable changes in national or local economic conditions that correlate with default on receivables.
If any such evidence exists, the amount of impairment loss is measured as the difference between the asset’s carrying amount and the present value of estimated future cash flows discounted at the financial asset’s original effective interest rate. The impairment loss is recognised in profit or loss.
The carrying amount of the financial asset is reduced by the impairment loss directly for all financial assets with the exception of trade receivables, where the carrying amount is reduced through the use of an allowance account. When a trade receivable becomes uncollectible, it is written off against the allowance account.
If in a subsequent period, the amount of the impairment loss decreases and the decrease can be related objectively to an event occurring after the impairment was recognised, the previously recognised impairment loss is reversed to the extent that the carrying amount of the asset does not exceed its amortised cost at the reversal date. The amount of reversal is recognised in profit or loss.
notes to the Financial Statements (cont’d)31 January 2015

A n n u A l R e p o R t 2 0 1 5
67StRengthening CoRe BuSineSS
2. SIGNIfICANT ACCoUNTING PoLICIES (CoNT’D)
2.13 Cash and bank balances
Cash and bank balances comprise cash at bank and on hand, demand deposits, and short-term, highly liquid investments that are readily convertible to known amount of cash and which are subject to an insignificant risk of changes in value. These also include bank overdrafts that form an integral part of the Group’s cash management.
2.14 Inventories
Inventories are stated at the lower of cost and net realisable value. Costs incurred in bringing the inventories to their present location and condition are accounted for as follows:
– Raw materials, spares and tools and consumables: purchase costs on a weighted average basis.
– Finished goods and work-in-progress: costs of direct materials and labour and a proportion of manufacturing overheads based on normal operating capacity. These costs are assigned on a weighted average basis.
Net realisable value is the estimated selling price in the ordinary course of business less estimated costs of completion and the estimated costs necessary to make the sale.
2.15 Provisions
Provisions are recognised when the Group and the Company has a present obligation (legal or constructive) as a result of a past event, it is probable that an outflow of economic resources will be required to settle the obligation and the amount of the obligation can be estimated reliably.
Provisions are reviewed at each reporting date and adjusted to reflect the current best estimate. If it is no longer probable that an outflow of economic resources will be required to settle the obligation, the provision is reversed. If the effect of the time value of money is material, provisions are discounted using a current pre tax rate that reflects, where appropriate, the risks specific to the liability. When discounting is used, the increase in the provision due to the passage of time is recognised as a finance cost.
2.16 financial liabilities
Financial liabilities are classified according to the substance of the contractual arrangements entered into and the definitions of a financial liability.
Financial liabilities, within the scope of MFRS 139, are recognised in the statement of financial position when, and only when, the Group and the Company become a party to the contractual provisions of the financial instrument. Financial liabilities are classified as either financial liabilities at fair value through profit or loss or other financial liabilities.

S A p u RA i n d u S t R i A l B e R h A d
68
2. SIGNIfICANT ACCoUNTING PoLICIES (CoNT’D)
2.16 financial liabilities (cont’d)
Other financial liabilities
The Group’s and the Company’s other financial liabilities include trade payables, other payables and loans and borrowings.
Trade and other payables are recognised initially at fair value plus directly attributable transaction costs and subsequently measured at amortised cost using the effective interest method.
Loans and borrowings are recognised initially at fair value, net of transaction costs incurred, and subsequently measured at amortised cost using the effective interest method. Borrowings are classified as current liabilities unless the Group and the Company has an unconditional right to defer settlement of the liability for at least 12 months after the reporting date.
For other financial liabilities, gains and losses are recognised in profit or loss when the liabilities are derecognised, and through the amortisation process.
A financial liability is derecognised when the obligation under the liability is extinguished. When an existing financial liability is replaced by another from the same lender on substantially different terms, or the terms of an existing liability are substantially modified, such an exchange or modification is treated as a derecognition of the original liability and the recognition of a new liability, and the difference in the respective carrying amounts is recognised in profit or loss.
2.17 financial guarantee contracts
A financial guarantee contract is a contract that requires the issuer to make specified payments to reimburse the holder for a loss it incurs because a specified debtor fails to make payment when due.
Financial guarantee contracts are recognised initially as a liability at fair value, net of transaction costs. Subsequent to initial recognition, financial guarantee contracts are recognised as income in profit or loss over the period of the guarantee. If the debtor fails to make payment relating to financial guarantee contract when it is due and the Group and the Company, as the issuer, is required to reimburse the holder for the associated loss, the liability is measured at the higher of the best estimate of the expenditure required to settle the present obligation at the reporting date and the amount initially recognised less cumulative amortisation.
2.18 borrowing costs
Borrowing costs are capitalised as part of the cost of a qualifying asset if they are directly attributable to the acquisition, construction or production of that asset. Capitalisation of borrowing costs commences when the activities to prepare the asset for its intended use or sale are in progress and the expenditures and borrowing costs are incurred. Borrowing costs are capitalised until the assets are substantially completed for their intended use or sale.
All other borrowing costs are recognised in profit or loss in the period they are incurred. Borrowing costs consist of interest and other costs that the Group and the Company incurred in connection with the borrowing of funds.
notes to the Financial Statements (cont’d)31 January 2015

A n n u A l R e p o R t 2 0 1 5
69StRengthening CoRe BuSineSS
2. SIGNIfICANT ACCoUNTING PoLICIES (CoNT’D)
2.19 Employee benefits
(a) Short term benefits
Wages, salaries, bonuses and social security contributions are recognised as an expense in the year in which the associated services are rendered by employees. Short term accumulating compensated absences such as paid annual leave are recognised when services are rendered by employees that increase their entitlement to future compensated absences. Short term non-accumulating compensated absences such as sick leave are recognised when the absences occur.
(b) Defined contribution plans
The Group and the Company participates in the national pension schemes as defined by the laws of the countries in which it has operations. The Malaysian companies in the Group make contributions to the Employees Provident Fund in Malaysia, a defined contribution pension scheme. Contributions to defined contribution pension schemes are recognised as an expense in the period in which the related service is performed.
(c) Defined benefit plan
The Group operates an unfunded, defined benefit Retirement Benefit Scheme (“the Scheme”) for its eligible employees. The Group’s obligation under the Scheme, calculated using the Projected unit Credit Method, is determined based on actuarial computations by independent actuaries, through which the amount of benefit that employees have earned in return for their service in the current and prior years is estimated. That benefit is discounted in order to determine its present value. Actuarial gains and losses are recognised immediately through other comprehensive income in order for the net pension asset or liability recognised in the consolidated statement of financial position to reflect the full value of the plan deficit or surplus. Past service costs are recognised immediately to the extent that the benefits are already vested, and otherwise are amortised on a straight-line basis over the average period until the amended benefits become vested.
The amount recognised in the statements of financial position represents the present value of the defined benefit obligations adjusted for unrecognised past service costs, and reduced by the fair value of plan assets. Any asset resulting from this calculation is limited to the net total of any past service costs, and the present value of any economic benefits in the form of refunds or reductions in future contributions to the plan.
2.20 Leases
(a) As lessee
Finance leases, which transfer to the Group substantially all the risks and rewards incidental to ownership of the leased item, are capitalised at the inception of the lease at the fair value of the leased asset or, if lower, at the present value of the minimum lease payments. Any initial direct costs are also added to the amount capitalised. Lease payments are apportioned between the finance charges and reduction of the lease liability so as to achieve a constant rate of interest on the remaining balance of the liability. Finance charges are charged to profit or loss. Contingent rents, if any, are charged as expenses in the periods in which they are incurred.
Leased assets are depreciated over the estimated useful life of the asset. However, if there is no reasonable certainty that the Group will obtain ownership by the end of the lease term, the asset is depreciated over the shorter of the estimated useful life and the lease term.
Operating lease payments are recognised as an expense in profit or loss on a straight-line basis over the lease term. The aggregate benefit of incentives provided by the lessor is recognised as a reduction of rental expense over the lease term on a straight-line basis.

S A p u RA i n d u S t R i A l B e R h A d
70
2. SIGNIfICANT ACCoUNTING PoLICIES (CoNT’D)
2.20 Leases (cont’d)
(b) As lessor
Leases where the Group retains substantially all the risks and rewards of ownership of the asset are classified as operating leases. Initial direct costs incurred in negotiating an operating lease are added to the carrying amount of the leased asset and recognised over the lease term on the same bases as rental income. The accounting policy for rental income is set out in Note 2.21(e).
2.21 Revenue
Revenue is recognised to the extent that it is probable that the economic benefits will flow to the Group and the Company and the revenue can be reliably measured. Revenue is measured at the fair value of consideration received or receivable.
(a) Sale of goods
Revenue from sale of goods is recognised upon the transfer of significant risk and rewards of ownership of the goods to the customer. Revenue is not recognised to the extent where there are significant uncertainties regarding recovery of the consideration due, associated costs or the possible return of goods.
(b) Interest income
Interest income is recognised using the effective interest method.
(c) Management fees
Management fees are recognised when services are rendered.
(d) Dividend income
Dividend income is recognised when the Group’s and the Company’s right to receive payment is established.
(e) Rental income
Rental income is accounted for on a straight-line basis over the lease terms. The aggregate costs of incentives provided to lessees are recognised as a reduction of rental income over the lease term on a straight-line basis.
2.22 Income taxes
(a) Current tax
Current tax assets and liabilities are measured at the amount expected to be recovered from or paid to the taxation authorities. The tax rates and tax laws used to compute the amount are those that are enacted or substantively enacted by the reporting date.
Current taxes are recognised in profit or loss except to the extent that the tax relates to items recognised outside profit or loss, either in other comprehensive income or directly in equity.
notes to the Financial Statements (cont’d)31 January 2015

A n n u A l R e p o R t 2 0 1 5
71StRengthening CoRe BuSineSS
2. SIGNIfICANT ACCoUNTING PoLICIES (CoNT’D)
2.22 Income taxes (cont’d)
(b) Deferred tax
Deferred tax is provided using the liability method on temporary differences at the reporting date between the tax bases of assets and liabilities and their carrying amounts for financial reporting purposes.
Deferred tax liabilities are recognised for all temporary differences, except:
– where the deferred tax liability arises from the initial recognition of goodwill or of an asset or liability in a transaction that is not a business combination and, at the time of the transaction, affects neither the accounting profit nor taxable profit or loss; and
– in respect of taxable temporary differences associated with investments in subsidiaries and associate, where the timing of the reversal of the temporary differences can be controlled and it is probable that the temporary differences will not reverse in the foreseeable future.
Deferred tax assets are recognised for all deductible temporary differences, carry forward of unused tax credits and unused tax losses, to the extent that it is probable that taxable profit will be available against which the deductible temporary differences, and the carry forward of unused tax credits and unused tax losses can be utilised except:
– where the deferred tax asset relating to the deductible temporary difference arises from the initial recognition of an asset or liability in a transaction that is not a business combination and, at the time of the transaction, affects neither the accounting profit nor taxable profit or loss; and
– in respect of deductible temporary differences associated with investments in subsidiaries and associate, deferred tax assets are recognised only to the extent that it is probable that the temporary differences will reverse in the foreseeable future and taxable profit will be available against which the temporary differences can be utilised.
The carrying amount of deferred tax assets is reviewed at each reporting date and reduced to the extent that it is no longer probable that sufficient taxable profit will be available to allow all or part of the deferred tax asset to be utilised. unrecognised deferred tax assets are reassessed at each reporting date and are recognised to the extent that it has become probable that future taxable profit will allow the deferred tax assets to be utilised.
Deferred tax assets and liabilities are measured at the tax rates that are expected to apply to the year when the asset is realised or the liability is settled, based on tax rates and tax laws that have been enacted or substantively enacted at the reporting date.
Deferred tax relating to items recognised outside profit or loss is recognised outside profit or loss. Deferred tax items are recognised in correlation to the underlying transaction either in other comprehensive income or directly in equity and deferred tax arising from a business combination is adjusted against goodwill on acquisition.
Deferred tax assets and deferred tax liabilities are offset, if a legally enforceable right exists to set off current tax assets against current tax liabilities and the deferred taxes relate to the same taxable entity and the same taxation authority.

S A p u RA i n d u S t R i A l B e R h A d
72
2. SIGNIfICANT ACCoUNTING PoLICIES (CoNT’D)
2.23 Segment reporting
For management purposes, the Group is organised into operating segments based on their products and services which are independently managed by the respective segment managers responsible for the performance of the respective segments under their charge. The segment managers report directly to the management of the Company who regularly review the segment results in order to allocate resources to the segments and to assess the segment performance. Additional disclosures on each of these segments are shown in Note 31, including the factors used to identify the reportable segments and the measurement basis of segment information.
2.24 Share capital and share issuance expenses
An equity instrument is any contract that evidences a residual interest in the assets of the Group and of the Company after deducting all of its liabilities. Ordinary shares are equity instruments.
Ordinary shares are recorded at the proceeds received, net of directly attributable incremental transaction costs. Ordinary shares are classified as equity. Dividends on ordinary shares are recognised in equity in the period in which they are declared.
2.25 Contingencies
A contingent liability or asset is a possible obligation or asset that arises from past events and whose existence will be confirmed only by the occurrence or non-occurrence of uncertain future events not wholly within the control of the Group.
Contingent liabilities and assets are not recognised in the statement of financial position of the Group.
3. SIGNIfICANT ACCoUNTING JUDGEMENTS AND ESTIMATES
The preparation of the Group’s financial statements requires management to make judgements, estimates and assumptions that affect the reported amounts of revenues, expenses, assets and liabilities, and the disclosure of contingent liabilities at the reporting date. However, uncertainty about these assumptions and estimates could result in outcomes that could require a material adjustment to the carrying amount of the asset or liability affected in the future.
3.1 Judgements made in applying accounting policies
In the process of applying the Group’s accounting policies, management has made the following judgement apart from those involving estimations, which have the effect on the amounts recognised in the financial statements:
(a) Classification between investment properties and property, plant and equipment
The Group developed certain criteria in making judgement whether a property qualifies as an investment property. Investment property is a property held to earn rentals or for capital appreciation or both.
Some properties comprise a portion that is held to earn rentals or for capital appreciation and another portion that is held for use in the production or supply of goods or services or for administrative purposes. If these portions could be sold separately (or leased out separately under a finance lease), the Group would account for the portions separately. If the portions could not be sold separately, the property is an investment property only if an insignificant portion is held for use in the production or supply of goods or services or for administrative purposes. Judgement is made on an individual property basis to determine whether ancillary services are so significant that a property does not qualify as investment property.
notes to the Financial Statements (cont’d)31 January 2015

A n n u A l R e p o R t 2 0 1 5
73StRengthening CoRe BuSineSS
3. SIGNIfICANT ACCoUNTING JUDGEMENTS AND ESTIMATES
3.1 Judgements made in applying accounting policies (cont’d)
(a) Classification between investment properties and property, plant and equipment (cont’d)
The Group has sub-let portion of a building but has decided to classify the entire building as property, plant and equipment as this portion cannot be sold separately and significant portion of the building is held for use in the production or supply of goods or services or for administrative purposes.
3.2 Key sources of estimation uncertainty
The key assumptions concerning the future and other key sources of estimation uncertainty at the reporting date that have a significant risk of causing a material adjustment to the carrying amounts of assets and liabilities within the next financial year are discussed below.
(a) Write down of inventories
Inventories are written down to reflect the current net realisable value based on estimated selling price less selling and distribution costs and all other estimated costs to completion. In arriving at the net realisable value, due allowance was made for slow-moving and obsolete items.
(b) Useful lives of property, plant and machinery
The cost of property, plant and equipment is depreciated on a straight-line basis over the assets’ estimated economic useful lives. The useful lives and annual depreciation rates of these assets are disclosed in Notes 2.7. These are common life expectancies applied in the respective industries. Changes in the expected level of usage and technological developments could impact the economic useful lives and the residual values of these assets, therefore future depreciation charges could be revised. The carrying amount of the Group’s property, plant and equipment at the reporting date are disclosed in Notes 13.
(c) Deferred tax assets
Deferred tax assets are recognised for all unused tax losses, unabsorbed capital allowances and other deductible temporary differences to the extent that it is probable that taxable profit will be available against which the losses, capital allowances and other deductible temporary differences can be utilised. Significant management judgement is required to determine the amount of deferred tax assets that can be recognised, based upon the likely timing and level of future taxable profits together with future tax planning strategies. The total carrying value of recognised tax losses, capital allowances and other deductible temporary differences of the Group and of the Company were approximately RM12,046,000 (2014: RM6,920,000) and RM Nil (2014: RM565,000) respectively. The unrecognised tax losses, capital allowances, reinvestment allowances and provisions of the Group and of the Company were approximately RM105,985,000 (2014: RM98,286,000) and RM22,628,000 (2014: RM24,007,000) respectively.
(d) Impairment of loans and receivables
The Group assesses at each reporting date whether there is any objective evidence that a financial asset is impaired. To determine whether there is objective evidence of impairment, the Group considers factors such as the probability of insolvency or significant financial difficulties of the debtor and default or significant delay in payments.
Where there is objective evidence of impairment, the amount and timing of future cash flows are estimated based on historical loss experience for assets with similar credit risk characteristics. The carrying amount of the Group’s loans and receivable at the reporting date is disclosed in Note 17.

S A p u RA i n d u S t R i A l B e R h A d
74
4. REVENUE
Group Company 2015 2014 2015 2014 RM RM RM RM
Sales of goods 232,714,779 274,305,874 – – Management fees from subsidiaries – – 19,319,367 21,902,751 Dividends from subsidiaries – – 3,750,000 8,100,000 232,714,779 274,305,874 23,069,367 30,002,751
5. oThER INCoME
Included in other income are: Group Company 2015 2014 2015 2014 RM RM RM RM
Rental income 696,066 632,216 1,818,436 1,841,879 Interest income from: Deposits 272,877 194,834 – – Subsidiaries – – 159,738 147,974 Income from sales of scrap 1,918,941 1,951,418 – – Foreign exchange gain - unrealised 516,458 33,008 – – - Realised 1,555 4,404 – – Bad debts recovered – – 448,291 502,044
6. fINANCE CoSTS
Group Company 2015 2014 2015 2014 RM RM RM RM
Interests expense on: Term loans 782,324 1,044,043 8,129 63,790 Overdrafts 55,272 56,105 3,053 921 Revolving credit 502,936 552,425 218,799 307,532 Obligations under finance lease 65,585 52,246 35,781 41,676 Bankers’ acceptances 185,733 116,597 – – Letter of credits 106,891 138,585 – – Advances from subsidiaries – – 164,997 89,621 Others – 4,357 – –
1,698,741 1,964,358 430,759 503,540
notes to the Financial Statements (cont’d)31 January 2015

A n n u A l R e p o R t 2 0 1 5
75StRengthening CoRe BuSineSS
7. PRofIT bEfoRE TAx
The following items have been included in arriving at profit before tax:
Group Company 2015 2014 2015 2014 RM RM RM RM
Employee benefits expense (Note 8) 38,873,357 38,468,145 15,478,055 14,444,057 Non-executive directors’ remuneration (Note 9) 314,000 317,500 314,000 317,500 Amortisation of development expenditure (Note 14) 745,597 888,710 – – Auditors’ remuneration - Statutory audit 138,000 138,000 38,000 38,000 - Other services 6,000 6,000 6,000 6,000 Tax agent fee 111,200 91,500 13,500 11,000 Depreciation of property, plant and equipment 11,731,358 15,632,042 780,740 826,202 Foreign exchange loss - unrealised 43,476 401,031 – – - Realised 621,626 894,783 1,265 – Impairment loss on development expenditure – 34,584 – – Inventories written off 604,308 179,137 – – Property, plant and equipment written off 86,200 230,111 18,556 7,937 Loss/(gain) on disposal of property, plant and equipment 6,856 (43,606 ) 18,836 (16,745 ) Write back of corporate guarantee – – (154,165 ) (148,404 ) Impairment loss on other receivables – – 816,026 757,576 Rental expense: - Premises 506,551 503,219 1,247,402 1,258,568 - Motor vehicles 3,666 9,325 8,011 12,770 - Equipments 612,552 194,352 – – Bad debts written off – 2,857 – –
8. EMPLoyEE bENEfITS ExPENSE
Group Company 2015 2014 2015 2014 RM RM RM RM
Wages and salaries 29,745,971 29,512,187 11,737,786 10,647,080 Social security contribution 276,336 268,729 60,173 58,954 Contributions to defined contribution plan 2,900,665 2,950,394 1,319,607 1,386,159 Increase in liability for defined benefit plan (Note 20) 550,452 410,997 192,655 190,989 Short term accumulating compensated absences 8,924 (10,828) (2,652 ) 3,982 Other benefits 5,391,009 5,336,666 2,170,486 2,156,893
38,873,357 38,468,145 15,478,055 14,444,057
Included in employee benefits expense of the Group and of the Company are remuneration of executive directors of the Group and of the Company amounting to RM3,689,440 (2014: RM3,008,187) as further disclosed in Note 9.

S A p u RA i n d u S t R i A l B e R h A d
76
9. DIRECToRS’ REMUNERATIoN
Group Company 2015 2014 2015 2014 RM RM RM RM
Directors of the Company
Executive: Salaries and other emoluments 2,891,000 2,442,667 2,891,000 2,442,667 Bonus 575,000 320,000 575,000 320,000 Contributions to defined contribution plan 223,440 245,520 223,440 245,520 Benefits-in-kind 19,196 7,189 19,196 7,189
3,708,636 3,015,376 3,708,636 3,015,376 Non-Executive: Fees 265,000 265,000 265,000 265,000 Other emoluments 49,000 52,500 49,000 52,500
314,000 317,500 314,000 317,500
4,022,636 3,332,876 4,022,636 3,332,876
Analysis excluding benefits-in-kind: Total executive director’s remuneration, excluding benefits-in-kind (Note 8) 3,689,440 3,008,187 3,689,440 3,008,187 Total non-executive directors’ remuneration, excluding benefits-in-kind (Note 7) 314,000 317,500 314,000 317,500
Total directors’ remuneration excluding benefits-in-kind 4,003,440 3,325,687 4,003,440 3,325,687
The number of directors of the Company whose total remuneration during the financial year fell within the following bands is analysed below:
Number of Directors 2015 2014 Executive directors:
RM2,250,001 - RM2,300,000 – 1 RM2,050,001 - RM2,100,000 1 – RM1,600,001 - RM1,650,000 1 – RM1,450,001 - RM1,500,000 – – RM700,001 - RM750,000 – 1
Non-executive directors: RM50,001 - RM100,000 3 3 Below RM50,000 2 2
notes to the Financial Statements (cont’d)31 January 2015

A n n u A l R e p o R t 2 0 1 5
77StRengthening CoRe BuSineSS
10. TAxATIoN
Major components of income tax expense
Major components of income tax expense for the years ended 31 January 2015 and 2014 are:
Statement of comprehensive income:
Group Company 2015 2014 2015 2014 RM RM RM RM
Current income tax: Malaysia income tax 1,325,656 5,958,999 – – Overprovision in prior years (363,825 ) (215,230 ) – –
961,831 5,743,769 – –
Deferred tax (Note 24): Relating to origination and reversal of temporary differences 1,091,573 (310,044 ) – – underprovision in prior years 691,454 306,986 – –
1,783,027 (3,058) – –
2,744,858 5,740,711 – –
Domestic income tax is calculated at the Malaysian statutory tax rate of 25% (2014: 25%) of the estimated assessable profit for the year. The domestic statutory tax rate will be reduced to 24% from the current year’s rate of 25%, effective year of assessment 2016.
A reconciliation between tax expense and the product of accounting profit multiplied by the applicable corporate tax rate for the years ended 31 January 2015 and 2014 are as follows:
Group Company 2015 2014 2015 2014 RM RM RM RM
Profit before tax 10,769,337 23,745,786 4,897,134 8,127,342
Tax at Malaysian statutory tax rate of 25% (2014: 25%) 2,692,334 5,936,447 1,224,284 2,031,836 Income not subject to tax – – (937,500 ) (2,025,000 ) Effect on opening deferred tax of reduction in Malaysian income tax rate – (70,387 ) – – Expenses not deductible for tax purposes 190,512 813,890 146,577 563,829 utilisation of reinvestment allowances (953,886 ) (866,854 ) – – Deferred tax assets not recognised during the year 906,682 936,075 – – utilisation of previously unrecognised tax losses and unabsorbed capital allowances (418,413 ) (1,100,216 ) (433,361 ) (570,665 ) under/(over)provision of deferred tax expense in prior years 691,454 306,986 – – Overprovision of income tax expense in prior years (363,825 ) (215,230 ) –
2,744,858 5,740,711 – –
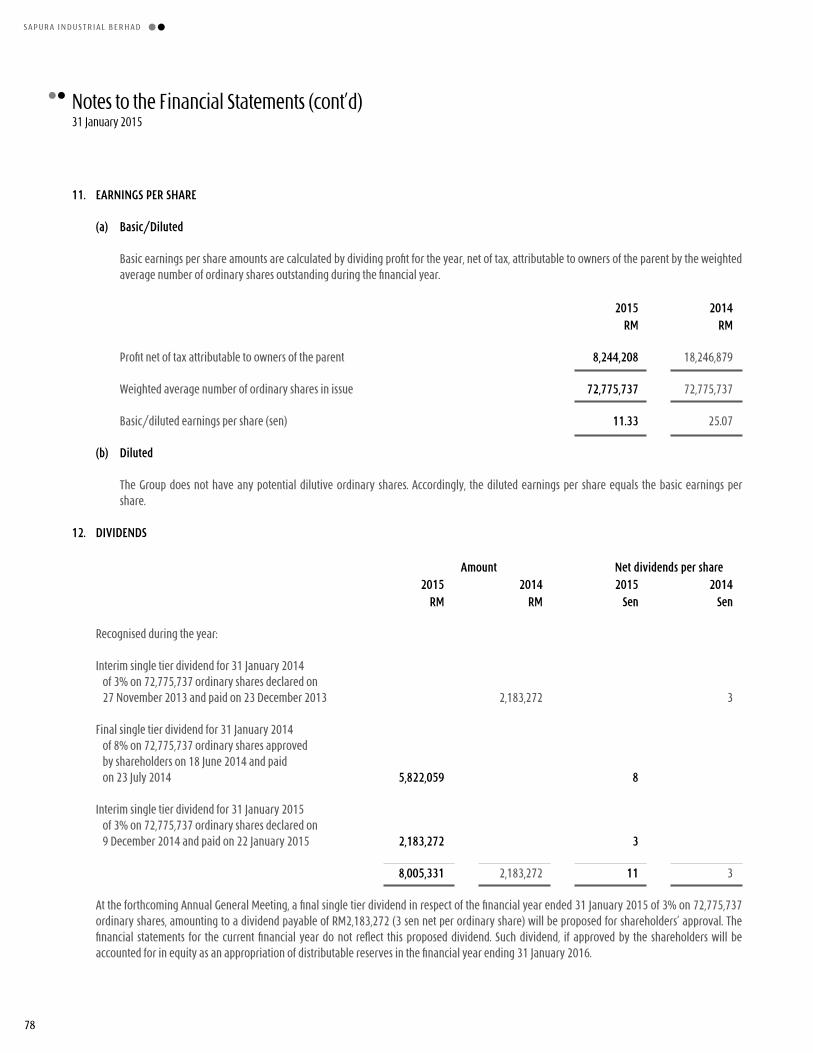
S A p u RA i n d u S t R i A l B e R h A d
78
11. EARNINGS PER ShARE
(a) basic/Diluted
Basic earnings per share amounts are calculated by dividing profit for the year, net of tax, attributable to owners of the parent by the weighted average number of ordinary shares outstanding during the financial year.
2015 2014 RM RM
Profit net of tax attributable to owners of the parent 8,244,208 18,246,879
Weighted average number of ordinary shares in issue 72,775,737 72,775,737
Basic/diluted earnings per share (sen) 11.33 25.07
(b) Diluted
The Group does not have any potential dilutive ordinary shares. Accordingly, the diluted earnings per share equals the basic earnings per share.
12. DIVIDENDS
Amount Net dividends per share 2015 2014 2015 2014 RM RM Sen Sen
Recognised during the year:
Interim single tier dividend for 31 January 2014 of 3% on 72,775,737 ordinary shares declared on 27 November 2013 and paid on 23 December 2013 2,183,272 3
Final single tier dividend for 31 January 2014 of 8% on 72,775,737 ordinary shares approved by shareholders on 18 June 2014 and paid on 23 July 2014 5,822,059 8
Interim single tier dividend for 31 January 2015 of 3% on 72,775,737 ordinary shares declared on 9 December 2014 and paid on 22 January 2015 2,183,272 3
8,005,331 2,183,272 11 3
At the forthcoming Annual General Meeting, a final single tier dividend in respect of the financial year ended 31 January 2015 of 3% on 72,775,737 ordinary shares, amounting to a dividend payable of RM2,183,272 (3 sen net per ordinary share) will be proposed for shareholders’ approval. The financial statements for the current financial year do not reflect this proposed dividend. Such dividend, if approved by the shareholders will be accounted for in equity as an appropriation of distributable reserves in the financial year ending 31 January 2016.
notes to the Financial Statements (cont’d)31 January 2015

A n n u A l R e p o R t 2 0 1 5
79StRengthening CoRe BuSineSS
13. PRoPERTy, PLANT AND EqUIPMENT
Plant, furniture, machinery, fixture, electrical office installation, equipment, factory renovation, Long term equipment and computer leasehold application and motor land building tool vehicle Total RM RM RM RM RM
Group
At 31 January 2015
Costs At 1 February 2014 24,454,624 23,642,816 221,149,822 13,134,602 282,381,864 Additions – 11,000 14,749,835 1,133,430 15,894,265 Disposals – – – (731,651 ) (731,651 )Write offs – (5,880 ) (1,740,221 ) (1,543,706 ) (3,289,807 )Reclassification – – 3,400 (3,400 ) –
At 31 January 2015 24,454,624 23,647,936 234,162,836 11,989,275 294,254,671 Accumulated depreciation and impairmentAt 1 February 2014 3,448,328 10,018,539 172,378,992 9,722,333 195,568,192 Depreciation charge for the year 249,588 471,718 9,873,879 1,136,173 11,731,358 Disposals – - (685,933 ) – (685,933 )Write offs – (1,086 ) (1,682,169 ) (1,520,352 ) (3,203,607 )Reclassification – – 850 (850 ) –
At 31 January 2015 3,697,916 10,489,171 179,885,619 9,337,304 203,410,010 Analysed as:Accumulated depreciation 3,697,916 8,304,530 144,931,471 9,161,288 166,095,205 Accumulated impairment losses – 2,184,641 34,954,148 176,016 37,314,805
3,697,916 10,489,171 179,885,619 9,337,304 203,410,010
Net carrying amount 20,756,708 13,158,765 54,277,217 2,651,971 90,844,661

S A p u RA i n d u S t R i A l B e R h A d
80
13. PRoPERTy, PLANT AND EqUIPMENT (CoNT’D)
Plant, furniture, machinery, fixture, electrical office installation, equipment, factory renovation, Long term equipment and computer leasehold application and motor land building tool vehicle Total RM RM RM RM RM
Group (cont’d)
At 31 January 2014
Costs At 1 February 2013 24,454,624 23,707,192 212,657,318 12,638,454 273,457,588 Additions – – 11,343,555 884,343 12,227,898 Disposals – – (457,287 ) (244,788 ) (702,075 ) Write offs – (64,376 ) (2,393,764 ) (143,407 ) (2,601,547 )
At 31 January 2014 24,454,624 23,642,816 221,149,822 13,134,602 282,381,864
Accumulated depreciation and impairment At 1 February 2013 3,198,740 9,458,443 161,096,621 8,889,456 182,643,260 Depreciation charge for the year 249,588 584,461 13,585,544 1,212,449 15,632,042 Disposals – – (99,179 ) (236,495 ) (335,674 ) Write offs – (24,365 ) (2,203,994 ) (143,077 ) (2,371,436 )
At 31 January 2014 3,448,328 10,018,539 172,378,992 9,722,333 195,568,192
Analysed as: Accumulated depreciation 3,448,328 7,833,898 137,424,844 9,546,317 158,253,387 Accumulated impairment losses – 2,184,641 34,954,148 176,016 37,314,805
3,448,328 10,018,539 172,378,992 9,722,333 195,568,192
Net carrying amount 21,006,296 13,624,277 48,770,830 3,412,269 86,813,672
notes to the Financial Statements (cont’d)31 January 2015

A n n u A l R e p o R t 2 0 1 5
81StRengthening CoRe BuSineSS
13. PRoPERTy, PLANT AND EqUIPMENT (CoNT’D)
furniture, fixture, office equipment, Plant, renovation, Long term machinery, computer leasehold and factory and motor land building equipment vehicle Total RM RM RM RM RM
Company
At 31 January 2015
Cost At 1 February 2014 16,571,044 2,265,637 10,423 5,062,955 23,910,059 Additions – – – 855,936 855,936 Disposal – – – (585,812 ) (585,812 ) Write offs – – – (400,502 ) (400,502 )
At 31 January 2015 16,571,044 2,265,637 10,423 4,932,577 23,779,681 Accumulated depreciation and impairment At 1 February 2014 2,237,267 1,495,219 579 3,697,795 7,430,860 Charge for the year 168,935 24,772 – 587,033 780,740 Disposal – – – (542,474 ) (542,474 ) Write offs – – – (381,946 ) (381,946 )
At 31 January 2015 2,406,202 1,519,991 579 3,360,408 7,287,180 Analysed as:
Accumulated depreciation 2,406,202 768,483 579 3,360,408 6,535,672 Accumulated impairment loss – 751,508 – – 751,508
2,406,202 1,519,991 579 3,360,408 7,287,180 Net carrying amount 14,164,842 745,646 9,844 1,572,169 16,492,501

S A p u RA i n d u S t R i A l B e R h A d
82
13. PRoPERTy, PLANT AND EqUIPMENT (CoNT’D)
furniture, fixture, office equipment, Plant, renovation, Long term machinery, computer leasehold and factory and motor land building equipment vehicle Total RM RM RM RM RM
Company (cont’d)
At 31 January 2014 Cost At 1 February 2013 16,571,044 2,265,637 11,281 5,055,983 23,903,945 Additions – – 10,942 190,660 201,602 Disposal – – – (171,270 ) (171,270 ) Write offs – – (11,800 ) (12,418 ) (24,218 )
At 31 January 2014 16,571,044 2,265,637 10,423 5,062,955 23,910,059 Accumulated depreciation and impairment At 1 February 2013 2,068,332 1,470,447 4,016 3,247,908 6,790,703 Charge for the year 168,935 24,772 616 631,879 826,202 Disposal – – – (169,764 ) (169,764 ) Write offs – – (4,053 ) (12,228 ) (16,281 )
At 31 January 2014 2,237,267 1,495,219 579 3,697,795 7,430,860 Analysed as:
Accumulated depreciation 2,237,267 743,711 579 3,697,795 6,679,352 Accumulated impairment loss – 751,508 – – 751,508
2,237,267 1,495,219 579 3,697,795 7,430,860 Net carrying amount 14,333,777 770,418 9,844 1,365,160 16,479,199
notes to the Financial Statements (cont’d)31 January 2015

A n n u A l R e p o R t 2 0 1 5
83StRengthening CoRe BuSineSS
13. PRoPERTy, PLANT AND EqUIPMENT (CoNT’D)
(a) During the financial year, the Group and the Company acquired property, plant and equipment at aggregate costs of RM15,894,265 (2014: RM12,227,898) and RM855,936 (2014: RM201,602) respectively, of which RM837,494 (2014: RM86,202) and RM749,907 (2014: RM Nil) respectively were acquired by means of finance leases.
The net carrying amounts of property, plant and equipment held under finance leases are as follows:
Group Company 2015 2014 2015 2014 RM RM RM RM
Factory equipment and machinery 659,468 767,500 – – Motor vehicle 1,144,242 822,640 913,426 546,827
1,803,710 1,590,140 913,426 546,827
Details of the terms and conditions of the finance leases are disclosed in Note 23.
(b) The net carrying amounts of property, plant and equipment pledged as securities for borrowings (Note 22) are as follows:
Group Company 2015 2014 2015 2014 RM RM RM RM
Leasehold land 1,472,068 1,488,349 – – Plant and machinery 35,037,640 30,062,593 – –
36,509,708 31,550,942 – –
(c) Included in property, plant and equipment of the Group and of the Company are the following cost of fully depreciated assets which are still in use:
Group Company 2015 2014 2015 2014 RM RM RM RM
Plant, machinery, electrical installation, factory equipment and application tool 89,554,943 67,201,062 – –
Furniture, fixture, equipment, renovation, computer and motor vehicle 7,448,847 6,260,417 1,906,247 1,291,672

S A p u RA i n d u S t R i A l B e R h A d
84
14. DEVELoPMENT ExPENDITURE
Group 2015 2014 RM RM
Cost At beginning of year 4,520,613 4,072,937 Incurred during the year 995,236 807,476 Adjustment for completed projects – (359,800 )
At end of year 5,515,849 4,520,613
Accumulated amortisation and impairment loss At beginning of year 2,013,421 1,449,927 Amortisation 745,597 888,710 Impairment loss – 34,584 Adjustment for completed projects – (359,800 )
At end of year 2,759,018 2,013,421 Net carrying amount 2,756,831 2,507,192
15. INVESTMENT IN SUbSIDIARIES
Company 2015 2014 RM RM
unquoted shares, at cost 61,439,524 61,439,524 Less: Accumulated impairment losses (32,481,646 ) (32,481,646 )
28,957,878 28,957,878
Details of the subsidiaries, all of which are incorporated in Malaysia and audited by Ernst & Young Malaysia, are as follows:
Equity interest heldName of subsidiaries Principal activities 2015 2014 % %
held by the Company
Sapura Machining Corporation Sdn. Bhd. Manufacture and sale of high value added machined products 100 100 for the automotive industry.
Asian Automotive Steels Sdn. Bhd. Manufacture and sale of stabiliser bar and cold drawn 100 100 high grade structured steel bars used in the automotive, electronics and electrical industries.
notes to the Financial Statements (cont’d)31 January 2015

A n n u A l R e p o R t 2 0 1 5
85StRengthening CoRe BuSineSS
15. INVESTMENT IN SUbSIDIARIES (CoNT’D)
Equity interest heldName of subsidiaries Principal activities 2015 2014 % %
held by the Company (cont’d)
Sapura Automotive Industries Sdn. Bhd. Manufacture and sale of coil springs, shock absorbers and 100 100 strut assemblies, constant velocity joint, axle module and front corner module assemblies for the automotive industry.
International Autoparts Sdn. Bhd. Trading of auto parts in retail/after sales market. 100 100
Automotive Specialist Centre Sdn. Bhd. Dormant. 100 100
Sapura Brake Technologies Sdn. Bhd. Manufacture, supply and sale of brake systems for the 100 100 automotive industry.
Sapura Technical Centre Sdn. Bhd. Computer aided design and computer aided manufacture 100 100 of tools, jigs and dies and engineering services in design, modifications and fabrications of sub-system/system for the application in production and testing.
Isencorp Sdn. Bhd. Dormant. 100 100
Sapura-Schulz Hydroforming Sdn. Bhd. Manufacture and sale of butt-weld fittings for oil 75 75 (“SSH”) and gas industries.
Subang Properties Sdn. Bhd. (“SPSB”) Dormant. 51.68 51.68
held by International Autoparts Sdn. bhd.
Awaltek Sdn. Bhd. Dormant. 100 100

S A p u RA i n d u S t R i A l B e R h A d
86
15. INVESTMENT IN SUbSIDIARIES (CoNT’D)
Non-controlling interests (“NCI”)
SSh SPSb Total RM RM RM 25% 48.32%
2015
NCI percentage of ownership interest and voting interest
Carrying amount of NCI (1,883,207 ) 504,294 (1,378,913 )
Loss allocated to NCI (216,633 ) (3,096 ) (219,729)
2014
NCI percentage of ownership interest and voting interest
Carrying amount of NCI (1,666,574 ) 507,390 (1,159,184 )
Loss allocated to NCI (239,891 ) (1,913 ) (241,804 )
The summarised financial information of these subsidiaries are provided below. This information is based on amounts before inter-company eliminations.
Summarised statement of profit or loss for 2015:
SSh SPSb Total RM RM RM 25% 48.32%
Revenue – – – Loss for the year, representing total comprehensive loss (866,531 ) (6,408 ) (872,939 )
Summarised statement of profit or loss for 2014:
Revenue – – – Loss for the year, representing total comprehensive loss (959,564 ) (3,959 ) (963,523 )
Summarised statement of financial position as at 31 January 2015:
Non-current assets 368,017 – 368,017 Current assets 3,214 1,047,057 1,050,271 Current liabilities 8,288,588 3,402 8,291,990 Net (liabilities)/assets (7,917,357 ) 1,043,655 (6,873,702 )
notes to the Financial Statements (cont’d)31 January 2015

A n n u A l R e p o R t 2 0 1 5
87StRengthening CoRe BuSineSS
15. INVESTMENT IN SUbSIDIARIES (CoNT’D)
Non-controlling interests (“NCI”) (cont’d)
Summarised statement of financial position as at 31 January 2014:
SSh SPSb Total RM RM RM 25% 48.32%
Non-current assets 372,087 – 372,087 Current assets 2,139 1,051,851 1,053,990 Current liabilities 7,040,522 1,789 7,042,311 Net (liabilities)/assets (6,666,296 ) 1,050,062 (5,616,234 )
Summarised statement of cash flows for 2015:
Cash flows from operating activities representing net increase in cash and cash equivalents 209,926 (20 ) 209,906
Dividend paid to NCI – – –
Summarised statement of cash flows for 2014:
Cash flows from operating activities representing net increase in cash and cash equivalents 199,208 406 199,614
Dividend paid to NCI – – –
16. INVENToRIES
Group 2015 2014 RM RM
At cost: Materials and component parts 11,725,026 12,788,878 Work-in-progress 2,150,321 2,205,846 Finished goods 4,786,905 6,540,845 Spares and tools 3,329,678 4,490,976 Consumables 334,280 217,322
22,326,210 26,243,867
During the year, the amount of inventories recognised as an expense in cost of sales Group was RM80,342,635 (2014: RM165,785,902).

S A p u RA i n d u S t R i A l B e R h A d
88
17. TRADE AND oThER RECEIVAbLES
Group Company 2015 2014 2015 2014 RM RM RM RM
Trade receivables Third parties 46,278,962 52,413,319 – – Less: Allowance for impairment third parties (78,420 ) (78,420 ) – – Trade receivables, net 46,200,542 52,334,899 – –
other receivables Amounts due from subsidiaries – – 57,322,735 54,505,843 Amounts due from related companies 156,308 124,715 91,772 86,516 Amounts due from an affiliate company 5,828,770 5,828,770 – – Refundable deposits 683,686 671,194 294,649 273,857 Other receivables 5,550,453 5,784,358 62,383 47,765 12,219,217 12,409,037 57,771,539 54,913,981 Less: Allowance for impairment Amounts due from subsidiaries – – (37,073,167 ) (36,705,432 ) Amounts due from related companies (41,857 ) (41,857 ) (3,658 ) (3,658 ) Amounts due from an affiliate company (5,828,770 ) (5,828,770 ) – – Refundable deposits (7,090 ) (7,090 ) – – Other receivables (598,663 ) (598,663 ) – – (6,476,380 ) (6,476,380 ) (37,076,825 ) (36,709,090 ) Other receivables, net 5,742,837 5,932,657 20,694,714 18,204,891 Total trade and other receivables 51,943,379 58,267,556 20,694,714 18,204,891
Total trade and other receivables 51,943,379 58,267,556 20,694,714 18,204,891
Less: Refundable deposits net of impairment (683,686 ) (664,104 ) (294,649 ) (266,767 ) Add: Dividend receivable – – 3,750,000 8,332,000 Cash and bank balances (Note 19) 6,316,001 17,749,078 144,269 180,390
Total loans and receivables 57,575,694 75,352,530 24,294,334 26,450,514
notes to the Financial Statements (cont’d)31 January 2015

A n n u A l R e p o R t 2 0 1 5
89StRengthening CoRe BuSineSS
17. TRADE AND oThER RECEIVAbLES (CoNT’D)
(a) Trade receivables
Trade receivables are non-interest bearing and the Group’s normal trade credit terms range from 30 to 90 (2014: 30 to 90) days. Other credit terms are assessed and approved on a case-by-case basis. They are recognised at their original invoice amounts which represent their fair values on initial recognition.
Ageing analysis of trade receivables
The ageing analysis of the Group’s trade receivables is as follows:
Group 2015 2014 RM RM
Neither past due nor impaired 40,780,184 49,511,109
1 to 30 days past due not impaired 3,250,516 2,352,314 31 to 60 days past due not impaired 1,502,606 124,452 61 to 90 days past due not impaired 667,236 347,024
5,420,358 2,823,790 Impaired 78,420 78,420
46,278,962 52,413,319
Receivables that are neither past due nor impaired
Trade receivables that are neither past due nor impaired are creditworthy customers with long term relationship and no history of default.
None of the Group’s trade receivables that are neither past due nor impaired have been renegotiated during the financial year.
Receivables that are past due but not impaired
The Group has trade receivables amounting to RM5,420,358 (2014: RM2,823,790) that are past due at the reporting date but not impaired. These relate mostly to customers with slower repayment patterns, with no history of default.
The trade receivables that are past due but not impaired are unsecured.

S A p u RA i n d u S t R i A l B e R h A d
90
17. TRADE AND oThER RECEIVAbLES (CoNT’D)
(a) Trade receivables (cont’d)
Receivables that are impaired
The Group’s trade receivables that are impaired at the reporting date and the movement of the allowance accounts used to record the impairment are as follows:
Group 2015 2014 RM RM
Trade receivables: Nominal value 78,420 78,420
Less: Allowance for impairment: - individually impaired (78,420 ) (78,420 )
– –
Movement in allowance accounts:
Group 2015 2014 RM RM
At 1 February/31 January 78,420 78,420
Trade receivables that are individually determined to be impaired at the reporting date relate to debtors that are in significant financial difficulties and have defaulted on payments. These receivables are not secured by any collateral or credit enhancements.
(b) other receivables
The Group’s and the Company’s other receivables that are impaired at the reporting date and the movement of the allowance accounts used to record the impairment are as follows:
Group Company 2015 2014 2015 2014 RM RM RM RM
Other receivables: Nominal value 6,476,380 6,476,380 37,076,825 36,709,090 Less: Allowance for impairment (6,476,380 ) (6,476,380 ) (37,076,825 ) (36,709,090 )
– – – –
notes to the Financial Statements (cont’d)31 January 2015

A n n u A l R e p o R t 2 0 1 5
91StRengthening CoRe BuSineSS
17. TRADE AND oThER RECEIVAbLES (CoNT’D)
(b) other receivables (cont’d)
Movement in allowance accounts:
Group Company 2015 2014 2015 2014 RM RM RM RM
At the beginning of year 6,476,380 6,479,237 36,709,090 36,453,558 Charge for the year (Note 7) – – 816,026 757,576 Written off – (2,857 ) – – Bad debts recovered (Note 5) – – (448,291 ) (502,044 )
At the end of year 6,476,380 6,476,380 37,076,825 36,709,090
Other receivables that are impaired
At the reporting date, the Group and the Company have provided an allowance of RM6,476,380 (2014: RM6,476,380) and RM37,076,825 (2014: RM36,709,090) respectively. These mainly relate to balances due from related parties which have been significantly long outstanding.
(c) Related companies and affiliate balances
Related companies refer to companies in the Sapura Holdings Sdn. Bhd. group of companies.
An affiliate refers to Schulz Export GmbH, a fellow subsidiary of Sophisticated Pipe Industry Production Sdn. Bhd., a corporate shareholder of a subsidiary of the Company, Sapura-Schulz Hydroforming Sdn. Bhd.
The amounts due from related companies are unsecured, non-interest bearing and are repayable upon demand, except for an amount due from subsidiaries of RM1,294,737 (2014: RM1,917,426) which attract interest rate of 4.00% (2014: 4.65%) per annum.
(d) Credit risk
As at the reporting date, the Group has significant concentration of credit risk in the form of outstanding balances due from 2 (2014: 2) groups of debtors representing 72% (2014: 86%) of the total net trade receivables.
18. oThER CURRENT ASSETS
Group Company 2015 2014 2015 2014 RM RM RM RM
Prepayments 2,676,744 1,768,563 130,831 77,827

S A p u RA i n d u S t R i A l B e R h A d
92
19. CASh AND bANK bALANCES
Group Company 2015 2014 2015 2014 RM RM RM RM
Cash on hand and at banks 5,963,819 3,615,950 144,269 180,390 Deposits with licensed banks 352,182 14,133,128 – –
Cash and bank balances 6,316,001 17,749,078 144,269 180,390 Less: Bank overdrafts (Note 22) (289,515 ) (495,140 ) – –
Cash and cash equivalents 6,026,486 17,253,938 144,269 180,390
The weighted average effective interest rates and average maturities of deposits with licensed banks at reporting date of the Group were 2.90% (2014: 2.73%) per annum and 30 days (2014: 30 days) respectively.
20. RETIREMENT bENEfIT obLIGATIoNS
The Group operates an unfunded, defined benefit Retirement Benefit Scheme (“the Scheme”) for its eligible employees. The Group’s obligation under the Scheme is determined based on the latest actuarial valuation by an independent valuer for the financial year 2014 until 2015. under the Scheme, eligible employees are entitled to retirement benefits on attainment of the retirement age.
The amounts recognised on the statement of financial position are determined as follows:
Group Company 2015 2014 2015 2014 RM RM RM RM
Present value of unfunded defined benefit obligations, representing net liabilities 4,583,571 4,454,953 1,504,127 1,570,241
Analysed as: Current 16,970 17,194 5,256 5,256 Non-current 4,566,601 4,437,759 1,498,871 1,564,985
4,583,571 4,454,953 1,504,127 1,570,241
The amount recognised in the statement of comprehensive income are as follows:
Group Company 2015 2014 2015 2014 RM RM RM RM
Current service costs 306,464 193,137 107,194 114,957 Interest cost 243,988 217,860 85,461 76,032
Total, included in employee benefits expense (Note 8) 550,452 410,997 192,655 190,989
notes to the Financial Statements (cont’d)31 January 2015

A n n u A l R e p o R t 2 0 1 5
93StRengthening CoRe BuSineSS
20. RETIREMENT bENEfIT obLIGATIoNS (CoNT’D)
Movements in the net liability in the current year were as follows:
Group Company 2015 2014 2015 2014 RM RM RM RM
At beginning of year 4,454,953 4,187,728 1,570,241 1,420,263 Recognised in profit or loss 550,452 410,997 192,655 190,989 Benefits paid (421,834 ) (143,772 ) (258,769 ) (41,011 )
At end of year 4,583,571 4,454,953 1,504,127 1,570,241
Principal actuarial assumptions used:
2015 2014 % %
Discount rate 5.1 5.1 Expected rate of salary increases - Executives 5.5 5.5 - Non executives 5.5 5.5
Assumptions regarding future mortality are based on published statistics and mortality tables.
21. fINANCIAL GUARANTEE
Provision for corporate guarantee RM
Company:
At 1 February 2013 521,282 unused amount reversed (148,404 )
At 1 February 2014 372,878 unused amount reversed (154,165 ) At 31 January 2015 218,713
The provision relates to a proportionate share of corporate guarantee extended by the Company to a bank for credit facilities granted to a subsidiary.

S A p u RA i n d u S t R i A l B e R h A d
94
22. LoANS AND boRRoWINGS
Group Company 2015 2014 2015 2014 RM RM RM RM
Current
Secured: Bank overdrafts 289,515 495,140 – – Term loans 4,726,328 7,709,655 – – Obligations under finance leases (Note 23) 358,702 394,892 280,297 291,022
5,374,545 8,599,687 280,297 291,022
Unsecured: Bankers’ acceptances 7,856,267 15,236,476 – – Revolving credits 9,200,000 9,200,000 2,200,000 3,200,000 Term loan – 666,640 – 666,640
17,056,267 25,103,116 2,200,000 3,866,640
22,430,812 33,702,803 2,480,297 4,157,662
Non-current
Secured: Term loans 10,807,200 8,748,615 – – Obligations under finance leases (Note 23) 639,625 384,486 502,107 230,888
11,446,825 9,133,101 502,107 230,888
Total
Bank overdrafts (Note 19) 289,515 495,140 – – Revolving credits 9,200,000 9,200,000 2,200,000 3,200,000 Bankers’ acceptances 7,856,267 15,236,476 – – Term loans 15,533,528 17,124,910 – 666,640 Obligations under finance leases 998,327 779,378 782,404 521,910
33,877,637 42,835,904 2,982,404 4,388,550
notes to the Financial Statements (cont’d)31 January 2015

A n n u A l R e p o R t 2 0 1 5
95StRengthening CoRe BuSineSS
22. LoANS AND boRRoWINGS (CoNT’D)
The remaining maturities of the loans and borrowings as at 31 January 2015 are as follows:
Group Company 2015 2014 2015 2014 RM RM RM RM
Within 1 year 22,430,812 33,702,803 2,480,297 4,157,662 More than 1 year and less than 2 years 4,235,568 5,489,333 272,288 201,310 More than 2 years and less than 5 years 7,211,257 3,643,768 229,819 29,578
33,877,637 42,835,904 2,982,404 4,388,550
The weighted average effective interest rates per annum at the reporting date for the borrowings, excluding finance leases, were as follows:
Group Company 2015 2014 2015 2014 % % % %
Bank overdrafts 8.00 8.55 – – Revolving credits 4.75 4.59 4.75 4.62 Bankers’ acceptances 2.29 3.95 4.89 4.33 Term loans 4.33 4.59 – 4.60
The secured bank overdrafts of the Group are secured by certain assets of the Group (Note 13(b)).
The term loans are secured by a first legal charge over certain leasehold land and certain plant and machinery of the Group and/or the Company (Note 13(b)).
The unsecured borrowings are guaranteed by the Company and certain subsidiaries and a negative pledge over all fixed and other assets of the Company.
The Company has extended corporate guarantees amounting to RM118,858,000 (2014: RM108,834,500) as at the reporting date to banks and financial institutions for banking facilities granted to certain subsidiaries.

S A p u RA i n d u S t R i A l B e R h A d
96
23. hIRE PURChASE AND fINANCE LEASE LIAbILITIES
Group Company 2015 2014 2015 2014 RM RM RM RM
Minimum lease payments: Not later than 1 year 402,417 436,047 313,084 311,850 Later than 1 year and not later than 2 years 356,397 210,383 291,225 132,597 Later than 2 years and not later than 5 years 333,665 192,666 251,437 113,185
1,092,479 839,096 855,746 557,632 Less: Finance charges (94,152 ) (59,718 ) (73,342 ) (35,722 )
998,327 779,378 782,404 521,910
Analysis of present value of finance lease liabilities: Not later than 1 year 358,702 394,892 280,297 291,022 Later than 1 year and not later than 2 years 332,347 198,296 272,288 122,825 Later than 2 years and not later than 5 years 307,278 186,190 229,819 108,063
998,327 779,378 782,404 521,910
Less: Amount due within 12 months (Note 22) (358,702 ) (394,892 ) (280,297 ) (291,022 )
Amount due after 12 months (Note 22) 639,625 384,486 502,107 230,888
The Group and the Company have finance leases for various items of plant and equipment (Note 13(a)). These leases do not have terms of renewal, but have purchase options at nominal values at the end of the lease term.
The finance leases of the Group and of the Company attract interest rate during the year varying between 2.38% to 3.95% (2014: 2.23% to 3.95%) and 2.38% to 3.56% (2014: 2.23% to 3.71%) per annum respectively.
Other information of financial risks of finance leases are disclosed in Note 29.
24. DEfERRED TAx
Group Company 2015 2014 2015 2014 RM RM RM RM
At the beginning of year 7,035,644 7,038,702 – – Recognised in profit or loss (Note 10) 1,783,027 (3,058 ) – –
At the end of year 8,818,671 7,035,644 – –
notes to the Financial Statements (cont’d)31 January 2015

A n n u A l R e p o R t 2 0 1 5
97StRengthening CoRe BuSineSS
24. DEfERRED TAx (CoNT’D)
Deferred tax assets of the Group:
Unutilised reinvestment and Unabsorbed investment tax capital allowances allowances Provisions Total RM RM RM RM
At 1 February 2013 (505,133 ) 28,975 (1,278,515 ) (1,754,673 ) Recognised in profit or loss 85,334 (68,856 ) 8,155 24,633
At 31 January 2014 (419,799 ) (39,881 ) (1,270,360 ) (1,730,040 ) Recognised in profit or loss (897,587 ) – (383,971 ) (1,281,558 )
At 31 January 2015 (1,317,386 ) (39,881 ) (1,654,331 ) (3,011,598 )
Deferred tax liabilities of the Group:
Accelerated Development capital expenditure allowances capitalised Total RM RM RM
At 1 February 2013 8,124,070 669,305 8,793,375 Recognised in profit or loss 94,422 (122,113 ) (27,691 )
At 31 January 2014 8,218,492 547,192 8,765,684 Recognised in profit or loss 2,934,824 129,761 3,064,585
At 31 January 2015 11,153,316 676,953 11,830,269
Deferred tax asset of the Company:
Unabsorbed capital allowances RM
At 1 February 2013 (23,429 ) Recognised in profit or loss (118,045 )
At 31 January 2014 (141,474 ) Recognised in profit or loss 141,474
At 31 January 2015 –

S A p u RA i n d u S t R i A l B e R h A d
98
24. DEfERRED TAx (CoNT’D)
Deferred tax liability of the Company: Accelerated capital allowances RM
At 1 February 2013 23,429 Recognised in profit or loss 118,045
At 31 January 2014 141,474 Recognised in profit or loss (141,474 )
At 31 January 2015 –
Deferred tax assets have not been recognised in respect of the following items:
Group Company 2015 2014 2015 2014 RM RM RM RM
unused tax losses 48,511,566 47,276,115 18,915,231 20,273,450 unabsorbed capital allowances 39,628,483 38,834,543 – – unabsorbed reinvestment and investment tax allowances 6,889,500 1,801,467 – – Other temporary differences 10,955,311 10,374,482 3,712,679 3,733,351
105,984,860 98,286,607 22,627,910 24,006,801
Deferred tax assets have not been recognised in respect of the above items as it is not probable that future taxable profits will be available against which they may be utilised.
The unused tax losses and unabsorbed capital allowances of the Group and of the Company are available for offsetting against future taxable profits of the respective entities within the Group, subject to no substantial changes in shareholdings of those entities under the Income Tax Act, 1967 and guidelines issued by the tax authority.
notes to the Financial Statements (cont’d)31 January 2015

A n n u A l R e p o R t 2 0 1 5
99StRengthening CoRe BuSineSS
25. TRADE AND oThER PAyAbLES
Group Company 2015 2014 2015 2014 RM RM RM RM
Trade payables - third parties 11,704,134 16,117,040 – –
other payables Accruals 262,534 227,410 – 1,200 Other payables 19,566,968 21,062,045 3,525,894 3,620,446 Amount due to subsidiaries – – 29,203,887 26,277,820 Amount due to related companies 28,117 185,802 20,543 178,228
19,857,619 21,475,257 32,750,324 30,077,694
Total trade and other payables 31,561,753 37,592,297 32,750,324 30,077,694
Total trade and other payables 31,561,753 37,592,297 32,750,324 30,077,694 Add: Loans and borrowings (Note 22) 33,877,637 42,835,904 2,982,404 4,388,550
Total financial liabilities carried at amortised cost 65,439,390 80,428,201 35,732,728 34,466,244
(a) Trade payables
Trade payables are non-interest bearing and the normal trade credit terms granted to the Group range from 30 to 60 (2014: 30 to 60) days.
(b) other payables
These amounts are non-interest bearing. Other payables are normally settled on an average term range from 30 to 60 (2014: 30 to 60) days.
(c) Amounts due to subsidiaries and related companies
The amounts due to subsidiaries and related companies are unsecured, non-interest bearing and are repayable upon demand.
26. ShARE CAPITAL
Number of ordinary Amount shares of RM1 each 2015 2014 2015 2014 RM RM
Authorised At 1 February/31 January 100,000,000 100,000,000 100,000,000 100,000,000
Issued and fully paid At 1 February/31 January 72,775,737 72,775,737 72,775,737 72,775,737
The holders of ordinary shares are entitled to receive dividends as and when declared by the Company. All ordinary shares carry one vote per share without restrictions and rank equally with regard to the Company residual assets.

S A p u RA i n d u S t R i A l B e R h A d
100
27. CoMMITMENTS
(a) Capital commitments
Group Company 2015 2014 2015 2014 RM RM RM RM
Capital expenditures
Property, plant and equipment: Approved but not contracted for 4,366,500 10,243,300 18,000 994,400
(b) operating lease commitment - Group as lessee
The Group and the Company have entered into operating lease agreements for the use of buildings and certain plant and equipment. These leases have an average life of between 1 and 2 years with renewal but no purchase option included in the contracts. The Group and the Company are required to give, on an average, a 3-month notice for the termination of these leases.
The future aggregate minimum lease payments under operating leases contracted for as at the reporting date but not recognised as liabilities are as follows:
Group Company 2015 2014 2015 2014 RM RM RM RM
Future minimum lease payables: Not later than 1 year 3,493,936 3,482,544 1,170,708 1,170,708 Later than 1 year and not later than 5 years 1,643,114 2,722,614 – 1,170,708
5,137,050 6,205,158 1,170,708 2,341,416
notes to the Financial Statements (cont’d)31 January 2015

A n n u A l R e p o R t 2 0 1 5
101StRengthening CoRe BuSineSS
28. RELATED PARTy DISCLoSURES
(a) Significant related party transactions
In addition to the related party information disclosed elsewhere in the financial statements, the following significant transactions between the Group and related parties took place at terms agreed between the parties during the financial year.
Group Company 2015 2014 2015 2014 RM RM RM RM
holding company Corporate service fee – 662,454 – 662,454
Subsidiaries Interest expense – – 164,997 89,621 Rental expense – – – 1,190,666 Interest income – – (159,738 ) (147,974 ) Management fees – – (19,319,367 ) (21,902,751 ) Dividend income – – (3,750,000 ) (8,100,000 ) Rental income – – (1,456,447 ) (1,456,447 )
Information regarding outstanding balance arising from related party transactions as at 31 January 2014 are disclosed in Notes 18 and 26.
The directors are of the opinion that all the transactions above have been entered into in the normal course of business and have been established on terms and conditions that are mutually agreed between parties.
(b) Compensation of key management personnel
The remuneration of members of key management during the year including directors of subsidiary companies under the Group was as follows:
Group Company 2015 2014 2015 2014 RM RM RM RM
Wages and salaries 3,585,481 3,652,529 3,085,061 3,199,668 Contributions to defined contribution plan 430,926 438,841 370,724 384,303 Benefits-in-kind 111,204 129,957 95,228 112,828
4,127,611 4,221,327 3,551,013 3,696,799
29. fINANCIAL INSTRUMENTS
(a) financial risk management objectives and policies
The Group’s financial risk management policy seeks to ensure that adequate financial resources are available for the development of the Group’s businesses whilst managing its interest rate risk (both fair value and cash flow), foreign currency risk, liquidity risk and credit risk. It is, and has been throughout the year under review, the Group’s policy that no trading in derivative financial instruments shall be undertaken.

S A p u RA i n d u S t R i A l B e R h A d
102
29. fINANCIAL INSTRUMENTS (CoNT’D)
(b) Interest rate risk
The Group’s primary interest rate risk relates to interest-bearing debts as the Group had no substantial long term interest-bearing assets as at 31 January 2015. The investment in financial assets are mainly short term in nature and they are not held for speculative purposes but have been mostly placed in fixed deposits or occasionally, in short term commercial papers which yield better returns than cash at bank.
The Group manages its interest rate exposure by maintaining a prudent mix of fixed and floating rate borrowings. The Group actively reviews its debt portfolio, taking into account the investment holding period and nature of its assets. This strategy allows it to capitalise on cheaper funding in a low interest rate environment and achieve a certain level of protection against rate hikes.
The information on maturity dates and effective interest rates of financial assets and liabilities are disclosed in their respective notes.
The interest rate profile of the Group’s and the Company’s interest-bearing financial instruments, based on carrying amount as at reporting date was:
Group Company 2015 2014 2015 2014 RM RM RM RM
fixed rate instruments Financial liabilities (1,287,842 ) (1,274,518 ) (782,404 ) (521,910 )
floating rate instruments Financial assets 352,182 14,133,128 – – Financial liabilities (32,589,795 ) (41,561,386 ) (2,200,000 ) (3,866,640 )
Sensitivity analysis for interest rate risk
At the reporting date; if interest rates had been 25 basis points lower/higher, with all other variables held constant, the Group’s profit net of tax and total equity would have been RM48,378 (2014: RM45,575) higher/lower, arising mainly as a result of lower/higher interest expense on floating rate loans and borrowings, if interest rates had been 25 basis points lower/higher, with all other variables held constant, the Company’s profit net of tax and total equity would have been RM12,533 (2014: RM16,059) higher/lower, arising mainly as a result of lower/higher interest expense on floating rate loans and borrowings.
The assumed movement in basis points for interest rate sensitivity analysis is based on the currently observable market environment.
(C) foreign exchange risk
The Group is exposed to various currencies, mainly united States Dollar (“uSD”), Japanese Yen (“JPY”), Pound Sterling (“GBP”), Indonesian Rupiah (“IDR”) and Euro (“Euro”). Foreign currencies denominated assets and liabilities together with expected cashflows from highly probable purchases and sales give rise to foreign exchange exposures.
Foreign exchange exposures in transactional currencies other than functional currency of the Company and all its subsidiaries are kept to an acceptable level.
Sensitivity analysis for foreign currency risk
The following table demonstrates the sensitivity of the Group’s profit net of tax to a reasonably possible change in the uSD, JPY, GBP, IDR and Euro exchange rates against the respective functional currencies of the Group’s entities, with all other variables held constant.
notes to the Financial Statements (cont’d)31 January 2015

A n n u A l R e p o R t 2 0 1 5
103StRengthening CoRe BuSineSS
29. fINANCIAL INSTRUMENTS (CoNT’D)
(c) foreign exchange risk (cont’d)
Group Profit net of tax 2015 2014 RM RM
uSD/RM – strengthened 5% (134,974 ) (108,730 ) – weakened 5% 134,974 108,730 JPY/RM – strengthened 5% (19,158 ) (29,179 ) – weakened 5% 19,158 29,179 GBP/RM – strengthened 5% (1,854 ) (2,424 ) – weakened 5% 1,854 2,424 IDR/RM – strengthened 5% (11.605 ) – – weakened 5% 11,605 – Euro/RM – strengthened 5% (262,637 ) (319,234 ) – weakened 5% 262,637 319,234
(d) Liquidity risk
The Group actively manages its debt maturity profile, operating cash flows and the availability of funding so as to ensure that all refinancing, repayment and funding needs are met. As part of its overall prudent liquidity management, the Group maintains sufficient levels of cash or cash convertible investments to meet its working capital requirements. In addition, the Group strives to maintain available banking facilities of a reasonable level to its overall debt position. As far as possible, the Group raises committed funding from financial institutions and prudently balances its portfolio with some short term funding so as to achieve overall cost effectiveness.
Analysis of financial instruments by remaining contractual maturities
The table below summarises the maturity profile of the Group’s and the Company’s liabilities at the reporting date based on contractual undiscounted repayment obligations.
2015 on demand or within one to one year five years Total RM RM RM
Group
financial liabilities: Trade and other payables 31,561,753 – 31,561,753 Loans and borrowings 23,731,392 12,969,652 36,701,044
Total undiscounted financial liabilities 55,293,145 12,969,652 68,262,797
Company
financial liabilities: Trade and other payables 32,750,324 – 32,750,324 Loans and borrowings 2,617,584 542,662 3,160,246
Total undiscounted financial liabilities 35,367,908 542,662 35,910,570

S A p u RA i n d u S t R i A l B e R h A d
104
29. fINANCIAL INSTRUMENTS (CoNT’D)
(d) Liquidity risk (cont’d)
2014 on demand or within one to one year five years Total RM RM RM
Group
financial liabilities: Trade and other payables 37,592,297 – 37,592,297 Loans and borrowings 34,686,205 9,873,042 44,559,247
Total undiscounted financial liabilities 72,278,502 9,873,042 82,151,544
Company
financial liabilities: Trade and other payables 30,077,694 – 30,077,694 Loans and borrowings 4,335,759 244,617 4,580,376
Total undiscounted financial liabilities 34,413,453 244,617 34,658,070
(e) Credit risk
Credit risk is controlled by the application of credit approvals, limits and monitoring procedures. Credit risks are minimised and monitored via strictly limiting the Group’s associations to business partners with high creditworthiness. Trade receivables are monitored on an ongoing basis via Group management reporting procedures.
The Group has no significant concentration of credit risk that may arise from exposures to a single debtor or to groups of debtors as at 31 January 2015, other than as disclosed in Note 17.
(f) fair values
The carrying amounts of cash and cash equivalents, trade and other receivables, trade and other payables and current portion of loans and borrowings are reasonable approximate of their fair values due to the relatively short term nature of these financial instruments.
The following table analyses financial instruments not carried at fair value for which fair value is disclosed, together with their fair values and carrying amounts shown in the statement of financial position. The different levels have been defined as follows:
– Level 1 - Quoted prices (unadjusted) in active markets for identical assets or liabilities
– Level 2 - Inputs other than quoted prices included within Level 1 that are observable for the asset or liability, either directly (i.e. as prices) or indirectly (i.e. derived from prices).
– Level 3 - Inputs for the asset or liability that are not based on observable market data (unobservable input).
Fair values below are categorised within the Level 3 fair value hierarchy which is described as inputs for the asset or liability that are based on unobservable market data (unobservable input).
notes to the Financial Statements (cont’d)31 January 2015

A n n u A l R e p o R t 2 0 1 5
105StRengthening CoRe BuSineSS
29. fINANCIAL INSTRUMENTS (CoNT’D)
(f) fair values (cont’d)
Group Company Carrying fair Carrying fair amount value amount value RM RM RM RM
financial liabilities
At 31 January 2015:Obligations under finance leases (non-current) 639,625 654,583 502,107 515,094 Term loans (non-current) 10,807,200 11,222,954 – –
At 31 January 2014:Obligations under finance leases (non-current) 384,486 392,633 230,888 233,163 Term loans (non-current) 9,706,978 9,827,474 – –
Inter-relationship between significant unobservable inputs and fair value measurement are as follows:
(a) The estimated fair value of the obligations under finance leases and term loans would increase/(decrease) if the interest rate applied to the borrowings increase/(decrease).
The Group and the Company do not have any financial assets or financial liabilities measured at Level 1 and Level 2 hierarchy.
30. CAPITAL MANAGEMENT
The primary objective of the Group’s capital management is to ensure that it maintains a strong credit rating and healthy capital ratios in order to support its business and maximise shareholder value.
The Group manages its capital structure and makes adjustments to it, in light of changes in economic conditions. To maintain or adjust the capital structure, the Group may adjust the dividend payment to shareholders, return capital to shareholders or issue new shares. No changes were made in the objectives, policies or processes during the years ended 31 January 2015 and 2014.
The Group monitors capital using a gearing ratio, which is net debt divided by total capital plus net debt. The Group’s policy is to keep the gearing ratio at an acceptable limit. The Group includes within net debt, loans and borrowings, trade and other payables, less cash and bank balances. Capital includes equity attributable to the owners of the parent less non-distributable share premium.

S A p u RA i n d u S t R i A l B e R h A d
106
30. CAPITAL MANAGEMENT (CoNT’D)
Group Company 2015 2014 2015 2014 RM RM RM RM
Loans and borrowings 33,877,637 42,835,904 2,982,404 4,388,550 Trade and other payables 31,561,753 37,592,297 32,750,324 30,077,694 Less: Cash and bank balances (6,316,001 ) (17,749,078 ) (144,269 ) (180,390 )
Net debt 59,123,389 62,679,123 35,588,459 34,285,854
Equity attributable to the owners of the parent, representing total capital 101,679,057 101,440,180 32,714,625 35,822,822
Capital and net debt 160,802,446 164,119,303 68,303,084 70,108,676
Gearing ratio 37% 38% 52% 49%
31. SEGMENT INfoRMATIoN
(a) business segments:
The Group is organised into three major business segments:
(i) Manufacturing - the manufacture and supply of products for the automotive, electronics and electrical industries and manufacture of butt-weld fittings for oil and gas industries;
(ii) Investment holding - the holding of investments and provision of management services to subsidiaries; and
(iii) Others - trading of autoparts in retail and after sales market, providing computer aided design and manufacture of sub-systems and systems for applications in production and testing and other dormant companies.
(b) Geographical segments:
The Group’s operations are carried out solely in Malaysia.
(c) Allocation basis
Segment results, assets and liabilities include items directly attributable to a segment as well as those that can be allocated on a reasonable basis. unallocated items comprise mainly corporate assets, liabilities and expenses.
Transfer prices between business segments are set on an arm’s length basis in a manner similar to transactions with third parties. Segment revenue, expenses and results include transfers between business segments. These transfers are eliminated on consolidation.
notes to the Financial Statements (cont’d)31 January 2015

A n n u A l R e p o R t 2 0 1 5
107StRengthening CoRe BuSineSS
31. SEGMENT INfoRMATIoN (CoNT’D)
(d) Information on major customers
Included in the manufacturing segment are two major customers contributing RM119,497,350 (2014:RM163,239,983) and RM91,742,666 (2014: RM97,530,003) of revenue in the current financial year.
Business Segments
Investment Manufacturing holding others Eliminations Notes Consolidated RM RM RM RM RM
31 January 2015
Revenue External 228,157,584 – 4,557,195 – 232,714,779 Inter-segment 8,048,181 23,069,367 – (31,117,548 ) A –
Total revenue 236,205,765 23,069,367 4,557,195 (31,117,548 ) 232,714,779
Results Segment results, representing profit/(loss) from operations 10,716,130 5,327,893 398,729 (3,974,674 ) 12,468,078 Finance costs (1,698,741 ) Taxation (2,744,858 )
Profit net of tax 8,024,479
Assets Consolidated segment assets 192,083,955 70,170,193 7,326,382 (90,438,754) 179,141,776
Liabilities Consolidated segment liabilities 119,203,936 37,455,567 21,412,620 (99,230,191) 78,841,932
other information Capital expenditure 15,792,246 855,936 241,319 – B 16,889,501 Depreciation 10,682,820 780,740 267,798 – 11,731,358 Amortisation 745,597 – – – 745,597 Non-cash expenses other than depreciation, amortisation and interest 673,753 386,291 18,131 (344,191) C 733,984

S A p u RA i n d u S t R i A l B e R h A d
108
31. SEGMENT INfoRMATIoN (CoNT’D)
(d) Information on major customers (cont’d)
Business Segments (cont’d)
Investment Manufacturing holding others Eliminations Notes Consolidated RM RM RM RM RM
31 January 2014
Revenue External 269,506,384 – 4,799,490 – 274,305,874 Inter-segment 10,148,823 30,002,751 – (40,151,574 ) A –
Total revenue 279,655,207 30,002,751 4,799,490 (40,151,574 ) 274,305,874
Results Segment results, representing profit/(loss) from operations 24,970,056 8,630,882 414,904 (8,305,698 ) 25,710,144 Finance costs (1,964,358 ) Taxation (5,740,711 )
Profit net of tax 18,005,075
Assets Consolidated segment assets 202,450,558 72,232,185 6,670,307 (87,935,533 ) 193,417,517
Liabilities Consolidated segment liabilities 132,337,845 36,409,363 20,926,554 (96,537,241 ) 93,136,521
other information Capital expenditure 12,177,970 201,602 655,802 – B 13,035,374 Depreciation 14,564,825 826,202 241,015 – 15,632,042 Amortisation 888,710 – – – 888,710 Non-cash expenses other than depreciation, amortisation and interest 836,926 263,470 – (255,533 ) C 844,863
notes to the Financial Statements (cont’d)31 January 2015

A n n u A l R e p o R t 2 0 1 5
109StRengthening CoRe BuSineSS
31. SEGMENT INfoRMATIoN (CoNT’D)
Notes Nature of adjustments and eliminations to arrive at amounts reported in the consolidated financial statements
A Inter-segment revenues are eliminated on consolidation.
B Capital expenditure consist of:
2015 2014 RM RM
Property, plant and equipment 15,894,265 12,227,898 Development expenditure 995,236 807,476
16,889,501 13,035,374
C Other material non-cash expenses consist of the following items as presented in the respective notes to the financial statements:
Note 2015 2014 RM RM
unrealised gain on foreign exchange 5 (516,458 ) (33,008 ) unrealised loss on foreign exchange 7 559,934 434,039 Impairment loss on development expenditure 7 – 34,584 Inventories written off 7 604,308 179,137 Property, plant and equipment written off 7 86,200 230,111
733,984 844,863
32. SUPPLEMENTARy INfoRMATIoN - bREAKDoWN of RETAINED PRofITS/(ACCUMULATED LoSSES) INTo REALISED AND UNREALISED
The breakdown of the retained profits/(accumulated losses) of the Group and of the Company as at 31 January 2015 into realised and unrealised profits/(losses) is presented in accordance with the directive issued by Bursa Malaysia Securities Berhad dated 25 March 2010 and prepared in accordance with Guidance on Special Matter No. 1, Determination of Realised and unrealised Profits or Losses in the Context of Disclosure Pursuant to Bursa Malaysia Securities Berhad Listing Requirements, as issued by the Malaysian Institute of Accountants.
Group Company 2015 2014 2015 2014 RM RM RM RM
Total accumulated losses of the Company and its subsidiaries - Realised (65,595,446 ) (71,261,155 ) (42,261,238 ) (39,153,041 ) - unrealised (8,862,147 ) (7,436,675 ) – –
(74,457,593 ) (78,697,830 ) (42,261,238 ) (39,153,041 ) Less: Consolidation adjustments 101,160,787 105,162,147 – –
Retained profits/(accumulated losses) as per financial statements 26,703,194 26,464,317 (42,261,238) (39,153,041)

S A p u RA i n d u S t R i A l B e R h A d
110
Analysis of ShareholdingsAs at 11 May 2015
Authorised Share Capital : RM100,000,000 Issued and Paid-up Share Capital : RM72,775,737 Comprising of 72,775,737 Ordinary Shares of RM1.00 each No. of Shareholders : 3,783 DISTRIBUTION OF ORDINARY SHARESBased on Record of Depositors as at 11 May 2015
Size of Holdings No. of Shares
% Over Total No. of Holders
% Over Total Shares Shareholders
Less than 100 2,656 0 103 2.72 100 to 1,000 242,182 0.33 353 9.33 1,001 to 10,000 9,158,303 12.60 2,882 76.20 10,001 to 100,000 11,392,007 15.65 411 10.86 100,001 to less than 5% of issued shares 12,708,450 17.46 32 0.84 5% and above of issued shares 39,272,139 53.96 2 0.05
TOTAl 72,775,737 100.00 3,783 100.00
DIRECTORS’ SHAREHOlDINGS Based on Register of Directors’ Sharesholdings as at 11 May 2015
No. of Ordinary Shares of RM1.00 each Name of Directors Direct Interest Deemed Interest No. of Shares Held % No. of Shares Held %
Tan Sri Dato’ Seri Ir. Shamsuddin bin Abdul Kadir 34,172,139 46.96 _ _
Tan Sri Dato’ Seri Shahril bin Shamsuddin 1,426,875 1.96 _ _
Dato’ Shahriman bin Shamsuddin 663,175 0.91 _ _
Dato’ Azlan bin Hashim _ _ _ _
Datuk Kisai bin Rahmat _ _ _ _
Md. Shah bin Hussin _ _ _ _
Wan Ahamad Sabri bin Wan Daud _ _ _ _
SUBSTANTIAl SHAREHOlDERS Based on Record of Depositors as at 11 May 2015
No. of Ordinary Shares of RM1.00 each Name of Shareholders Direct Interest Deemed Interest No. of Shares Held % No. of Shares Held %
Tan Sri Dato’ Seri Ir. Shamsuddin bin Abdul Kadir 34,172,139 46.96 – –
Puncak Exotika Sdn. Bhd. 5,100,000 7.01 – –

A n n u A l R e p o R t 2 0 1 5
111StRengthening CoRe BuSineSS
THIRTY (30) lARGEST SHAREHOlDERSBased on Record of Depositors as at 11 May 2015
No. Name of Shareholders No. of Shares Held %
1 Tan Sri Dato’ Seri Ir. Shamsuddin bin Abdul Kadir 34,172,139 46.96
2 Puncak Exotika Sdn. Bhd. 5,100,000 7.01
3 HSBC Nominees (Asing) Sdn. Bhd. 3,000,000 4.12 Exempt AN for Bank Julius Baer & Co. Ltd (Singapore BCH)
4 Tan Sri Dato’ Seri Shahril bin Shamsuddin 1,426,875 1.96
5 Yeoh Phek Leng 1,184,500 1.63
6 RHB Capital Nominees (Tempatan) Sdn. Bhd. 697,100 0.96 Pledged Securities Account for Su Ming Yaw
7 CIMSEC Nominees (Tempatan) Sdn. Bhd. 663,175 0.91 CIMB for Shahriman bin Shamsuddin (PB)
8 Lee Siew Hoon 508,000 0.70
9 Lim Kien Hua 393,100 0.54
10 Chia Siew Fung 393,000 0.54
11 Tan Yee Kong 355,000 0.49
12 Wong Shak On 338,900 0.46
13 Tan Yee Seng 280,000 0.38
14 Leong Hon Wah 270,000 0.37
15 Goh Sook Kee 243,000 0.33
16 Wong Chiap You 222,000 0.31
17 Lee Kim Seng 217,000 0.30
18 Eu Soon Keat 207,500 0.29
19 Shanmuganathan A/L Murugasu 195,000 0.27
20 TA Nominees (Tempatan) Sdn. Bhd. 193,100 0.26 Pledged Securities Account for Phua Lee Ping
21 Public Nominees (Tempatan) Sdn. Bhd. 160,000 0.22 Pledged Securities Account for Tan Tian Sang @ Tan Tian Song (E-PPG)
22 Lam Pun Ying 150,000 0.21
23 Universal Trustee (Malaysia) Berhad Ronfield Limited 150,000 0.21
24 Wong Lay Heong 150,000 0.21
25 Chua Kok Sian 147,000 0.20
26 Eu Soon Keat 142,500 0.19
27 Edmund Song Swee Khoon 140,000 0.19
28 Tan Kai Li 139,000 0.19
29 Ananda Krishna A/L Sithamberam Pillay 133,500 0.18
30 Maybank Nominees (Tempatan) Sdn. Bhd. 130,000 0.18 Pledged Securities Account for Tan Boon Huat
TOTAl 51,501,389 70.77

S A p u RA i n d u S t R i A l B e R h A d
112
particulars of properties
location Description / land Area Tenure/Year Approximate Net Book Value Existing Use of Expiring Age of Building as at 31.01.2015 (Years) (RM’000) /Date of last Revaluation / *Acquisition
HS (M) 9725, PT No 11556Mukim KajangDaerah Hulu Langat Selangor Darul Ehsan
Postal address : No. 11, Jalan P/1, Seksyen 13 Kawasan Perindustrian Bangi43650 Bandar Baru Bangi Selangor Darul Ehsan
HS (D) 52700 & 52701 PT No 40849 & 40850 Bandar Baru BangiDaerah Hulu Langat Selangor Darul Ehsan
Postal address : Lot 2 & 4, Jalan P/11, Seksyen 10 Kawasan Perindustrian Bangi43650 Bandar Baru Bangi Selangor Darul Ehsan
HS (D) 87682, PT No 56915 Seksyen 9, Bandar Baru Bangi Daerah Hulu LangatSelangor Darul Ehsan
Postal address :Lot 5, Persiaran UsahawanTaman IKS, Seksyen 943650 Bandar Baru BangiSelangor Darul Ehsan
HS (D) 87683, PT No 56916 Seksyen 9, Bandar Baru Bangi Daerah Hulu LangatSelangor Darul Ehsan
Postal address :Lot 7, Persiaran UsahawanTaman IKS, Seksyen 943650 Bandar Baru BangiSelangor Darul Ehsan
Industrial land /factory cum office
Industrial land /factory cum office
Vacant industrialland
Vacant industrialland
1.2141 ha.
6,552m2 & 7,241m2
20,460.5m2
20,502.6m2
99-year leaseexpiring
29.09.2086
99-year lease expiring
19.08.2098
99-year lease expiring
18.07.2103
99-year lease expiring
18.07.2103
24
20
Nil
Nil
7,401/08.03.1994
6,096/*05.06.1992
5,176/*12.06.2002
5,070/*01.11.2001

A n n u A l R e p o R t 2 0 1 5
113StRengthening CoRe BuSineSS
location Description / land Area Tenure/Year Approximate Net Book Value Existing Use of Expiring Age of Building as at 31.01.2015 (Years) (RM’000) /Date of last Revaluation / *Acquisition
HS (D) 25354, PT No 6733Mukim Gurun, Daerah Kuala Muda Kedah Darul Aman
Postal address : Lot 58Kawasan Perindustrian Berat Gurun08300 Gurun Kedah Darul Aman
HS (M) 549, PT No 98Mukim Bukit KatilDaerah Melaka Tengah, Melaka
Postal address : Lot 98, Jalan Usaha 7Kawasan Perindustrian Ayer Keroh 75450 Melaka
HS (D) 52726 & 52727PT No 40875 & 40876Bandar Baru Bangi Daerah Hulu LangatSelangor Darul Ehsan
Postal address : Lot 1 & 3, Jalan P/14, Seksyen 10Kawasan Perindustrian Bangi43650 Bandar Baru BangiSelangor Darul Ehsan
HS(D) 23239, PT 1755Seksyen 20Bandar & Daerah Kuala SelangorSelangor Darul Ehsan
Postal address :Lot No 6, Jalan Perusahaan 6 Kawasan Perusahaan Kuala Selangor 45000 Kuala SelangorSelangor Darul Ehsan
TOTAl
Industrial land /factory cum office
Industrial land /factory cum office
Industrial land /factory cum office
Industrial land /factory cum office
49,824m2
5a1r.15.2p
2,326m2 & 1,833m2
11,800 m2
99-year lease expiring
06.02.2104
99-year leaseexpiring
30.05.2072
99-year lease expiring
19.08.2098
99-year leaseexpiring
11.10.2108
10
35
19
19
4,036/08.05.2007
2,543/*30.01.1995
2,121/*15.11.1994
1,472/19.01.2005
33,915

This page is intentionally left blank

A n n u A l R e p o R t 2 0 1 5
Total number of Proxy(ies) appointed
Proportion of shareholdings to be Proxy 1 Proxy 2 represented by each proxy % %
Total number of shares held
CDS Account No.
I/We NRIC No. (FULL NAME IN CAPITAL LETTERS)
of (FULL ADDRESS)
being a Member of SAPURA INDUSTRIAL BERHAD, do hereby appoint (FULL NAME IN CAPITAL LETTERS)
NRIC No. of (FULL ADDRESS)
or failing him/her, NRIC No. (FULL NAME IN CAPITAL LETTERS)
of (FULL ADDRESS)
or failing him/her, the CHAIRMAN OF THE MEETING, as my/our proxy to vote for me/us and on my/our behalf at the 39th Annual General Meeting to be held at the Multi-Purpose Hall, Ground Floor, Sapura @ Mines, No. 7, Jalan Tasik, The Mines Resort City, 43300 Seri Kembangan, Selangor Darul Ehsan on Tuesday, 30 June 2015 at 11.00 a.m. or at any adjournment thereof.
Please indicate with an “X” in the space provided below how you wish your vote to be cast. If no specific direction as to voting is given, the Proxy will vote or abstain from voting at his/her discretion.
Resolution For AgainstOrdinary Resolution 1 Payment of final single tier dividend Ordinary Resolution 2 Re-election of Tan Sri Dato’ Seri Shahril bin Shamsuddin Ordinary Resolution 3 Re-election of Encik Md. Shah bin Hussin Special Resolution 1 Reappointment of Tan Sri Dato’ Seri Ir. Shamsuddin bin Abdul Kadir Special Resolution 2 Reappointment of Dato’ Azlan bin Hashim Ordinary Resolution 4 Reappointment of Datuk Kisai bin Rahmat as Independent Non-Executive DirectorOrdinary Resolution 5 Reappointment of Messrs Ernst & Young as Auditors of the Company Ordinary Resolution 6 Payment of Directors’ fees Ordinary Resolution 7 To authorise the Directors under Section 132D of the Companies Act, 1965, to allot and issue new shares in the Company
Signature/Common Seal of Shareholder Dated this day of 2015
Notes:
1. A member whose name appears in the Record of Depositors of the Company as at 19 June 2015 shall be entitled to attend, speak and vote at this Meeting.2. A member of the Company who is entitled to attend and vote at this Meeting is entitled to appoint not more than two (2) proxies to attend and vote on a show of hands or on a poll in his stead.
A proxy may but need not be a member of the Company and a member may appoint any person to be his proxy without limitation as to the qualification of the proxy.3. Where a member is an authorised nominee (as defined under the Securities Industry (Central Depositories) Act 1991), it may appoint at least one (1) proxy in respect of each securities account it
holds with ordinary shares of the Company standing to the credit of the said securities account.4. Where a member appoints two (2) proxies to attend and vote at the same meeting, such appointment shall be invalid unless he specifies the proportion of his shareholdings to be represented by
each proxy.5. An instrument appointing a proxy shall be in writing and in the case of an individual shall be signed by the appointor or by his attorney duly authorised in writing and in the case of a corporate
member, shall be either under its Common Seal or signed by its attorney or an officer of the corporation duly authorised.6. The instrument appointing a proxy must be deposited at the Registered Office of the Company at Lot 2 & 4, Jalan P/11, Seksyen 10, Kawasan Perindustrian Bangi, 43650 Bandar Baru Bangi, Selangor
Darul Ehsan, not less than forty eight (48) hours before the time set for holding the Meeting or any adjournment thereof.
proxy Form Sapura Industrial Berhad (17547-W)

FOLD HERE
FOLD HERE
STAMP
The Company SecretarySapura Industrial Berhad (17547-W)
Lot 2 & 4, Jalan P/11, Seksyen 10Kawasan Perindustrian Bangi
43650 Bandar Baru BangiSelangor Darul Ehsan