Ratio-Based Multitemporal SAR Images Denoising: RABASAR · speckle reduction results than is...
14
3552 IEEE TRANSACTIONS ON GEOSCIENCE AND REMOTE SENSING, VOL. 57, NO. 6, JUNE 2019 Ratio-Based Multitemporal SAR Images Denoising: RABASAR Weiying Zhao , Charles-Alban Deledalle , Loïc Denis , Henri Maître, Jean-Marie Nicolas, and Florence Tupin , Senior Member, IEEE Abstract— In this paper, we propose a fast and efficient multitemporal despeckling method. The key idea of the proposed approach is the use of the ratio image, provided by the ratio between an image and the temporal mean of the stack. This ratio image is easier to denoise than a single image thanks to its improved stationarity. Besides, temporally stable thin structures are well preserved thanks to the multitemporal mean. The proposed approach can be divided into three steps: 1) estimation of a “superimage” by temporal averaging and possibly spatial denoising; 2) denoising of the ratio between the noisy image of interest and the “superimage”; and 3) computation of the denoised image by remultiplying the denoised ratio by the “superimage.” Because of the improved spatial stationarity of the ratio images, denoising these ratio images with a speckle- reduction method is more effective than denoising images from the original multitemporal stack. The amount of data that is jointly processed is also reduced compared to other methods through the use of the “superimage” that sums up the temporal stack. The comparison with several state-of-the-art reference methods shows better results numerically (peak signal-noise- ratio and structure similarity index) as well as visually on simulated and synthetic aperture radar (SAR) time series. The proposed ratio-based denoising framework successfully extends single-image SAR denoising methods to time series by exploiting the persistence of many geometrical structures. Index Terms—Multitemporal synthetic aperture radar (SAR) series, ratio image, speckle reduction, superimage. I. I NTRODUCTION S YNTHETIC aperture radar (SAR) imaging is widely used in the monitoring of land surfaces, disasters, or the envi- ronment, due to its all-time acquisition capability, its sensitiv- ity to geometric structures, and its penetration characteristics. However, the system-inherent speckle noise visually corrupts the appearance of images and severely diminishes the analysis and interpretation of SAR images. Therefore, a preliminary Manuscript received October 15, 2018; accepted November 19, 2018. Date of publication January 4, 2019; date of current version May 28, 2019. This work was supported in part by the CNES (French Space Agency) under Project DAJ/AR/IB-2016-10117102 and in part by the China Scholarship Council. (Corresponding author: Florence Tupin.) W. Zhao, H. Maître, J.-M. Nicolas, and F. Tupin are with LTCI, Télécom ParisTech, Université Paris-Saclay, 75013 Paris, France (e-mail: [email protected], [email protected], jean-marie. [email protected], fl[email protected]). C.-A. Deledalle is with IMB, CNRS, Bordeaux INP, University of Bordeaux„ F-33405 Talence, France (e-mail: charles-alban.deledalle@ math.u-bordeaux.fr). L. Denis is with the Laboratoire Hubert Curien UMR 5516, UJM-Saint- Etienne, CNRS, Institut d Optique Graduate School, University of Lyon, F-42023 SAINT-ETIENNE, France (e-mail: [email protected]). Color versions of one or more of the figures in this paper are available online at http://ieeexplore.ieee.org. Digital Object Identifier 10.1109/TGRS.2018.2885683 speckle reduction step is often necessary for the successful exploitation of SAR images. The recent and unprecedented availability of long time series with Sentinel-1 constellation has opened new ways for SAR speckle reduction. This highly redundant information offers a new paradigm. Taking inspiration from temporal multilooking and residual noise analysis, we propose in this paper a ratio-based denoising approach (first presented in [1]), dedicated to long multitemporal stacks. The main problems of SAR image despeckling are the spa- tial resolution preservation, the edges and textures restoration, and the preservation of point-like targets. Spatial multilooking is a common way to reduce speckle fluctuations in a single SAR image, at the cost of a significant spatial resolution loss [2]. To effectively estimate the noise-free reflectivity as well as preserve the spatial resolution, many single-channel SAR speckle reduction methods have been proposed during the past decades. Detailed introductions of the methods are given by Argenti et al. [2], Touzi [3], and Deledalle et al. [4]. These methods mainly belong to four categories: Bayesian methods in the spatial domain (Lee filter [5] and Lee refined filter [6]), Bayesian methods in a transformed domain [7], selection- based filtering (IDAN [8], PPB [9], and NL-SAR [10]), and sparse-based approaches [11]. Many single-SAR-image denoising methods are designed by combining information in different domains (the spatial domain and a transformed domain), with different estimation criteria and various statistical models of speckle and radar reflectivities [2]. Several state-of-the-art single-image despeckling methods perform a weighted average of selected surrounding pixels values to estimate the speckle-free values. If the surrounding pixels are not well selected or if their associated weights are badly chosen, an estimation bias occurs which is generally visible in the form of a spatial resolution loss (over-smoothing and spreading of thin structures). The accurate selection of pixels is very challenging in single-look SAR images given the large fluctuations due to speckle phenomenon. Even when using state-of-the-art spatial denoising approaches (such as SAR-BM3D [12] or NL-SAR [10]), the smallest and least contrasted structures can be damaged or some noticeable speckle fluctuations can remain after filtering. Recently, convolutional neural networks have shown a high capability of denoising data affected by additive white Gaussian noise [13]. Application to SAR images has also been proposed, either through an homomorphic approach [14] 0196-2892 © 2019 IEEE. Personal use is permitted, but republication/redistribution requires IEEE permission. See http://www.ieee.org/publications_standards/publications/rights/index.html for more information.
Transcript of Ratio-Based Multitemporal SAR Images Denoising: RABASAR · speckle reduction results than is...

3552 IEEE TRANSACTIONS ON GEOSCIENCE AND REMOTE SENSING, VOL. 57, NO. 6, JUNE 2019
Ratio-Based Multitemporal SAR ImagesDenoising: RABASAR
Weiying Zhao , Charles-Alban Deledalle , Loïc Denis , Henri Maître, Jean-Marie Nicolas,
and Florence Tupin , Senior Member, IEEE
Abstract— In this paper, we propose a fast and efficientmultitemporal despeckling method. The key idea of the proposedapproach is the use of the ratio image, provided by the ratiobetween an image and the temporal mean of the stack. Thisratio image is easier to denoise than a single image thanksto its improved stationarity. Besides, temporally stable thinstructures are well preserved thanks to the multitemporal mean.The proposed approach can be divided into three steps: 1)estimation of a “superimage” by temporal averaging and possiblyspatial denoising; 2) denoising of the ratio between the noisyimage of interest and the “superimage”; and 3) computation ofthe denoised image by remultiplying the denoised ratio by the“superimage.” Because of the improved spatial stationarity ofthe ratio images, denoising these ratio images with a speckle-reduction method is more effective than denoising images fromthe original multitemporal stack. The amount of data that isjointly processed is also reduced compared to other methodsthrough the use of the “superimage” that sums up the temporalstack. The comparison with several state-of-the-art referencemethods shows better results numerically (peak signal-noise-ratio and structure similarity index) as well as visually onsimulated and synthetic aperture radar (SAR) time series. Theproposed ratio-based denoising framework successfully extendssingle-image SAR denoising methods to time series by exploitingthe persistence of many geometrical structures.
Index Terms— Multitemporal synthetic aperture radar (SAR)series, ratio image, speckle reduction, superimage.
I. INTRODUCTION
SYNTHETIC aperture radar (SAR) imaging is widely usedin the monitoring of land surfaces, disasters, or the envi-
ronment, due to its all-time acquisition capability, its sensitiv-ity to geometric structures, and its penetration characteristics.However, the system-inherent speckle noise visually corruptsthe appearance of images and severely diminishes the analysisand interpretation of SAR images. Therefore, a preliminary
Manuscript received October 15, 2018; accepted November 19, 2018. Dateof publication January 4, 2019; date of current version May 28, 2019. Thiswork was supported in part by the CNES (French Space Agency) under ProjectDAJ/AR/IB-2016-10117102 and in part by the China Scholarship Council.(Corresponding author: Florence Tupin.)
W. Zhao, H. Maître, J.-M. Nicolas, and F. Tupin are with LTCI,Télécom ParisTech, Université Paris-Saclay, 75013 Paris, France (e-mail:[email protected], [email protected], [email protected], [email protected]).
C.-A. Deledalle is with IMB, CNRS, Bordeaux INP, University ofBordeaux„ F-33405 Talence, France (e-mail: [email protected]).
L. Denis is with the Laboratoire Hubert Curien UMR 5516, UJM-Saint-Etienne, CNRS, Institut d Optique Graduate School, University of Lyon,F-42023 SAINT-ETIENNE, France (e-mail: [email protected]).
Color versions of one or more of the figures in this paper are availableonline at http://ieeexplore.ieee.org.
Digital Object Identifier 10.1109/TGRS.2018.2885683
speckle reduction step is often necessary for the successfulexploitation of SAR images.
The recent and unprecedented availability of long timeseries with Sentinel-1 constellation has opened new ways forSAR speckle reduction. This highly redundant informationoffers a new paradigm. Taking inspiration from temporalmultilooking and residual noise analysis, we propose in thispaper a ratio-based denoising approach (first presented in [1]),dedicated to long multitemporal stacks.
The main problems of SAR image despeckling are the spa-tial resolution preservation, the edges and textures restoration,and the preservation of point-like targets. Spatial multilookingis a common way to reduce speckle fluctuations in a singleSAR image, at the cost of a significant spatial resolutionloss [2]. To effectively estimate the noise-free reflectivity aswell as preserve the spatial resolution, many single-channelSAR speckle reduction methods have been proposed during thepast decades. Detailed introductions of the methods are givenby Argenti et al. [2], Touzi [3], and Deledalle et al. [4]. Thesemethods mainly belong to four categories: Bayesian methodsin the spatial domain (Lee filter [5] and Lee refined filter [6]),Bayesian methods in a transformed domain [7], selection-based filtering (IDAN [8], PPB [9], and NL-SAR [10]),and sparse-based approaches [11]. Many single-SAR-imagedenoising methods are designed by combining informationin different domains (the spatial domain and a transformeddomain), with different estimation criteria and variousstatistical models of speckle and radar reflectivities [2].Several state-of-the-art single-image despeckling methodsperform a weighted average of selected surrounding pixelsvalues to estimate the speckle-free values. If the surroundingpixels are not well selected or if their associated weights arebadly chosen, an estimation bias occurs which is generallyvisible in the form of a spatial resolution loss (over-smoothingand spreading of thin structures). The accurate selection ofpixels is very challenging in single-look SAR images giventhe large fluctuations due to speckle phenomenon. Even whenusing state-of-the-art spatial denoising approaches (such asSAR-BM3D [12] or NL-SAR [10]), the smallest and leastcontrasted structures can be damaged or some noticeablespeckle fluctuations can remain after filtering.
Recently, convolutional neural networks have shown ahigh capability of denoising data affected by additive whiteGaussian noise [13]. Application to SAR images has alsobeen proposed, either through an homomorphic approach [14]
0196-2892 © 2019 IEEE. Personal use is permitted, but republication/redistribution requires IEEE permission.See http://www.ieee.org/publications_standards/publications/rights/index.html for more information.

ZHAO et al.: RATIO-BASED MULTITEMPORAL SAR IMAGES DENOISING 3553
or directly applying gamma distribution-based methods [15].Unlike traditional SAR image denoising approaches, thesemethods predict the noise-free value through the estimation ofthe speckle component. These recent techniques reach com-parable despeckling results w.r.t. state-of-the-art approaches,both in terms of signal-to-noise ratio (simulated data) and interms of spatial feature preservation. However, the trainingof these networks is time consuming and requires to build atraining set with pairs of speckle-free/speckled SAR images.
With the launch of the latest generation of SAR satellites(Cosmo-SkyMed, TerraSAR-X, ALOS-2, and Sentinel-1) [16],more and more SAR images, with shorter revisit time or higherresolution, are now available. With multitemporal images,both spatial and temporal information can be combined in thedenoising process, which gives the potential of reaching betterspeckle reduction results than is achievable when processinga single image. This is the path followed by several kindsof multitemporal denoising methods, proposing temporalweighted average [17]–[19], temporal weighted average in atransformed domain (M-TSF [20] and MSAR-BM3D [21]),change-detection-aware multitemporal average (Lê’s method[22], [23] and 2SPPB [24]), or filtering using 3-D adaptiveneighborhoods [25], [26]. A drawback of such approachesis the increased computational complexity with longer timeseries.
Multitemporal denoising methods take advantage of theincreasing availability of SAR image time series to solvethe spatial denoising problems, for the benefit of a betterspatial resolution preservation. Most of the multitemporaldenoising methods process the whole time series in orderto produce a denoised image at a given date. In this paper,we take a different approach by forming a summary of themultitemporal series (which we call a “superimage,” thespeckle in that image being strongly reduced), and by usingonly this “superimage” in addition to the speckle-corruptedimage (rather than the whole time series) to obtain a denoisedimage at any given date.
This ratio-based multitemporal denoising method fullyexploits the significant information of the multitemporal stackthrough the “superimage.” After forming the ratio imagebetween the noisy image and the “superimage,” the proposedmethod takes advantage of the state-of-the-art single-imagespeckle reduction methods to denoise the ratio image [1]. Weconsider multitemporal images acquired on the same orbit(i.e., either all ascending orbits or all descending orbits),with similar incidence angles, and which have accuratelybeen registered [27]. For the sake of reproducible research,we have released an open-source code at https://www.math.u-bordeaux.fr/~cdeledal/rabasar.php.
The contributions of this paper are the following.
1) We introduce a generic ratio-based multitemporaldenoising framework, called RABASAR, to process asingle-SAR image using a multitemporal stack.
2) We design a denoiser, called RuLoG, adapted to thestatistical distribution of the ratio image formed betweena speckle-corrupted image and a “superimage” withreduced speckle, by extending the MuLoG method pro-posed in [28].
3) We demonstrate the interest of the proposed method onsimulated and SAR time series.
The remainder of this paper is organized as follows. InSection II, we introduce the general framework of the pro-posed method. Section III presents different ways to computethe “superimage.” Then the filtering of the ratio image isdescribed in Section IV. Experimental results are presentedin Section V. Finally, some conclusions and perspectives aredrawn in Section VI.
II. PRINCIPLE OF THE PROPOSED METHOD
The temporal averaging (also called temporal multilooking)of SAR time series produces an image with reduced speckleand a preserved spatial resolution. We call such a reduced-speckle image a “superimage.” In this paper, we proposeto exploit this superimage to build a ratio-based denoisingframework.
The proposed method is composed of three main steps,illustrated in Fig. 1.
1) In the first step, a superimage is calculated from atime series of spatially registered and radiometricallycalibrated SAR images. Averaging temporal intensitysamples is the simplest way to obtain an image withreduced speckle. This corresponds to the maximum like-lihood (ML) estimation of the reflectivity when speckleis considered temporally decorrelated and temporal fluc-tuations of the reflectivity are neglected (observationsat a given pixel are then independent and identicallydistributed). In practice, changes impacting some regionsof the image may occur at some dates. Rather thanaveraging all dates, it can be beneficial to select onlyrelevant dates when forming the “superimage,” as donefor instance in [23], [24], and [29]. Moreover, becausespeckle is temporally correlated (by spatially varyingcorrelation levels), some amount of spatial denois-ing helps to produce a “superimage” where speckleis reduced everywhere. Computation of the superim-age, denoted um in the sequel, will be presented inSection III.
2) In the second step, the superimage is used to formthe ratio τt between the image vt at time t and thesuperimage, at each spatial location s
τt (s) = vt (s)
um(s). (1)
We refer to τt as the “ratio image” at time t . It containsthe residual speckle noise between the two images, andthe radiometric shifts when changes occur. When thelength of the time series increases and in the absenceof change, the superimage um converges to the reflec-tivity ut . The ratio image τt then tends to pure speckle(i.e., a collection of independent identically distributedgamma random variables with unitary mean and thesame number of looks as the original image). In contrast,when changes occur in the time series, these changesimpact the superimage which then differs from thereflectivity ut of the image at time t . Processing the ratio

3554 IEEE TRANSACTIONS ON GEOSCIENCE AND REMOTE SENSING, VOL. 57, NO. 6, JUNE 2019
Fig. 1. Summary of RABASAR method for speckle reduction of SAR time series and associated sections of this paper.
image τt is necessary to correctly recover the reflectiv-ity ut . Both the noisy image vt and the superimage um
suffer from speckle (the speckle in the superimage,though, is strongly reduced). The processing of the ratioimage requires to account for the specific noise statisticsarising from this ratio of speckled images. A denoiserdedicated to the statistics of the ratio-image is derivedin Section IV.
3) In the third step, the filtered image is recovered bymultiplying the denoised ratio image with the originalsuperimage.
III. COMPUTATION OF THE SUPERIMAGE
The superimage can be computed from a time series bydifferent ways. First, different Hölder means (such as thearithmetic or the geometric means) could be chosen; then,these means may be applied either on the intensity data or onthe amplitude data. We may expect from these choices toenhance different pieces of information [30]. In this paper,registered and radiometrically corrected intensity SAR imagesare used. We propose to use the arithmetic mean for its goodproperties [30], in particular in terms of modeling the statisticsof the superimage, with the option of using binary weights todiscard the intensity at some dates when a change occurred.
A. Statistics of SAR Images
We briefly recall in this section the statistics of fullydeveloped speckle. Under Goodman’s hypothesis [31], fullydeveloped intensity speckle follows a gamma distribution
G(u, L) depending on the number of looks L and the meanreflectivity u (the aftersought signal of interest) of the scene
pv(v | u, L) = L
u�(L)
(Lv
u
)L−1
e−Lvu . (2)
Speckle in SAR images acts like a multiplicative noise andthe speckle model can be expressed as [5]
v = u w (3)
wherew follows a gamma distribution G(1, L), the expectationis E[v] = u and the variance is Var[v] = u2/L. With theincrease of the number of looks L, the variance decreases.The proportionality between the variance and u2 reflects thatnoise is signal dependent and multiplicative.
B. Arithmetic Mean
Given a time series of T intensity values {vt (s)}Tt=1 indexedby time t , the arithmetic mean is calculated at location s by
uAMm (s) = 1
T
T∑t=1
vt (s) 1 ≤ t ≤ T . (4)
Theoretically, with: 1) no change in the time series, u1(s) =u2(s) = · · · = uT (s) and 2) T large enough and specklesufficiently decorrelated from one image to an other, averagingthe temporal intensity data is a simple yet effective approachto reduce the speckle [32]. When speckle is fully decorrelated,the arithmetic mean uAM
m (s) corresponds to the ML estimationof u(s) and the multilook image uAM
m follows a gamma distri-bution G(u, L T ). In practice, because of temporal correlations

ZHAO et al.: RATIO-BASED MULTITEMPORAL SAR IMAGES DENOISING 3555
of the speckle, the resulting equivalent number of looks (ENL)may be less than this theoretical value (L T ), especially incase of images in interferometric configuration. The associatedENL will be denoted by Lm in the following, and its estimationis discussed in Section III-D.
When changes occur in the time series, the arithmetic meanuAM
m (s) no longer matches the scene reflectivity at time t .We can reduce this discrepancy between the temporal averageand the reflectivity at date t by averaging only the unchangedtemporal samples, as described in Section III-C.
C. Binary Weighted Arithmetic Mean
Instead of computing the superimage from the time serieswithout considering the date t of the image under study,another option is to compute a dedicated superimage that iscloser to the reflectivity ut . Only samples with similar andstable reflectivities can be considered in the average. To detectthese samples, we suggest using a patch-based selection basedon the generalized-likelihood ratio (GLR) test. The GLR testbetween two independent observed intensity values v1 and v2(with the same number of looks L) confronts the following twohypotheses: the null hypothesis corresponding to a commonreflectivity value u12 accounting for the observed intensitiesv1 and v2, and the alternative hypothesis where a differentreflectivity is considered for each observation (u1 for v1 and u2for v2) to account for a change in the reflectivity between theobservations. The GLR test corresponding to this hypothesistest is given by [33]
GLR(v1, v2) = v1v2
(v1 + v2)2(5)
where constant terms are omitted. Taking the log and extend-ing the comparison to the image patches centered at locations in the images at date t and t ′ lead to [9], [24]
dt,t ′(s) =∑δ
log
(√vt (s + δ)vt ′(s + δ) +
√vt ′(s + δ)vt (s + δ)
)(6)
where vt (s + δ) is the value in the noisy patch at date t . Thesum is taken over all pixel shifts δ such that pixels with indexs + δ are located inside a patch centered on s (small squarewindow). Then, a binary weight wt,t ′(s), expressing whetherthere are temporal changes or not, is computed as
wt,t ′(s) ={
1, if dt,t ′(s) < σ0, otherwise
(7)
where σ is a threshold chosen as σ = quantile(dt,t ′(s), α)under the null hypothesis and is estimated with Monte Carlosimulations using gamma distributed data and α = 0.92 asproposed in [24].
Then, the binary-weighted arithmetic mean (denoted byBWAM in the sequel) is calculated at date t by
uBWAMtm (s) = 1∑T
t ′=1 wt,t ′(s)
T∑t ′=1
wt,t ′(s)vt ′(s) (8)
where the notation BWAMt is used to highlight that thesuperimage depends on the targeted date t . For each pixels and each date t of the stack, the weights wt,t ′(s) select
the dates t ′ for which no significant change occurred withrespect to the image at date t . Thus, the binary weightedmean uBWAMt
m (s) provides a more faithful estimation of ut (s).This improvement is obtained at the cost of an increasedcomplexity since the superimage is date specific: the stackhas to be processed for each date t , while a single superimageis computed once and for all with the (unweighted) arithmeticmean. The interest of using such a temporal mean will beevaluated in Section V.
In practice, the selection performed by the binaryweights affects the associated ENL Lm of the superimage.In Section III-D, we describe how Lm is estimated.
D. ENL Estimation
The superimage may have a spatially varying ENL becauseof temporally changing areas, because of spatially varyingcoherence or because of the use of locally computed binaryweights. To robustly estimate Lm in the superimage calculatedwith medium or high-resolution temporal SAR images, thelog-cumulant method [34] is used within sliding windows.Empirical expressions for the local first and second-order log-cumulant estimators are (for N samples)
k1(s) = 1
N
∑δ
log um(s + δ) (9)
and
k2(s) = 1
N
∑δ
[log um(s + δ)− k1(s)]2. (10)
The sums are computed over all pixel shifts δ such that pixelswith index s + δ are located inside a square window withN-pixels centered on s (in practice, we use N = 30 × 30pixels). Assuming all samples in the local window are iid,we can obtain a local estimation of the ENL by inverting thefollowing relationship (theoretical expression):
k2(s) = ψ(1, Lm(s)) (11)
where ψ is the first-order Polygamma function [34]. Notethat the traditional estimation method (by means of theratio E[um]2/Var[um]), the moment estimation method or theML estimation method could also be used for the ENLestimation [35].
Nevertheless, samples within local windows centered on sare usually not iidand the subsequent statistic Lm(s) underesti-mates Lm(s). For this reason, once the ENLs have been locallyestimated in all sliding windows, we consider a global ENL forthe whole superimage obtained by Lm = quantile(Lm(s), α)where α = 0.98 (almost the maximum). While it may beargued that the ENL varies spatially in the image, we foundon several images obtained by different sensors that using aconstant ENL value leads to satisfying results in the subse-quent denoising steps.
E. Denoising the Superimage
When the number of dates T is not large enough or when thetemporal correlation of speckle is too strong, the superimageobtained by (weighted) averaging suffers from significant
3556 IEEE TRANSACTIONS ON GEOSCIENCE AND REMOTE SENSING, VOL. 57, NO. 6, JUNE 2019
remaining speckle fluctuations. A spatial filtering step is thennecessary to improve the quality of the superimage um . Atthis step, any speckle reduction method can be used. In thispaper, we use MuLoG-BM3D [28] to perform this spatialfiltering. MuLoG-BM3D will be discussed in more details inSection IV-B, where we describe how it can be extended toprocess ratio images.
In summary, four superimages can be computed: the arith-metic mean image [according to (4)], the BWAM image[according to (8)], the denoised arithmetic mean (DAM)image, and the denoised BWAM (DBWAM) image. Theimpact of the method used to build the superimage on the out-put of RABASAR is evaluated in Section V. In the following,these four superimages will be indifferently denoted as um .
After temporal averaging and spatial filtering, the remainingnoise in the superimage follows a distribution without knownclosed-form. It can nonetheless be approximated by a gammadistribution G(um , Lm), where Lm is a constant parameter thatcan be reestimated from the data in order to fit at best theempirical distribution as described in Section III-D.
IV. RATIO IMAGE DENOISING
The ratio image τt formed at date t contains both thefluctuations due to the speckle component of the noisy imagevt (pure speckle) and some structures that appear due to thediscrepancy between the superimage um and the reflectivityut (changes of reflectivity). Compared to the noisy image vt ,the ratio image τt is spatially far more homogeneous so thatdenoising the ratio image is advantageous.
A. Statistical Analysis of the Ratio
Denoising a ratio image requires a denoising methodadapted to the statistics of the ratio between the SAR imagevt at date t and the superimage um . Despite the temporalaveraging (and possibly, the spatial filtering) of the superim-age, remaining fluctuations are present in um . The statisticaldistribution of the ratio τt = vt/um , therefore differs from thegamma distribution G(ut/um, L) followed by the more idealratio vt/um . Note that, for the sake of notation simplicity,we drop in this section the dependency with s and eachformula must be understood pixelwise. The Mellin frameworkdeveloped in [35] provides an efficient way to derive the pdfof τt . Indeed, the pdf of the product of two independentrandom variables is the Mellin convolution of the pdf ofthe two variables. The details of the computation are givenin the Appendix. It is shown that the ratio τt = vt/um
follows a Fisher pdf F(ρt , L, Lm ) with the three parametersρt = ut/um , L, and Lm
pτ (τt | ρt , L, Lm) ∝ τ L−1t
ρLt·(
Lm + Lτt
ρt
)−L−Lm
(12)
where the normalization constant depends solely on thenumber of looks L and Lm . Fisher random variableshave a multiplicative behavior, τt = ρtwt , wherewt follows a Fisher distribution F(1, L, Lm). We haveE[τt ] = ρt (Lm/(Lm − 1)), for Lm > 1, and Var[τt ] =ρ2
t (L2m(Lm + L − 1))/(L(Lm − 2)(Lm − 1)2), for Lm > 2.
The proportionality between Var[τt ] and ρ2t reveals again that
noise is signal dependent.
B. Denoising of the Ratio Image: RuLoG Algorithm
To denoise the ratio images, we need a method that canaccount for the Fisher distribution that arises when formingthe ratio between gamma-distributed random variables withdiffering number of looks. To this end, we describe in thisparagraph the MuLoG framework [28] and how it can beextended in order to apply general-purpose Gaussian denoisersto Fisher-distributed noise.
MuLoG first stabilizes the variance by applying a logarithmtransform to the image. We denote by y the log of the ratioimage τt at date t (the dependency to t is dropped to simplifythe notations) and by x = logρt = log ut/um the log ofthe ratio of the reflectivities. Thanks to the log transform, themultiplicative noise in the ratio image is mapped to an additivesignal-independent noise with expectation E[y] = x−log L
Lm+
(L) − (Lm) and variance Var[y] = ψ(1, L) + ψ(1, Lm)where (·) denotes the digamma function. This shows that,like for gamma-distributed noise, taking the log of the ratioimage stabilizes the variance of the Fisher-distributed noise.
Unlike standard homomorphic approaches, and inspiredby [36], MuLoG considers next the exact distribution of log-transformed data. Specifically, the n-pixels image x is obtainedby maximum a posteriori estimation expressed as the solutionof an optimization problem of the form
x ∈ arg minx∈Rn
[− log py(y|x)+R(x)] (13)
where the first term − log py(y|x) is the exact likeli-hood of the log-transformed ratio y, and the second termR(x) = − log px(x) is a prior enforcing some spatial regu-larity on the solution. MuLoG solves problem (13) iterativelyby the alternating direction method of multipliers (ADMM)algorithm that repeats, for β > 0, the updates
z ← arg minz∈Rn
[β
2‖z − x + d‖2 +R(z)
](14)
d ← d + z − x (15)
x ← arg minx∈Rn
[β
2‖x − z − d‖2 − log py(y|x)
]. (16)
In practice, six iterations are considered with β = 1+ 2/L +2/Lm as suggested in [28].
Regarding problem (16), in the case of gamma-distributedspeckle considered in the original MuLoG method [28],the likelihood term was corresponding to a Fisher–Tippettdistribution. As discussed in Section IV-A, the distributionof ratio images is not gamma distributed but follows aFisher distribution. Therefore, the optimization of (16) hasto be modified compared to the original MuLoG algorithm.By applying a change of variable, it can be shown that, afterthe log transform, Fisher-distributed random variables followa z-Fisher pdf [37] given by:pr (y(s) | x(s), L, Lm) ∝ exp[L(y(s)− x(s))]
· (Lm + L exp[y(s)− x(s)])−L−Lm
(17)

ZHAO et al.: RATIO-BASED MULTITEMPORAL SAR IMAGES DENOISING 3557
Fig. 2. (a) Sentinel-1 noisy image. (b) Arithmetic mean image. (c) Ratio image. (d) Denoised result on ratio image. Appearing [dark areas in (d)] anddisappearing buildings (clear areas) are located in the middle of the image.
which leads to
− log py(y|x) = Cst+N∑
s=1
[Lx(s)
+ (L + Lm) log(Lm + L exp[y(s)− x(s)])].(18)
Injecting this expression in (16) leads to solve N separableconvex problems whose solutions can be obtained by a fewiterations of Newton’s method defined by
x(s)← x(s)− β(x(s)− z(s)− d(s))+ L(1− c(s))
β + Lc(s)(
1− LLm+L c(s)
) (19)
where c(s) = (Lm + L) exp[y(s)− x(s)]/{Lm + L exp[y(s)−x(s)]}. Interestingly, when Lm → ∞, the z-Fisher pdf tendsto the Fisher–Tippett pdf, and taking the limit in (19) leads tothe original MuLoG algorithm [28].
Regarding problem (14), MuLoG adopts the strategy ofplug-and-play ADMM (see for instance [38]) which consistsin replacing the minimization problem involving R(x) by thesolution of a denoiser adapted to additive white Gaussiannoise with variance 1/β. In this paper, we consider usingBM3D [39], an algorithm based on patch similarity and 3-Dwavelet shrinkage, and reaching remarkable results with fastcomputation. We refer to this method for ratio image denoisingas ratio adaptation of MuLoG (RuLoG), see Algorithm 1.
After obtaining the estimated noise-free value ρt (s) =exp(x(s)) of the ratio, we obtain the denoised image ut
through
ut (s) = um(s) · ρt (s). (20)
The application of this pipeline—RABASAR—is illustratedin Fig. 2. A typical filtering result on a ratio image is presentedon Fig. 2(d) along with the original image, superimage, andthe ratio image. The pseudocode is given in Algorithm 2.
V. EXPERIMENTAL RESULTS
To evaluate the performances of the proposed method,different experiments have been conducted on simulated andSAR images. Recall that an open-source code of RABASAR
Algorithm 1 Extension of MuLoG to Ratio Images (RuLoG)Input: ratio image τt
number of looks L of the numeratornumber of looks Lm of the denominator
Output: Denoised ratio image ρt
1: maxADMMiter← 6 (typical value)2: maxNewtoniter← 10 (typical value)3: d ← 04: y← log(τt )5: x ← log(τt )+ log(L/Lm)+ ψ(Lm )− ψ(L)6: β ← 1+ 2
L+ 2
Lm
7: for k from 1 to maxADMMiter8: z ← BM3D_denoise(x − d,noise_std = 1/
√β)
9: d ← d + z − x
update x with a few Newton iterations:10: for � from 1 to maxNewtoniter11: c← (Lm + L) exp[y − x]/{Lm + L exp[y − x]}
12: x ← x − β(x − z − d)+ L (1− c)
β + Lc(1− LLm+L c)
13: end14: end15: return exp(x)
is available at https://www.math.u-bordeaux.fr/~cdeledal/rabasar.php.
The influence of different superimages on RABASARdenoising results are commented in Section V-C. Then,RABASAR is compared to some selected methods from theliterature: UTA [17], [18], NLTF [21], 2SPPB [24], andMSAR-BM3D [21] (Section V-D).
A. Data Presentation
1) Sentinel-1 and TerraSAR-X Images: The proposed meth-ods are tested on a time series of 69 descending Sentinel-1 IWSLC Level-1 images acquired from December 24, 2014 toMay 6, 2017 with VV polarization over Saclay area, southof Paris1 [see Fig. 2(a) and (b)]. Saclay plateau is mostly an
1All the Sentinel-1 images can be downloaded from Copernicus OpenAccess Hub (https://scihub.copernicus.eu/dhus/).
3558 IEEE TRANSACTIONS ON GEOSCIENCE AND REMOTE SENSING, VOL. 57, NO. 6, JUNE 2019
Algorithm 2 Multitemporal Speckle Reduction (RABASAR)
Input: T co-registered SAR images {vt }Tt=1,targeted date t , input number of looks L.
Output: Image with reduced speckle ut .
Step 1: computation of the super-image (AM or BWAM)
1: um ← compute_super_image(y, t)2: Lm← estimate_looks
(um)
Step 2 (optional): denoising of the super-image
3: um ← MuLoG_BM3D(um, L = Lm)4: Lm← estimate_looks
(um)
Step 3-4: denoising of the ratio image
5: τt ← vt / um
6: ρt ← RuLoG_BM3D(τt , L, Lm = Lm)
Step 5: computation of the restored image
7: ut ← um · ρt
8: return ut
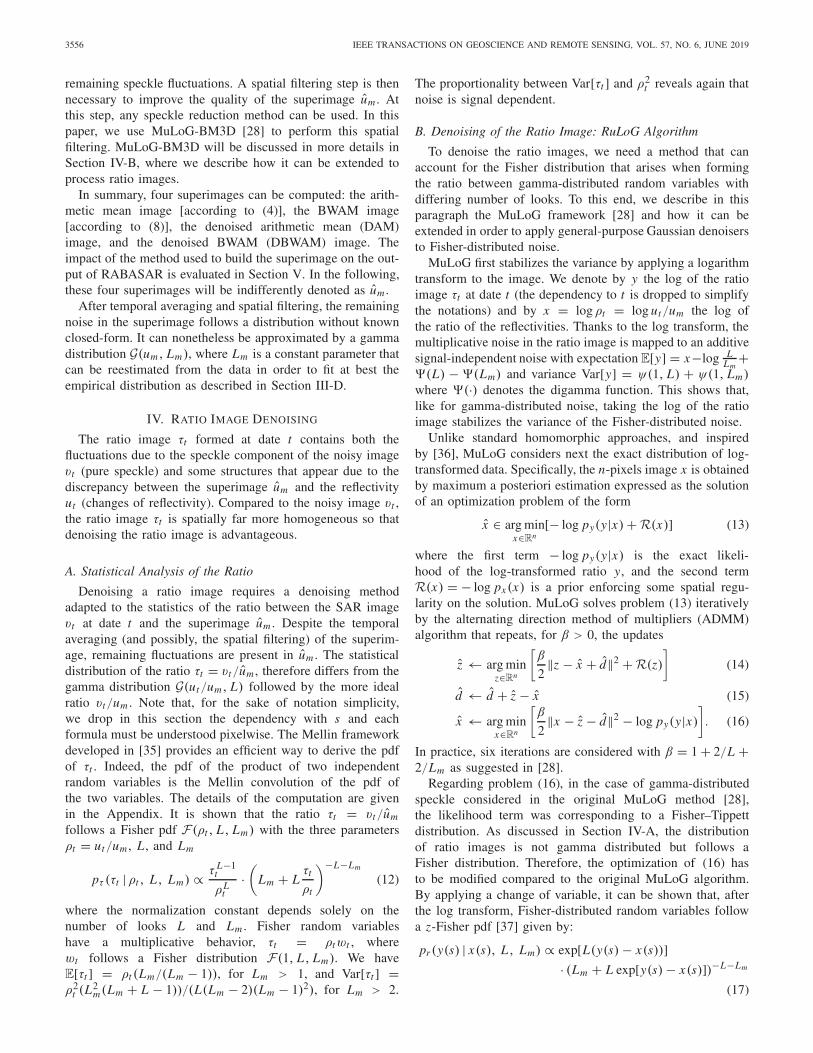
Fig. 3. TerraSAR-X series. (a) One image of the temporal series. (b)Arithmetic mean of the 26 images.
agricultural area with pieces of forests and dispersed academicbuildings. In the last five years, many new buildings andinfrastructures have been under development.
In addition, 26 single-look TerraSAR-X images (13 imagesare sensed in 2009 and the other 13 images in 2011) acquiredover Saint-Gervais-les-Bains, south-east of Geneva, are used(project DLR-MTH0232). These images are taken over ahighly mountainous countryside, with a narrow inhabitedvalley concentrating many human artifacts (roads, bridges, anddams) (see Fig. 3).
In this paper, we are dealing with images acquired ininterferometric configuration (same orbit and incidence angle).In this case, the registration step can be done accurately usingthe sensor parameters provided by the space agencies. BesidesSentinel-1 and TerraSAR-X images are radiometrically cali-brated.
It often happens that SAR pixels are not spatially inde-pendent because of a slight oversampling creating a spatialcorrelation. This spatial correlation should be taken intoaccount during the denoising. However, most of the denoising
Fig. 4. Images used for data simulation. (a) Optical image used as a noisefree image. (b) Arithmetic mean of Sentinel-1 images with the location ofdifferent land-cover types used to simulate temporal changes (green: farmlandchanges, yellow: forest changes, red: appearing building, and blue: appearingthen disappearing building.
methods are based on the hypothesis that the speckle noise iswhite. When applied directly to images with correlated noise,reduced performances may be expected from these methods.Therefore, we recommend to perform a spatial decorrelationbefore despeckling. In this paper, the noisy TerraSAR-Ximages are decorrelated using the method proposed in [40] andthe Sentinel-1 images are decorrelated by resampling becauseof its special acquisition model (the beam both steering inrange direction and steering from backward to forward inazimuth direction). All the SAR images are coregistered usingsubpixel image registration applied on the single look complexdata [27].
2) Simulated Data: Simulated SAR images are obtainedaccording to (3), by multiplying a reflectivity map with arandom gamma distributed noise.
Many simulations are based on reflectivity maps obtainedfrom optical images. However, SAR images exhibit strong andpersistent scatterers, especially in urban areas which can hardlybe simulated using optical images. Therefore, we propose touse the arithmetic mean image of long-time series of SARimages, considered as a noise free image (a reflectivity map u)to create realistic simulations of SAR images. This map uis multiplied by a gamma distributed noise wt providingan image vt = uwt of the series. These simulated datacorrespond to the case without change and are an ideal case(pure iid samples of noise). Images of Figs. 2(b), 3(b), and 4(a)are used for the simulated case without changes.
Concerning changes in the temporal series, to deal withchanges in a realistic way, temporal sequences have beenintroduced over various areas: forests, farmlands, and buildingareas as shown in Fig. 4(b). The introduced temporal changeshave been chosen according to changes observed in SAR timeseries and have the temporal profiles shown in Fig. 6.
B. Evaluation Method
Measurement of speckle reduction performances is a chal-lenging task, especially when noise-free data are unavailable.Visually checking the despeckling results is an immediateand important way for quality evaluation, but it lacksobjectivity. To overcome this limitation, we use the peak

ZHAO et al.: RATIO-BASED MULTITEMPORAL SAR IMAGES DENOISING 3559
Fig. 5. RABASAR performances obtained with different superimages, in the absence of change, as measured with (a) PSNR and (b) MSSIM. The solid linerepresents the mean value computed over 50 different noise realizations. For each index box, the bottom and top edges indicate the 25th and 75th percentiles,respectively. The outliers are plotted individually using the “+” symbol.
Fig. 6. Evaluation of RABASAR estimators in four different change scenarios: typical temporal variations of reflectivities in (a) farmland areas; (b) forestareas; (c) urban areas when a new building appears; and (d) urban areas with an appearing then disappearing structure. The mean and 1σ confidence intervalare displayed for RABASAR-AM (top curve) and RABASAR-BWAM (bottom curve).
signal-noise-ratio (PSNR) and mean structure similarityindex (MSSIM) indexes, even though they suffer from somelimitations that have been well discussed in the literature.Other criteria as the one proposed in [41] could also be used.
1) PSNR: The PSNR is a commonly used approach toevaluate the quality of restoration results. We consider thePSNR expressed on amplitude images u A = √u and u A =
√u
PSNR = 10 · log10|u A|2max
E[(u A(s)− u A(s))2] (21)
where |u A|max is the maximum amplitude value in the noisefree data, E[·] represents the spatial average and u A is thedenoised amplitude value.
2) MSSIM: To evaluate the preservation of image features,the SSIM index [42] (structural similarity index measurement)is often preferred to PSNR. From the structural similarity indexmeasurement, we derive the mean structural similarity indexmeasurement values which provide a comprehensive measure
over the whole image
MSSIM
= 1
N
N∑i=1
[2 · E[u A] · E[u A] + α1
E[u2A] + E[u2
A] + α1
2 · Cov[u A, u A] + α2
Var[u A] + Var[u A] + α2
]where u A and u A are noise free and denoised amplitudepatches, Cov[·, ·] is the measure of covariance, α1 and α2 aresuitable constants, and N is the number of local windows inthe image.
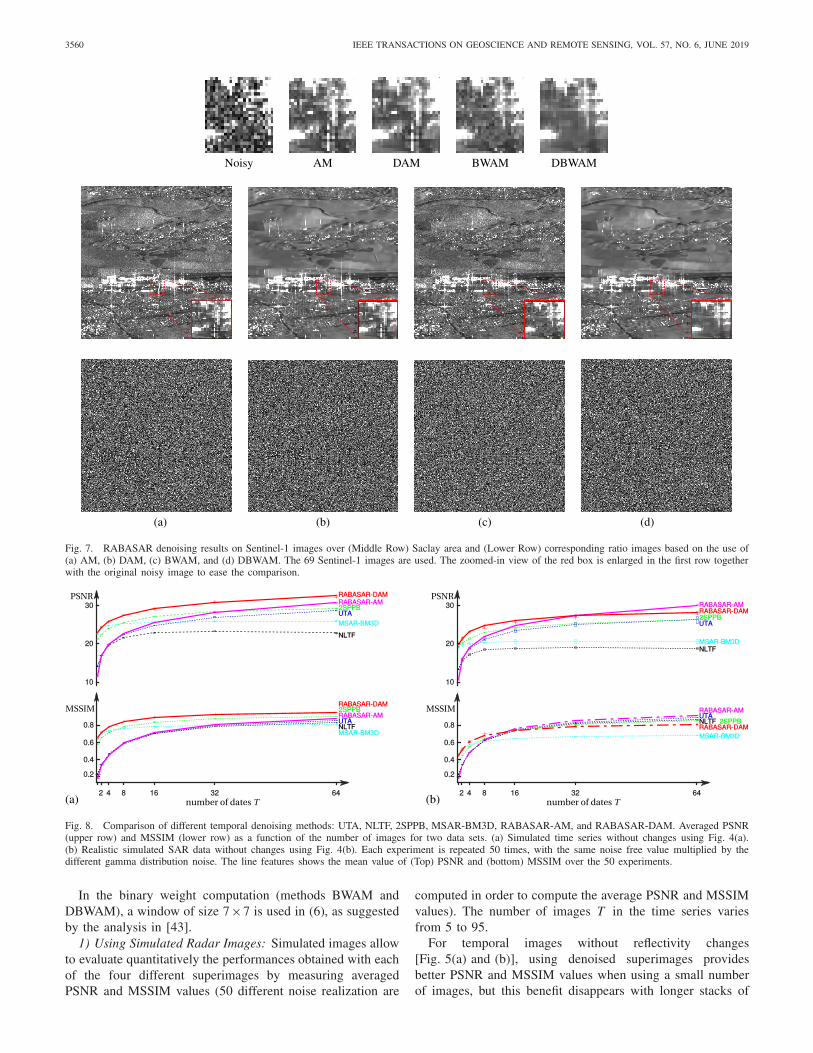
C. Which Superimage Gives the Best Denoising?
We presented in Section III-E different ways to computethe superimage (AM, BWAM, and their spatially denoisedversions). This section presents quantitative (Fig. 5) andqualitative (Fig. 7) denoising results obtained when usingdifferent superimages and considering different time serieslengths T .
3560 IEEE TRANSACTIONS ON GEOSCIENCE AND REMOTE SENSING, VOL. 57, NO. 6, JUNE 2019
Fig. 7. RABASAR denoising results on Sentinel-1 images over (Middle Row) Saclay area and (Lower Row) corresponding ratio images based on the use of(a) AM, (b) DAM, (c) BWAM, and (d) DBWAM. The 69 Sentinel-1 images are used. The zoomed-in view of the red box is enlarged in the first row togetherwith the original noisy image to ease the comparison.
Fig. 8. Comparison of different temporal denoising methods: UTA, NLTF, 2SPPB, MSAR-BM3D, RABASAR-AM, and RABASAR-DAM. Averaged PSNR(upper row) and MSSIM (lower row) as a function of the number of images for two data sets. (a) Simulated time series without changes using Fig. 4(a).(b) Realistic simulated SAR data without changes using Fig. 4(b). Each experiment is repeated 50 times, with the same noise free value multiplied by thedifferent gamma distribution noise. The line features shows the mean value of (Top) PSNR and (bottom) MSSIM over the 50 experiments.
In the binary weight computation (methods BWAM andDBWAM), a window of size 7×7 is used in (6), as suggestedby the analysis in [43].
1) Using Simulated Radar Images: Simulated images allowto evaluate quantitatively the performances obtained with eachof the four different superimages by measuring averagedPSNR and MSSIM values (50 different noise realization are
computed in order to compute the average PSNR and MSSIMvalues). The number of images T in the time series variesfrom 5 to 95.
For temporal images without reflectivity changes[Fig. 5(a) and (b)], using denoised superimages providesbetter PSNR and MSSIM values when using a small numberof images, but this benefit disappears with longer stacks of

ZHAO et al.: RATIO-BASED MULTITEMPORAL SAR IMAGES DENOISING 3561
Fig. 9. Denoising Sentinel-1 images over the region of Saclay (RuLoG results) [the original noisy image is shown in Fig. 2(a)]. Filtered with (a) 2SPPB,(b) MSAR-BM3D, (c) RABASAR-DAM, and (d) RABASAR-DBWAM. (e)-(h) Residual noise images between the noisy image and denoised results. The69 Sentinel-1 images are used.
images (more than 60). When using denoised superimages,the obtained PSNR/MSSIM values is notably impacted bythe value of the ENL.
In the case of changing areas, we performed restorationsof 50 speckle realizations in the four different change scenariosdiscussed in Section V-A2. We report in Fig. 6 that the meanvalue and 1σ confidence interval are obtained by RABASAR.It can be observed that, in the case of fluctuations typicallyobserved in farmland and forest areas [Fig. 6(a) and (b)],both RABASAR-AM and RABASAR-BWAM perform welland produce an estimate with no significant bias (the reflec-tivity varies up to a factor 2 in our simulations). Because asmaller number of dates is selected in the case of RABASAR-BWAM, the estimation variance is very slightly larger. InFig. 6(c) and (d), we consider the case of much larger changesthat typically occur in urban areas: an appearing large reflectiv-ity or a temporarily large reflectivity. In this case, RABASAR-AM leads to a bias of the same order as the estimation standarddeviation. The origin of this bias, observed in Fig. 6(c) fort ≥ 29, can be ascribed to the difference between the truereflectivity and the mean intensity. This difference is too smallto be compensated when denoising the ratio. When t < 29,the difference is much larger and no bias can be observed(after denoising, the ratio image correctly compensates forthe misfit of the superimage value). By selecting only similardates, RABASAR-BWAM is more robust to this phenomenon:the bias is negligible compared to the estimation standarddeviation. In the case of an appearing, then disappearingstructure [Fig. 6(d)], no significant bias is visible with eithermethod because the superimage with RABASAR-AM differssignificantly from the true reflectivity and that difference is
correctly recovered when denoising the ratio image (the signal-to-noise ratio is sufficient so that it be recovered).
2) Using Sentinel-1 Images: The temporal seriesof 69 Sentinel-1 images on the Saclay area is used totest the method on SAR images. Fig. 7 can be used tovisually assess the efficiency of speckle reduction whenusing different “superimages.” RABASAR provides satisfyingdenoising results with each of the four different superimages.The use of an additional spatial filtering step to form thesuperimage seems beneficial in terms of restoration quality:the obtained images are smoother.
When using AM and DAM, small areas with low val-ues were sometimes smoothed, leading to the apparition ofnew points in the denoised results [Fig. 7(a) and (b) redrectangular]. This phenomenon is obvious for impulsive andabrupt changes in building areas. Using BWAM and DBWAMreduces this problem [Fig. 7(c) and (d)]. In some changingparts of the image, using BWAM, however, leads to poorfiltering results because very few similar dates could becombined when computing the superimage.
3) Computation Time: The computation time of the algo-rithm depends on the adopted RABASAR version (type ofsuperimage -binary weighted or not-, ENL estimation methodand choice of the spatial denoising).
When running the experiments on a time serie of 69 SARimages of size 512× 768 (Saclay) in the MATLAB environ-ment on a computer [4 cores, Intel(R) Core(TM) i7-7600UCPU @ 2.80 GHz], the averaged elapsed time of RABASAR-DBWAM is given in Table I.
As can bee seen, the main part of RABASAR computingtime is due to the denoising step. If both the superimage and

3562 IEEE TRANSACTIONS ON GEOSCIENCE AND REMOTE SENSING, VOL. 57, NO. 6, JUNE 2019
Fig. 10. Denoising results of TerraSAR-X images over Saint-Gervais (using Rulog). The original noisy image is available in Fig. 4(f). (a) 2SPPB. (b) MSAR-BM3D. (c) RABASAR-DAM. (d) RABASAR-DBWAM. (e)–(h) Residual noise images (ratio of noisy image and denoised results). The 26 TerraSAR-Ximages are used.
TABLE I
AVERAGED COMPUTATION TIME OVER 10 RUNS OF DIFFERENT STEPSFOR A TIME SERIES OF 69 IMAGES WITH SIZE 512× 768 PIXELS
the ratio image are denoised, the time is multiplied by 2. Thesimilarity and weight computation represents only 1% of thetotal time. Nevertheless, when using BWAM, the superim-age has to be computed again for each image to process,whereas the superimage computation is done only once forAM or DAM versions of RABASAR.
D. Denoising Performances of RABASAR Comparedto Existing Methods
The proposed method is compared with state-of-the-artmultitemporal denoising methods, both on simulated and SARimages. Numerical and visual results are provided when com-paring RABASAR with the chosen methods: UTA [18], NLTF[21], 2SPPB [24], and MSAR-BM3D [21].
1) Quantitative Comparison: As in the previous sections,to quantitatively compare the filtering performance of thesemethods, averaged PSNR and MSSIM are computed. OnlyRABASAR-AM and RABASAR-DAM performances are pre-sented in the curves of Fig. 8.
In this simulation, we see from Fig. 8, that RABASARgenerally provides better PSNR than other filtering methods.
With few images in the stack, MSAR-BM3D, and 2SPPBalso provide competitive PSNR and MSSIM. However, withthe increase of the number of images, MSAR-BM3D curvedoes not rise as fast as 2SPPB. When using less than fourimages, MSAR-BM3D provides the best MSSIM values. Withan increasing number of images, UTA PSNR, and MSSIMvalues keep increasing.
Table II presents some results about PSNR and MSSIMresults. It shows that RABASAR-DAM provides the bestresults in this ideal situation when there is no change in thetemporal series.
2) Sentinel-1 and TerraSAR-X Image Denoising: Thissection presents and discusses the results obtained whendenoising Sentinel-1 and TerraSAR-X images. Since thenoise free images are not available, the denoised resultsand the residual noise (ratio of the original image by thedenoised image) are visually evaluated. The residual noiseshould correspond to pure gamma-distributed noise samples ofmean 1. Residual structures, homogeneous areas, and radio-metric variations correspond to the following perturbations:the destruction of structures, the absence of filtering, and biasintroduction.
Fig. 9 presents different filtering results on a Sentinel-1 timeserie of Saclay. Compared to 2SPPB and MSAR-BM3Dmethods, RABASAR-DAM and RABASAR-DBWAM pro-vide better denoising results since they take both the ratioresults and the texture characteristics into account. Some noisyareas can be observed in the RABASAR-DBWAM resultsdue to the temporal samples selection (for some pixels, onlyfew similar temporal samples can be found to compute theBWAM). The 2SPPB method does not give good results forseasonal changing farmland areas, and shows an obvious bias

ZHAO et al.: RATIO-BASED MULTITEMPORAL SAR IMAGES DENOISING 3563
TABLE II
NUMERICAL RESULTS PROVIDED BY DIFFERENT METHODS WITH 32 IMAGES IN THE SERIES. EVALUATION IS MADE BY PSNR AND MSSIM.FOR PSNR AND MSSIM, LARGER VALUES EXPRESS BETTER DENOISING RESULTS. THE MEAN VALUES OF 20 TIMES TEST ARE USED
Fig. 11. (a) Noisy image and (b) and (c) denoising results of MuLoG-BM3D and RABASAR-DAM. The 64 resampled Sentinel-1 images are usedto calculate the arithmetic mean image.
in the residual noise [see, for instance, the blue circle areain Fig. 9(e)].
Since MSAR-BM3D method detects the bright points inadvance and prohibits any denoising around these points [21],building areas in the residual noise are homogeneous [Fig. 9(f)red circle area] showing that no filtering has been applied inthese areas [Fig. 9(b) red circle area].
This also explains why MSAR-BM3D has lower PSNR val-ues. In addition, some of the textures in MSAR-BM3D resultsare over smoothed, such as the blue circle area in Fig. 9(b).
Similar phenomena can be observed on the TerraSAR-Ximages presented Fig. 10. Whereas Fig. 10(c) and (d) visuallyprovide satisfying results and homogeneous residual noiseimages, both 2SPPB and MSAR-BM3D smoothed out sometextures (Fig. 10 blue circle areas), or keep unchanged somenoisy areas.
Compared to MuLoG-BM3D applied on a single image,RABASAR-DAM provides a much better result, preservingfine structures and isolated objects (see Fig. 11). This exper-iment shows that the exploitation of the superimage and theratio image, which is much more stationary than the originalnoisy image, helps preserving the original resolution.
VI. CONCLUSION
This paper has proposed a ratio-based multitemporal denois-ing framework. During the restoration of each SAR image,it exploits the temporal information through a superimage.The use of different strategies to compute the superimageshas been analyzed. RABASAR can provide better PSNRand MSSIM values when using a spatially denoised super-image. With the increase of the number of images in thetime series, the differences of using different superimagesdecrease. When there are changes in the time series, using aBWAM can also provide good results. Based on the processingof time series corrupted by simulated speckle noise, actualSentinel-1 stacks and TerraSAR-X stacks, the qualitative andquantitative comparisons with UTA, NLTF, and MSAR-BM3Dand 2SPPB methods showed the potential of RABASAR tobetter preserve structures in multitemporal SAR images whileefficiently removing speckle. Besides, the superimage can beeasily updated when a new data becomes available so as toprocess new images online.
The future work will be devoted to the updating framework,especially for the “recomputation” of the superimage and tothe further processing of denoised time series.
APPENDIX
DISTRIBUTION OF THE RATIO IMAGE
In this appendix, we present a simple way of deriving thedistribution (pdf) followed by the ratio τt = vt
um. The pdf of
the ratio of 2 gamma-distributed random variables has beenestablished in [44], and used in [45] for edge detection inSAR images. Following [46] and [47], the Mellin frameworkallows a straightforward derivation.
We assume that the numerator vt follows a gamma distribu-tion G(ut , L), the denominator um follows a gamma distribu-tion G(um, Lm), and that vt and um are independent. We willdenote by × the Mellin convolution, and H(u) the homotheticpdf defined by H(u)(ν) = (1/u)δ((ν/u) − 1). We have thefollowing relationship between a gamma distributed pdf of
3564 IEEE TRANSACTIONS ON GEOSCIENCE AND REMOTE SENSING, VOL. 57, NO. 6, JUNE 2019
mean 1 and a gamma pdf of mean ut [35]:G(ut , L) = H(ut ) × G(1, L).
In the same way, we have the following relation for the pdfof um :
G(um , Lm) = H(um) × G(1, Lm).
The variable u−1m follows an inverse gamma distribution GI
given by:pu−1
m(u−1
m | um, Lm) = [H(u−1m ) × GI(1, Lm)](u−1
m )
with
GI(μ,M)(ν) = 1
�(M)
1
Mμ
(Mμ
ν
)(M+1)
e−Mμν .
Multiplying the variables vt and (1/um), we thus have theMellin convolution of H(ut/um), G(1, L), and GI(1, Lm)which leads to a Fisher pdf F(ρt , L, Lm ) [35], [47], notingρt = (ut/um)
pτt (τt | ρt , L, Lm) = [H(ρt )×G(1, L)×GI(1, Lm)](τt )
= [H(ρt )×F(1, L, Lm)](τt )
= F(ρt , L, Lm )(τt )
= L
Lm
1
ρt
�(L + Lm)
�(L)�(Lm )
( LLm
τtρt)L−1
(1+ LLm
τtρt)(L+Lm)
.
REFERENCES
[1] W. Zhao, C.-A. Deledalle, L. Denis, H. Maître, J.-M. Nicolas, andF. Tupin, “RABASAR: A fast ratio based multi-temporal SAR despeck-ling,” in Proc. IEEE Int. Geosci. Remote Sens. Symp. (IGARSS),Jul. 2018, pp. 4197–4200.
[2] F. Argenti, A. Lapini, T. Bianchi, and L. Alparone, “A tutorial on specklereduction in synthetic aperture radar images,” IEEE Geosci. RemoteSens. Mag., vol. 1, no. 3, pp. 6–35, Sep. 2013.
[3] R. Touzi, “A review of speckle filtering in the context of estima-tion theory,” IEEE Trans. Geosci. Remote Sens., vol. 40, no. 11,pp. 2392–2404, Nov. 2002.
[4] C.-A. Deledalle, L. Denis, G. Poggi, F. Tupin, and L. Verdoliva,“Exploiting patch similarity for SAR image processing: The nonlocalparadigm,” IEEE Signal Process. Mag., vol. 31, no. 4, pp. 69–78,Jul. 2014.
[5] J.-S. Lee, “Speckle analysis and smoothing of synthetic aperture radarimages,” Comput. Graph. Image Process., vol. 17, no. 1, pp. 24–32,1981.
[6] J.-S. Lee, “Refined filtering of image noise using local statistics,”Comput. Graph. Image Process., vol. 15, no. 4, pp. 380–389, 1981.
[7] P. Meer, R. H. Park and K. J. Cho, “Multiresolution adaptive imagesmoothing,” CVGIP, Graph. Models Image Process., vol. 56, no. 2,pp. 140–148, 1994.
[8] G. Vasilé, E. Trouve, J.-S. Lee, and V. Buzuloiu, “Intensity-drivenadaptive-neighborhood technique for polarimetric and interferometricSAR parameters estimation,” IEEE Trans. Geosci. Remote Sens., vol. 44,no. 6, pp. 1609–1621, Jun. 2006.
[9] C.-A. Deledalle, L. Denis, and F. Tupin, “Iterative weighted maximumlikelihood denoising with probabilistic patch-based weights,” IEEETrans. Image Process., vol. 18, no. 12, pp. 2661–2672, Dec. 2009.
[10] C.-A. Deledalle, L. Denis, F. Tupin, A. Reigber, and M. Jäger, “NL-SAR:A unified nonlocal framework for resolution-preserving (Pol)(In)SARdenoising,” IEEE Trans. Geosci. Remote Sens., vol. 53, no. 4,pp. 2021–2038, Apr. 2015.
[11] S. Foucher, “SAR image filtering via learned dictionaries and sparse rep-resentations,” in Proc. IEEE Int. Geosci. Remote Sens. Symp. (IGARSS),vol. 1, Jul. 2008, pp. I-229–I-232.
[12] S. Parrilli, M. Poderico, C. V. Angelino, and L. Verdoliva, “A nonlocalSAR image denoising algorithm based on LLMMSE wavelet shrink-age,” IEEE Trans. Geosci. Remote Sens., vol. 50, no. 2, pp. 606–616,Feb. 2012.
[13] K. Zhang, W. Zuo, Y. Chen, D. Meng, and L. Zhang, “Beyond aGaussian Denoiser: Residual learning of deep CNN for image denois-ing,” IEEE Trans. Image Process., vol. 26, no. 7, pp. 3142–3155,Jul. 2017.
[14] G. Chierchia, D. Cozzolino, G. Poggi, and L. Verdoliva. (2017). “SARimage despeckling through convolutional neural networks.” [Online].Available: https://arxiv.org/abs/1704.00275
[15] P. Wang, H. Zhang, and V. M. Patel, “SAR image despeckling usinga convolutional neural network,” IEEE Signal Process. Lett., vol. 24,no. 12, pp. 1763–1767, Dec. 2017.
[16] A. Moreira, P. Prats-Iraola, M. Younis, G. Krieger, I. Hajnsek, andK. P. Papathanassiou, “A tutorial on synthetic aperture radar,” IEEEGeosci. Remote Sens. Mag., vol. 1, no. 1, pp. 6–43, Mar. 2013.
[17] J.-J. Lee, M. R. Grunes, and S. A. Mango, “Speckle reduction inmultipolarization, multifrequency SAR imagery,” IEEE Trans. Geosci.Remote Sens., vol. 29, no. 4, pp. 535–544, Jul. 1991.
[18] S. Quegan, T. L. Toan, J. J. Yu, F. Ribbes, and N. Floury, “MultitemporalERS SAR analysis applied to forest mapping,” IEEE Trans. Geosci.Remote Sens., vol. 38, no. 2, pp. 741–753, Mar. 2000.
[19] S. Quegan and J. J. Yu, “Filtering of multichannel SAR images,” IEEETrans. Geosci. Remote Sens., vol. 39, no. 11, pp. 2373–2379, Nov. 2001.
[20] D. Coltuc, E. Trouvé, F. Bujor, N. Classeau, and J. P. Rudant, “Time-space filtering of multitemporal SAR images,” in Proc. Geosci. RemoteSens. Symp. (IGARSS), vol. 7, Jul. 2000, pp. 2909–2911.
[21] G. Chierchia, M. El Gheche, G. Scarpa, and L. Verdoliva, “Multitem-poral SAR image despeckling based on block-matching and collabo-rative filtering,” IEEE Trans. Geosci. Remote Sens., vol. 55, no. 10,pp. 5467–5480, Oct. 2017.
[22] T. T. Lê, A. M. Atto, E. Trouvé, and J.-M. Nicolas, “Adaptive multitem-poral SAR image filtering based on the change detection matrix,” IEEEGeosci. Remote Sens. Lett., vol. 11, no. 10, pp. 1826–1830, Oct. 2014.
[23] T. T. Lê, A. M. Atto, E. Trouvé, A. Solikhin, and V. Pinel, “Changedetection matrix for multitemporal filtering and change analysis of SARand PolSAR image time series,” ISPRS J. Photogram. Remote Sens.,vol. 107, pp. 64–76, Sep. 2015.
[24] X. Su, C. Deledalle, F. Tupin, and H. Sun, “Two-step multitemporalnonlocal means for synthetic aperture radar images,” IEEE Trans.Geosci. Remote Sens., vol. 52, no. 10, pp. 6181–6196, Nov. 2014.
[25] M. Ciuc, P. Bolon, E. Trouvé, V. Buzuloiu, and J.-P. Rudant, “Adaptive-neighborhood speckle removal in multitemporal synthetic aperture radarimages,” Appl. Opt., vol. 40, no. 32, pp. 5954–5966, 2001.
[26] S. Lobry, L. Denis, and F. Tupin, “Multitemporal SAR image decom-position into strong scatterers, background, and speckle,” IEEE J. Sel.Topics Appl. Earth Observ. Remote Sens., vol. 9, no. 8, pp. 3419–3429,Aug. 2016.
[27] J.-M. Nicolas et al., “A first comparison of Cosmo-Skymed andTerraSAR-X data over chamonix Mont-Blanc test-site,” in Proc. Geosci.Remote Sens. Symp. (IGARSS), Jul. 2012, pp. 5586–5589.
[28] C.-A. Deledalle, L. Denis, S. Tabti, and F. Tupin, “MuLoG, or howto apply Gaussian denoisers to multi-channel SAR speckle reduction?”IEEE Trans. Image Process., vol. 26, no. 9, pp. 4389–4403, Sep. 2017.
[29] X. Su, C.-A. Deledalle, F. Tupin, and H. Sun, “NORCAMA: Changeanalysis in SAR time series by likelihood ratio change matrix clustering,”ISPRS J. Photogram. Remote Sens., vol. 101, pp. 247–261, Sep. 2015.
[30] G. Quin, B. Pinel-Puyssegur, J.-M. Nicolas, and P. Loreaux, “MIMOSA:An automatic change detection method for SAR time series,” IEEETrans. Geosci. Remote Sens., vol. 52, no. 9, pp. 5349–5363, Sep. 2014.
[31] J. W. Goodman, Speckle Phenomena in Optics: Theory and Applications.Englewood, CO, USA: Roberts and Company Publishers, 2007.
[32] C. Oliver, Understanding Synthetic Aperture Radar Images. West Perth,WA, Australia: SciTech, 2004.
[33] C.-A. Deledalle, L. Denis, and F. Tupin, “How to compare noisypatches? Patch similarity beyond Gaussian noise,” Int. J. Comput. Vis.,vol. 99, no. 1, pp. 86–102, 2012.
[34] C. Tison, J. M. Nicolas, F. Tupin, and H. Maitre, “A new statisticalmodel for Markovian classification of urban areas in high-resolutionSAR images,” IEEE Trans. Geosci. Remote Sens., vol. 42, no. 10,pp. 2046–2057, Oct. 2004.
[35] J. M. Nicolas, “Introduction to second kind statistics: Application of log-moments and log-cumulants to the analysis of radar image distributions,”Trait. Signal, vol. 19, no. 3, pp. 139–167, 2002.
[36] J. M. Bioucas-Dias and M. A. T. Figueiredo, “Multiplicative noiseremoval using variable splitting and constrained optimization,” IEEETrans. Image Process., vol. 19, no. 7, pp. 1720–1730, Jul. 2010.
[37] R. A. Fisher, “On a distribution yielding the error functions of severalwell known statistics,” in Proc. Int. Congr. Math., pp. 493–502, 1924.

ZHAO et al.: RATIO-BASED MULTITEMPORAL SAR IMAGES DENOISING 3565
[38] S. H. Chan, X. Wang, and O. A. Elgendy, “Plug-and-play admm forimage restoration: Fixed-point convergence and applications,” IEEETrans. Comput. Imag., vol. 3, no. 1, pp. 84–98, Jan. 2017.
[39] K. Dabov, A. Foi, V. Katkovnik, and K. Egiazarian, “Image denoisingby sparse 3-D transform-domain collaborative filtering,” IEEE Trans.Image Process., vol. 16, no. 8, pp. 2080–2095, Aug. 2007.
[40] R. Abergel, L. Denis, S. Ladjal, and F. Tupin, “Subpixellic methodsfor sidelobes suppression and strong targets extraction in single lookcomplex SAR images,” IEEE J. Sel. Topics Appl. Earth Observ. RemoteSens., vol. 11, no. 3, pp. 759–776, Mar. 2018.
[41] L. Gomez, R. Ospina, and A. C. Frery, “Unassisted quantitative evalu-ation of despeckling filters,” Remote Sens., vol. 9, no. 4, p. 389, 2017.
[42] Z. Wang, A. C. Bovik, H. R. Sheikh, and E. P. Simoncelli, “Imagequality assessment: From error visibility to structural similarity,” IEEETrans. Image Process., vol. 13, no. 4, pp. 600–612, Apr. 2004.
[43] A. Buades, B. Coll, and J.-M. Morel, “A non-local algorithm for imagedenoising,” in Proc. IEEE Comput. Soc. Conf. Comput. Vis. PatternRecognit. (CVPR), vol. 2, Jun. 2005, pp. 60–65.
[44] H. Cramér, Mathematical Methods of Statistics (PMS–9). Princeton, NJ,USA: Princeton Univ. Press, 1946.
[45] R. Touzi, A. Lopes, and P. Bousquet, “A statistical and geometricaledge detector for SAR images,” IEEE Trans. Geosci. Remote Sens.,vol. GRS-26, no. 6, pp. 764–773, Nov. 1988.
[46] B. Epstein, “Some applications of the Mellin transform in statistics,”Ann. Math. Statist., vol. 19, no. 3, pp. 370–379, 1948.
[47] J. M. Nicolas, “A Fisher-MAP filter for SAR image processing,” inProc. IEEE Int. Geosci. Remote Sens. Symp. (IGARSS), vol. 3, Jul. 2003,pp. 1996–1998.
Weiying Zhao is currently pursuing the Ph.D.degree with Telecom ParisTech, University of Paris-Saclay, Paris, France.
His research interests include multitemporal SARimage denoising and change analysis, InSAR, imageprocessing, and machine learning.
Charles-Alban Deledalle received the Engineeringdegree from the École Pour l’Informatique et lesTechniques Avancées, Le Kremlin-Bicêtre, France,in 2008, the master’s degree from the University ofParis VI, Paris, France, in 2008, and the Ph.D. degreefrom Telecom ParisTech, Paris, in 2011.
He is currently a Researcher with CNRS, IMB,University of Bordeaux, Bordeaux, France, and aVisiting Professor with the University of California,San Diego, CA, USA. His research interests includeimage denoising and inverse problems.
Dr. Deledalle received the IEEE ICIP Best Student Paper Award in 2010,the ISIS/EEA/GRETSI Best PhD Award in 2012, and the IEEE GRSSTransactions Prize Paper Award in 2016.
Loïc Denis received the M.Sc. degree from CPELyon, Villeurbanne, France, in 2003, and the Ph.D.degree from the Université de Saint-Etienne, Saint-Etienne, France, in 2006.
He is currently an Associate Professor with theUniversité de Lyon, Lyon, France. His researchinterests include image denoising and reconstruction,radar image processing, deconvolution, and digitalholography.
Dr. Denis was a co-recipient of the IEEE ICIPBest Student Paper Award in 2010, the EURASIP
EUSIPCO Best Student Paper Award in 2015, and the IEEE Geoscience andRemote Sensing Society 2016 Transactions Prize Paper Award.
Henri Maître received the Engineering degree fromthe Ecole Centrale de Lyon, Lyon, France, in 1971,and the Docteur es Sciences degree in physics fromParis VI University, Paris, France, in 1982.
Since 1973, he has been with Telecom ParisTech,Paris, where he taught digital picture processingand is currently an Emeritus Professor. His researchinterests include satellite image processing and com-putational photography.
Jean-Marie Nicolas received the degree from theEcole Normale Supérieure de Saint Cloud, Paris,France, in 1979, and the Ph.D. degree in physicsfrom the University of Paris XI, Paris, France,in 1982.
He was a Research Scientist in medical imaging atthe Laboratoire d’Electronique Philips, and at Thom-son CSF, Thomson Sintra Activités Sous Marines,and at Laboratoire Central de Recherche in signaland image processing.
He is currently a Professor at Image, Data, SignalDepartment, LTCI, Telecom ParisTech IDS, Paris. His research interestsinclude concern radar imaging.
Florence Tupin (SM’07) received the Engineeringdegree in 1994, the Ph.D. degree in signal andimage processing from Ecole Nationale Superieuredes Telecommunications, Paris, France, in 1997, andthe Habilitation á Diriger des Recherches degreefrom the University of Rennes in 2007.
She is currently a Professor with Telecom Paris-Tech, Paris, France. From 1997 to 1998, she waswith SAGEM, Paris, where she was involved infingerprint recognition. Since 1998, she has beenan Associate Professor and a Professor of image
and signal processing with the Image, Data, Signal Department, TelecomParisTech, Paris. Since 2014, she has been the Head of the Image, Modeling,Analysis, Geometry, Synthesis Group. She has co-authored over 200 papers.Her research interests include image processing and analysis, especially forremote sensing and synthetic aperture radar imagery applications, and earthobservation.
Dr. Tupin was a recipient of several awards, among them the IEEE TGRSTransactions Prize Paper Award in 2016 for works on nonlocal specklefiltering. She was a Chair of the Urban Remote Sensing Joint Event heldin Paris, in 2007. Since 2003, she has been a member of International andNational Technical Committees. From 2005 to 2007, she was an AssociateEditor of the French journal Signal Processing and from 2007 to 2016, sheserved as an Associate Editor of the IEEE TRANSACTIONS ON GEOSCIENCEAND REMOTE SENSING.