Ratio Analysis Project GMR Infra Ltd
20
LIVE PROJECT REPORT IN FINANCIAL MANAGEMENT AN ANALYSIS OF BALANCE SHEET OF GMR INFRA LTD Submitted To: Submitted By: 1
-
Upload
raja-sekhar -
Category
Documents
-
view
147 -
download
8
Transcript of Ratio Analysis Project GMR Infra Ltd

LIVE PROJECT REPORT IN FINANCIAL MANAGEMENT
AN ANALYSIS OF BALANCE SHEET OF GMR INFRA LTD
Submitted To: Submitted By:
1

TITLE
AN ANALYSIS OF FINANCIAL STATEMENTS OF GMR INFRA BY RATIO ANALYSIS
2

TABLE OF CONTENTS
INTRODUCTION 1-4
OBJECTIVE 4
METHODOLOGY 5-6
DATA ANLYSIS 6-11
FINDINGS 11-13
CONCLUSION 13
3

INTRODUCTION: GMR Group is an Indian business group that is in to Energy and Infrastructure sectors. It is based in Bangalore, India. The group has emerged as a big player in the airport development space and is presently developing the Delhi and Hyderabad airports. GMR also owns Indian Premier League's (A Twenty20 Cricket league in India) Delhi franchise, Delhi Daredevils. Grandhi Mallikarjun Rao is the Chairman and Managing director of GMR group. With an estimated personal worth of $6.2 billion dollars, G M Rao stands at #198 in Forbes' 2008 World Billionaire list.
Key Companies
GMR Group is one of the fastest growing infrastructure companies in India and has interests in Airports, Highways, Energy and Urban Infrastructure. It other area of interest is Agri-Business.
4

GMR Holdings Private Limited is the holding company for The GMR Group of Companies.
The two main subsidiary companies are
GMR Infrastructure LimitedGMR Industries Limited
GMR Infrastructure Limited has over 23 subsidiaries in the following sectors
Energy
Badrinath Hydro PowerVemagiri Power GenerationGMR Bajoli Power ProjectGMR Chattisgarh Power ProjectUpper Karnali Power Project
GMR Orissa Power Plant Kakinada Barge Mounted Power Plant (Being relocated from Tanirbavi)
Highways
Tambaram-TindivanamTuni-AnkapalliAmbala-ChandigarhAdloor-Gundla PonchanpalliTindivanam-UlunderpetThondapalli-Jadcherla
Airports
Hyderabad AirportDelhi Airport. Sabiha Gokcen International Airport, Istanbul, Turkey.
5

Urban Infrastructure
SEZ in Krishnagiri District, Tamil Nadu
Apart from this GMR group has interests in several other areas. It's most recent entry was into the field of Sports - specifically into Indian Premier League For Cricket. It bought the IPL Delhi team franchise. The team was named Delhi Daredevils and will be participating in the 59 match 44-day 8-team Indian Premier League cricket tournament starting April 18.
Also, the company announced the purchase of 50% stake in Intergen N.V. on June 25th 2008 in a transaction valued at US$1.1 billion. This was the largest ever acquisition of a global energy utility by an indian company
OBJECTIVE:
The objective of this project is to find out the liquidity, and profitability position of GMR INFRA LTD
RESEARCH METHODOLOGY:
The research methodology used here is:
Defining the objective
Developing the information and resources
Collecting the information
Analysis of collected information
Findings
The tool used in this study is Ratio analysis. It is a quantitative investment
technique used for comparing a company's financial performance to the
6
market in general. A change in these ratios helps to bring about a change in
the way a company works. It helps to identify areas where the management
needs to change. This is the most prevalent method of analyzing a balance
sheet is through ratio analysis. The ratio analysis can be for a single year or
it may extend to more than one year. The ratios can also be compared with
similar ratios of others concerns to make a comparative study.
.First, all ratios will be worked out for each year and each set of comparable
items.
.The ratios worked out will be put in the context of a trend over several
years.
.They will be compared with similar companies/ standard ratios.
i) for the year concerned, and
ii) Over a period of time.
Any number of ratios can be prepared by comparing any two figures
available in the balance sheet or profits and loss account or both. But to
serve its purpose, the figures compared should be meaningful, having a link
between them, and should satisfy the needs of the person who analysis the
financial statements.
Ratios are also classified differently on different bases. The mostly used one
is the financial classification under which the ratios are broadly divided into
the following five classes:
1. Liquidity ratios concerned with the short term solvency of the concern or
its ability to meet financial obligation on their due dates.
7

2. Activity ratios concerning efficiency of management of various assets by
the concern.
3. Leverage ratios concerning stake of the owners in the business in relation
to outside borrowings or long term solvency.
4. Coverage ratios concerned with the ability of the company to meet fixed
commitments such as interest on term loans and dividend on preference
shares and
5. Profitability ratios concerned with the profitability of the concern.
DATA NALYSIS:
In this study, Liquidity ratios are used to find out the liquidity position of
GMR INFRA LIMITED. by comparing the past three years financial
performances from the balance sheet and variations in working capital are
studied.
Liquidity Ratios: Liquidity implies the firm’s ability to pay its debts in short
run. This ability can be measured by the use of Liquidity Ratios. Short term
liquidity involves the relationship between current assets and current
liabilities. If a firm has sufficient net working capital it is assumed to have
enough liquidity. The current ratio and the quick ratio are the two ratios,
which directly measures the liquidity.
Current Ratio(Working Capital Ratio):
The ratio is worked out by dividing the current assets of the concern by its
current liabilities.
8

Current Ratio= current assets/current liabilities.
Current ratios indicate the relation between current assets and current
liabilities. Current liabilities represent the immediate financial obligations of
the company. Current assets are the sources of repayment of current
liabilities. Therefore, the ratio measures the capacity of the company to meet
financial obligation as and when they arise. Textbooks claim a ratio of 1.5 to
2 is ideal; bit in practice this is rarely achieved. This ratio is also known as
working capital ratio.
Quick Ratio (Acid-Test Ratio):
Quick assets represent current assets excluding stock and prepaid expenses.
Stock is excluded because it is not immediately realizable in cash. Prepaid
expenses are excluded because they cannot be realized in cash. It is a
stringent test that indicates if a firm has enough short-term assets to cover its
immediate liabilities. It is more reliable than current ratio because it
considers only the most liquid assets and does not include the hidden factors
like window dressing that may skew the actual scenario.
Quick Ratio = Quick Assets/Current liabilities.
= (Current Assets-Inventories)/Current Liabilities.
One of the defects of current ratio is that it does not measure accurately to
meet financial commitments as and when they arise. This is because the
current assets include also items that are not easily realizable, such as stock.
9

The acid test ratio is a refinement of current ratio and is calculated to
measure the ability of the company to meet the liquidity requirements in the
immediate future. A minimum of 1: 1 is expected which indicates that the
concern can fully meet its financial obligations. This also called as Liquid
ratio or Quick ratio.
Working Capital:
Working capital, also known as net working capital, is a
financial metric which represents operating liquidity available to a business.
Along with fixed assets such as plant and equipment, working capital is
considered a part of operating capital. It is calculated as current assets minus
current liabilities. If current assets are less than current liabilities, an entity
has a working capital deficiency, also called a working capital deficit.
A company can be endowed with assets and profitability but short of
liquidity if its assets cannot readily be converted into cash. Positive working
capital is required to ensure that a firm is able to continue its operations and
that it has sufficient funds to satisfy both maturing short-term debt and
upcoming operational expenses. The management of working capital
involves managing inventories, accounts receivable and payable and cash.
Working Capital = Current Assets – Current liabilities
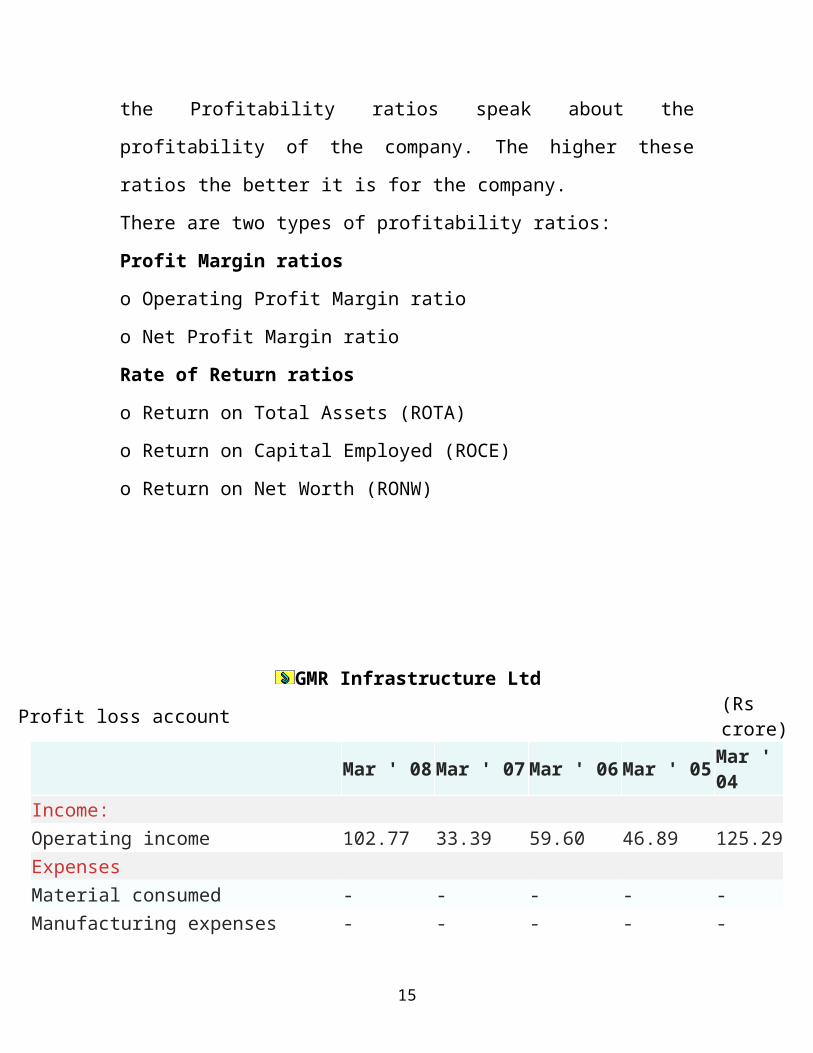
Profitability Ratios:
10

Profitability Ratios show how successful a
company is in terms of generating returns or profits on the Investment that it
has made in the business i.e. the Profitability ratios speak about the
profitability of the company. The higher these ratios the better it is for the
company.
There are two types of profitability ratios:
Profit Margin ratios
o Operating Profit Margin ratio
o Net Profit Margin ratio
Rate of Return ratios
o Return on Total Assets (ROTA)
o Return on Capital Employed (ROCE)
o Return on Net Worth (RONW)
GMR Infrastructure LtdProfit loss account (Rs crore)
Mar ' 08 Mar ' 07 Mar ' 06 Mar ' 05 Mar ' 04
Income: Operating income 102.77 33.39 59.60 46.89 125.29Expenses Material consumed - - - - -Manufacturing expenses - - - - -Personnel expenses 5.96 0.34 1.23 0.37 5.17Selling expenses 2.92 0.84 0.05 - -Adminstrative expenses 5.75 1.72 6.01 5.03 31.29Expenses capitalised - - - - -
11
Cost of sales 14.62 2.90 7.29 5.40 36.46Operating profit 88.14 30.50 52.31 41.49 88.83Other recurring income 1.36 0.51 1.22 3.98 10.17Adjusted PBDIT 89.50 31.00 53.54 45.47 99.01Financial expenses 25.37 19.96 18.20 25.44 41.02Depreciation 0.13 0.20 0.22 0.25 0.23Other write offs - - - 0.97 0.42Adjusted PBT 64.01 10.85 35.12 18.81 57.34Tax charges 2.84 2.39 -0.04 -0.14 -0.12Adjusted PAT 61.16 8.46 35.16 18.94 57.47Non recurring items 1.54 -5.58 0.39 1.76 -Other non cash adjustments - - - 3.68 0.16Reported net profit 62.70 2.88 35.55 24.38 57.62Earnigs before appropriation 144.48 63.17 73.97 95.68 81.45Equity dividend - - - - -Preference dividend - - - 1.55 2.41Dividend tax - - - 0.20 0.31Retained earnings 144.48 63.17 73.97 93.93 78.74
Balance sheet (Rs crore) Mar ' 08 Mar ' 07 Mar ' 06 Mar ' 05 Mar ' 04Sources of fundsOwner's fund Equity share capital 364.13 331.08 264.44 158.66 158.66Share application money - - - 40.00 -Preference share capital - - - - 18.50Reserves & surplus 5,240.44 1,308.70 104.04 174.27 146.84Loan fundsSecured loans 469.18 177.17 175.89 214.23 221.34Unsecured loans 10.00 20.00 106.76 53.72 14.93Total 6,083.74 1,836.95 651.13 640.89 560.26
12

Uses of funds Fixed assets Gross block 1.71 1.71 2.22 2.33 2.41Less : revaluation reserve - - - - -Less : accumulated depreciation 1.03 0.90 1.11 0.96 0.76Net block 0.68 0.81 1.11 1.37 1.65Capital work-in-progress - - - - -Investments 4,780.31 1,344.03 438.24 442.36 367.30Net current assets Current assets, loans & advances 1,324.06 493.89 214.40 199.92 199.61Less : current liabilities & provisions 21.30 1.78 2.63 2.76 8.30Total net current assets 1,302.76 492.12 211.77 197.16 191.32Miscellaneous expenses not written - - - - -Total 6,083.74 1,836.95 651.13 640.89 560.26Notes: Book value of unquoted investments 4,773.72 1,344.03 438.24 438.12 -Market value of quoted investments 11.98 14.40 - 9.20 -Contingent liabilities 3,132.29 834.73 260.16 122.91 -
Findings :
year 2008 2007 2006 2005 2004
Current
ratio
62.15 278.01 81.55 72.48 24.06
Quick
ratio
62.15 277.98 81.53 72.47 24.06
13

From the above figures it is understood that there is a consistent growth in
current ratio up to 2007 but a sudden fall in 2008. this is because of increase
in current liabilities.also the same with quick ratio,but in 2008 quick ratio is
equal to current ratio because of absence of inventories.
From the above figures it is clear that working capital is on increasing trend and it reflects that the company is financing its short tern funds with out any difficulties
Year 2008 2007 2006 2005Net profit ratio
60.21 8.49 58.43 47.92
Regarding profitability of company it is held that there is an increase but in 2007 the net profits of the company declined due to decreade in sales.
With regard to liquidity ratios the Total debt/equity ratios for 2008,07,06 are as follows
14
year 2008 2007 2006 2005Debt equity ratio
0.08 0.12 0.76 0.83
This shows that there is a decline in the owners stake in the company
With respect to coverage ratios the figures are as followsYear 2008 2007 2006 2005Finance coverage ratio
3.53 1.55 2.94 1.79
As finance coverage ratio is increasing it shows that company ability to meet its interest and dividend is increasing
Conclusion: From the above analysis it is held that overall performance of the conpany is satisfatory
15

![GMR Voting System Catalog Part1 ... - download.gongkong.comdownload.gongkong.com/file/company/10490/GMRVotingSystemCatalog.pdf · c?Ô 1 1. veÄ • gmr 2Ï4³ veÄ 3 • gmr ]](https://static.fdocuments.in/doc/165x107/5bfc0ea409d3f225088bc5a1/gmr-voting-system-catalog-part1-co-1-1-veae-gmr-2i4-veae-3-.jpg)