Internship Report Overview of Islami Bank Bangladesh Limited

RATIO ANALYSIS
OF
FIRST SECURITY ISLAMI BANK LIMITED

Internship Report
On
“Ratio Analysis of First Security Islami Bank Limited”
Prepared For
Ms. Sohana Wadud Ahmad
Lecturer, BRAC Business School
Prepared By
Maliha Ehsan
ID- 09204042
BRAC University
February 17, 2014

February 17, 2014
Ms. Sohana Wadud Ahmad Lecturer BRAC University Mohakhali, Dhaka
Subject: Submission of Internship Report
Dear Madam,
With due respect, I would like to notify you that I have completed my Internship Report on
“Ratio Analysis of First Security Islami Bank Limited (FSIBL).”
This particular report enables me to get an insight of the performance of First Security Islami
Bank Limited and how they create value for their stake holders. I have analyzed many ratios and
data to judge the performance of FSIBL. I have formed graphs to analyze the performance
better.
Finally, I would like to express my gratitude for your supportive thoughts and kind
consideration in making this report. At each stage, I have given my best efforts in preparing this
report. Without any doubt, this experience enriches my knowledge in a greater degree. If you
have any query over any aspect of my report, I would gladly answer them.
Regards
Maliha Ehsan
ID-09204042

Acknowledgement:
In the beginning, I would express my gratitude to Almighty Allah for whose Mercy I am mentally
and physically sound in order to prepare this report. Other than that, I am thankful to many
people who have provided me with incentive and support during the whole time I was working
with this report. I am very grateful to Ms. Sohana Wadud Ahmad, my respective faculty and
advisor of my internship report who assigned me with this topic and assisted me the whole
time. She guided me to finish this task successfully. Without her assistance, I would not have
been able to complete my report successfully. I would also like to thank my Office Supervisor,
Mr. Masud Hossain, FAVP & Second Manager, FSIBL Mohakhali Branch; Mr. Ishtiak Al Anis,
Assistant Officer; Ms. Tasnuva Hassan, Assistant Officer, Mr. Rubel Miah, Assistant Officer and
Mr. Mamun Ahmed, Assistant Officer; who have cordially helped me and provided me with the
information that I needed to prepare this report. Also, I am extremely thankful for all the
websites, journals, research papers, books and literature that provided me information on this
issue, as without that, the project would go nowhere. I would also like to thank my peers and
friends who assisted me during its preparation. Without their support, suggestion and co-
operation, this project would have remained a dream.

1
Table of Contents Executive Summary ...................................................................................................................................... 4
Introduction .................................................................................................................................................. 6
History of First Security Islami Bank Limited ............................................................................................... 7
Corporate Information .............................................................................................................................. 8
Shariah Council of FSIBL .......................................................................................................................... 10
Board of Directors ................................................................................................................................... 11
Products and Services ................................................................................................................................ 12
Loan Schemes ......................................................................................................................................... 12
Financial Products ................................................................................................................................... 13
Deposit Accounts ................................................................................................................................ 13
Short Term Deposit Account ............................................................................................................... 15
Schemes .............................................................................................................................................. 15
ATM Banking ....................................................................................................................................... 18
Services ................................................................................................................................................... 18
Online any Branch Banking ................................................................................................................. 18
SMS Banking ........................................................................................................................................ 18
Locker Service ..................................................................................................................................... 18
Utility Bills ........................................................................................................................................... 19
Organogram ................................................................................................................................................ 21
Senior Management ............................................................................................................................... 22
Managing Director .................................................................................................................................. 22
Human Resource Division ....................................................................................................................... 22
Finance and Accounts Division ............................................................................................................... 23
Internal Control and Compliance Division .............................................................................................. 23
Information Technology Division ............................................................................................................ 23
International Division .............................................................................................................................. 24
Corporate Governance ............................................................................................................................ 24
Executive Committee .............................................................................................................................. 24
Audit Committee ..................................................................................................................................... 25
Vision .......................................................................................................................................................... 27
Mission........................................................................................................................................................ 27
Objectives of the Bank ............................................................................................................................... 28
Nature of the Job ........................................................................................................................................ 30

2
Specific Responsibilities of the Job ............................................................................................................ 30
Different Aspects of Job Performance ....................................................................................................... 33
Critical Observation and Recommendation .............................................................................................. 34
Description of the Project .......................................................................................................................... 36
Objectives of the Report ......................................................................................................................... 36
General Objective ............................................................................................................................... 36
Specific Objective ................................................................................................................................ 36
Methodology ........................................................................................................................................... 37
Scope of the Study .................................................................................................................................. 38
Limitations .............................................................................................................................................. 38
Financial Performance Measure ................................................................................................................ 40
Findings ....................................................................................................................................................... 41
Analysis ....................................................................................................................................................... 42
ROA ......................................................................................................................................................... 42
ROE .......................................................................................................................................................... 42
Net Interest Income ................................................................................................................................ 43
Net Interest Income as a % of TRGA ....................................................................................................... 43
Net Non Interest Income as a % of TRGA ............................................................................................... 44
EPS ........................................................................................................................................................... 44
Earnings Spread ...................................................................................................................................... 45
Interest Sensitive Gap ............................................................................................................................. 45
Relative IS GAP ........................................................................................................................................ 46
Interest Sensitive Ratio ........................................................................................................................... 46
Investment Maturity Strategy ................................................................................................................. 47
Liquidity Indicators .................................................................................................................................. 47
Cash Position Indicator ....................................................................................................................... 47
Liquid Securities Indicator ................................................................................................................... 48
Capacity Ratio ..................................................................................................................................... 48
Core Deposit Ratio .............................................................................................................................. 49
Deposit Composition Ratio ................................................................................................................. 49
GAAP ....................................................................................................................................................... 50
RAP Capital .............................................................................................................................................. 50
Tier 1 or Core Capital .............................................................................................................................. 51
Leverage Ratio......................................................................................................................................... 51
Tier 2 or Supplementary Capital ............................................................................................................. 52
3
Ratio of Tier 1 Capital to Total Risk Assets .............................................................................................. 52
Ratio of Tier 1 Capital + Tier 2 Capital to Total Risk Assets ..................................................................... 53
ICGR ......................................................................................................................................................... 53
Conclusion .................................................................................................................................................. 54
Attachments and References ..................................................................................................................... 55
Appendix I ................................................................................................................................................... 56
Return on Assets (ROA) ........................................................................................................................... 56
Return on Equity (ROE) ........................................................................................................................... 57
Net Interest Income ................................................................................................................................ 58
Net Interest Income as % of Total Revenue Generating Assets (TRGA) ................................................. 59
Net Non-Interest Income (NNII) as % of Total Revenue Generating Assets ........................................... 60
Earnings per Share .................................................................................................................................. 61
Earnings Spread ...................................................................................................................................... 62
Interest Sensitive Gap ............................................................................................................................. 64
Relative Interest Sensitive Gap ............................................................................................................... 65
Interest Sensitivity Ratio ......................................................................................................................... 66
Identification of the Investment Maturity Strategy ................................................................................ 67
Liquidity Indicators .................................................................................................................................. 70
Cash Position Indicator ....................................................................................................................... 70
Liquid Securities Indicator ................................................................................................................... 71
Capacity Ratio ..................................................................................................................................... 72
Core Deposit Ratio .............................................................................................................................. 73
Deposit Composition Ratio ................................................................................................................. 75
Book value of bank capital (GAAP) ......................................................................................................... 76
RAP Capital .............................................................................................................................................. 77
Tier 1 or Core Capital .............................................................................................................................. 78
Leverage Ratio......................................................................................................................................... 79
Tier 2 or Supplementary Capital ............................................................................................................. 80
Ratio of Tier 1 capital to Total Risk Assets .............................................................................................. 80
Ratio of Tier 1 + Tier 2 Capital to Total Risk Assets ................................................................................. 82
Internal Capital Growth Rate (ICGR) ....................................................................................................... 83
Appendix II .................................................................................................................................................. 84

4
Executive Summary
First Security Islami Bank Limited (FSIBL) formed in Bangladesh on August 29, 1999 as a banking
company under Companies Act 1994. On September 22, 1999, FSIBL got permission from
Bangladesh Bank to start its business. From then on it started its journey from a conventional
bank and gradually headed on their goals and then converted to a modern bank in January 1,
2009, following the Islamic Shariah rules and regulations. The Bank offers a wide range of
banking services through its 117 branches in the country, including accepting deposits,
discounting bills, conducting money transfer and foreign exchange transactions, and performing
other related services such as safe keeping, collections and issuing guarantees, acceptances and
letter of credit.
I was appointed in the General Banking Division, Accounting Division, Clearing Division and
Foreign Trade Division supervised by Masud Hossain, FAVP & Second Manager of the
Mohakhali Branch. Being an intern, I gained knowledge on the products offered by FSIBL and
had assisted in dealing with the customers constantly. I am doing my internship report on
“Ratio Analysis of First Security Islami Bank Limited.”
This report is designed in a few chapters. The first is “The Organization.” The next segment,
“Operational Network Organogram of FSIBL” contains the functions and objectives of different
departments of FSIBL. The third chapter is on ‘The Vision for Future,” then “Job Responsibility in
FSIBL,” then “Description of the Project.” The last chapter, “Financial Performance” includes
analysis of different ratios of FSIBL. At the end, I have found out some interpretations of the
findings.

5
CHAPTER 1 | THE ORGANIZATION

6
Introduction
This report is a requirement of my internship course in the BBA program of BRAC University. My
supervisor, Ms. Sohana Wadud Ahmad, Lecturer of BRAC Business School, BRAC University,
assigned me the topic for my report. I have tried my level best to make it an excellent one and
used all the latest data and information available. I was assigned in the Mohakhali Branch of
First Security Islami Bank Limited for my practical orientation. I have been serving this company
as an intern under different Departments for three months. My job responsibility is to serve
customers with their needs of the different banking products available in the bank, to write pay
orders and forms for customers and preparing spreadsheets etc. I got the opportunity to be
very close to the corporate customers. At the end of the program, the interns are required to
place the accomplishments and findings of the report through the writing of the internship
report covering the relevant topics.

7
History of First Security Islami Bank Limited
First Security Islami Bank Limited (FSIBL) was formed in Bangladesh on 29 August 1999 under
Companies Act 1994 to start banking business. It obtained permission from Bangladesh Bank on
22 September 1999 to begin its business. The Bank carries banking activities through its 117
branches in the country. Their commercial banking activities include a wide range of services
including accepting deposits, discounting bills, conducting money transfer and foreign exchange
transactions, and performing other related services such as safe keeping, collections and issuing
guarantees, acceptances and letter of credit. FSIBL started their business with traditional
commercial banking services as First Security Bank Ltd. However, from January 01, 2009 they
converted their business to Islamic Banking with Islamic Shariah Act and the bank changed its
name and mode of business and incorporated as First Security Islami Bank Ltd. It started with
14 branches in 1999 but now has 117 branches in Bangladesh which shows the impact they
have had in the economy. The bank maintains a friendly relationship with the top ranking
banks. They have online, SMS and ATM banking facilities for their clients.
The company philosophy “A step ahead in time” has been exactly the spirit for Asian success;
the bank has been operating with talented and brilliant personnel, equipment with modern
technology so as to make it most efficient to meet the challenges of 21st century and to fulfill
the needs and wants of its customers.

8
Corporate Information Chairman Mr. Mohammad Saiful Alam
Vice Chairman Mr. Alhaj Mohammad Abdul Maleque
Managing Director Mr. A.A.M. Zakaria
Company Secretary Mr. S. M. Nazrul Islam
Legal Status Public Limited Company
Date of Incorporation August 29, 1999
Date of Commencement of Business August 29, 1999
Date of getting license from Bangladesh
Bank
September 22, 1999
Date of Opening of First Branch October 25, 1999
Corporate Head Office House- SW (I) 1/A, Road-8, Gulshan-1, Dhaka-
1212, Bangladesh.
Registered Office 23, Dilkusha, Dhaka-1000, Bangladesh
Authorized Capital Tk.1,000 Million
Paid up Capital Tk.3,400.32 Million
Phone 88-02-9888446 (Hunting), 8402613-8402625
(ICT Division).
Fax 880-02-9891915
E-mail [email protected]
9
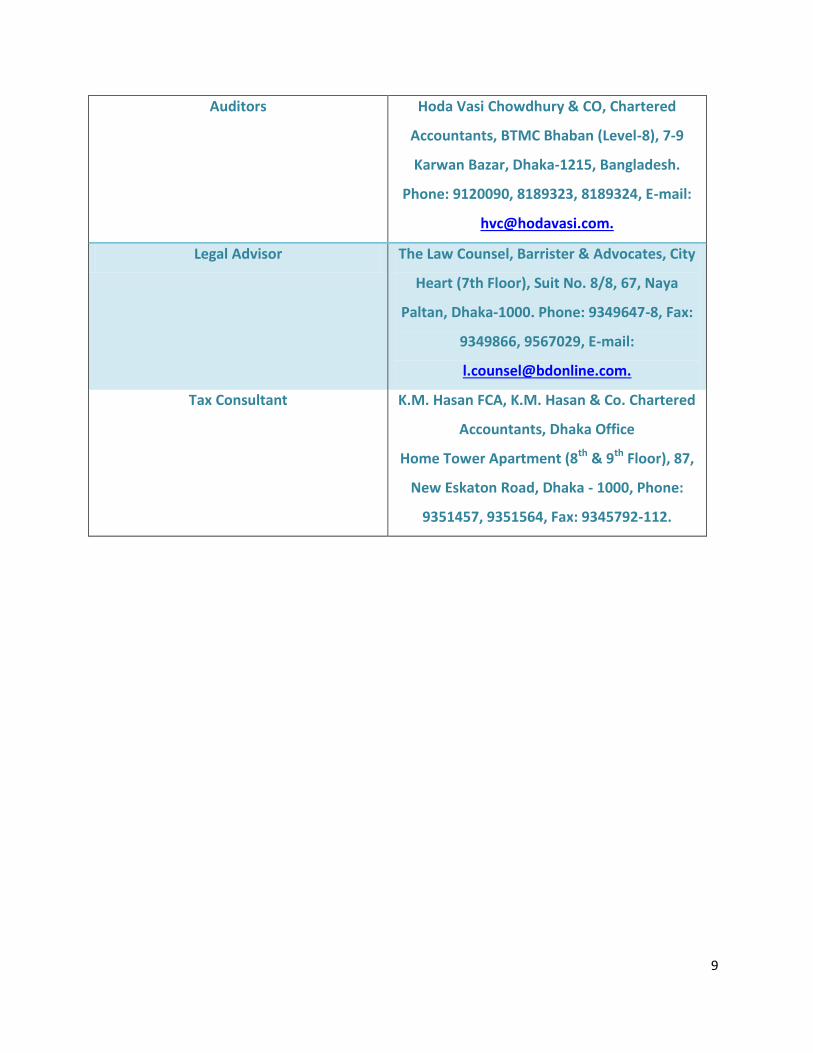
Auditors Hoda Vasi Chowdhury & CO, Chartered
Accountants, BTMC Bhaban (Level-8), 7-9
Karwan Bazar, Dhaka-1215, Bangladesh.
Phone: 9120090, 8189323, 8189324, E-mail:
Legal Advisor The Law Counsel, Barrister & Advocates, City
Heart (7th Floor), Suit No. 8/8, 67, Naya
Paltan, Dhaka-1000. Phone: 9349647-8, Fax:
9349866, 9567029, E-mail:
Tax Consultant K.M. Hasan FCA, K.M. Hasan & Co. Chartered
Accountants, Dhaka Office
Home Tower Apartment (8th & 9th Floor), 87,
New Eskaton Road, Dhaka - 1000, Phone:
9351457, 9351564, Fax: 9345792-112.

10
Shariah Council of FSIBL Name Position Address
Sheikh (Moulana) Mohammad
Qutubuddin
Chairman Baitush Sharaf Complex,
Shah Abdul Jabbar Road,
Dhanialapara, Chittagong 4100
Mufti Sayeed Ahmed
Vice Chairman Markaze Eshaete Islam
Darus Salam, Mirpur, Dhaka
Moulana M. Shamaun Ali
Member
Secretary
491, Wireless Railgate
Moghbazar, Dhaka-1217
Moulana Abdus Shaheed
Naseem
Member 493, Wireless Railgate, Bara
Moghbazar, Dhaka-1217
Mr. Mohammad Azharul Islam
Member Lecturer
University of Dhaka,
Dhaka-1000
Alhaj Md. Abdul Maleque
Vice Chairman,
Board of
Directors
8/A, OR Nizam Road Panchlaish R/A
Chittagong
Prof. Md. Sharif Hussain
Board of Directors 57, East Hajipara (5 th Floor)
Rampura, Dhaka-1219
Mr. Shahidul Islam
Board of Directors House# 7, Road# 1,
Nasirabad Housing
Society,Chittagong
Mr. A. A. M. Zakaria
Managing
Director
House SW(I)1/A, Road - 8, Gulshan -
1, Dhaka-1212

11
Board of Directors: Chairman Mohammad Saiful Alam.
Vice Chairman Alhaj Mohammed Abdul Maleque
Directors: Ms. Farzana Parveen
Ms. Rahima Khatun
Mr. Ahsanul Alam
Ms. Atiqun Nesa
Mr. Md. Sharif Hussain
Mr. Mohammad Ishaque
Mr. Md. Wahidul Alam Seth
Mr. Shahidul Islam
Mr. Mohammed Oheidul Alam
Mohammad Kutub Uddowllah
Ms. Khurshid Jahan
Managing Director Mr. A. A. M. Zakaria
Board & Company Secretary Mr. S. M. Nazrul Islam

12
Products and Services:
Loan Schemes:
1. Term Loan: This loan from the bank is for a specific amount and a specified time with a
floating interest rate and they mature between one to ten years.
2. Loan (General): This is an agreement between a broker and the bank to borrow funds for
the purchase of securities. This agreement is open-ended and brokers can continuously
borrow funds for day to day business transactions.
3. Secured Overdraft (SOD): This is an extension of credit from the bank when an account
reaches zero. An overdraft allows an individual to continue withdrawing money even if
the account has no funds in it. This facility is provided to known customers who are
trusted.
4. Transport Loan: The transportation loan provides financial assistance to foreign
nationals, refugees and members of the Humanitarian protected person abroad classes
to cover the costs of transportation for themselves or their family.
5. Cash Credit (C.C): This account with the bank by which a person or house, having given
security for repayment, draws at pleasure from the bank to the degree of an amount
agreed upon.
6. House Building Loan: Loan which is meant to cover the cost of land development and
building construction, and is paid off as needed as each stage is completed according to
a prearranged schedule.
7. Payment Against Document (PAD): This is an arrangement under which a buyer can get
the delivery (shipping) documents only upon full payment of the invoice or bill of
exchange.
8. Loan against Imported Merchandise (LIM): This type of finance is offered to the
importer to finance their needs for meeting the cost including freight, insurance, and
customs and excise duty payable on the imported merchandise. The lending bank, FSIBL
mostly pledges the imported goods. The merchandise is released for the use of the
importer (borrower) upon repayment of the bank’s finance and charges either fully or

13
partially, on production of the Delivery Order issued by the banker in favor of the
borrower.
9. Loan against Trust Receipts (LATR): This is a loan against a Trust Receipt provided to the
client when the documents covering an import shipment are given without payment.
Under this system, the client will hold the goods of their sale proceeds in trust for the
bank, until the loan allowed against the Trust Receipt is fully paid.
10. Consumer Finance Scheme: Options provided to investors for acquiring consumer
durables where an individual initially pays a fraction of the cash on purchase while
promising to pay the balance with interest over a specified time period. Consumer
finance is available for a large number of durables like televisions, refrigerators, washing
machines, cars, two-wheelers, personal computers etc.
11. Hire-Purchase Scheme: This is a method of buying goods through making installment
payments over time under a contract that the buyer is leasing the goods and does not
obtain ownership until the full amount of the contract is paid.
Financial Products:
Deposit Accounts: 1. Al-Wadiah Current Account: This account can be opened with a minimum of Tk.1000.
The bank can invest this account holder’s money into their businesses but the account
holder won’t bear profit or loss incurred from that investment. Thus, no profit rate for
this deposit account.
2. Al-Wadiah Current Plus Account (MORJADDA): This account can be opened with a
minimum of Tk.15000. The account holder must have also at least Tk.15000 in the
account. The bank can invest this account holder’s money into their businesses but the
account holder won’t bear profit or loss incurred from that investment. The account
holder will receive a free Cheque Book of 100 pages and a free ATM Card as well as avail
life insurance policy of Tk.100, 000.
3. Al-Wadiah Premium Account (SHOMMAN): This account can be opened with a minimum
of Tk.25000. The account holder must have also at least Tk.25000 in the account. The

14
bank can invest this account holder’s money into their businesses but the account
holder won’t bear profit or loss incurred from that investment. The account holder will
receive a free Cheque Book of 100 pages and a free ATM Card as well as avail life
insurance policy of Tk.100, 000.
4. Mudarabah Savings Deposit Account: This account can be opened with a minimum of
Tk.500 with a reserve balance of Tk.500 as well. Per month’s profit or loss incurred from
investments are added in the accounts twice a year i.e. in June and December. Current
profit rate is 5%.
5. Mudarabah Salary Savings Account (PRAPTI): This account can be opened with a
minimum of Tk.500 with a reserve balance of Tk.500 as well. Per month’s profit or loss
incurred from investments are added in the accounts twice a year i.e. in June and
December. Current profit rate is 5%. The account holder will receive a free Cheque Book
of 10 pages and a free ATM Card for the 1st year.
6. Mudarabah Student Savings Account (School Banking-ONKUR): This account can be
opened with a minimum of Tk.100 with no reserve balance required. Per month’s profit
or loss incurred from investments are added in the accounts twice a year i.e. in June and
December. Current profit rate is 8%. The account holder will receive a free Cheque Book
of 10 pages and a free ATM Card for the 1st year. No service charge required for this
account.
7. Mudarabah Student Savings Account (University/College-PROJONMO): This account can
be opened with a minimum of Tk.200 with a reserve balance of Tk.100. Per month’s
profit or loss incurred from investments are added in the accounts twice a year i.e. in
June and December. Current profit rate is 8%. The account holder will receive a free
Cheque Book of 10 pages and a free ATM Card for the 1st year. No service charge
required for this account.
8. Mudarabah Senior Citizen Savings Account (PROBIN): This account can be opened with a
minimum of Tk.5000 with a reserve balance of Tk.5000 as well. Per month’s profit or
loss incurred from investments are added in the accounts twice a year i.e. in June and
15
December. Current profit rate is 8%. The account holder will receive a free Cheque Book
of 20 pages and a free ATM Card for the 1st year.
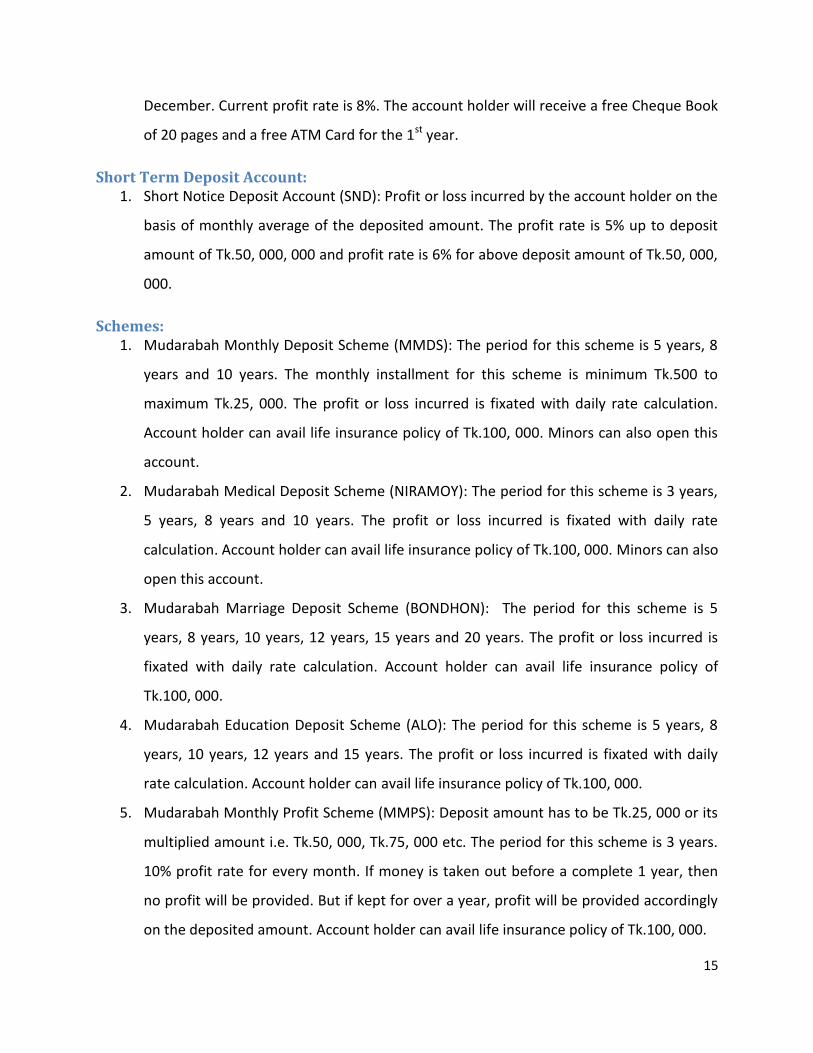
Short Term Deposit Account: 1. Short Notice Deposit Account (SND): Profit or loss incurred by the account holder on the
basis of monthly average of the deposited amount. The profit rate is 5% up to deposit
amount of Tk.50, 000, 000 and profit rate is 6% for above deposit amount of Tk.50, 000,
000.
Schemes: 1. Mudarabah Monthly Deposit Scheme (MMDS): The period for this scheme is 5 years, 8
years and 10 years. The monthly installment for this scheme is minimum Tk.500 to
maximum Tk.25, 000. The profit or loss incurred is fixated with daily rate calculation.
Account holder can avail life insurance policy of Tk.100, 000. Minors can also open this
account.
2. Mudarabah Medical Deposit Scheme (NIRAMOY): The period for this scheme is 3 years,
5 years, 8 years and 10 years. The profit or loss incurred is fixated with daily rate
calculation. Account holder can avail life insurance policy of Tk.100, 000. Minors can also
open this account.
3. Mudarabah Marriage Deposit Scheme (BONDHON): The period for this scheme is 5
years, 8 years, 10 years, 12 years, 15 years and 20 years. The profit or loss incurred is
fixated with daily rate calculation. Account holder can avail life insurance policy of
Tk.100, 000.
4. Mudarabah Education Deposit Scheme (ALO): The period for this scheme is 5 years, 8
years, 10 years, 12 years and 15 years. The profit or loss incurred is fixated with daily
rate calculation. Account holder can avail life insurance policy of Tk.100, 000.
5. Mudarabah Monthly Profit Scheme (MMPS): Deposit amount has to be Tk.25, 000 or its
multiplied amount i.e. Tk.50, 000, Tk.75, 000 etc. The period for this scheme is 3 years.
10% profit rate for every month. If money is taken out before a complete 1 year, then
no profit will be provided. But if kept for over a year, profit will be provided accordingly
on the deposited amount. Account holder can avail life insurance policy of Tk.100, 000.

16
6. Mudarabah Pension Deposit Scheme (OBSHOR): The period for this scheme is 5 years,
10 years, 15 years and 20 years. Account holder can avail life insurance policy of Tk.100,
000.
7. Mudarabah Immigrant Deposit Scheme (SHODESH): The period for this scheme is 5
years, 8 years, 10 years, 12 years, 15 years and 20 years. Immigrants can run this
account from abroad and also anyone they appoint can also run on their behalf. The
monthly installment for this scheme is minimum Tk.2000 to maximum Tk.30, 000.
8. Mudarabah Double Deposit Scheme (MDDS): The period for this scheme is 5 years and 5
months. Deposit amount has to be Tk.10, 000 or its multiplied amount i.e. Tk.20, 000,
Tk.30, 000 etc. If money is taken out before a complete 1 year, then no profit will be
provided. But if kept for over a year, profit will be provided accordingly on the deposited
amount.
9. Mudarabah Triple Deposit Scheme (Triple Benefit): The period for this scheme is 8 years
and 6 months. Deposit amount has to be Tk.10, 000 or its multiplied amount i.e. Tk.20,
000, Tk.30, 000 etc. If money is taken out before a complete 1 year, then no profit will
be provided. But if kept for over a year, profit will be provided accordingly on the
deposited amount. Account holder can avail life insurance policy of Tk.100, 000.
10. Mudarabah Quadruple Deposit Scheme (ARBA): The period for this scheme is 10 years
and 8 months. Deposit amount has to be Tk.10, 000 or its multiplied amount i.e. Tk.20,
000, Tk.30, 000 etc. If money is taken out before a complete 1 year, then no profit will
be provided. But if kept for over a year, profit will be provided accordingly on the
deposited amount. Account holder can avail life insurance policy of Tk.100, 000.
11. Mudarabah Millionaire Deposit Scheme (AGROSHOR): The period for this scheme is 3
years, 5 years, 8 years, 10 years, 12 years, 15 years, 18 years and 20 years. For a specific
period, a specific amount has to be deposited every month. The scheme holder is
expected to get Tk.1, 000, 000 plus profit amount, excluding Tax. Account holder can
avail life insurance policy of Tk.100, 000.
12. Mudarabah One Crore Deposit Scheme (UNNATI): The period for this scheme is 5
years, 8 years, 10 years, 12 years, 15 years, 18 years, 20 years, 22 years and 25 years.

17
For a specific period, a specific amount has to be deposited every month. The scheme
holder is expected to get Tk.10, 000, 000 plus profit amount, excluding Tax. Account
holder can avail life insurance policy of Tk.100, 000.
13. Mudarabah Home Maker Deposit Scheme (GHORONI): The period for this scheme is 3
years, 5 years, 8 years and 10 years. The monthly installment for this scheme is
minimum Tk.500 to maximum Tk.25, 000 and can be paid more than once in a month.
The profit or loss incurred is fixated with daily rate calculation. Account holder can avail
life insurance policy of Tk.100, 000.
14. UDDIPON: This is a special scheme for college and university students with monthly
installments of minimum Tk.200 to maximum Tk.20, 000 and can be paid more than
once in a month. The period for this scheme is 1 year, 2 years, 3 years, 4 years, 5 years,
6 years, 7 years and 8 years. Account holder can avail life insurance policy of Tk.100,
000.
15. Mudarabah Hajj Deposit Scheme: This is for those who want to save money for Hajj.
The period for this scheme is 5 years, 8 years, 10 years, 12 years, 15 years, 18 years, 20
years, 22 years and 25 years. Account holder can avail life insurance policy of Tk.100,
000.
16. Mudarabah Money Plant Deposit Scheme (PROYASH): This scheme can be opened by a
certain specific amount deposited and is for a period of 10 years, 12 years and 15 years.
Profit rate is 12% on the amount deposited. Account holder cannot avail profit if the
account is closed before 6 months. And if the account is closed within 3 years, then
profit rate will be 7% to 8%. Account holder can avail life insurance policy of Tk.100, 000.
Others:
1. Zakaat Fund: This is a special service provided for account holders who give Zakaat by
sending their money in the account: 010 1111 000 2636-1. The money collected for the
Zakaat Fund is then distributed among different charities under the supervision of the
Shariah Board.

18
2. Mudarabah Gift Cheque: The cheque is valued of Tk.500, Tk. 1000, Tk. 2000 and
Tk.5000. This can be availed form any of the branches.
3. Mudarabah Waqf Cash Account: This account can be opened by Tk.1000 but the amount
has to be increased to Tk.5000. This account cannot be closed and the payment goes to
the poor, the needy and the physically and mentally impaired.
ATM Banking:
First Security Islami Bank Ltd. has implemented successfully Automated Teller Machine (ATM)
card transaction from June 25, 2008. Through Automated Teller Machine (ATM) /Debit card,
customer can avail the facilities like withdrawal money, balance inquiry and purchase goods
from Point of sale (POS).
Services:
Online any Branch Banking:
FSIBL have set up Wide Area Network through Radio Fiber-Optics and other available
communication media systems to provide any branch banking to their customers. Customer of
one branch is now able to deposit and withdraw money at any of other branches. All Branches
are included in the Wide Area Network.
SMS Banking:
First Security Islami Bank Ltd. has officially launched SMS banking service from December 17,
2007.
Locker Service:
For safekeeping of customer’s valuables like important documents and goods like jewelries and
gold ornaments, FSIBL Locker Service is available in most of the Branches in urban areas.
19
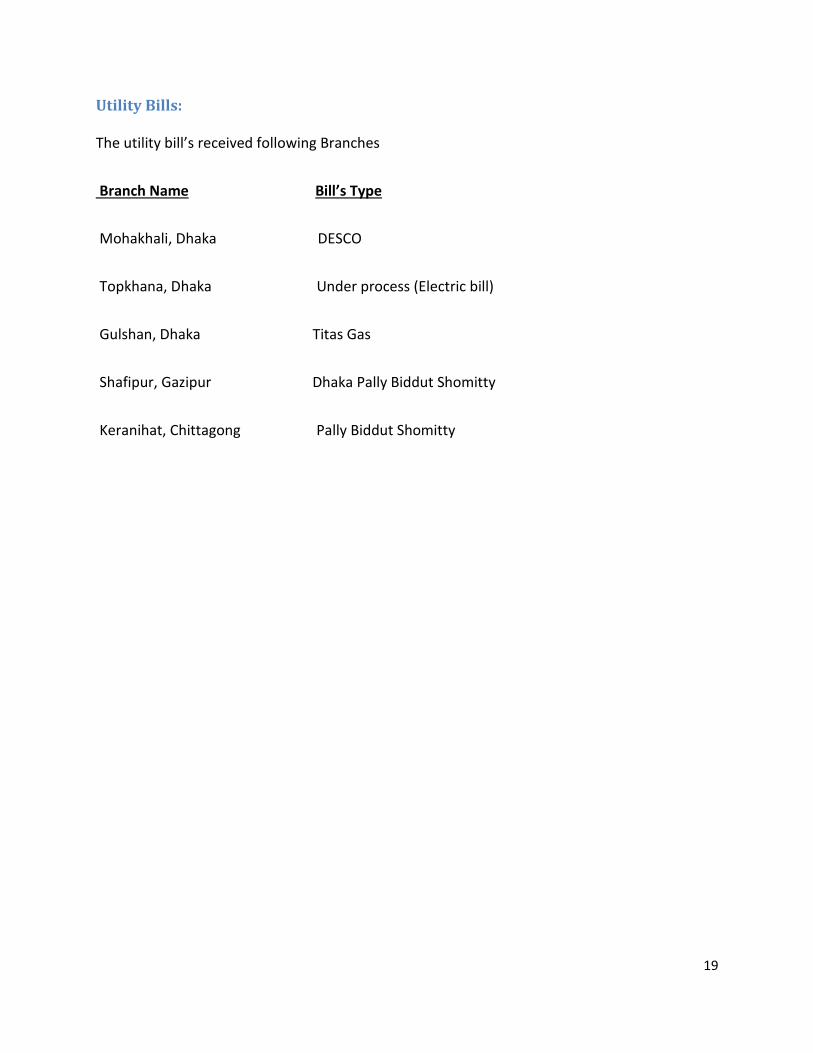
Utility Bills:
The utility bill’s received following Branches
Branch Name Bill’s Type
Mohakhali, Dhaka DESCO
Topkhana, Dhaka Under process (Electric bill)
Gulshan, Dhaka Titas Gas
Shafipur, Gazipur Dhaka Pally Biddut Shomitty
Keranihat, Chittagong Pally Biddut Shomitty
20
CHAPTER 2 | OPERATIONAL NETWORK ORGANOGRAM OF FSIBL

21
Organogram:
MANAGING DIRECTOR
DEPUTY MANAGING DIRECTOR
EXECUTIVE VICE PRESIDENT
SENIOR VICE PRESIDENT
SENIOR EXECUTIVE OFFICER
SENIOR OFFICER
OFFICER
EXECUTIVE OFFICER
PRINCIPAL OFFICER
VICE PRESIDENT
ASSISTANT OFFICER
FIRST VICE PRESIDENT
ASSISTANT VICE PRESIDENT
JUNIOR OFFICER
22
Senior Management
The professional management team of FSIBL is functioning being headed by the Managing
Director, Mr. A. A. M. Zakaria.
Managing Director
Mr. A. A. M. Zakaria, Managing Director of the bank is a renowned banking personality having
more than 3 decades of experience in the banking industry. He successfully completed his BBA
and did his Masters in Economics from Dhaka University. He started his career in Rupali Bank as
a Senior Officer in 1977. He was the Deputy Managing Director in Dutch-Bangla Bank Limited
before this. He trained in many programs and workshops on banking at home and abroad. Since
7th August 2005, Mr. A. A. M. Zakaria joined FSIBL as the Managing Director.
The top management of the bank is supported by human resource strength of over 1200
executives and officers. The Bank has the following committees for smooth functioning of their
operations: Management committee (MANCO) comprises of senior members of the
management headed by Managing Director of the bank. Asset Liability Management
Committee (ALCO) headed by the Managing Director, is responsible for balance sheet risk
management. The committee participate in the monthly ALCO meeting and review the liquidity
position, review rate of interest on deposit and lending, and review the ALCO papers on
presentation by treasury back office on the position of profit, deposit, advance, cost analysis,
maturity bucket of deposit & advance, balance sheet, profit and loss account and many other
issues relating to banks business and assets-liability management.
Human Resource Division:
The employees are the most valuable resource and thus bank continues to encourage its
employees to receive training and participate in various seminars and workshop to enrich their
professional skills. Having professional and competent employees are extremely important for
the business to progress. It is important to adapt a working culture where work can be done
with expertise, fun and objectivity.

23
Finance and Accounts Division:
This division is very important because of the tasks they do. These are to maintain daily liquidity
positions, treasury bills, call money, debentures, placement of funds, monthly accrued profit
calculation of all profit bearing accounts, inter-branch calculation, amortization of all fixed
assets and other assets, preparation of statement of accounts and profit and loss account of the
bank, weekly deposit and advance analysis of the bank, cost of fund analysis and maintenance
of accounts, preparation of annual report of the bank, maintenance of provident fund accounts,
maintenance of income and expenditure posting, maintenance of salaries and wages of the
employees etc.
Internal Control and Compliance Division:
Operational loss may start from errors and fraud due to lack of internal Control and
Compliance. FSIBL has separate Internal Control and Compliance division (ICCD) headed by a
Vice President. This Division consists of 3 units, namely:
a) Audit and Inspection Unit,
b) Compliance Unit, and
c) Monitoring Unit.
Information Technology Division:
This division is responsible for providing computerized banking services to meet the needs of its
customers. The bank aims to maintain, operate and strengthen the technology base of the bank
in order to provide error free service to its customers and ensure efficient, effective and
profitable operations.

24
International Division:
This division is responsible for assisting the authorized branches to deal with foreign trades;
imports and exports of businesses by giving approval for transactions and controlling them at
various stages and deals with all the correspondents of foreign banks having arrangements with
FSIBL. The larger the number of correspondents and the wider the coverage area, the richer will
be the international connections of the bank and will add value to the economy.
Corporate Governance:
Corporate governance is about how the corporation is running its operations to achieve its
corporate objectives. Bangladesh Bank (BB) gives emphasis on implementing corporate
governance among the financial institutions and to do that, BB emphasizes implementation of
the guidelines issued by them for improving corporate governance in banking. Good Corporate
Governance practices enhance an entity’s corporate image and market credibility, which attract
capital and increase its borrowing power. These can be reflected in the quality of financial
reporting and disclosures; strength of internal control system and internal audit function
induction of professionally competent, independent non-executive Directors on corporate
Board; formation of Audit Committee; delegation of authority to executives and staff; and
protection of corporate governance for strengthening organizational strength. With a view to
ensure effective participation and deep interest in the affairs of the company and as per
Articles of Association of the Company and as per Bangladesh Bank Circular No. 16 dated March
24, 2003 the bank has set up the following 2 committees:
Executive Committee:
FSIB has constituted 9 members executive committee of the board as per Bangladesh Bank
guidelines to ensure corporate governance in the business of which managing director of the
Bank is Ex-officio Member. The executive committee of the board is responsible for developing
policy and strategy for smooth operations of business and business development of the bank to
ensure maximization of shareholders wealth’s protecting other stakeholder’s interest in the
company Mr. Alhaj Md. Saiful Alam, Chairman of the Board of Directors is the Chairman of the

25
present Executive Committee of the bank. He is very dynamic person and leading the executive
committee of the bank in a very admirable manner.
Audit Committee:
FSIB has formulated an audit committee which can play an effective role in formulating an
efficient banking system. The Audit Committee has been formed comprising three members of
the Board of Directors. As per corporate governance guidelines the Chairman of the Audit
Committee should have sound knowledge and expertise in finance & accounting or auditing.
Mr. Hamidul Haq, who is also a Director of the Bank, is Convener of the committee. He is
associated in banking field over long years.

26
CHAPTER 3 | VISIONS FOR THE FUTURE

27
Vision: First Security Islami Bank Limited aims to become one of the leading banks in Bangladesh by
excellent quality of operations in their banking sector. The bank has some missions to achieve
to meet the organizational goals.
These are listed below:
The bank believes in strong and well-capitalization.
It maintains high standard of corporate and business ethics in the business field.
First Security Islami Bank Limited extends highest quality of services, which attracts the
customers to choose them first.
First Security Islami Bank Limited provides products and services that encourage savings.
First Security Islami Bank Limited’s main business mission is to obtain fine position in the
banking sector of Bangladesh as well as globally.
It also emphasizes on a reasonable earnings from its investment to satisfy the
shareholders.
Mission:
First Security Islami Bank Limited says that their mission is to provide service to customers with
sincerity and proficiency with an interactive and efficient workforce providing them with the
most modern technology.
For this mission FSIBL has the following objectives and goals:
Their main objective is to maximize profit and wealth.
First Security Islami Bank Limited is always ready to maintain the highest quality of
services by banking technology prudence in management and by applying high standard
of business ethics through its established commitment and heritage.
First Security Islami Bank Limited is committed to ensure its contribution to national
economy by increasing its profitability through professional and disciplined growth

28
strategy for its customers and by creating a proper work culture in international banking
area.
Objectives of the Bank:
The objectives of the FSIBL are given below:
To provide efficient and effectively computerized banking system.
To enhance foreign exchange operations further.
To accept deposits on profit-loss sharing basis.
To establish a welfare-oriented banking system.
To play a vital role in human development and employment generation.
To contribute towards balanced growth and development of the country through
investment operations particularly in the less developed areas.
To establish participatory banking instead of banking on debtor-creditor relationship.

29
CHAPTER 4 | JOB RESPONSIBILITY IN FSIBL

30
Nature of the Job: My internship at First Security Islami Bank Ltd. started on 15th September, 2013 and ended on
1st January, 2014. During these 3 months, I was assigned at the Mohakhali Branch and was
given responsibilities of different divisions to perform and to gather some valuable knowledge
and practical experience. This practical orientating is necessary for the development and
preparation of an individual in the job world. The things that I have learned at First Security
Islami Bank Ltd. are
Being Responsible
Being Committed
Open to learning New Expertise
Being Punctual and Regular
Ability to Interact with Different kinds of People and Handling Customers
Specific Responsibilities of the Job:
First Security Islami Bank Ltd. has a prepared internship program for internees. Although it is
rarely followed, it served as a guideline. I was rotated across all the different departments in
the past 3 months, mostly worked in the General Banking and Foreign Trade Department.
I was in the Accounting Department for the two three weeks and learned the following from
this department:
Attaching Vouchers with the General Ledger
Arranging Voucher in serials
Typing other documents given by my in charge

31
Then I was assigned to the Clearing Department and learned the following from this
department:
Scanning Cheque
Error Correction
Then I was assigned to the front desk where I spent the most time. It was very arduous, but
very fruitful with a wide variety of responsibilities at the front desk:
Bringing out the Cheque books for the customers, verifying them, receiving them from
the courier.
Writing and later on printing pay orders
Finding the Fixed Deposits (FD), Deposit Pension Scheme (DPS) and other account
opening forms
Opening account for new customers and aiding them in the process
Inputting information into the Bank’s software, Ultimus
Making bank solvency certificates
Keeping things in order and at arm’s length
The work was really hard and extremely tedious at the front desk. I learned how to deal with the
work and learning new expertise was what kept me motivated. I was highly praised by my
supervisors.
The last three weeks I was posted in the foreign trade department. I did not have to deal with
the customers that much but there were a few basic responsibilities that I had. Such as:
- Filling up the Letter of Credit (LC) forms
- Calculating the VAT, commission, margin etc

32
- Putting seals
- Taking signatures
- Numbering the LCs
Doing the similar things for BTB (Back-to-Back) LCs and Local LCs
Filling up the IMP forms
Putting the LC and IMP into their following registers
Learning to put different types of seals
Printing cover letters, letters etc
Taking necessary papers from customers such as taking photocopy of National ID
card, Passport, Trade License etc.

33
Different Aspects of Job Performance:
So here is what some of my supervisors had to say about me during my tenure in First Security
Islami Bank Limited;
Maliha has been a very hard-working girl since the beginning of her internship. She was
assigned in different departments and was trusted with responsibilities around everywhere
because she had shown interest in learning. It was easy to trust her with the jobs as she learned
quickly.
-Tasnuva Hassan, Assistant Officer
Maliha was shifted from department to department and every of her supervisor would want
her to stick with them and not be shifted because she showed her enthusiasm while working.
-Ishtiak Al Anis, Assistant Officer
Maliha is a very soft-spoken and polite girl who needs to work a little more on her inter-
personal skills. But she learns things quickly, and can be entrusted with work.
-Rubel Miah, Assistant Officer
Maliha, we are glad to have had your presence amongst us. Work on your skills and seek more
knowledge and prosper further in life. Our best wishes with you.
-Mamun Ahmed, Assistant Officer

34
Critical Observation and Recommendation:
It was very fascinating working at First Security Islami Bank Limited. The employees are really
friendly, talented and very helpful whenever I wanted to learn something new. The things that I
have noticed and observed are:
The work was never left pending for the next day unless it was absolutely necessary
The work process could be made faster with better computers and operating systems
A good job performance should be praised more often, so that there is no lacking
motivation for the employees
There is always a rush of customers so there is no standard on what the employees do
throughout the day. The work activities of an employee are set, but what to do when
varies along the day.
Each and every employee has a certain set of responsibilities divided for them. This is the way it
should be and it was remarkable when I saw it first-hand. They carry out this rush of
responsibilities throughout the day. Work was made enjoyable and fun by the employees.

35
CHAPTER 5 | DESCRIPTION OF THE PROJECT

36
Description of the Project
Objectives of the Report: The objective of the report can be summarized in two forms:
General Objective
Specific Objective
General Objective:
This internship report is prepared primarily to fulfill the Bachelor of Business Administration
(B.B.A) degree requirement under the Faculty of BRAC Business School, BRAC University.
Specific Objective:
More specifically, this study entails the following aspects:
To give an overview of First Security Islami Bank Limited.
To focus on the products, services, work environment and facilities provided to
employees of First Security Islami Bank Limited.
To understand the functions of different departments of FSIBL.
To identify the financial performances of FSIBL by analyzing different ratios.
To identify the market position of FSIBL.
To detect out the competitive environment of FSIBL.

37
Methodology:
Data Collection Method
The process of financial data collection is not hassle free for any outsiders. As I am working
there, they have allowed me to collect a few data from MIS and Finance Department.
Sometimes, they have provided data verbally and I took note of that.
Most of the data are secondary in nature and primary data will only include the interview with
employees.
Primary Data Sources
The primary sources are:
Interview with the FSIBL employees
Day-to-day conversation and discussion with the finance department
Secondary Data Sources
The secondary sources are:
Annual Report of FSIBL and other banks
Various file study of FSIBL
Discussion with officers of the Bank
Bangladesh Bank Annual Report
Internet Browsing

38
Scope of the Study
The unit where I was assigned for my internship was General Banking. There was a lot of scope
for studying, like how customers are assisted with their queries, how to finish tasks within time
and as quickly as possible because it is all customer service oriented. Gaining knowledge and
constantly learning new things make perfect sense when it is associated with practice.
Theoretical knowledge gets its perfection with proper practical application. My education
helped me to compare the knowledge gathered from the BBA program with the real world
banking sector operation. I have come to know the products and procedures of banking
operation and the contribution of banks in the overall economy. The report highly focuses on
the performance of First Security Islami Bank Limited.
Limitations Few limitations were faced while writing this report. Some of these limitations are as follows:
Secondary Information: There was a time constraint for which it was very difficult to
collect all the required information in such a short period.
Confidentiality: Due to some legal obligation and business secrecy, banks are reluctant
to provide data. For this reason, the study limits only on the available published data
and certain degree of formal and informal interview.
Experience: There was lack of experience in collecting information, doing analysis and
taking assessment of the related topics. However, as time passed, many of these
limitations faded away.

39
CHAPTER 6 | FINANCIAL PERFORMANCE

40
Financial Performance Measure:
A tool used by individuals to conduct a quantitative analysis of information in a company's
financial statements. Ratios are calculated from current year numbers and are then compared
to previous years, other companies, the industry, or even the economy to judge the
performance of the company. Ratio analysis is predominately used by proponents of
fundamental analysis. (Investopedia)
To do an analysis, the following ratios and values have been calculated:
ROA, ROE, Net Interest Income, Net Interest Income as a % of Total Revenue Generating Assets,
Net Non Interest Income as a % of Total Revenue Generating Assets, Earnings per Share,
Earnings Spread, Interest Sensitive Gap, Relative Interest Sensitive Gap, Interest Sensitivity
Ratio, Investment Maturity Strategy, Liquidity Indicators, GAAP, RAP Capital, Tier 1 or Core
Capital, Leverage Ratio, Tier 2 or Supplementary Capital, Ratio of Tier 1 Capital to Total Risk
Assets, Ratio of Tier 1 Capital + Tier 2 Capital to Total Risk Assets and Internal Capital Growth
Ratio.
[Please see Appendix I for the calculations]

41
Findings:
2012 2011 2010 2009 2008
ROA 0.0059 0.0064 0.0086 0.0068 0.0033
ROE 0.1345 0.1289 0.1399 0.1141 0.0411
Net Interest Income (NII) 3,029,913,237 2,076,812,223 1,421,221,295 1,014,874,186 202,643,691
NII as % of TRGA 2.99% 2.83% 2.58% 2.50% 0.77%
NNII as % of TRGA 1.92% 2.16% 2.19% 1.85% 1.03%
EPS 2.04 1.71 2.33 1.42 7.35
Earnings Spread 0.5238 0.4608 0.3640 0.4042 0.6569
Interest Sensitive Gap 95,051,409,236 65,985,421,408 44,585,669,584 34,753,512,364 24,236,001,479
Relative IS Gap 0.7327 0.7255 0.7008 0.7244 0.7758
Interest Sensitivity Ratio 4.615 4.3802 3.8436 4.0978 5.4361
Investment Maturity Strategy:
Not more than 1 Year 0.4786 0.4658 0.4550 0.4537 0.5518
More than 1 Year, not more than 5 Years
0.3139 0.3280 0.3383 0.3371 0.4464
In more than 5Yrs 0.1385 0.1377 0.1379 0.1401 0.0008
Liquidity Indicators:
Cash Position Indicator 0.9283 0.9377 0.9620 0.9891 0.8723
Liquid Securities Indicator 0.4272 0.4314 0.4526 0.4428 0.0235
Capacity Ratio 0 0 0 0 0.8033
Core Deposit Ratio 0.1654 0.1618 0.1495 0.1291 0.0786
Deposit Composition Ratio 0.0576 0.0756 0.1125 0.0863 0.0597
GAAP 4,613,557,022 4,141,371,119 3,655,841,641 2,681,961,056 2,380,490,857
RAP Capital 4,613,557,022 4,141,371,119 3,655,841,641 2,681,961,056 2,380,490,857
Tier 1 or Core Capital 5,262,084,832 4,500,173,333 3,920,011,486 2,865,410,755 2,538,573,006
Leverage Ratio 0.0406 0.0495 0.0616 0.05972 0.08126
Tier 2 or Supplementary Capital 2,883,242,028 900,376,700 662,205,999 513,625,077 323,625,077
Ratio of Tier 1 Capital to Total Risk Assets
0.0996 0.1193 0.1425 0.1386 0.1916
Ratio of Tier 1+Tier 2 to Total Risk Assets
0.1541 0.1432 0.1666 0.1635 0.2161
ICGR 0.0765 0.0826 0.1020 0.0970 0.0317

42
Analysis:
ROA
Return on Assets: It shows how capable the management of the bank has been in converting
the institution’s assets into net earnings, as it calculates how much a bank earns using Tk. 1 of
assets. Here the return in asset has a fluctuating trend. It varies between Tk. 0.0033 to Tk.
0.0086 between 2008 and 2012 and being its highest in 2010.
ROE
Return on Equity: Till 2010, it shows increase in the trend. But after that, there is a fluctuation
in 2011 and 2012. The net income affected the ROE due to reasons like instruction of
Bangladesh Bank to limit the Credit Deposit Ratio within 85%. So the banks have to take deposit
in higher competitive rates.
0
0.002
0.004
0.006
0.008
0.01
2012 2011 2010 2009 2008
ROA
0
0.02
0.04
0.06
0.08
0.1
0.12
0.14
0.16
2012 2011 2010 2009 2008
ROE

43
Net Interest Income
Net Interest Income: NII shows an increasing trend. The higher, the better for the company
because it shows high amount of net interest income which is based on FSIBL’s smooth
operation on the focused investments.
Net Interest Income as a % of TRGA
Net Interest Income as a % of TRGA: NII as % of TRGA shows how a bank’s net interest income is
increasing by utilizing its revenue generating assets. This particular ratio also shows a slight fall
on the 2011 rate which happened because of the slow pace in the economic growth that year.
0
500,000,000
1,000,000,000
1,500,000,000
2,000,000,000
2,500,000,000
3,000,000,000
3,500,000,000
2012 2011 2010 2009 2008
Net Interest Income
0
0.5
1
1.5
2
2.5
3
3.5
2012 2011 2010 2009 2008
Net Interest Income as % of TRGA

44
Net Non Interest Income as a % of TRGA
Net Non Interest Income as a % of TRGA: Net non interest income shows the fluctuating trend
over 5 years. The highest amount of NNII as % of TRGA is in the year of 2010 which explains
that FSIBL’s main earning revenue sources are non operating income in this year, which has
both positive and negative sides. As non operating income is not the main source of income of a
company.
EPS
Earnings per Share: Earnings per share show a decreasing trend in the graph. In 2008, the EPS
was Tk. 7.35. But due to major changes in the business operations and a shift towards investing
in an Islamic way, the EPS fell excessively. In 2012, the graph shows slight increase in the order.
0
0.5
1
1.5
2
2.5
2012 2011 2010 2009 2008
Net Non Interest Income as % of TRGA
0
1
2
3
4
5
6
7
8
2012 2011 2010 2009 2008
EPS

45
Earnings Spread
Earnings Spread: Earnings spread shows how much money the bank generates from income
utilizing the assets and liabilities. In 2008, the earnings spread of the bank is high compared to
the other years. The bank is efficient in their intermediary function as the graph shows that, the
earning spread is not highly fluctuating from 2009-2012.
Interest Sensitive Gap
Interest Sensitive Gap: The graph shows the bank's control on the volume of interest rate
sensitive assets and liabilities. The IS gap is showing an increasing value from the year 2008-
2012 and the bank's IS gap is positive. Thus it means they have an asset sensitive gap. The
interest/profit rate is adjusted as the asset of the bank is not compromised and the interest
income is higher than interest expense.
0
0.1
0.2
0.3
0.4
0.5
0.6
0.7
2012 2011 2010 2009 2008
Earnings Spread
0
10,000,000,000
20,000,000,000
30,000,000,000
40,000,000,000
50,000,000,000
60,000,000,000
70,000,000,000
80,000,000,000
90,000,000,000
100,000,000,000
2012 2011 2010 2009 2008
Interest Sensitive Gap

46
Relative IS GAP
Relative IS Gap: The Relative Interest Sensitive Gap shows the relationship with Interest
Sensitive Gap with its total assets. This graph shows that the bank has a fluctuating positive
relative IS gap from year 2008-2012. First, it shows a fall till 2010 which means the bank had
increased its asset yearly and then an increase due to its high asset sensitive gap.
Interest Sensitive Ratio
Interest Sensitivity Ratio: This graph shows that the bank has fluctuating Interest Sensitivity
Ratio from year 2008-2012 but comparatively less. The asset and liability of each year has been
increased as the bank has higher interest income from 2008-2012.
0.66
0.68
0.7
0.72
0.74
0.76
0.78
0.8
2012 2011 2010 2009 2008
Relative IS GAP
0
1
2
3
4
5
6
2012 2011 2010 2009 2008
Interest Sensitive Ratio

47
Investment Maturity Strategy
Investment Maturity Strategy: There is no back end load maturity, ladder or barbell investment
portfolio followed for FSIBL. They follow Front-end load maturity strategy where for almost
each of the five years around 80% of the investments were made in the short and medium
terms. For 2008, around 100% of the investments were in the short and medium term. This
shows that FSIBL prefers higher liquidity to higher profitability.
Liquidity Indicators:
Cash Position Indicator
Cash Position Indicator: The graph shows that there is a fluctuating trend of the cash position
indicator. In 2009 the ratio to cash and deposit to total asset was the highest in the 5 years
where as 2008 had the lowest. In 2010, 2011 and 2012, it is gradually decreasing which means
the liquidity position of FSIBL is declining over the years.
0
0.1
0.2
0.3
0.4
0.5
0.6
2012 2011 2010 2009 2008
Short Term- Not more than one year
In more than one year but not more than five years
In more than five years
0.8
0.85
0.9
0.95
1
2012 2011 2010 2009 2008
Cash Position Indicator

48
Liquid Securities Indicator
Liquid Securities Indicator: The ratio of short-term securities to total asset was the highest in
2010. This increase was due to a high amount of investment in the short term portfolio. As
investments was very low in 2008 ratio fell down significantly but started to rise slowly since
then.
Capacity Ratio
Capacity Ratio: The capacity ratio was only possible to calculate in 2008, which indicated that
the loan and lease was only taken then. In 2009-2012, no loan and lease were taken by the
bank since they became an Islamic bank and did not want to be involved with interest rate. In a
way, it’s good because the lower the capacity ratio, the better for the bank.
0
0.05
0.1
0.15
0.2
0.25
0.3
0.35
0.4
0.45
0.5
2012 2011 2010 2009 2008
Liquid Securities Indicator
0
0.1
0.2
0.3
0.4
0.5
0.6
0.7
0.8
0.9
2012 2011 2010 2009 2008
Capacity Ratio

49
Core Deposit Ratio
Core Deposit Ratio: The core deposit ratio was the lowest in 2008 but later on, the core deposit
ratio has an increasing trend and it kept increasing from 2009 to 2012. An increasing core
deposit ratio is good for the bank as we know that the higher the core deposits, the better.
Core deposits offer many advantages to banks, such as cost predictions and a measurement of
the degree of customer loyalty.
Deposit Composition Ratio
Deposit Composition Ratio: The deposit composition ratio was the highest in 2010 which
indicates that the time deposit was lower than demand deposit. This ratio was lowest in 2012
which indicates that the time deposit was higher than demand deposit. We know that the
lower this ratio the better for the bank because more liquidity, thus FSIBL is in good position in
terms of deposit composition ratio.
0
0.02
0.04
0.06
0.08
0.1
0.12
0.14
0.16
0.18
2012 2011 2010 2009 2008
Core Deposit Ratio
0
0.02
0.04
0.06
0.08
0.1
0.12
2012 2011 2010 2009 2008
Deposit Composition Ratio

50
GAAP
GAAP Capital: For calculating book value of GAAP capital we add par, surplus, undivided profit
and total provisions. As FSIBL has no surplus so it’s paid up capital equivalent to its par value of
common stock. This increasing trend shows how the GAAP capital book value is growing. Here
par value of common stock is the main reason. Bank does not have preferred stock at all.
RAP Capital
RAP Capital: The ratio analysis was done on FSIBL’s main operation, so there is no minority
interest involved. In calculating book value based on RAP capital method; common stock,
retained earnings, equity reserve, preferred stock, sub-ordinate debenture, minority interest
and all kinds of provisions were included, but there are no preferred stock, equity reserve, sub-
ordinate debentures. Above chart is showing increasing trend that means over the years the
0
1,000,000,000
2,000,000,000
3,000,000,000
4,000,000,000
5,000,000,000
2012 2011 2010 2009 2008
GAAP
0500,000,000
1,000,000,0001,500,000,0002,000,000,0002,500,000,0003,000,000,0003,500,000,0004,000,000,0004,500,000,0005,000,000,000
2012 2011 2010 2009 2008
RAP Capital

51
book value of RAP capital is growing. It is a good sign for the bank. As we know that increasing
capital through equity financing means bank can prevent solvency and liquidity crisis.
Tier 1 or Core Capital
Tire-1 or Core Capital: The graph shows that the Core Capital elements are increasing each year
from 2008-2012. The higher the bank increases their core capital amount, the better they might
become well capitalized firm to run their operation.
Leverage Ratio
Leverage Ratio: The bank has well capitalized leverage ratio according to Basel Act. From 2008
to 2012 bank has leverage ratio more than 3%. The change of the ratio of five years is due to
the change of especially total asset and the elements of core capital. So the bank should
continue their operation to maintain this well capitalized leverage ratio.
0
1,000,000,000
2,000,000,000
3,000,000,000
4,000,000,000
5,000,000,000
6,000,000,000
2012 2011 2010 2009 2008
Tier 1 or Core Capital
0
0.01
0.02
0.03
0.04
0.05
0.06
0.07
0.08
0.09
2012 2011 2010 2009 2008
Leverage Ratio

52
Tier 2 or Supplementary Capital
Tire-2 or Supplementary Capital: The graph shows that the supplementary capital increases
each year from 2008-2012, especially high increase in 2012. Bank should continue the
increasing amount of this capital to be well capitalized and expand their regular operation.
Ratio of Tier 1 Capital to Total Risk Assets
Ratio of Tier-1 Capital to Total Risk Assets: The ratio of the bank is above 6% from year 2008-
2012. In this ratio the bank is well capitalized. The bank's financial strength is based on the sum of
its equity capital and disclosed reserves and its ratio suggests that the bank is well capitalized. The
Ratio of Tier 1 Capital to Total Risk Assets shows the comparison between a banking firm’s core
equity capital and total risk assets.
0
500,000,000
1,000,000,000
1,500,000,000
2,000,000,000
2,500,000,000
3,000,000,000
3,500,000,000
2012 2011 2010 2009 2008
Tier 2 or Supplementary Capital
0
0.05
0.1
0.15
0.2
0.25
2012 2011 2010 2009 2008
Ratio of Tier 1 Capital to Total Risk Assets

53
Ratio of Tier 1 Capital + Tier 2 Capital to Total Risk Assets
Ratio of Tire-1+Tire-2 to Total Risk Assets: The ratio of the bank is above 10% from year 2008-
2012 which shows that the bank is well capitalized. The Ratio of Tier 1 +Tier 2 Capital to Total
Risk Assets, also known as Capital Adequacy Ratio is used to protect depositors and promote
the stability and efficiency of financial systems around the world. The Percentage threshold for
Capital Adequacy Ratio varies from bank to bank, according to Basel Accords. For most banks it
has to be greater than 10%.
ICGR
Internal Capital Growth Ratio: This ratio which states the internal capital i.e. retained earnings
of the bank. The trend shows that ICGR is fluctuating over the five years. ROE multiplying with
retention ratio gives the rate of internal capital growth rate. As the growth rate is not very
satisfying, the company has to work on it.
0
0.05
0.1
0.15
0.2
0.25
2012 2011 2010 2009 2008
Ratio of Tier 1+Tier 2 to Total Risk Assets
0
0.02
0.04
0.06
0.08
0.1
0.12
2012 2011 2010 2009 2008
ICGR

54
Conclusion: By observing and analyzing the overall performance and profitability of First Security Islami
Bank Limited, it can be said that net interest income shows an increasing trend over the five
years, which is good for the bank and shows smooth operation of the investments and that the
expenses are controlled. The growth in RAP Capital shows that the bank has the ability to
prevent solvency and liquidity crisis. Higher Leverage Ratio of more than 3%, the Tier 1 Capital
Ratio being above 6% and the Capital Adequacy Ratio above 10% suggests that FSIBL is well-
capitalized. In year after year they are trying to improve themselves by establishing a sound
capital base. They are trying to make their products and services more lucrative to their
customers. And they are rewarding their shareholder’s by enhancing their wealth and attracting
more investors by their bank performance. FSIBL follows Shariah Laws in their business
transactions since January 2009, after they became First Security Islami Bank Limited from First
Security Bank Limited. Thus, they don’t have Loan and Lease from 2009 till 2012 in my
calculation, which is very healthy for their business. However, the change into the Islamic
dimension and investments has reduced the Earnings per share from Tk7.35 to an eventual
Tk2.04, which they need to work on. They follow a front-end load maturity strategy where
more than 80% of the investments are short and medium term investments which say that
FSIBL prefers higher liquidity to higher profitability. But that is something that they might face
trouble with as shown by the analysis of liquidity indicators. The Cash Position Indicator shows
fluctuation in the graph and in 2010, 2011 and 2012; it is gradually decreasing which means the
liquidity position of the bank is declining over the years. This problem can be solved by finding
out ways to lower the costs of overhead like advertising, professional costs and rent. However,
since the bank is well capitalized with sound investments, this after all might not be a major
problem for a bank with 117 branches.

55
Attachments and References: 1. http://www.investopedia.com/terms/t/termloan.asp
2. http://www.investorwords.com/7922/general_loan_and_collateral_agreement.html
3. http://www.investopedia.com/terms/o/overdraft.asp
4. http://www.cic.gc.ca/english/resources/manuals/op/op17-eng.pdf
5. http://www.thefreedictionary.com/Cash+credit
6. http://www.businessdictionary.com/definition/construction-loan.html
7. http://www.businessdictionary.com/definition/payment-against-documents.html
8. http://www.agranibank.org/lim.php
9. http://www.bracbank.com/latr.php
10. http://www.themanagementor.com/EnlightenmentorAreas/finance/FIFS/ConsumerFin.htm
11. http://www.investopedia.com/terms/h/hire-purchase.asp
12. http://www.investopedia.com/terms/c/currentratio.asp
13. http://www.investopedia.com/articles/stocks/07/bankfinancials.asp
14. http://www.investopedia.com/terms/r/returnonequity.asp
15. http://www.fsiblbd.com/
16. http://wiki.islamicfinance.de/index.php/First_Security_Islami_Bank_Limited
17. http://www.investopedia.com/terms/r/returnonassets.asp
18. http://en.wikipedia.org/wiki/Return_on_assets
19. http://www.investopedia.com/terms/r/returnonequity.asp
20. http://en.wikipedia.org/wiki/Barbell_strategy
21. http://archive.thedailystar.net/newDesign/news-details.php?nid=174912
22. https://www.bis.org/publ/bcbs270.pdf
23. http://www.investopedia.com/terms/t/tier-1-capital-ratio.asp
24. http://www.investopedia.com/terms/t/tier-1-capital-ratio.asp
25. http://en.wikipedia.org/wiki/Capital_requirement
26. http://www.investopedia.com/terms/c/capitaladequacyratio.asp
27. http://www.investopedia.com/terms/d/demanddeposit.asp

56
Appendix I:
These are the tools useful in valuation because it helps the financial analyst gauge returns and
risks. So, here are the calculations for FSIBL:
Return on Assets (ROA)
= Net Income/Total Assets
2012
Return on Assets= 761,863,499/129,733,173,088
= 0.0059
2011
Return on Assets= 580,161,847/90,956,640,861
= 0.0064
2010
Return on Assets= 548,600,731/63,619,797,799
= 0.0086
2009
Return on Assets= 326,837,749/47,978,552,952
= 0.0068
2008
Return on Assets= 104,282,064/31,239,393,418
= 0.0033

57
Return on Equity (ROE)
= Net Income/Shareholder's Equity
2012
ROE= 761,863,499/ 5,664,479,782
= 0.1345
2011
ROE= 580,161,847/ 4,500,173,333
= 0.1289
2010
ROE= 548,600,731/ 3,920,011,486
= 0.1399
2009
ROE= 326,837,749/ 2,865,410,755
= 0.1141
2008
ROE= 104,282,064/ 2,538,573,006
= 0.0411

58
Net Interest Income
= Total Interest Income – Total Interest Expense
2012
Net Interest Income= 13,339,668,730 - 10,309,755,493
= 3,029,913,237
2011
Net Interest Income= 8,747,763,443 - 6670951220
= 2,076,812,223
2010
Net Interest Income= 5,547,047,795 - 4,125,826,500
= 1,421,221,295
2009
Net Interest Income= 4,348,674,553 - 3,333,800,367
= 1,014,874,186
2008
Net Interest Income= 3,141,799,470 - 2,939,155,779
= 202,643,691

59
Net Interest Income as % of Total Revenue Generating Assets (TRGA)
= (Total Interest Income – Total Interest Expense)/TRGA
2012
Net Interest Income as % of Total Revenue Generating Assets
= (13,339,668,730 - 10,309,755,493)/ (4,913,392,720 + 96,304,228,588)
= 3,029,913,237/ 101,217,621,308
= 0.0299 or 2.99%
2011
Net Interest Income as % of Total Revenue Generating Assets
= (8,747,763,443 - 6670951220)/ (3,977,001,504 + 69,467,328,284)
= 2,076,812,223/ 73,444,329,788
= 0.0283 or 2.83%
2010
Net Interest Income as % of Total Revenue Generating Assets
= (5,547,047,795 - 4,125,826,500)/ (2,859,354,561 + 52,123,903,164)
= 1,421,221,295/ 54,983,257,725
= 0.0258 or 2.58%
2009
Net Interest Income as % of Total Revenue Generating Assets
= (4,348,674,553 - 3,333,800,367)/ (1,914,504,030 + 38,725,874,774)
= 1,014,874,186/ 40,640,378,804

60
= 0.0250 or 2.50%
2008
Net Interest Income as % of Total Revenue Generating Assets
= (3,141,799,470 - 2,939,155,779)/ (1,332,969,100 + 25,094,658,077)
= 202,643,691/ 26,427,627,177
= 0.0077 or 0.77%
Net Non-Interest Income (NNII) as % of Total Revenue Generating Assets
= (Total Non Interest Income – Total Non Interest Expense)/TRGA
= (Total Operating Income - Total Operating Expense)
2012
Net Non-Interest Income as % of Total Revenue Generating Assets
= (3,734,683,955 - 1,792,725,352)/ (4,913,392,720 + 96,304,228,588)
= 1,941,958,603/ 101,217,621,308
= 0.0192 or 1.92%
2011
Net Non-Interest Income as % of Total Revenue Generating Assets
= (2,735,752,917 -1,146,191,070)/ (3,977,001,504 + 69,467,328,284)
= 1,589,561,847/ 73,444,329,788
= 0.0216 or 2.16%

61
2010
Net Non-Interest Income as % of Total Revenue Generating Assets
= (2,085,207,938 - 881,607,207)/ (2,859,354,561 + 52,123,903,164)
= 1,203,600,731/ 54,983,257,725
= 0.0219 or 2.19%
2009
Net Non-Interest Income as % of Total Revenue Generating Assets
= (1,327,633,708 -576,795,959)/ (1,914,504,030 + 38,725,874,774)
= 750,837,749/ 40,640,378,804
= 0.0185 or 1.85%
2008
Net Non-Interest Income as % of Total Revenue Generating Assets
= (572,782,959 - 300,874,419)/ (1,332,969,100 + 25,094,658,077)
= 271,908,540/ 26,427,627,177
= 0.0103 or 1.03%
Earnings per Share = Net Income/ Number of Outstanding Shares
2012
EPS = 761,863,499/ 374,035,200
= 2.04

62
2011
EPS = 580,161,847/ 340,032,000
= 1.71
2010
EPS = 548,600,731/ 235,888,630
= 2.33
2009
EPS = 326,837,749/ 230,000,000
= 1.42
2008
EPS = 104,282,064/ 14,187,500
= 7.35
Earnings Spread = (Total Interest Income/Total Revenue Generating Assets)+(Total Interest Expense/Total
Interest Bearing Liabilities)
2012
Earning Spread = (13,339,668,730/ 101,217,621,308) + (10,309,755,493/ (4,598,574,967 +
5,462,576,972 + 16,235,459,337))
= (13,339,668,730/ 101,217,621,308) + (10,309,755,493/ 26,296,611,276)
= 0.5238 or 52.38%
63
2011
Earning Spread = (8,747,763,443/ 73,444,329,788) + (6670951220/ (3,231,114,000 +
4,579,934,181 +11,709,826,793))
= (8,747,763,443/ 73,444,329,788) + (6670951220/ 19,520,874,974)
= 0.4608 or 46.08%
2010
Earning Spread = (5,547,047,795 / 54,983,257,725) + (4,125,826,500/ (3,987,763,459 +
11,691,392,816))
= (5,547,047,795 / 54,983,257,725) + (4,125,826,500/ 15,679,156,275)
= 0.3640 or 36.40%
2009
Earning Spread = (4,348,674,553 / 40,640,378,804) + (3,333,800,367/ (2,441,458,467 +
8,777,183,002))
= (4,348,674,553 / 40,640,378,804) + (3,333,800,367/ 11,218,641,469)
= 0.4042 or 40.42%
2008
Earning Spread = (3,141,799,470 / 26,427,627,177) + (2,939,155,779/ (630,000,000 +
922,379,325 + 6,150,000 + 3,904,772,214))
= (3,141,799,470 / 26,427,627,177) + (2,939,155,779/ 5,463,301,539)
= 0.6569 or 65.69%

64
Interest Sensitive Gap = Interest Sensitive Asset – Interest Sensitive Liabilities
2012
Interest Sensitive Gap = (9,344,683,143 + 10,315,382,991 + 470,333,070 + 4,060,654,300 +
852,738,420 + 95,493,421,519 + 810,807,069) – (4,598,574,967 + 5,462,576,972 +
16,235,459,337)
= 121,348,020,512 - 26,296,611,276
= 95,051,409,236
2011
Interest Sensitive Gap = (6,393,582,366 + 5,455,758,041 + 212,626,187 + 3,121,548,300 +
855,453,204 + 64,451,579,004 + 5,015,749,280) – (3,231,114,000 + 4,579,934,181
+11,709,826,793)
= 85,506,296,382 - 19,520,874,974
= 65,985,421,408
2010
Interest Sensitive Gap = (4,245,369,057 + 926,081,336 + 110,117,741 + 2,331,134,100 +
528,220,461 + 47,640,238,696 + 4,483,664,468) – (3,987,763,459 + 11,691,392,816)
= 60,264,825,859 - 15,679,156,275
= 44,585,669,584
2009
Interest Sensitive Gap = (4,600,624,708 + 494,050,218 + 237,100,103 + 1,610,674,000 +
303,830,030 + 35,616,450,493

65
+ 3,109,424,281) – (2,441,458,467 + 8,777,183,002)
= 45,972,153,833 - 11,218,641,469
= 34,753,512,364
2008
Interest Sensitive Gap = (1,170,239,597 + 2,028,471,883 + 72,964,361 + 1,331,969,100 +
1,000,000 + 23,166,010,710 + 1,928,647,367) – (630,000,000 + 922,379,325 + 6,150,000 +
3,904,772,214)
= 29,699,303,018 - 5,463,301,539
= 24,236,001,479
Relative Interest Sensitive Gap = Interest Sensitive Gap/ Total Assets
2012
Relative IS Gap = 95,051,409,236/129,733,173,088
= 0.7327
2011
Relative IS Gap = 65,985,421,408/90,956,640,861
= 0.7255
2010
Relative IS Gap = 44,585,669,584/63,619,797,799
= 0.7008
66
2009
Relative IS Gap = 34,753,512,364/47,978,552,952
= 0.7244
2008
Relative IS Gap = 24,236,001,479/31,239,393,418
= 0.7758
Interest Sensitivity Ratio = Interest Sensitive Asset/ Interest Sensitive Liabilities
2012
Interest Sensitivity Ratio = 121,348,020,512/ 26,296,611,276
= 4.6146
2011
Interest Sensitivity Ratio = 85,506,296,382/ 19,520,874,974
= 4.3802
2010
Interest Sensitivity Ratio = 60,264,825,859/ 15,679,156,275
= 3.8436
2009
Interest Sensitivity Ratio = 45,972,153,833/ 11,218,641,469
= 4.0978

67
2008
Interest Sensitivity Ratio = 29,699,303,018/ 5,463,301,539
= 5.4361
Identification of the Investment Maturity Strategy Short Term- Not more than one year = (In not more than one month + In more than one month
but not more than three months + In more than three months but not more than one
year)/Total of the Maturity grouping of investments
In more than one year but not more than Five years = (In more than one year but not more
than five years)/ Total of the Maturity grouping of investments
In more than Five years = (In more than five years)/ Total of the Maturity grouping of
investments
2012
Short Term- Not more than one year
= (1,586,568,970 + 600,000,000 + 1,000,000,000 + 24,242,389,287 + 21,015,347,089)/
(4,913,392,720 + 96304228588)
= 48,444,305,346/ 101,217,621,308
= 0.4786
In more than one year but not more than Five years
= (1,711,600,000 + 30,064,302,244)/ (4,913,392,720 + 96,304,228,588)
= 31,775,902,244/ 101,217,621,308
= 0.3139

68
In more than Five years
= (14,569,450 + 14,004,074,019)/ (4,913,392,720 + 96,304,228,588)
= 0.1385
2011
Short Term- Not more than one year
= (990,883,754 + 150,000,000 + 420,000,000 + 17,486,812,778 + 15,159,043,758)/
(3,977,001,504 + 69,467,328,284)
= 34,206,740,290/ 73,444,329,788
= 0.4658
In more than one year but not more than Five years
= (2,400,000,000 + 21,686,345,284)/ 73,444,329,788
= 0.3280
In more than Five years
= (14,569,450 + 10,101,587,661)/ 73,444,329,788
= 0.1377
2010
Short Term- Not more than one year
= (523,803,761 + 13,121,003,071 + 11,374,391,790)/ (2,859,354,561 + 52,123,903,164)
= 0.4550
In more than one year but not more than Five years
= (2,330,000,000 + 16,272,067,796)/ (2,859,354,561 + 52,123,903,164)

69
= 0.3383
In more than Five years
= (4,416,700 + 7,579,589,978)/ (2,859,354,561 + 52,123,903,164)
= 0.1379
2009
Short Term- Not more than one year
= (240,352,032 + 9,748,355,188 + 8,450,696,233)/ (1,914,504,030 + 38,725,874,774)
= 0.4537
In more than one year but not more than Five years
= (1,610,000,000 + 12,089,464,170)/ 40,640,378,804
= 0.3371
In more than Five years
= (63,477,998 + 5,631,317,583)/ 40,640,378,804
= 0.1401
2008
Short Term- Not more than one year
= 735,501,600/ 1,332,969,100
= 0.5518
In more than one year but not more than Five years
= 595,000,000/ 1,332,969,100
= 0.4464

70
In more than Five years
= 1,000,000/ 1,332,969,100
= 0.0008
Liquidity Indicators (Cash Position Indicator, Liquid Securities Indicator, Capacity Ratio, Core Deposit Ratio, Deposit
Composition Ratio)
Cash Position Indicator = (Cash + Deposit)/ Total Asset
2012
Cash Position Indicator = (10,528,144,967 + 109,905,568,871)/ 129,733,173,088
= 120,433,713,838/ 129,733,173,088
= 0.9283
2011
Cash Position Indicator = (7,145,564,053 + 78,145,045,008)/ 90,956,640,861
= 85,290,609,061/ 90,956,640,861
= 0.9377
2010
Cash Position Indicator = (4,857,542,203 + 56,344,959,167)/ 63,619,797,799
= 61,202,501,370/ 63,619,797,799
= 0.9620

71
2009
Cash Position Indicator = (5,033,532,439 + 42,423,092,722)/ 47,978,552,952
= 47,456,625,161/ 47,978,552,952
= 0.9891
2008
Cash Position Indicator = (1,394,671,407 + 25,854,541,500)/ 31,239,393,418
= 27,249,212,907/ 31,239,393,418
= 0.8723
Liquid Securities Indicator = Short Term Security/ Total Asset
2012
Liquid Securities Indicator = (654,300 + 1,586,568,970 + 600,000,000 + 1,000,000,000 +
6,978,115,949 + 24,242,389,287 + 21,015,347,089)/ 129,733,173,088
= 55,423,075,595/ 129,733,173,088
= 0.4272
2011
Liquid Securities Indicator = (1,548,300 + 990,883,754 + 150,000,000 + 420,000,000
+5,033,538,803 + 17,486,812,778 + 15,159,043,758)/ 90,956,640,861
= 39,241,827,393/ 90,956,640,861
= 0.4314

72
2010
Liquid Securities Indicator = (1,134,100 + 523,803,761 + 3,776,850,529 + 13,121,003,071 +
11,374,391,790)/ 63,619,797,799
= 28,797,183,251/ 63,619,797,799
= 0.4526
2009
Liquid Securities Indicator = (674,000 + 240,352,032 + 2,806,041,600 + 9,748,355,188 +
8,450,696,233)/ 47,978,552,952
= 21,246,119,053/ 47,978,552,952
= 0.4428
2008
Liquid Securities Indicator = (1, 467,500 + 735,501,600)/ 31,239,393,418
= 736,969,100/ 31,239,393,418
= 0.0235
Capacity Ratio = Loan and Lease/ Total Asset
2012
Capacity Ratio = 0/ 129,733,173,088
= 0

73
2011
Capacity Ratio = 0/ 90,956,640,861
= 0
2010
Capacity Ratio = 0/ 63,619,797,799
= 0
2009
Capacity Ratio = 0/ 47,978,552,952
= 0
2008
Capacity Ratio = 25,094,658,077/ 31,239,393,418
= 0.8033
Core Deposit Ratio = Core Deposit/ Total Asset
2012
Core Deposit Ratio = (160,000,000 + 1,600,000,000 + 7,810,000,000 + 4,274,180,000 +
4,404,936,396 + 3,213,255,809)/ 129,733,173,088
= 21,462,372,205/ 129,733,173,088
= 0.1654

74
2011
Core Deposit Ratio = (550,000,000 + 1,890,000,000 + 4,650,000,000 + 250,000,000 +
3,525,823,407 + 3,847,308,558)/ 90,956,640,861
= 14,713,131,965/ 90,956,640,861
= 0.1618
2010
Core Deposit Ratio = (540,000,000 + 120,000,000 + 1,380,000,000 + 100,000,000 +
3,180,887,242 + 4,193,131,957)/ 63,619,797,799
= 9,514,019,199/ 63,619,797,799
= 0.1495
2009
Core Deposit Ratio = (310,000,000 + 250,000,000 + 1,780,000,000 + 1,993,468,880 +
1,860,511,504)/ 47,978,552,952
= 6,193,980,384/ 47,978,552,952
= 0.1291
2008
Core Deposit Ratio = (250,000,000 + 690,000,000 + 1,153,779,011 + 362,627,725)/
31,239,393,418
= 2,456,406,736/ 31,239,393,418
= 0.0786

75
Deposit Composition Ratio = Demand Deposit/Time Deposit
2012
Deposit Composition Ratio = (160,000,000 + 4,404,936,396)/ 79,263,696,843
= 0.0576
2011
Deposit Composition Ratio = (550,000,000 + 3,525,823,407)/ 53,914,817,281
= 0.0756
2010
Deposit Composition Ratio = (540,000,000 + 3,180,887,242)/ 33,076,189,284
= 0.1125
2009
Deposit Composition Ratio = (310,000,000 + 1,993,468,880)/ 26,684,564,624
= 0.0863
2008
Deposit Composition Ratio = 1,153,779,011/ 19,319,071,709
= 0.0597

76
Book value of bank capital (GAAP) = Par + Surplus + Undivided Profit + Provisions for Loan Lease
2012
GAAP = 3,740,352,000 + 433,109,918 + 440,095,104
= 4,613,557,022
2011
GAAP = 3,400,320,000 + 371,651,119 + 369,400,000
= 4,141,371,119
2010
GAAP = 3,036,000,000 + 399,841,641 + 220,000,000
= 3,655,841,641
2009
GAAP = 2,300,000,000 + 277,961,056 + 104,000,000
= 2,681,961,056
2008
GAAP = 2,300,000,000 + 80,490,857
= 2,380,490,857

77
RAP Capital = Common Stock + Retained earning + Equity Reserve + Preferred Stock + Provisions
+Subordinate Debenture + Minority interest
2012
RAP capital = 3,740,352,000 + 433,109,918 + 440,095,104
= 4,613,557,022
2011
RAP capital = 3,400,320,000 + 371,651,119 + 369,400,000
= 4,141,371,119
2010
RAP capital = 3,036,000,000 + 399,841,641 + 220,000,000
= 3,655,841,641
2009
RAP capital = 2,300,000,000 + 277,961,056 + 104,000,000
= 2,681,961,056
2008
RAP capital = 2,300,000,000 + 80,490,857
= 2,380,490,857

78
Tier 1 or Core Capital = Paid Up Capital + Statutory Reserve + General Reserve + Retained Earnings
2012
Tier 1 or Core Capital = 3,740,400,000 + 1,004,574,914 + 84,000,000 + 433,109,918
= 5,262,084,832
2011
Tier 1 or Core Capital = 3,400,320,000 + 704,202,214 + 24,000,000 + 371,651,119
= 4,500,173,333
2010
Tier 1 or Core Capital = 3,036,000,000 + 460,169,845 + 24,000,000 + 399,841,641
= 3,920,011,486
2009
Tier 1 or Core Capital = 2,300,000,000 + 263,449,699 + 24,000,000 + 277,961,056
= 2,865,410,755
2008
Tier 1 or Core Capital = 2,300,000,000 + 134,082,149 + 24,000,000 + 80,490,857
= 2,538,573,006
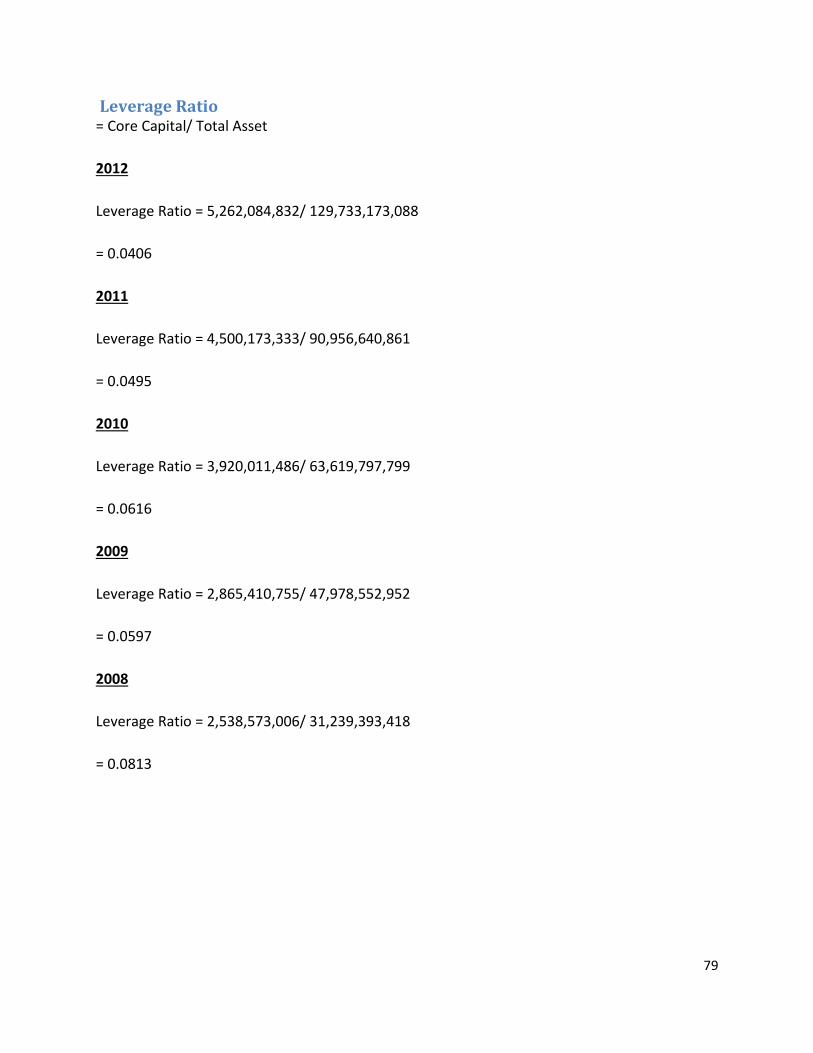
79
Leverage Ratio = Core Capital/ Total Asset
2012
Leverage Ratio = 5,262,084,832/ 129,733,173,088
= 0.0406
2011
Leverage Ratio = 4,500,173,333/ 90,956,640,861
= 0.0495
2010
Leverage Ratio = 3,920,011,486/ 63,619,797,799
= 0.0616
2009
Leverage Ratio = 2,865,410,755/ 47,978,552,952
= 0.0597
2008
Leverage Ratio = 2,538,573,006/ 31,239,393,418
= 0.0813

80
Tier 2 or Supplementary Capital = General Provision + Exchange Equalization Account + Assets Revaluation Reserves +
Subordinated Debt
2012
Tier 2 or Supplementary Capital = 1,103,395,103 + 201,221,475 + 1,578,625,450
= 2,883,242,028
2011
Tier 2 or Supplementary Capital = 900,376,700
2010
Tier 2 or Supplementary Capital = 662,205,999
2009
Tier 2 or Supplementary Capital = 512,205,999 + 1,419,078
= 513,625,077
2008
Tier 2 or Supplementary Capital = 322,205,999 + 1,419,078
= 323,625,077
Ratio of Tier 1 capital to Total Risk assets = Tier 1 Capital/ Total Risk Weighted Asset
2012
Ratio of Tier 1 capital to Total Risk assets
= 5,262,084,832/ 52,841,255,710

81
= 0.0996
2011
Ratio of Tier 1 capital to Total Risk assets
= 4,500,173,333/ 37,724,180,400
= 0.1193
2010
Ratio of Tier 1 capital to Total Risk assets
= 3,920,011,486/ 27,504,810,069
= 0.1425
2009
Ratio of Tier 1 capital to Total Risk assets
= 2,865,410,755/ 20,667,788,954
= 0.1386
2008
Ratio of Tier 1 capital to Total Risk assets
= 2,538,573,006/ 13,247,050,569
= 0.1916

82
Ratio of Tier 1 + Tier 2 Capital to Total Risk Assets = (Tier 1 Capital + Tier 2 Capital)/ Total Risk Weighted Asset
2012
Ratio of Tier 1 + Tier 2 Capital to Total Risk Assets
= (5,262,084,832 + 2,883,242,028)/ 52,841,255,710
= 0.1541
2011
Ratio of Tier 1 + Tier 2 Capital to Total Risk Assets
= (4,500,173,333 + 900,376,700)/ 37,724,180,400
= 0.1432
2010
Ratio of Tier 1 + Tier 2 Capital to Total Risk Assets
= (3,920,011,486 + 662,205,999)/ 27,504,810,069
= 0.1666
2009
Ratio of Tier 1 + Tier 2 Capital to Total Risk Assets
= (2,865,410,755 + 513,625,077)/ 20,667,788,954
= 0.1635
2008
Ratio of Tier 1 + Tier 2 Capital to Total Risk Assets
= (2,538,573,006 + 323,625,077)/ 13,247,050,569

83
= 0.2161
Internal Capital Growth Rate (ICGR) = ROE X Retention Ratio
2012
= 0.134498406 X (433,109,918/ 761,863,499)
= 0.0765
2011
= 0.128919889 X (371,651,119/ 580,161,847)
= 0.0826
2010
= 0.139948756 X (399,841,641/ 548,600,731)
= 0.1020
2009
= 0.11406314 X (277,961,056/ 326,837,749)
= 0.0970
2008
= 0.041079009 X (80,490,857/ 104,282,064)
= 0.0317
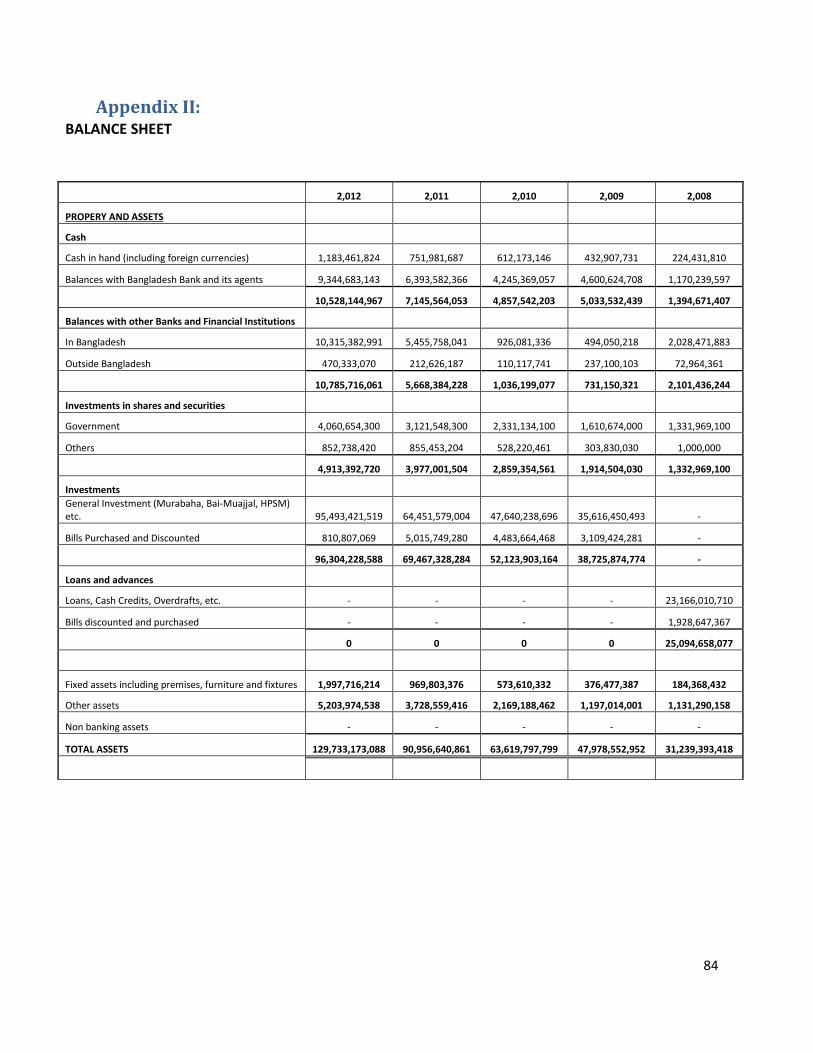
84
Appendix II:
BALANCE SHEET
2,012 2,011 2,010 2,009 2,008
PROPERY AND ASSETS
Cash
Cash in hand (including foreign currencies) 1,183,461,824 751,981,687 612,173,146 432,907,731 224,431,810
Balances with Bangladesh Bank and its agents 9,344,683,143 6,393,582,366 4,245,369,057 4,600,624,708 1,170,239,597
10,528,144,967 7,145,564,053 4,857,542,203 5,033,532,439 1,394,671,407
Balances with other Banks and Financial Institutions
In Bangladesh 10,315,382,991 5,455,758,041 926,081,336 494,050,218 2,028,471,883
Outside Bangladesh 470,333,070 212,626,187 110,117,741 237,100,103 72,964,361
10,785,716,061 5,668,384,228 1,036,199,077 731,150,321 2,101,436,244
Investments in shares and securities
Government 4,060,654,300 3,121,548,300 2,331,134,100 1,610,674,000 1,331,969,100
Others 852,738,420 855,453,204 528,220,461 303,830,030 1,000,000
4,913,392,720 3,977,001,504 2,859,354,561 1,914,504,030 1,332,969,100
Investments General Investment (Murabaha, Bai-Muajjal, HPSM)
etc. 95,493,421,519 64,451,579,004 47,640,238,696 35,616,450,493 -
Bills Purchased and Discounted 810,807,069 5,015,749,280 4,483,664,468 3,109,424,281 -
96,304,228,588 69,467,328,284 52,123,903,164 38,725,874,774 -
Loans and advances
Loans, Cash Credits, Overdrafts, etc. - - - - 23,166,010,710
Bills discounted and purchased - - - - 1,928,647,367
0 0 0 0 25,094,658,077
Fixed assets including premises, furniture and fixtures 1,997,716,214 969,803,376 573,610,332 376,477,387 184,368,432
Other assets 5,203,974,538 3,728,559,416 2,169,188,462 1,197,014,001 1,131,290,158
Non banking assets - - - - -
TOTAL ASSETS 129,733,173,088 90,956,640,861 63,619,797,799 47,978,552,952 31,239,393,418

85
2012 2011 2010 2009 2008
LIABILITIES AND CAPITAL
Liabilities
Placement from banks and financial institutions 4,598,574,967 3,231,114,000 - - 630,000,000
Deposits and other current accounts
Current deposits & other accounts etc. 7,119,359,753 7,050,818,872 7,043,747,274 3,958,510,256 1,444,525,699
Bills payable 1,824,475,966 889,647,881 545,866,334 561,376,373 257,642,553
Savings bank deposits 5,462,576,972 4,579,934,181 3,987,763,459 2,441,458,467 922,379,325
Fixed deposits 79,263,696,843 53,914,817,281 33,076,189,284 26,684,564,624 19,319,071,709
Bearer certificates of deposits - - - - 6,150,000
Deposits under schemes 16,235,459,337 11,709,826,793 11,691,392,816 8,777,183,002 3,904,772,214
109,905,568,871 78,145,045,008 56,344,959,167 42,423,092,722 25,854,541,500
Other Liabilities 7,344,549,468 5,080,308,520 3,354,827,146 2,690,049,475 2,216,278,912
Mudarabah Subordinated Bond 2,220,000,000 - - - -
TOTAL LIABILITIES 124,068,693,306 86,456,467,528 59,699,786,313 45,113,142,197 28,700,820,412
SHAREHOLDERS' EQUITY
Share Capital-Paid up capital 3,740,352,000 3,400,320,000 3,036,000,000 2,300,000,000 2,300,000,000
Statutory reserve 1,004,574,914 704,202,214 460,169,845 263,449,699 134,082,149
Asset revaluation reserve 402,442,950 - - - -
Profit and loss account-retained earnings 433,109,918 371,651,119 399,841,641 277,961,056 80,490,857
Other Reserve 84,000,000 24,000,000 24,000,000 24,000,000 24,000,000
TOTAL SHAREHOLDERS' EQIUTY 5,664,479,782 4,500,173,333 3,920,011,486 2,865,410,755 2,538,573,006
TOTAL LIABILITIES AND SHAREHOLDERS' EQUITY 129,733,173,088 90,956,640,861 63,619,797,799 47,978,552,952 31,239,393,418
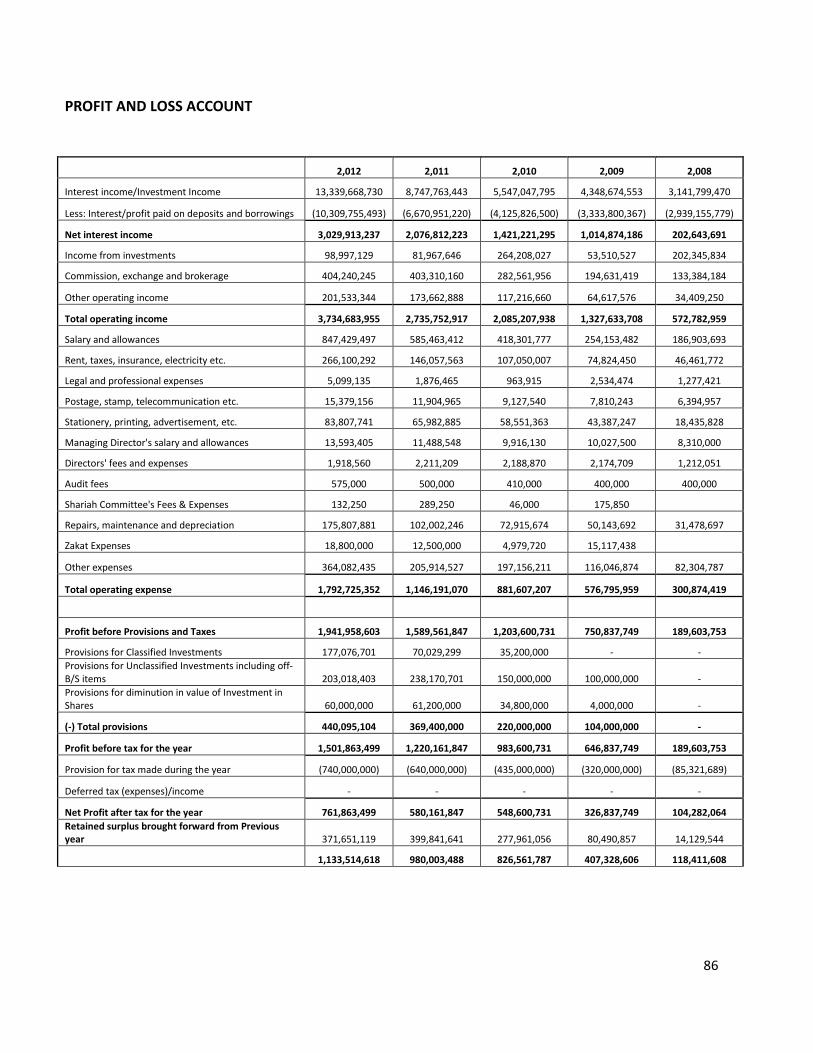
86
PROFIT AND LOSS ACCOUNT
2,012 2,011 2,010 2,009 2,008
Interest income/Investment Income 13,339,668,730 8,747,763,443 5,547,047,795 4,348,674,553 3,141,799,470
Less: Interest/profit paid on deposits and borrowings (10,309,755,493) (6,670,951,220) (4,125,826,500) (3,333,800,367) (2,939,155,779)
Net interest income 3,029,913,237 2,076,812,223 1,421,221,295 1,014,874,186 202,643,691
Income from investments 98,997,129 81,967,646 264,208,027 53,510,527 202,345,834
Commission, exchange and brokerage 404,240,245 403,310,160 282,561,956 194,631,419 133,384,184
Other operating income 201,533,344 173,662,888 117,216,660 64,617,576 34,409,250
Total operating income 3,734,683,955 2,735,752,917 2,085,207,938 1,327,633,708 572,782,959
Salary and allowances 847,429,497 585,463,412 418,301,777 254,153,482 186,903,693
Rent, taxes, insurance, electricity etc. 266,100,292 146,057,563 107,050,007 74,824,450 46,461,772
Legal and professional expenses 5,099,135 1,876,465 963,915 2,534,474 1,277,421
Postage, stamp, telecommunication etc. 15,379,156 11,904,965 9,127,540 7,810,243 6,394,957
Stationery, printing, advertisement, etc. 83,807,741 65,982,885 58,551,363 43,387,247 18,435,828
Managing Director's salary and allowances 13,593,405 11,488,548 9,916,130 10,027,500 8,310,000
Directors' fees and expenses 1,918,560 2,211,209 2,188,870 2,174,709 1,212,051
Audit fees 575,000 500,000 410,000 400,000 400,000
Shariah Committee's Fees & Expenses 132,250 289,250 46,000 175,850
Repairs, maintenance and depreciation 175,807,881 102,002,246 72,915,674 50,143,692 31,478,697
Zakat Expenses 18,800,000 12,500,000 4,979,720 15,117,438
Other expenses 364,082,435 205,914,527 197,156,211 116,046,874 82,304,787
Total operating expense 1,792,725,352 1,146,191,070 881,607,207 576,795,959 300,874,419
Profit before Provisions and Taxes 1,941,958,603 1,589,561,847 1,203,600,731 750,837,749 189,603,753
Provisions for Classified Investments 177,076,701 70,029,299 35,200,000 - -
Provisions for Unclassified Investments including off-B/S items 203,018,403 238,170,701 150,000,000 100,000,000 -
Provisions for diminution in value of Investment in Shares 60,000,000 61,200,000 34,800,000 4,000,000 -
(-) Total provisions 440,095,104 369,400,000 220,000,000 104,000,000 -
Profit before tax for the year 1,501,863,499 1,220,161,847 983,600,731 646,837,749 189,603,753
Provision for tax made during the year (740,000,000) (640,000,000) (435,000,000) (320,000,000) (85,321,689)
Deferred tax (expenses)/income - - - - -
Net Profit after tax for the year 761,863,499 580,161,847 548,600,731 326,837,749 104,282,064
Retained surplus brought forward from Previous year 371,651,119 399,841,641 277,961,056 80,490,857 14,129,544
1,133,514,618 980,003,488 826,561,787 407,328,606 118,411,608

87
Identification of the Investment Maturity Strategy From Notes
Maturity grouping of investments in Shares and Securities 2012 2011 2010 2009 2008
On demand 654,300 1,548,300 1,134,100 674,000
In not more than one month 1,586,568,970 990,883,754 523,803,761 240,352,032 In more than one month but not more than three months 600,000,000 150,000,000
In more than three months but not more than one year 1,000,000,000 420,000,000
In more than one year but not more than five years 1,711,600,000 2,400,000,000 2,330,000,000 1,610,000,000
In more than five years 14,569,450 14,569,450 4,416,700 63,477,998
4,913,392,720 3,977,001,504 2,859,354,561 1,914,504,030
Maturity grouping of investments
On demand 6,978,115,949 5,033,538,803 3,776,850,529 2,806,041,600 1 ,467,500
In not more than one month
In more than one month but not more than three months 24,242,389,287 17,486,812,778 13,121,003,071 9,748,355,188 735,501,600
In more than three months but not more than one year 21,015,347,089 15,159,043,758 11,374,391,790 8,450,696,233
In more than one year but not more than five years 30,064,302,244 21,686,345,284 16,272,067,796 12,089,464,170 595,000,000
In more than five years 14,004,074,019 10,101,587,661 7,579,589,978 5,631,317,583 1 ,000,000
96,304,228,588 69,467,328,284 52,123,903,164 38,725,874,774 1,332,969,100
101,217,621,308 73,444,329,788 54,983,257,725 40,640,378,804 1,332,969,100
2012 2011 2010 2009 2008
Appropriation
Statutory reserve 300,372,700 244,032,369 196,720,146 129,367,550 37,920,751
Other Reserve 60,000,000 - - - -
Bonus Share Issued 340,032,000 364,320,000 230,000,000 - -
(700,404,700) (608,352,369) (426,720,146) (129,367,550) (37,920,751)
Retained earnings carried forward 433,109,918 371,651,119 399,841,641 277,961,056 80,490,857
Earnings per share 2.04 1.71 2.33 1.42 7.35

88
From Notes Tier-I ( Core capital) 2012 2011 2010 2009 2008
Paid up capital 3,740,400,000 3,400,320,000 3,036,000,000 2,300,000,000 2,300,000,000
Statutory reserve 1,004,574,914 704,202,214 460,169,845 263,449,699 134,082,149
General reserve 84,000,000 24,000,000 24,000,000 24,000,000 24,000,000
Retained earnings 433,109,918 371,651,119 399,841,641 277,961,056 80,490,857
5,262,084,832 4,500,173,333 3,920,011,486 2,865,410,755 2,538,573,006
From Notes of Deposit
Maturity grouping of deposit
From Banks 2012 2011 2010 2009 2008
On demand 160,000,000 550,000,000 540,000,000 310,000,000
Within one month 1,600,000,000 1,890,000,000 120,000,000 250,000,000 250,000,000
In more than one month but less than six months 7,810,000,000 4,650,000,000 1,380,000,000 1,780,000,000 690,000,000
In more than six months but less than one year 4,274,180,000 250,000,000 100,000,000
In more than one year but within five years
In more than five years but within ten years
Unclaimed deposit aging 10 years or more
13,844,180,000 7,340,000,000 2,140,000,000 2,340,000,000 940,000,000
From other than Banks
On demand 4,404,936,396 3,525,823,407 3,180,887,242 1,993,468,880 1,153,779,011
Short Term Deposit 3,213,255,809 3,847,308,558 4,193,131,957 1,860,511,504 362,627,725
7,618,192,205 7,373,131,965 7,374,019,199 3,853,980,384 1,516,406,736
21,462,372,205 14,713,131,965 9,514,019,199 6,193,980,384 2,456,406,736
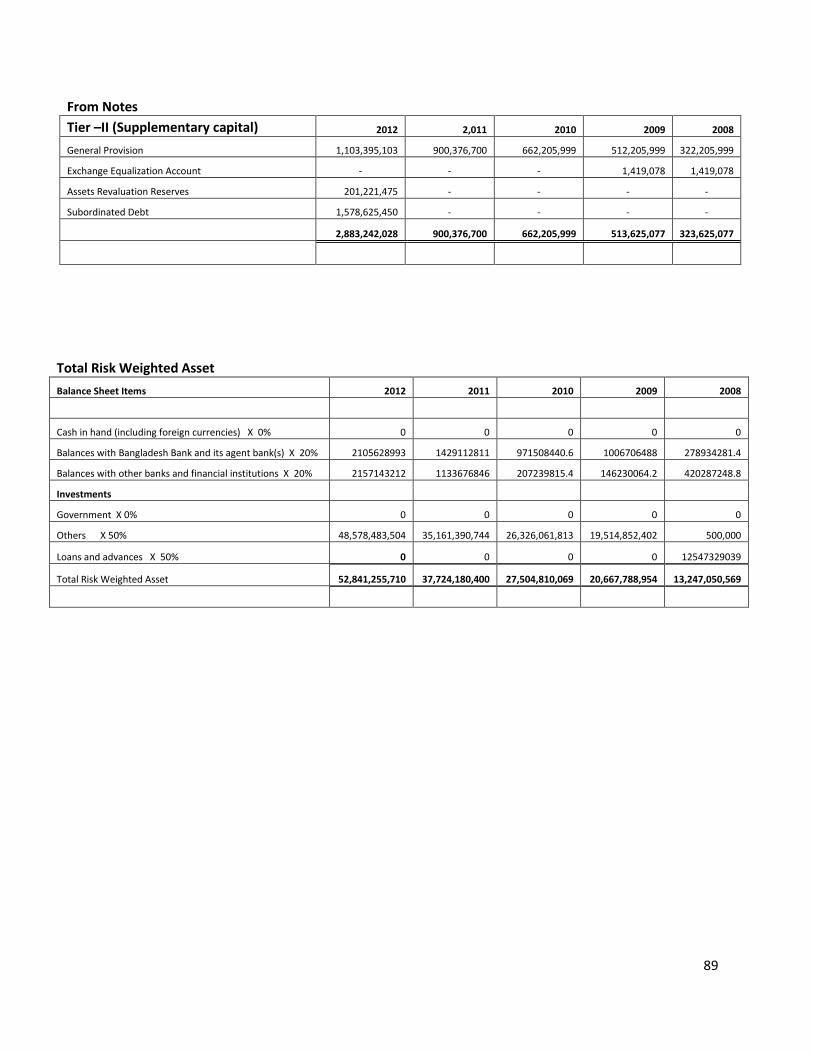
89
From Notes Tier –II (Supplementary capital) 2012 2,011 2010 2009 2008
General Provision 1,103,395,103 900,376,700 662,205,999 512,205,999 322,205,999
Exchange Equalization Account - - - 1,419,078 1,419,078
Assets Revaluation Reserves 201,221,475 - - - -
Subordinated Debt 1,578,625,450 - - - -
2,883,242,028 900,376,700 662,205,999 513,625,077 323,625,077
Total Risk Weighted Asset
Balance Sheet Items 2012 2011 2010 2009 2008
Cash in hand (including foreign currencies) X 0% 0 0 0 0 0
Balances with Bangladesh Bank and its agent bank(s) X 20% 2105628993 1429112811 971508440.6 1006706488 278934281.4
Balances with other banks and financial institutions X 20% 2157143212 1133676846 207239815.4 146230064.2 420287248.8
Investments
Government X 0% 0 0 0 0 0
Others X 50% 48,578,483,504 35,161,390,744 26,326,061,813 19,514,852,402 500,000
Loans and advances X 50% 0 0 0 0 12547329039
Total Risk Weighted Asset 52,841,255,710 37,724,180,400 27,504,810,069 20,667,788,954 13,247,050,569

90
Annual Reports 2012
FIRST SECURITY ISLAMI BANK LIMITED BALANCE SHEET
AS AT 31 DECEMBER 2012
31.12.2012 31.12.2011 Notes BDT BDT
PROPERTY AND ASSETS Cash 3 10,528,144,967 7,145,564,053 In hand (Including foreign currencies) 1,183,461,824 751,981,687 Balance with Bangladesh Bank and its agent bank(s) 9,344,683,143 6,393,582,366 (Including foreign currencies)
Balance with other Banks and Financial Institutions 4 10,785,716,061 5,668,384,228 In Bangladesh 10,315,382,991 5,455,758,041 Outside Bangladesh 470,333,070 212,626,187
Investments in Shares & Securities 5 4,913,392,720 3,977,001,504 Government 4,060,654,300 3,121,548,300 Others 852,738,420 855,453,204
Investments 6 96,304,228,588 69,467,328,284 General Investment (Bai-Murabaha, Bai-Muajjal, HPSM) etc. 6.A
95,493,421,519 64,451,579,004 Bills Purchased and Negotiated 6.B 810,807,069 5,015,749,280
Fixed Assets Including Premises, Furniture & Fixtures 7 1,997,716,214 969,803,376 Other Assets 8 5,203,974,538 3,728,559,416
Total Assets
129,733,173,088 90,956,640,861
LIABILITIES AND CAPITAL
Liabilities
Placement from Banks & other Financial Institutions 9 4,598,574,967 3,231,114,000
Deposits and Other Accounts 10 109,905,568,871 78,145,045,008 Al-Wadia Current Accounts and Other Deposit Accounts 10.1 7,119,359,753 7,050,818,872 Bills Payable 10.2 1,824,475,966 889,647,881 Mudaraba Savings Bank Deposits 10.3 5,462,576,972 4,579,934,181 Mudaraba Term Deposits including other Banks 10.4 79,263,696,843 53,914,817,281 Mudaraba Deposits under Schemes 10.5 16,235,459,337 11,709,826,793
Mudaraba Subordinated Bond 11 2,220,000,000 - Other Liabilities 12 7,344,549,468 5,080,308,520 Total Liabilities 124,068,693,306 86,456,467,528 Capital/Shareholders' equity
Paid-up Capital 13 3,740,352,000 3,400,320,000 Statutory Reserve 14 1,004,574,914 704,202,214 Other Reserve 84,000,000 24,000,000 Assets Revaluation Reserve 15 402,442,950 - Retained Earnings 16 433,109,918 371,651,119 Total Shareholders' Equity 5,664,479,782 4,500,173,333
Total Liabilities and Shareholders' Equity 129,733,173,088 90,956,640,861

91
FIRST SECURITY ISLAMI BANK LIMITED
PROFIT AND LOSS ACCOUNT FOR THE YEAR ENDED 31 DECEMBER 2012
31.12.2012 31.12.2011 Notes BDT BDT
Investments Income
20
13,339,668,730 8,747,763,443 Profit Paid on Deposits 21 (10,309,755,493) (6,670,951,220) Net Investment Income 3,029,913,237 2,076,812,223 Income from Investment in shares and securities 22 98,997,129 81,967,646 Commission, Exchange and Brokerage 23 404,240,245 403,310,160 Other Operating Income 24 201,533,344 173,662,888
Total Operating Income 704,770,718 658,940,694 3,734,683,955 2,735,752,917
Less: Operating Expenses Salary and Allowances 25 847,429,497 585,463,412 Rent, Taxes, Insurances, Electricity etc. 26 266,100,292 146,057,563 Legal Expenses 27 5,099,135 1,876,465 Postage, Stamps, Telecommunication etc. 28 15,379,156 11,904,965 Stationery, Printings, Advertisements etc. 29 83,807,741 65,982,885 Managing Director's Salary and Fees 30 13,593,405 11,488,548 Auditors' Fees 575,000 500,000 Directors' Fees 32 1,918,560 2,211,209 Shariah Committee's Fees & Expenses 33 132,250 289,250 Depreciation and Repair of Bank's Assets 34 175,807,881 102,002,246 Zakat Expenses 18,800,000 12,500,000 Other Expenses 35 364,082,435 205,914,527 Total Operating Expenses 1,792,725,352 1,146,191,070 Profit before Provision and Tax 1,941,958,603 1,589,561,847 Provisions for Classified Investments 177,076,701 70,029,299 Provisions for Unclassified Investments including off-B/S items 12.2 203,018,403 238,170,701 Provisions for diminution in value of Investment in Shares 60,000,000 61,200,000 Total Provisions 440,095,104 369,400,000 Total Profit before Taxes 1,501,863,499 1,220,161,847 Provision for Taxation 12.1 (740,000,000) (640,000,000) Deferred Tax Income 2.8.4 - -
(740,000,000) (640,000,000) Net Profit after tax for the period 761,863,499 580,161,847 Retained Earnings Brought Forward from Previous Year 371,651,119 399,841,641
Appropriations: 1,133,514,618 980,003,488
Statutory Reserve 300,372,700 244,032,369 Other Reserve 60,000,000 - Bonus Share Issued 340,032,000 364,320,000
Retained Earnings Carried Forward 700,404,700 608,352,369 433,109,918 371,651,119
Earnings Per Share (EPS) 36 2.04 1.71
EARNINGS PER SHARE
Net Profit after Tax 761,863,499 580,161,847 Number of Ordinary Shares (weighted average as per
374,035,200 340,032,000 BAS-33 )
Earnings Per Share (EPS) 2.04 1.71
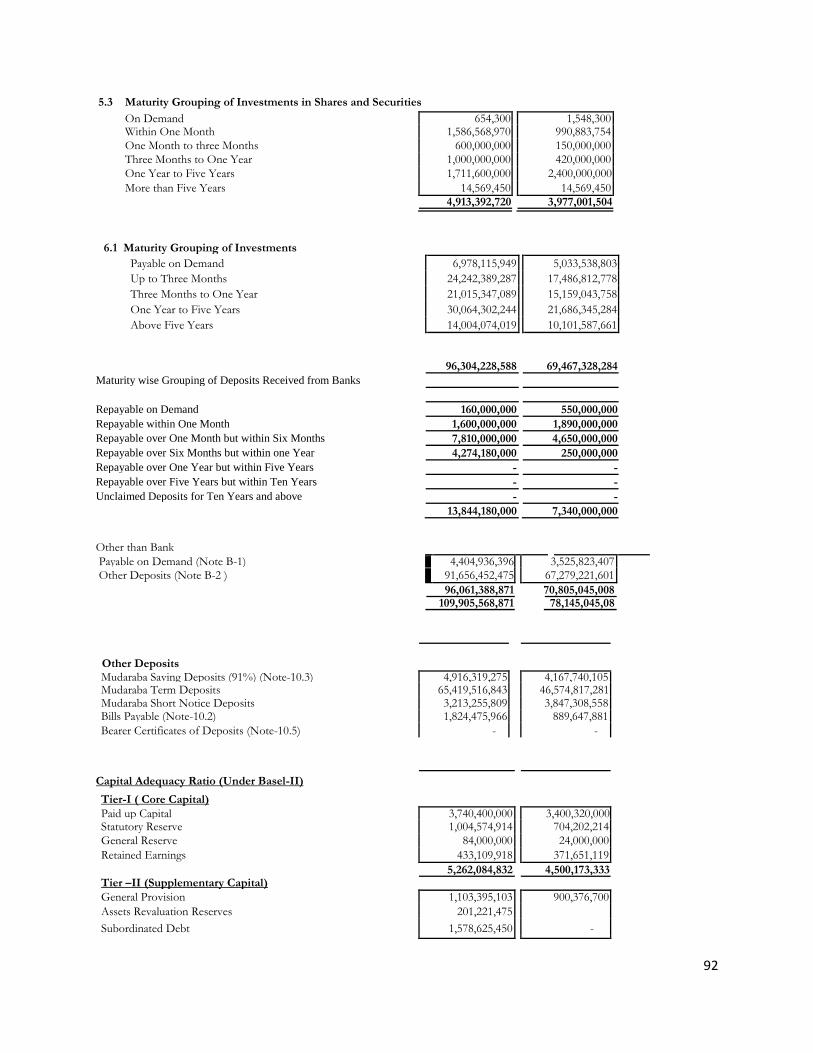
92
5.3 Maturity Grouping of Investments in Shares and Securities On Demand 654,300 1,548,300 Within One Month 1,586,568,970 990,883,754 One Month to three Months 600,000,000 150,000,000 Three Months to One Year 1,000,000,000 420,000,000 One Year to Five Years 1,711,600,000 2,400,000,000 More than Five Years 14,569,450 14,569,450 4,913,392,720 3,977,001,504
6.1 Maturity Grouping of Investments Payable on Demand 6,978,115,949 5,033,538,803 Up to Three Months 24,242,389,287 17,486,812,778 Three Months to One Year 21,015,347,089 15,159,043,758 One Year to Five Years 30,064,302,244 21,686,345,284 Above Five Years 14,004,074,019 10,101,587,661
96,304,228,588 69,467,328,284 Maturity wise Grouping of Deposits Received from Banks
Repayable on Demand 160,000,000 550,000,000
Repayable within One Month 1,600,000,000 1,890,000,000
Repayable over One Month but within Six Months 7,810,000,000 4,650,000,000
Repayable over Six Months but within one Year 4,274,180,000 250,000,000
Repayable over One Year but within Five Years - -
Repayable over Five Years but within Ten Years - -
Unclaimed Deposits for Ten Years and above - -
13,844,180,000 7,340,000,000
Other than Bank Payable on Demand (Note B-1) 4,404,936,396 3,525,823,407 Other Deposits (Note B-2 ) 91,656,452,475 67,279,221,601 96,061,388,871 70,805,045,008 109,905,568,871 78,145,045,08
Other Deposits
Mudaraba Saving Deposits (91%) (Note-10.3) 4,916,319,275 4,167,740,105 Mudaraba Term Deposits 65,419,516,843 46,574,817,281 Mudaraba Short Notice Deposits 3,213,255,809 3,847,308,558 Bills Payable (Note-10.2) 1,824,475,966 889,647,881 Bearer Certificates of Deposits (Note-10.5) - -
Capital Adequacy Ratio (Under Basel-II)
Tier-I ( Core Capital) Paid up Capital 3,740,400,000 3,400,320,000 Statutory Reserve 1,004,574,914 704,202,214 General Reserve 84,000,000 24,000,000 Retained Earnings 433,109,918 371,651,119
Tier –II (Supplementary Capital) 5,262,084,832 4,500,173,333
General Provision 1,103,395,103 900,376,700 Assets Revaluation Reserves 201,221,475
Subordinated Debt 1,578,625,450 -

93
2,883,242,028 900,376,700 2011
FIRST SECURITY ISLAMI BANK LIMITED BALANCE SHEET
AS AT 31 DECEMBER 2011 31.12.2011 31.12.2010
Notes BDT BDT
PROPERTY AND ASSETS 3
Cash 7,145,564,053 4,857,542,203
In hand (Including foreign currencies) 751,981,687 612,173,146
Balance with Bangladesh Bank and its agent bank(s) 6,393,582,366 4,245,369,057
(Including foreign currencies)
Balance with other Banks and Financial Institutions 4 5,668,384,228 920,520,972 In Bangladesh 5,455,758,041 810,403,231 Outside Bangladesh 212,626,187 110,117,741
Investments in Shares & Securities 5 3,977,001,504 2,859,354,561 Government 3,121,548,300 2,331,134,100 Others 855,453,204 528,220,461
Investments 6 69,467,328,284 52,123,903,164
General Investment (Bai-Murabaha, Bai-Muajjal, HPSM) etc. 6.A
64,451,579,004 47,640,238,696 Bills Purchased and Discounted 6.B 5,015,749,280 4,483,664,468
Fixed Assets Including Premises, Furniture & Fixtures 7 969,803,376 573,610,332 Other Assets 8 3,728,559,416 2,284,866,567 Non Banking Assets - -
Total Assets 90,956,640,861 63,619,797,799
LIABILITIES AND CAPITAL
Liabilities
9
Placement from Banks & other Financial Institutions 3,231,114,000 -
Deposits and Other Accounts 10 78,145,045,008 56,344,959,167 Al-Wadia Current Accounts and Other Deposit Accounts 10.1 7,050,818,872 7,043,747,274 Bills Payable 10.2 889,647,881 545,866,334 Mudaraba Savings Bank Deposits 10.3 4,579,934,181 3,987,763,459 Mudaraba Term Deposits including other Banks 10.4 53,914,817,281 33,076,189,284 Bearer Certificates of Deposits 10.5 - - Mudaraba Deposits under Schemes 10.6 11,709,826,793 11,691,392,816
Other Liabilities 11 5,080,308,520 3,354,827,146 Total Liabilities 86,456,467,528 59,699,786,313 Capital/Shareholders' equity
Paid-up Capital 12 3,400,320,000 3,036,000,000 Statutory Reserve 13 704,202,214 460,169,845 Other Reserve 24,000,000 24,000,000 Retained Earnings 14 371,651,119 399,841,641 Total Shareholders' Equity 4,500,173,333 3,920,011,486
Total Liabilities and Shareholders' Equity 90,956,640,861 63,619,797,799

94
Investments Income 18
8,747,763,443 5,547,047,795
Profit Paid on Deposits 19 (6,670,951,220) (4,125,826,500)
Net Investment Income 2,076,812,223 1,421,221,295
Income from Investment in shares and securities 20 81,967,646 264,208,027
Commission, Exchange and Brokerage 21 403,310,160 282,561,956
Other Operating Income 22 173,662,888 117,216,660
658,940,694 663,986,643
Total Operating Income 2,735,752,917 2,085,207,938
Less: Operating Expenses Salary and Allowances 23 585,463,412 418,301,777 Rent, Taxes, Insurances, Electricity etc. 24 146,057,563 107,050,007 Legal Expenses 25 1,876,465 963,915 Postage, Stamps, Telecommunication etc. 26 11,904,965 9,127,540 Stationery, Printings, Advertisements etc. 27 65,982,885 58,551,363 Managing Director's Salary and Fees 28 11,488,548 9,916,130 Auditors' Fees 500,000 410,000 Directors' Fees 29 2,211,209 2,188,870 Shariah Committee's Fees & Expenses 30 289,250 46,000 Depreciation and Repair of Bank's Assets 31 102,002,246 72,915,674 Zakat Expenses 12,500,000 4,979,720 Other Expenses 32 205,914,527 197,156,211 Total Operating Expenses 1,146,191,070 881,607,207 Profit before Provision and Tax 1,589,561,847 1,203,600,731 Provisions for Classified Investments 70,029,299 35,200,000 Provisions for Unclassified Investments including off-B/S items 11.2 238,170,701 150,000,000 Provisions for diminution in value of Investment in Shares 61,200,000 34,800,000 Total Provisions 369,400,000 220,000,000 Total Profit before Taxes 1,220,161,847 983,600,731 Provision for Taxation 11.1 (640,000,000) (435,000,000) Deferred Tax Income 2.8.4 - -
(640,000,000) (435,000,000) Net Profit after tax for the period 580,161,847 548,600,731 Retained Earnings Brought Forward from Previous Year 399,841,641 277,961,056
980,003,488 826,561,787 Appropriations:
Statutory Reserve 244,032,369 196,720,146 Bonus Share Issued 364,320,000 230,000,000
608,352,369 426,720,146 Retained Earnings Carried Forward 371,651,119 399,841,641
33
Earnings Per Share (EPS) 1.71 1.61 EARNINGS PER SHARE Net Profit after Tax
Number of Ordinary Shares (weighted average as per BAS-33) Earnings Per Share (EPS)
580,161,847 548,600,731
340,032,000 340,032,000
1.71 1.61

95
5.3 Maturity Grouping of Investments in Shares and Securities
On Demand 1,548,300 1,134,100 Within One Month 990,883,754 523,803,761 One Month to three Months 150,000,000 - Three Months to One Year 420,000,000 - One Year to Five Years 2,400,000,000 2,330,000,000 More than Five Years 14,569,450 4,416,700 3,977,001,504 2,859,354,561
5.3 Maturity Grouping of Investments
Payable on Demand 5,033,538,803 3,776,850,529 Up to Three Months
17,486,812,778
13,121,003,071
Three Months to One Year 15,159,043,758 11,374,391,790 One Year to Five Years 21,686,345,284 16,272,067,796 Above Five Years 10,101,587,661 7,579,589,978
69,467,328,284 52,123,903,164
Maturity wise Grouping of Deposits Received from Banks
Repayable on Demand 550,000,000 540,000,000 Repayable within One Month 1,890,000,000 120,000,000 Repayable over One Month but within Six Months 4,650,000,000 1,380,000,000 Repayable over Six Months but within one Year 250,000,000 100,000,000 Repayable over One Year but within Five Years - - Repayable over Five Years but within Ten Years - - Unclaimed Deposits for Ten Years and above - -
7,340,000,000 2,140,000,000
B. Other than Bank Payable on Demand (Note B-1) 3,525,823,407 3,180,887,242 Other Deposits (Note B-2 ) 67,279,221,601 51,024,071,925
70,805,045,008 54,204,959,167 78,145,045,008 56,344,959,167
Other Deposits
Mudaraba Saving Deposits (91%) (Note-10.3) 4,167,740,105 3,628,864,748 Mudaraba Term Deposits 46,574,817,281 30,936,189,284 Mudaraba Short Notice Deposits 3,847,308,558 4,193,131,957 Bills Payable (Note-10.2) 889,647,881 545,866,334 Bearer Certificates of Deposits (Note-10.5) - - Mudaraba Deposit under Schemes (Note-10.6) 11,709,826,793 11,691,392,816 Foreign Currency Deposits 89,880,983 28,626,786
67,279,221,601 51,024,071,925
Capital Adequacy Ratio (Under Basel-II)
Tier-I ( Core Capital) Paid up Capital 3,400,320,000 3,036,000,000 Statutory Reserve 704,202,214 460,169,845 General Reserve 24,000,000 24,000,000 Retained Earnings 371,651,119 399,841,641
4,500,173,333 3,920,011,486 Tier –II (Supplementary Capital)
General Provision 900,376,700 662,205,999 Exchange Equalization Account - -
900,376,700 662,205,999
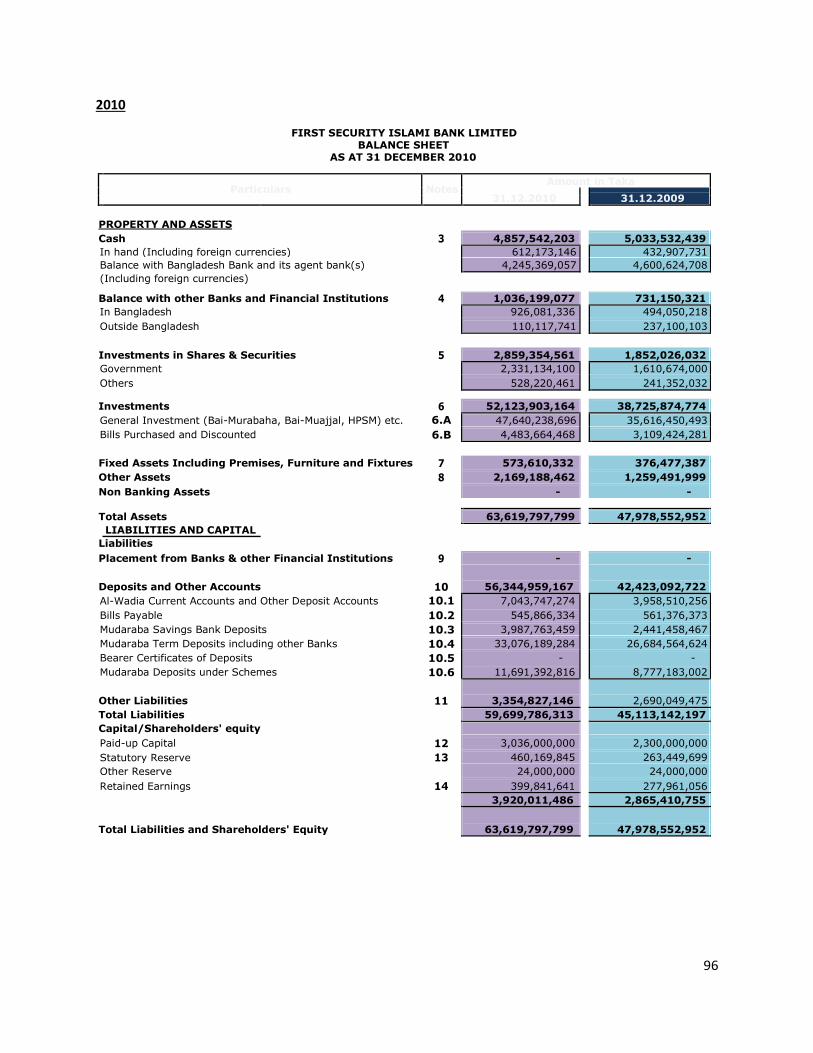
96
2010
FIRST SECURITY ISLAMI BANK LIMITED BALANCE SHEET
AS AT 31 DECEMBER 2010
Particulars Notes Amount in Taka
31.12.2010
31.12.2009
PROPERTY AND ASSETS
Cash 3 4,857,542,203 5,033,532,439
In hand (Including foreign currencies) 612,173,146 432,907,731
Balance with Bangladesh Bank and its agent bank(s) 4,245,369,057 4,600,624,708
(Including foreign currencies)
Balance with other Banks and Financial Institutions 4
1,036,199,077 731,150,321
In Bangladesh 926,081,336 494,050,218
Outside Bangladesh 110,117,741 237,100,103
5
Investments in Shares & Securities 2,859,354,561 1,852,026,032
Government 2,331,134,100 1,610,674,000
Others 528,220,461 241,352,032
6
Investments 52,123,903,164 38,725,874,774
General Investment (Bai-Murabaha, Bai-Muajjal, HPSM) etc. 6.A 47,640,238,696 35,616,450,493
Bills Purchased and Discounted 6.B 4,483,664,468 3,109,424,281
7
Fixed Assets Including Premises, Furniture and Fixtures 573,610,332 376,477,387
Other Assets 8 2,169,188,462 1,259,491,999
Non Banking Assets - -
Total Assets 63,619,797,799 47,978,552,952
LIABILITIES AND CAPITAL
Liabilities
9
Placement from Banks & other Financial Institutions - -
Deposits and Other Accounts 10 56,344,959,167 42,423,092,722
Al-Wadia Current Accounts and Other Deposit Accounts 10.1 7,043,747,274 3,958,510,256
Bills Payable 10.2 545,866,334 561,376,373
Mudaraba Savings Bank Deposits 10.3 3,987,763,459 2,441,458,467
Mudaraba Term Deposits including other Banks 10.4 33,076,189,284 26,684,564,624
Bearer Certificates of Deposits 10.5 - -
Mudaraba Deposits under Schemes 10.6 11,691,392,816 8,777,183,002
Other Liabilities 11 3,354,827,146 2,690,049,475
Total Liabilities 59,699,786,313 45,113,142,197
Capital/Shareholders' equity
Paid-up Capital 12 3,036,000,000 2,300,000,000
Statutory Reserve 13 460,169,845 263,449,699
Other Reserve 24,000,000 24,000,000
Retained Earnings 14 399,841,641 277,961,056
3,920,011,486 2,865,410,755
Total Liabilities and Shareholders' Equity 63,619,797,799 47,978,552,952

97
FIRST SECURITY ISLAMI BANK LIMITED PROFIT AND LOSS ACCOUNT
FOR THE YEAR ENDED 31 DECEMBER 2010
Particulars Notes Amount in Taka
31.12.2010 31.12.2009
Investments Income 18
5,547,047,795 4,348,674,553
Profit Paid on Deposits 19 (4,125,826,500) (3,333,800,367)
Net Investment Income 1,421,221,295 1,014,874,186
Income from Investment in shares and securities 20
264,208,027 53,510,527
Commission, Exchange and Brokerage 21 282,561,956 194,631,419
Other Operating Income 22 117,216,660 64,617,576
663,986,643 312,759,522
Total Operating Income 2,085,207,938 1,327,633,708
Less: Operating Expenses
Salary and Allowances 23 418,301,777 255,480,982
Rent, Taxes, Insurances, Electricity etc. 24 107,050,007 74,824,450
Legal Expenses 25 963,915 2,534,474
Postage, Stamps, Telecommunication etc. 26 9,127,540 7,810,243
Stationery, Printings, Advertisements etc. 27 58,551,363 43,387,247
Managing Director's Salary and Fees 28 9,916,130 8,700,000
Auditors' Fees 410,000 400,000
Directors' Fees 29 2,188,870 2,174,709
Shariah Committee's Fees 30 46,000 175,850
Depreciation and Repair of Bank's Assets 31 72,915,674 50,143,692
Zakat Expenses 4,979,720 15,117,438
Other Expenses 32 197,156,211 116,046,874
Total Operating Expenses 881,607,207 576,795,959
Profit before Provision and Tax 1,203,600,731 750,837,749
Provisions for Classified Investments 35,200,000 -
Provisions for Unclassified Investments including off-B/S items 11.2 150,000,000 100,000,000
Provisions for diminution in value of Investment in Shares 34,800,000 4,000,000
Total Provisions 220,000,000 104,000,000
Total Profit before Taxes 983,600,731 646,837,749
Provision for Taxation 11.1 (435,000,000) (320,000,000)
Deferred Tax 2.8.4 - -
(435,000,000) (320,000,000)
Net Profit after tax for the year 548,600,731 326,837,749
Retained Earnings Brought Forward from Previous Year 277,961,056 80,490,857
826,561,787 407,328,606
Appropriations:
Statutory Reserve
196,720,146 129,367,550
Bonus Share Issued 230,000,000 -
426,720,146 129,367,550
Retained Earnings Carried Forward 399,841,641 277,961,056
Earning Per Share (EPS) 33 2.33 1.42
EARNINGS PER SHARE
Net Profit after Tax 548,600,731 326,837,749 Number of Ordinary Shares (weighted average
235,888,630
230,000,000 as per BAS-33 )
Earnings Per Share (EPS) 2.33 1.42

98
674,000 240,352,032
- -
1,610,000,000 1,000,000
1,852,026,032
5.3 Maturity Grouping of Investments in Shares and Securities
6.1 Maturity Grouping of Investments
Payable on Demand 3,776,850,529 2,806,041,600 Up to Three Months 13,121,003,071 9,748,355,188 Three Months to One Year 11,374,391,790 8,450,696,233 One Year to Five Years 16,272,067,796 12,089,464,170
Above Five Years 7,579,589,978 5,631,317,583 52,123,903,164 38,725,874,774
Maturity wise Grouping of Inter Bank Deposit
Repayable on Demand 540,000,000 310,000,000 Repayable within One Month 120,000,000 250,000,000 Repayable over One Month but within Six Months 1,380,000,000 1,780,000,000
Repayable over Six Months but within one Year 100,000,000 - Repayable over One Year but within Five Years - - Repayable over Five Years but within Ten Years - -
Unclaimed Deposits for Ten Years and above - - 2,140,000,000 2,340,000,000 B. Other than Bank
Payable on Demand (Note B-1) 3,180,887,242 1,993,468,880 Other Deposits (Note B-2 ) 51,024,071,925 38,089,623,842
54,204,959,167 40,083,092,722 56,344,959,167 42,423,092,722 Other Deposits
Mudaraba Saving Deposits (91%) (Note-10.3) 3,628,864,748 2,221,727,205 Mudaraba Term Deposits 30,936,189,284 24,654,564,624 Mudaraba Short Notice Deposits 4,193,131,957 1,860,511,504 Bills Payable (Note-10.2) 545,866,334 561,376,373 Bearer Certificates of Deposits (Note-10.5) - - Mudaraba Deposit under Schemes (Note-10.6) 11,691,392,816 8,777,183,003
Foreign Currency Deposits 28,626,786 14,261,133
Total 51,024,071,925 38,089,623,842
On Demand 1,134,100
Within One Month 523,803,761
One Month to three Months -
Three Months to One Year -
One Year to Five Years 2,330,000,000
More than Five Years 4,416,700
2,859,354,561
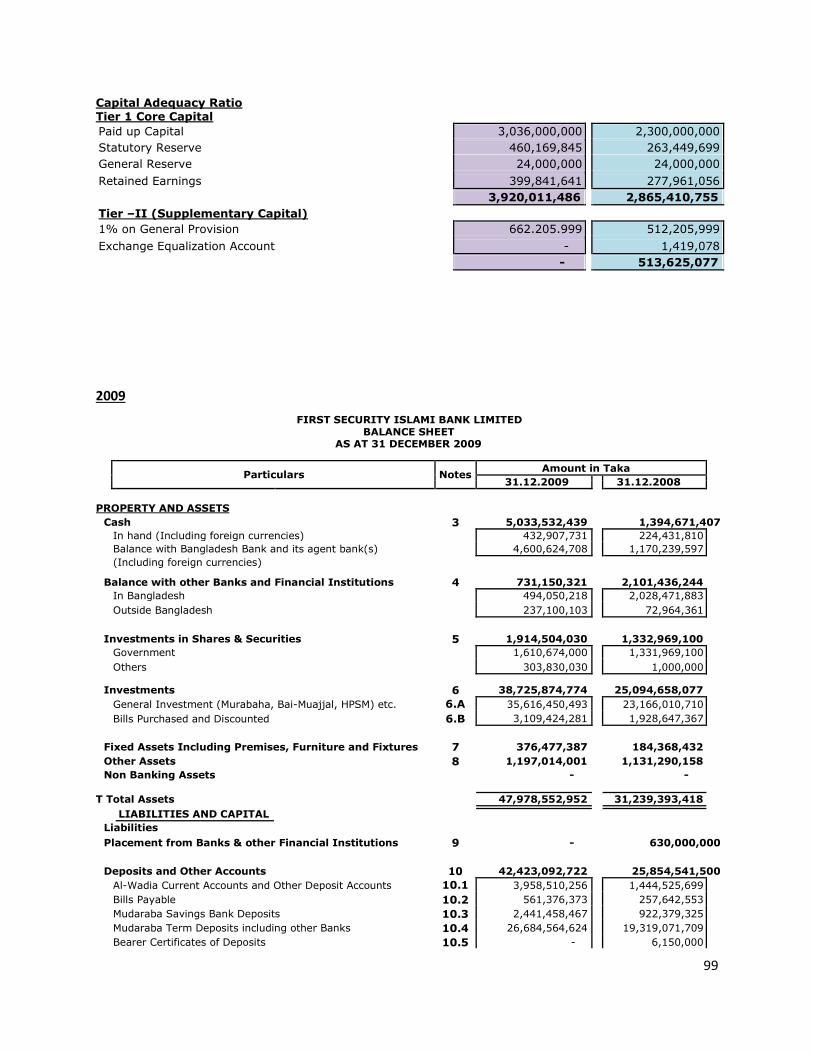
99
Capital Adequacy Ratio Tier 1 Core Capital
Paid up Capital 3,036,000,000 2,300,000,000 Statutory Reserve 460,169,845 263,449,699 General Reserve 24,000,000 24,000,000 Retained Earnings 399,841,641 277,961,056 3,920,011,486 2,865,410,755 Tier –II (Supplementary Capital)
1% on General Provision 662.205.999 512,205,999 Exchange Equalization Account - 1,419,078 - 513,625,077
2009
FIRST SECURITY ISLAMI BANK LIMITED BALANCE SHEET
AS AT 31 DECEMBER 2009
Particulars Notes Amount in Taka
31.12.2009
31.12.2008
PROPERTY AND ASSETS
Cash 3 5,033,532,439 1,394,671,407
In hand (Including foreign currencies) 432,907,731 224,431,810
Balance with Bangladesh Bank and its agent bank(s) 4,600,624,708 1,170,239,597
(Including foreign currencies)
Balance with other Banks and Financial Institutions 4 731,150,321 2,101,436,244
In Bangladesh 494,050,218 2,028,471,883
Outside Bangladesh 237,100,103 72,964,361
Investments in Shares & Securities 5 1,914,504,030 1,332,969,100
Government 1,610,674,000 1,331,969,100
Others 303,830,030 1,000,000
Investments 6 38,725,874,774 25,094,658,077
General Investment (Murabaha, Bai-Muajjal, HPSM) etc. 6.A 35,616,450,493 23,166,010,710
Bills Purchased and Discounted 6.B 3,109,424,281 1,928,647,367
Fixed Assets Including Premises, Furniture and Fixtures 7 376,477,387 184,368,432
Other Assets 8 1,197,014,001 1,131,290,158
Non Banking Assets - -
T Total Assets 47,978,552,952 31,239,393,418
LIABILITIES AND CAPITAL
Liabilities
Placement from Banks & other Financial Institutions 9 - 630,000,000
Deposits and Other Accounts 10 42,423,092,722 25,854,541,500
Al-Wadia Current Accounts and Other Deposit Accounts 10.1 3,958,510,256 1,444,525,699
Bills Payable 10.2 561,376,373 257,642,553
Mudaraba Savings Bank Deposits 10.3 2,441,458,467 922,379,325
Mudaraba Term Deposits including other Banks 10.4 26,684,564,624 19,319,071,709
Bearer Certificates of Deposits 10.5 - 6,150,000
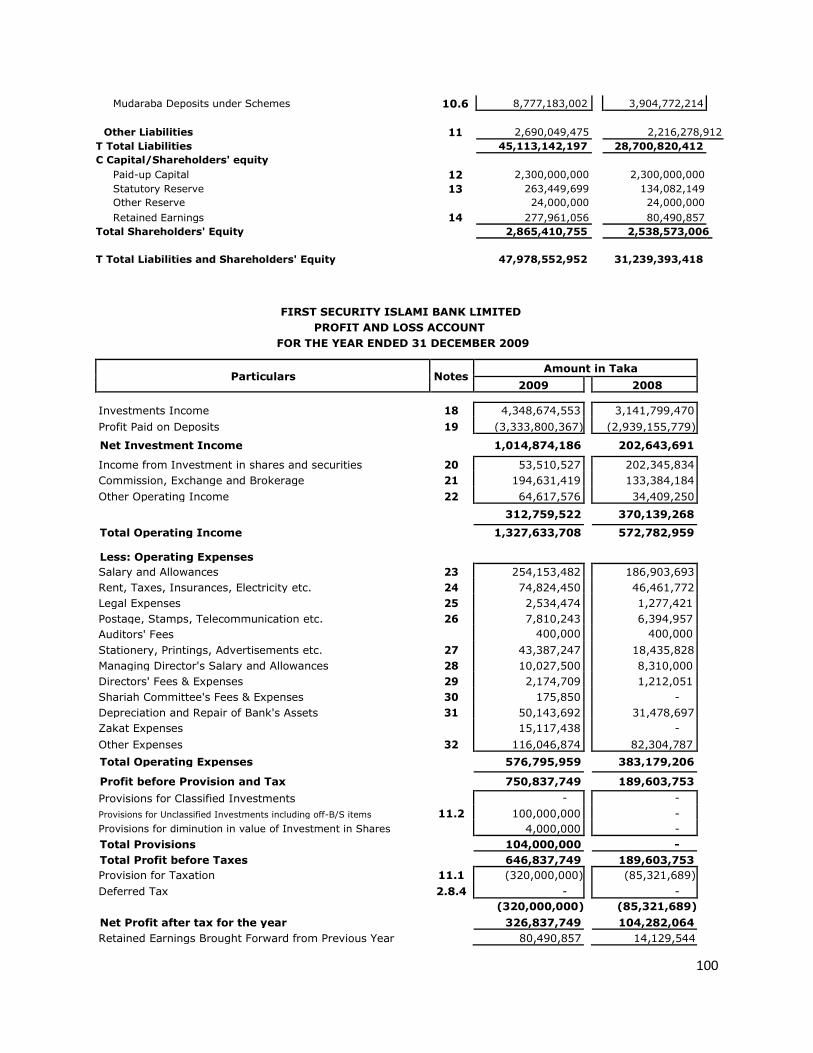
100
Mudaraba Deposits under Schemes 10.6 8,777,183,002 3,904,772,214
Other Liabilities 11 2,690,049,475 2,216,278,912
T Total Liabilities 45,113,142,197 28,700,820,412
C Capital/Shareholders' equity
Paid-up Capital 12 2,300,000,000 2,300,000,000
Statutory Reserve 13 263,449,699 134,082,149
Other Reserve 24,000,000 24,000,000
Retained Earnings 14 277,961,056 80,490,857
Total Shareholders' Equity 2,865,410,755 2,538,573,006
T Total Liabilities and Shareholders' Equity 47,978,552,952 31,239,393,418
FIRST SECURITY ISLAMI BANK LIMITED
PROFIT AND LOSS ACCOUNT FOR THE YEAR ENDED 31 DECEMBER 2009
Particulars Notes Amount in Taka
2009
2008
Investments Income 18
4,348,674,553 3,141,799,470
Profit Paid on Deposits 19 (3,333,800,367) (2,939,155,779)
Net Investment Income 1,014,874,186 202,643,691
Income from Investment in shares and securities 20
53,510,527 202,345,834
Commission, Exchange and Brokerage 21 194,631,419 133,384,184
Other Operating Income 22 64,617,576 34,409,250
312,759,522 370,139,268
Total Operating Income
1,327,633,708 572,782,959
Less: Operating Expenses
Salary and Allowances 23 254,153,482 186,903,693
Rent, Taxes, Insurances, Electricity etc. 24 74,824,450 46,461,772
Legal Expenses 25 2,534,474 1,277,421
Postage, Stamps, Telecommunication etc. 26 7,810,243 6,394,957
Auditors' Fees 400,000 400,000
Stationery, Printings, Advertisements etc. 27 43,387,247 18,435,828
Managing Director's Salary and Allowances 28 10,027,500 8,310,000
Directors' Fees & Expenses 29 2,174,709 1,212,051
Shariah Committee's Fees & Expenses 30 175,850 -
Depreciation and Repair of Bank's Assets 31 50,143,692 31,478,697
Zakat Expenses 15,117,438 -
Other Expenses 32 116,046,874 82,304,787
Total Operating Expenses 576,795,959 383,179,206
Profit before Provision and Tax
750,837,749 189,603,753
Provisions for Classified Investments
- -
Provisions for Unclassified Investments including off-B/S items 11.2 100,000,000 -
Provisions for diminution in value of Investment in Shares 4,000,000 -
Total Provisions 104,000,000 -
Total Profit before Taxes 646,837,749 189,603,753
Provision for Taxation 11.1 (320,000,000) (85,321,689)
Deferred Tax 2.8.4 - -
(320,000,000) (85,321,689)
Net Profit after tax for the year 326,837,749 104,282,064
Retained Earnings Brought Forward from Previous Year 80,490,857 14,129,544

101
407,328,606 118,411,608
Appropriations:
Statutory Reserve
129,367,550 37,920,751
Other Reserve - -
129,367,550 37,920,751
Retained Earnings Carried Forward 277,961,056 80,490,857
Earning Per Share (EPS) 33
14.21 7.35
EARNINGS PER SHARE
Net Profit after Tax 326,837,749 104,264,600 Number of Ordinary Shares (weighted average
23,000,000 14,187,500 as per BAS-33 )
Earnings Per Share (EPS) 14.21 7.35
5.2 Maturity Grouping of Investments in Shares and Securities
On Demand 674,000 1,467,500
Within One Month 240,352,032 -
One Month to three Months - 735,501,600
Three Months to One Year - -
One Year to Five Years 1,610,000,000 595,000,000
More than Five Years 63,477,998 1,000,000
1,914,504,030 1,332,969,100
6.1 Maturity Grouping of Investments
Payable on Demand 2,806,041,600 1,818,336,059 Up to Three Months 9,748,355,188 6,317,007,471 Three Months to One Year 8,450,696,233 5,476,114,709
One Year to Five Years 12,089,464,170 7,834,063,697 Above Five Years 5,631,317,583 3,649,136,141
38,725,874,774 25,094,658,077
Maturity wise Grouping of Inter Bank Deposit
Repayable on Demand 310,000,000 - Repayable within One Month 250,000,000 250,000,000 Repayable over One Month but within Six Months 1,780,000,000 690,000,000 Repayable over Six Months but within one Year - - Repayable over One Year but within Five Years - - Repayable over Five Years but within Ten Years - - Unclaimed Deposits for Ten Years and above - -
2,340,000,000 940,000,000

102
Other than Bank
Payable on Demand (Note B-1) 1,993,468,880 1,153,779,011 Other Deposits (Note B-2 ) 38,089,623,842 23,760,762,489
40,083,092,722 24,914,541,500
42,423,092,722 25,854,541,500 B- 2 Other Deposits
Mudaraba Saving Deposits (91%) (Note-10.3) 2,221,727,205 830,141,393 Mudaraba Term Deposits 24,654,564,624 18,379,071,709 Mudaraba Short Notice Deposits 1,860,511,504 362,627,725 Bills Payable (Note-10.2) 561,376,373 257,642,553 Bearer Certificates of Deposits (Note-10.5) - 6,150,000 Mudaraba Deposit under Schemes (Note-10.6) 8,777,183,003 3,904,772,214 Foreign Currency Deposits 14,261,133 20,356,895
Total 38,089,623,842 23,760,762,489 Capital Adequacy Ratio
Tier-I ( Core Capital)
Paid up Capital 2,300,000,000 2,300,000,000
Statutory Reserve 263,449,699 134,082,149
General Reserve 24,000,000 24,000,000
Retained Earnings 277,961,056 80,490,857
2,865,410,755 2,538,573,006
Tier –II (Supplementary Capital)
1% on General Provision
512,205,999 322,205,999
Exchange Equalization Account 1,419,078 1,419,078
513,625,077 323,625,077 2008
FIRST SECURITY BANK LIMITED BALANCE SHEET
AS AT 31ST DECEMBER 2008
Particulars Notes Amount in Taka
2008
2007
PROPERTY AND ASSETS
Cash 3 1,394,671,407 1,186,903,866
In hand (Including foreign currencies) 224,431,810 192,238,601
Balance with Bangladesh Bank and its agent bank(s) 1,170,239,597 994,665,265
(Including foreign currencies)
4 2,101,436,244 2,679,521,916
Balance with other Banks and Financial Institutions
In Bangladesh 2,028,471,883 2,020,476,468
Outside Bangladesh 72,964,361 659,045,448
Money at Call and Short Notice 5 - 225,000,000
Investments 6 1,332,969,100 2,498,328,500
Government 1,331,969,100 2,497,328,500
Others 1,000,000 1,000,000

103
Loans and Advances 7 25,094,658,077 18,616,225,315
Loans, Cash Credit, Overdraft etc. 7.A 23,166,010,710 14,089,262,662
Bills Purchased and Discounted 7.B 1,928,647,367 4,526,962,653
Fixed Assets including Premises, Furniture and Fixtures 8 184,368,432 135,223,386
Other Assets 9 1,131,290,158 1,600,577,888
Non Banking assets - -
Total assets 31,239,393,418 26,941,780,871
LIABILITIES AND CAPITAL
Liabilities
Borrowings from other Banks, Financial Institutions- 10 630,000,000 -
and Agents
Deposits and Other Accounts 11 25,854,541,500 23,504,045,031
Current Accounts and Other Accounts 11.1 1,444,525,699 2,681,774,856
Bills Payable 11.2 257,642,553 303,457,536
Savings Bank Deposits 11.3 922,379,325 633,755,819
Fixed Deposits including deposit from other Banks 11.4 19,319,071,709 16,679,719,397
Bearer Certificates of deposits 11.5 6,150,000 6,150,000
Deposits under schemes 11.6 3,904,772,214 3,199,187,423
Other Liabilities 12 2,216,278,912 2,303,444,898
Total Liabilities 28,700,820,412 25,807,489,929
Capital/Shareholders' Equity
Paid-up Capital 13 2,300,000,000 1,000,000,000
Statutory Reserve 14 134,082,149 96,161,398
Other Reserve 24,000,000 24,000,000
Surplus in Profit & Loss Account 15 80,490,857 14,129,544
Total Shareholders' Equity 2,538,573,006 1,134,290,942
Total Liabilities and Shareholders' equity 31,239,393,418 26,941,780,871
FIRST SECURITY BANK LIMITED PROFIT AND LOSS ACCOUNT
FOR THE YEAR ENDED 31 DECEMBER 2008
Notes Amount in Taka
2008
2007
Interest Income
3,141,799,470 2,180,308,712
Interest Paid on Deposits and Borrowings etc. (2,939,155,779) (2,130,328,088)
Net Interest income 202,643,691 49,980,624
Investment income
202,345,834 177,752,561
Commission, Exchange and Brokerage 133,384,184 161,010,079
Other operating income 34,409,250 25,788,223
370,139,268 364,550,863
Total operating income
572,782,959 414,531,487
Less: Operating expenses
Salary and allowances 186,903,693 142,977,355
Rent, Taxes, Insurances, Electricity etc. 46,461,772 46,054,606

104
Legal expenses 1,277,421 413,341
Postage, Stamps, Telecommunication etc. 6,394,957 6,827,341
Auditors' fees 400,000 300,000
Stationery, Printings, Advertisements etc. 18,435,828 13,490,480
Managing Director's Salary and allowances 8,310,000 6,880,000
Directors' fees 1,212,051 1,019,009
Depreciation and repair of Bank's Assets 31,478,697 23,202,157
Other expenses 82,304,787 44,836,470
Total operating expenses 383,179,206 286,000,759
Profit before Provision and Taxes
189,603,753 128,530,728
Provision for Classified Loans and Advances
- -
Provisions for Unclassified Loans and Advances & Off B/S - 70,000,000
Total Provisions - 70,000,000
Total Profit before taxes
189,603,753 58,530,728
Provision for taxation
(85,321,689) (57,900,000)
Deferred tax income - 30,000,000
(85,321,689) (27,900,000)
Net Profit after Tax for the year 104,282,064 30,630,728
Retained surplus brought forward from Previous year 14,129,544 (4,795,038)
118,411,608 25,835,690
Appropriations
Statutory Reserve
37,920,751 11,706,146
Other Reserve - -
37,920,751 11,706,146
Retained Earnings carried forward 80,490,857 14,129,544
Earnings Per Share (EPS)
7.35 3.20
EARNINGS PER SHARE Net Profit after tax 104,282,064 30,630,728 Number of Ordinary Shares 14,187,500 9,583,333 Earnings Per Share (EPS) 7.35 3.20
6.1 Maturity Grouping of Investments
On Demand 1,467,500 1,328,500 Within One Month - 100,000,000 One Month to Three Months 735,501,600 70,000,000 Three Months to One Year - 480,000,000 One Year to Five Years 595,000,000 1,846,000,000 More than Five Years 1,000,000 1,000,000
1,332,969,100 2,498,328,500
Maturity wise grouping of inter Bank deposit
Repayable on Demand - - Repayable within One Month 250,000,000 410,000,000 Repayable over One Month but within Six Months 690,000,000 1,230,000,000 Repayable over Six Months but within One Year - 60,000,000 Repayable over One Year but within Five Years - - Repayable over Five Years but within Ten Years - -

105
Unclaimed deposits for Ten Years and above - - 940,000,000 1,700,000,000
Other than Bank
Payable on Demand (Note B-1) 1,153,779,011 1,107,950,283
Other deposits (Note B-2 ) 23,760,762,489 20,696,094,748
24,914,541,500 21,804,045,031
B-2 Other Deposits
Saving Deposits (91%) (Note-11.3) 830,141,393 576,717,795 Fixed Deposits 18,379,071,709 14,979,719,397 Short Term Deposits 362,627,725 1,602,756,063 Bills Payable (Note-11.2) 257,642,553 303,457,536 Bearer Certificates of Deposits (Note-11.5) 6,150,000 6,150,000 Deposits under Schemes (Note-11.6) 3,904,772,214 3,199,187,423 Foreign Currency Deposits 20,356,895 28,106,534
23,760,762,489 20,696,094,748
13.4 Capital Adequacy Ratio 2008 2007
Tier – I (Core Capital)
Paid up Capital
2,300,000,000 1,000,000,000 Statutory Reserve 134,082,149 96,161,398 General Reserve 24,000,000 24,000,000 Retained Earnings 80,490,857 14,129,544
2,538,573,006 1,134,290,942 Tier –II (Supplementary Capital)
1% General Provision 322,205,999 212,205,999 Exchange Equalization Account 1,419,078 1,419,078
323,625,077 213,625,077