Ratio Analysis Of Banking Reports(HBL,UBL,MCB etc)
42
CORPORATE FINANCE ASSIGNMENT ON ANALYSIS OF FINANCIAL STATEMENTS SUBMITTED TO: SIR ATIF IQBAL SUBMITTED BY: FAHAD AHMED KHAN HASSAN ALI KHAN UNIVERSITY OF KARACHI
-
Upload
fahad-khan -
Category
Documents
-
view
275 -
download
2
Transcript of Ratio Analysis Of Banking Reports(HBL,UBL,MCB etc)
CORPORATE FINANCE
ASSIGNMENT
ON
ANALYSIS OF FINANCIAL STATEMENTS
SUBMITTED TO:
SIR ATIF IQBAL
SUBMITTED BY:
FAHAD AHMED KHAN
HASSAN ALI KHAN
UNIVERSITY OF KARACHI
ANALYSIS OF FINANCIAL STATEMENTS
Financial statement analysis is defined as the process of identifying financial strengths and
weaknesses of the firm by properly establishing relationship between the items of the balance
sheet and the profit and loss account.
OR
Financial Statement Analysis is the process of understanding the risk and profitability of the firm
through analysis of reported financial information, by using different accounting tools and
techniques.
Financial Statements are prepared to meet external reporting obligations and also for decision
making purposes. They play a dominant role in setting the framework of managerial decisions.
But the information provided in Financial Statements is not an end in itself as no meaningful
conclusion can be drawn from these statements alone. However, the information provided in the
financial statements is of immense use in making decisions through analysis and interpretation of
financial statements.
TOOLS OF FINANCIAL STATEMENT ANALYSIS:
Following are the most important tools of financial statement analysis.
1) Horizontal and vertical analysis.
2) Ratio analysis.
1) Horizontal and Vertical Analysis:
Horizontal Analysis or Trend Analysis:
Comparison of two or more year's financial data is known as horizontal analysis, or trend
analysis. Horizontal analysis is facilitated by showing changes between years in both Rupees and
%age form.
Trend Percentage:
Horizontal analysis of financial statements can also be carried out by computing trend
percentages. Trend percentage states several years' financial data in terms of a base year.The
base year equals 100%, with all other years stated in some percentage of this base.
Vertical Analysis:
Vertical Analysis is the procedure of preparing and presenting common size statements.
Common size statement is one that shows the items appearing on it in percentage form as well as
in Rupees form. Each item is stated as a percentage of some total of which that item is a part.
Key financial changes and trends can be highlighted by use of common size statements.
2) Ratios Analysis:
The ratio analysis is the most important tool of financial statement analysis. Ratios simply means
one number expressed in term of another. A ratio is statistical yardstick by means of which
relationships between two or various figures can be compared or measured. Ratios show how
one number is related to another.
Advantages of Ratios Analysis:
1) Simplifies financial statements.
2) Facilitates inter- firm comparison.
3) Helps in planning.
4) Makes inter- firm comparison possible.
5) Help in investment decisions.
There are various ratios which can analyze any particular financial statement of any firm, some
important ratios are given below.
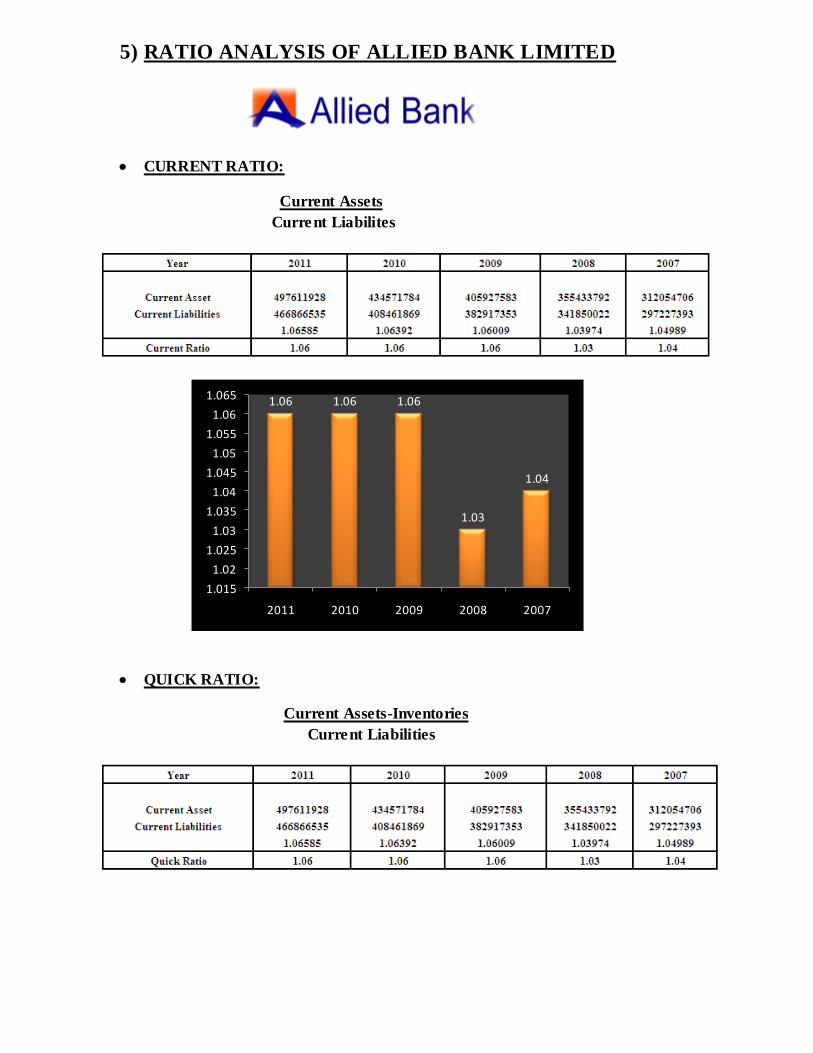
CURRENT RATIO:
Current ratio may be defined as the relationship between current assets and current liabilities.
This ratio is also known as "working capital ratio". It is a measure of general liquidity and is
most widely used to make the analysis for short term financial position or liquidity of a firm.It is
calculated by dividing the total of the current assets by total of the current liabilities.
Current Assets
Current Liabilites
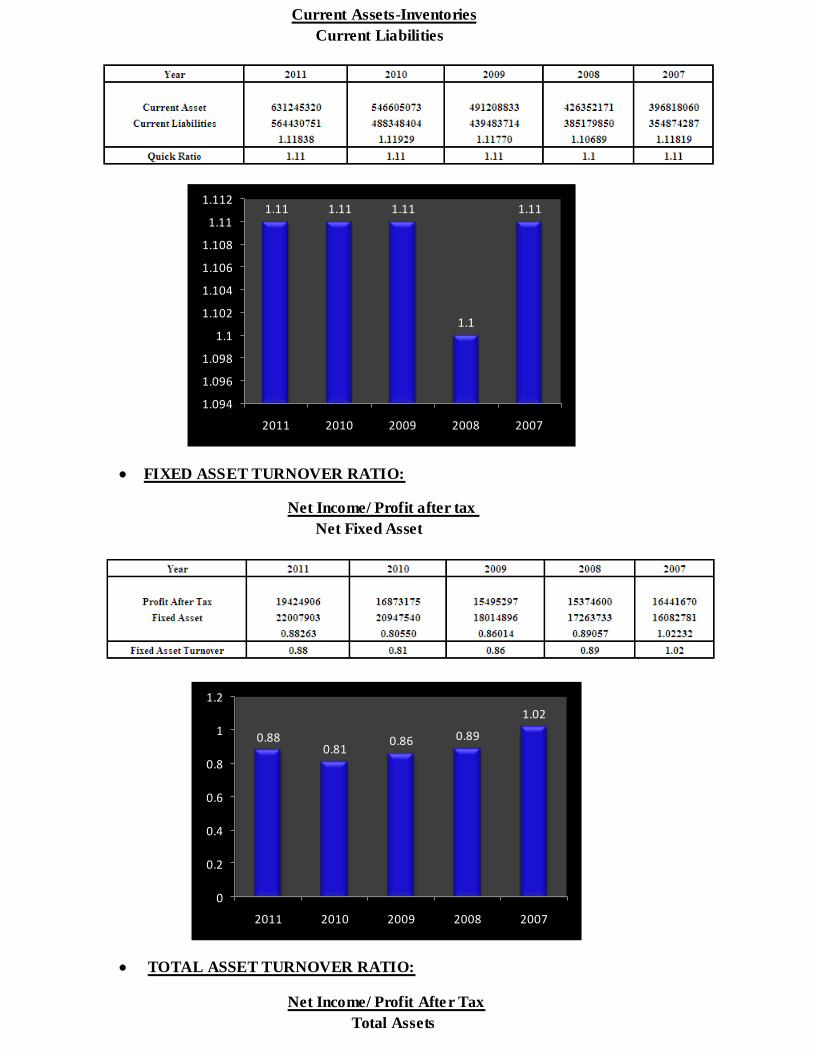
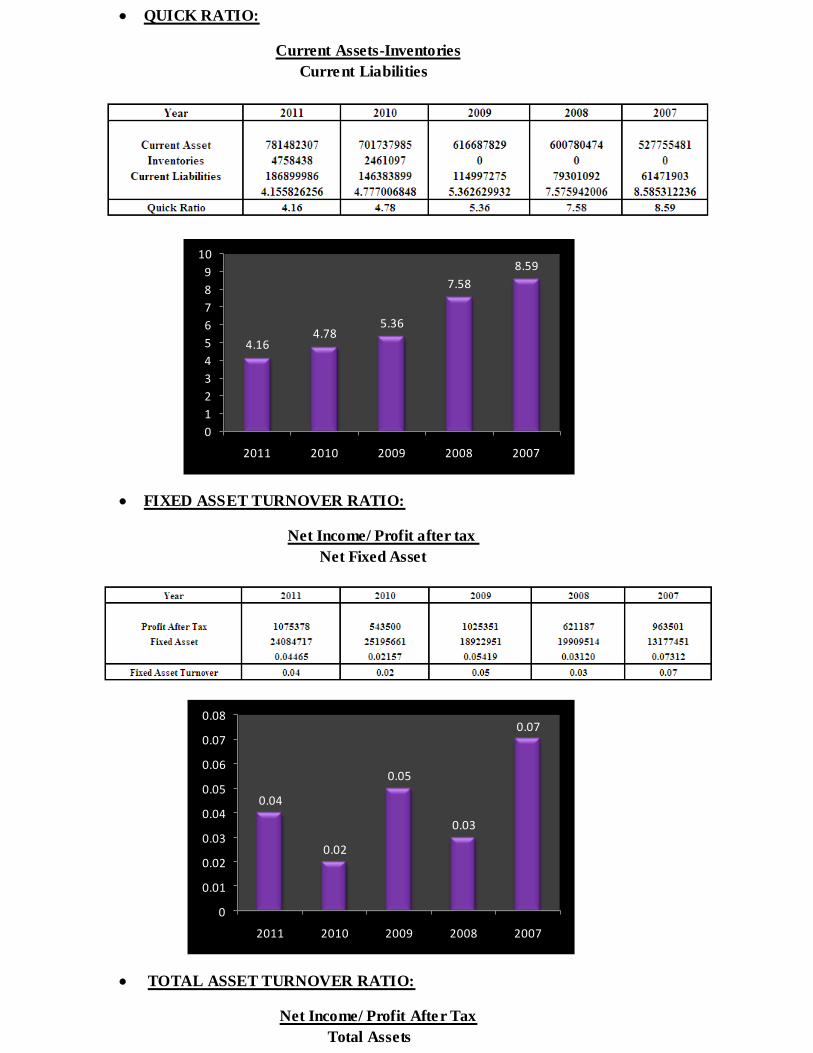
QUICK RATIO:
Liquid ratio is also termed as "Liquidity Ratio", "Acid Test Ratio" or "Quick Ratio".It is the
ratio of liquid assets to current liabilities. The true liquidity refers to the ability of a firm to pay
its short term obligations as and when they become due.
Current Assets-Inventories
Current Liabilities
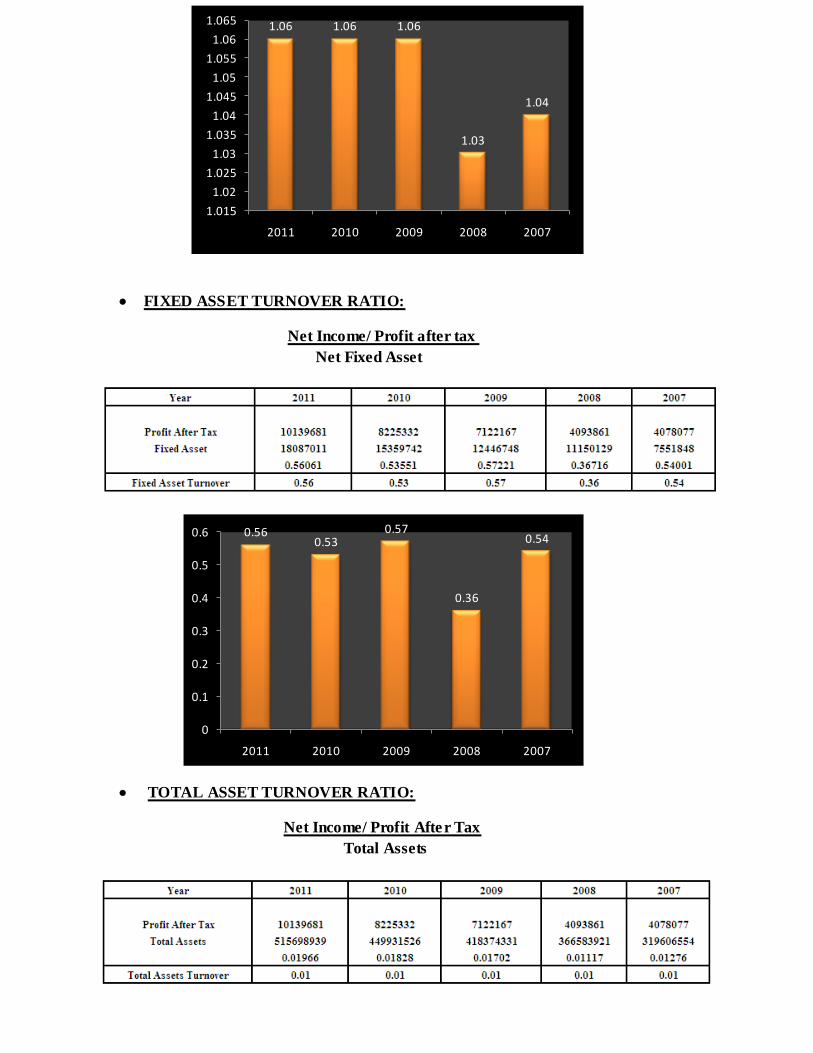
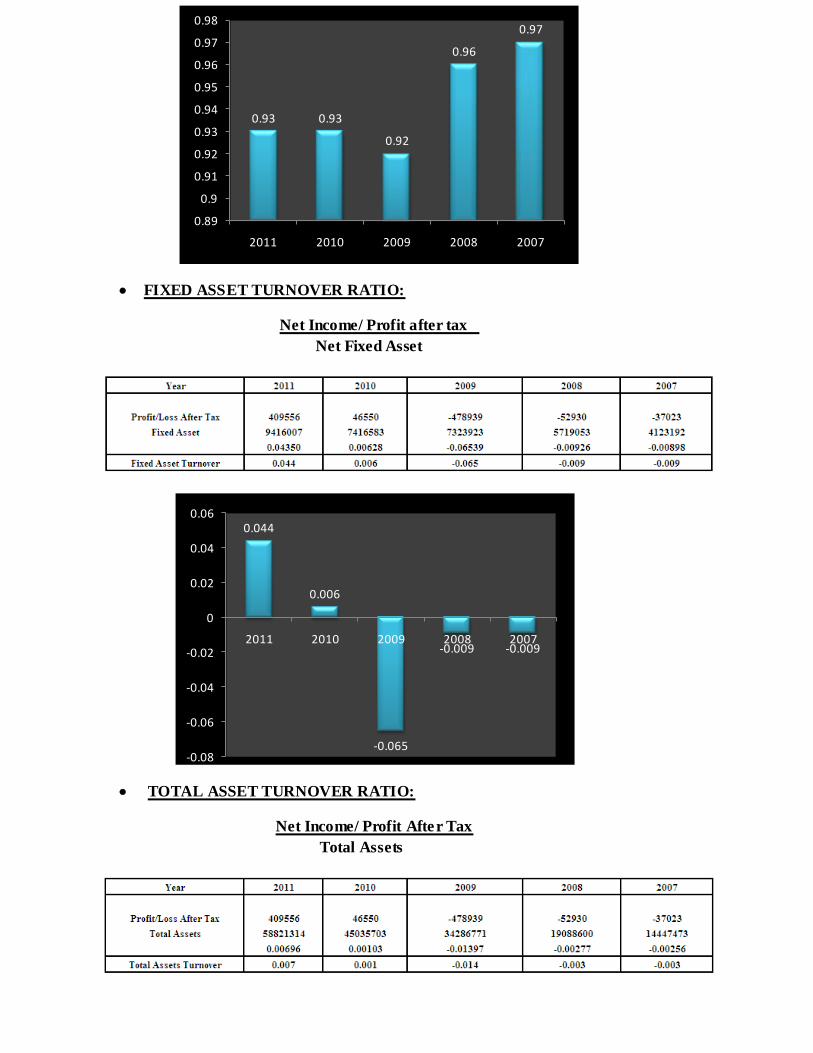
FIXED ASSET TURNOVER RATIO:
This ratio measures the efficiency and profit earning capacity of the concern.Higher the ratio,
greater is the intensive utilization of fixed assets.Lower ratio means under-utilization of fixed
assets. The ratio is calculated by using following formula:
Net Income/ Profit after tax
Net Fixed Asset
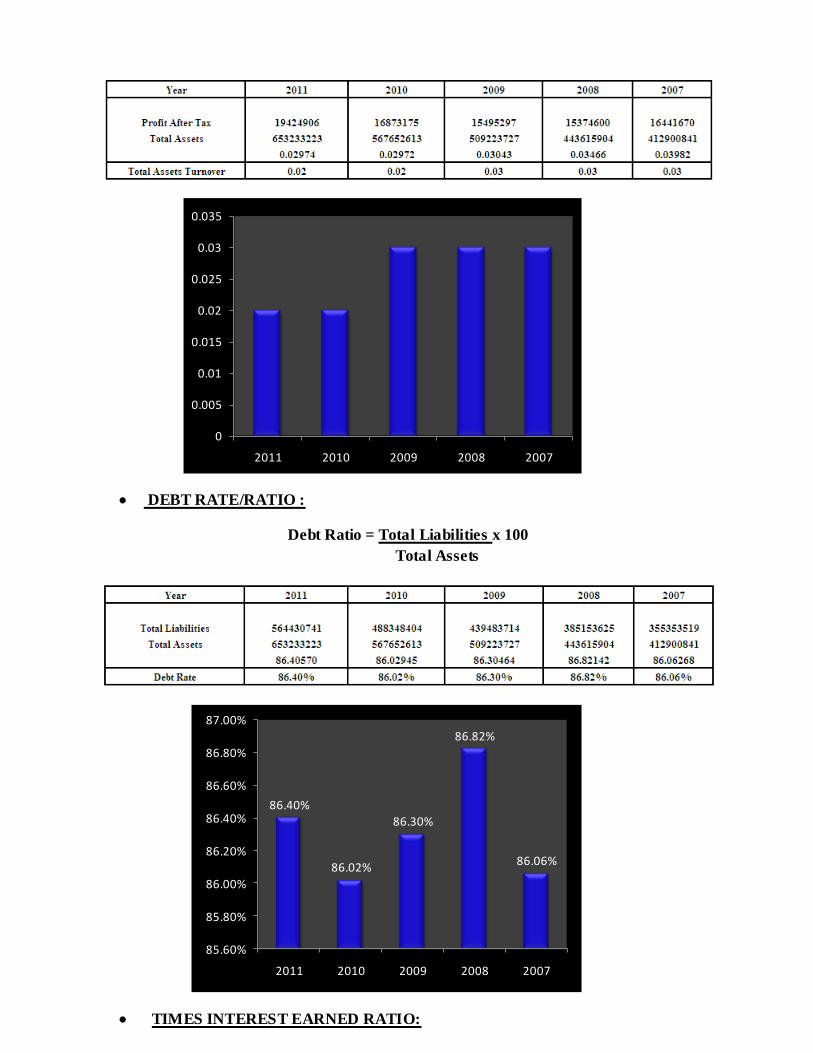
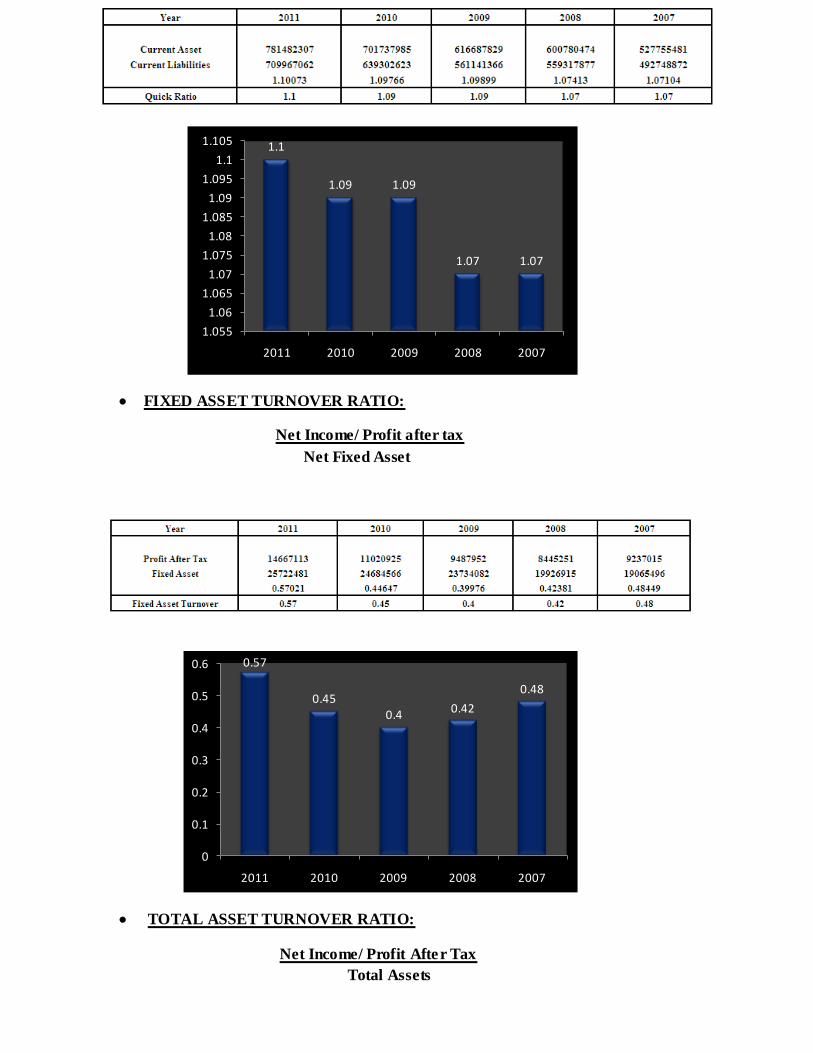
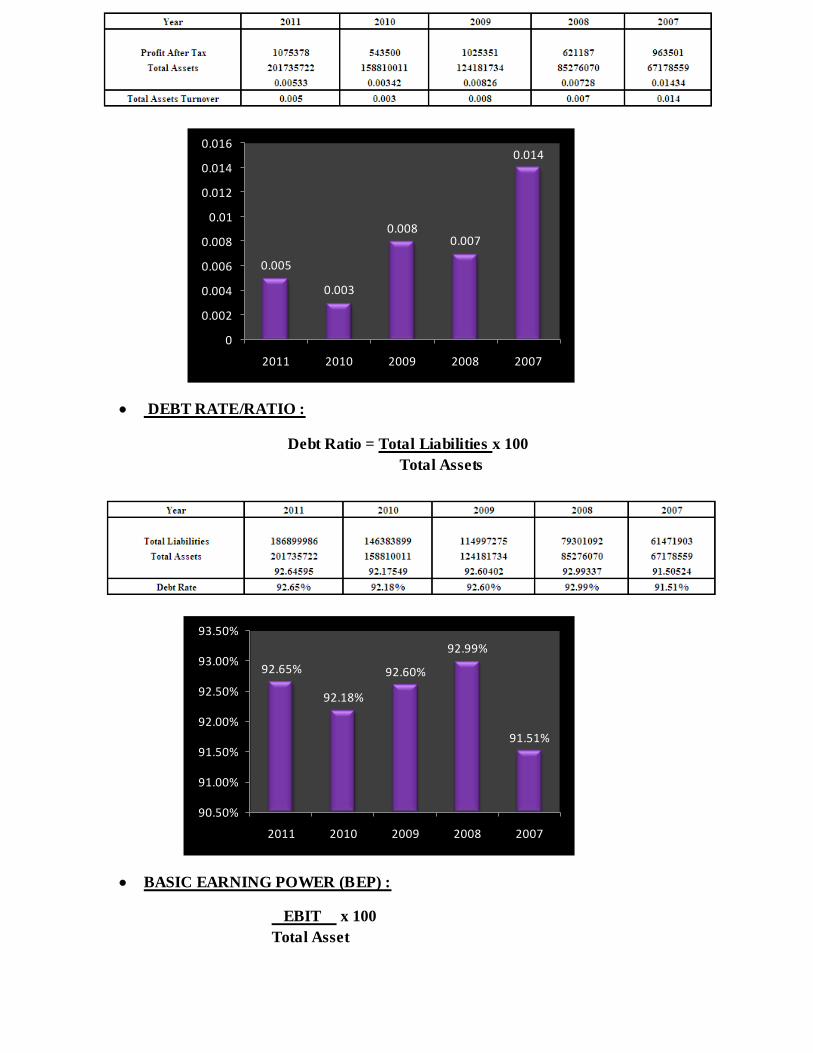
TOTAL ASSET TURNOVER RATIO:
The final asset management ratio, the total assets turnover ratio, measures the turnover of all the
firms assets. It measures the ability of a company to use its assets efficiently.This ratio considers
all assets, current and fixed.
Net Income/ Profit After Tax
Total Assets
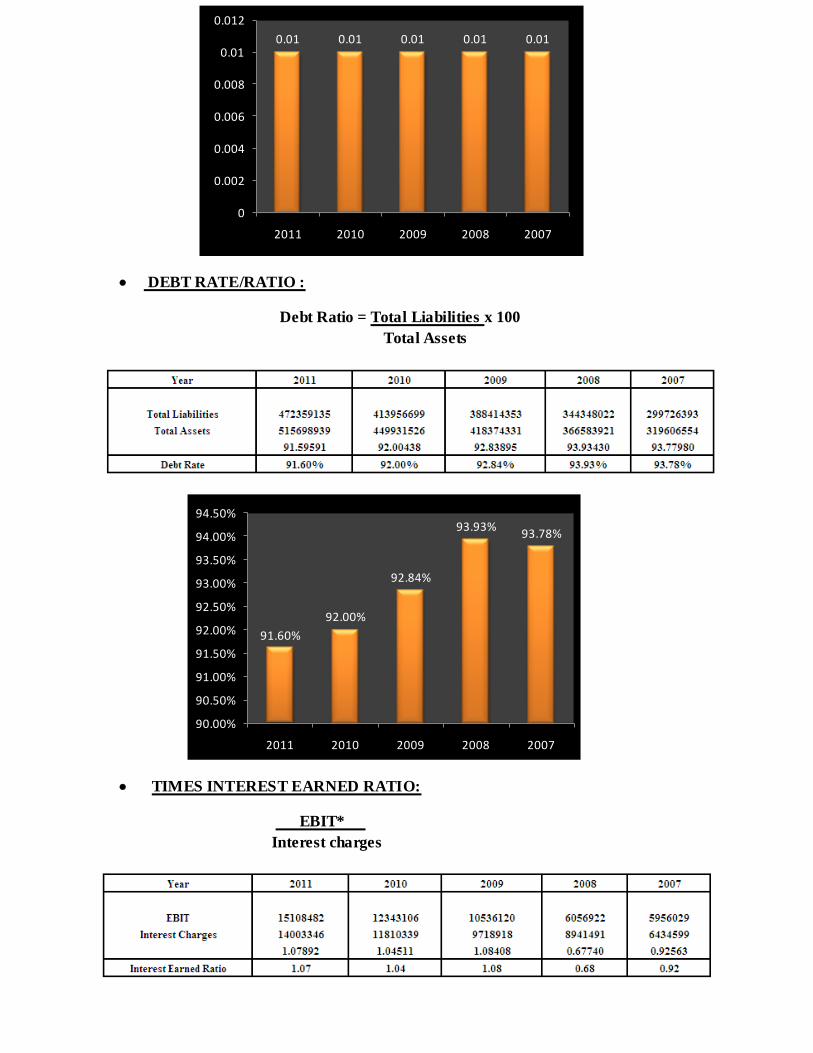
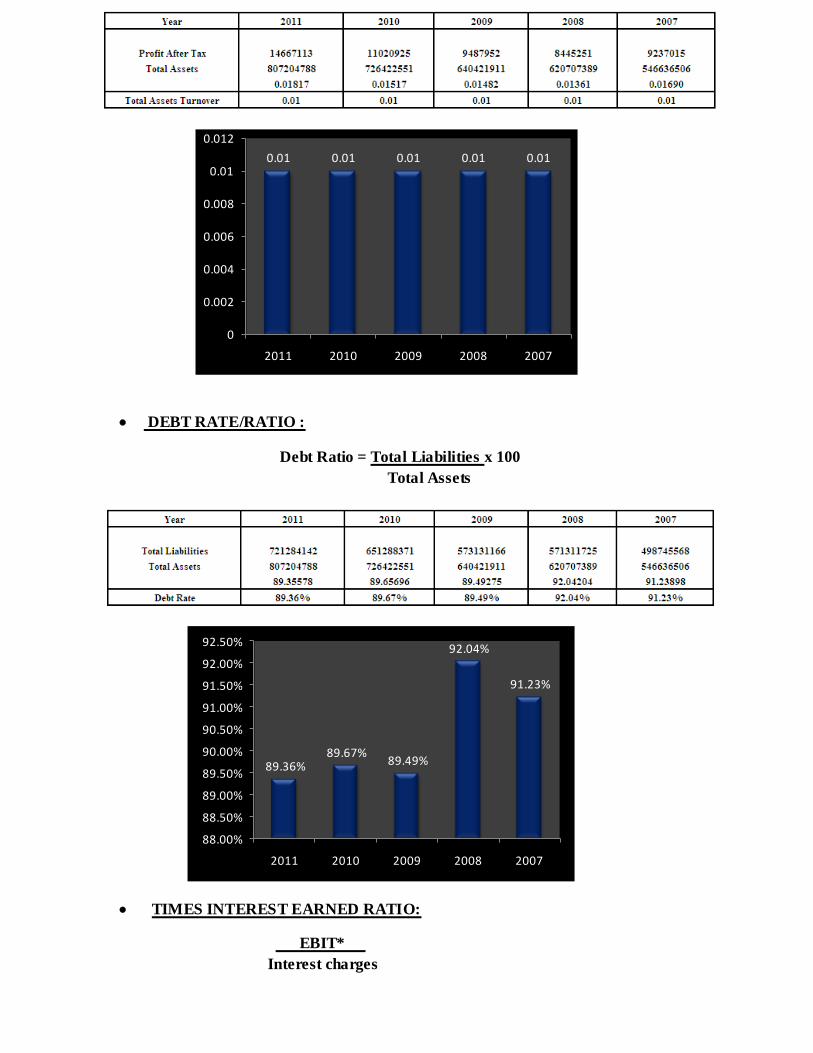
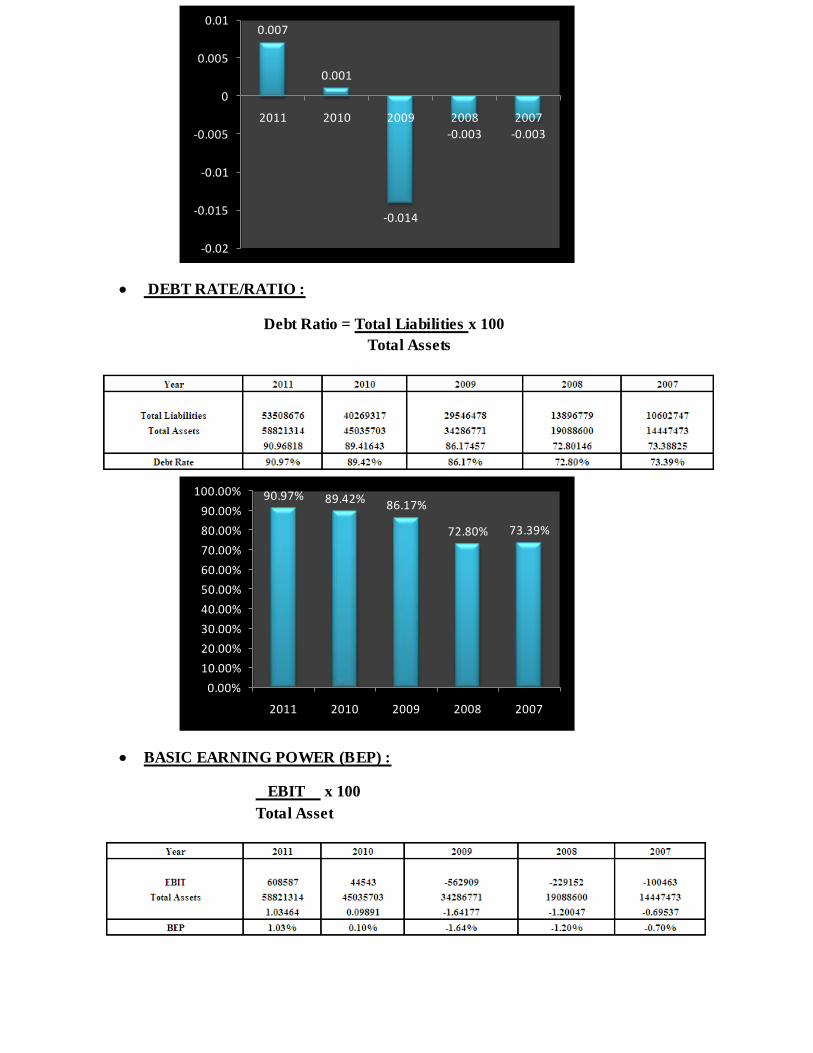
DEBT RATE/RATIO :
A ratio that indicates what proportion of debt a company has has relative to assets. The measures
gives an idea to the leverage of the company along with the potential risk the company faces in
terms of its debt load.A debt ratio of greater than 1 indicates that a company has more debt than
assets, meanwhile, a debt ratio of less than 1 indicates that a company has more assets than debt.
Used in conjunction with other measures of financial health, the debt ratio can help investors
determine a company's level of risk.
Debt Ratio = Total Liabilities x 100
Total Assets
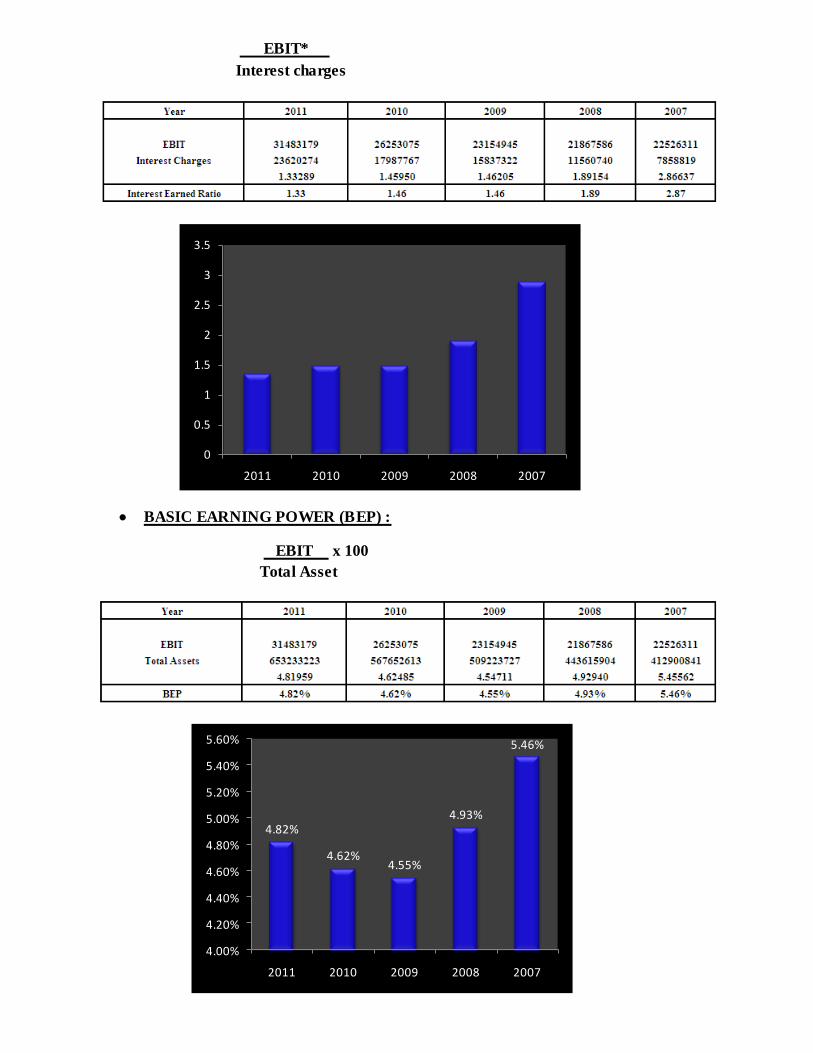
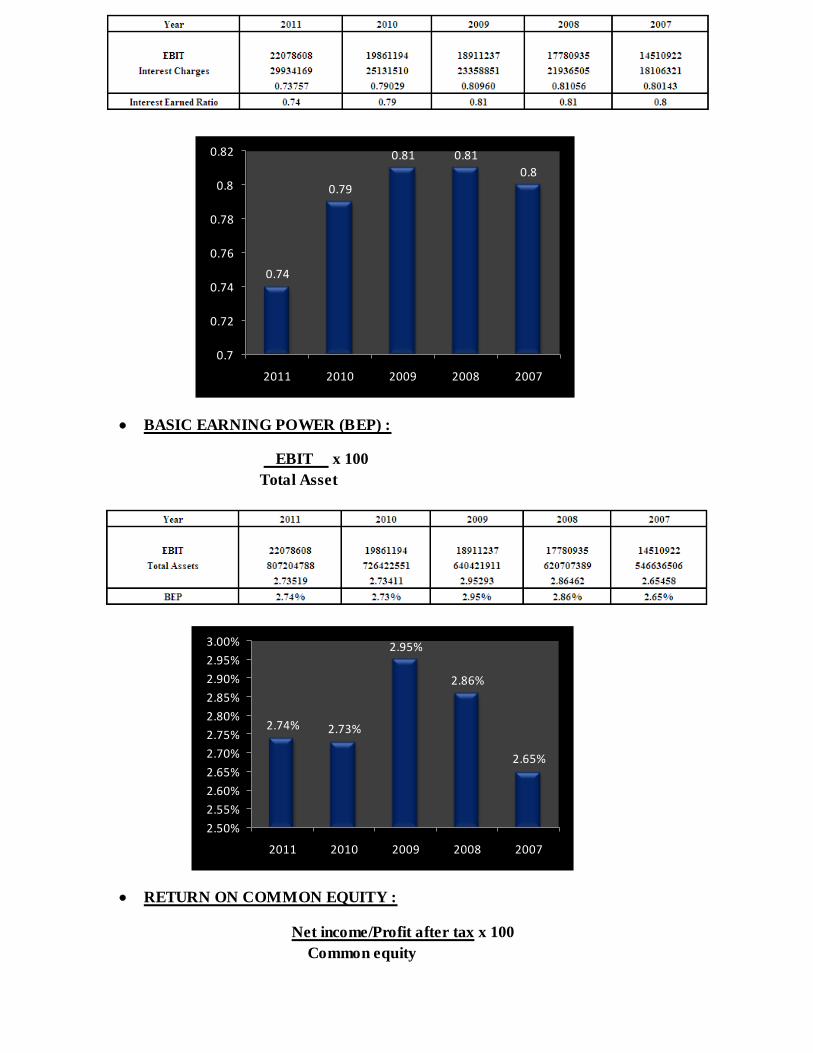
TIMES INTEREST EARNED RATIO:
Times interest earned (also called interest coverage ratio) is the ratio of earnings before
interest and tax (EBIT) of a business to its interest expense during a given period. It is a
solvency ratio measuring the ability of a business to pay off its debts.
EBIT*
Interest charges
*EBIT= Earning before interest and tax
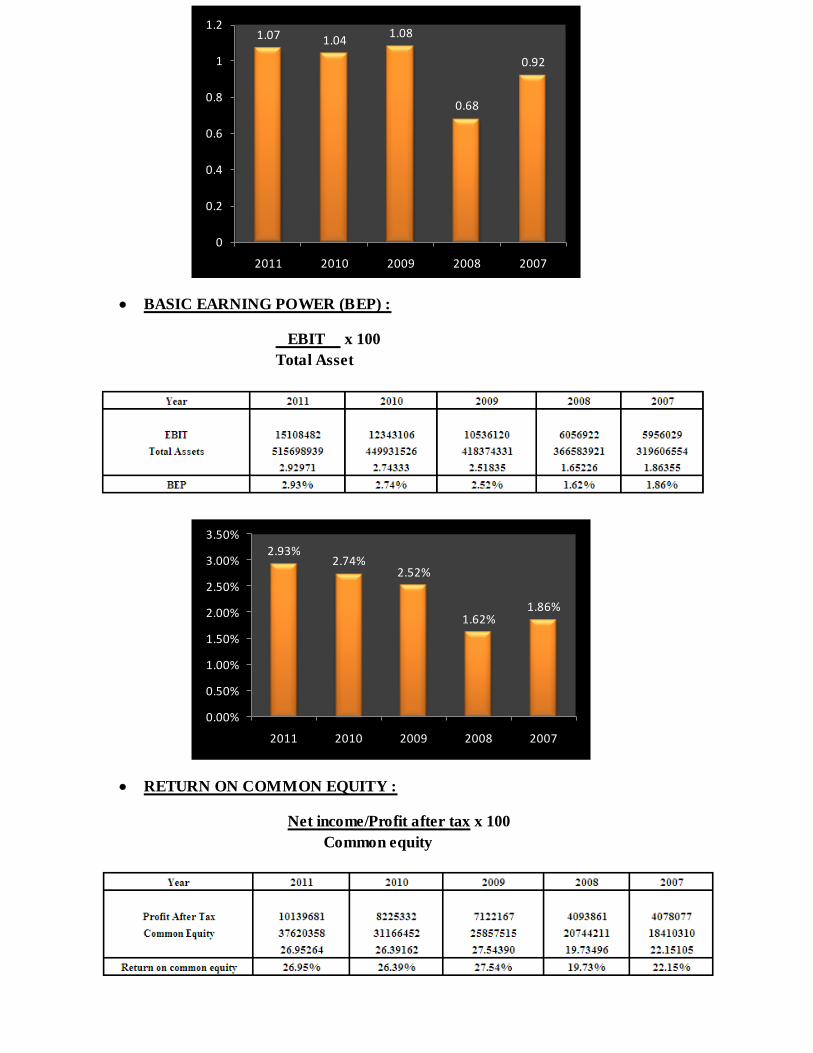
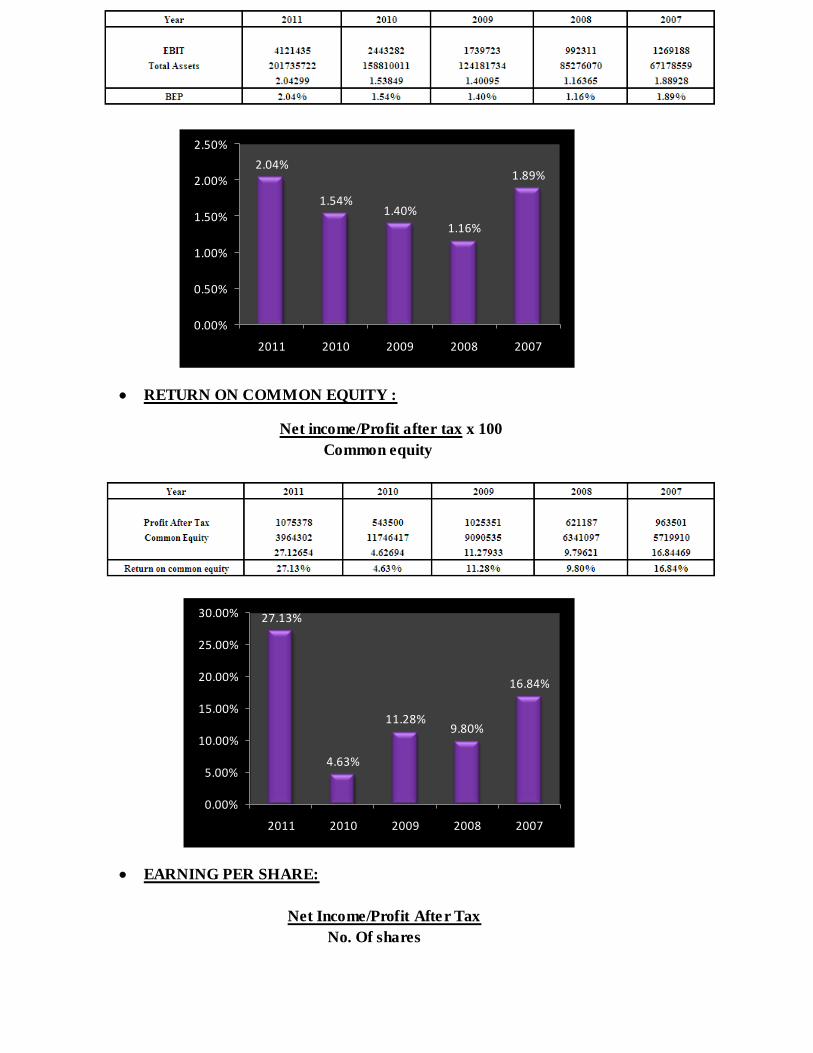
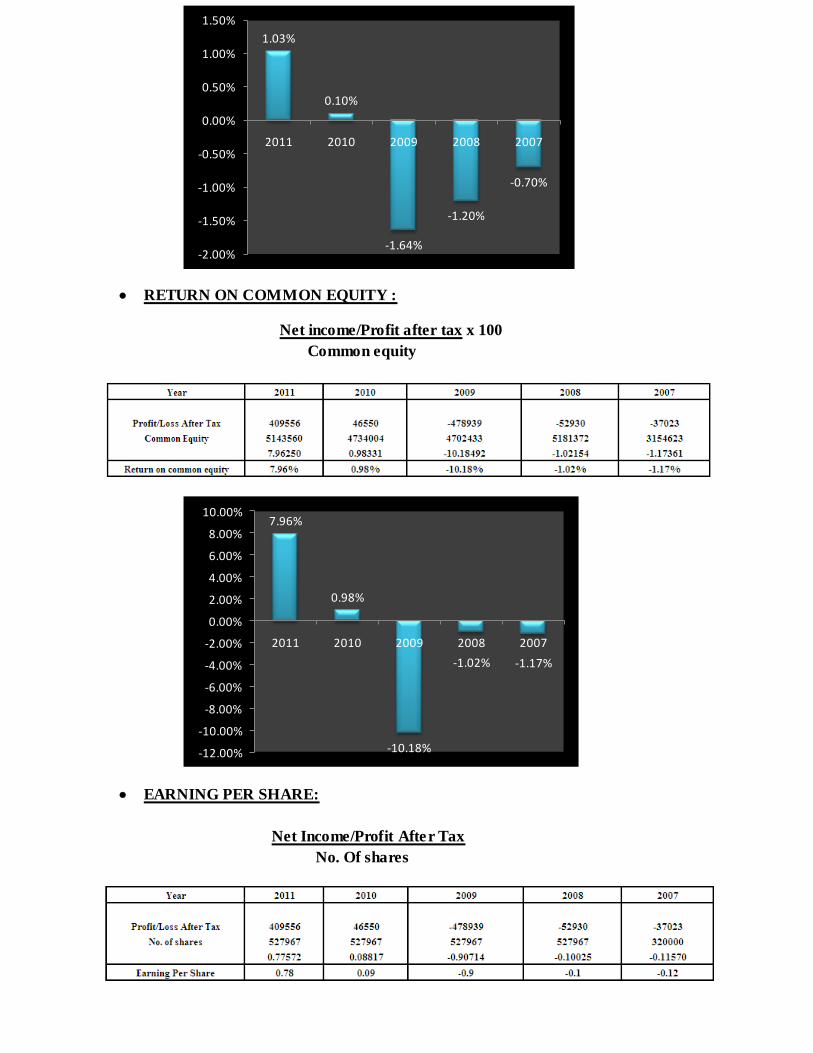
BASIC EARNING POWER (BEP) :
This ratio shows the raw earning power of the firms assets before the influence of tax and debts,
and it is useful when comparing firms with different debts and tax situation. The higher the BEP
ratio, the more effective a company is at generating income from its assets.Using EBIT instead
of operating income means that the ratio considers all income earned by the company, not just
income from operating activity. This gives a more complete picture of how the company makes
money.BEP is useful for comparing firms with different tax situations and different degrees of
financial leverage.
EBIT x 100
Total Asset
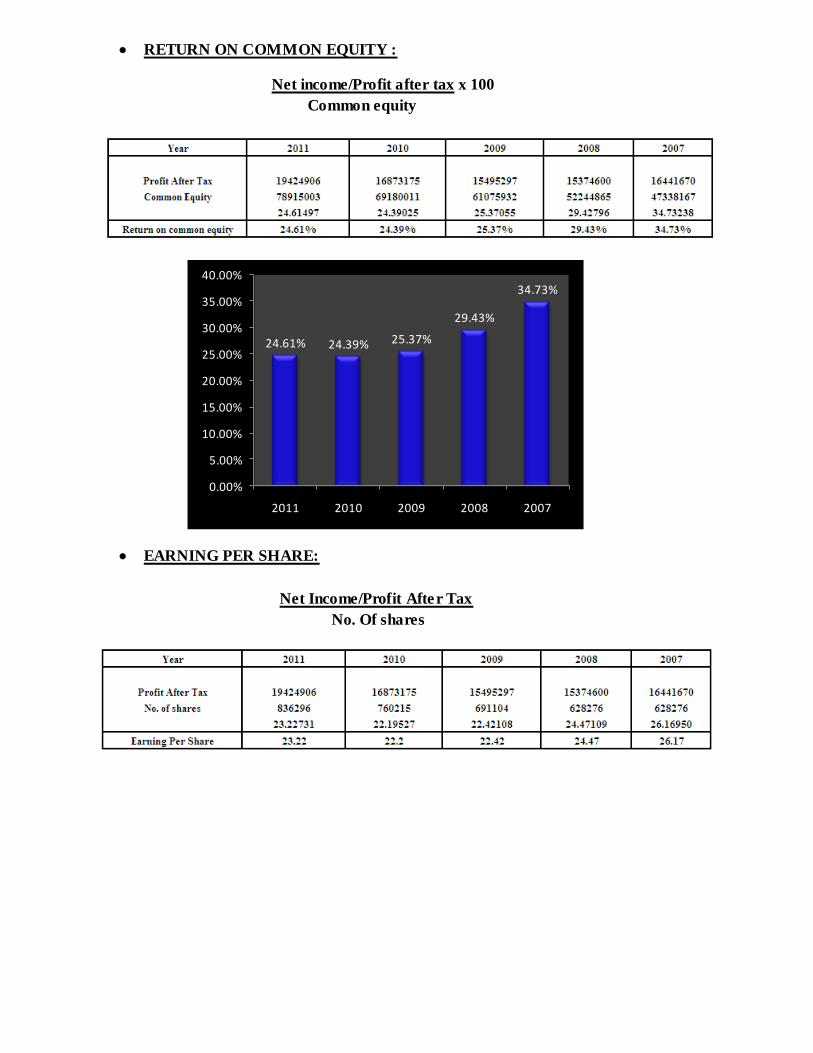
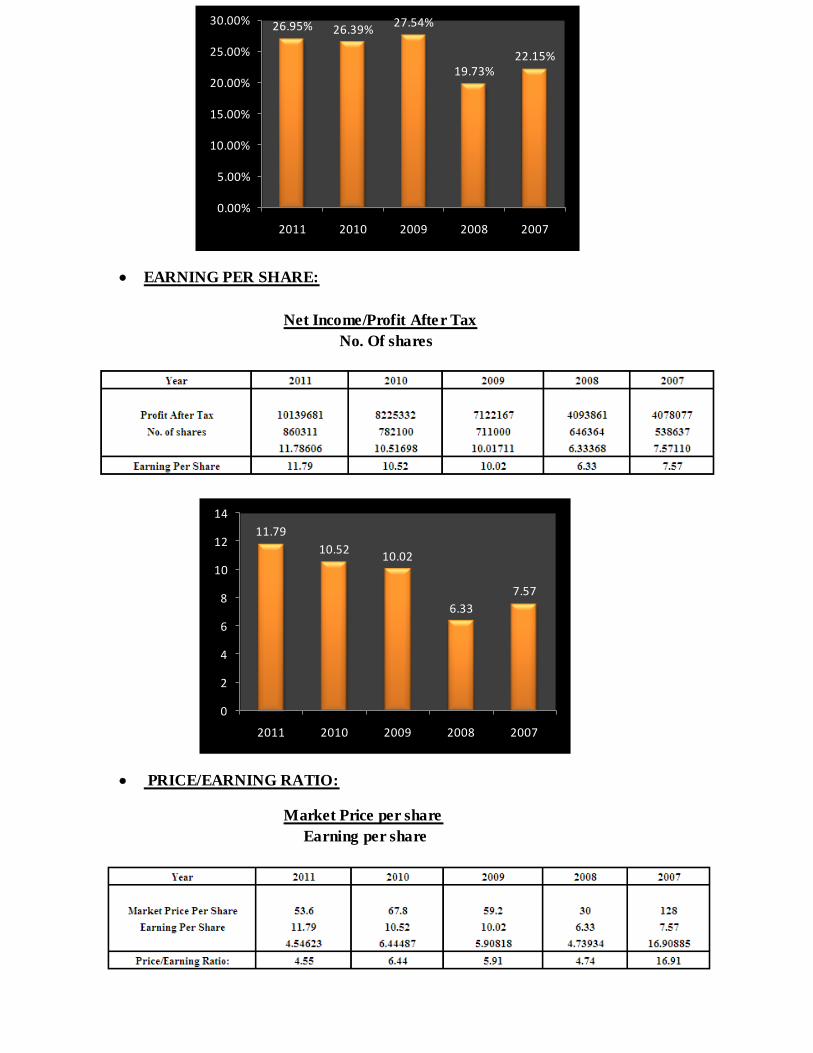
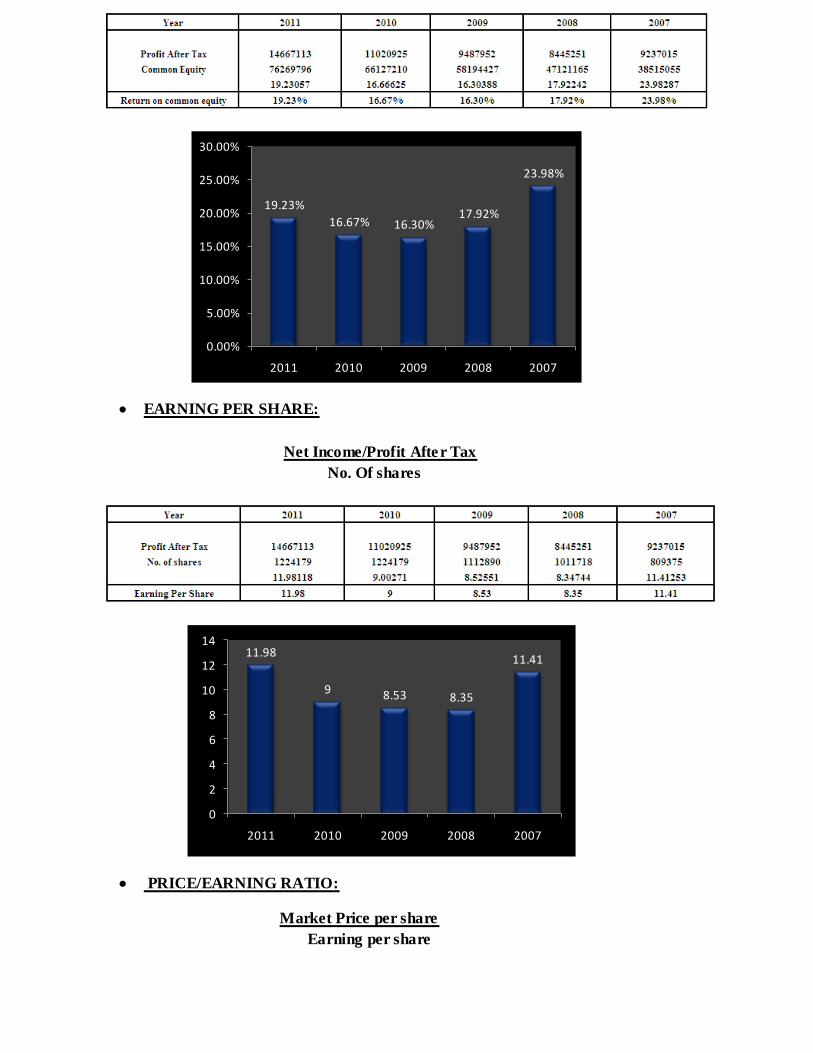
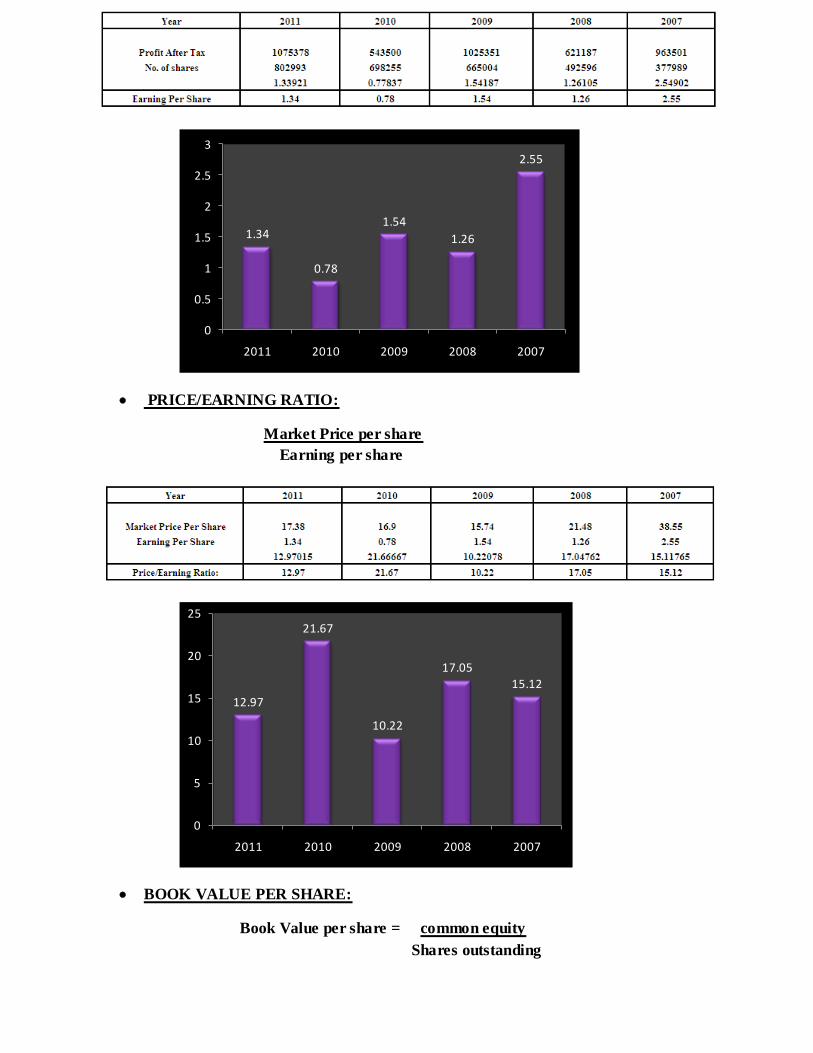
RETURN ON COMMON EQUITY :
It is the ratio of net profit to share holder's investment. It is the relationship between net profit
(after interest and tax) and share holder's/proprietor's fund. This ratio establishes the profitability
from the share holders' point of view. The ratio is generally calculated in percentage. Return on
equity measures a corporation's profitability by revealing how much profit a company generates
with the money shareholders have invested.
Net income/Profit after tax x 100
Common equity
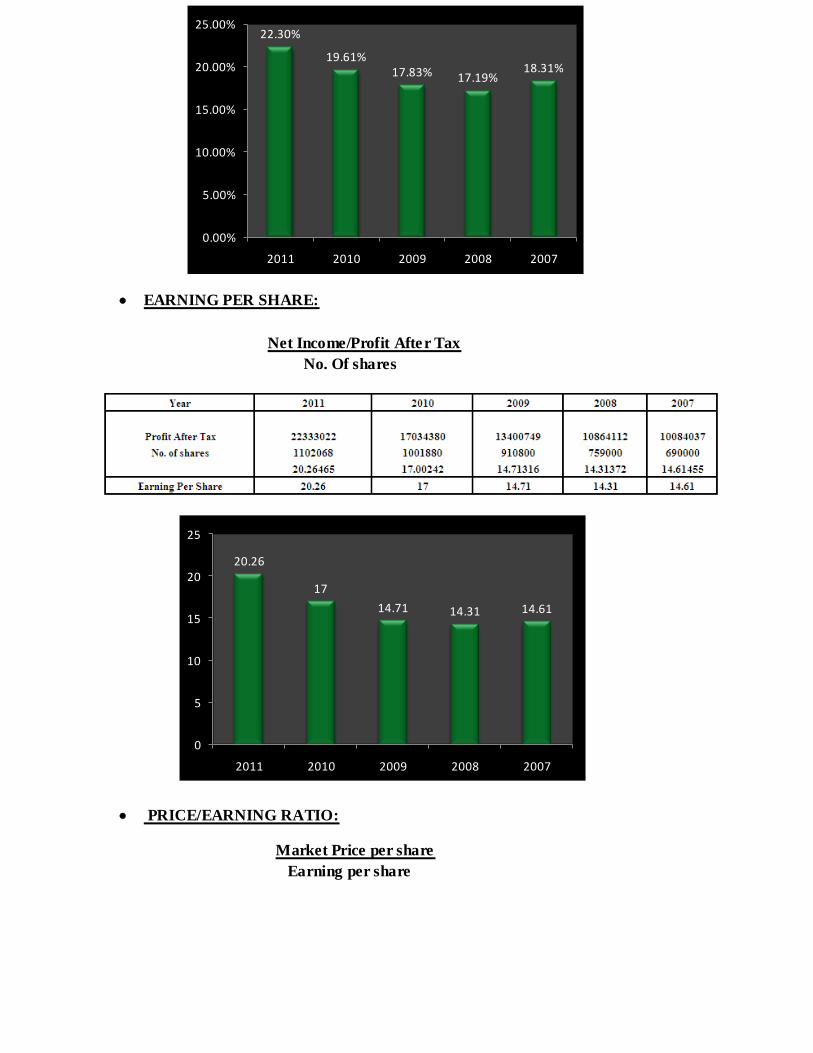
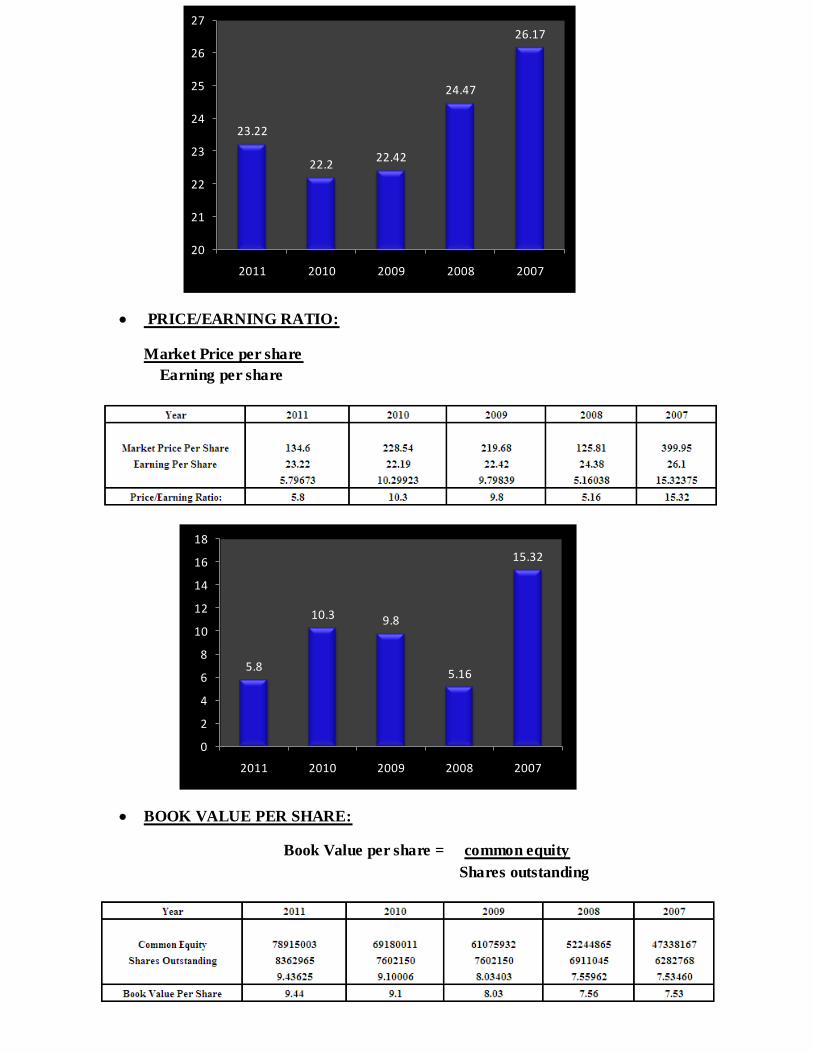
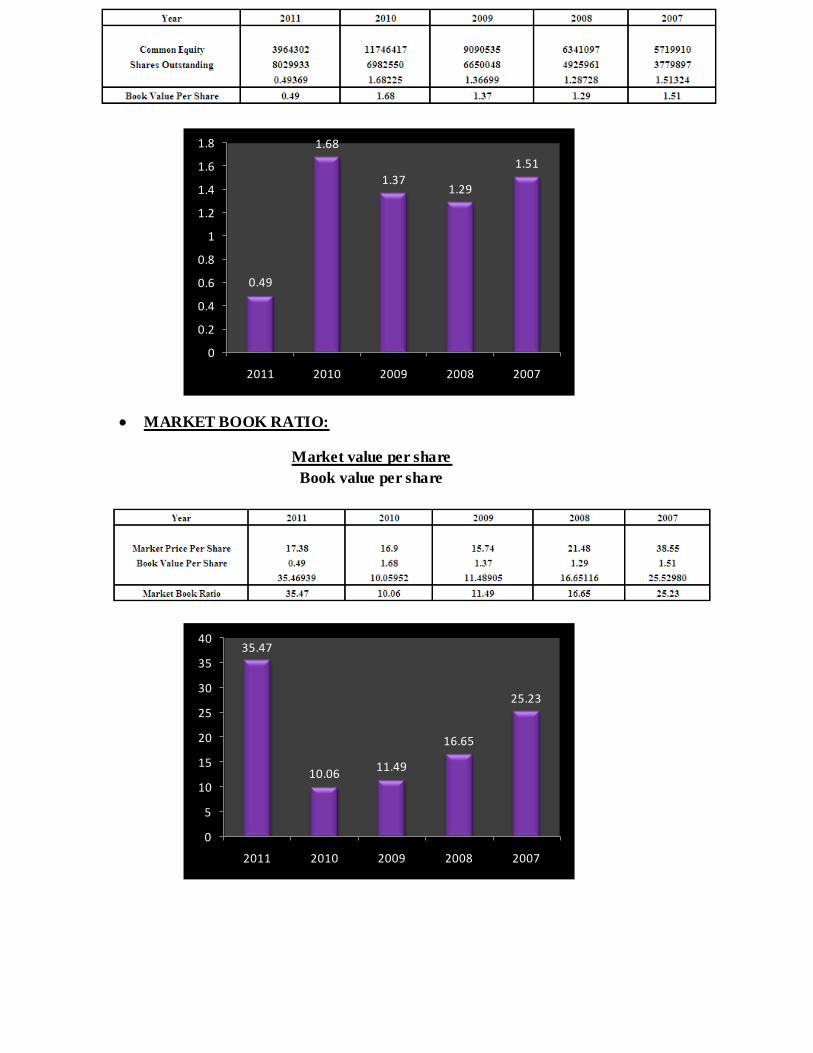
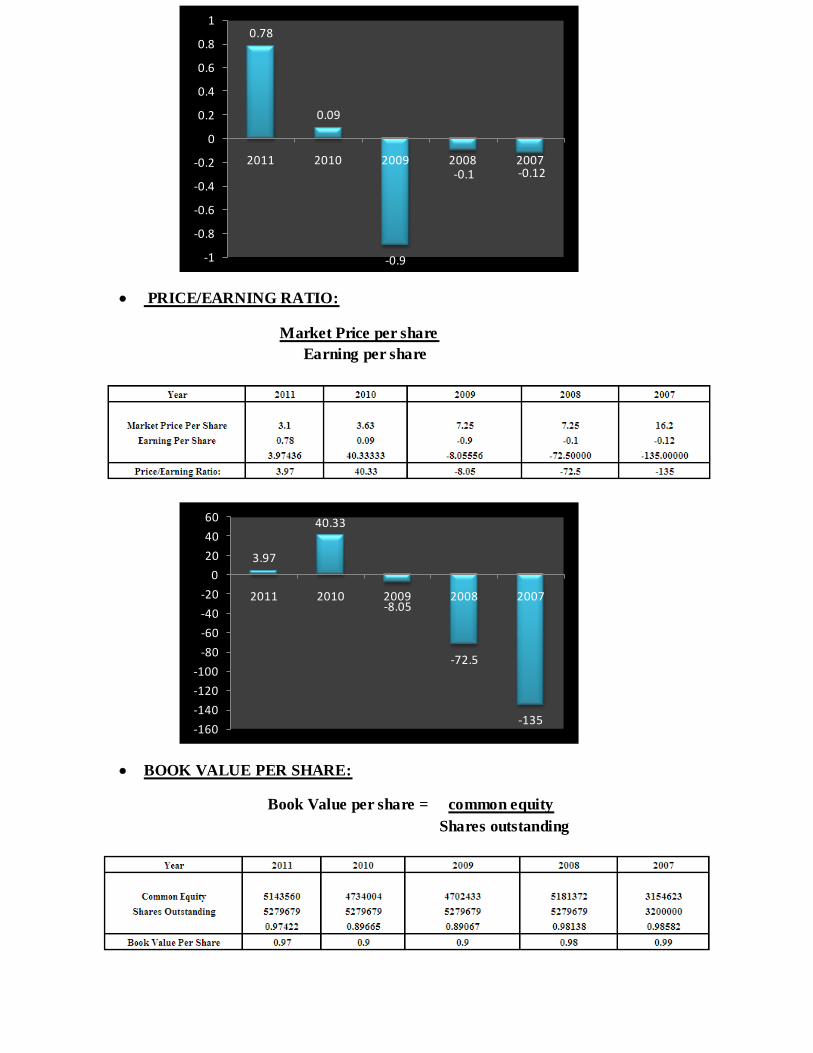
EARNING PER SHARE:
Earnings per share ratio (EPS Ratio) is a small variation of return on equity capital ratio and is
calculated by dividing the net profit after taxes and preference dividend by the total number of
equity shares.
Net Income/Profit After Tax
No. Of shares
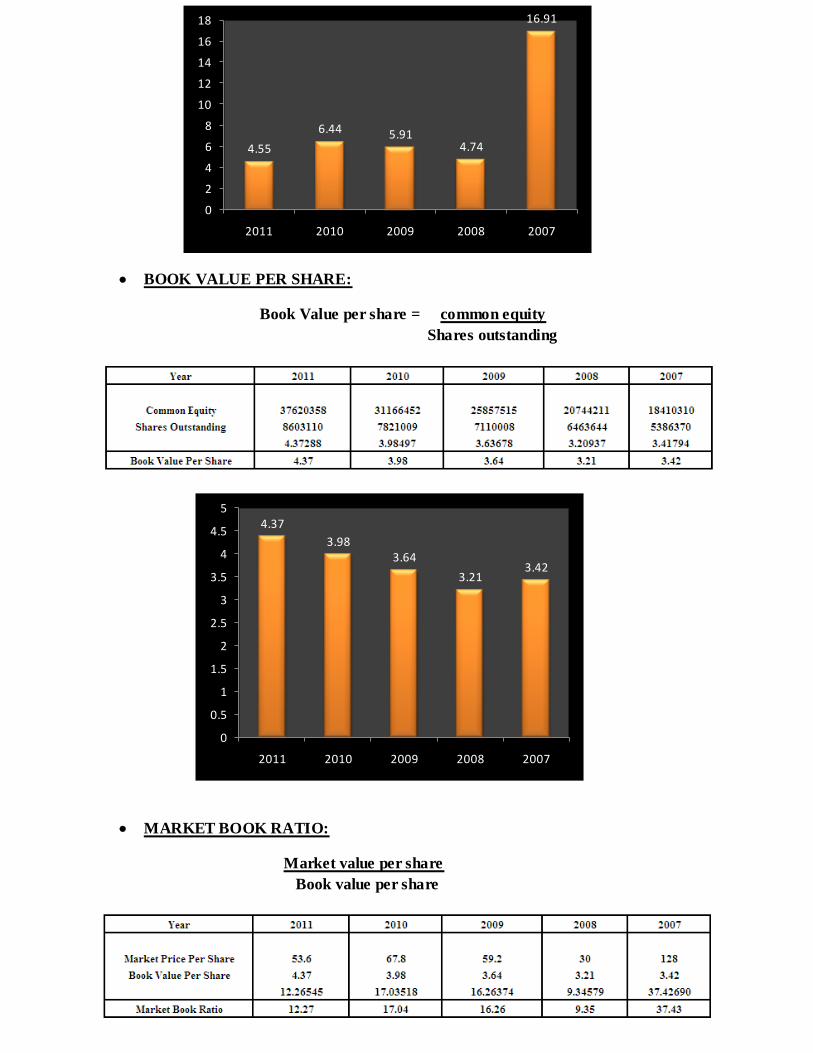
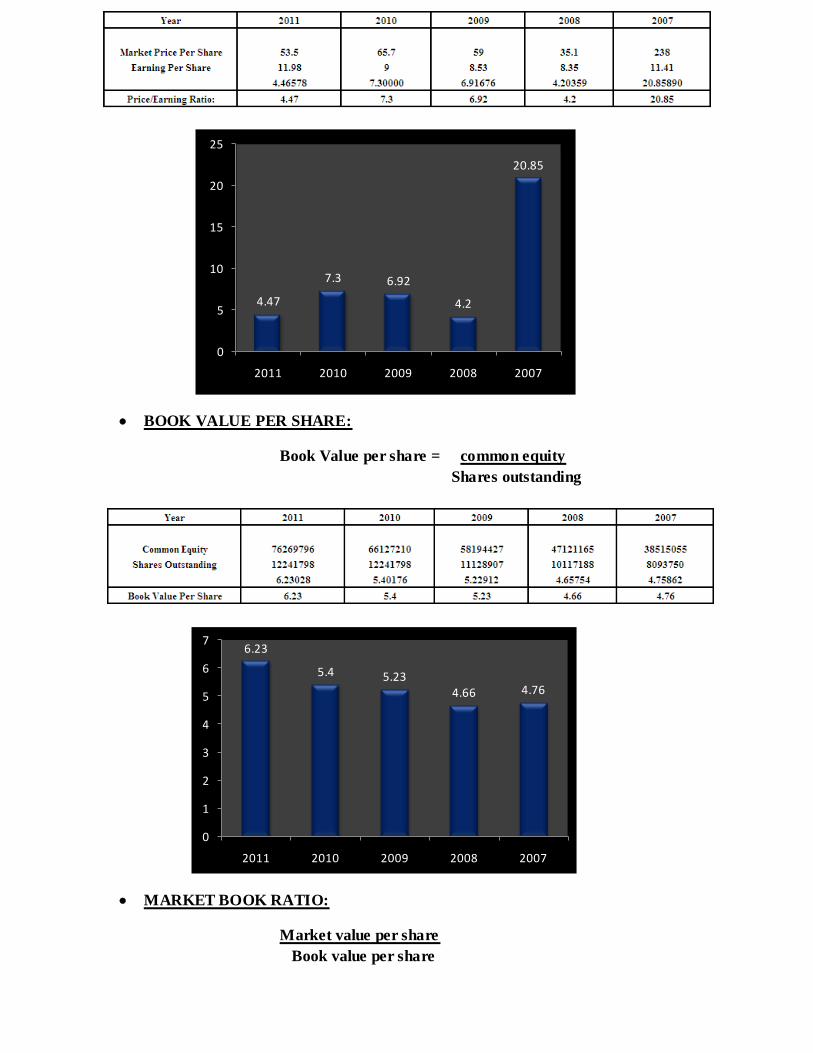
PRICE/EARNING RATIO:
Price earnings ratio (P/E ratio) is the ratio between market price per equity share and earning per
share. The ratio is calculated to make an estimate of appreciation in the va lue of a share of a
company and is widely used by investors to decide whether or not to buy shares in a particular
company.
Market Price per share
Earning per share
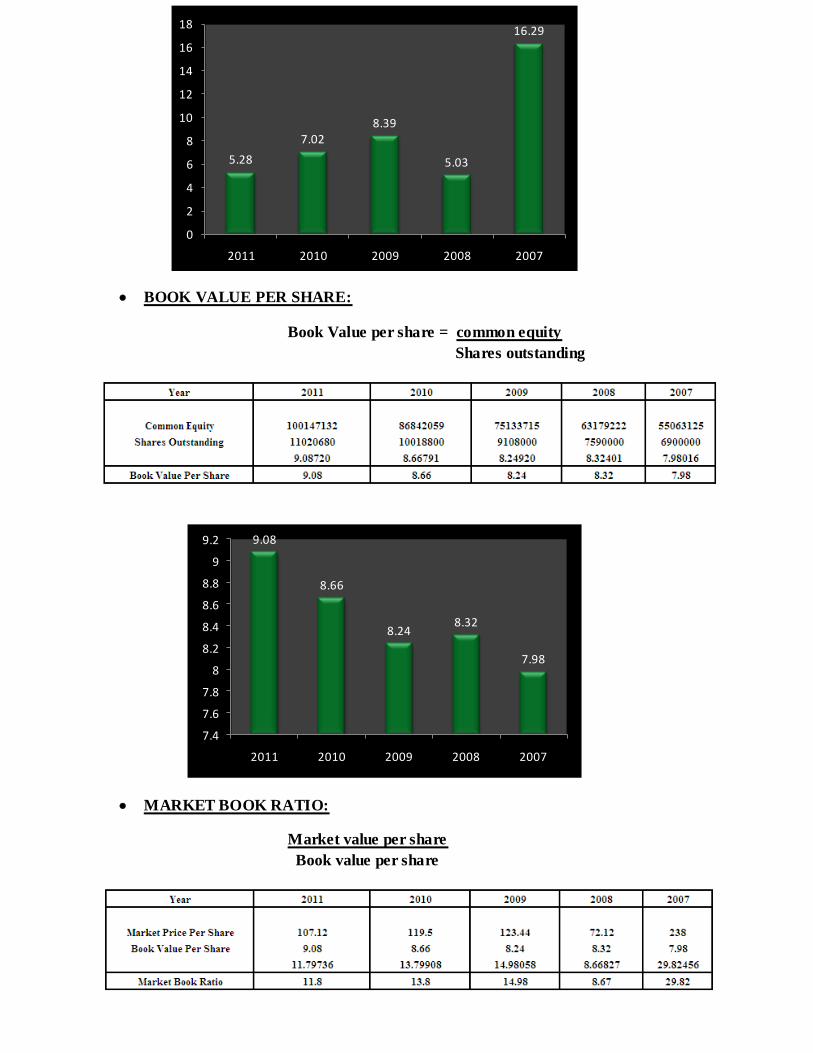
BOOK VALUE PER SHARE:
A measure used by owners of common shares in a firm to determine the level of safety
associated with each individual share after all debts are paid accordingly.Should the company
decide to dissolve, the book value per common indicates the dollar value remaining for common
shareholders after all assets are liquidated and all debtors are paid.
In simple terms it would be the amount of money that a holder of a common share would get if a
company were to liquidate.
Book Value per share = common equity
Shares outstanding
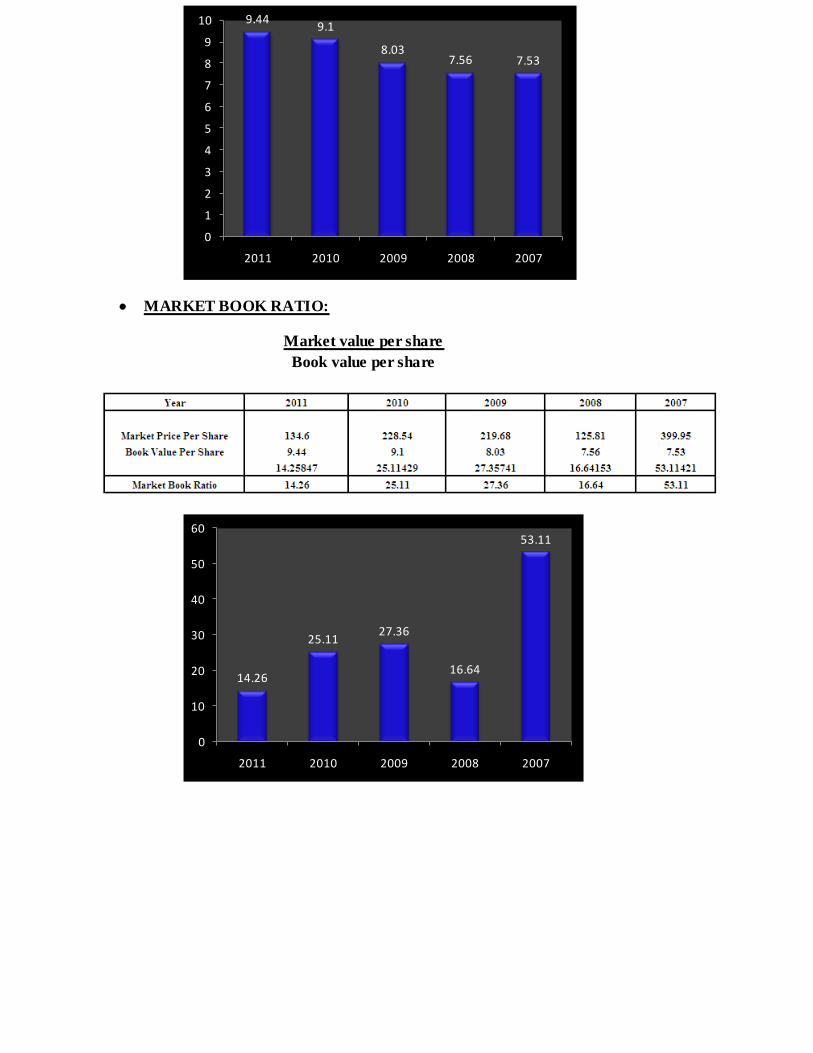
MARKET BOOK RATIO:
The ratio of a stock’s market price to its book value gives another indication of how investors
regard the company. Companies that are well regarded by investors which means low risk and
high growth—have high M/B ratios.A ratio used to find the value of a company by comparing
the book value of a firm to its market value.Book value is calculated by looking at the firm's
historical cost, or accounting value.Market value is determined in the stock market through its
market capitalization.
Market value per share
Book value per share
3) RATIO ANALYSIS OF HABIB BANK LIMITED:
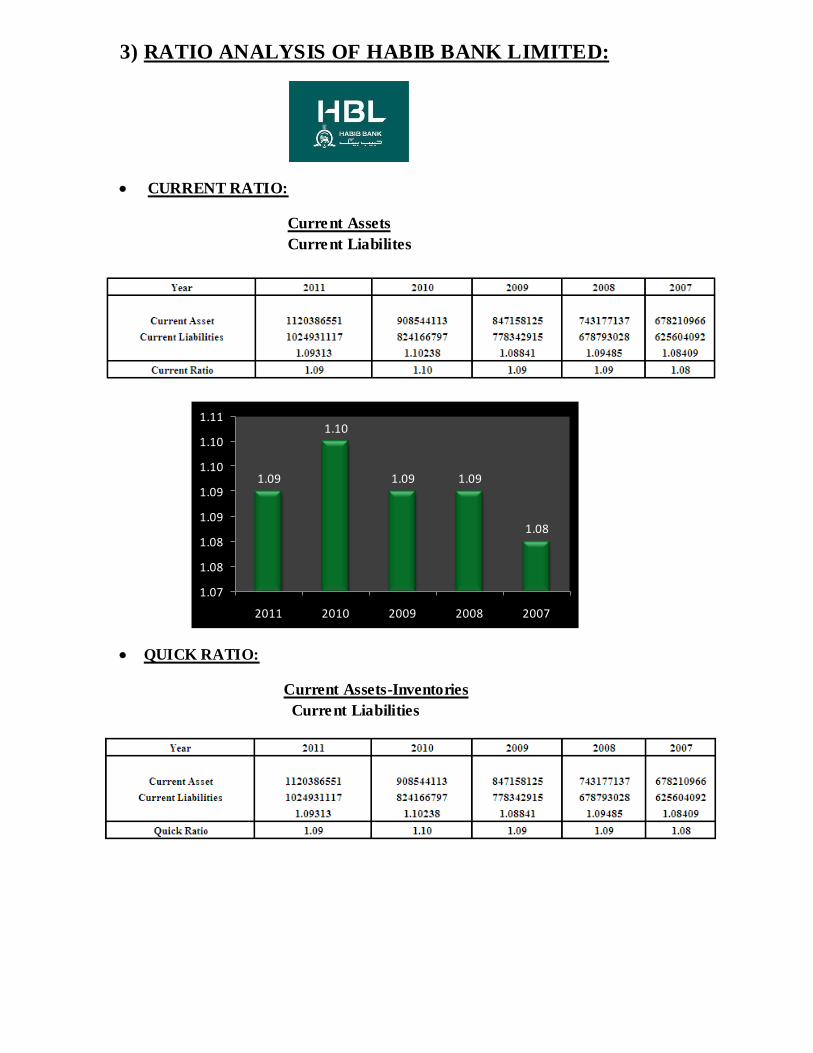
CURRENT RATIO:
Current Assets
Current Liabilites
QUICK RATIO:
Current Assets-Inventories
Current Liabilities
1.09
1.10
1.09 1.09
1.08
1.07
1.08
1.08
1.09
1.09
1.10
1.10
1.11
2011 2010 2009 2008 2007
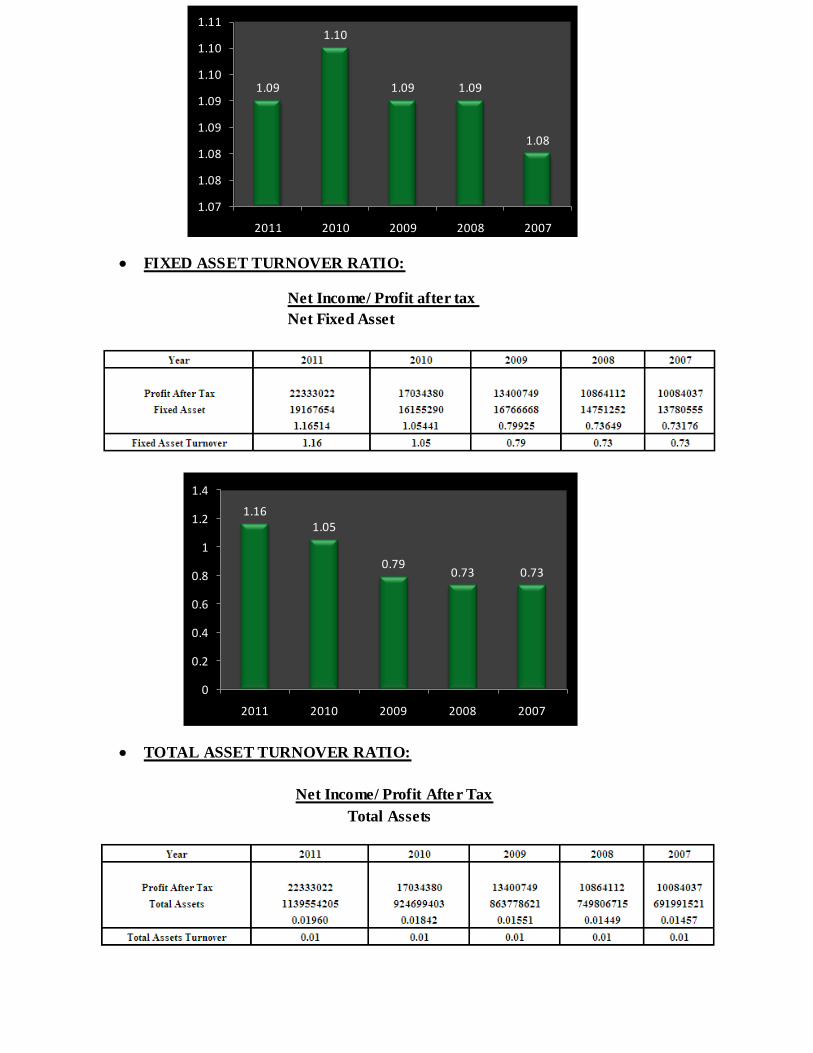
FIXED ASSET TURNOVER RATIO:
Net Income/ Profit after tax
Net Fixed Asset
TOTAL ASSET TURNOVER RATIO:
Net Income/ Profit After Tax
Total Assets
1.09
1.10
1.09 1.09
1.08
1.07
1.08
1.08
1.09
1.09
1.10
1.10
1.11
2011 2010 2009 2008 2007
1.161.05
0.790.73 0.73
0
0.2
0.4
0.6
0.8
1
1.2
1.4
2011 2010 2009 2008 2007
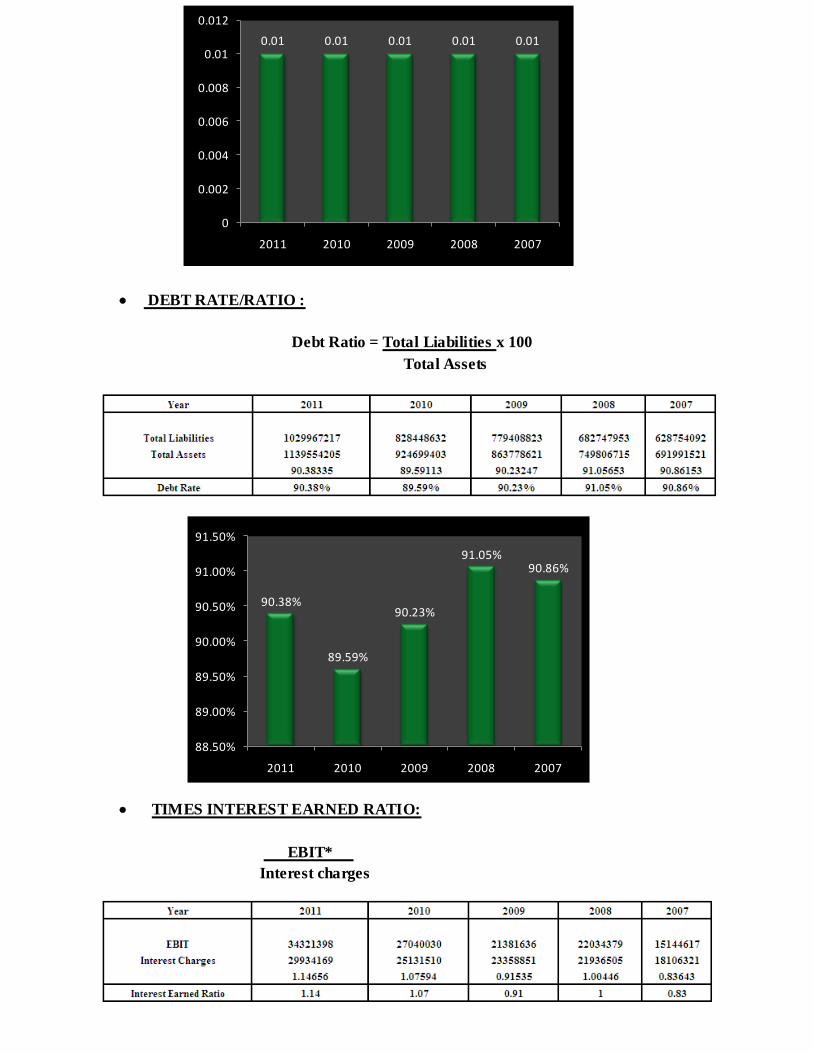
DEBT RATE/RATIO :
Debt Ratio = Total Liabilities x 100
Total Assets
TIMES INTEREST EARNED RATIO:
EBIT*
Interest charges
0.01 0.01 0.01 0.01 0.01
0
0.002
0.004
0.006
0.008
0.01
0.012
2011 2010 2009 2008 2007
90.38%
89.59%
90.23%
91.05%90.86%
88.50%
89.00%
89.50%
90.00%
90.50%
91.00%
91.50%
2011 2010 2009 2008 2007
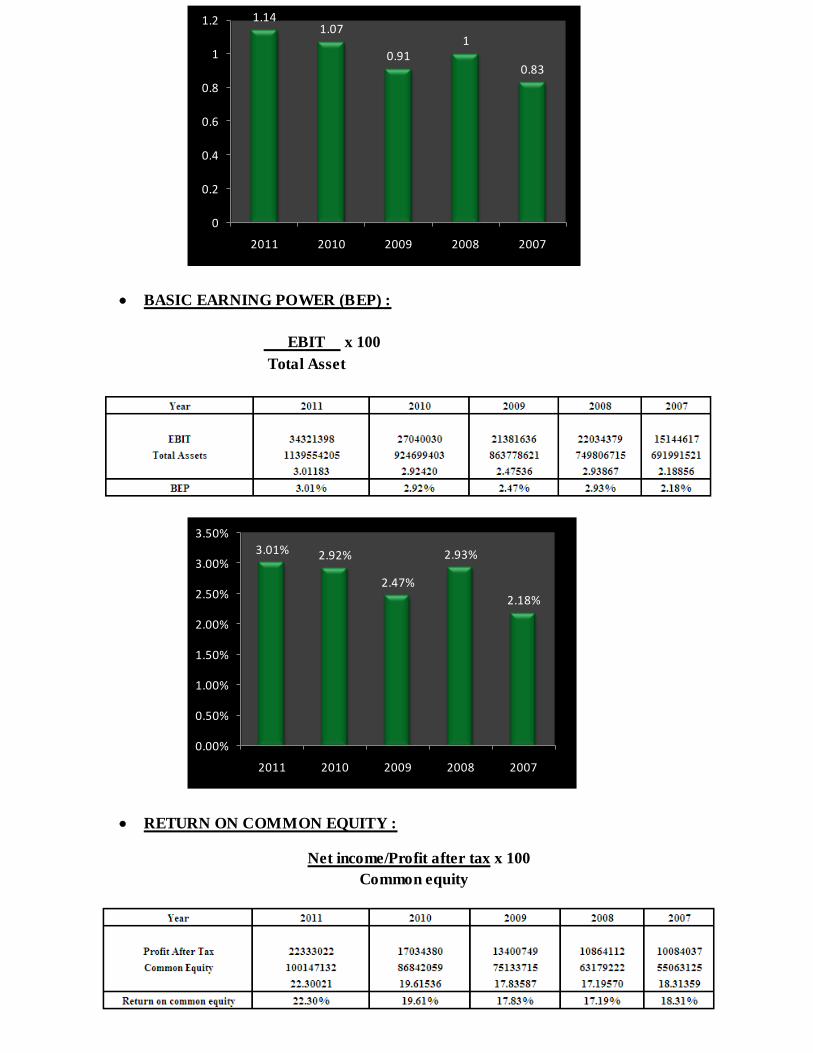
BASIC EARNING POWER (BEP) :
EBIT x 100
Total Asset
RETURN ON COMMON EQUITY :
Net income/Profit after tax x 100
Common equity
1.141.07
0.911
0.83
0
0.2
0.4
0.6
0.8
1
1.2
2011 2010 2009 2008 2007
3.01% 2.92%
2.47%
2.93%
2.18%
0.00%
0.50%
1.00%
1.50%
2.00%
2.50%
3.00%
3.50%
2011 2010 2009 2008 2007
EARNING PER SHARE:
Net Income/Profit After Tax
No. Of shares
PRICE/EARNING RATIO:
Market Price per share
Earning per share
22.30%
19.61%17.83% 17.19%
18.31%
0.00%
5.00%
10.00%
15.00%
20.00%
25.00%
2011 2010 2009 2008 2007
20.26
17
14.71 14.31 14.61
0
5
10
15
20
25
2011 2010 2009 2008 2007
BOOK VALUE PER SHARE:
Book Value per share = common equity
Shares outstanding
MARKET BOOK RATIO:
Market value per share
Book value per share
5.28
7.028.39
5.03
16.29
0
2
4
6
8
10
12
14
16
18
2011 2010 2009 2008 2007
9.08
8.66
8.248.32
7.98
7.4
7.6
7.8
8
8.2
8.4
8.6
8.8
9
9.2
2011 2010 2009 2008 2007
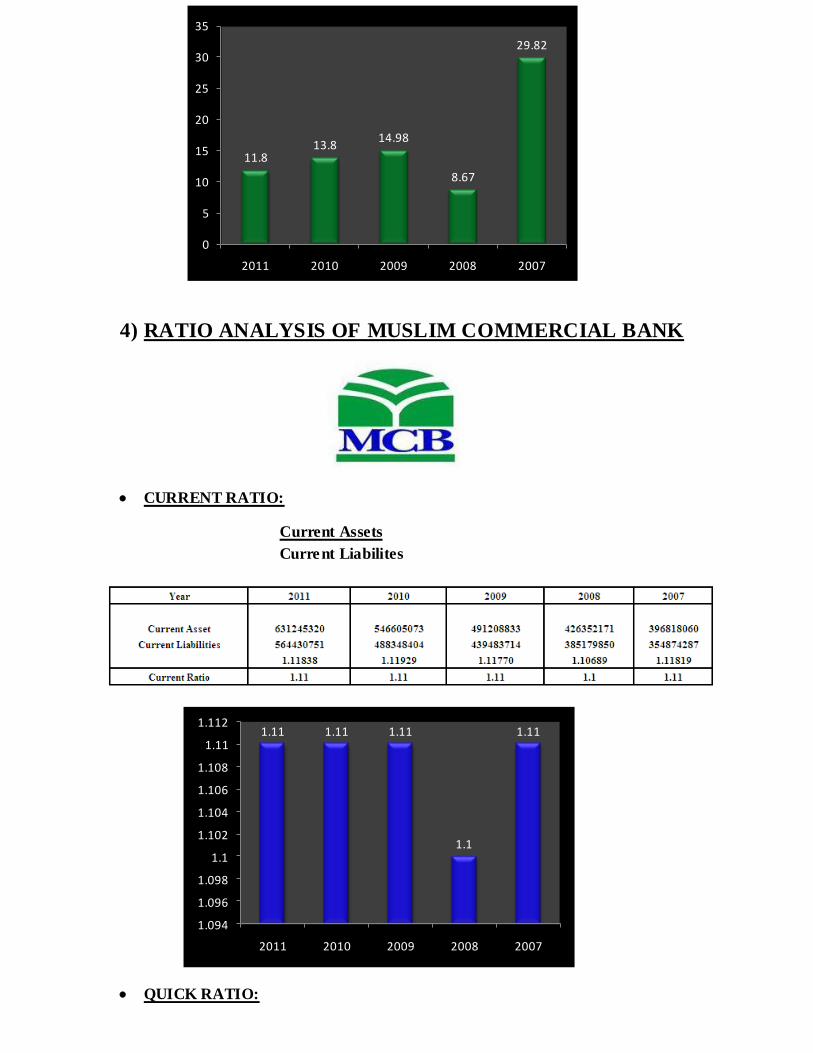
4) RATIO ANALYSIS OF MUSLIM COMMERCIAL BANK
CURRENT RATIO:
Current Assets
Current Liabilites
QUICK RATIO:
11.813.8
14.98
8.67
29.82
0
5
10
15
20
25
30
35
2011 2010 2009 2008 2007
1.11 1.11 1.11
1.1
1.11
1.094
1.096
1.098
1.1
1.102
1.104
1.106
1.108
1.11
1.112
2011 2010 2009 2008 2007
Current Assets-Inventories
Current Liabilities
FIXED ASSET TURNOVER RATIO:
Net Income/ Profit after tax
Net Fixed Asset
TOTAL ASSET TURNOVER RATIO:
Net Income/ Profit After Tax
Total Assets
1.11 1.11 1.11
1.1
1.11
1.094
1.096
1.098
1.1
1.102
1.104
1.106
1.108
1.11
1.112
2011 2010 2009 2008 2007
0.880.81
0.86 0.89
1.02
0
0.2
0.4
0.6
0.8
1
1.2
2011 2010 2009 2008 2007
DEBT RATE/RATIO :
Debt Ratio = Total Liabilities x 100
Total Assets
TIMES INTEREST EARNED RATIO:
0
0.005
0.01
0.015
0.02
0.025
0.03
0.035
2011 2010 2009 2008 2007
86.40%
86.02%
86.30%
86.82%
86.06%
85.60%
85.80%
86.00%
86.20%
86.40%
86.60%
86.80%
87.00%
2011 2010 2009 2008 2007
EBIT*
Interest charges
BASIC EARNING POWER (BEP) :
EBIT x 100
Total Asset
0
0.5
1
1.5
2
2.5
3
3.5
2011 2010 2009 2008 2007
4.82%
4.62%4.55%
4.93%
5.46%
4.00%
4.20%
4.40%
4.60%
4.80%
5.00%
5.20%
5.40%
5.60%
2011 2010 2009 2008 2007
RETURN ON COMMON EQUITY :
Net income/Profit after tax x 100
Common equity
EARNING PER SHARE:
Net Income/Profit After Tax
No. Of shares
24.61% 24.39% 25.37%
29.43%
34.73%
0.00%
5.00%
10.00%
15.00%
20.00%
25.00%
30.00%
35.00%
40.00%
2011 2010 2009 2008 2007
PRICE/EARNING RATIO:
Market Price per share
Earning per share
BOOK VALUE PER SHARE:
Book Value per share = common equity
Shares outstanding
23.22
22.222.42
24.47
26.17
20
21
22
23
24
25
26
27
2011 2010 2009 2008 2007
5.8
10.3 9.8
5.16
15.32
0
2
4
6
8
10
12
14
16
18
2011 2010 2009 2008 2007
MARKET BOOK RATIO:
Market value per share
Book value per share
9.449.1
8.037.56 7.53
0
1
2
3
4
5
6
7
8
9
10
2011 2010 2009 2008 2007
14.26
25.1127.36
16.64
53.11
0
10
20
30
40
50
60
2011 2010 2009 2008 2007
5) RATIO ANALYSIS OF ALLIED BANK LIMITED
CURRENT RATIO:
Current Assets
Current Liabilites
QUICK RATIO:
Current Assets-Inventories
Current Liabilities
1.06 1.06 1.06
1.03
1.04
1.015
1.02
1.025
1.03
1.035
1.04
1.045
1.05
1.055
1.06
1.065
2011 2010 2009 2008 2007
FIXED ASSET TURNOVER RATIO:
Net Income/ Profit after tax
Net Fixed Asset
TOTAL ASSET TURNOVER RATIO:
Net Income/ Profit After Tax
Total Assets
1.06 1.06 1.06
1.03
1.04
1.015
1.02
1.025
1.03
1.035
1.04
1.045
1.05
1.055
1.06
1.065
2011 2010 2009 2008 2007
0.560.53
0.57
0.36
0.54
0
0.1
0.2
0.3
0.4
0.5
0.6
2011 2010 2009 2008 2007
DEBT RATE/RATIO :
Debt Ratio = Total Liabilities x 100
Total Assets
TIMES INTEREST EARNED RATIO:
EBIT*
Interest charges
0.01 0.01 0.01 0.01 0.01
0
0.002
0.004
0.006
0.008
0.01
0.012
2011 2010 2009 2008 2007
91.60%
92.00%
92.84%
93.93%93.78%
90.00%
90.50%
91.00%
91.50%
92.00%
92.50%
93.00%
93.50%
94.00%
94.50%
2011 2010 2009 2008 2007
BASIC EARNING POWER (BEP) :
EBIT x 100
Total Asset
RETURN ON COMMON EQUITY :
Net income/Profit after tax x 100
Common equity
1.07 1.041.08
0.68
0.92
0
0.2
0.4
0.6
0.8
1
1.2
2011 2010 2009 2008 2007
2.93%2.74%
2.52%
1.62%1.86%
0.00%
0.50%
1.00%
1.50%
2.00%
2.50%
3.00%
3.50%
2011 2010 2009 2008 2007
EARNING PER SHARE:
Net Income/Profit After Tax
No. Of shares
PRICE/EARNING RATIO:
Market Price per share
Earning per share
26.95% 26.39%27.54%
19.73%22.15%
0.00%
5.00%
10.00%
15.00%
20.00%
25.00%
30.00%
2011 2010 2009 2008 2007
11.79
10.5210.02
6.33
7.57
0
2
4
6
8
10
12
14
2011 2010 2009 2008 2007
BOOK VALUE PER SHARE:
Book Value per share = common equity
Shares outstanding
MARKET BOOK RATIO:
Market value per share
Book value per share
4.55
6.44 5.914.74
16.91
0
2
4
6
8
10
12
14
16
18
2011 2010 2009 2008 2007
4.37
3.983.64
3.213.42
0
0.5
1
1.5
2
2.5
3
3.5
4
4.5
5
2011 2010 2009 2008 2007
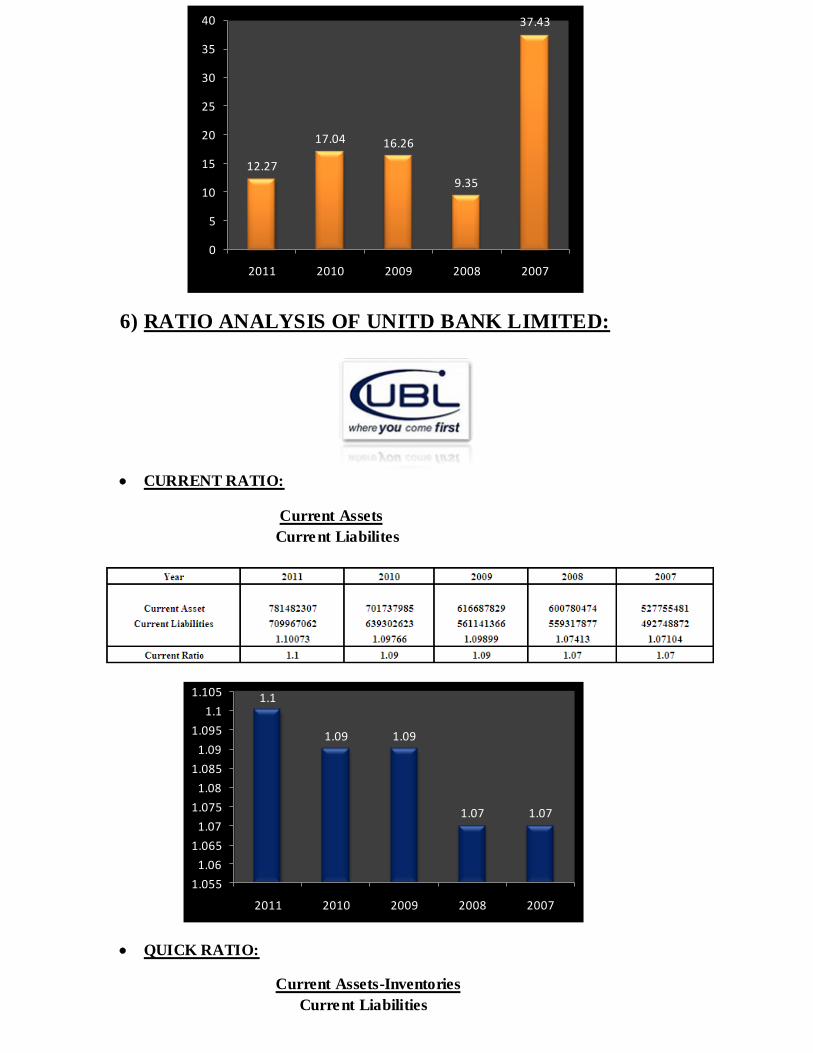
6) RATIO ANALYSIS OF UNITD BANK LIMITED:
CURRENT RATIO:
Current Assets
Current Liabilites
QUICK RATIO:
Current Assets-Inventories
Current Liabilities
12.27
17.04 16.26
9.35
37.43
0
5
10
15
20
25
30
35
40
2011 2010 2009 2008 2007
1.1
1.09 1.09
1.07 1.07
1.055
1.06
1.065
1.07
1.075
1.08
1.085
1.09
1.095
1.1
1.105
2011 2010 2009 2008 2007
FIXED ASSET TURNOVER RATIO:
Net Income/ Profit after tax
Net Fixed Asset
TOTAL ASSET TURNOVER RATIO:
Net Income/ Profit After Tax
Total Assets
1.1
1.09 1.09
1.07 1.07
1.055
1.06
1.065
1.07
1.075
1.08
1.085
1.09
1.095
1.1
1.105
2011 2010 2009 2008 2007
0.57
0.450.4 0.42
0.48
0
0.1
0.2
0.3
0.4
0.5
0.6
2011 2010 2009 2008 2007
DEBT RATE/RATIO :
Debt Ratio = Total Liabilities x 100
Total Assets
TIMES INTEREST EARNED RATIO:
EBIT*
Interest charges
0.01 0.01 0.01 0.01 0.01
0
0.002
0.004
0.006
0.008
0.01
0.012
2011 2010 2009 2008 2007
89.36%89.67%
89.49%
92.04%
91.23%
88.00%
88.50%
89.00%
89.50%
90.00%
90.50%
91.00%
91.50%
92.00%
92.50%
2011 2010 2009 2008 2007
BASIC EARNING POWER (BEP) :
EBIT x 100
Total Asset
RETURN ON COMMON EQUITY :
Net income/Profit after tax x 100
Common equity
0.74
0.79
0.81 0.81
0.8
0.7
0.72
0.74
0.76
0.78
0.8
0.82
2011 2010 2009 2008 2007
2.74% 2.73%
2.95%
2.86%
2.65%
2.50%
2.55%
2.60%
2.65%
2.70%
2.75%
2.80%
2.85%
2.90%
2.95%
3.00%
2011 2010 2009 2008 2007
EARNING PER SHARE:
Net Income/Profit After Tax
No. Of shares
PRICE/EARNING RATIO:
Market Price per share
Earning per share
19.23%
16.67% 16.30%17.92%
23.98%
0.00%
5.00%
10.00%
15.00%
20.00%
25.00%
30.00%
2011 2010 2009 2008 2007
11.98
9 8.53 8.35
11.41
0
2
4
6
8
10
12
14
2011 2010 2009 2008 2007
BOOK VALUE PER SHARE:
Book Value per share = common equity
Shares outstanding
MARKET BOOK RATIO:
Market value per share
Book value per share
4.47
7.3 6.92
4.2
20.85
0
5
10
15
20
25
2011 2010 2009 2008 2007
6.23
5.4 5.234.66 4.76
0
1
2
3
4
5
6
7
2011 2010 2009 2008 2007
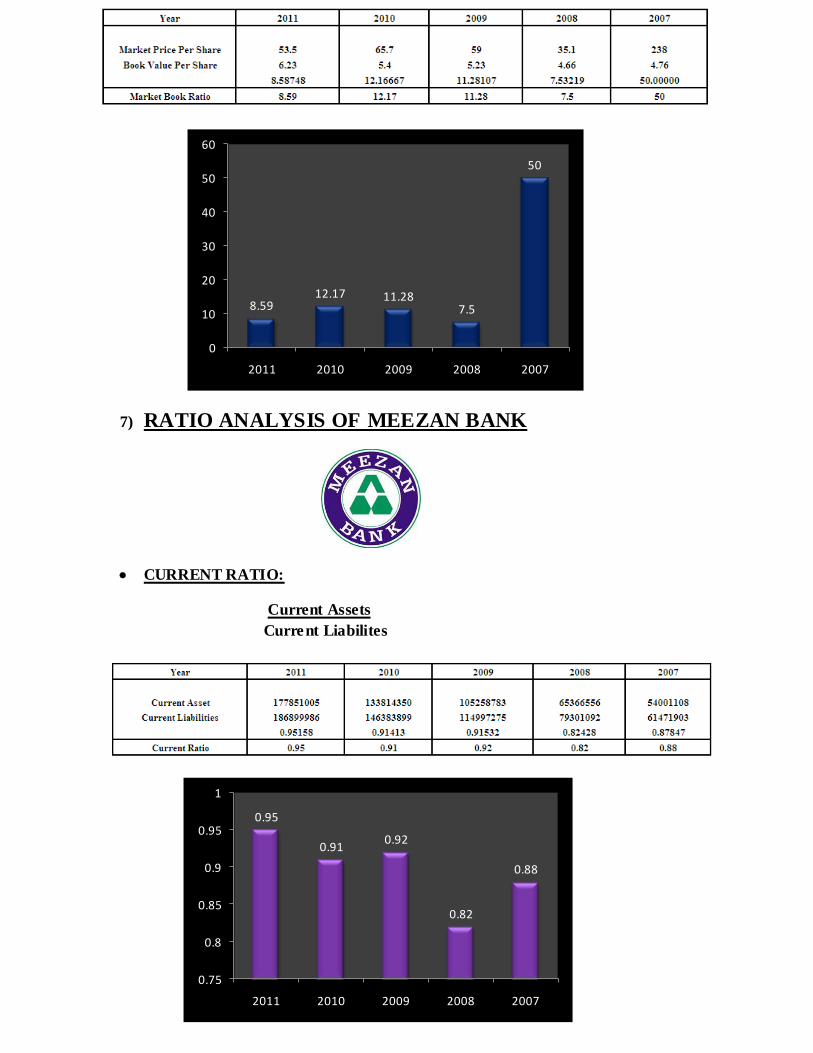
7) RATIO ANALYSIS OF MEEZAN BANK
CURRENT RATIO:
Current Assets
Current Liabilites
8.5912.17 11.28
7.5
50
0
10
20
30
40
50
60
2011 2010 2009 2008 2007
0.95
0.910.92
0.82
0.88
0.75
0.8
0.85
0.9
0.95
1
2011 2010 2009 2008 2007
QUICK RATIO:
Current Assets-Inventories
Current Liabilities
FIXED ASSET TURNOVER RATIO:
Net Income/ Profit after tax
Net Fixed Asset
TOTAL ASSET TURNOVER RATIO:
Net Income/ Profit After Tax
Total Assets
4.164.78
5.36
7.58
8.59
0
1
2
3
4
5
6
7
8
9
10
2011 2010 2009 2008 2007
0.04
0.02
0.05
0.03
0.07
0
0.01
0.02
0.03
0.04
0.05
0.06
0.07
0.08
2011 2010 2009 2008 2007
DEBT RATE/RATIO :
Debt Ratio = Total Liabilities x 100
Total Assets
BASIC EARNING POWER (BEP) :
EBIT x 100
Total Asset
0.005
0.003
0.0080.007
0.014
0
0.002
0.004
0.006
0.008
0.01
0.012
0.014
0.016
2011 2010 2009 2008 2007
92.65%
92.18%
92.60%
92.99%
91.51%
90.50%
91.00%
91.50%
92.00%
92.50%
93.00%
93.50%
2011 2010 2009 2008 2007
RETURN ON COMMON EQUITY :
Net income/Profit after tax x 100
Common equity
EARNING PER SHARE:
Net Income/Profit After Tax
No. Of shares
2.04%
1.54%1.40%
1.16%
1.89%
0.00%
0.50%
1.00%
1.50%
2.00%
2.50%
2011 2010 2009 2008 2007
27.13%
4.63%
11.28%9.80%
16.84%
0.00%
5.00%
10.00%
15.00%
20.00%
25.00%
30.00%
2011 2010 2009 2008 2007
PRICE/EARNING RATIO:
Market Price per share
Earning per share
BOOK VALUE PER SHARE:
Book Value per share = common equity
Shares outstanding
1.34
0.78
1.54
1.26
2.55
0
0.5
1
1.5
2
2.5
3
2011 2010 2009 2008 2007
12.97
21.67
10.22
17.05
15.12
0
5
10
15
20
25
2011 2010 2009 2008 2007
MARKET BOOK RATIO:
Market value per share
Book value per share
0.49
1.68
1.371.29
1.51
0
0.2
0.4
0.6
0.8
1
1.2
1.4
1.6
1.8
2011 2010 2009 2008 2007
35.47
10.0611.49
16.65
25.23
0
5
10
15
20
25
30
35
40
2011 2010 2009 2008 2007
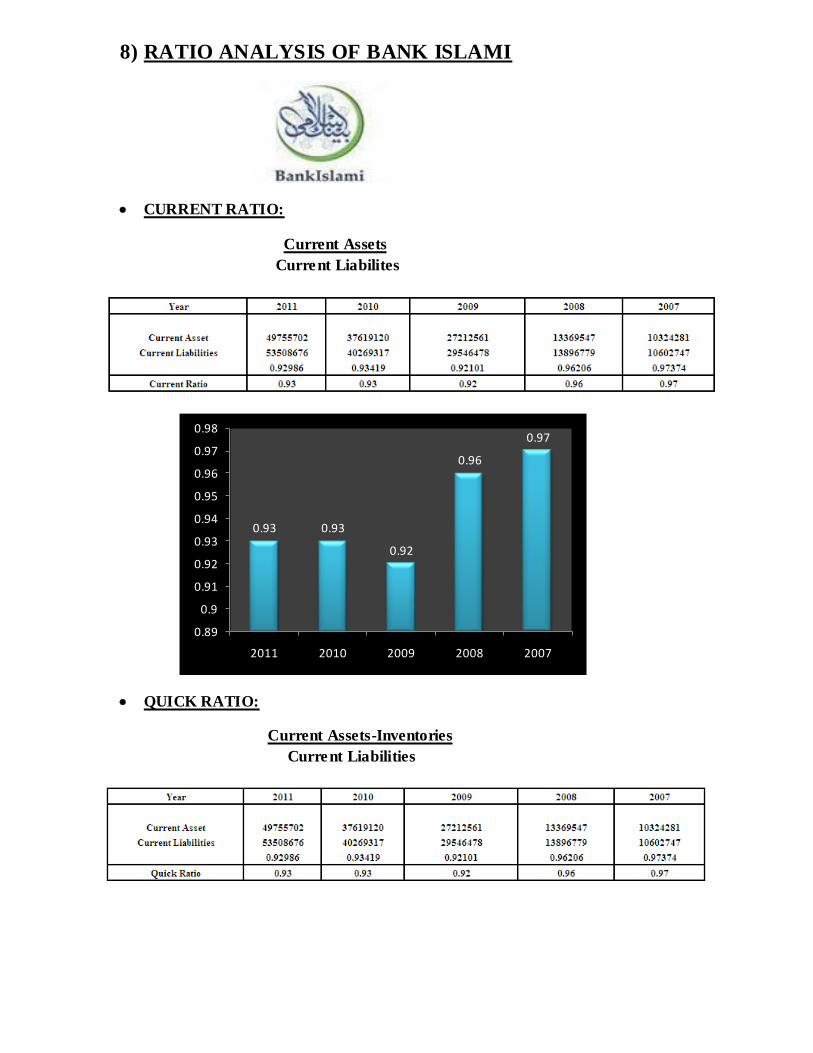
8) RATIO ANALYSIS OF BANK ISLAMI
CURRENT RATIO:
Current Assets
Current Liabilites
QUICK RATIO:
Current Assets-Inventories
Current Liabilities
0.93 0.93
0.92
0.96
0.97
0.89
0.9
0.91
0.92
0.93
0.94
0.95
0.96
0.97
0.98
2011 2010 2009 2008 2007
FIXED ASSET TURNOVER RATIO:
Net Income/ Profit after tax
Net Fixed Asset
TOTAL ASSET TURNOVER RATIO:
Net Income/ Profit After Tax
Total Assets
0.93 0.93
0.92
0.96
0.97
0.89
0.9
0.91
0.92
0.93
0.94
0.95
0.96
0.97
0.98
2011 2010 2009 2008 2007
0.044
0.006
-0.065
-0.009 -0.009
-0.08
-0.06
-0.04
-0.02
0
0.02
0.04
0.06
2011 2010 2009 2008 2007
DEBT RATE/RATIO :
Debt Ratio = Total Liabilities x 100
Total Assets
BASIC EARNING POWER (BEP) :
EBIT x 100
Total Asset
0.007
0.001
-0.014
-0.003 -0.003
-0.02
-0.015
-0.01
-0.005
0
0.005
0.01
2011 2010 2009 2008 2007
90.97% 89.42% 86.17%
72.80% 73.39%
0.00%
10.00%
20.00%
30.00%
40.00%
50.00%
60.00%
70.00%
80.00%
90.00%
100.00%
2011 2010 2009 2008 2007
RETURN ON COMMON EQUITY :
Net income/Profit after tax x 100
Common equity
EARNING PER SHARE:
Net Income/Profit After Tax
No. Of shares
1.03%
0.10%
-1.64%
-1.20%
-0.70%
-2.00%
-1.50%
-1.00%
-0.50%
0.00%
0.50%
1.00%
1.50%
2011 2010 2009 2008 2007
7.96%
0.98%
-10.18%
-1.02% -1.17%
-12.00%
-10.00%
-8.00%
-6.00%
-4.00%
-2.00%
0.00%
2.00%
4.00%
6.00%
8.00%
10.00%
2011 2010 2009 2008 2007
PRICE/EARNING RATIO:
Market Price per share
Earning per share
BOOK VALUE PER SHARE:
Book Value per share = common equity
Shares outstanding
0.78
0.09
-0.9
-0.1 -0.12
-1
-0.8
-0.6
-0.4
-0.2
0
0.2
0.4
0.6
0.8
1
2011 2010 2009 2008 2007
3.97
40.33
-8.05
-72.5
-135-160
-140
-120
-100
-80
-60
-40
-20
0
20
40
60
2011 2010 2009 2008 2007
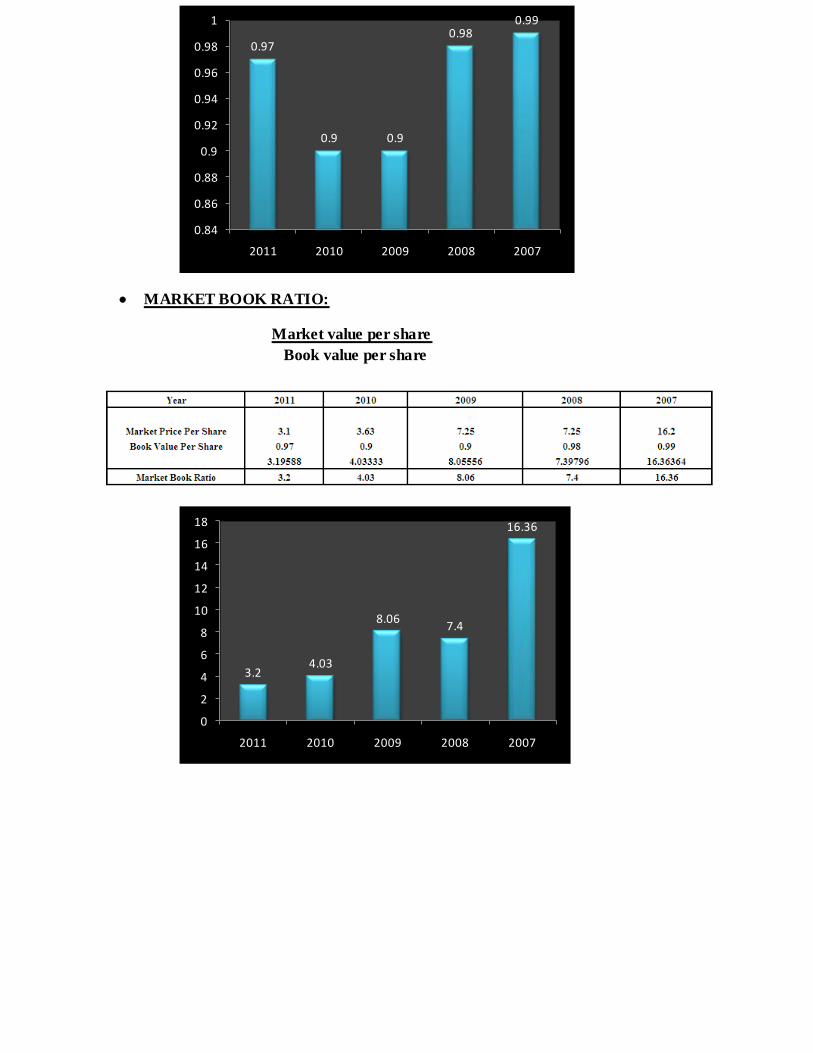
MARKET BOOK RATIO:
Market value per share
Book value per share
0.97
0.9 0.9
0.980.99
0.84
0.86
0.88
0.9
0.92
0.94
0.96
0.98
1
2011 2010 2009 2008 2007
3.24.03
8.067.4
16.36
0
2
4
6
8
10
12
14
16
18
2011 2010 2009 2008 2007