Ratings Performance, Regulation and the Great Depression ... · Henry Varnum Poor first published a...
35
Ratings Performance, Regulation and the Great Depression: Evidence from Foreign Government Securities Marc Flandreau, Norbert Gaillard, and Frank Packer ♦ March 2009 Preliminary: Comments Welcome. Do not Circulate. Do not cite without permission Abstract During the 1930s, rating agencies took up a central role in regulatory supervision that they still have today. We study the process through which they received this regulatory license. The proximate cause for this changeover was the economic shock of the Great Depression. Exploring the performance of rating agencies in assessing the risks of sovereign debt, an important segment of the bond market, we show that superior forecasting capacities cannot explain the agencies’ growing importance. We argue that the agencies’ perceived lack of conflicts of interest (in contrast to other financial intermediaries) was a major factor in bringing them to the forefront of a new regulatory regime. ♦ Graduate Institute for International and Development Studies, Geneva and CEPR, London; Sciences Po, Paris; Bank of International Settlements, Basel, respectively. Part of this paper were written while Marc Flandreau was visiting scholar with the BIS, whose hospitality is warmly acknowledged. We are to grateful to Magdalena Erdem for her invaluable assistance in preparing the paper. We also thank Laura Rosner for assistance with additional sources located in New York. We thank Richard Cantor, Robert McCauley, Mira Wilkins and seminar participants at the Bundesbank and London School of Economics for their comments on previous drafts. Caveat: The views expressed here are those of the authors and do not reflect those of the Bank for International Settlements. Corresponding author: [email protected]
Transcript of Ratings Performance, Regulation and the Great Depression ... · Henry Varnum Poor first published a...

Ratings Performance, Regulation and the Great Depression:
Evidence from Foreign Government Securities
Marc Flandreau, Norbert Gaillard, and Frank Packer♦
March 2009
Preliminary: Comments Welcome. Do not Circulate.
Do not cite without permission
Abstract
During the 1930s, rating agencies took up a central role in regulatory supervision that they still have today. We study the process through which they received this regulatory license. The proximate cause for this changeover was the economic shock of the Great Depression. Exploring the performance of rating agencies in assessing the risks of sovereign debt, an important segment of the bond market, we show that superior forecasting capacities cannot explain the agencies’ growing importance. We argue that the agencies’ perceived lack of conflicts of interest (in contrast to other financial intermediaries) was a major factor in bringing them to the forefront of a new regulatory regime.
♦ Graduate Institute for International and Development Studies, Geneva and CEPR, London; Sciences Po, Paris; Bank of International Settlements, Basel, respectively. Part of this paper were written while Marc Flandreau was visiting scholar with the BIS, whose hospitality is warmly acknowledged. We are to grateful to Magdalena Erdem for her invaluable assistance in preparing the paper. We also thank Laura Rosner for assistance with additional sources located in New York. We thank Richard Cantor, Robert McCauley, Mira Wilkins and seminar participants at the Bundesbank and London School of Economics for their comments on previous drafts. Caveat: The views expressed here are those of the authors and do not reflect those of the Bank for International Settlements. Corresponding author: [email protected]

2
The role of rating agencies in setting the stage for the financial market turmoil that erupted in mid-2007 has been hotly debated as of late. While arguments had for some time been made that the ratings process for structured financial instruments exacerbated conflicts of interest (Partnoy 2002, 2006), the origins of the recent crisis in securitisations of sub-prime mortgages has provided further impetus to these concerns and a multitude of proposals for revised regulatory oversight of rating agencies have surfaced across the globe.1
Credit rating agencies have long been a lightning rod for criticism when financial markets were perceived to have failed. Following the East Asian crisis of 1997, many observers suggested that ratings agencies had amplified business fluctuations through hasty downgrades (Reisen & Von Maltzan 1999, Ferri, Liu & Stiglitz 1999). Rating agencies came again under scrutiny following the Enron debacle: some argued that the agencies had waited too long to voice doubt about the ailing conglomerate.2 This was followed by the adoption of the Credit
Rating Agency Reform Act of 2006, which was intended to increase competition in the rating industry.3 By contrast, many of today’s critics view competition among agencies as a mechanism that contributed to a lowering of rating agency standards.4
The debates of the past decade raise the question of how and why rating agencies came to be used as a basis of regulatory frameworks in the first place. Given the recurrring criticisms of agencies whenever financial markets fall into turmoil, such a decision may appear to have been ill advised.5 The irony, however, is that rating agencies were discovered by regulators precisely in a period of deep distrust towards the market mechanism. The collapse of stock and bond markets that followed the Great Crash of 1929 had led to accusations of “banksterism”. Banks, it was said, had failed to address the conflicts of interest between their role as gatekeepers and the fees they earned from selling securities to the public.6 It may have been of importance that some people within the rating industry had publicly expressed concerns about the conflicted role of banking intermediaries.
It was against this backdrop that the Office of the Comptroller of the Currency (OCC) - a department of United States Treasury that was in charge of supervising nationally chartered banks - took an emergency decision in 1931 that depended heavily on rating agency judgements. In the midst of a wave of defaults and plummeting bond prices in 1931, the OCC instituted formulae based on credit ratings to book the value of US national banks’ bond portfolios. The role of rating agencies was extended in 1936 when the OCC restricted the purchase by banks of securities with lower credit ratings. So while the current financial crisis
1The agreement reached between rating agencies and New York’s Attorney General’s Andrew Cuomo last June lends credence to this view as it was meant to prevent “ratings shopping”, in which new issuers play off rating agencies against each other in order to elicit the most generous credit rating. See “Status Cuomo; Credit-rating agencies”, The Economist, June 5, 2008.
2“Market watch; Post-Enron, All Eyes On Rating Agencies” Gretchen Morgenson, The New York Times, December 16, 2001.
3See Hill (2004) for a sceptical appraisal.
4See Financial Times, October 23rd 2008, on Waxman and Congressional hearings of rating agencies. Quote on competition bearing the blame. For an early discussion of the potential impact of ratings competition in structured finance ratings, see Cantor and Packer (1994); for a recent theoretical perspective on the problem, see Bolton et al (2008).
5As of December 3rd, 2008, the SEC (Securities and Exchange Commission) had not dropped explicit references to credit ratings from its own rules (Financial Times, “SEC set to crack down on credit rating agencies”, December, 4th, 2008).
6This point was initially made in the context of sovereign debts but it was then extended to all sectors of originations; see U.S. Congress, Senate (1932), Mintz (1951).

3
has raised questions about the widespread reliance of regulations on rating agency judgements, it was the financial crisis of the 1930s that led regulators to start depending on rating agencies in the first place.
In this article, our goal is to understand why rating agencies emerged from the Great Depression with a considerably enhanced status within the US financial system, securing regulatory license from banking supervisors. One hypothesis is that the agencies had outperformed markets and thus emerged as a natural tool for regulatory purposes. To address this question, we have gathered and analysed data on ratings and financial markets during the debt cycle of the 1920s and 1930s.7 We focus on foreign government securities, or the sovereign debt market. While this market was smaller than the corporate debt market, it nonetheless provides a useful test case of the performance of rating agencies. According to the conventional wisdom of the day, the sovereign market was where the abuse of investors by underwriting banks was the most rampant, and thus where the agencies’ role as a “conscience of lenders” might have been most valuable.8
We find little evidence to support this view. Rating agencies do not appear to have performed particularly well relative to financial markets in seeing the incoming mess approaching or judging relative risks of borrowers. When we compare the predictive power of agency ratings with that of synthetic ratings based on market yields, we find little that suggests superior performance could have been a critical motive for the initial delegation of a regulatory license to ratings.
The alternative view we articulate is the following: During the 1920s, rating agencies operated in an environment that was radically different from that of today. While today’s incentives have, at least in the minds of some critics, tarnished the credibility of rating agencies as much as that of banks, the conflicts of interest they faced during the interwar era–when the rating industry was in its infancy–were perceived as very different from those of banks. When problems hit in the 1930s, banks came under ferocious public criticism. But rating firms earned revenues from selling their Manuals instead of charging the concerns they rated. They were not at all involved in the origination of securities. Barriers to entry in the rating business did not appear particularly large. All of this protected the agencies against accusation of wrongdoing and they were not a target of public criticism and litigation. Therefore, the agencies were in the early 1930s a ready-made alternative to certification of asset quality by banks. And since the key problem of the time was one of complete distrust in the ability of markets and private financial institutions to set prices correctly, ratings became a valuable and politically acceptable tool in the hands of regulators.
This paper stands at the confines of neighbouring literatures. One is the law and economics literature that has dealt with the relation between regulation and rating. West (1973) argues that during the 1930s bond yield spreads for bonds with lower credit ratings were larger than could be explained by fundamental factors. He suggests that this owes to the emergence of regulatory frameworks that discriminated against these bonds. Another relevant literature is the macroeconomic history literature that has studied the interwar sovereign debt boom and bust cycle. This literature has ignored ratings but has looked at bond performance and default. Examples of this literature include Eichengreen and Werley (1988). A third thread is the finance literature that has questioned the wisdom of the Glass-Steagall Act’s separation of commercial and investment banking. This literature, which has focused either on sovereign or corporate debt, has used evidence on ratings to gauge the relative performance of
7On the history of lending booms and bust a useful survey is Eichengreen (1990).
8U.S. Congress, Senate (1932), Winkler (1933), Lewis (1938), Rippy (1950), Mintz (1951).

4
intermediaries. For instance, Kroszner and Rajan (1994) compare the quality of the portfolio underwritten by investment banks versus commercial banks’ security affiliates using Moody’s and Poor’s ratings as benchmarks. There also exists a closely related business history literature that has looked at individual banks’ performances using ratings as a metric (Cleveland and Huertas 1986).
Another set of relevant work comprises studies devoted to studying the performance of ratings over various time periods. Hickman (1958) and (1960) examined the performance of American corporate bonds from 1900-1943, looking at default rates across rating categories. Related exercises have since been performed by numerous academics (Atkinson, 1967; Altman, 1989). Today, rating agencies regularly report similar evidence in their bond default studies, some of which look back as early as 1920 (e.g. see Moody’s (1997)). Moody’s (2003), S&P 2007, and Fitch (2007) provide extensions of default studies to sovereign ratings. In general, the extant research has documented a consistently negative association between default rates and credit rating categories. However, we are not aware of previous work that has compared the performance of credit ratings in distinguishing among default risks in the interwar era versus the performance of market-implied rankings of risk, as we shall do here.
The remainder of the paper is organized as follows. Section I reviews some salient features of the boom-bust cycle of the interwar period. We document the rating agencies’ abrupt rise from relative obscurity to a tool of regulatory intervention in the 1930s. Section II discusses the dataset, the differences in rating policies among agencies, and the surge in sovereign defaults across many rating classes during the 1930s. Section III reviews some conventional criteria for judging credit agencies performance, applies these to our new dataset and provides some insights on the performance of sovereign ratings in the interwar period. Section IV reexamines the rationale for the increased regaultory use of ratings in the 1930s. In conclusion, we provide some lessons that may be useful for the current debate.
Section I. Sovereign Rating’s Regulatory License in the Interwar
Sovereign rating as we know it today was born in the United States during the interwar period. Henry Varnum Poor first published a Manual of the Railroads of the United States in 1868 and Moody’s first manual for corporate securities was released in 1900. They respectively began publishing ratings for corporations and railroads in 1916 and 1909. But it was not until 1918 that rating agencies started reviewing sovereign and sub-sovereign entities, when Moody’s published its first Governments and Municipals handbook. Moody’s move into sovereign ratings was soon followed by other agencies that already existed or were being created. We have sovereign ratings from Poor’s since 1922, and from Fitch and Standard Statistics since 1924.
European markets, by contrast, although characterised by heavy investment and trading in foreign securities during the 19th century, never developed comparable products (Feis 1931). Nineteenth century publications for the London Stock Exchange, such as Fortune’s Epitome, did occasionally contain rating formulae and tables which provided a sorting of selected sovereigns according to some metrics of creditworthiness, but such assessments were not produced or provided systematically. In Paris, another major venue for sovereign bond investment, ratings were occasionally produced in at least one leading commercial bank, but only for internal purposes.9 A key difference of these ratings with the later ratings produced by the bond rating agencies is that issuers, rather than individual bonds or securities, were
9See Flandreau and Zumer (2004), pp. 27-29, Flandreau (2003).

5
being assessed. In any case, available assessments of sovereign risk remained partial and unsystematic.
Rather than depend on ratings, investors in Europe were satisfied with relying on intermediaries’ reputations. In the pre-rating era, underwriters performed some certification and monitoring for investors. Flandreau and Flores (2009) report strong evidence of a mapping of underwriters’ prestige onto the grade of sovereign borrowers, with leading merchant houses such as Rothschild and Barings signalling lower default risks by sovereign borrowers. Even during the interwar period, when ratings were being used in the New York market, ratings do not appear to have gained traction in Europe. Lord Kindersley, of the house of Lazard in London, stated before the Macmillan Committee that “if we put our name to [an issue] we really say to the public: ‘We have looked thoroughly into this, we thoroughly believe in it, and we can thoroughly recommend it”.10 The emergence of independent financial advice in the form of published manuals including ratings is therefore something of an American specialty and its reasons still remain to be fully understood.
Partnoy (2001, p. 5) portrays the business of rating as a fairly minor one during the 1920s. He notes that “early rating agencies were small and only marginally profitable”, and suggests that rating agencies were only propelled to the forefront of financial markets with the emergence of and receipt of a “regulatory license” in the 1930s. This was when regulators began to rely on ratings, effectively providing the agencies with property rights over certain forms of quality certification. At that time, the agencies were probably less fundamental a part of the financial system. Certainly they did not enjoy the kind of prestige or power that recently led a well-known columnist to compare them (favourably) with a “superpower”.11 When the US Senate Commission on foreign bonds convened in 1931 to discuss sovereign bond market practices it summoned a large number of witnesses, but did not call anyone from the ratings industry. Instead, private bankers, public officials, and economists involved in advising such as Edwin Kemmerer, were examined.12
On the other hand, the relevance of ratings – sovereign and other -- in that early period should not be discounted too extensively. Growth in ratings demand and supply was obviously fuelled by the 1920s’ boom in the New York securities markets. The timing of the 1920s expansion of debt issues (sovereign and corporate) coincided with agencies’ entry into the market. By the time the stock market crash of 1929 occurred the agencies had already secured attention in descriptions of the NYSE (Dice 1926). This and other anecdotal evidence suggest that there was a rising demand for informed opinion about sovereign and other credit risks. Harold (1938) provides extensive evidence of a growing use of ratings by investors and government agencies.13 He suggests that the price of the Manuals and their availability on bank facilities limited individual demand for subscription to the manuals but states that institutional investors were important customers.14 He refers to Fowler (1928) and Robinson (1929) who describe how some investment trusts created during the 1920s used ratings to
10Macmillan Committee, Minutes of Evidence, p. 77.
11 Thomas L. Friedman, interview, Newshour with Jim Lehrer, PBS, February 1996.
12Further, the hundreds of pages of testimony do not contain, as far as we can tell, a single reference to the agencies or to their opinion, even if the Senate Commission met only a few weeks after the Office of the Comptroller of the Currency’s ruling on the role of ratings for booking bond prices.
13Harold (1938) is the principal source on this. This is where we draw most of the evidence in this section.
14Harold (1938, p. 25).

6
provide investors with reassurance on the solidity of their portfolio.15 That trusts gave producers a kind of de facto trustee status suggests that they must have been perceived as somewhat reliable. In this background, the gradual emergence of regulatory uses of ratings and its acceleration after the surge in defaults and bond market collapse in 1931 is less of a discontinuity than Partnoy argues. We will come back to this in the last section of the paper.
The increased regulatory reliance on ratings occurred in the midst of a fragmented banking system in the US, where different authorities were in charge of supervising different institutions. National banks had a federal charter and were supervised by the Office of the Comptroller of the Currency, a branch of the Federal Treasury. State banks had a State charter and were supervised by State authorities. All banks that decided to become members of the Federal Reserve System got to be supervised by the Federal Reserve Banks. But all bodies came to rely on ratings in the 1930s.
The initial use of ratings in financial supervision addressed the question of how credit risky securities should be valued. The post 1929 asset price deflation created balance sheet problems for US financial institutions. According to Osterhus (1931), the Federal Reserve Bank of New York began in 1930 weighing reporting banks’ bond portfolio quality using established ratings.16 A more dramatic move was the OCC’s ruling of September 11, 1931. At the time bond prices were plummeting in the wake of the German financial crisis and a run on Sterling. The OCC ruling stated that all Federal, State, and Municipal US securities, as well as other domestic and foreign securities belonging to any of the top four categories of ratings could be booked by banks at face value (Harold 1938, Cantor and Packer 1994, Partnoy 2001), while other securities and defaulted bonds should continue to be marked to market. According to the Wall Street Journal, the regulation really formalized the administrative guidance already introduced in 1930, and was supported and endorsed by market participants.17 Harold’s classic account (1938) heavily emphasizes the September 1931 ruling as of critical importance to the credit rating idustry, as have subsequent authors.18
Several points regarding the decision, however, are worth mentioning. First, it carefully abstained from referring to the ratings of any specific agency but only referred to the grades given by “statistical corporations”. Second, the ratings could come from any of the agencies,
15Robinson (1929), pp. 557-8. For instance, the United States Shares Corporation, created 1927 advertised the following prudential rules for its investment policy: no securities rated below Moody’s B; at most 10% securities below Moody’s Ba; at most 50% below Moody’s Baa; at least 20% of securities above A
16In contrast to risk-weighted asset approach to assessing bank capital requirements (eg the standardized
approach of the Basel II framework), weights in this case were increasing with credit quality: 100% for securities rated in the top notch category, 90%, 80% and 50% respectively for the next three ones, etc. 17Harold (1938) quotes a “mimeographed ruling” by J. W. Pole, which he may have seen. We corresponded with the archivist of the OCC and it looks like the document would have to be recovered from primary sources, if it survived at all. The sources that are still accessible to us are the New York Sun of September 11, 1931, The Wall Street Journal of September 12, 1931. Harold (1928) gives the Commercial and Financial Chronicle of September 12. However, the CFC essentially reprinted parts of the New York Sun article. A later article supporting the move was “New York Banks agree on Values”, Wall Street Journal, December 31, 1931.
18Sylla (2003), Partnoy (2001). It is of interest that after having made an article on the front page of the Wall Street Journal and another one inside the New York Sun, which was then picked up by the Commercial and
Financial Chronicle, coverage of the OCC 1931 ruling soon dissapated. To be sure, the month of September 1931 was a busy one for financial news.

7
implying that the highest rating was used, in contrast with modern practice.19 Third, as far as we can tell, the unpublished decision did not initially use the modern terms of “investment grade” and “speculative grade”, but relied instead on a separation between “low grade” and “high grade” securities, the latter being associated with ratings in the top four categories.20 Finally, the “cut-off” implied by the ruling appears to have been less conservative than the language of the agencies themselves might have suggested, since agency descriptions of their ratings associated very safe securities with the top three, and not the top four, categories. The language used to describe securities in the fourth category emphasizes the risks involved and imply that they ought to be dealt with by informed agents only.21
In subsequent years, similar trends could be observed in the supervision of members of the Federal Reserve System. State superintendents started relying more and more on ratings. Similarly, authorities supervising insurance companies began using ratings.22 Regulatory reliance on ratings soon intensified to include the proscription of the purchase of securities with low ratings. The Banking Act of 1935 vested the Comptroller of the Currency with the power to identify “investment securities” that institutions under its supervision would be enabled to buy. A similar arrangement was made for State banks that were members of the Federal Reserve System under Federal Reserve rules.23 In February 1936, the OCC ruled that national banks were now prevented from buying securities viewed as “distinctly and predominantly speculative”. No rating was provided for what would be a “speculative” security, but the wording “speculative” that is now widespread was born.24 A footnote stated that “the terms employed herein may be found in recognized rating manuals, and where there is doubt as to the eligibility of a security for purchase, such eligibility must be supported by not less than two rating manuals”.25
While there was initially some doubt regarding the exact cut-off associated with the 1936 ruling (some observers suggested the cut-off was at a higher rating level than the previous one), it gradually emerged that the target was again between the top four and lower grades. Greater conservativeness was rather reflected in the implicit move from the top rating to the second best rating as the one which “counted” (when there were multiple ratings), and in the formal prevention of any purchase of a security not over the cut-off. The new regulation represented a significant new constraint, for as shown in Table 1, the percentage of securities falling below the agencies’ fourth category had increased enormously between 1931 and 1936. An estimation performed by the Securities Tabulating Corporation of New York at the
19Harold (1938), p. 27. A complication also arises from the fact that one agency – Poor’s -- reported a number of what Harold (1938, p. 74) called “super-ratings” that only applied to top US securities and other “impregnable securities”. If the criterion of focusing on the top four categories was applied literally, very few securities would be eligible for booking at face value using Poor’s ratings. On the other hand, we have not seen the unpublished mimeographed document and we cannot rule out that the ruling did adjust for this. With regard to modern practice, see, for example, the standardised approach of the Basel 2 framework, whereby in the case of multiple ratings, the second highest rating is recommended for the calculation of risk weights (BIS 2006).
20See Wall Street Journal, September 12,1931. However, Harold (1938, p. 28) describes the OCC’s decision as identifying an “investment grade” category.
21For instance, bonds have “moderate investment merit”, “require close discrimination”, are “business-men bonds”, etc. See Fitch Bond Book 1930, Moody’s Manual of Investment 1929, Poor’s Ratings 1925, Standard
Bond Book 1924.
22Harold 1938, p. 29.
23Harold 1938, p. 29.
24“Comptroller unlikely to define ‘Speculative’ securities”, Wall Street Journal, April 29, 1936
25Harold (1938, p. 30).

8
time showed that around half of the bonds traded in the NYSE could no longer be purchased.26 By 1936, speculative securities, as they were now known, outnumbered higher grade ones.
Unlike the provision of 1931, the 1936 ruling triggered strong protests from the banking and finance industry.27 Since bond prices were rallying, bankers did not want to be excluded from the bull market. In addition, bankers argued that the new ruling penalized smaller companies who were not covered by rating agencies. Bankers also didn’t hesitate to criticize ratings as metrics of credit risk: they noted that relying on ratings could create a deceptive sense of security, and that ratings tended to be backward looking. There was also criticism that the agencies’ past record did not suggest they had outsmarted markets.28 One resolution from a bankers’ association quoted by Harold (1938, p. 32) stated that “delegation of the judgement as to what constitutes a sound investment is unprecedented in our history and wholly unwarranted by [the agencies] records in the past”. The OCC had eventually to back off somewhat, and provided banks with slightly greater freedom over the identification of speculative securities.29 To conclude, not only did the 1930s usher in the emergence of a central role for rating agencies in financial supervision, but the decade also provided a preview of future criticism opposing this role.
Section II. Bond Issuance and Rating Activity in the Interwar Era
Bond Issuance and coverage
During the interwar period, the New York bond market experienced a classic boom-bust debt cycle. Total bond issuance grew rapidly during the 1920s, both for foreign government and other bonds (Figure 1). Foreign government bonds issued over the entire decade amounted to $4.3 US billion, slightly more than 15% of the total issuance of domestic corporate bonds. The largest sovereign issuers were Canada ($575 US million), Argentina ($462 US m), Chile ($304 US m), France ($300 US m) and Belgium ($289 US m). Foreign issues peaked in 1924 when they were more than 25% of domestic corporate issuance. By contrast domestic corporate issuance reached a maximum in 1927. However, bond issuance contracted dramatically after 1930, following the stock market crash and ensuing credit crunch, with foreign bond issuance essentially vanishing.
The statistical agencies covered securities through a variety of tools. Moody’s for instance, had two main products: a set of annual publications (known as Manuals) organized by type of investment (Municipal & Government, Banks and Finance Companies, Industrials, Public Utilities and Railroads), and a higher frequency Investment Letter, containing updates on selected instruments. The yearly publications of Fitch and Standard were known as the Bond
Books, while Poor’s called their annual publications Volumes. All the rating agencies had a specific volume for Governments and municipals.
Figure 2 shows the number of sovereign securities listed on the NYSE in 1929 and the number of these securities that were covered by the agencies’ volumes of that year (1929). Listing in the NYSE resulted either from offerings on that market or cross listing of securities
26Harold (1938, p. 31).
27“Banks oppose eligibility rules for investments”, Wall Street Journal, March 13, 1936; “Security regulations opposed by bankers” Wall Street Journal, June 25, 1936.
28“Security regulations opposed by bankers”, Wall Street Journal, June 25, 1936.
29“Banks given more discretion over investment”, Wall Street Journal, May 23, 1936. One is reminded of the poem published in 1903 by the Anglo-Colorado Mining Guide: “In modern speculation/Your language you must choose./It’s an “investment” if you win/ But “gambling” if you lose”.

9
initially traded abroad. Coverage of instruments listed in the NYSE by Moody’s, Poor’s and Standards was close to exhaustive (missing securities would usually be covered in the next volume). Fitch was slightly less complete (about 90%), had thinner and less detailed volumes than the others. Bonds omitted by Fitch fetched low to disastrous grades with the other agencies.
In an age of largely free capital mobility, New York was not the only market available for US investment. Other markets of greater or lesser importance to US investors could also be covered. One prominent example is the London market. While Fitch, Poor’s, and Standard Statistics focused on New York exclusively, Moody’s, which had a London branch, also covered instruments traded in that market. It also rated a number of domestic currency local bonds not listed in New York or London.
Symbology
Unlike today’s readily comparable scales, rating symbols were a challenge to match across agencies. The A, B, C, D ranking was common to all four agencies, but different firms used different keys for granularity, although always sorted out through three sub-rankings. For instance to decompose the top A category, Fitch used AAA, AA, A, Moody’s Aaa, Aa, A, Poor’s A**, A*, A, and Standard A1+, A1, A. Complications included Moody’s lack of a letter D letter and Poor’s initial use of a “super-rating” category above A** that was “practically inapplicable” to most securities (Harold 1938, p. 74) and was discontinued in 1939.
Harold (1938) gives product differentiation as one likely reason why agencies did not initially seek consistency. Differentiation would have also enabled agencies to interpret own forecast errors simply as owing to different “meaning” of the symbols. That said, the use of ratings in regulation implied at some level that the ratings could be compared. The OCC’s reference to the top four ratings assumed that at least the difference between these ratings and lower ones was consistent across agencies. This usage may have provided incentives to agencies to make their ratings categories more consistent with each other over time.30
Based on the language used by agencies31 to describe the meaning of the ratings and by his own extensive survey of market participants, Harold (1938) establishes a “majority interpretation” of the correspondence across the individual agency ratings (Table 2). This equivalence system is consistent with the later evolution which produced a convergence across rating keys. Unless we state otherwise Harold’s majority interpretation is the key that we use in this article. It is important to emphasize however, that in most of the analysis that follows, a strict correspondence across ratings is not needed.
Ratings Composition
Previous writers have emphasized the deteriorating quality of the portfolio of sovereign bond issued in the NYSE before 1929 (Mintz 1951) but an examination of ratings composition
30We do not know whether the OCC’s decision of 1931 adjusted for Poor’s super ratings. If it did not, it may
have persuaded investors not to refer to Poor’s manuals because that would have forced them to do more write offs. This may explain that Poor’s deleted its super-ratings (A*****, A****, and A***) in the late 1930s. The reduction of Poor’s rating range downgraded top bonds (U.S. Government, British, and Canadian bonds in 1938 and 1939) and amalgamated them into the new current highest rating . 31At the top, Fitch described AAA securities as “highest”, while Moody’s Aaa were “highest”, Poor’s A** “very
high” and Standard’s A1+ “highest class”, suggesting a fairly good match. At the bottom, the D letter meant “slight or nil” to Fitch, “practically valueless” to Poor’s and “doubtful value” to Standard. Intermediary cases may have involved some overlap, however. For instance, Fitch’s B was “speculative” while Standard’s B was “semi-speculative” (“speculative” was C1+).

10
reveals a sharp deterioration in quality after 1930. The evolution of the distribution of outstanding ratings per category is tracked for two rating agencies in Figure 3.32 For Moody’s, while only about one-fifth of the issues were rated Ba and below in 1930, that number had risen to 40% by 1933. The case of Fitch shows an even more dramatic change: while on average less than 15% of their 1930 ratings were BB and below, by 1933 more than 60% were in that category.
Since new issues were essentially discontinued after 1930, and rating agencies did thus not increase their coverage, the sharp deterioration in rating composition reflected many more downgrades than upgrades. Figure 4 tracks upgrades and downgrades for the four agencies. Indeed, there were no upgrades and a large number of downgrades between 1931 and 1934. In 1932 Fitch downgraded 90 percent of their foreign government securities, Moody’s 80 percent, and Standard Statistics and Poor’s close to 50%.
Defaults
Defaults were a powerful driver of the deterioration in ratings during the period (For agencies other than Moody’s, defaulted securities were recorded as D-rated securities and maintained as part of the rated security population). As is well known, the 1930s wave of sovereign defaults was unprecedented. Defaults surged across many rating classes. By December 1939, more than half of countries that had borrowed on the NYSE in the 1920s had defaulted, accounting for 48% of the amount of sovereign and quasi-sovereign securities issued there. And more than four-fifths of the amount of sovereign and quasi-sovereign bonds issued in the 1920s that defaulted in the 1930s did so between 1931 and 1933 (Figure 5).
To the extent that the agencies had generally remained upbeat during the 1920s, with upgrades greatly outnumbering downgrades (see Figure 4) and revised drastically their perception after 1931, questions about the stability of ratings through the cycle may be raised by the early experience of sovereign rating. On the other hand, it may simply reveal that the bond market collapse of 1931 was just as unpredictable for rating agencies as it was for markets. The next section takes a closer look at the record and assesses in greater detail the performance of the rating agencies.
Section III. Agencies’ Performance
Recent commentators have suggested or implied that the regulatory license rating agencies received in the 1930s drastically modified the set of incentives facing rating agencies. For instance Goodhart et al. (2008) write that “in the early 1930s, incentives for [Statistical Ratings Organizations] to produce reliable information for investors were complicated by introducing ratings into the regulatory process.” Partnoy (2001, p.5) also suggests that the advent of a regulatory license dramatically changed the rules of the game: “Throughout the 1920s, credit ratings were financed entirely from subscription fees, and rating agencies competed to acquire their respective reputations for independence, integrity, and reliability. In a market with low-cost barriers to entry, a rating agency issued inaccurate ratings at its peril. Every time an agency assigned a rating, that agency’s name, integrity, and credibility were subject to inspection and critique by the entire investment community. Reputational considerations would have been especially acute in such an environment.” While agencies’ reputations are also at stake today, the existence of competing concerns, namely, the provision of fees by issuers being rated as a result of the issuer-pay business model, present
32As the lists of securities rated by the two agencies were not identical, differences may represent differences in composition of issues rating as well as differences in the ratings assigned to common borrowers. However, the charts do not differ greatly if only jointly rated issues are used.

11
countervailing pressures. Thus, implicit in the modern notion that regulatory usage hampers ratings performance is the view that the rating agencies must have done better previous to the change in the regulatory environment. Yet we do not know that this proposition is true.
One way to approach this matter is to look at the way ratings were being performed during those years and whether this differed from later practice. Gaillard (2008) studies the work of rating agencies and argues that when they began rating sovereign bonds, US agencies relied on information that was publicly available. Econometric investigation suggests that the determinants of the grades they gave reflected the contemporary consensus views of the major factors likely to affect sovereign credit risk. Among the 25 key criteria listed by Moody’s (1924), wealth, monetary stability, external debt, past default and institutional quality show up as particularly large and statistically significant determinants of ratings during the 1920s.
Interestingly, the principal interwar determinants do not differ much neither in size, nor in significance, from the determinants of sovereign credit ratings in the post-WWII era identified by Cantor and Packer (1996).
In this paper, we seek to take a closer look at this question by organizing an explicit comparison of ratings reliability among different agencies and more importantly between these agencies and yield premia. Yield premia are a natural benchmark, because the standard charge of the time against bankers was that they had brought bad bonds to market at too low a yield and subsequently manipulated bond prices to cheat investors. It is natural in this context to ask whether the rating industry as a whole might have been seen as an inlet of serious opinions in a sea of banksters.
Ratings at and before default
An obvious indicator of the level of ratings reliability assumed in the use of letter-grade cut-offs is the extent that agency ratings are able to anticipate actual defaults. To what extent did the levels of ratings as well as the movement ahead of default events reflect their risk? To what extent were investors alerted by the rating agencies in line with the assignments which were viewed as “low grade” in the September 1931 ruling?
In fact, it appears that so-called high-grade ratings provided little guarantee against default during the financial crisis. After 1930, defaults surged across all rating classes. The composition of the ratings for the 4 rating agencies at the time of default for 41 defaults of the sample is presented in Figure 6. More than one-half of all default were rated high-grade (the equivalent of BBB or higher) by at least one agency at the time of default. In the case of individual agencies, for Fitch and Poor’s, more than one-third of the defaulting issues were rated high-grade at the time of default. In the case of Moody’s, fully 46% were rated high-grade. This contrasts notably with the general default experience of the last two decades of the 20th century.33 The only exception to the very common occurrence of high-grade defaults during the crisis was Standard Statistics, which had only 1 of the 41 defaults rated high-grade at the time of default.
The incidence of high-grade defaults at the time was not merely due to bonds at the fourth highest letter grade level. In the case of the other three agencies, a good chunk of the high-grade defaults occurred at ratings even higher than the fourth highest letter grade level:
33For instance, Cantor and Mann (2003) state that the average Moody’s rating for defaulting issues during 1983-2001 is CCC.

12
defaults of A grade (or equivalent) or higher accounted for more than one-half of the high-grade defaults. 34
Even starker results obtain when we move a bit further back in time, and check the ratings of defaulted issues one year ahead of default (Figure 7). Between 30% (Standard) and 70% (Moody’s) of the defaulting bonds were rated high-grade one-year ahead of default. This compares to an average Moody’s rating one-year prior to default of B in the 1983-2001 sample mentioned above. Again, there are many future defaulters rated A grade (or equivalent) or above one-year ahead of time (more than half the high-grade defaulters). Even more surprisingly, only 41% of defaulters with high-grade ratings one year before default were downgraded to low-grade before default. Excluding the case of Standard ratings, the percentage declines to 31%.
Correspondence of ratings to default rates
Default rates, which control for the quantity of issues outstanding in different ratings classes, provide another take on the issue of ratings reliability. The use of ratings in regulations assumes, at some level, that ratings provide a good measure of the absolute risks of default, or the degree of probability of default or expected loss associated with a particular rating category. However, evidence for recent periods does suggest agency ratings have not been a particularly reliable guide to absolute credit risks over time – the likelihood of default associated with any particular rating tends to drift over time (Cantor and Packer, 1994).
As might be expected, variability is present in default rates on various horizons in the interwar era (Tables 3-5). For example, the 1-year high grade default rate for Fitch which averages 3% in the years 1928 to 1937 ranges between 0 and 16% for individual years; at the longer horizon of 5-years, the high-grade default rate ranges for Moody’s ranges between 2 and 32%. This variability is much greater than that documented in the post-era – likely indicative of the degree to which the financial crisis and great depression were completely unanticipated and beyond cyclical norms.
In addition to variability, the default rates at all horizons show extremely high default rates for high-grade credits, nearly an order of magnitude difference at all horizons relative to recent experience. For instance, the average high-grade one-year default rate (for the years 1928-1937) of between 2-4% for the four rating agencies (Table 3) dwarfs Moody’s worst single-year default rate for investment-grade credit during 1983-2001 of 0.5%. Similarly high-grade default rates at the three year horizon (for the years 1928-1937) that average between 8-13% for the four rating agencies (Table 5) correspond to a worst year of 2% in the recent Moody’s rated sample cited above.
Neither do the default tables provide ringing support for the notion implied by the use of multiple agency ratings in regulation that the absolute scales of the ratings agencies – ie the correspondence of their ratings to default – were strictly comparable in the interwar era. Moody’s 1 and 3-year Baa default rates of 15% and 35% corresponded to ranges for the other three agencies of between 5-8% and 16-20%, respectively. The degree and consistency of the differential may be indicative of the fact that in the interwar era, before the correspondence of ratings implied by regulation was well-established, Moody’s could well have thought of their
34No bond was granted the top rating (AAA/Aaa/A**/A1+) at the time of default. One bond that was top rated
prior to default (the 1924 German bond, rated AAA by Fitch four years before its default). Two securities were rated in the second top category at the time of default: the Dominican bonds rated AA by Fitch. Several bonds were rated in this category before their default (the Dominican bonds (Fitch and Standard Statistics), the 1924 German bond (Moody’s), the 1930 Cuban bond (Poor’s), the 1928 Panama bond (Fitch, Poor’s, Standard Statistics)). Many bonds were rated A by the agencies at the time of default or few years before.

13
Baa rating as corresponding to a higher default rate than the other ratings agencies thought of their BBB-equivalent.35 Another example is provided by Standard’s higher-grade rating default rates, which were consistently lower than those of the other three agencies at all time horizons, suggestive of a different cut-off for Standard Statistics than the other three agencies for high grade credits.
Relative Risk, Cumulative Accuracy Profiles and Accuracy Ratios
The above discussion focused on the variability and levels of absolute risk at different rating levels. In fact, Moody’s and other rating agencies have for some time indicated that relative rating accuracy is the primary objective of their rating systems (eg Cantor and Mann, 2003). To be useful, ratings at a minimum should be able to provide a good ordering of relative default risk among different credits. Since for the most part relative creditworthiness does not change dramatically over time, producing consistent relative rankings allows rating agencies to maintain ratings stability through the business cycle, with relatively infrequent and small changes that are unlikely to be reversed in a short period of time.
One indicator of the ability of rating agencies to order relative risks is the degree to which default rates tend to increase as ratings decline. Almost all academic studies on the topic show a strong negative relationship between the two at relevant time-horizons. Tables 3-5–despite the documented variability in default rates over time and across agencies--are all consistent with default rates rising as ratings decline at the 1, 3 and 5 year time horizons for all years before and during the financial crisis.
However, documenting the simple existence of a negative relation between ratings and default rates or recovery rates is probably unsurprising and a fairly weak test of ratings reliability. Further, it does little to distinguish between the discriminatory power of one ratings system versus another. A more precise assessment of a rating system is provided by the so-called cumulative accuracy profile (CAP) and associated accuracy ratio, which is described in Cantor and Mann (2003).
Like default rates, CAPs and accuracy ratios can be calculated for any cohort of securities at a single point in time for any given time horizon. As shown in Figure 8 below, the CAP curve indicates the share of total defaults among the borrowers as a function of the share of the lowest-rated borrowers in the sample. Namely, for any given share of the lowest-rated borrowers in the sample (eg. the lowest 10% of the sample), the CAP curve charts what percent of defaults in the sample they account for (eg 50%). The more the CAP curve veers towards the upper-left hand corner close to the vertical and horizontal axes, the greater the proportion of defaults that occurs in the lowest rating categories.
This representation of ratings performance is independent of the particular scales used by agencies as well as the absolute level of default rates. Comparison then only requires using identical cohorts of securities across identical time periods. It is made by graphing different ratings system on the same chart and looking for the one that always provides a higher proportion of defaults for ratings in ascending order. This is the case for ratings system 1 in Figure 8, which dominates both ratings system 2 and 3. Of course, it can be the case that different curves provide ambiguous signals about their relative accuracy. This is when different parts of the curve lie closer to the upper left-hand corner, depending upon the portion of the rating scale that is examined. This is the situation for ratings system 2 and 3, which cannot be compared to one another.
35In the post-war era; if anything, evidence suggests that Moody’s ratings likely corresponded to a stricter scale
than those of some other agencies (Cantor and Packer, 1997).

14
However, it is possible to distil the information of any cumulative accuracy profile into a single statistic, called the accuracy ratio. This is the ratio of the area between the CAP curve and the 45 degree line on the one hand, and the maximum possible space between the 45 degree line on the other hand, which can be estimated through an equation discussed in the appendix.
The accuracy ratio has a number of attractive properties: a) it is always larger for any curve that lies unambiguously above another; b) it effectively varies between -1 and 1, much like a correlation measure, where 1 represents maximum accuracy when all defaulters are assigned the lowest ratings, and c) it is invariant to changes to the aggregate default rate that do not also change the ratings distribution of the share of defaults.36
Results
In what follows, we compare the performance of the four agencies’ separate ratings, an average of their ratings, and a measure of “market” ratings. For the last measures, we use a method detailed in Breger et al. (2003) to transform yield spreads (collected using prices in the Wall Street Journal) into ratings. The need to match the population of ratings across the four agencies produces a set of 120 bonds, though only a subset of these are used for any single cohort since bonds enter in and exit the sample due to new issuance, redemption, default and so forth. The need to match agency ratings against synthetic ratings derived from yields produces a more limited set of around 70 bonds (for which prices are available), though again only a subset of the 70 applies to any single cohort.
We consider three horizons (one year, three years and five years). Moreover, to capture the performance over the wave of interwar defaults and downgrades we examine the one year ahead predictive performance of the various ratings between 1931 and 1936 (since there were no defaults in 1935, one year accuracy ratios cannot be calculated for that year). We look at the three years ahead performance for the (non-overlapping) cohorts of 1929, 1932, and 1935. And finally the five years ahead performance is examined for the non-overlapping cohorts of 1929 and 1934.
The results in Table 6 show that, quite apart from the issues of absolute scale differences discussed above, there were significant differences in accuracy in the ranking of relative credits among the agencies. Moody’s and Standard Statistics had the highest accuracy ratios (AR) among the 4 agencies in 50% and 40% of the cohorts examined, respectively, and one of these two agencies accounted for the second highest ratio in 50% of the cases. The performance comparison of ratings was for the most part invariant to time horizon. Differences in the accuracy ratios could be substantial: for example, the mean accuracy ratio over all cohorts at the five-year horizon ranged from 60% for the highest performing rating agency to 52% for the lowest.37
In an indication that the individual rating agencies might be getting separate, valuable, signals about the creditworthiness of sovereign borrowers, the accuracy ratios of the consolidated ratings (average rating) was often superior to those of each of the single agencies. The
36There are other schemes reducing the CAP to a single number with the above properties, but the key identifying assumption of the accuracy ratio of equation (1) is that the ratio, as calculated, weighs errors on the high end of the rating scheme equivalently to errors on the low rating end of the scheme. Equivalently, the cost of having a defaulting borrower highly rated (type 1 error) is weighed equally to the costs having a non-defaulter rated too low (type 2 error).
37Mean and median accuracy ratios were calculated over all available yearly cohorts, and thus contain
overlapping observations at horizons greater than one-year.

15
average rating scored higher on average than all of the individual agency ratings at the three and five-year horizons, with a mean accuracy ratio higher than each of the single agencies.
Finally, with regard to market versus rating agency rankings of relative risk, we report the difference between the accuracy ratios of the agency ratings, and synthetic ratings derived from market prices for the same cohorts in Table 7. (A negative number in any cell indicates that the agency ratings had lower accuracy ratios than the yield-based metrics.) The results suggest that market-based ratings modestly outperform agency ratings at the one- and three-year horizons, having a higher AR in about 16 of the 25 cases (4 agency ratings plus average rating over five separate years) at the one-year horizon, and a higher AR in two-thirds of the cases at the three-year horizon. At the longer 5-year horizon, actual agency ratings appears to outperform the yield implied ratings, though only modestly.38 That said, the difference in the accuracy ratios between ratings and yield-implied ratings at all maturities, while large for specific years and specific agencies, is relatively small when the mean is taken across all the cohort years. In sum, there does not seem to be anything specific or exceptional about the performance of rating agencies in assessing relative credit risk over the interwar period compared to what could have been inferred from market prices. At the same time, they were still pretty new to the game and this is only half surprising.
Section IV. Conflict of interest, legal franchise and regulatory license
We find therefore that agency ratings did not prove to be particularly good leading indicators of the problems of the interwar period. Consistent with this data-based inference is the general macro outlook presented by Moody’s Investors Service on January 4, 1929, which stated that the “prosperity which has characterized this country with only moderate setbacks since 1923 is likely to continue without great variation well into the future”.39 All this suggests that the pre-regulatory license era characterized, according to previous authors, by different incentives than those faced today, was not associated with significantly greater predictive ability on the part of rating agencies. In particular, the agencies did not outperform the market mechanism and the pricing of bonds by market participants. This conclusion leaves us with a puzzle. We need to understand the rationale for the increased regulatory use of ratings in the 1930s. In what follows, we argue that ratings – and only ratings – met both a necessary and a sufficient condition to emerge as an instrument for supervision.
Our starting point is the following remark. Serious financial crises such as that of the 1930s, or the sub-prime crisis today, are characterized by a failure of the price discovery mechanism. Distress sales and the withdrawal of many investors from financial markets not only result in severe price declines but often the inability to transact at any price. Not only are bad securities shunned, but so are fair ones and even good ones. The effects of such shocks to market liquidity are enormous and threaten economic stability. One implication of this is that the frequently heard suggestion that regulation could rely on market prices as has been repeatedly argued in various places misses a critical point.
An alternative solution is to provide support to good securities, since the deep discounts during crises or on occasion even the disappearance of liquidity altogether for these securities does not represent a problem with their intrinsic value. This rationale goes back to early
38As reported in Table 7, though the accuracy ratio tends to be higher for actual agency ratings than yield-based
ratings for the two selected cohorts at the five-year horizon, the mean difference calculated across all annual cohorts find agency ratings to (slightly) outperform market yields only in the case of Moody’s ratings. The improvement in the ratings performance relative to the YIR at longer maturities parallels the results for more recent samples using Moody’s ratings (Cantor and Mann, 2003). 39New York Times, Jan 4, 19. 29.

16
contributions to the theory of lending of last resort. Bagehot (1873/1919, p. 194-5) emphasized the need to lend freely on “good” securities. He also provided insights on what should be considered as good securities.40 Extensive support to holders of such securities, he concluded, would check unjustified price depreciation.
Identification of eligible bonds thus becomes the crux of crisis management. It is a peculiarly difficult issue, because it is in the nature of crises to cast doubt on the significance of previously well-established values. If all values go down, and if illiquidity quickly converts itself into insolvency, how are we to tell good from bad? We argue that two conditions must be met. The sufficient condition is that the sorting of securities to handle the crisis is socially and politically acceptable. This means that a critical degree of consensus should exist on what a good security ought to be. Any sorting system that is robust to political criticism can become an eligible instrument of crisis management. The necessary condition is that this system does exhibit a fair degree of separation, in normal times but more importantly in periods of crises, with the standard price discovery system, since it is this very system, which is said to malfunction. To summarize, what is needed to handle a crisis, is a kind of price system that is not the price system. If such a solution to this “catch-22” problem does exist, then public authorities can lay to rest the malfunctioning parts of markets and restore order by relying on a parallel pricing system.
We argue that ratings provided a response. To see this, we need to show that relying on ratings as was done in the early 1930s provided a corrective to what was perceived as defective market pricing. For this, we use a randomly drawn sample of US corporate and foreign government securities rated in the third and fourth top categories on the day after the publication of the ruling, and compute the nominal benefit from booking at face value as a percentage of mark-to-market valuations. The reported computations are made using Moody’s third and fourth notches (A and Baa) but similar results would obtain for other agencies. For corporate securities the wedge between is 16.7% (A) and 32.8% (Baa). For foreign government and sub-national securities, for which the collapse in prices had been reported to have been much worse, the boost is huge: 75.6% (A) and 82.1% (Baa).41 In other words, in the midst of the crisis, ratings initially emerged as a powerful corrective to a financial panic that sent bond prices plummeting across the board. According to the New York Sun, quoting the Comptroller of Currency: “the banks have been permitted to enter in their assets the full value of [high grade] bonds […] Mr Pole stated that depreciation in these high grade securities has been due purely to market fluctuations, and that to permit banks to report them at face value is now and has always proved sound and reasonable.”42 Similarly the Wall Street
Journal reported that “depreciation in high grade securities has been due purely to market conditions, and that to permit banks to report them at face value is […] sound and reasonable. […] Issues given the four highest ratings by statistical corporations did not have their intrinsic value impaired by market fluctuations.”43 We conclude that ratings met the sufficient condition described above, namely, they were a sorting instrument to correct a perceived failure of the price discovery mechanism.
40. He found that British government debt and also prime corporate bonds ought to be eligible.
41Computations based on prices as of September 12, 1931 (Wall Street Journal, September 14, 1931). For details on how the sample was constructed, see appendix. For a related interpretation, see Morton 1939. He argues that the use of ratings enabled banks to insulate themselves from the bond price debacle while ensuring the quality of their portfolio.
42New York Sun, September 11, 1931.
43“75% of bonds valuations safe”, Wall Street Journal September 12, 1931.

17
The second part of our argument has to do with the social acceptability of ratings. While some recent authors have emphasized the different set of incentives faced by rating agencies in the interwar period, they have not emphasized the implications that this may have had on the public’s perception of the agencies. It is in the nature of crises to bring a crop of regrets, and students of history are familiar with the blaming game that follows disasters. Crises, when they reveal wrongdoing, create pressures for political action. To the extent that the crisis is viewed to have been created by improper behaviour, then the offenders must be punished. And if it has been created by improper structures, these ought to be changed as well.
The interwar stock market collapse and bond debacle provided plenty of opportunity for complaints. The soil for such accusation had been fertilized for a long time by concerns expressed publicly by senior voices such as Brandeis (later Justice Brandeis of the Supreme Court) an open critic of the agency problem associated with delegation of portfolio management to bankers (Brandeis 1914). Already before WWI, the Pujo Commission and investigation of the Money Trust had emphasized the conflicts of interest posed by investment banks’ underwriting and intermediation role. Critics included prominent bankers such as Thomas Lamont of the firm JP Morgan and members of the US state department. They noted that the originate and distribute model, whereby underwriting firms were receiving fees from the concerns whose bonds they floated, was flawed by inevitable conflicts of interest. Among the most vocal proponents of this view was Max Winkler. The only member of Moody’s editorial board between 1922 and 1927 to be endowed with a PhD, Winkler supervised foreign government bond ratings in this firm. He left Moody’s and launched his own series of manuals in 1928 (Winkler’s Manual of Foreign Corporations, published by Overseas Statistics). Later, he wrote what became a reference book on the 1920s sovereign bond market cycle in which he drew on his experience at Moody’s (Winkler 1933). The debate over bankers’ conflicts of interest during the 1930s is a critical aspect of the evolution of the rating industry during those years. During the 1930s concerns were expressed in newspapers and also in a succession of Senatorial commissions, starting with the Senate Commission of 1931 on the sale of foreign securities in the US and continuing with increasingly acrimonious overtones when Ferdinand Pecora led the Senate hearings (known as the Pecora Commission) into the causes of the Wall Street Crash of 1929. The recurrent, almost obsessive, theme of these hearings was concern with bankers’ conflicts of interest (Benston 1990, p. 64). These included and were not limited to accusations such as the following: a) bankers had misled the public about the quality of securities to cash in short-term fees; b) bankers were connected to Republican administrations and committed to their foreign policies; c) bankers supported foreign defaults on long term debts (held by ordinary investors) to protect their own short term loans to foreign governments (still in their books).
The rampant distrust of normal financial intermediaries – sometimes called “banksters” – was so prevalent that it became a major theme of Franklin Delano Roosevelt’s 1932 Presidential campaign. This distrust stands in contrast with the prevalent view of the rating agencies. As a result, bankers taken to task on specific bond issues they had underwritten gave contemporary ratings as proof of their sincerity. Benston (1990, p. 64) gives the example of the National City Company’s CEO Charles Mitchell justification of Anaconda Investments before the Pecora Commission by pointing to the positive outlook Anaconda had received from Standard Statistics. Such a defence may have been suggested by the bank’s lawyers. As early as 1897 court decisions quoted ratings as external evidence of the quality of investment recommendations.44 Thus it would appear that judges saw ratings as opinions that were free of
44Partnoy (2001, p. 19).

18
conflicts of interest, and this we argue was a powerful factor in causing their emergence as an instrument for regulatory control.
In any event pointing to the initial high ratings provided a stronger case than pointing to the initial high prices bond has once commanded, because bankers faced the charge that they had manipulated prices. We thus argue that ratings not being tainted by conflicts of interest gave them a legal franchise that was a powerful factor for their subsequent regulatory license.45 The key element is the perceived lack of conflict of interest, rather than exceptional performance in the sorting of risks.
Conclusions
The interwar period offers a rich environment where we can examine a number of contentions pertaining to the performance of rating agencies and the relation between this performance and the regulatory and competitive environment. This is because until the 1930s, ratings were not part of the supervisory frameworks and thus in principle without regulatory license. The two natural questions that emerge in this context are why did ratings emerge as an instrument for regulatory control and did rating agencies perform significantly better or worse in this environment.
Our main finding is that the performance of rating agencies during the interwar era was not exceptional by any standard. Ratings above subsequent regulatory cut-offs provided little guarantee against default during the financial crisis. Rating agencies generally did not exhibit forecasting capacities superior to those embedded in available market prices. While this probably means that the agencies like many other players in the financial industry did not see the interwar debacle coming, it is also consistent with the view that their forecasting capacities at the time were not particularly outstanding.
It is in the nature of crises to bring a crop of regrets, and students of history are familiar with the blame game that usually follows crashes. The blame game is obviously politically important. Crises, when they reveal wrongdoing, or suggest that wrongdoing may have occurred, do sap important political and social institutions. The discredit in which the market economy found itself in the interwar years may well be related to the subsequent embracing of extreme ideologies, which sold themselves precisely as an alternative to the “defunct” 19th century liberal-bourgeois social compact. The irony is that distrust in bankers during the interwar years is both a cause of the emergence of ratings as a regulatory instrument, and a foreshadowing of some of the challenges now faced by the agencies.
In conclusion, the agencies’ new role in the 1930s did not result from any evidence of the superior forecasting qualities of ratings. They became important because they were perceived as being free from conflicts of interest. While bankers were said to have manipulated prices, the agencies provided a certification of quality that was not tainted by the rampant mistrust in financial intermediaries, and their opinions were used as benchmarks in legal cases. Second, in an environment where volatility hampered the ability of the market to perform effective price discovery, the top four ratings gave some basis for identifying “good collateral”. The emergence of ratings as a regulatory instrument was a specific response to the specific financial problems faced during the Great Depression.
The previous thoughts cast doubt on what we ought to expect from a revision of incentive frameworks. It may or may not be that some particularly ill-advised ratings were produced ahead of the latest crisis in part on account of defective incentive schemes plagued by conflicts of interest, but there is a long way to go between proving this claim and reaching the
45Compare with Partnoy (2001).

19
further conclusion that regulatory changes addressing such conflicts of interest ought to cure most of our modern problems and somehow make credit ratings more “perfect”. Our results suggest, if anything, that a world where agency conflicts of interest are less pronounced, is not one where crises are absent, nor one were they are more predictable.

20
References
Altman, Edward (1989), “Measuring Corporate Bond Mortality and Performance”, Journal of
Finance, Vol.44.
Atkinson, T. (1967), Trends in Corporate Bond Quality, NBER.
Bagehot, W., 1873/1919, Lombard Street, a description of the money market, London, John Murray.
Bank for International Settlements (2006), Basel II: International Convergence of Capital
Measurement and Capital Standards: A Revised Framework - Comprehensive Version
Becker, Bo, and Todd Milbourn (2009), “Reputation and competition: evidence from the credit rating industry”, mimeo, February.
Benston, George J., (1990), The separation of commercial and investment banking. Th eGlass
Steagall Act Revisited and Reconsidered, London: Macmillan.
Board of Governors of the Federal Reserve System, (1943), Banking and Monetary Statistics 1914-1941, Washington D.C.
Bolton, Patrick, Xavier Freixas, and Joel Shapiro, (2008), “The Credit Ratings Game” Mimeo, UPF, Barcelona.
Boot, Arnoud, Milbourn, Todd J., and Anjolein Schmeits, 2006) “Credit Ratings as Coordination Mechanisms”, Review of Financial Studies, 19, 1, 81-118.
Brandeis, Louis D., (1914), Other People's Money and How the Bankers Use It, New York: New York: Frederick A. Stokes Company.
Breger Ludovic, Goldberg, Lisa and Cheyette, Oren (2003), “Market Implied Ratings”, Barra
Credit Series, Research Insights.
Cantor, Richard and Christopher Mann, (2003), “Measuring The Performance Of Corporate Bond Ratings”, Moody’s Special Comment.
Cantor, Richard and Packer, Frank (1994), “The Credit Rating Industry”, Federal Reserve
Bank of New York Quarterly Review, Summer-Fall.
Cantor, Richard and Packer, Frank (1996), “Determinants and Impact of Sovereign Credit Ratings”, Economic Policy Review, October.
Cantor, Richard and Packer, Frank (1997), “Differences of Opinion and Selection Bias in the Credit Rating Industry”, Journal of Banking and Finance 21, 1395-1417.
Cleveland, Harold Van B., and Thomas F. Huertas, (1986), Citibank, 1812-1970, Cambridge, Ma: Harvard University Press.
Dice, Charles A., (1926), The Stock Market, New York: McGraw-Hill Book Cy.
Dittrich, Fabian, (2007), “The Credit Rating Industry: Competition and Regulation”, Working Paper, University of Cologne - Department of Economics.
Barry Eichengreen and Carolyn Werley, (1988), "How the Bondholders Fared: Realized Rates of Return on Foreign Dollar Bonds Floated in the 1920s", Working Paper No. 8869, University of California, Berkeley
Ferri, Giovanni, Liu, L.-G. and Stiglitz Joseph (1999), “The Procyclical Role of Rating Agencies: Evidence from the East Asian Crisis”, Economic Notes, Banca Monte dei Paschi di
Siena SpA, No.3.

21
Fitch (2007), Sovereign Rating Transition and Default Study 1995-2006, February 7.
Fitch (various years), Fitch Bond Books.
Flandreau, Marc and Zumer, Frédéric, (2004), The Making of Global Finance, 1880-1913, Development Centre Studies, OECD.
Flandreau, Marc, (2003), “Caveat Emptor – Coping with Sovereign Risk Under the International Gold Standard, 1871-1913”, in Flandreau, Marc, Holtfrerich, C-L. and James, Harold (eds.), International Financial History in the Twentieth century. System and anarchy, Cambridge University Press.
Flandreau, Marc and Juan H. Flores (2009), “Bonds and Brands: Foundations of sovereign debt markets 1820-1830”, Journal of Economic History, Fall.
Fowler J. F. (1928), American Investment Trusts, New York and London, Harper & brothers.
Frost, Carol Ann, (2006), “Credit Rating Agencies in Capital Markets: A Review of Research Evidence on Selected Criticisms of the Agencies”, Working paper, University of North Texas.
Gaillard, Norbert, (2007), Les méthodologies de notation souveraine, Unpub. Diss. Institut d’Etudes Politiques de Paris.
Goodhart, C. A. E., (2008), “The Financial Economists Roundtable’s statement on reforming the role of SROs in the securitisation process”, in Vox, December 5 2008, http://www.voxeu.org/index.php?q=node/2667
Harold, Gilbert, (1934), “Do bond ratings forecast the market?” Barron’s, vol. xiv, N° 53.
Harold, Gilbert, (1938), Bond Ratings as an Investment Guide, Ronald Press Company, New York.
Hickman, W. Braddock, (1953), The Volume of Corporate Bond Financing Since 1900, Princeton University Press.
Hickman, W. Braddock, (1958), Corporate Bond Quality and Investor Experience, Princeton University Press.
Hickman, W. Braddock, (1960), Statistical Measures of Corporate Bond Financing since
1900, Princeton University Press.
Hill, C. (2004), “Regulating the Rating Agencies”, Washington University Law Quarterly, Vol.82.
Kisgen, Darren. “Credit Ratings and Capital Structure”Journal of Finance, 41, 3, 1035-1072.
KMV Corporation (1998), “Uses and Abuses of Bond Default Rates”, March 3.
Kroszner, Randall S., and Rajan, Raghuram G., (1994), “Is the Glass-Steagall Act Justified ? A Study of the U.S. Experience with Universal Banking before 1933”, American Economic Review, Vol.84, No.4, pp.810-832.
Lewis, Cleona (1938), America’s Stake in International Investments, Brookings Institution, Washington.
Mintz, Ilse (1951), Deterioration in the Quality of Foreign Bonds Issued in the United States
1920-30, NBER, Cambridge.
Moody's Investors Service, (1924), Foreign and American Government Securities.
Moody’s Investors Service (1995), Corporate Bond Defaults and Default Rates 1970-1994, January.

22
Moody's Investors Service, 1997, Historical Default Rates of Corporate Bond Issuers, 1920-
1996.
Moody’s Investors Service (2003), Sovereign Bond Defaults, Rating Transitions, And
Recoveries (1985-2002), February.
Moody’s Investors Service (2007), Sovereign Default and Recovery Rates, 1983-2006, June.
Moody’s Investors Service (various years), Moody’s Manuals.
Morton W. A. (1939), « Liquidity and Solvency », American Economic Review, Vol. 29 (2).
Osterhus, Gustav (1931), “Flaw-Tester for Bond Lists”, American Bankers Association
Journal, August.
Palyi, Melchior (1938), “Bank Portfolios and the Control of the Capital Market”, Journal of
Business of the University of Chicago, Vol. 11 (1).
Partnoy, Frank, (2001), “The paradox of credit ratings” UCSD Law and Economics Working Paper.
Partnoy, Frank, (2006), “How and Why Credit Rating Agencies are Not Like Other Gatekeepers”, in Yasuyuki Fuchita, Robert E. Litan, eds., Financial Gatekeepers: Can they Protect Investors? Brookings Institution Press and the Nomura Institute of Capital Markets Research, 2006
Poor’s (various years), Poor’s Volumes.
Reisen, Helmut and Von Maltzan, Julia (1999), “Boom and Bust and Sovereign Ratings”, OECD Development Centre, Working Papers No.148.
Rippy J. F. (1950), “A Bond-Selling Extravaganza of the 1920’s”, Journal of Business of the
University of Chicago, Vol.23, No.4, pp.238-247.
Winkler, Max, (1933), Foreign Bonds – An Autopsy, New York: Roland Swain Company.

23
Figure 1
Bond issuance on the NYSE (1920-1929)
In millions of US dollars
0
2,000
4,000
6,000
8,000
1920 1921 1922 1923 1924 1925 1926 1927 1928 1929
US State and municipal bondsDomestic rail roads bondsDomestic public utility bonds
Domestic industrial bondsForeign sub-sovereign bondsForeign sovereign bonds
Source: Hickman (1953), pp.253-255, for domestic railroad, public utility, and industrial figures. Board of Governors of the Federal
Reserve System (1943), p.487, for U.S. State and municipal figures. Authors’ computations from Moody’s Manuals for foreign sub-
sovereign and sovereign figures.
Figure 2
Listed NYSE sovereign securities and rating agency coverage
Number of securities
100
105
110
115
120
Total listed NYSE Fitch Moody’s Poor’s Standard Statistics Source: Hickman (1953), rating agency manuals.

24
Figure 3
Ratings composition of sovereign bonds outstanding (1918-1937)
In per cent
Moody’s Fitch
0
20
40
60
80
100
18 20 22 24 26 28 30 32 34 36 38
AaaAa
ABaa
BaB
Caa-C
0
20
40
60
80
100
24 26 28 30 32 34 36 38
AAAAA
ABBB
BBB
CCC-CDDD-D
Source: Gaillard (2008).
Figure 4
Upgrades and downgrades as fraction of outstanding ratings1
In per cent
–100
–80
–60
–40
–20
0
20
40
1925 1926 1927 1928 1929 1930 1931 1932 1933 1934 1935 1936 1937 1938 1939
Moody’sFitchPoor’sStandard Statistics
1 Positive bars indicate upgrades, negative indicate downgrades.
Source: Author’s computations;
Note: an upgrade (resp. downgrade) measures any upward (resp. downward) revision occurring during year.

25
Figure 5
Defaulted sovereign bonds (1920-1939)
0
100
200
300
400
0
10
20
30
40
1920-1930 1931 1932 1933 1934 1935 1936 1937 1938 1939
Amount1(lhs)Percentage2(rhs)
1 In millions of US dollars, stock of defaulted bonds during that year. 2 Cumulative number of defaulted sovereign bonds from 1931 as
percent of total sovereign bond issues 1920-1930. Sovereign bond withdrawn from sample as they mature.
Source: Moody’s Manuals (various years).

26
Figure 6
Ratings composition at the time of default
(1924-1942, 41 defaulted issues)
0
20
40
60
80
100
Fitch Moody’s Poor’s Standard
AA A BBB BB B CCC
Footnote text explaining ratings correpondences used.
Figure 7
Ratings composition one year before the default
(1924-1942, 42 defaulted issues)
0
20
40
60
80
100
Fitch Moody’s Poor’s Standard
AA A BBB BB B CCC
Footnote text explaining ratings correspondences used.
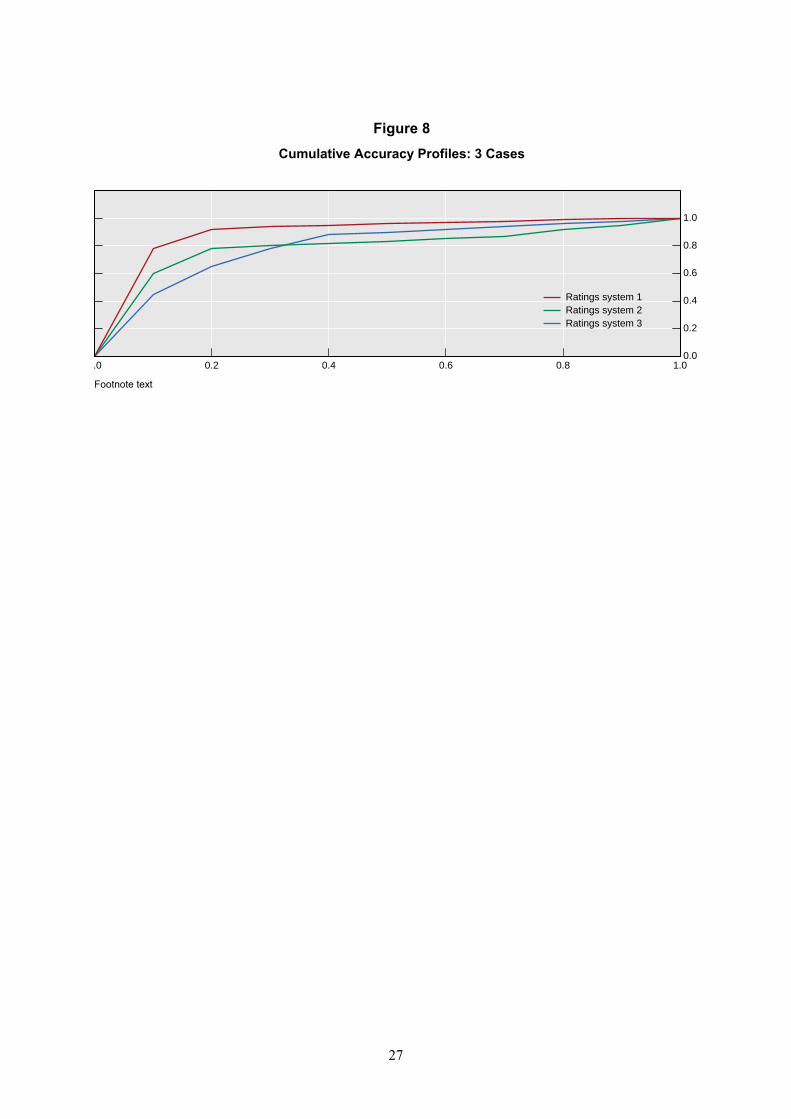
27
Figure 8
Cumulative Accuracy Profiles: 3 Cases
0.0
0.2
0.4
0.6
0.8
1.0
0.0 0.2 0.4 0.6 0.8 1.0
Ratings system 1Ratings system 2Ratings system 3
Footnote text
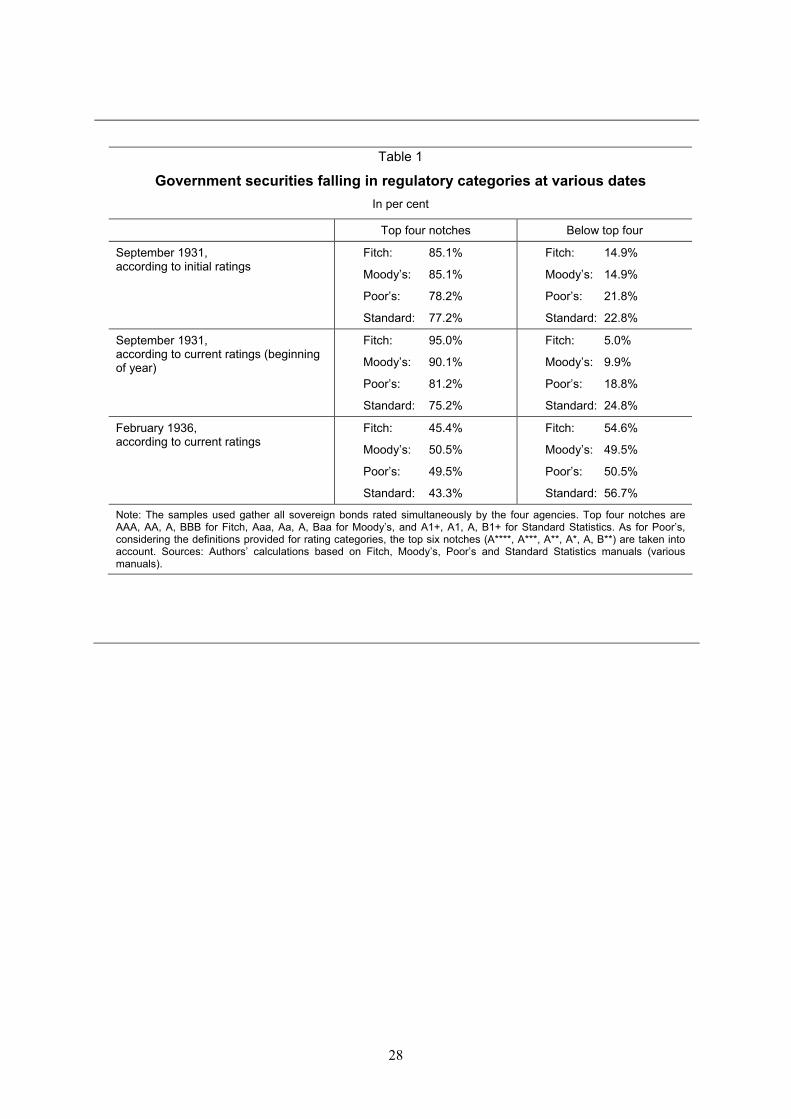
28
Table 1
Government securities falling in regulatory categories at various dates
In per cent
Top four notches Below top four
September 1931, according to initial ratings
Fitch: 85.1%
Moody’s: 85.1%
Poor’s: 78.2%
Standard: 77.2%
Fitch: 14.9%
Moody’s: 14.9%
Poor’s: 21.8%
Standard: 22.8%
September 1931, according to current ratings (beginning of year)
Fitch: 95.0%
Moody’s: 90.1%
Poor’s: 81.2%
Standard: 75.2%
Fitch: 5.0%
Moody’s: 9.9%
Poor’s: 18.8%
Standard: 24.8%
February 1936, according to current ratings
Fitch: 45.4%
Moody’s: 50.5%
Poor’s: 49.5%
Standard: 43.3%
Fitch: 54.6%
Moody’s: 49.5%
Poor’s: 50.5%
Standard: 56.7%
Note: The samples used gather all sovereign bonds rated simultaneously by the four agencies. Top four notches are AAA, AA, A, BBB for Fitch, Aaa, Aa, A, Baa for Moody’s, and A1+, A1, A, B1+ for Standard Statistics. As for Poor’s, considering the definitions provided for rating categories, the top six notches (A****, A***, A**, A*, A, B**) are taken into account. Sources: Authors’ calculations based on Fitch, Moody’s, Poor’s and Standard Statistics manuals (various manuals).

29
Table 2
Correspondence across ratings
Fitch Moody’s Poor’s Standard “Majority interpretation”
AAA Aaa A** A1+ Highest
AA Aa A* A1 High
A A A A Sound
BBB Baa B** B1+ Good
BB Ba B* B1 Fair
B B B B Somewhat speculative
CCC Caa C** C1+ Speculative
CC Ca C* C1 Highly speculative
C C C C Extremely speculative
DDD -- D** D1+ Low or weak
DD -- D* D1 Small or very weak
D -- D D Practically valueless
Source: Harold 1938, p 75.

30
Table 3
1-year default rates (1928-1937)
1928 1929 1930 1931 1932 1933 1934 1935 1936 1937 Average
1928-371
Fitch
AAA 0 0 0 0 0 0 0 0 0 0 0
AA 0 0 0 11 0 0 0 0 0 0 2
A 0 0 0 24 0 13 0 0 0 0 5
BBB 0 0 0 27 10 0 0 0 0 0 4
BB 0 0 0 0 56 0 13 0 25 0 9
B 33 0 0 0 25 10
CCC 80 33 0 50 56
IG 0 0 0 16 4 3 0 0 0 0 3
SG 0 0 0 0 56 23 10 0 25 13 16
Moody’s
AAA 0 0 0 0 0 0 0 0
AA 0 0 0 0 0 0 0 0 0 0 0
A 0 0 0 28 5 0 0 0 0 0 4
BBB 0 0 0 35 36 20 6 0 10 0 10
BB 0 0 0 17 60 45 20 0 0 17 19
B 0 0 50 0 17
CCC
IG 0 0 0 16 7 8 4 0 4 0 4
SG 0 0 0 17 60 45 17 0 13 14 18
Poor’s
AAA 0 0 0 0 0 0 0 0 0 0 0
AA 0 0 0 0 0 0 0 0 0
A 0 0 0 18 4 8 0 0 0 0 4
BBB 0 0 0 30 4 0 0 0 5 0 5
BB 0 0 0 8 38 7 17 0 25 0 10
B 0 0 0 0 50 78 33 0 0 0 27
CCC 0 0 50 100 33
IG 0 0 0 17 3 4 0 0 2 0 3
SG 0 0 0 7 40 35 19 0 20 7 15
Standard
AAA 0 0 0 0 0 0 0 0 0 0 0
AA 0 0 0 0 0 0 0 0 0 0 0
A 0 0 0 16 0 0 0 0 0 0 3
BBB 0 0 0 13 5 15 0 0 0 0 4
BB 0 0 0 38 5 0 33 0 10 11 7
B 0 0 0 29 30 0 0 0 33 0 13
CCC 50 100 73 33 0 50 0 59
IG 0 0 0 9 2 5 0 0 0 0 2
SG 0 0 0 38 22 23 23 0 20 8 16 1 Weighted by the number of issues.
Source: Authors’ calculations.

31
Table 4
3-year default rates (1928-1937)
1928 1929 1930 1931 1932 1933 1934 1935 1936 1937 Average
1928-371
Fitch
AAA 0 0 0 0 0 0 0 0 0 0 0
AA 0 0 6 16 6 0 0 0 0 0 5
A 0 17 28 45 25 13 0 0 0 0 18
BBB 0 26 64 60 30 0 0 0 0 0 18
BB 0 0 29 100 67 7 27 11 25 0 20
B 33 0 0 50 50 19
CCC 90 67 67 100 83
IG 0 13 22 31 19 3 0 0 0 0 13
SG 0 0 29 100 67 30 21 18 42 25 28
Moody’s
AAA 0 0 0 0 0 0 0 0
AA 0 0 0 0 8 0 0 0 0 0 1
A 0 25 28 45 32 0 0 0 0 0 17
BBB 0 33 75 82 73 28 9 4 10 0 28
BB 0 0 40 50 60 55 40 25 33 33 37
B 100 50 50 0 50
CCC
IG 0 13 22 30 22 11 5 2 4 0 13
SG 0 0 40 50 60 55 50 30 38 29 38
Poor’s
AAA 0 0 0 0 0 0 0 0 0 0 0
AA 0 0 0 0 0 0 0 0 0
A 0 15 18 24 21 8 0 0 0 0 11
BBB 0 24 40 52 19 0 0 0 5 0 17
BB 0 0 45 69 69 29 25 7 25 0 31
B 0 0 0 0 50 78 67 20 25 20 39
CCC 100 100 100 100 100
IG 0 14 20 26 15 4 0 0 2 0 11
SG 0 0 42 60 67 48 38 19 40 14 36
Standard
AAA 0 0 0 0 0 0 0 0 0 0 0
AA 0 4 4 9 10 0 0 0 0 0 3
A 0 27 33 25 0 0 0 0 0 0 10
BBB 0 25 10 40 30 15 0 0 25 33 16
BB 0 18 64 50 11 5 50 13 20 11 22
B 0 0 71 86 80 33 25 33 33 0 51
CCC 83 100 82 67 100 50 0 78
IG 0 12 11 20 14 5 0 0 2 3 8
SG 0 14 67 71 41 31 46 27 27 8 37 1 Weighted by the number of issues.
Source: Authors’ calculations.

32
Table 5
5-year default rates (1928-1937)
1928 1929 1930 1931 1932 1933 1934 1935 1936 1937 Average
1928-371
Fitch
AAA 0 0 0 4 0 0 0 0 0 0 1
AA 0 0 11 16 6 0 0 0 0 0 6
A 14 23 40 47 25 13 0 0 0 0 23
BBB 29 58 82 60 37 0 0 0 19 57 32
BB 67 50 43 100 78 15 27 11 25 0 28
B 33 0 0 50 75 24
CCC 100 100 100 100 100
IG 12 23 31 33 22 3 0 0 7 11 19
SG 67 50 43 100 78 38 24 23 42 38 37
Moody’s
AAA 0 0 0 0 0 0 0 0
AA 0 0 4 4 8 0 0 0 0 0 2
A 13 42 52 48 32 0 0 0 5 7 25
BBB 88 83 81 82 91 32 9 4 20 22 41
BB 0 0 40 50 80 73 60 38 33 33 46
B 100 50 50 0 50
CCC
IG 15 25 32 32 25 13 5 2 10 14 20
SG 0 0 40 50 80 73 67 40 38 29 46
Poor’s
AAA 0 0 0 0 0 0 0 0 0 0 0
AA 0 0 0 0 0 0 0 0 0
A 10 15 24 26 21 8 0 0 0 0 13
BBB 13 52 64 57 19 0 0 0 20 17 27
BB 71 50 55 69 85 36 25 7 25 38 46
B 0 0 0 0 100 100 100 40 25 20 55
CCC 100 100 100 100 100
IG 8 22 30 28 15 4 0 0 9 6 15
SG 63 44 50 60 87 61 44 24 40 36 50
Standard
AAA 0 0 0 0 0 0 0 0 0 0 0
AA 5 4 8 9 10 0 0 0 0 0 5
A 13 47 61 25 0 0 0 0 0 0 16
BBB 13 33 30 53 30 15 0 0 25 100 23
BB 63 55 64 50 21 10 50 13 50 44 38
B 50 67 86 86 90 67 25 50 33 0 66
CCC 83 100 91 100 100 50 0 85
IG 7 17 21 23 14 5 0 0 2 9 12
SG 60 57 71 71 50 40 54 33 47 33 52 1 Weighted by the number of issues.
Source: Authors’ calculations.
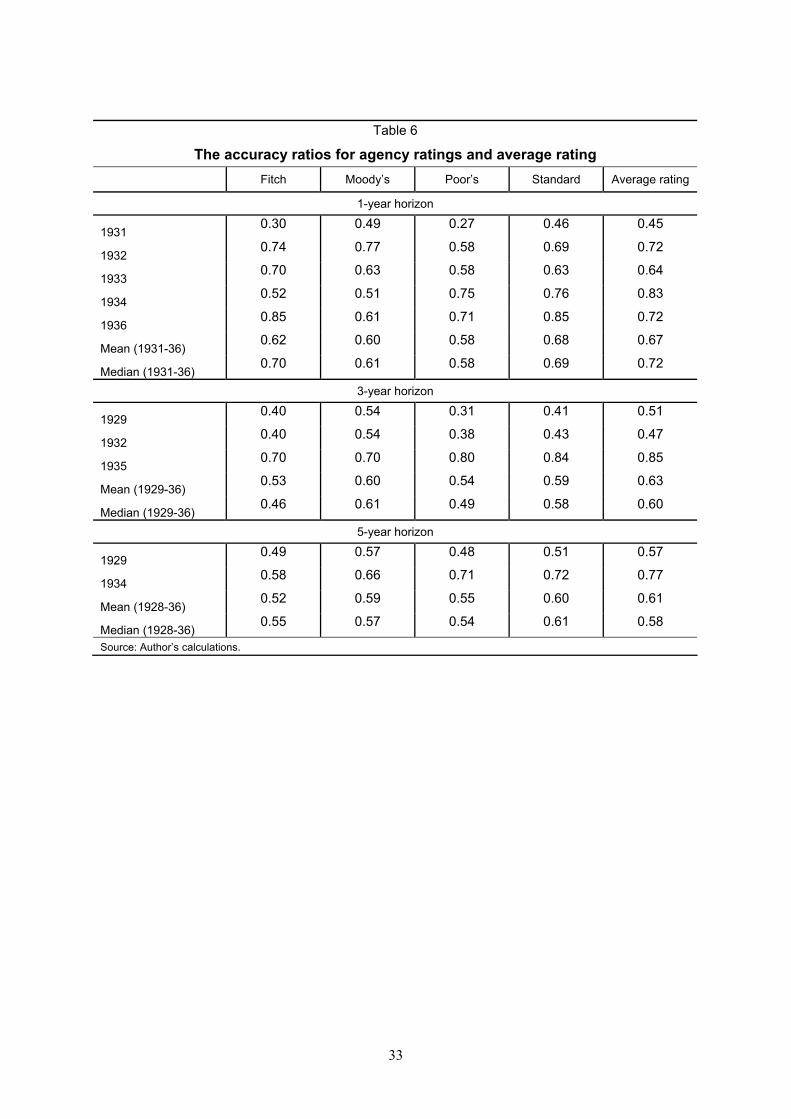
33
Table 6
The accuracy ratios for agency ratings and average rating
Fitch Moody’s Poor’s Standard Average rating
1-year horizon
1931 0.30 0.49 0.27 0.46 0.45
1932 0.74 0.77 0.58 0.69 0.72
1933 0.70 0.63 0.58 0.63 0.64
1934 0.52 0.51 0.75 0.76 0.83
1936 0.85 0.61 0.71 0.85 0.72
Mean (1931-36) 0.62 0.60 0.58 0.68 0.67
Median (1931-36) 0.70 0.61 0.58 0.69 0.72
3-year horizon
1929 0.40 0.54 0.31 0.41 0.51
1932 0.40 0.54 0.38 0.43 0.47
1935 0.70 0.70 0.80 0.84 0.85
Mean (1929-36) 0.53 0.60 0.54 0.59 0.63
Median (1929-36) 0.46 0.61 0.49 0.58 0.60
5-year horizon
1929 0.49 0.57 0.48 0.51 0.57
1934 0.58 0.66 0.71 0.72 0.77
Mean (1928-36) 0.52 0.59 0.55 0.60 0.61
Median (1928-36) 0.55 0.57 0.54 0.61 0.58
Source: Author’s calculations.
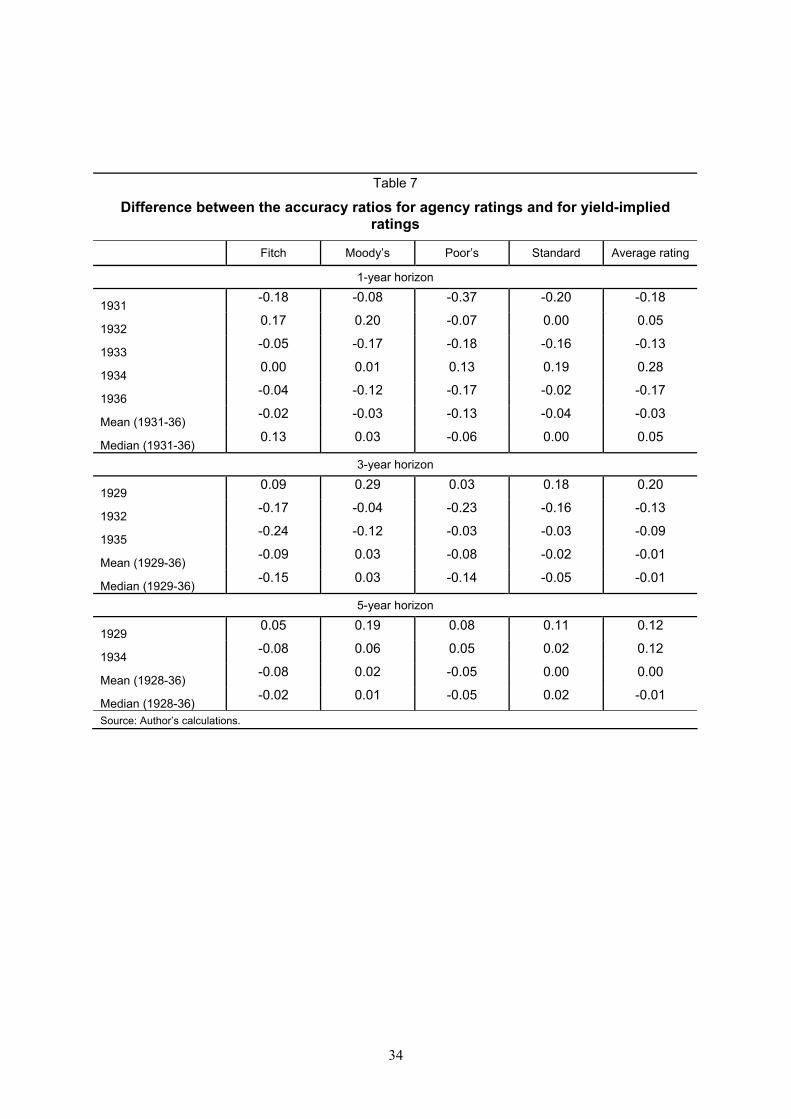
34
Table 7
Difference between the accuracy ratios for agency ratings and for yield-implied ratings
Fitch Moody’s Poor’s Standard Average rating
1-year horizon
1931 -0.18 -0.08 -0.37 -0.20 -0.18
1932 0.17 0.20 -0.07 0.00 0.05
1933 -0.05 -0.17 -0.18 -0.16 -0.13
1934 0.00 0.01 0.13 0.19 0.28
1936 -0.04 -0.12 -0.17 -0.02 -0.17
Mean (1931-36) -0.02 -0.03 -0.13 -0.04 -0.03
Median (1931-36) 0.13 0.03 -0.06 0.00 0.05
3-year horizon
1929 0.09 0.29 0.03 0.18 0.20
1932 -0.17 -0.04 -0.23 -0.16 -0.13
1935 -0.24 -0.12 -0.03 -0.03 -0.09
Mean (1929-36) -0.09 0.03 -0.08 -0.02 -0.01
Median (1929-36) -0.15 0.03 -0.14 -0.05 -0.01
5-year horizon
1929 0.05 0.19 0.08 0.11 0.12
1934 -0.08 0.06 0.05 0.02 0.12
Mean (1928-36) -0.08 0.02 -0.05 0.00 0.00
Median (1928-36) -0.02 0.01 -0.05 0.02 -0.01
Source: Author’s calculations.

35
Appendix:
1) Formula for the Accuracy Ratio (AR).
This formula is computed using the difference between the cumulative distribution of
realizations and the cumulative distribution of ratings or:
agencygivenaofratingsRRR
ND
lessandRratedissuersofnumbertotalN
lessandRrateddefaultsofnumbertotalD
issuersofnumbertotalN
defaultsofnumbertotalD
where
DN
NNDDAR
i
iR
iR
RRR
RiRRiR
i
i
i
ii
−==
=
===
−−+
= ∑=
−−
max1
00
,...,
,...,
0,
)5.02
))(((2
max1
11
2) Formula for the Yield Implied Ratings
The goal is to compute the vector of brackets that minimize loss function P(b). In the following
formula the (x)+ operator takes value zero when result within brackets is negative.
P(b) = w j s j −bi( j )
+( )++ w j bi( j )
− − s j( )+
j∑
Where:
i(j) = agency rating index of issue j.
sj = spread of issue j over US bonds (for simplicity, since our computations are annual, and one
average US yield is considered, we have performed computations over yields rather than spreads,
without loss of generality).
bi( j )
+ = upper threshold for rating j by agency i.
bi( j )
− = lower threshold for rating j by agency i.
w j = rate chosen i j to level off the contribution of each rating bucket