Rating Matrix KSB Pumps (KSBPUM) - ICICI...
25
January 28, 2015 ICICI Securities Ltd | Retail Equity Research Initiating Coverage Quality play, master of fluid control .... KSB Pumps (KSB), a subsidiary of KSB AG, Germany (global leader in pump manufacturing), is a pumps & valves manufacturer domestically based out of Pune. KSB’s sales (consolidated) have grown at a CAGR of 6.7% in CY09-13 to | 733 crore in CY13. In CY13, pumps comprised 82% (| 603 crore) while valves comprised 17% (| 122 crore) of total sales (| 733 crore). The company clocked an EBITDA of | 101 crore (EBITDA margins 14%) in CY13 with corresponding PAT at | 67 crore. By virtue of KSB focusing only on non-project businesses (unlike its peers) it generates robust free cash flows and maintains working capital discipline with CY13 free cash flow (FCF) yield at 4.2%. Going forward, with increasing focus on energy efficiency pumps and up-tick expected from the revival of domestic capex cycle, we expect sales and PAT to grow at a CAGR of 10.8% and 22.5%, respectively, in CY13-16E. We initiate coverage on KSB with a BUY rating and assign it 23x P/E (1x PEG) on CY16E EPS of | 35.2 to arrive at a target price of | 810. Strong parentage, leader in technological intensive pumps market!!! KSB has a strong parentage with KBS AG, providing all R&D support and technical assistance. In India, it commands a market share of ~7% (pump sales of | 603 crore in CY13) out of the total industry size, which is pegged at ~| 8500 crore as of FY14. KSB supplies ~35% of its pumps in the standard pumps segment (used for irrigation & building services). It supplies remaining 65% of its pumps (~| 400 crore sales vis-à-vis market size of ~| 4500 crore, market share ~9%) to the industrial segment, which is technology intensive. Going forward, we expect KSB’s pump sales to grow at a CAGR of 13.1% in CY13-16E to | 876 crore in CY16E. Valves segment, focus on increasing profitability; not chasing growth Valves constitute ~17% (| 122 crore in CY13) of consolidated sales. The performance of valves has been a laggard in the past few quarters on account of fierce competition and subdued demand (a majority of which is accounted by oil & gas sector). Going forward, KSB expects to consolidate its position in the valves market with focus on increasing profitability rather than chasing sales growth. Going forward, post a blip in CY14E, we expect valves sales to largely remain flat with CY16E sales at | 122 crore. KSB also owns 49% in MIL Controls Ltd (51% ownership with KSB AG) with an initial investment of | 6.3 crore, on which it is reaping rich benefits (share of profit at | 9.6 crore in CY13; RoI ~150%). Likely beneficiary of capex cycle revival; balance sheet strength to grow! KSB is likely to realise operating leverage benefits (margin expansion of 360 bps and PAT CAGR of 22.5% in CY13-16E) in the form of higher demand for its product. This may lead to improvement in RoEs & RoCEs and strong FCF generation of | 90 crore in CY15E and | 114 crore in CY16E, going forward. We initiate coverage with a target price of | 810. Exhibit 1: Financial Performance (Consolidated) (Year-end March) CY12 CY13 CY14E CY15E CY16E Net Sales (| crore) 715.4 732.7 758.5 860.8 1,000.2 EBITDA (| crore) 92.0 100.8 111.9 144.0 173.7 Net Profit (| crore) 63.6 66.7 78.3 100.7 122.5 EPS (|) 18.3 19.2 22.5 28.9 35.2 P/E (x) 37.2 35.5 30.2 23.5 19.3 Price / Book (x) 5.1 4.6 4.2 3.7 3.3 EV/EBITDA (x) 24.8 21.9 19.5 14.9 12.0 RoCE (%) 14.1 14.4 14.8 17.8 19.6 RoE (%) 13.6 13.0 13.9 15.9 17.1 Source: Company, ICICIdirect.com Research KSB Pumps (KSBPUM) | 680 Rating Matrix Rating : Buy Target : | 810 Target Period : 18-24 months Potential Upside : 19% YoY growth (%) (YoY Growth) CY13 CY14E CY15E CY16E Net Sales 2.4 3.5 13.5 16.2 EBITDA 9.6 11.0 28.7 17.1 Net Profit 4.9 17.4 28.6 18.3 EPS (Rs) 4.9 17.4 28.6 18.3 Valuation summary (Consolidated) CY13 CY14E CY15E CY16E P/E 35.5 30.2 23.5 19.3 Target P/E 42.3 36.0 28.0 23.0 EV / EBITDA 21.9 19.5 14.9 12.0 P/BV 4.6 4.2 3.7 3.3 RoNW 13.0 13.9 15.9 17.1 RoCE 14.4 14.8 17.8 19.6 Stock Data Stock Data Market Capitalization | 2367.1 Crore Total Debt (CY13) | 3.2 Crore Cash and Investments (CY13) | 160 Crore EV | 2210.3 Crore 52 week H/L 682 / 234 Equity capital | 34.8 Crore Face value | 10 MF Holding (%) 2.6 FII Holding (%) 14.2 Comparative return matrix (%) Return % 1M 3M 6M 12M Kirloskar Brothers (7.9) (20.1) (29.1) 46.9 KSB Pumps 7.2 28.7 26.4 177.2 Roto Pumps (5.8) 59.6 74.7 365.1 Shakti Pumps 11.8 (5.3) 5.7 212.1 WPIL 3.7 8.2 57.8 200.0 Price movement 0 100 200 300 400 500 600 700 800 Jan-15 Oct-14 Jul-14 Apr-14 Jan-14 Oct-13 Jul-13 May-13 Feb-13 2,000 3,000 4,000 5,000 6,000 7,000 8,000 9,000 10,000 Price (R.H.S) Nifty (L.H.S) Research Analyst’ Chirag J Shah [email protected] Shashank Kanodia [email protected]
Transcript of Rating Matrix KSB Pumps (KSBPUM) - ICICI...

January 28, 2015
ICICI Securities Ltd | Retail Equity Research
Initiating Coverage
Quality play, master of fluid control.... KSB Pumps (KSB), a subsidiary of KSB AG, Germany (global leader in pump manufacturing), is a pumps & valves manufacturer domestically based out of Pune. KSB’s sales (consolidated) have grown at a CAGR of 6.7% in CY09-13 to | 733 crore in CY13. In CY13, pumps comprised 82% (| 603 crore) while valves comprised 17% (| 122 crore) of total sales (| 733 crore). The company clocked an EBITDA of | 101 crore (EBITDA margins 14%) in CY13 with corresponding PAT at | 67 crore. By virtue of KSB focusing only on non-project businesses (unlike its peers) it generates robust free cash flows and maintains working capital discipline with CY13 free cash flow (FCF) yield at 4.2%. Going forward, with increasing focus on energy efficiency pumps and up-tick expected from the revival of domestic capex cycle, we expect sales and PAT to grow at a CAGR of 10.8% and 22.5%, respectively, in CY13-16E. We initiate coverage on KSB with a BUY rating and assign it 23x P/E (1x PEG) on CY16E EPS of | 35.2 to arrive at a target price of | 810. Strong parentage, leader in technological intensive pumps market!!! KSB has a strong parentage with KBS AG, providing all R&D support and technical assistance. In India, it commands a market share of ~7% (pump sales of | 603 crore in CY13) out of the total industry size, which is pegged at ~| 8500 crore as of FY14. KSB supplies ~35% of its pumps in the standard pumps segment (used for irrigation & building services). It supplies remaining 65% of its pumps (~| 400 crore sales vis-à-vis market size of ~| 4500 crore, market share ~9%) to the industrial segment, which is technology intensive. Going forward, we expect KSB’s pump sales to grow at a CAGR of 13.1% in CY13-16E to | 876 crore in CY16E. Valves segment, focus on increasing profitability; not chasing growth Valves constitute ~17% (| 122 crore in CY13) of consolidated sales. The performance of valves has been a laggard in the past few quarters on account of fierce competition and subdued demand (a majority of which is accounted by oil & gas sector). Going forward, KSB expects to consolidate its position in the valves market with focus on increasing profitability rather than chasing sales growth. Going forward, post a blip in CY14E, we expect valves sales to largely remain flat with CY16E sales at | 122 crore. KSB also owns 49% in MIL Controls Ltd (51% ownership with KSB AG) with an initial investment of | 6.3 crore, on which it is reaping rich benefits (share of profit at | 9.6 crore in CY13; RoI ~150%). Likely beneficiary of capex cycle revival; balance sheet strength to grow! KSB is likely to realise operating leverage benefits (margin expansion of 360 bps and PAT CAGR of 22.5% in CY13-16E) in the form of higher demand for its product. This may lead to improvement in RoEs & RoCEs and strong FCF generation of | 90 crore in CY15E and | 114 crore in CY16E, going forward. We initiate coverage with a target price of | 810.
Exhibit 1: Financial Performance (Consolidated) (Year-end March) CY12 CY13 CY14E CY15E CY16ENet Sales (| crore) 715.4 732.7 758.5 860.8 1,000.2 EBITDA (| crore) 92.0 100.8 111.9 144.0 173.7 Net Profit (| crore) 63.6 66.7 78.3 100.7 122.5 EPS (|) 18.3 19.2 22.5 28.9 35.2 P/E (x) 37.2 35.5 30.2 23.5 19.3 Price / Book (x) 5.1 4.6 4.2 3.7 3.3 EV/EBITDA (x) 24.8 21.9 19.5 14.9 12.0 RoCE (%) 14.1 14.4 14.8 17.8 19.6 RoE (%) 13.6 13.0 13.9 15.9 17.1
Source: Company, ICICIdirect.com Research
KSB Pumps (KSBPUM)| 680
Rating Matrix Rating : BuyTarget : | 810Target Period : 18-24 monthsPotential Upside : 19%
YoY growth (%)
(YoY Growth) CY13 CY14E CY15E CY16ENet Sales 2.4 3.5 13.5 16.2 EBITDA 9.6 11.0 28.7 17.1 Net Profit 4.9 17.4 28.6 18.3 EPS (Rs) 4.9 17.4 28.6 18.3
Valuation summary (Consolidated)
CY13 CY14E CY15E CY16EP/E 35.5 30.2 23.5 19.3 Target P/E 42.3 36.0 28.0 23.0 EV / EBITDA 21.9 19.5 14.9 12.0 P/BV 4.6 4.2 3.7 3.3 RoNW 13.0 13.9 15.9 17.1 RoCE 14.4 14.8 17.8 19.6
Stock Data
Stock DataMarket Capitalization | 2367.1 CroreTotal Debt (CY13) | 3.2 CroreCash and Investments (CY13) | 160 CroreEV | 2210.3 Crore52 week H/L 682 / 234Equity capital | 34.8 CroreFace value | 10MF Holding (%) 2.6FII Holding (%) 14.2
Comparative return matrix (%)
Return % 1M 3M 6M 12MKirloskar Brothers (7.9) (20.1) (29.1) 46.9 KSB Pumps 7.2 28.7 26.4 177.2 Roto Pumps (5.8) 59.6 74.7 365.1 Shakti Pumps 11.8 (5.3) 5.7 212.1 WPIL 3.7 8.2 57.8 200.0
Price movement
0100200300400500600700800
Jan-
15
Oct-1
4
Jul-1
4
Apr-1
4
Jan-
14
Oct-1
3
Jul-1
3
May
-13
Feb-
13
2,0003,0004,0005,0006,0007,0008,0009,000
10,000
Price (R.H.S) Nifty (L.H.S)
Research Analyst’
Chirag J Shah [email protected]
Shashank Kanodia [email protected]

ICICI Securities Ltd | Retail Equity Research Page 2
Company background KSB Pumps, promoted by KSB AG (Germany), was established in 1960 and set up a pump manufacturing facility at Pimpri, Pune (Maharashtra). The company has been at the forefront of importing technology from its parent for delivering cutting edge, high quality products in the domestic market. Globally, KSB AG is one of the largest pump manufacturers with sales in excess of €2.2 billion (~US$2.8 billion) out of the total pump market, which is pegged at US$47 billion as of 2014. In India, KSB supplies pumps and valves to all major industries viz. power, waste water treatment, irrigation (agriculture), chemicals, etc. KSB’s products are used for pumping, transportation and flow control of fluids, which include clean or contaminated water, explosive fluids, corrosive and viscous fluids, slurries and fluid/solid mixtures. In India, KSB has a wide distribution network that includes four zonal offices, 15 branch offices, over 800 authorised dealers, four service stations, 110 authorised service centres and 22 warehouses. Exhibit 2: Plant locations
Source: Company, ICICIdirect.com Research
Exhibit 3: KSB Timeline – continuous product launches along the journey
s
Commenced manufacturing end suction process pumps, non-clog pumps for sewage, solid handling
Inception of power projects division at Chinchwad; commenced manf
high pressure multistage boiler feed pumps
Established in India (1960); Commenced manufacturing
submersible motor pumpsetsInception of foundry division at Vambori
Inception of valves division at Coimbatore; Manf. high
pressure multistage pumps
Manf: Sewage submersible motor pumps
1960-65 1970-75
Manufacturing primary coolant pumps for nuclear power stations;
Submersible pumps for sewage
Manf: Barrel casing pumps for refinery applications; Inception of water pumps
division at Sinnar
Manf: Openwell monobloc pumpset; sewage submersible pumps; centrifugal
monobloc pumpsets
2010-14
Manf: Water pressure boosting systems; end suction process pumps
2005-101965-70 1975-80 1980-85 1985-90 1990-95 2000-05
Source: Company, ICICIdirect.com Research, *Manf: Manufacturing of
Chinchwad
Power projects divisionManufacturing of primary heat transfer pumps, moderator pumps, main and auxiliary boiler feed pumps & multistage condense extraction pumps, re-heater drain pumps
Pimpri
Nashik
Vambori
Coimbatore
Irrigation and process pumps division Manufacturing of submersible pumps, vertical and horizontal pumps, series and non-series pumps, Multistage pumps, chemical process pumps and non clog pumps
This unit is engaged in the manufacture of high pressure and submersible pumps
Foundry divisionManufacturing of steel & iron castings, including for captive consumption
Valves divisionManufacturing of valves (globe, gate, check, butterfly & ball valves)
Shareholding pattern (%) – Q3CY14
Shareholder's Category Holding (%)Promoters 66.4Institutional Investors 16.8General Public 16.8
FII & DII holding trend (%)
0.6 0.7 1.0 1.2 2.0 2.3 2.60.6
11.7 11.8 11.8 12.3 13.1 13.8 14.211.7
0.02.04.06.08.0
10.012.014.016.0
Q4CY
12
Q1CY
13
Q2CY
13
Q3CY
13
Q4CY
13
Q1CY
14
Q2CY
14
Q3CY
14
%
FII DII
Major shareholders (%) – Q3CY14
Shareholder's Category Holding (%)Reliance Mutual Fund 7.4Thyssenkrupp Ind India Pvt Ltd 3.1Pinebridge Investments Asia Ltd 2.3Bajaj Allianz Life Insurance Company Lt 2.1

ICICI Securities Ltd | Retail Equity Research Page 3
Product profile (pumps) Exhibit 4: Product profile (pumps) Product Name Product Diagram/Picture Specifications Applications
KWP
Horizontal, end suction pump in back pull-out design with radial flow impellers of single, double, or multivane, closed or semi-closed type
Suitable to handle contaminated fluids, sludges, slurries, fluids containing admixture and thick stock of all kinds
KRTSingle stage, submersible centrifugal pumps of closed coupled (monobloc) construction
For pumping all types of sewage, effluent in water treatment and industry, especially untreated sewage, with long fibres and solid substances, liquids containing air and gas as well as raw, activated and digested sludge
CENTRIBLOCMini monobloc pumpsets in compact design with superior hydraulic component design
Suitable for pumping of water to overhead tanks, in bungalows, fountains & car washing
moviBOOST M
Horizontal, centrifugal, radially split, multistage pumps fitted with pressure tank, pressure sensor and gauge
Suitable for water pressure boostingapplications in bungalows, flats,and individual bathrooms
Submersible Motor Pumps
Submersible pump in multi-stage construction with radial or mixed flow impellers coupled with oil or water filled, single/three phase submersible motors. Pumps with SS jacket are also available up to 100 mm diameter
Suitable for horticulture, irrigation, housing, building services and farm houses and ornamental fountains
APPHorizontal, single stage, end suction, radially split volute casing pump in backpull-out design
Suitable for continuous operation in process industries to handle clean,abrasive corrosive liquids
MegaCPK
Horizontal, end suction, centrifugal, radially split, volute casing process pump in back-pull-out design, fitted with a radial impeller
Suitable to handle aggressive, organic and inorganic fluids in chemical and process industries like paper, cellulose, sugar, food, textile, drugs, breweries, pharmaceutical and distilleries
RPH
Horizontal, single stage, radially split pump in back-pull-out design with end suction fitted with a single entry closed radial impeller
Suitable to handle products in refineries, chemical, petrochemical and coal conversion plants, power station and environmental engineering applications
HGHorizontal, multi-stage, centrifugal pump in ring section design with radial impeller
Suitable for boiler-feed water for captive and combined cycle co-generation power plants
HGM
Horizontal, multi-stage, centrifugal pump in ring section design with medium lubricated plain bearings
Suitable for boiler-feed duties and condensate transport in power stations and industrial boilers
Pumps for chemical, petrochemical, oil production, processing, steam and power generation
Pumps & Systems for water, waste water treatment, sewage handling, building services & industrial applications
Source: Company, ICICIdirect.com Research

ICICI Securities Ltd | Retail Equity Research Page 4
Investment Rationale (1) Indian pump market on strong footing
As per industry sources, the global pump market size is pegged at US$47 billion as of 2014 and is expected to reach US$56 billion in 2017, growing at a CAGR of 6.0% in CY14-17E. The Indian pump market size is pegged at ~| 8500 crore as of 2014; wherein a majority of it i.e. ~95% (~| 8000 crore) consists of centrifugal pumps (pumps used for increasing the flow rate) while the remaining i.e. 5% (~| 500 crore) comprises positive displacement pumps (pumps used for maintaining the flow rate). The Indian pump market is expected to grow at a CAGR of 10% in FY14-17E to | 11300 crore in FY17E.
Exhibit 5: Process industry
Pumps & valves industry
Process industry
Casting & forging industry
Process control & automation
Process plantequipment
Source: FICCI, Tata Strategic Management Group, ICICIdirect.com Research
The Indian pump market can also be segregated on the basis of end usage. The main sectors in which pumps find application include: agriculture (irrigation), building services, waste water/sewage management and industrial uses (power, oil & gas, metals & mining, etc).
Exhibit 6: Indian pumps market segregation (value)
others, | 1105 cr, 13%
Metals & Mining, | 340 cr, 4%
Oil & Gas,| 680 cr, 8%
Power Generation, | 1020 cr, 12%
Water & Wastewater , | 1445 cr, 17%
Building Services, | 1615 cr, 19%
Agriculture, | 2295 cr, 27%
Source: FICCI, Tata Strategic Management Group, ICICIdirect.com Research
Out of the above; agriculture and building services comprise the major portion (46%) of the market by value i.e. ~| 4000 crore. This segment of the pump market is highly fragmented and competitive in nature with a whole lot of small & medium enterprises (SMEs) vying for the market pie.
On the other hand, the industrial sector constitutes the remaining 54% of the market, which is pegged at ~| 4500 crore. It consists of sectors such as water/sewage treatment, power generation, oil & gas and metals & mining. This segment of the pump market is technologically intensive and hard for SMEs to penetrate. The leadership of this segment is maintained by companies like KSB and Kirloskar Brothers in the listed space while ITT and Flowserve are key players from the private space.
Global pumps market
47
56
40
45
50
55
60
2014 2017E
US$
Billio
n
Source: Ficci, TSMG, ICICIdirect.com Research
CAGR over 2014-17E: 6%
Indian pumps market
8500
11300
02000400060008000
1000012000
FY14 FY17E
| cr
ore
Source: Ficci, TSMG, ICICIdirect.com Research
CAGR over FY14-17E: 10%
Raw material
Raw material
ICICI Securities Ltd | Retail Equity Research Page 5
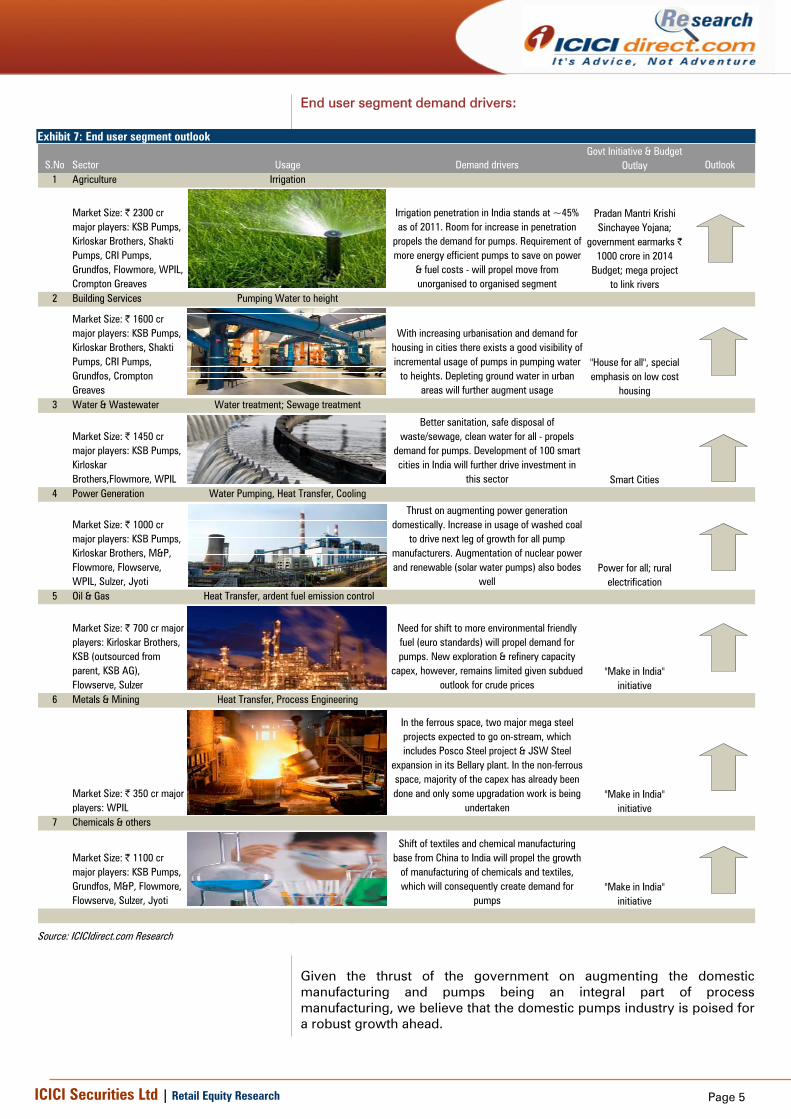
End user segment demand drivers:
Exhibit 7: End user segment outlook
S.No Sector Usage Demand drivers Outlook1 Agriculture Irrigation
Market Size: | 2300 cr major players: KSB Pumps, Kirloskar Brothers, Shakti Pumps, CRI Pumps, Grundfos, Flowmore, WPIL, Crompton Greaves
Irrigation penetration in India stands at ~45% as of 2011. Room for increase in penetration
propels the demand for pumps. Requirement of more energy efficient pumps to save on power
& fuel costs - will propel move from unorganised to organised segment
2 Building Services Pumping Water to height
Market Size: | 1600 cr major players: KSB Pumps, Kirloskar Brothers, Shakti Pumps, CRI Pumps, Grundfos, Crompton Greaves
With increasing urbanisation and demand for housing in cities there exists a good visibility of incremental usage of pumps in pumping water
to heights. Depleting ground water in urban areas will further augment usage
3 Water & Wastewater Water treatment; Sewage treatment
Market Size: | 1450 cr major players: KSB Pumps, Kirloskar Brothers,Flowmore, WPIL
Better sanitation, safe disposal of waste/sewage, clean water for all - propels
demand for pumps. Development of 100 smart cities in India will further drive investment in
this sector4 Power Generation Water Pumping, Heat Transfer, Cooling
Market Size: | 1000 cr major players: KSB Pumps, Kirloskar Brothers, M&P, Flowmore, Flowserve, WPIL, Sulzer, Jyoti
Thrust on augmenting power generation domestically. Increase in usage of washed coal
to drive next leg of growth for all pump manufacturers. Augmentation of nuclear power and renewable (solar water pumps) also bodes
well5 Oil & Gas Heat Transfer, ardent fuel emission control
Market Size: | 700 cr major players: Kirloskar Brothers, KSB (outsourced from parent, KSB AG), Flowserve, Sulzer
Need for shift to more environmental friendly fuel (euro standards) will propel demand for pumps. New exploration & refinery capacity
capex, however, remains limited given subdued outlook for crude prices
6 Metals & Mining Heat Transfer, Process Engineering
Market Size: | 350 cr major players: WPIL
In the ferrous space, two major mega steel projects expected to go on-stream, which includes Posco Steel project & JSW Steel
expansion in its Bellary plant. In the non-ferrous space, majority of the capex has already been done and only some upgradation work is being
undertaken7 Chemicals & others
Market Size: | 1100 cr major players: KSB Pumps, Grundfos, M&P, Flowmore, Flowserve, Sulzer, Jyoti
Shift of textiles and chemical manufacturing base from China to India will propel the growth
of manufacturing of chemicals and textiles, which will consequently create demand for
pumps
Power for all; rural electrification
"Make in India" initiative
"Make in India" initiative
"Make in India" initiative
Govt Initiative & Budget Outlay
Pradan Mantri Krishi Sinchayee Yojana;
government earmarks | 1000 crore in 2014
Budget; mega project to link rivers
"House for all", special emphasis on low cost
housing
Smart Cities
Source: ICICIdirect.com Research
Given the thrust of the government on augmenting the domestic manufacturing and pumps being an integral part of process manufacturing, we believe that the domestic pumps industry is poised for a robust growth ahead.

ICICI Securities Ltd | Retail Equity Research Page 6
(2) Strong parentage (KSB AG Germany); technology support KSB Pump is a subsidiary of KSB AG (established in 1871), which is a global supplier of high-quality pumps, valves and related systems and also provides a wide range of services to users of these products. KSB AG is headquartered out of Germany and has a presence in over 100 countries with 16500 employees and 160 service centres. The group supplies pumps to engineering contractors, OEMs and end users. Europe forms the largest market for KSB AG followed by Asia, Americas/Oceania and Middle East & Africa. KSB AG’s sales have grown at a CAGR of 4.0% in CY07-13 to €2247 million in CY13 (€1771 million in CY07) while its EBITDA has grown at a CAGR of 1.9% in CY07-13 to €196 million in CY13 (€175 million in CY07). The EBITDA growth has been subdued in comparison to its sales growth in CY07-13 on account of volatility in EBITDA margins, which have dropped to 8.7% in CY13 vis-à-vis a six-year high of 12.5% in CY08 and 9.9% in CY07. The main revenue generating subsidiaries of KSG AG are:
a. KSB SAS, Gennevilliers (Paris), France b. GIW Industries, Inc., Grovetown/Georgia, USA c. KSB Shanghai Pump Co. Ltd., Shanghai, China d. KSB Bombas Hidráulicas S.A., Várzea Paulista, Brazil e. KSB Service GmbH, Frankenthal, Germany f. KSB Pumps Limited, Pimpri (Pune), India
Exhibit 8: KSB AG pump application (presence across all segments)
Source: Company, ICICIdirect.com Research
Exhibit 9: KSB AG sales, EBITDA & EBITDA margins
1771 19
92
1893
1939 2091 2268
2247
175 250
233
211
188
210
196
9.9
12.5 12.310.9
9.0 9.3 8.7
0
500
1000
1500
2000
2500
CY07 CY08 CY09 CY10 CY11 CY12 CY13
mill
ion
EUR
0
2
4
6
8
10
12
14
%
Sales EBITDA EBITDA Margins
Source: Company, ICICIdirect.com Research
Exhibit 10: KSB AG CFO, FCF & CFO:EBITDA
124 14
3
212
162
36
94
135
70 51
121
92
-24
14
81
0.7
0.6
0.9
0.8
0.2
0.4
0.7
-50
0
50
100
150
200
250
CY07 CY08 CY09 CY10 CY11 CY12 CY13
mill
ion
EUR
0.0
0.1
0.2
0.3
0.4
0.5
0.6
0.7
0.8
0.9
1.0
x
CFO FCF CFO:EBITDA
Source: Company, ICICIdirect.com Research
KSB AG- Sales (2013: EUR 2247 million) Bifurcation
Service, 404, 18%
Valves, 382, 17%
Pumps, 1461, 65%
Source: Company, ICICIdirect.com Research

ICICI Securities Ltd | Retail Equity Research Page 7
(3) KSB; outperforming its peers; best placed to play capex revival Domestically, in the listed space, there are five companies operating in the pumps segment with sales leadership maintained in the order of Kirloskar Brothers, KSB Pumps, WPIL, Shakti Pumps and Roto Pumps. KSB clearly outperforms its peers on account of higher EBITDA margins, a lean balance sheet (minimal leverage) and working capital discipline (on account of no exposure to the project/EPC business), thereby emerging as the best placed to capture the revival of the capex cycle and an up-tick in economic activity domestically.
Higher EBITDA margins: Strong focus on customised pumps segment As of CY13, KSB supplies ~35% of its pumps (~| 200 crore) to the standard pumps segment (used for irrigation & building services). This segment is commoditised in nature and is highly competitive with a lot of small & medium enterprises (SMEs) vying for the market pie. KSB supplies the remaining 65% of its pumps (~| 400 crore sales vis-à-vis market size of ~| 4500 crore, market share ~9%) to the industrial segment, which is technology intensive and hard for SMEs to penetrate. Therefore, high exposure to the technological intensive segment leads to higher margins of KSB (13.9% as of CY13) as compared to its comparable peer i.e. Kirloskar Brothers (7.4% as of FY14).
Historically, KSB as a part of its business philosophy has not ventured into the project/EPC business and has only restricted itself to the product business that helps in balance sheet prudence with efficient working capital management.
Exhibit 11: Financials - domestic pump manufacturers/players
FY14/CY13Kirloskar Brothers KSB WPIL Shakti Pumps Roto Pumps
Net Sales (| crore) 2682.3 732.7 511.1 292.1 89.63 year CAGR 0.2% 6.3% 32.5% 29.4% 14.6%EBITDA (| crore) 199.4 102.0 81.6 43.3 18.3EBITDA Margin (%) 7.4 13.9 16.0 14.8 20.4PAT 64 67 30 25 10
Debt:Equity 0.3 0.0 1.4 0.8 0.6ROE 6.4 13.0 22.3 18.8 20.7ROCE 12.1 17.1 21.0 19.0 21.7
Net Working Capital (days) 52 42 158 154 119Promoter Holding (%) 63.3 66.4 74.9 45.0 69.7
Gross Block (| crore) 921 389 211 90 41Asset Turnover (x) 2.9 1.9 2.4 3.3 2.2Market Capitalization (| crore) 1659 2367 601 364 203
Source: Capitaline, Company, ICICIdirect.com Research
Exhibit 12: EBITDA margins of KSB vis-à-vis Kirloskar Brothers
7.110.0 9.1
5.37.7 7.4
17.620.0
12.99.9
13.0 13.9
0
5
10
15
20
25
FY09/CY08 FY10/CY09 FY11/CY10 FY12/CY11 FY13/CY12 FY14/CY13
%
Kirloskar* KSB
Source: Company, ICICIdirect.com Research Kirloskar*: Kirloskar Brothers’ margins are subdued due to high exposure to EPC (project) business
Major players in the standardised segment are: KSB Pumps, Kirloskar Brothers, Shakti Pumps, CRI Pumps, Grundfos, Flowmore, WPIL and Crompton Greaves, among others
Major players in the technological intensive segment are: KSB Pumps, Kirloskar Brothers, Flowserve, Flowmore, WPIL and M&P among others
Major players in the project business include Kirloskar Brothers and Flowmore
KSB Pumps- sales bifurcation
Technology Intensive
Product, | 400 cr, 67%
Standard Product, | 200 cr, 33%
Source: Company, ICICIdirect.com Research
KSB sales growth vis-à-vis industry sales growth rate
21.4
7.42.1
6.7 4.9
35.9
8.7
24.9
4.2
-7.9
-10.6
4.4
-20
-10
0
10
20
30
40
FY09
/CY0
8
FY10
/CY0
9
FY11
/CY1
0
FY12
/CY1
1
FY13
/CY1
2
FY14
/CY1
3
%
Industry Sales Growth KSB Sales Growth
Source: Capitaline, ICICIdirect.com Research

ICICI Securities Ltd | Retail Equity Research Page 8
Lean balance sheet: Strength to grow organically In the listed space, WPIL is the most levered company with debt-equity at 1.4 followed by Shakti Pumps at 0.8x, Roto Pumps at 0.6x and Kirloskar at 0.3x. KSB, on the other hand, is a debt-free company with no leverage. Conversely, KSB has cash reserves of | 160 crore as of CY13, equivalent to 31.3% of its networth (| 512 crore as of CY13), thereby providing enough room to grow organically (Greenfield and brownfield expansion).
Working capital discipline: Strong positive The working capital management of KSB is one of the best in the industry wherein its net working capital days are well below 60 days whereas majority of the industry players have working capital days at ~120 days. In CY12 and CY13, KSB’s net working capital days stood at 68 days and 42 days, respectively. Exhibit 14: Net working capital days (pump players in India)
44
85
142
190
150
4868
129
186
154
52 42
119
154 158
0
50
100
150
200
Kirloskar KSB Pumps Roto Pumps Shakti WPIL
net W
C da
ys
FY12 FY13 FY14
Source: Capitaline, ICICIdirect.com Research
Going forward, we have conservatively built in the net working capital days of KSB at 50 days in CY14E, CY5E and CY16E. The working capital is likely to be controlled for KSB as it has no exposure to the project/EPC business while the management’s focus is on scaling up the product basket.
Exhibit 13: Networth, debt, debt-equity (pump players in India)
996
512
297
3 195
113
2846133
136
0.3
0.0
1.4
0.8
0.6
0
200
400
600
800
1000
1200
Kirloskar KSB Pumps WPIL Shakti Pumps Roto Pumps
| cr
ore
-0.20.00.20.40.60.81.01.21.41.6
x
Networth (| crore) Debt (| crore) Debt:Equity (x)
Source: Company, ICICIdirect.com Research
Net working capital days (KSB India)
68
4151
85
68
4250 50 50
0102030405060708090
CY08
CY09
CY10
CY11
CY12
CY13
CY14
E
CY15
E
CY16
E
days
Source: Company, ICICIdirect.com Research

ICICI Securities Ltd | Retail Equity Research Page 9
Catalyst for up-tick in KSB’s business 1) Power: KSB’s stronghold, capacity addition to drive growth Power generation is one of the major demand drivers for pumps. With huge thermal capacity expansion in the pipeline, the domestic pump industry is poised for robust growth ahead. Total installed power capacity in India as of December 2014 was at 256 GW & is expected to reach 288 GW by 2017E (erstwhile Planning Commission target). Of the 88.5 GW capacity expansion planned in Twelfth Five Year Plan, ~49 GW has already been commissioned i.e. 55% of target has been achieved as of October 2014. Out of the remaining target i.e. 39.5 GW, thermal capacity expansion is envisaged at 25.2 GW, implying a capex of ~| 1,26,000 crore. As per industry sources, ~5% of thermal power capex is spent on pumps & allied products, thereby implying opportunity of ~| 6300 crore in FY14-17E for entire Indian pumps industry. KSB, with its strong presence in power segment, is also poised for robust growth ahead.
Exhibit 15: India power generation capacity
159174
200223
245
288
0
50
100
150
200
250
300
350
FY10 FY11 FY12 FY13 FY14 FY17E
Giga
Wat
t (GW
)
Source: Ministry of power, ICICIdirect.com Research
Exhibit 16: Pumps opportunity - power segment
Type/Sector Central State Private TotalThermal 14.9 13.9 43.5 72.3Hydro 6 1.6 3.3 10.9Nuclear 5.3 0 5.3Total 26.2 15.5 46.8 88.5
Type/Sector Central State Private TotalThermal 7.7 9.9 29.6 47.2Hydro 1.6 0.1 0.2 1.9Nuclear 0 0 0 0Total 9.3 10.0 29.8 49.1
Type/Sector Central State Private TotalThermal 7.3 4 13.9 25.2Hydro 4.4 1.5 3.1 9Nuclear 5.3 0 0 5.3Total 17.0 5.5 17 39.5
5 year plan (2012-17) Capacity addition Target (GW)
Capacity addition Achieved (GW)
Capacity addition to be achieved/pending (GW)
Source: Ministry of Power, ICICIdirect.com Research
Exhibit 17: Thermal power addition by large players
Company Existing Capacity (GW)Capacity under
implementation (GW) Expected commissioning
NTPC 43.1 7.4 FY15E-17E
Adani Power 10.5 2.6 Post FY17ELargest Private Sector
Largest Public Sector
Source: Company, ICICIdirect.com Research
KSB with its technological intensive power pumps division at Chinchwad, Pune has a stronghold in the power segment and is well placed to tap the opportunity and realise the associated benefits arising from the same. However, the company domestically manufacturers pumps only for sub-critical power plants (<660 MW rating) while for super critical power plants (> 660 MW rating) it imports the same from its parent company i.e. KSB AG.
Thus, with 25.2 GW of thermal capacity to be executed over the next two or three years and capex amounting to | 1,26,000 crore being spent on the same, there exists an opportunity worth | 6300 crore for the pump industry in the next two or three years

ICICI Securities Ltd | Retail Equity Research Page 10
2) Agriculture: Intense competition; stronghold in Punjab & Haryana India has traditionally been a monsoon driven agrarian economy with domestic farmers depending heavily on monsoons for their produce. However, with the aim of reducing the farmer’s dependency on monsoons and increasing the crop yield, the central government, over a period of time, has been increasingly promoting the usage of irrigation. The net irrigated area has increased from 21 million hectare (MH) in 1950-51 to 64 MH in 2011-12 with total irrigation penetration in India at 45% as of 2010-11 (18% in 1950-51). It has also been observed that increasing irrigation leads to increasing cropping intensity, which essentially implies more efficiency out of the same arable land (i.e. better yields).
Exhibit 18: Net sown area & net irrigated area
119 13
3
141
140
143
141
142
21 25 31 39 48 55 64
18 1922
2834
3945
020406080
100120140160
1950-51 1960-61 1970-71 1980-81 1990-91 2000-01 2010-11
milli
on h
ecta
res
(MH)
0
10
20
30
40
50
%
Net Area Sown Net Irrigated Area Irrigation %
Source: Ministry of Agriculture, ICICIdirect.com Research
Exhibit 19: Irrigation penetration & cropping intensity
18 1922
28
3439
45111 115 118 123 130 131141
05
101520253035404550
1950-51 1960-61 1970-71 1980-81 1990-91 2000-01 2010-11
%
0
20
40
60
80
100
120
140
160
%
Irrigation % Cropping Intensity
Source: Ministry of Agriculture, ICICIdirect.com Research
Pradhan Mantri Krishi Sinchayee Yojana The new government at the Centre has proposed to initiate a scheme Pradhan Mantri Krishi Sinchayee Yojana (PMKSY) with the aim of providing assured irrigation to farmers to mitigate risks associated with the farmer’s dependence on monsoons for water feeding their farmlands. This scheme would facilitate access to irrigation and a sum of | 1,000 crore has been earmarked for the same in Union Budget FY15. The Ministry of Water Resources was made the nodal ministry for implementing the programme. As per recent media releases, the Prime Minister has emphasised on the early implementation of the PMKSY and even asked the nodal agency i.e. Ministry of Water Resources for comprehensive mapping and identification of water bodies across the country to link farmlands with at least one common water body in the nearest surrounding area. Emphasis has also been laid on using high tech technology like satellite imagery and 3D photography for guiding villages to the best possible sources of irrigation. At the broader level, the Ministry of Water Resources has been asked to identify river linking projects that could be immediately taken up for implementation. Going forward, the government’s thrust on increasing crop yield, bringing more area under irrigation, reducing the farmer’s dependency on monsoons and farmer’s preference for more energy efficient pumps are expected to drive the growth of the agriculture pumps industry domestically. This is expected to initiate a tactical shift from the unorganised to the organised segment. KSB, with a strong presence in the agricultural pump market, particularly in the agrarian states of Punjab and Haryana, is likely to be a key beneficiary of the same.

ICICI Securities Ltd | Retail Equity Research Page 11
3) Oil & gas; can provide up-tick but with aid of parent KSB AG The present refining capacity in India as of November 2014 stands at ~215 million tonne per annum (MTPA). It is expected to increase by ~90 MTPA to ~305 MTPA in future. The pump demand in the oil & gas segment may get a fillip from a) the upgradation of refining complexes to meet stringent fuel emission norms (Euro levels), b) new refining capacities coming on stream (~90 MTPA) and c) incremental capex to be incurred in exploration & production (E&P) segment. KSB, however, as of now is not actively present in this segment and can import pumps from its parent i.e. KSB AG if the need arises. As far as the piping network in India is considered, it currently stands at ~15,000 km and is envisaged at ~30,000 km in future, which will drive the growth of valves segment domestically. KSB with its strong presence in the valve segment through its own plant at Coimbatore and its associate company MIL Controls Ltd (49% ownership with KSB and 51% ownership with KSB AG) is well placed to cater to this demand, going forward.
Exhibit 20: Planned capex in oil & gas sector
Company FY13 FY14 FY15 FY16 FY17 Total Company FY13 FY14 FY15 FY16 FY17 TotalONGC 36571 36163 34042 30412 30274 167462 IOCL 15046 12754 12700 8585 7115 56200OIL 2764 2953 3302 3353 3291 15663 CPCL 1486 2310 3330 4020 4500 15646
BPCL 4479 6035 9091 9355 3829 32789HPCL 4605 4681 5060 2465 2738 19549NRL 664 776 1453 2572 3530 8995ONGC-MRPL 2825 2437 3386 6104 6485 21237
Plan Outlay in 12th five year plan (Exploration & Production) Plan Outlay in 12th five year plan (Refining)
Source: Ministry of Petroleum & Natural Gas, ICICIdirect.com Research
As per the plan outlay in the Twelfth Five Year Plan by the erstwhile Planning Commission, it is envisaged that the total capex to be incurred by E&P players would be ~| 1,80,000 crore while the same in the refining space would be ~| 1,50,000 crore over FY13-17E. 4) Metals; ambitious capacity addition in ferrous space to aid growth Given the developing status of the Indian economy and the central government’s thrust on augmenting manufacturing facilities domestically, large players are undergoing capacity expansions via ambitious mega steel projects. This bodes well for the domestic pump industry, which will create incremental pump demand, going forward.
Exhibit 21: Major projects; metals Cost
(| crore)SAIL NA OngoingJSW Steel 3300 Mar-16NMDC 15500 Mar-16Tata Steel 25000 Mar-15
Cost(| crore)
Tata Steel 10000 NAJSW Steel 40000 Post FY17EPOSCO-India 51000 NASAIL 125000 NA
Likely commissioning
New integrated steel plant of 12 MTPA capacity in OdishaCapacity expansion from 23.4 MTPA to 50 MTPA
Company New projects envisaged
Phase 1 of Kalinganagar steel project; 3 MTPA capacity
Phase 2 of Kalinganagar steel project; 3 MTPA capacityExpansion at Bellary steel plant (10 MTPA)
CompanyLikely
commissioningProjects under implementationUndergoing modernisation & expansion programme
Capacity expansion at Dolvi plant from 3.3 MTPA to 5 MTPANew integrated steel plant of 3 MTPA capacity
Source: Company, ICICIdirect.com Research
However, the same ambition is lacking in the non-ferrous space wherein only one major expansion is being planned by Sesa-Sterlite pertaining to the copper smelter (capex worth | 2500 crore) in Tuticorin, Tamil Nadu. In the non-ferrous space, the capacity expansion is subdued as huge incremental capacity is already ready to be commissioned but for want of raw material availability.
Thus, huge capex pipeline in the oil & gas sector is expected to provide a fillip to the pump demand. The government’s thrust on augmenting domestic crude production to mitigate energy risk also bodes well for domestic pump industry

ICICI Securities Ltd | Retail Equity Research Page 12
Industrial valves industry As per industry sources, the global industrial valves market size is pegged at US$63 billion as of 2014 and is expected to reach US$75 billion in 2017; growing at a CAGR of 6.0% in CY14-17E. The Indian industrial valves market size is pegged at ~| 9000 crore as of 2014 wherein majority of it i.e. ~98% (by volume) consists of on-off valves (80% by value i.e. ~| 7200 crore) while the remaining 2% (by volume) comprises control valves (20% by value i.e. ~| 1800 crore). The Indian industrial valves market is expected to grow at a CAGR of 7% in FY14-19E to | 12600 crore in FY19E.
Exhibit 22: Indian industrial valves market (growth trajectory)
9000
12600
0
2000
4000
6000
8000
10000
12000
14000
FY14 FY19E
| cr
ore
Source: FICCI, Tata Strategic Management Group, ICICIdirect.com Research
The Indian industrial valves market can also be segregated on the basis of end usage. The main sectors in which these valves find applications include: oil & gas (upstream, midstream, downstream), power, chemicals and fertiliser, among others.
Exhibit 23: Indian industrial valves market segregation (value)
others, | 2133 cr, 24%
PCF , | 1287 cr, 14%
Power, | 1314 cr, 15%
Oil & Gas (downstream), |
2349 cr, 25%
Oil & Gas (midstream), |
972 cr, 11%
Oil & Gas (upstream), | 945 cr, 11%
Source: FICCI, Tata Strategic Management Group, ICICIdirect.com Research PCF: Petrochemical, Chemical & Fertilizer
The Indian valves market is highly fragmented with a lot of small & medium enterprises (SMEs) vying for the market pie. In the organised segment, the main players include L&T Valves (Audco India Ltd), Tyco, Virgo, KSB and Intervalve among others.
Global valves market
63
75
55
60
65
70
75
80
2014 2017E
US$
Billio
n
Source: Ficci, TSMG, ICICIdirect.com Research
CAGR over 2014-17E: 6%
CAGR over 2014-17E: 7%
Oil & gas constitutes a mammoth ~47.4% of the entire industrial valves segment amounting to ~| 4250 crore, followed by power that constitutes 14.6% (~| 1300 crore). Petrochemical, chemical & fertilisers constitute 14.3% of this segment amounting to ~| 1300 crore

ICICI Securities Ltd | Retail Equity Research Page 13
Calibrated approach; chasing profitability not growth KSB is also one of the leading manufacturers of industrial valves and manufactures a wide range of on/off valves. It has an ultra modern manufacturing facility in Coimbatore, Tamil Nadu. KSB’s sales from the valve segment have grown at a CAGR of 0.8% in CY07-13 to | 122 crore in CY13 (| 117 crore in CY07). On the profitability front, its EBIT margins are on a declining trend with EBIT margins declining to mere 1.6% (EBIT of | 2 crore) in CY13, a sharp drop from the peak EBIT margins realised in CY08 at 25.7% (EBIT at | 32 crore). Despite being a reliable brand in the valves market, the company’s profitability in this segment is subdued due to the enhanced presence of the unorganised segment, thereby resulting in fierce competition. Exhibit 24: KSB valves segmental revenue, EBIT & EBIT % (Annual)
117
124
85 103 14
1
146
122
25.6 32 11.1
5.2
15.8
16 2
21.9
25.7
13.0
5.0
11.2 10.9
1.60
20
40
60
80
100
120
140
160
CY07 CY08 CY09 CY10 CY11 CY12 CY13
| cr
ore
0
5
10
15
20
25
30
%
Sales EBIT EBIT %
Source: Company, ICICIdirect.com Research
The subdued EBIT margins of the valves segment have resulted in a steep fall in segmental RoCEs (valve segment RoCEs have declined from 18.8% in CY11 to 2.3% in CY13). This, in turn, has shadowed the robust performance of the pumps division (pumps segment RoCEs have improved from 15.4% in CY11 to 36.2% in CY13.
Exhibit 25: KSB segmental RoCEs (pumps & valves)
31.8
15.4
25.4
36.2
7.6
18.8 18.2
2.30
5
10
15
20
25
30
35
40
CY10 CY11 CY12 CY13
%
ROCE (Pumps) ROCE (Valves)
Source: Company, ICICIdirect.com Research
Going forward, the company expects to consolidate its position in the valves market with focus on increasing profitability rather than chasing sales growth. Going forward, post the blip in CY14E (sales of | 111 crore in CY14E vis-à-vis | 122 crore in CY13) we expect valves sales to largely remain flat with CY15E sales at | 117 crore & CY16E sales at | 122 crore.
KSB valves segment sales
146
122111 117 122
020406080
100120140160
CY12 CY13 CY14E CY15E CY16E
| cr
ore
Source: Company, ICICIdirect.com Research

ICICI Securities Ltd | Retail Equity Research Page 14
MIL Controls Ltd: Feather in the cap; small but key player MIL Controls Ltd (MIL) is an associate company of KSB (ownership share 49%) and a subsidiary of the parent i.e. KSB AG (ownership share 51%) involved in manufacturing high precision critical industrial control valves in India. KSB had made an initial investment worth | 6.3 crore in MIL and is reaping rich returns out of it. MIL’s contribution to KSB’s consolidated PAT in CY13 came in at | 9.6 crore (160% RoI in CY13). We believe MIL, even though small, will remain key and be a feather in KSB’s cap, going forward. MIL was set up in 1984 in technical collaboration with Masoneilan International Inc. in Kerala and has over two decades of unparalleled experience in manufacturing control valves in India. These valves not only find application domestically but are also exported worldwide by the parent group i.e. KSB AG. They find application in thermal & nuclear power plants, exploration & production of oil, gas & oil products (petrochemicals) and chemical industry (process industry), including fertilisers. Exhibit 26: Financials- MIL Particulars Units CY09 CY10 CY12 CY13Net Sales | crore 77.1 95.2 137.3 132.6EBITDA | crore 22.8 29.9 36.7 35.5EBITDA Margin % 29.6 31.4 26.8 26.8PAT | crore 13.8 18.5 22.6 21.0PAT margins (%) % 17.9 19.4 16.5 15.8
Gross Block | crore 26.0 32.2 42.0 66.4Asset Turnover x 3.0 3.0 3.3 2.0
Equity | crore 41.3 50.5 73.0 81.5Debt | crore 0.0 0.0 0.0 0.0
ROCE % 51.6 61.6 44.7 39.6ROE % 33.3 40.2 31.0 27.1
Source: Capitaline, ICICIdirect.com Research
MIL’s sales have grown at a CAGR of 14.5% in CY09-13 to | 132.6 crore in CY13. By virtue of its technological intensive product profile, it realised healthy 26.8% EBITDA margins in CY13. The RoE and RoCE in this division also stood at 27.1% and 39.6%, respectively, in CY13.
Exhibit 27: MIL (PBT, KSB’s share in profit)
20.0 19.020.9
27.9 28.1
33.831.7
6.4 6.0 6.89.0 8.9 8.3 9.6
0
5
10
15
20
25
30
35
40
CY07 CY08 CY09 CY10 CY11 CY12 CY13
| cr
ore
PBT Share in PAT
Source: Company, ICICIdirect.com Research
Going forward, we have built in a 9.0% CAGR (CY13-16E) in its PAT contribution to the consolidated numbers of KSB. We have built in KSB’s share of PAT from MIL at | 10.1 crore, | 11.1 crore and | 12.4 crore in CY14E, CY15E and CY16E, respectively.
MIL Control Valves Product Profile
Usage Diagram End Customers
Boiler feed pump recirculation
High pressure steam vent & condenser dump application
Heat transfer & moderator system control valves for nuclear power plants
Anti surge control valves
Water injection control valves in oil fields
Urea let down valves and low noise valves for steam applications
RCF, Iffco, Indo-Gulf Fertilizer Corporation, Manglore Chemicals & Fertilizers, Zuari Industries, etc
Fertilizers
Aerospace Sector
MIL Controls is associated with Isro for supply of cryogenic control valves including bellows sealed & vacuum jacketed for
LPSC – Mahendragiri Cryogenic Test facilities. Approximately 500 valves have been supplied to Isro for their test facility
Energy Sector
Bhel, L&T, Alstom, Doosan,
Thermax, IJT, Nuclear Power Corporation of India, Nalco,
Reliance Energy, Siemens
OIL & GAS Sector
HPCL, IOC, BPCL, ONGC, Cairn India, CPCL, EIL, Kuwait Oil Company,
Jacobs, Haldia Petrochemicals,
Toyo Engineering Corporation,
Gail, etc
Source: Company, ICICIdirect.com Research

ICICI Securities Ltd | Retail Equity Research Page 15
KSB Tech: R&D unit; owned by parent KSB by virtue of being a subsidiary of KSB AG does not spend a considerable amount on R&D and receives support for the same from its parent i.e. KSB AG. KSB’s expenditure on R&D in CY13 stood at | 0.2 crore vis-à-vis its consolidated sales of | 733 crore. R&D expense as a percentage of sales stood at a mere 0.03%. On the other hand, KSB AG’s expenditure on R&D in CY13 stood at €47 million vis-à-vis its consolidated sales of €2247 million; R&D expense as a percentage of sales stood at 2.1%. KSB AG has an entity i.e. KSB Tech Pvt Ltd, which operates out of Pune, the complete ownership (100%) of which is with KSB AG. KSB Tech helps the parent in meeting its global requirements of engineering inventions, designs, renovations, improvements, etc. for its business worldwide.
Exhibit 28: KSB; R&D expenditure, sales and R&D (as % of sales)
0.7 0.5 0.5 0.5 0.1 0.2 0.2
467 59
8
565 610 74
9
715
733
0.16
0.08 0.08 0.08
0.010.03 0.03
0
100
200
300
400
500
600
700
800
CY07 CY08 CY09 CY10 CY11 CY12 CY13
| cr
ore
0.000.020.040.060.080.100.120.140.160.18
%
R&D Expense Sales as % of Sales
Source: Company, ICICIdirect.com Research
Exhibit 29: KSB AG, R&D expenditure, sales & R&D (as % of sales)
31 32 34 41 42 45 47
1771 19
92
1893
1939 2091 22
68
2247
1.81.6
1.8
2.1 2.0 2.02.1
0
500
1000
1500
2000
2500
CY07 CY08 CY09 CY10 CY11 CY12 CY13
milli
on E
UR
0.0
0.5
1.0
1.5
2.0
2.5
%
R&D Expense Sales as % of Sales
Source: Bloomberg, ICICIdirect.com Research
The activities financed under R&D expense include hydraulics, materials technology and automation. The group employs 531 (previous year 440) employees under its R&D division while staff costs accounted for ~50% of the total amount spend on research & development.

ICICI Securities Ltd | Retail Equity Research Page 16
Risks & Concerns Royalty By virtue of technology transfer and support from the parent group i.e. KSB AG, KSB pays a royalty fee amounting to ~2% of its sales. The company’s management has guided for a royalty payment of 2-5% (of sales value) depending upon the product to its parent company. The total royalty outgo consists of direct royalty payments, professional fee and technical fee. Exhibit 30: Royalty payment (including components) Particulars Units CY07 CY08 CY09 CY10 CY11 CY12 CY13Royalty | crore 6.4 2.8 0.5 1.0 4.2 3.0 5.3Professional Fee | crore 3.4 0.9 0.4 2.6 5.2 4.8 6.9Technical Fee | crore 0.0 0.3 0.1 0.3 0.0 0.3 1.1Total Outgo | crore 9.8 4.0 1.0 3.9 9.4 8.1 13.3Sales | crore 465.4 596.9 563.8 608.6 746.7 713.8 731.3% of Sales % 2.1 0.7 0.2 0.6 1.3 1.1 1.8
Source: Company, ICICIdirect.com Research
Therefore, any increases in the royalty outgo (as a percentage of sales), going forward, will have an adverse impact on the company’s profitability with a direct impact on our target price calculations.
Commission to sole selling agent KSB has appointed its sister concern i.e. KSB Singapore (Asia Pacific) Pte Ltd as its sole selling agent in all territories outside India (exports) for a period of three years from February 20, 2014. The company is authorised to pay up to 12.5% of sales (value) as commission to the aforesaid entity. However, currently, for the past few years i.e. CY10-13, this commission is being paid at ~10%. Exhibit 31: Commission to sole selling agent Particulars Units CY07 CY08 CY09 CY10 CY11 CY12 CY13Exports | crore 33.3 82.6 78.2 63.3 70.1 103.4 106.8Comm to sole selling agents | crore 4.31 10.3 9.8 6.3 7.01 10.3 10.1% of Exports % 12.9 12.5 12.5 10.0 10.0 10.0 9.5
Source: Company, ICICIdirect.com Research
Therefore, going forward, any increase in this commission paid to this sole selling agent i.e. KSB Singapore will have adverse impact on the company profitability, thereby directly impacting our target price calculation.
Volatility in raw materials prices, especially steel price Iron derivative products like pig iron, iron castings, stampings, metal scrap, etc. form the major raw material costs for pumps & valves with the management guiding that ~35% of the sales value is composed of iron products (35%of sales equivalent to ~80% of raw material costs; raw material as a percentage of sales at ~45%). Exhibit 32: Steel i.e. key raw material price sensitivity (CY16E numbers)
-10% -5% 5% 10%RM as a % of Sales % 40.0 42.3 44.5 46.8 49EBITDA Margins % 21.9 19.7 17.4 15.2 12.9Change in PAT % 25.3 12.7 NA -12.7 -25.3EPS % 25.3 12.7 NA -12.7 -25.3Target Price % 1014 912 810 707 605
Particulars Unit Base CaseRise in Steel PriceDrop in Steel Price
Source: Company, ICICIdirect.com Research
We have modelled steel price to be a complete pass through for the company. However, any inability of the company to pass through the increase in steel costs will dent EBITDA margins and will have a consequent negative impact on our target price calculation.
One point worth mentioning here is that due to this arrangement the company does not deploy any resources in the exports market. The same is centralised with its Singapore arm on a global basis
It has been observed that for every 5% increase in steel price and KSB’s pump realisation remaining same; our target price reduces by ~12.7% i.e. | 103/share
ICICI Securities Ltd | Retail Equity Research Page 17
Financials Consolidated revenues to grow at 10.8% CAGR in CY13-16E
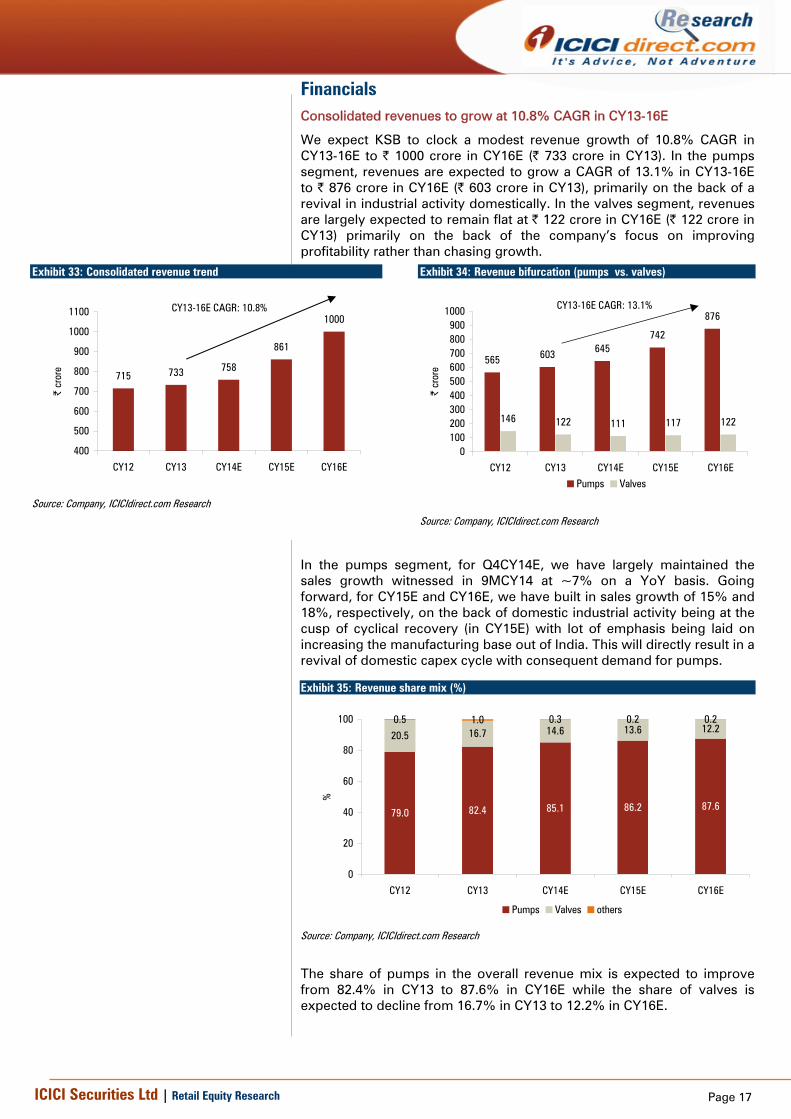
We expect KSB to clock a modest revenue growth of 10.8% CAGR in CY13-16E to | 1000 crore in CY16E (| 733 crore in CY13). In the pumps segment, revenues are expected to grow a CAGR of 13.1% in CY13-16E to | 876 crore in CY16E (| 603 crore in CY13), primarily on the back of a revival in industrial activity domestically. In the valves segment, revenues are largely expected to remain flat at | 122 crore in CY16E (| 122 crore in CY13) primarily on the back of the company’s focus on improving profitability rather than chasing growth.
Exhibit 33: Consolidated revenue trend
715 733 758
861
1000
400
500
600
700
800
900
1000
1100
CY12 CY13 CY14E CY15E CY16E
| cr
ore
Source: Company, ICICIdirect.com Research
Exhibit 34: Revenue bifurcation (pumps vs. valves)
565 603 645742
876
146 122 111 117 122
0100200300400500600700800900
1000
CY12 CY13 CY14E CY15E CY16E
| cr
ore
Pumps Valves
Source: Company, ICICIdirect.com Research
In the pumps segment, for Q4CY14E, we have largely maintained the sales growth witnessed in 9MCY14 at ~7% on a YoY basis. Going forward, for CY15E and CY16E, we have built in sales growth of 15% and 18%, respectively, on the back of domestic industrial activity being at the cusp of cyclical recovery (in CY15E) with lot of emphasis being laid on increasing the manufacturing base out of India. This will directly result in a revival of domestic capex cycle with consequent demand for pumps.
Exhibit 35: Revenue share mix (%)
79.0 82.4 85.1 86.2 87.6
20.5 16.7 14.6 13.6 12.20.5 1.0 0.3 0.2 0.2
0
20
40
60
80
100
CY12 CY13 CY14E CY15E CY16E
%
Pumps Valves others
Source: Company, ICICIdirect.com Research
The share of pumps in the overall revenue mix is expected to improve from 82.4% in CY13 to 87.6% in CY16E while the share of valves is expected to decline from 16.7% in CY13 to 12.2% in CY16E.
CY13-16E CAGR: 10.8% CY13-16E CAGR: 13.1%

ICICI Securities Ltd | Retail Equity Research Page 18
Consolidated EBITDA to grow 20.0% CAGR in CY13-16E We expect KSB’s consolidated EBITDA to grow at a CAGR of 20.0% in CY13-16E to | 174 crore in CY16E, primarily on the back of an improvement in EBITDA margins from 13.8% in CY13 to 17.4% in CY16E (i.e. 360 bps improvement in EBITDA margins). EBITDA margins are expected to improve on the back of subdued pig iron prices (key raw material), increasing share of profitable pumps segment in the overall sales mix and benefits of operating leverage kicking in by virtue of increased sales out of the same fixed asset base i.e. better capacity utilisation levels (increased asset turnover). Over the last 10 years, peak asset turn recorded by KSB was at 2.6x in CY08 after which it moved southwards to 1.9x in CY14. However, with a revival in demand, we believe KSB can scale back to asset turns in excess of 2x by CY16E. Exhibit 36: EBITDA & EBITDA margins (%) trend
92 101
112 14
4 174
17.416.714.8
13.812.9
0
50
100
150
200
CY12 CY13 CY14E CY15E CY16E
| cr
ore
0
5
10
15
20
%
EBITDA EBITDA Margins
Source: Company, ICICIdirect.com Research
Exhibit 37: Asset turnover Particulars Units CY08 CY09 CY10 CY11 CY12 CY13 CY14E CY15E CY16ESales | crore 598 565 610 749 715 733 758 861 1000Gross Block | crore 231 264 310 327 352 388 418 448 478Asset Turnover x 2.6 2.1 2.0 2.3 2.0 1.9 1.8 1.9 2.1
Source: Company, ICICIdirect.com Research
Consolidated PAT to grow 22.5% CAGR in CY13-16E We expect KSB’s PAT to grow at a CAGR of 22.5% in CY13-16E to | 123 crore in CY16E (| 67 crore in CY13) on the back of a pick-up in sales and improvement in EBITDA margins.
Exhibit 38: Consolidated PAT trend
64 6778
101
123
0
20
40
60
80
100
120
140
CY12 CY13 CY14E CY15E CY16E
| cr
ore
Source: Company, ICICIdirect.com Research
CY13-16E CAGR: 22.5%

ICICI Securities Ltd | Retail Equity Research Page 19
RoCE & RoE set to improve, payout expected to be maintained at ~30% With increasing profitability, we expect return ratios to improve, going forward. We expect RoCE to improve from 14.4% in CY13 to 19.6% in CY16E. The RoE is also expected to improve from 13.0% in CY13 to 17.1% in CY16E.
Exhibit 39: RoIC, RoCE & RoE trend
19.121.0 22.0
28.2
33.1
14.1 14.4 14.817.8
19.6
13.6 13.0 13.915.9 17.1
0
5
10
15
20
25
30
35
40
CY12 CY13 CY14E CY15E CY16E
%
RoIC RoCE RoE
Source: Company, ICICIdirect.com Research
Exhibit 40: EPS, DPS & dividend payout
18.3 19.222.5
28.935.2
5.5 5.5 6.5 7.5 9.5
30.2 28.8 28.925.9
27.0
0
5
10
15
20
25
30
35
40
CY12 CY13 CY14E CY15E CY16E
|/sh
are
0
5
10
15
20
25
30
35
%
EPS DPS Dividend Payout Ratio
Source: Company, ICICIdirect.com Research
The company has maintained a healthy dividend payout at 30.2% in CY12 and 28.8% in CY13. We expect KSB to maintain this healthy payout at ~30%, going forward. We expect the company to record an EPS of | 22.5 in CY14E, | 28.9 in CY15E and | 35.2 in CY16E. The corresponding dividend is expected at | 6.5/share in CY14E, | 7.5/share in CY15E and | 9.5/share in CY16E.
Cash flows to improve; CFO/EBITDA at 0.8x, FCF yield to remain healthy
By virtue of following prudent working capital management norms, the cash generation of KSB is healthy with CFO to EBITDA at 1.3x in CY13. Going forward, we expect KSB to realise healthy cash flows with CFO-EBITDA averaging at ~0.8x. On the free cash flow front, the company has no major capex plans in the near future and intends to spend an amount equivalent to its depreciation annually as capex expenditure for refurbishing its existing facilities. Going forward, the company is expected to record FCF of | 64 crore in CY14E, | 90 crore in CY15E and | 114 crore in CY16E.
Exhibit 41: CFO, EBITDA, CFO-EBITDA trend
142
130
94
120 14
4
92 101 112 14
4 174
1.5
1.3
0.8 0.8 0.8
020406080
100120140160180200
CY12 CY13 CY14E CY15E CY16E
| cr
ore
0.00.20.40.60.81.01.21.41.61.8
x
CFO EBITDA CFO:EBITDA
Source: Company, ICICIdirect.com Research
Exhibit 42: Free cash flow, free cash flow yield
96 99
64
90
114
4.0 4.2
2.7
3.8
4.8
0
20
40
60
80
100
120
CY12 CY13 CY14E CY15E CY16E
| cr
ore
0
1
2
3
4
5
6
%
FCF FCF Yield
Source: Company, ICICIdirect.com Research

ICICI Securities Ltd | Retail Equity Research Page 20
Valuation KSB is among the industry leaders in the pumps segment domestically with a strong presence in the industrial (power segment) and agricultural segments. KSB has no exposure to the project/EPC business in India with strong focus on product business, which will always keep its working capital cycle under control. The company realises 65% of its pumps segment revenues from the technology intensive industrial pumps segment wherein it enjoys leadership and, consequent, higher EBITDA margins. Domestically, industrial activity has been subdued in the recent past with mining operations across the country taking a hit due to policy logjam. The same was reflected in the IIP index, which fell from 8.2% in FY11 to -0.1% in FY14. However, with a new government at the helm and the recent initiatives undertaken by them viz. coal blocks auctioning (to increment coal production so to as to increase power generation) and thrust on making India a global manufacturing hub (Make in India campaign) bodes well for the domestic pump industry and is likely to lead to a rejuvenation of the industry, going forward. We expect KSB to record modest revenue growth of 10.8% CAGR in CY13-16E to | 1000 crore in CY16E (| 733 crore in CY13). In the pumps segment, revenues are expected to grow at a CAGR of 13.1% in CY13-16E to | 876 crore in CY16E (| 603 crore in CY13). In the valves segment, revenues are largely expected to remain flat at | 122 crore in CY16E (| 122 crore in CY13) primarily on the back of the company’s focus on improving profitability rather than chasing growth. The EBITDA and PAT are expected to grow at a CAGR of 20.0% and 22.5%, respectively, in CY13-16E. We have valued the company at 23x P/E (1x PEG) on CY16E EPS of | 35.2 and arrived at a target price of | 810 with a BUY rating on the stock. We believe KSB is a quality play and any correction in the stock price should be used a buying opportunity in the counter. With industrial activity at the cusp of a cyclical recovery, we believe KSB is on a strong footing on recovery with increasing sales and profitability, going forward.
Exhibit 43: Peer comparison (financials) (| crore)
CY11/FY12 CY12/FY13 CY13/FY14 CY11/FY12 CY12/FY13 CY13/FY14 CY11/FY12 CY12/FY13 CY13/FY14 CY11/FY12 CY12/FY13 CY13/FY14KSB Pumps 2367 3.2 749 715 733 71 92 101 9.4 12.9 13.8 49 64 67Kirloskar Bros 1659 297 2554 2612 2682 135 200 199 5.3 7.7 7.4 49 66 64WPIL 601 195 368 510 511 45 70 82 12.3 13.7 16.0 22 41 30Shakti Pumps 364 113 192 209 292 31 30 43 16.0 14.4 14.8 14 17 25Roto Pumps 203 20 76 89 90 14 16 18 18.2 18.0 20.4 7 8 10
PAT (| crore)
Company
EBITDA Margin (%)
DebtMarket
Cap
Sales (| crore) EBITDA (| crore)
Source: Capitaline, ICICIdirect.com Research
Exhibit 44: Peer comparison (valuation)
CY14E/ FY15E
CY15E/ FY16E
CY16E/ FY17E
CY14E/ FY15E
CY15E/ FY16E
CY16E/ FY17E
CY14E/ FY15E
CY15E/ FY16E
CY16E/ FY17E
CY14E/ FY15E
CY15E/ FY16E
CY16E/ FY17E
KSB Pumps 2367 30.2 23.5 19.3 19.5 14.9 12.0 4.2 3.7 3.3 13.9 15.9 17.1Kirloskar Bros 1659 48.6 17.7 13.9 13.6 8.4 7.3 1.7 1.6 1.5 3.5 9.3 10.9WPIL 601 25.3 22.8 NA 15.8 14.1 NA 4.1 3.5 NA 16.4 15.4 NAShakti Pumps 364 12.6 11.4 NA 7.4 6.7 NA 2.2 1.9 NA 17.7 16.4 NARoto Pumps 203 20.2 18.4 NA 11.6 10.4 NA 3.6 3.0 NA 18.2 17.0 NA
Market Cap (|
crore)
ROE (%)
Company
P/E (x) EV/EBITDA (x) P/B (x)
Source: Bloomberg, ICICIdirect.com Research
We also believe that phased implementation of the Goods & Services Tax (GST) and a shift towards star rated pumps (energy rating) is likely to result in a shift of the residual domestic pump market from the unorganised segment to the organised segment. This, in turn, will also be beneficial for KSB.

ICICI Securities Ltd | Retail Equity Research Page 21
Trading Multiples Exhibit 45: Two year forward P/E (KSB currently trading at 19.3x)
0
100
200
300
400
500
600
700
800
Jan-
07
Jul-0
7
Jan-
08
Jul-0
8
Jan-
09
Jul-0
9
Jan-
10
Jul-1
0
Jan-
11
Jul-1
1
Jan-
12
Jul-1
2
Jan-
13
Jul-1
3
Jan-
14
Jul-1
4
Jan-
15
(|)
Price 21x 18x 15x 13x 11x 10x 8x
Source: Reuters, ICICIdirect.com Research
Comparison vis-à-vis MNC players KSB, by virtue of being a subsidiary of an MNC group i.e. KSB AG, can also be compared to other MNC listed entities in India viz. Bosch, SKF India, Wabco, etc. in the engineering space and Gillette India, Nestlé, HUL, etc. in the consumer space. However, one noteworthy point that comes across in the comparison is the superior FCF yield of KSB vis-à-vis all listed MNC players in India. The FCF yield of KSB on a trailing basis stood at ~4.2% vis-à-vis average of ~1% of companies in the engineering space and average of ~2% of companies in the consumer space. While FCF yield on the two year forward basis for KSB stood at ~4.8% vis-à-vis average of ~3% of companies in the engineering space and average of ~2% of the companies in the consumer space. This reiterates our positive stance on KSB.
Exhibit 46: FCF yield & P/E multiple for major MNC players in India
Consumer CompaniesGillette India 11103 18.2 13.9 -16.0 22.1 0.33 NA 217.4 146.4Nestle 70563 13.2 11.7 10.9 14.0 2.1 2.4 62.7 42.7HUL 202478 14.1 11.2 19.7 10.9 1.7 2.5 51.3 37.5P&G 19963 27.0 19.5 26.0 20.7 1.2 NA 66.3 37.8Average Cons (excl Gillette) 18.1 14.1 18.9 15.2 1.7 2.4 60.1 39.3Engineering CompaniesBOSCH 73741 9.2 15.6 1.0 22.8 1.1 2.1 82.3 45.5SKF India 7588 2.8 14.4 -1.9 24.7 1.5 3.7 45.8 25.1FAG Bearing 6467 11.0 19.7 0.0 29.3 1.8 1.9 52.4 27.2Cummins 24983 0.3 17.2 0.5 18.9 0.0 3.4 41.5 24.5WABCO 10053 8.3 28.7 -2.7 38.8 0.9 2.9 86.0 33.3
ABB 28360 7.1 9.0 41.6 41.0 0.1 1.7 157.6 58.4
Siemens 37749 -3.6 13.1 -10.6 16.9 1.2 2.5 113.4 40.3
Average Engg 5.0 16.8 4.0 27.5 0.9 2.6 82.7 36.3
Total Average (excl Gillette) 8.9 16.0 8.4 23.8 1.2 2.6 75.9 37.2
KSB Pumps 2367 6.3 11.3 4.5 22.5 4.2 4.8 35.7 19.3
Company'sMarket
Capitalization (| crore)
Sales CAGR FY11-14 (%)
Sales CAGR FY14-17E (%)
PAT CAGR FY11-14 (%)
P/E 2 yr fwd (x)
PAT CAGR FY14-17E (%)
FCF Yield Trailing (%)
FCF Yield Forward (%)
P/E TTM (x)
Source: Bloomberg, ICICIdirect.com Research
KSB is currently trading at 35.6x TTM P/E while its engineering counterparts are trading at 82.7x TTM P/E (on an average basis). On the two year forward front, the stock is trading at 19.3x P/E while its engineering counterparts are trading at 36.3x P/E.

ICICI Securities Ltd | Retail Equity Research Page 22
Financial Summary (Consolidated) Exhibit 47: Profit and Loss (| crore)
(Year-end March) CY12 CY13 CY14E CY15E CY16ENet Sales 715.4 732.7 758.5 860.8 1,000.2 Other Operating Income - - 7.7 8.5 9.3 Total Operating Income 715.4 732.7 766.2 869.3 1,009.6 Other Income 14.4 12.7 21.6 23.9 27.5 Total Revenue 729.8 745.4 787.7 893.2 1,037.0
Raw Material Expenses 358.1 344.4 346.6 379.7 448.4 Employee Expenses 103.7 110.1 124.2 139.7 155.8 other operating costs 161.6 177.4 183.4 205.9 231.7 Total Operating Expenditure 623.4 631.9 654.3 725.3 835.9
EBITDA 92.0 100.8 111.9 144.0 173.7 Interest 5.2 2.6 1.9 1.9 1.9 PBDT 101.2 110.9 131.6 166.1 199.3 Depreciation 23.5 26.5 28.2 30.3 32.4 PBT 78.6 85.5 103.4 135.7 166.8 Total Tax 23.3 28.4 35.1 46.2 56.7 PAT before MI 55.3 57.1 68.2 89.6 110.1 Profit from Associates 8.3 9.6 10.1 11.1 12.4 PAT 63.6 66.7 78.3 100.7 122.5
Source: Company, ICICIdirect.com Research
Exhibit 48: Balance Sheet (| crore)(Year-end March) CY12 CY13 CY14E CY15E CY16EEquity Capital 34.8 34.8 34.8 34.8 34.8 Reserve and Surplus 432.5 477.0 528.8 599.0 682.8 Total Shareholders funds 467.3 511.8 563.6 633.8 717.6 Total Debt 16.9 3.2 3.2 3.2 3.2 Deferred Tax Liability - - - - - Other Non Current Liabilities 5.6 6.0 6.0 6.0 6.0 Liability side total 489.8 521.1 572.9 643.0 726.8
AssetsGross Block 352.1 388.4 418.4 448.4 478.4 Accumulated Depreciation 193.5 207.0 235.2 265.6 298.0 Net Block 158.6 181.4 183.2 182.8 180.4 Total CWIP 26.6 8.1 8.1 8.1 8.1 Total Fixed Assets 185.2 189.5 191.3 190.9 188.5
Other Investments 42.8 48.5 58.6 69.7 82.1
Inventory 193.5 183.3 187.0 212.3 246.6 Debtors 146.1 126.7 145.5 165.1 191.8 Loans and Advances 70.6 79.7 79.6 86.1 90.0 Other Current Assets 2.8 3.5 3.8 4.3 5.0 Cash 105.2 160.0 185.0 231.2 291.8 Total Current Assets 518.2 553.2 600.9 698.9 825.3 Creditors 206.5 225.5 228.6 259.4 301.4 Provisions 57.4 52.4 57.1 64.9 75.4 Net Current Assets 254.3 275.3 315.2 374.6 448.5
Deferred Tax Assets 7.5 7.8 7.8 7.8 7.8 Assets side total 489.8 521.1 572.9 643.0 726.8
Source: Company, ICICIdirect.com Research

ICICI Securities Ltd | Retail Equity Research Page 23
Exhibit 49: Cash flow statement (| crore)
(Year-end March) CY12 CY13 CY14E CY15E CY16EProfit after Tax 63.6 66.7 78.3 100.7 122.5 Depreciation 23.5 26.5 28.2 30.3 32.4 Cash Flow before working capital changes 92.3 95.8 108.4 132.9 156.8
Net Increase in Current Assets 43.7 19.8 (22.7) (51.8) (65.8) Net Increase in Current Liabilities 6.0 14.0 7.8 38.6 52.5 Net cash flow from operating activities 142.0 129.6 93.5 119.6 143.6
(Purchase)/Sale of Fixed Assets (46.3) (30.8) (30.0) (30.0) (30.0) Other Investments (4.4) (5.7) (10.1) (11.1) (12.4) Net Cash flow from Investing Activities (47.3) (36.4) (40.1) (41.1) (42.4)
Inc / (Dec) in Equity Capital - - - - - Inc / (Dec) in Loan Funds (46.3) (13.7) - - - Dividend & Dividend Tax (22.4) (22.4) (26.5) (30.5) (38.7) Net Cash flow from Financing Activities (73.9) (38.5) (28.3) (32.4) (40.6)
Net Cash flow 20.8 54.8 25.1 46.1 60.6 Cash and Cash Equivalent at the beginning 84.4 105.2 160.0 185.0 231.2 Closing Cash/ Cash Equivalent 105.2 160.0 185.0 231.2 291.8
Source: Company, ICICIdirect.com Research
Ratios
Exhibit 50: Ratio Analysis (Year-end March) CY12 CY13 CY14E CY15E CY16EPer Share DataEPS 18.3 19.2 22.5 28.9 35.2 Cash EPS 25.0 26.8 30.6 37.6 44.5 BV 134.2 147.0 161.9 182.1 206.1 Operating profit per share 26.4 29.0 32.1 41.4 49.9 Operating RatiosEBITDA Margin 12.9 13.8 14.6 16.6 17.2 PAT Margin 8.9 9.1 10.2 11.6 12.1 Return RatiosRoE 13.6 13.0 13.9 15.9 17.1 RoCE 14.1 14.4 14.8 17.8 19.6 RoIC 19.1 21.0 22.0 28.2 33.1 Valuation RatiosEV / EBITDA 24.8 21.9 19.5 14.9 12.0 P/E 37.2 35.5 30.2 23.5 19.3 EV / Net Sales 3.2 3.0 2.9 2.5 2.1 Sales / Equity 1.5 1.4 1.3 1.4 1.4 Market Cap / Sales 3.3 3.2 3.1 2.7 2.4 Price to Book Value 5.1 4.6 4.2 3.7 3.3 Turnover RatiosAsset turnover 1.4 1.4 1.4 1.4 1.5 Debtors Turnover Ratio 4.9 5.8 5.2 5.2 5.2 Creditors Turnover Ratio 3.5 3.2 3.3 3.3 3.3 Solvency RatiosDebt / Equity 0.0 0.0 0.0 0.0 0.0 Current Ratio 2.0 2.0 2.1 2.2 2.2
Quick Ratio 1.2 1.3 1.4 1.5 1.5
Source: Company, ICICIdirect.com Research

ICICI Securities Ltd | Retail Equity Research Page 24
RATING RATIONALE ICICIdirect.com endeavours to provide objective opinions and recommendations. ICICIdirect.com assigns ratings to its stocks according to their notional target price vs. current market price and then categorises them as Strong Buy, Buy, Hold and Sell. The performance horizon is two years unless specified and the notional target price is defined as the analysts' valuation for a stock. Strong Buy: >15%/20% for large caps/midcaps, respectively, with high conviction; Buy: >10%/15% for large caps/midcaps, respectively; Hold: Up to +/-10%; Sell: -10% or more;
Pankaj Pandey Head – Research [email protected]
ICICIdirect.com Research Desk, ICICI Securities Limited, 1st Floor, Akruti Trade Centre, Road No 7, MIDC, Andheri (East) Mumbai – 400 093

ICICI Securities Ltd | Retail Equity Research Page 25
ANALYST CERTIFICATION We /I, Chirag Shah PGDBM; Shashank Kanodia MBA (Capital Markets), Research Analysts, authors and the names subscribed to this report, hereby certify that all of the views expressed in this research report accurately reflect our views about the subject issuer(s) or securities. We also certify that no part of our compensation was, is, or will be directly or indirectly related to the specific recommendation(s) or view(s) in this report.
Terms & conditions and other disclosures: ICICI Securities Limited (ICICI Securities) is a full-service, integrated investment banking and is, inter alia, engaged in the business of stock brokering and distribution of financial products. ICICI Securities is a wholly-owned subsidiary of ICICI Bank which is India’s largest private sector bank and has its various subsidiaries engaged in businesses of housing finance, asset management, life insurance, general insurance, venture capital fund management, etc. (“associates”), the details in respect of which are available on www.icicibank.com. ICICI Securities is one of the leading merchant bankers/ underwriters of securities and participate in virtually all securities trading markets in India. We and our associates might have investment banking and other business relationship with a significant percentage of companies covered by our Investment Research Department. ICICI Securities generally prohibits its analysts, persons reporting to analysts and their relatives from maintaining a financial interest in the securities or derivatives of any companies that the analysts cover. The information and opinions in this report have been prepared by ICICI Securities and are subject to change without any notice. The report and information contained herein is strictly confidential and meant solely for the selected recipient and may not be altered in any way, transmitted to, copied or distributed, in part or in whole, to any other person or to the media or reproduced in any form, without prior written consent of ICICI Securities. While we would endeavour to update the information herein on a reasonable basis, ICICI Securities is under no obligation to update or keep the information current. Also, there may be regulatory, compliance or other reasons that may prevent ICICI Securities from doing so. Non-rated securities indicate that rating on a particular security has been suspended temporarily and such suspension is in compliance with applicable regulations and/or ICICI Securities policies, in circumstances where ICICI Securities might be acting in an advisory capacity to this company, or in certain other circumstances. This report is based on information obtained from public sources and sources believed to be reliable, but no independent verification has been made nor is its accuracy or completeness guaranteed. This report and information herein is solely for informational purpose and shall not be used or considered as an offer document or solicitation of offer to buy or sell or subscribe for securities or other financial instruments. Though disseminated to all the customers simultaneously, not all customers may receive this report at the same time. ICICI Securities will not treat recipients as customers by virtue of their receiving this report. Nothing in this report constitutes investment, legal, accounting and tax advice or a representation that any investment or strategy is suitable or appropriate to your specific circumstances. The securities discussed and opinions expressed in this report may not be suitable for all investors, who must make their own investment decisions, based on their own investment objectives, financial positions and needs of specific recipient. This may not be taken in substitution for the exercise of independent judgment by any recipient. The recipient should independently evaluate the investment risks. The value and return on investment may vary because of changes in interest rates, foreign exchange rates or any other reason. ICICI Securities accepts no liabilities whatsoever for any loss or damage of any kind arising out of the use of this report. Past performance is not necessarily a guide to future performance. Investors are advised to see Risk Disclosure Document to understand the risks associated before investing in the securities markets. Actual results may differ materially from those set forth in projections. Forward-looking statements are not predictions and may be subject to change without notice. ICICI Securities or its associates might have managed or co-managed public offering of securities for the subject company or might have been mandated by the subject company for any other assignment in the past twelve months. ICICI Securities or its associates might have received any compensation from the companies mentioned in the report during the period preceding twelve months from the date of this report for services in respect of managing or co-managing public offerings, corporate finance, investment banking or merchant banking, brokerage services or other advisory service in a merger or specific transaction. ICICI Securities or its associates might have received any compensation for products or services other than investment banking or merchant banking or brokerage services from the companies mentioned in the report in the past twelve months. ICICI Securities encourages independence in research report preparation and strives to minimize conflict in preparation of research report. ICICI Securities or its analysts did not receive any compensation or other benefits from the companies mentioned in the report or third party in connection with preparation of the research report. Accordingly, neither ICICI Securities nor Research Analysts have any material conflict of interest at the time of publication of this report. It is confirmed that Chirag Shah PGDBM; Shashank Kanodia MBA (Capital Markets), Research Analysts of this report have not received any compensation from the companies mentioned in the report in the preceding twelve months. Compensation of our Research Analysts is not based on any specific merchant banking, investment banking or brokerage service transactions. ICICI Securities or its subsidiaries collectively or Research Analysts do not own 1% or more of the equity securities of the Company mentioned in the report as of the last day of the month preceding the publication of the research report. Since associates of ICICI Securities are engaged in various financial service businesses, they might have financial interests or beneficial ownership in various companies including the subject company/companies mentioned in this report. It is confirmed that Chirag Shah PGDBM; Shashank Kanodia MBA (Capital Markets), Research Analysts do not serve as an officer, director or employee of the companies mentioned in the report. ICICI Securities may have issued other reports that are inconsistent with and reach different conclusion from the information presented in this report. Neither the Research Analysts nor ICICI Securities have been engaged in market making activity for the companies mentioned in the report. We submit that no material disciplinary action has been taken on ICICI Securities by any Regulatory Authority impacting Equity Research Analysis activities. This report is not directed or intended for distribution to, or use by, any person or entity who is a citizen or resident of or located in any locality, state, country or other jurisdiction, where such distribution, publication, availability or use would be contrary to law, regulation or which would subject ICICI Securities and affiliates to any registration or licensing requirement within such jurisdiction. The securities described herein may or may not be eligible for sale in all jurisdictions or to certain category of investors. Persons in whose possession this document may come are required to inform themselves of and to observe such restriction.