Ratemaking for Multi-Peril Crop Insurance
32
Ratemaking for Multi- Peril Crop Insurance CAS Seminar on Ratemaking Thomas Worth, Ph.D. Concurrent Session COM-7 Senior Actuary Philadelphia, PA Research and Development March 21-22, 2004 Risk Management Agency U.S. Dept. of Agriculture
-
Upload
dorian-morris -
Category
Documents
-
view
33 -
download
2
description
Ratemaking for Multi-Peril Crop Insurance. CAS Seminar on RatemakingThomas Worth, Ph.D. Concurrent Session COM-7Senior Actuary Philadelphia, PA Research and Development March 21-22, 2004 Risk Management Agency U.S. Dept. of Agriculture. - PowerPoint PPT Presentation
Transcript of Ratemaking for Multi-Peril Crop Insurance
Ratemaking for Multi-Peril Crop Insurance
CAS Seminar on Ratemaking Thomas Worth, Ph.D.
Concurrent Session COM-7 Senior Actuary
Philadelphia, PA Research and Development
March 21-22, 2004 Risk Management Agency U.S. Dept. of Agriculture
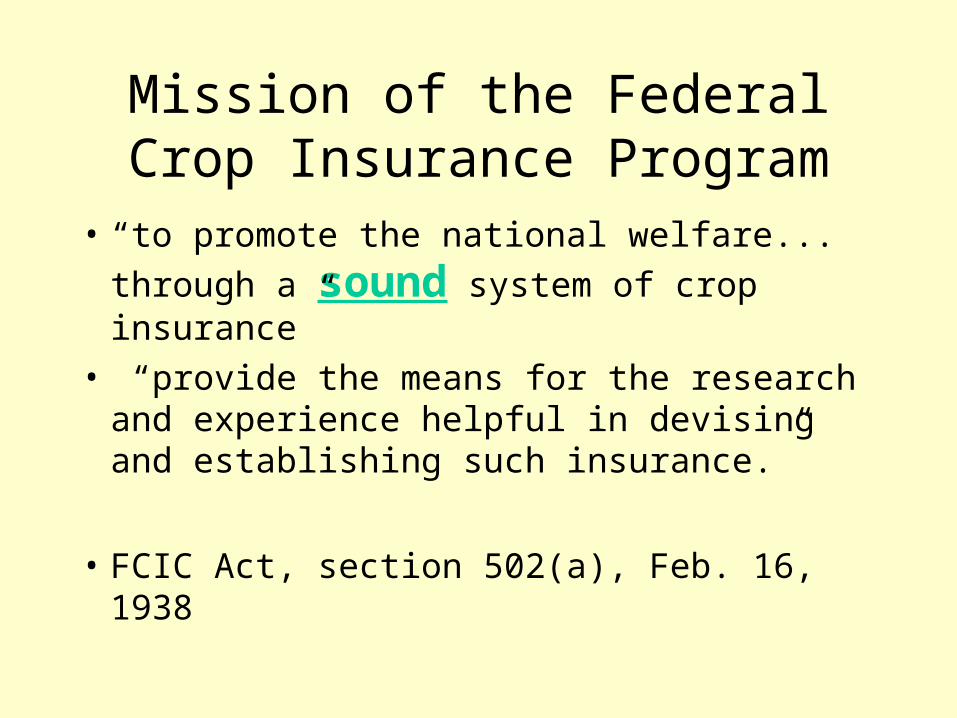
Mission of the Federal Crop Insurance Program
• “to promote the national welfare... through
a sound system of crop insurance”
• “provide the means for the research and experience helpful in devising and establishing such insurance.”
• FCIC Act, section 502(a), Feb. 16, 1938
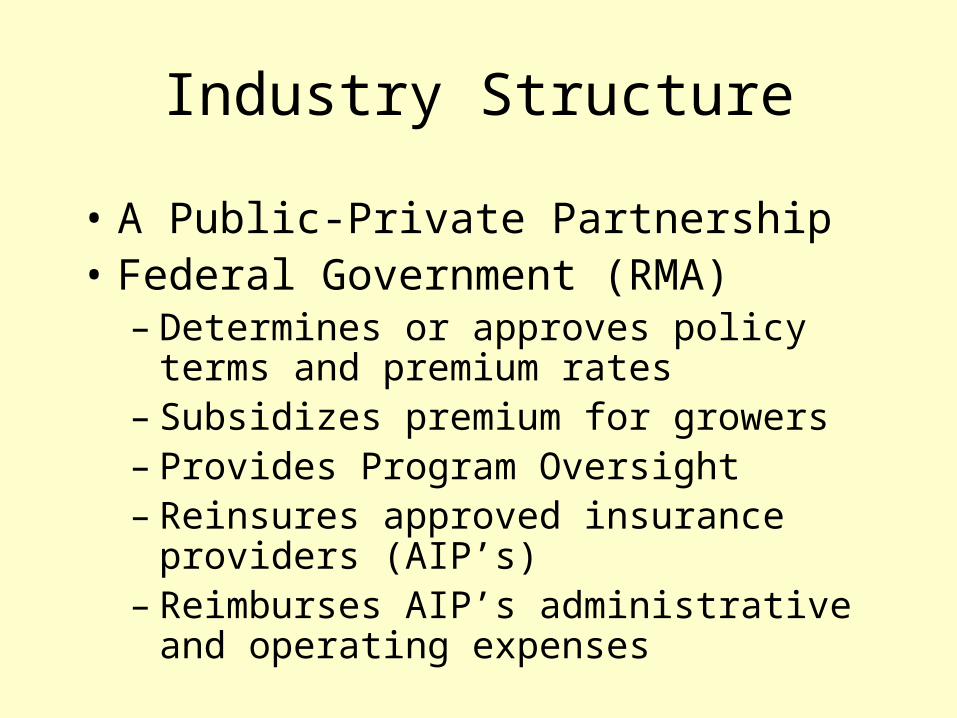
Industry Structure
• A Public-Private Partnership• Federal Government (RMA)
– Determines or approves policy terms and premium rates
– Subsidizes premium for growers– Provides Program Oversight– Reinsures approved insurance providers
(AIP’s)– Reimburses AIP’s administrative and operating
expenses
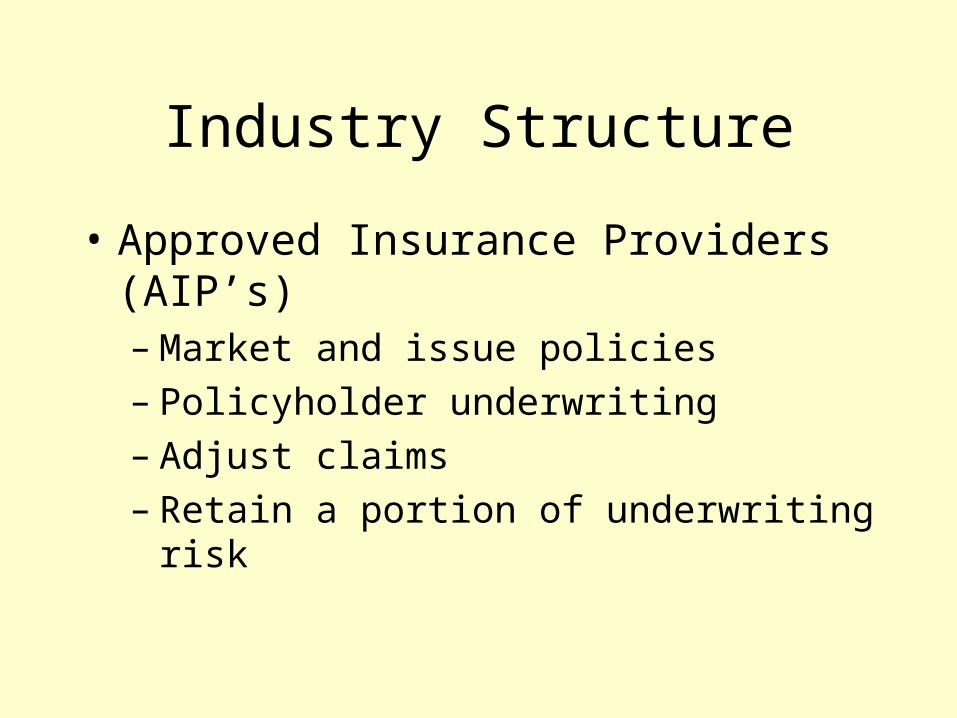
Industry Structure
• Approved Insurance Providers (AIP’s)– Market and issue policies– Policyholder underwriting– Adjust claims– Retain a portion of underwriting risk
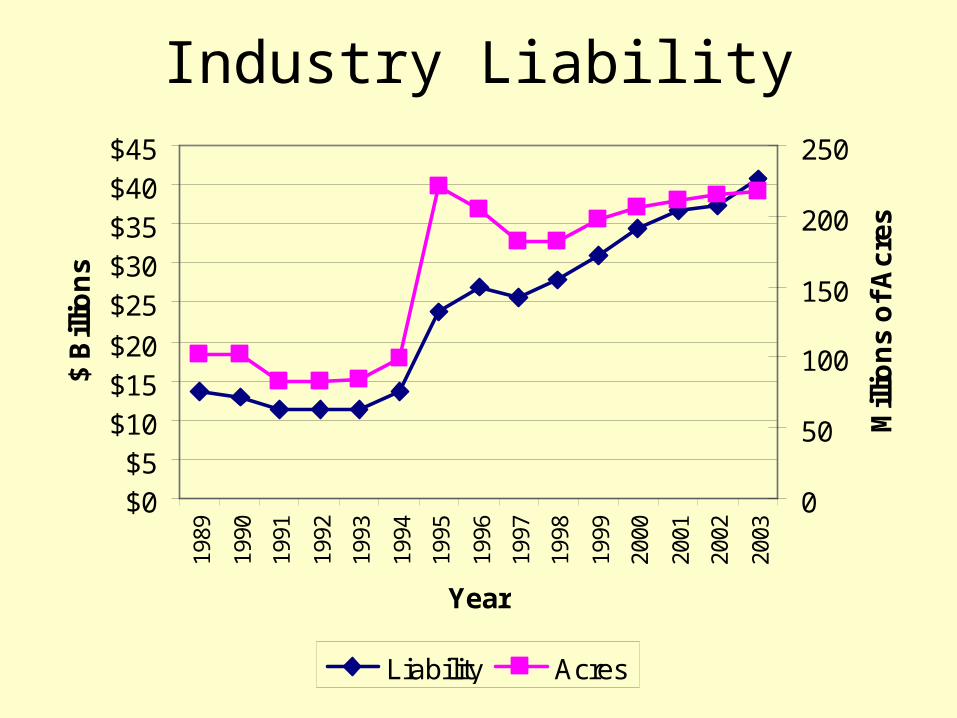
Industry Liability
$0$5
$10$15$20
$25$30$35$40$45
1989
1990
1991
1992
1993
1994
1995
1996
1997
1998
1999
2000
2001
2002
2003
Year
$ B
illio
ns
0
50
100
150
200
250
Mill
ion
s o
f A
cre
s
Liability Acres
Industry Liability
Liabilityin Millions
0 to 1 (723)1 to 10 (973)
10 to 40 (850)40 to 100 (229)
100 to 451 (29)
2003 Total Liability All Crops
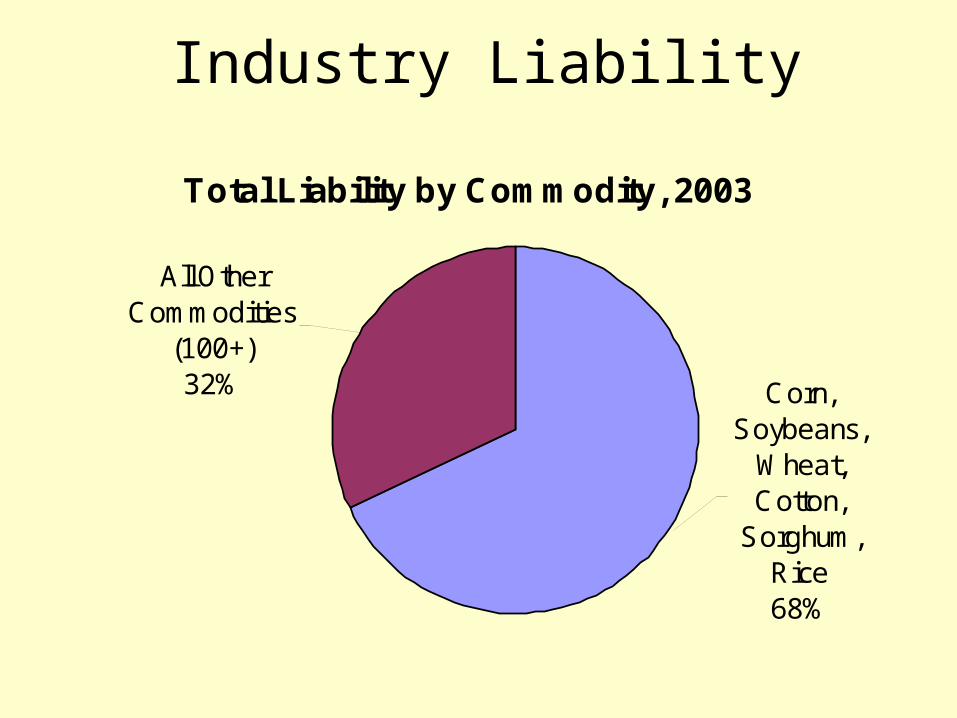
Industry Liability
Total Liability by Commodity, 2003
All Other Commodities
(100+)32% Corn,
Soybeans, Wheat, Cotton,
Sorghum, Rice68%
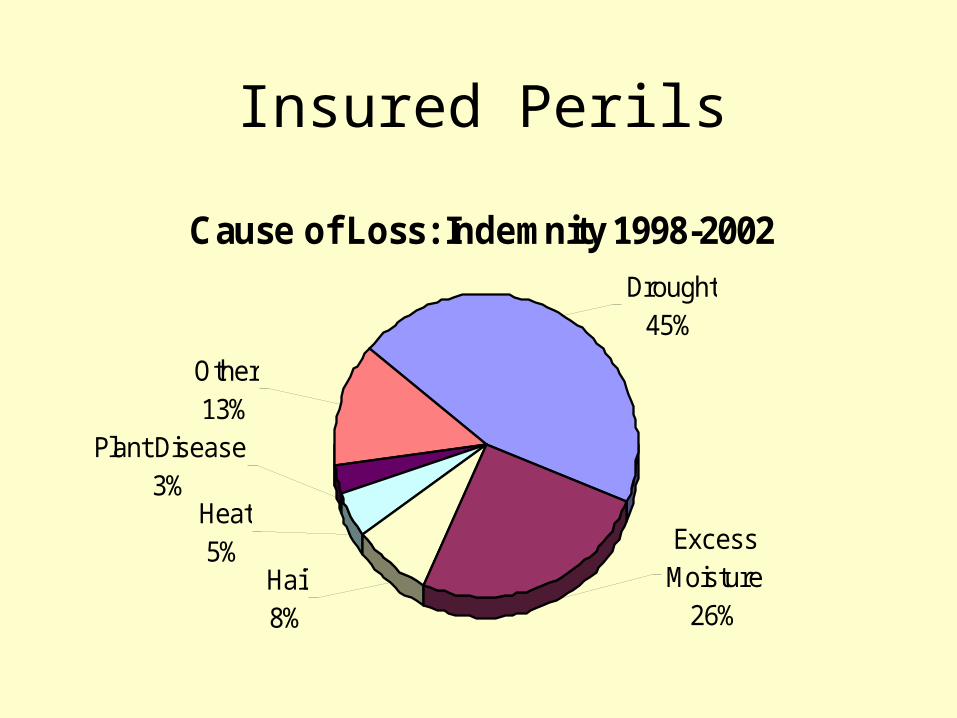
Insured Perils
Cause of Loss: Indemnity 1998-2002
Excess Moisture
26%
Plant Disease3%
Heat5%
Hail8%
Other13%
Drought45%
Crop Insurance Indemnity
Loss Ratios
0 to 0.5 (1310)0.5 to 1 (636)1 to 2 (559)2 to 4 (264)4 to 20.5 (49)
2001 Loss Ratios2001 Loss Ratios
Loss Ratios
0 to 0.5 (835)0.5 to 1 (534)1 to 2 (633)2 to 4 (601)4 to 17.5 (208)
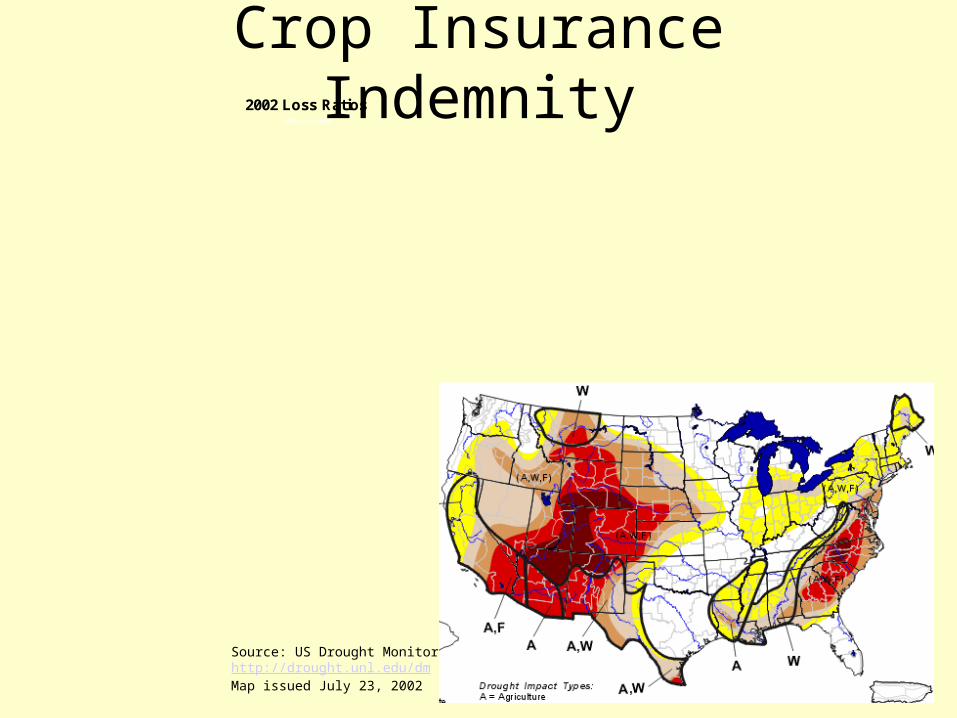
2002 Loss Ratios2002 Loss Ratios
Crop Insurance Indemnity
Loss Ratios
0 to 0.5 (835)0.5 to 1 (534)1 to 2 (633)2 to 4 (601)4 to 17.5 (208)
2002 Loss Ratios2002 Loss Ratios
Source: US Drought Monitorhttp://drought.unl.edu/dmMap issued July 23, 2002
Crop Insurance Indemnity
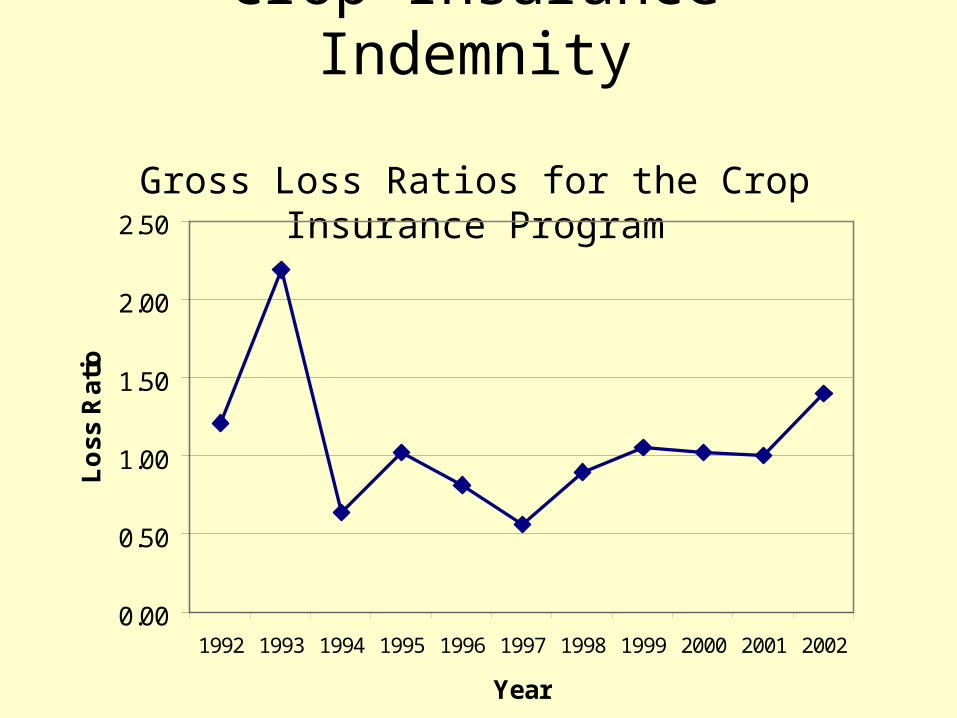
Gross Loss Ratios for the Crop Insurance Program
0.00
0.50
1.00
1.50
2.00
2.50
1992 1993 1994 1995 1996 1997 1998 1999 2000 2001 2002
Year
Lo
ss
Ra
tio
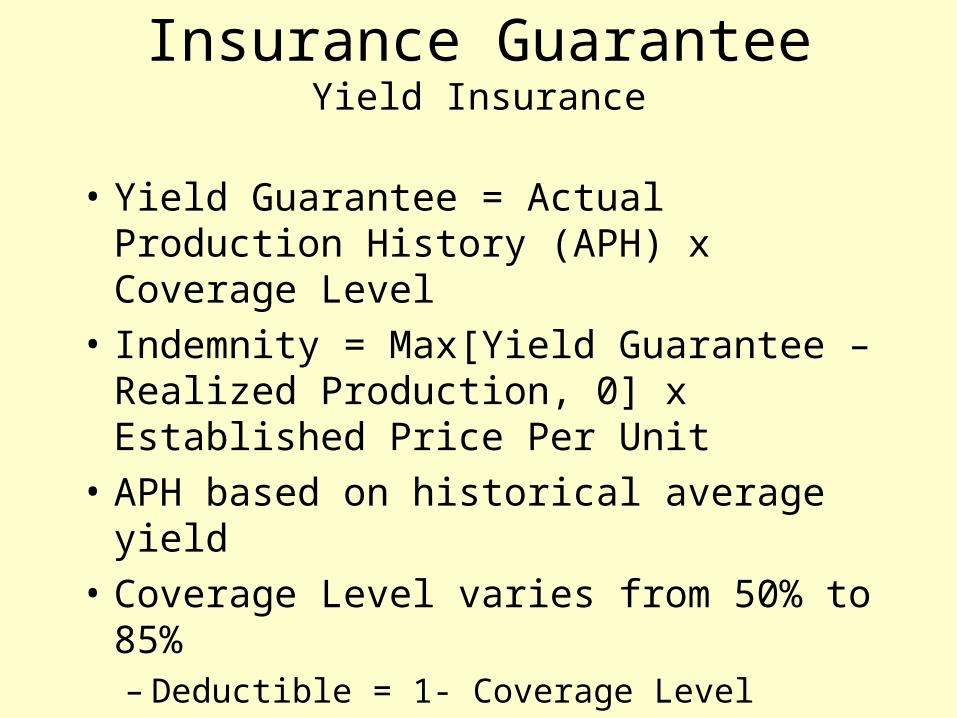
Insurance GuaranteeYield Insurance
• Yield Guarantee = Actual Production History (APH) x Coverage Level
• Indemnity = Max[Yield Guarantee – Realized Production, 0] x Established Price Per Unit
• APH based on historical average yield
• Coverage Level varies from 50% to 85%– Deductible = 1- Coverage Level
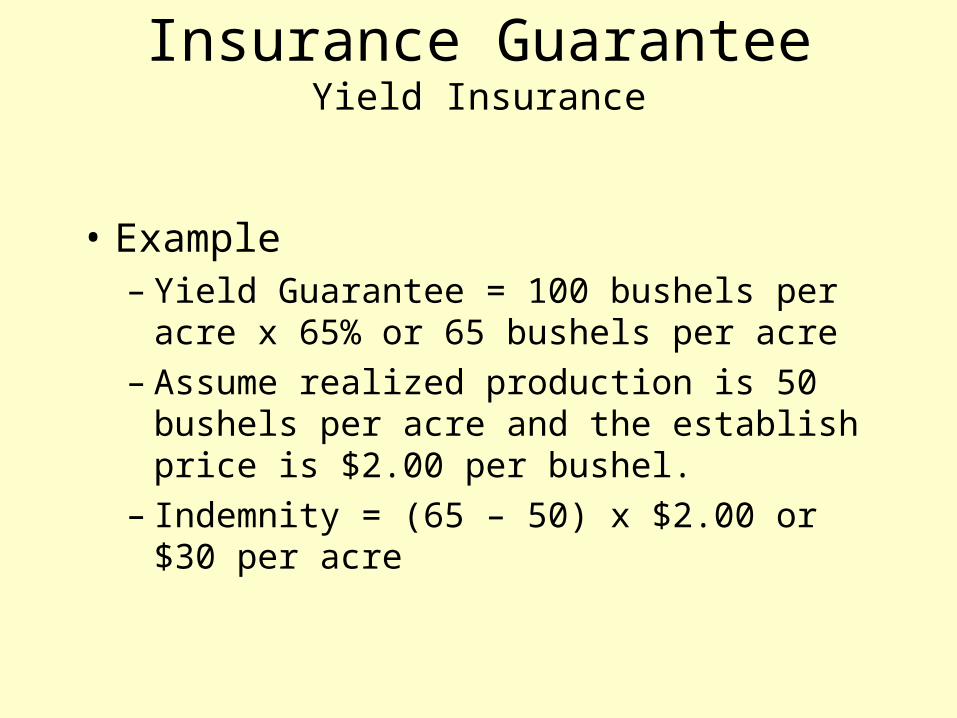
Insurance GuaranteeYield Insurance
• Example– Yield Guarantee = 100 bushels per acre x 65%
or 65 bushels per acre– Assume realized production is 50 bushels per
acre and the establish price is $2.00 per bushel.– Indemnity = (65 – 50) x $2.00 or $30 per acre
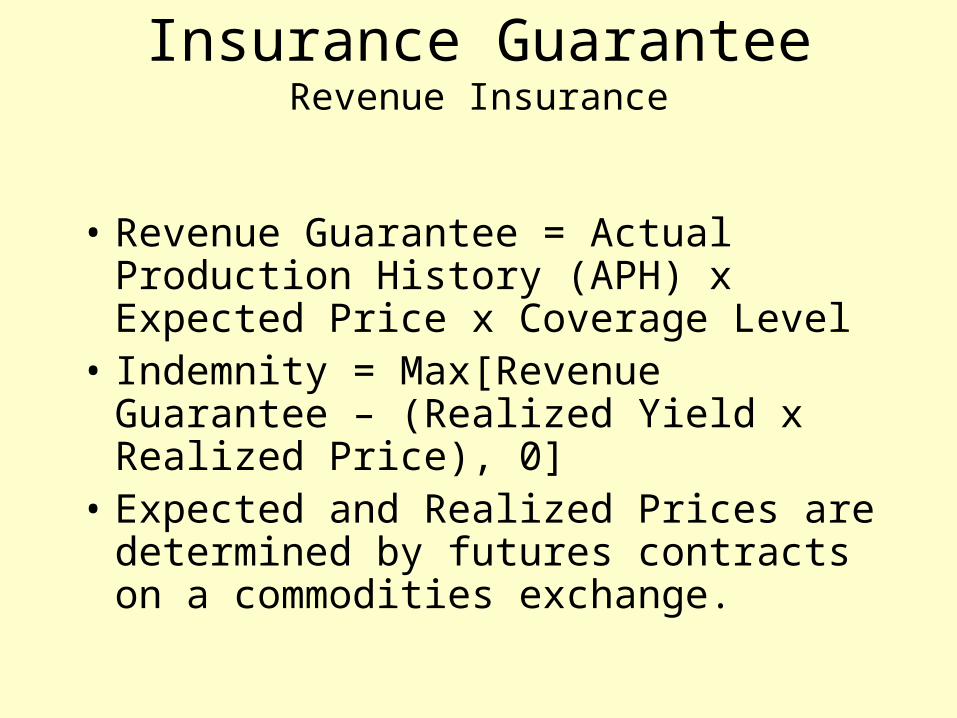
Insurance GuaranteeRevenue Insurance
• Revenue Guarantee = Actual Production History (APH) x Expected Price x Coverage Level
• Indemnity = Max[Revenue Guarantee – (Realized Yield x Realized Price), 0]
• Expected and Realized Prices are determined by futures contracts on a commodities exchange.
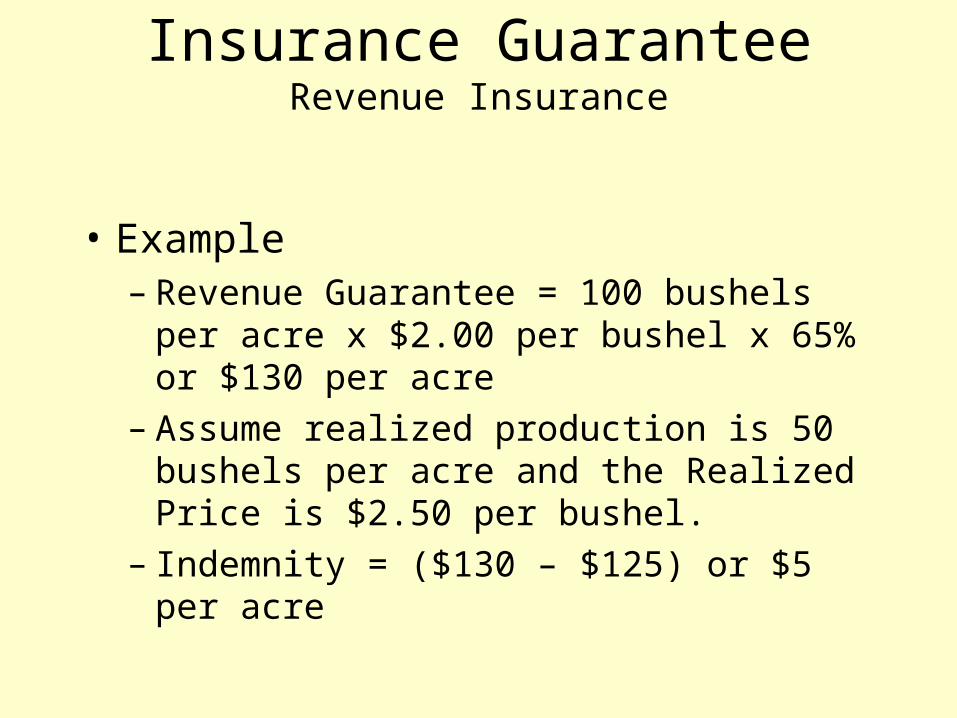
Insurance GuaranteeRevenue Insurance
• Example– Revenue Guarantee = 100 bushels per acre x
$2.00 per bushel x 65% or $130 per acre– Assume realized production is 50 bushels per
acre and the Realized Price is $2.50 per bushel.– Indemnity = ($130 – $125) or $5 per acre
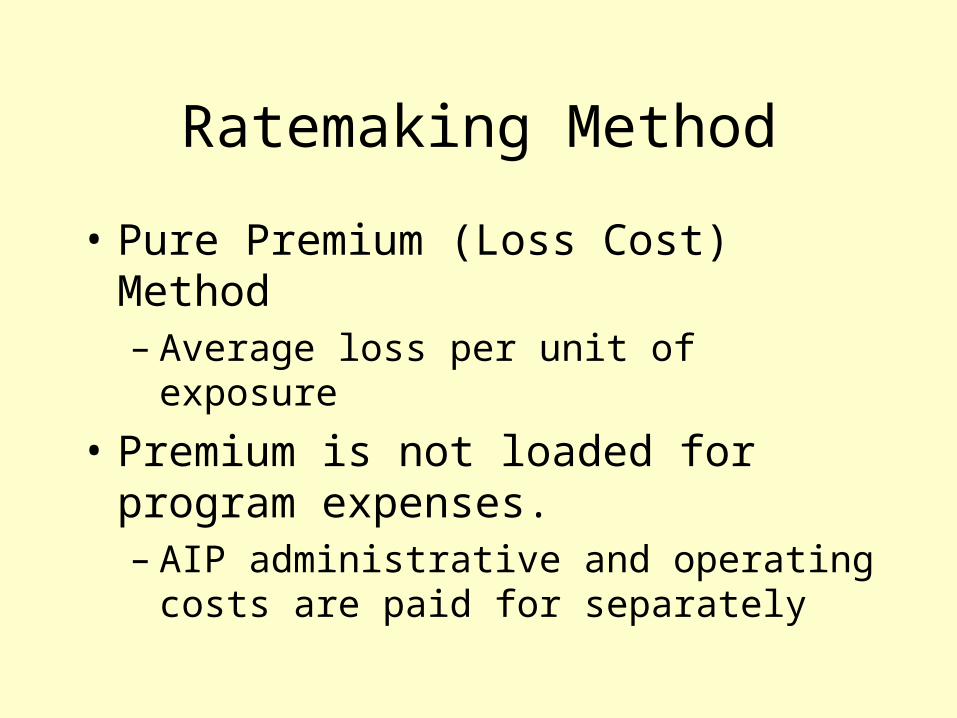
Ratemaking Method
• Pure Premium (Loss Cost) Method– Average loss per unit of exposure
• Premium is not loaded for program expenses.– AIP administrative and operating costs are paid
for separately
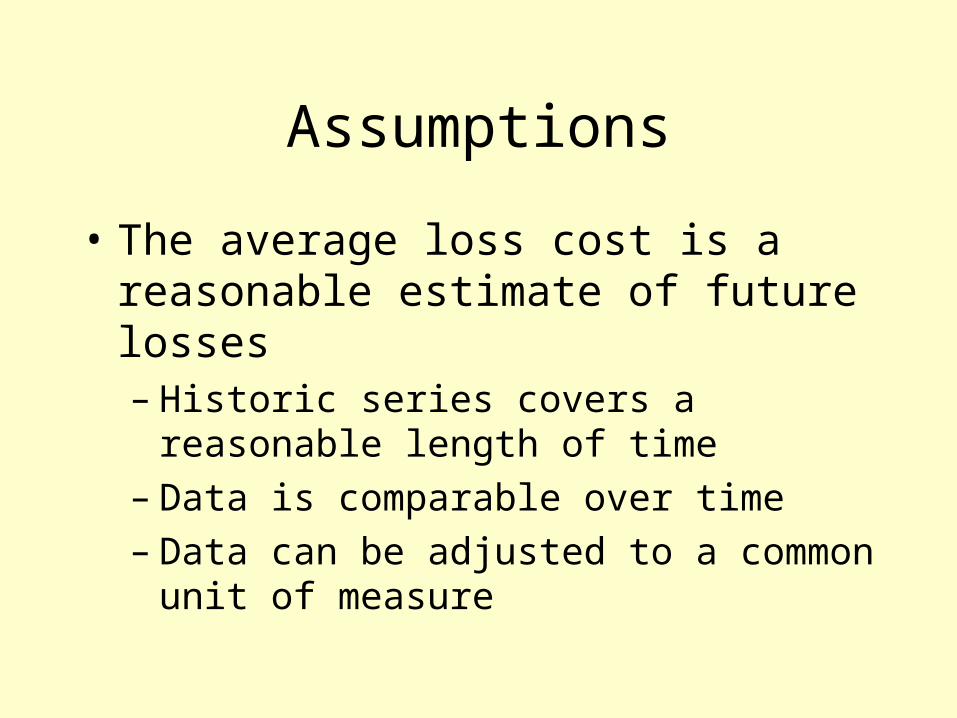
Assumptions
• The average loss cost is a reasonable estimate of future losses– Historic series covers a reasonable length of
time– Data is comparable over time– Data can be adjusted to a common unit of
measure
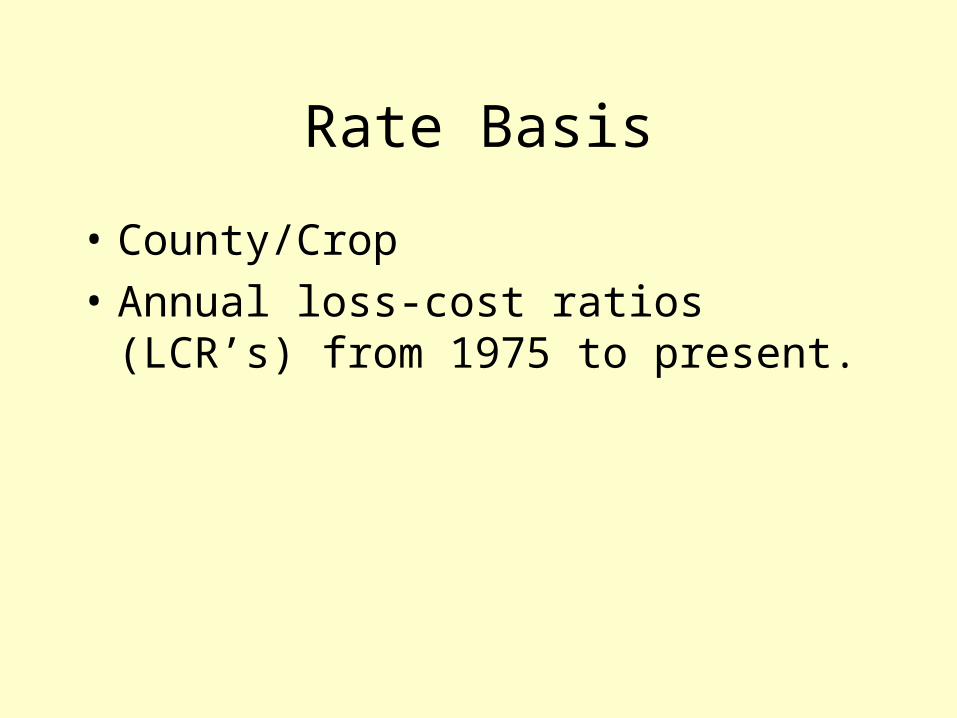
Rate Basis
• County/Crop
• Annual loss-cost ratios (LCR’s) from 1975 to present.
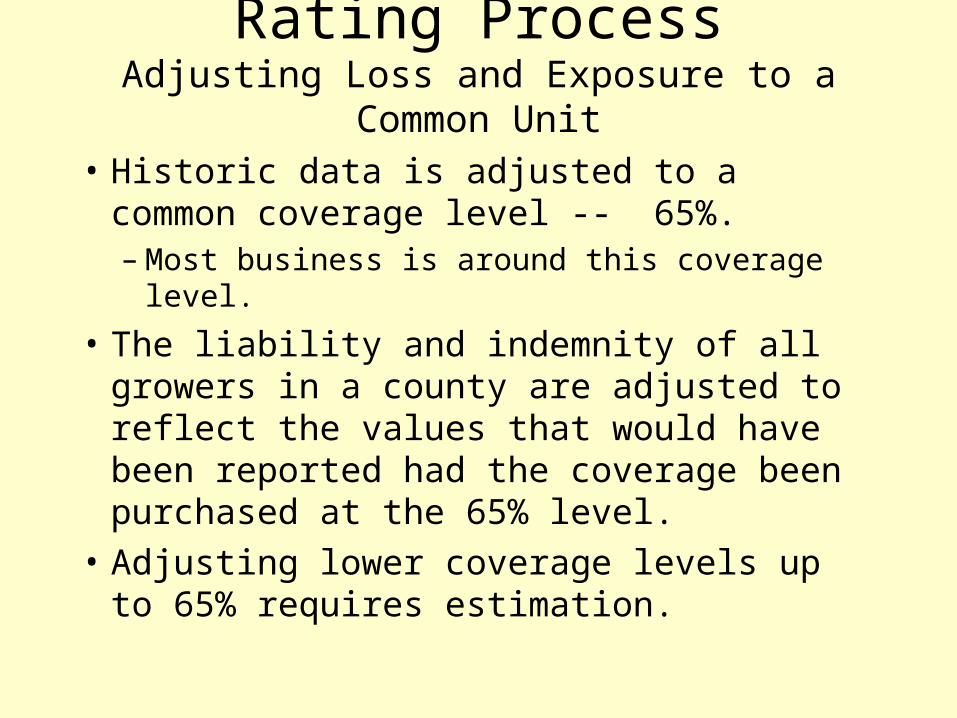
Rating ProcessAdjusting Loss and Exposure to a Common Unit
• Historic data is adjusted to a common coverage level -- 65%.– Most business is around this coverage level.
• The liability and indemnity of all growers in a county are adjusted to reflect the values that would have been reported had the coverage been purchased at the 65% level.
• Adjusting lower coverage levels up to 65% requires estimation.
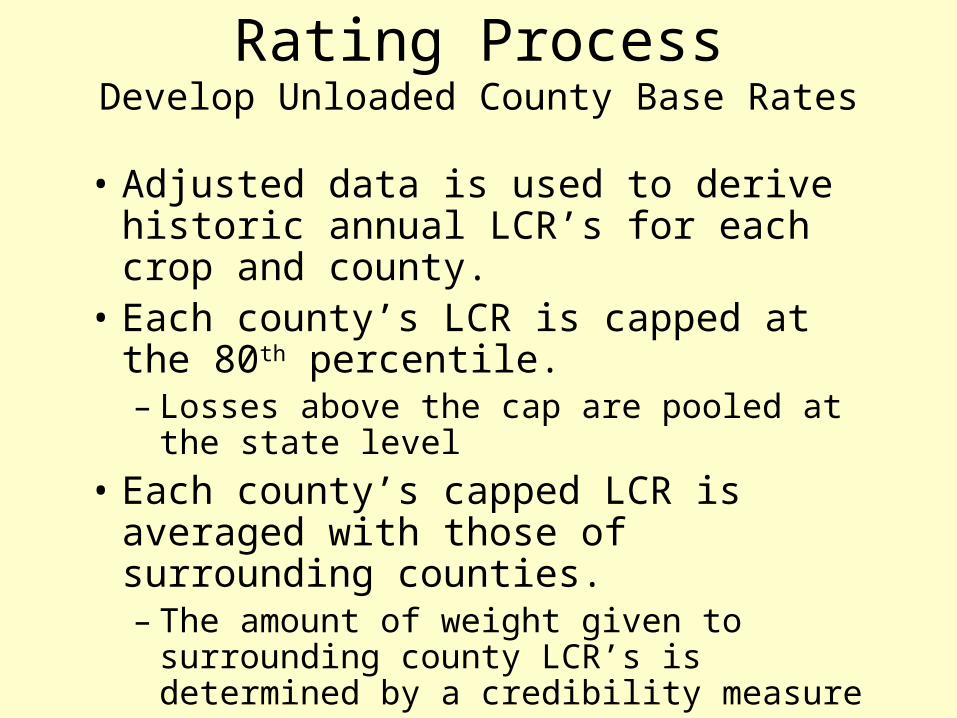
Rating ProcessDevelop Unloaded County Base Rates
• Adjusted data is used to derive historic annual LCR’s for each crop and county.
• Each county’s LCR is capped at the 80th percentile.– Losses above the cap are pooled at the state
level
• Each county’s capped LCR is averaged with those of surrounding counties.– The amount of weight given to surrounding
county LCR’s is determined by a credibility measure
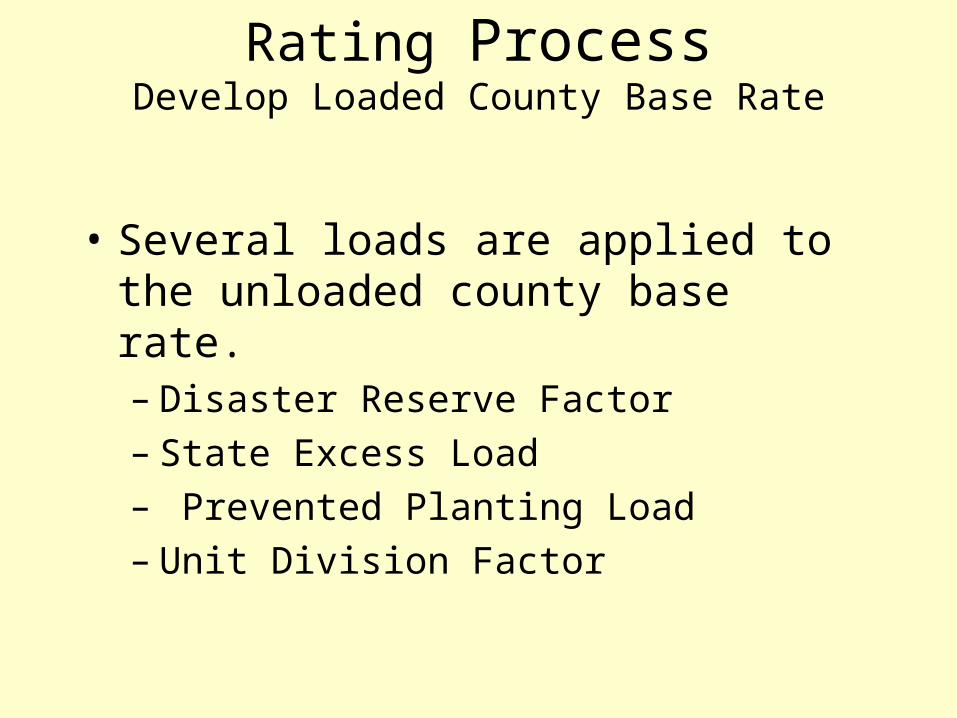
Rating ProcessDevelop Loaded County Base Rate
• Several loads are applied to the unloaded county base rate.– Disaster Reserve Factor– State Excess Load– Prevented Planting Load– Unit Division Factor
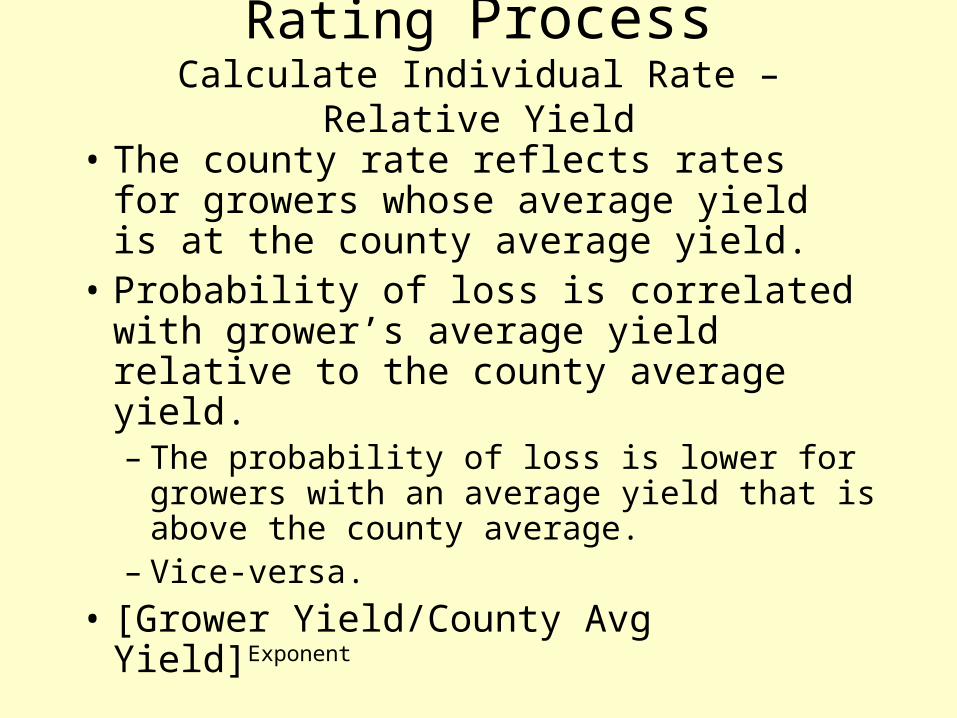
Rating ProcessCalculate Individual Rate – Relative Yield
• The county rate reflects rates for growers whose average yield is at the county average yield.
• Probability of loss is correlated with grower’s average yield relative to the county average yield.– The probability of loss is lower for growers
with an average yield that is above the county average.
– Vice-versa.
• [Grower Yield/County Avg Yield]Exponent
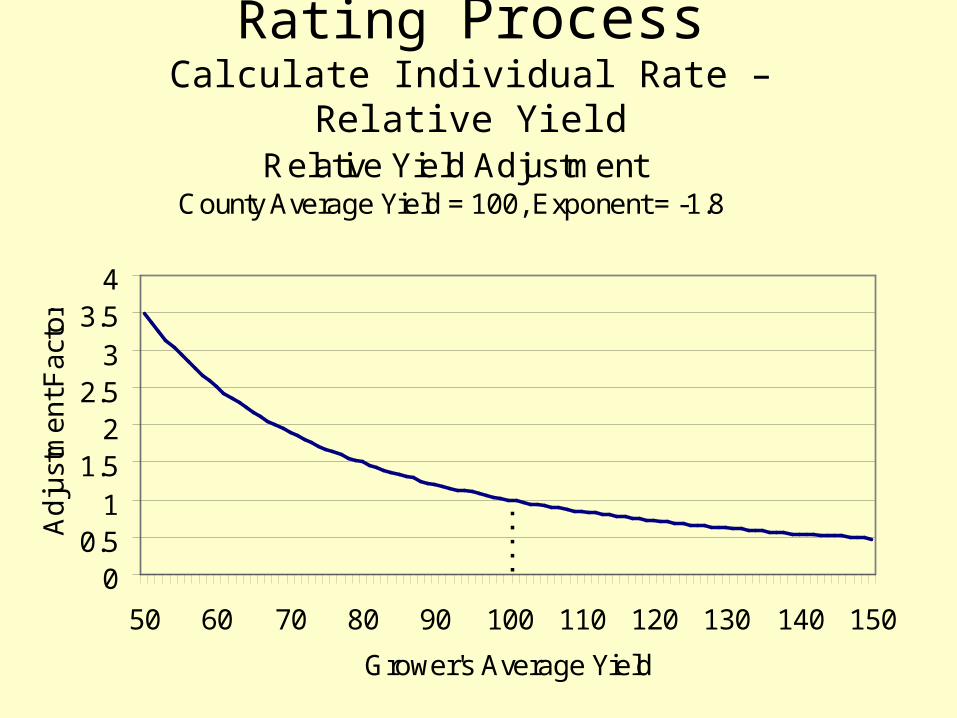
Rating ProcessCalculate Individual Rate – Relative Yield
Relative Yield AdjustmentCounty Average Yield = 100, Exponent = -1.8
00.5
11.5
22.5
33.5
4
50 60 70 80 90 100 110 120 130 140 150
Grower's Average Yield
Ad
just
me
nt F
act
or
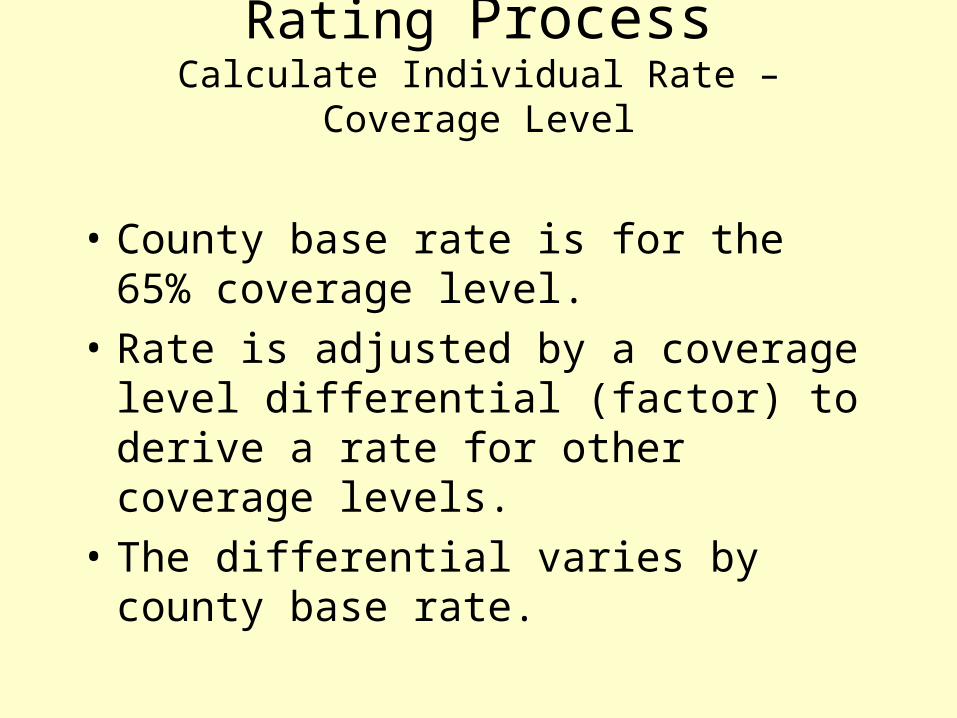
Rating ProcessCalculate Individual Rate – Coverage Level
• County base rate is for the 65% coverage level.
• Rate is adjusted by a coverage level differential (factor) to derive a rate for other coverage levels.
• The differential varies by county base rate.
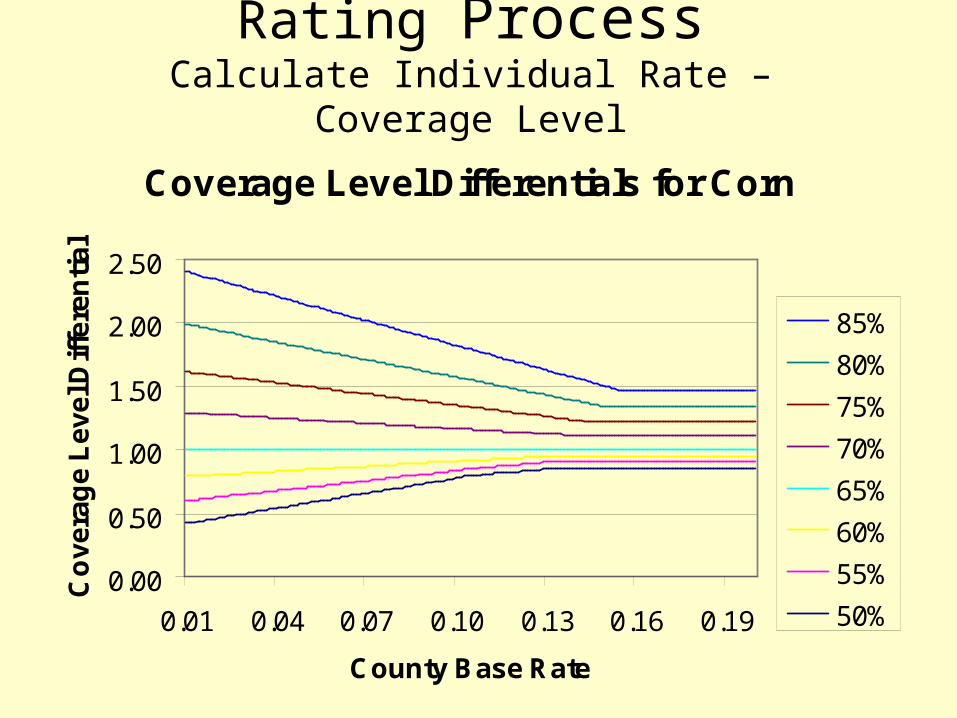
Rating ProcessCalculate Individual Rate – Coverage Level
Coverage Level Differentials for Corn
0.00
0.50
1.00
1.50
2.00
2.50
0.01 0.04 0.07 0.10 0.13 0.16 0.19
County Base Rate
Co
ve
rag
e L
ev
el D
iffe
ren
tia
l
85%
80%
75%
70%
65%
60%
55%
50%
Rating ProcessSummary
• The final rate is the county base rate with cumulative adjustments.– Relative Yield– Coverage Level– Unit Division Factor– Type Practice Factors
Standard Reinsurance Agreement
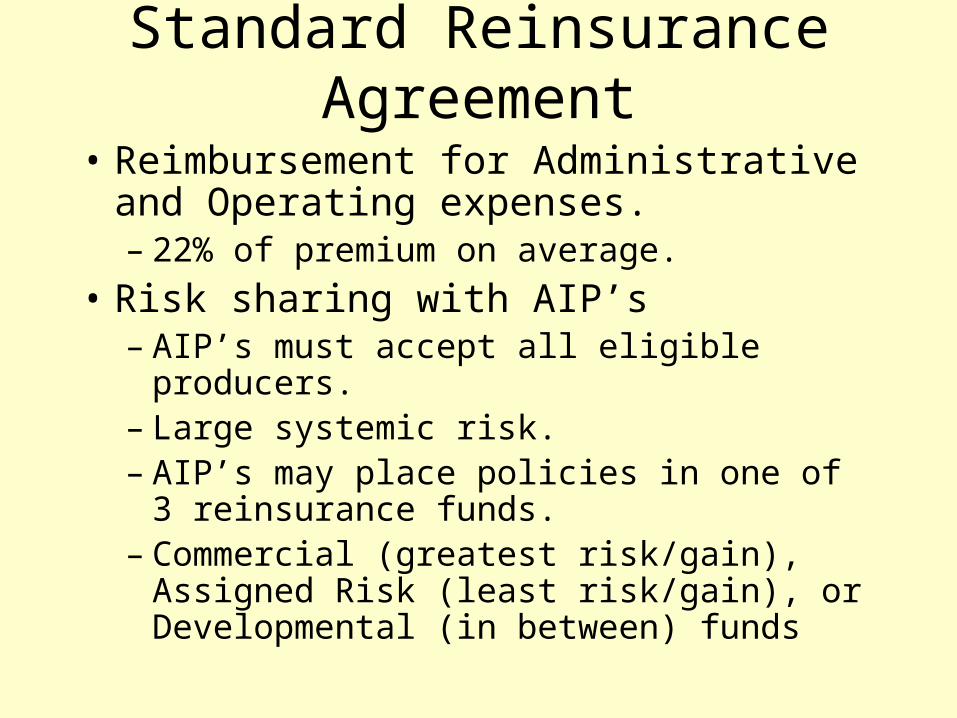
• Reimbursement for Administrative and Operating expenses.– 22% of premium on average.
• Risk sharing with AIP’s– AIP’s must accept all eligible producers.– Large systemic risk.– AIP’s may place policies in one of 3
reinsurance funds.– Commercial (greatest risk/gain), Assigned Risk
(least risk/gain), or Developmental (in between) funds
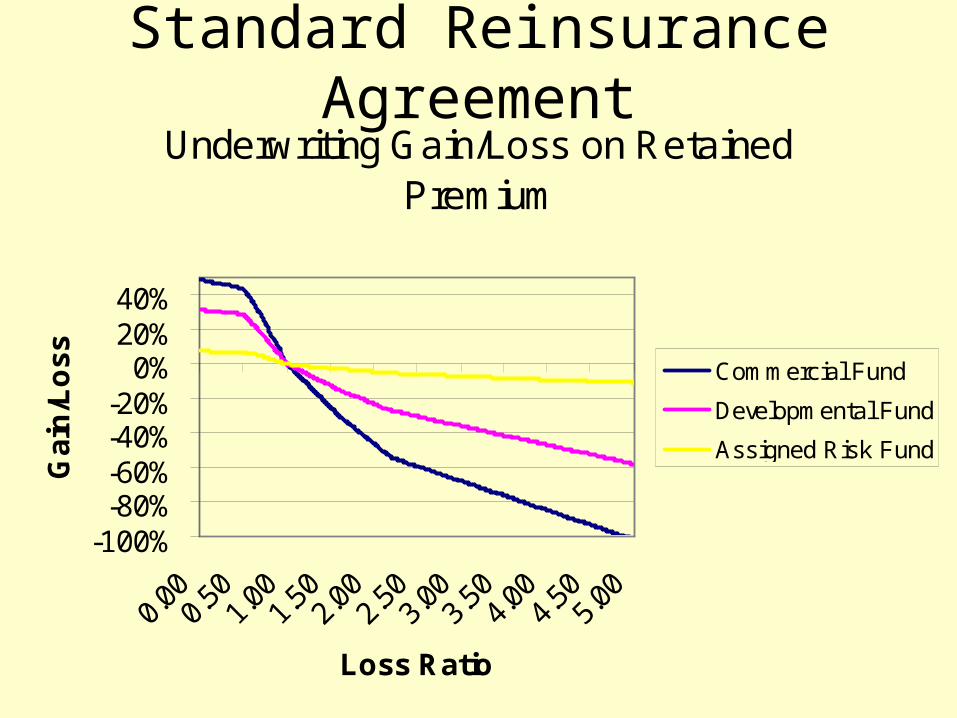
Standard Reinsurance AgreementUnderwriting Gain/Loss on Retained
Premium
-100%-80%-60%-40%-20%
0%20%40%
0.00
0.50
1.00
1.50
2.00
2.50
3.00
3.50
4.00
4.50
5.00
Loss Ratio
Ga
in/L
os
s
Commercial Fund
Developmental Fund
Assigned Risk Fund
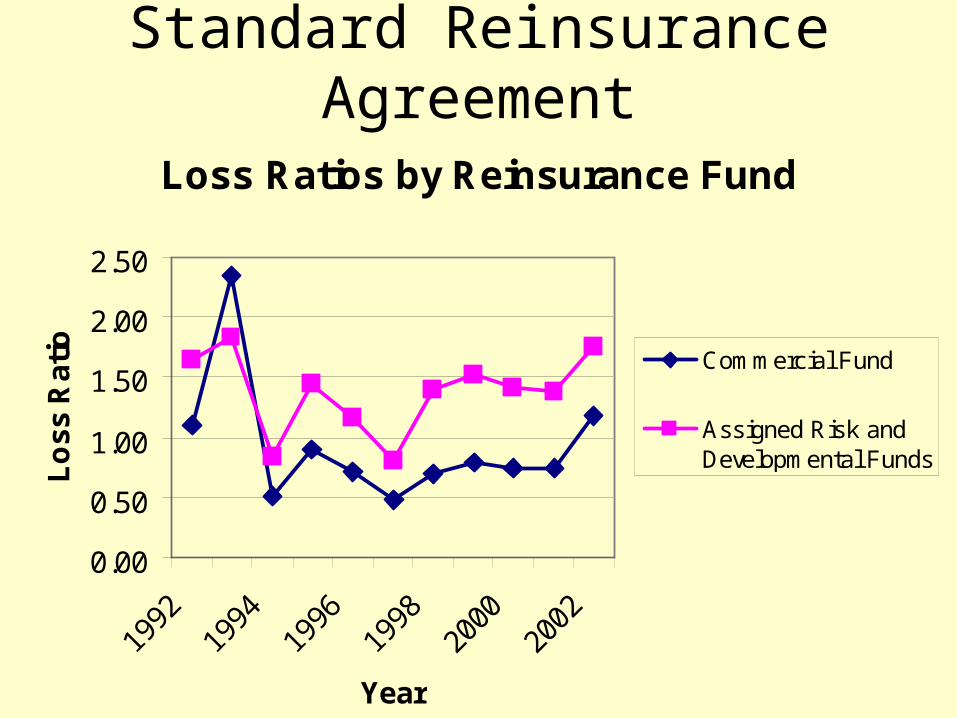
Standard Reinsurance Agreement
Loss Ratios by Reinsurance Fund
0.00
0.50
1.00
1.50
2.00
2.50
1992
1994
1996
1998
2000
2002
Year
Lo
ss
Ra
tio
Commercial Fund
Assigned Risk andDevelopmental Funds
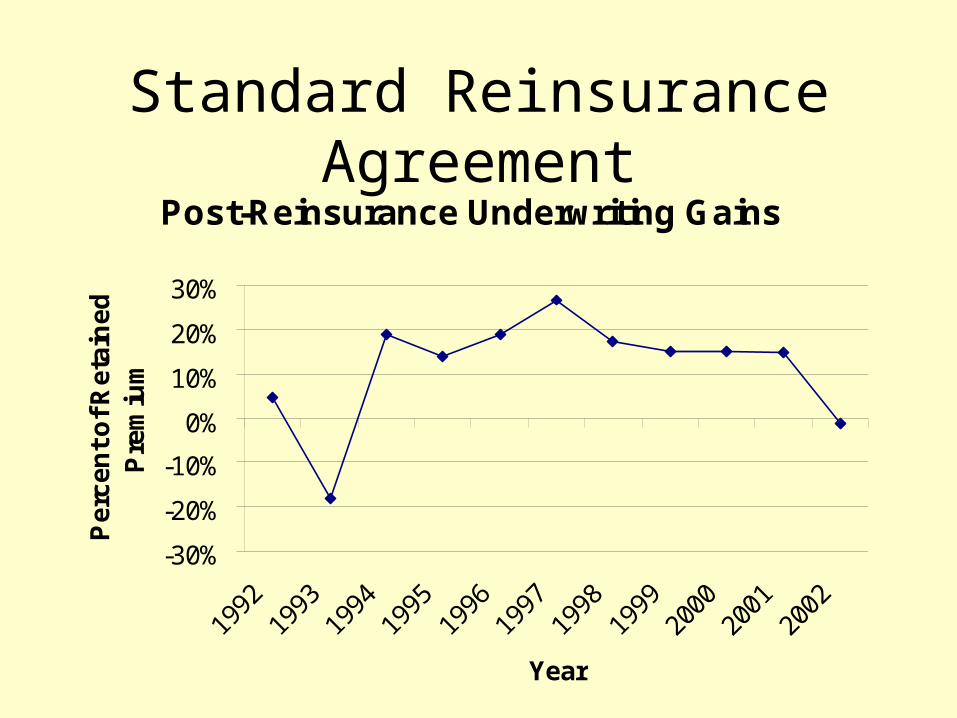
Standard Reinsurance AgreementPost-Reinsurance Underwriting Gains
-30%
-20%
-10%
0%
10%
20%
30%
1992
1993
1994
1995
1996
1997
1998
1999
2000
2001
2002
Year
Pe
rce
nt
of
Re
tain
ed
P
rem
ium
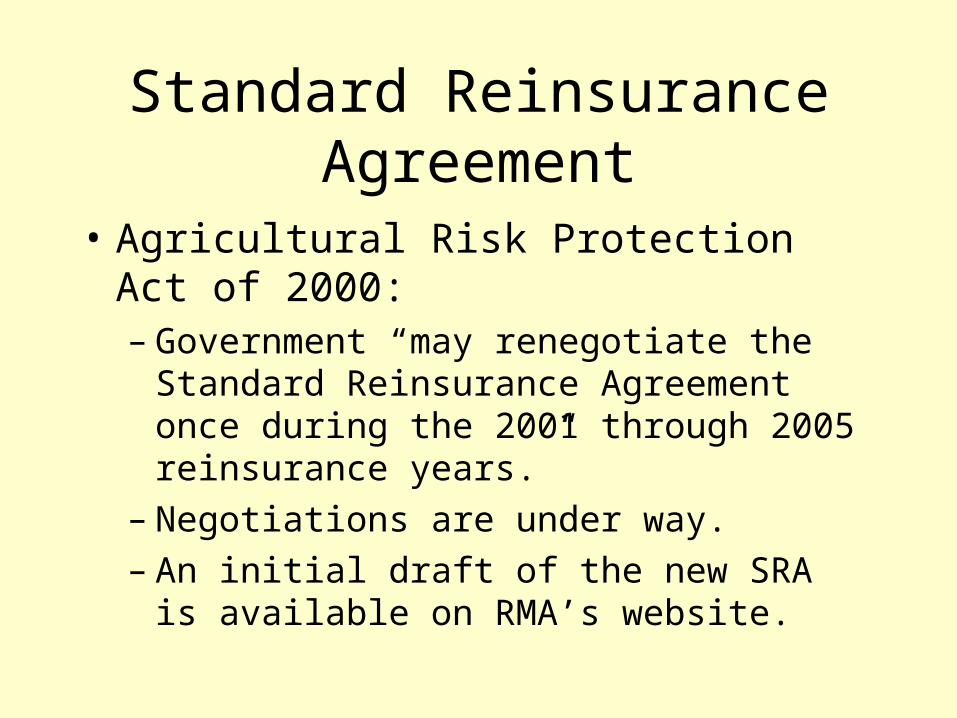
Standard Reinsurance Agreement
• Agricultural Risk Protection Act of 2000:– Government “may renegotiate the Standard
Reinsurance Agreement once during the 2001 through 2005 reinsurance years.”
– Negotiations are under way.– An initial draft of the new SRA is available on
RMA’s website.
Thank You
Visit the RMA website for more information:
www.rma.usda.gov