Rate effects on aerodynamics of intervocalic stops - ZAS Berlin
21
ZAS Papers in Linguistics 49, 2008: 1 - 21 Rate effects on aerodynamics of intervocalic stops: Evidence from real speech data and model data Claire Brutel-Vuilmet GIPSA-Lab, Département Parole et Cognition (ICP), Grenoble, France CNRS - UMR 5216 Susanne Fuchs Zentrum für Allgemeine Sprachwissenschaft, Berlin This paper is a first attempt towards a better understanding of the aerodynamic properties during speech production and their potential control. In recent years, studies on intraoral pressure in speech have been rather rare, and more studies concern the air flow development. However, the intraoral pressure is a crucial factor for analysing the production of various sounds. In this paper, we focus on the intraoral pressure development during the production of intervocalic stops. Two experimental methodologies are presented and confronted with each other: real speech data recorded for four German native speakers, and model data, obtained by a mechanical replica which allows reproducing the main physical mechanisms occurring during phonation. The two methods are presented and applied to a study on the influence of speech rate on aerodynamic properties. 1 Introduction Even if aerodynamics in speech production is getting a matter of particular interest, the development of the intraoral pressure is rarely considered in comparison to air flow variations. However, from a physical point of view, this parameter is crucial, particularly in the production of obstruents or for devoicing. Indeed, a certain amount of intraoral pressure is a necessary requirement in the production of obstruents. If it is missing, as for instance in cleft palate speech (Gibbon & Lee, accepted), it can either cause a distortion in the production and perception of the intended sound or a total reorganization of the
Transcript of Rate effects on aerodynamics of intervocalic stops - ZAS Berlin

ZAS Papers in Linguistics 49, 2008: 1 - 21
Rate effects on aerodynamics of intervocalic stops: Evidence from real speech data and model data Claire Brutel-Vuilmet GIPSA-Lab, Département Parole et Cognition (ICP), Grenoble, France CNRS - UMR 5216 Susanne Fuchs Zentrum für Allgemeine Sprachwissenschaft, Berlin
This paper is a first attempt towards a better understanding of the aerodynamic properties during speech production and their potential control. In recent years, studies on intraoral pressure in speech have been rather rare, and more studies concern the air flow development. However, the intraoral pressure is a crucial factor for analysing the production of various sounds. In this paper, we focus on the intraoral pressure development during the production of intervocalic stops. Two experimental methodologies are presented and confronted with each other: real speech data recorded for four German native speakers, and model data, obtained by a mechanical replica which allows reproducing the main physical mechanisms occurring during phonation. The two methods are presented and applied to a study on the influence of speech rate on aerodynamic properties.
1 Introduction Even if aerodynamics in speech production is getting a matter of particular interest, the development of the intraoral pressure is rarely considered in comparison to air flow variations. However, from a physical point of view, this parameter is crucial, particularly in the production of obstruents or for devoicing.
Indeed, a certain amount of intraoral pressure is a necessary requirement in the production of obstruents. If it is missing, as for instance in cleft palate speech (Gibbon & Lee, accepted), it can either cause a distortion in the production and perception of the intended sound or a total reorganization of the
Claire Brutel-Vuilmet & Susanne Fuchs
2
production of the sound. For instance, cleft palate speakers often try to compensate for the lack of high intraoral pressure by means of a retracted place of articulation. Some authors even go so far to assume that during speech we could aim at aerodynamic goals, next to acoustic or articulatory ones (Warren et al. 1992, Huber et al. 2004). Moreover, the intraoral pressure (or rather the transglottal pressure difference) is a crucial factor to understand the realization of vocal fold phonation (Hertegård et al. 1995). In obstruents, the increase of intraoral pressure associated with the occlusion of the vocal tract can entail the stop of the vocal folds vibration. This factor should also be dependent on the duration of the segment. The higher the intraoral pressure and the longer the segment, the more likely is the devoicing of sounds. On the contrary, oscillations can be maintained when the intraoral pressure does not increase to a large extent. Maximal intraoral pressure in obstruent production can be reached when the glottis is wide open and intraoral pressure equals subglottal pressure (assuming an oral occlusion and the complete closure of the velar port). If the glottis is only spindle shaped or closed, intraoral pressure may not reach this maximum. Hence, the extent of intraoral pressure is not only a result of the moving supralaryngeal articulators, but also a consequence of the laryngeal-oral coordination. In addition, the amount of peak pressure varies with manner of articulation as well as place of articulation (Fuchs & Koenig 2006). The more posterior the articulation of an obstruent the higher the pressure, and the wider the constriction in comparison to oral closure, the lower the pressure.
In summary, intraoral pressure is an important factor for the voicing or devoicing of a segment. It especially results from laryngeal-oral coordination, from the duration of a segment and from manner and place of articulation. These factors change under various speech conditions. Our study will concentrate on the intraoral pressure evolution in different speech rate conditions, i.e. on the impact of temporal parameters. 1.1 Speech rate We do not intend to provide an extensive overview on investigations considering speech rate since a tremendous amount of work has already been published on this topic. We will only exemplify some ideas and results from the literature which are interesting for the topic of our study.
Weitkus 1931 (cited in Pfitzinger 2001, p. 131) analysed a corpus of spoken utterances with 3 levels of speech rate (slow, normal and fast) and separated all phonemes in two groups. First, all consonants except the voiceless fricatives, are relatively shortened with increasing rate and second, all vowels,

Rate effects on aerodynamics of intervocalic stops
3
diphthongs, and voiceless fricatives are relatively lengthened in faster speech. Note that all segments are shorter in their absolute values at higher speech rate, but that is not the case if one considers the relative length of the relevant segment, normalized at the syllable or word level. Thus, speech rate has different effects on different segments which may cause a reorganisation of the segments in an uttered word.
By means of electropalatographic data Byrd and Tan (1996) investigated four levels of speech rate (which they called ‘normal’, ‘medium’, ‘faster’, ‘fastest’) in heterosyllabic sequences. They proposed different articulatory strategies which could underlie variations in speech rate. As one potential strategy they suppose that the faster the speaking rate, the stronger the gestural overlap of two adjacent segments (with no shortening of gestures). As another possibility they considered gestural shortening (without differences in the amount of gestural overlap) in faster speech. A combination of the two mechanisms was discussed too and additionally, a reduction of the movement amplitude (spatial reduction) was taken into consideration.
In addition to some speaker-specific variations, Byrd and Tan consistently found a temporal shortening and an increase in the amount of coarticulation in faster speech rates. More speaker-specific behaviour was reported with respect to spatial reduction of articulatory gestures at higher rates.
We suppose that there are aerodynamic consequences for the different strategies: The greater the gestural overlap and the spatial reduction of the closing gesture, the smaller the amount of intraoral pressure and the more likely the maintenance of vocal fold oscillation. In contrast, gestural shortening without an increase in gestural overlap of adjacent segments or a spatial reduction probably has less effect on the amount of intraoral pressure. There is no general agreement in the literature (see e.g. Pfitzinger, 2001) to explain the articulatory results under varying speech rate conditions (e.g. Tuller & Kelso 1984 proposing the invariance of the relative timing between articulators; Edwards, Beckman & Fletcher 1991 relating articulatory behaviour under varying speech rate (lengthening effects) to differences in the degree of stiffness; Lindblom (1963) assuming the so called ‘target undershoot’). However, whatever explanation one might follow, one fact seems to be quite consistent – the articulatory strategies used are highly speaker specific and should have an effect on the development of intraoral pressure. To summarise: (1) Speech rate can affect various segments in a different way. (2) Speech rate goes hand in hand with a temporal reduction of segments, but not necessarily with a spatial reduction. (3) Articulatory strategies used are highly speaker specific. (4) Speech rate should affect the aerodynamic properties during obstruent production. In the next section a review regarding previous investigations is provided.

Claire Brutel-Vuilmet & Susanne Fuchs
4
1.2 Aerodynamics and varying speech rate Arkebauer et al. (1967) reported averaged intraoral pressure peaks of selected consonants uttered under 3 rate conditions by 10 adults. They found higher intraoral pressure peaks in the faster rate condition in comparison to the slower condition when the data for all speakers were pooled together. They also mentioned that their results on speech rate may be confounded by changes in intensity. Brown et al. (1969) investigated the relation of intraoral pressure to oral cavity size in various consonants and conditions. They did not only record intraoral pressure, but also the size of the vocal tract by means of x-ray. Among other factors, they asked their 15 adult subjects to vary speech rate (1 utterance per second & 3 utterances per second). Intraoral peak did not differ significantly between the two rate conditions. Malécot (1969a,b) studied intraoral pressure under various speech conditions. He provided averaged data of 10 subjects uttering isolated bisyllabic words in a slow, average and fast condition. Malécot found only sporadic rate effects in intraoral pressure impulse (calculated as the area in mm between pressure curve and baseline) of the initial and final consonants, but significant effects for the consonants in intervocalic position. Pressure impulse decreased with increasing rate. Similar to the different results found for the kinematics under varying speech rate conditions, aerodynamic results from previous investigations are rather mixed, but all studies pooled all the speakers together and did not take into account the inter-speaker variations. 1.3 Motivation for the current study Our study is a first attempt towards a better understanding of the aerodynamic properties during speech production and their potential control. In recent years experimental studies on intraoral pressure have been rather rare although technology has been developed. Additionally, most studies concern air flow variation (Pelorson 1997). This was one reason to focus on intraoral pressure development. The major motivation for our study is to obtain relevant experimental data in order to test and to validate the physical modelling of speech production, which is not as advanced even for simple stop production (McGowan et al., 1995, Van Hirtum et al., 2004). To do so, two experimental methodologies were confronted: real speech data from four German native speakers and model data gathered by means of a simplified model of the phonation system which allows to reproducing the main physical mechanisms

Rate effects on aerodynamics of intervocalic stops
5
occurring in speech production. In a first step we decided to test the influence of speech rate on aerodynamics results. 2 Rate effects on aerodynamics in real speech data The following part describes the experimental procedure used to gather real speech data, their pre-processing, analyses, and the results. 2.1 Methods
A new experimental design has recently been developed (Fuchs & Koenig 2006) which allows to study aerodynamics in real speech in a relatively comfortable way for the subject. It consists of a piezoresistive pressure sensor (Endevco 8507C-2) of about 2.4 mm in diameter and 12 mm in length. It was glued mid-sagittaly approximately between the subject’s hard and soft palate. The sensor measures the pressure difference between intraoral and atmospheric pressure. Atmospheric pressure was sensed via a very small plastic tube hanging outside the mouth. The set-up is easier to apply in comparison to methods involving tube insertion through the nose and it is not affected by saliva blocking the tube. Altogether 4 German native speakers (2 males: jd & rw, 2 females: sf & vh) were recorded at the phonetics laboratory at ZAS. For one speaker (jd), we had to stop recording after half of the session since the amplifier overheated and only half of the data are available.
Figure 1: Experimental set-up.
Acoustics were recorded simultaneously on Digital Audio Tape (DAT) with a sampling rate of 48 kHz. We also tested a new device measuring at what point
Claire Brutel-Vuilmet & Susanne Fuchs
6
the upper and lower lip are in contact during the production of bilabials (simply by contact or no contact corresponding to 1 or 0). The device consisted of two very thin flexible copper plates glued mid-sagitally to the upper and lower lip. One of the subjects demonstrating the whole experimental set-up is shown in figure 1.
The subjects were instructed to speak the same sentence four times in a successive order, starting at a very slow speech rate and ending at a very fast one (total duration = 9 seconds). This method was chosen to get to the limits from very slow to very fast speech.
Our target words consisted of /CVCV/-sequences with C being one of the following consonants /p, b, t, v/ and V being /a, i, u/ (except for /v/ where we only used the /a/-context). Target words were embedded in the carrier phrase Habe X gesehen. (Have X seen) and repeated up to 7 times (x 4 speech rate conditions) in a randomized order. We will here concentrate on the target word /papa/. 2.2 Pre-processing and data analyses 2.2.1 Intraoral pressure data The pressure and the lip contact data were acquired using PCQuirer version 5.0 at a sampling rate of 1375 Hz and subsequently imported into Matlab for processing. The pressure data were smoothed with a 6th-order Butterworth filter using a 43 Hz cut-off so that low-frequency changes in the pressure could be monitored. Furthermore, the second derivate of the filtered pressure signal was calculated in order to label experimental data. This procedure was adopted from Koenig and Fuchs (2006) using the acceleration peak as a landmark for defining closure onset (CLOSon). The beginning of pressure drop (closure offset CLOSoff) was associated with the deceleration peak at the end of the pressure plateau, and voicing offset (VOICoff) was labeled too. Details of the labeling procedure are given in figure 2. From the temporal landmarks we calculated the difference between CLOSon and CLOSoff (tClosure) and the relative duration of voicing during closure (tVoicing/tClosure).
In addition, a script was used searching automatically for the pressure maximum in the interval between CLOSon and CLOSoff. Then, it calculates the pressure difference (DeltaIOP) between the pressure maximum and the pressure minimum at CLOSon. For the model data we will use similar labels, but with the extension _mod.

Rate effects on aerodynamics of intervocalic stops
7
Figure 2: Temporal landmarks for closure onset (CLOSon), voicing offset (VOICoff) and closure offset (CLOSoff); 1st track acoustic signal, 2nd intraoral pressure signal (in black raw data and in gray filtered data), 3rd track second derivative of the pressure signal with acceleration and deceleration peaks.
2.2.2 Acoustic analyses The acoustic analysis was carried out using PRAAT, version 4.4.20 (Boersma & Weenink 2006). In some speakers we had the perceptual impression that they did not only increased their speech rate, but also their loudness, starting from slow to fast speech. In order to check the potential mixture of effects, we labeled the intensity peaks in the surrounding vowels for each repetition.
Since temporal parameters could reflect a potential increase in loudness too (vowel lengthening coincides with louder speech), we additionally labeled the beginning and end of the second formant to measure the duration of the preceding and following vowels. In cases where the intervocalic /p/ became voiced, we considered a decrease (an increase) in the amplitude envelope as the relevant vowel offset (vowel onset).
-1
0
1x 10
4
Aco
ustic
s
/apa/ slow
0
200
400
IOP
[Pa]
2400 2450 2500 2550 2600 2650 2700 2750 2800 2850 2900-1
0
1
Time [samples]
2nd
deriv
ativ
e
CLOSon CLOSoff
VOICoff
Claire Brutel-Vuilmet & Susanne Fuchs
8
2.3 Results 2.3.1 Potential confounding of faster rate with intensity An increase in loudness affects the properties of vowels more consistently in comparison to consonants (Mooshammer et al., 2006). Generally, an increase in subglottal pressure, intensity, f0, vowel lengthening was reported previously (most of these parameters go also hand in hand when a particular phrase is under a prosodic focus condition).
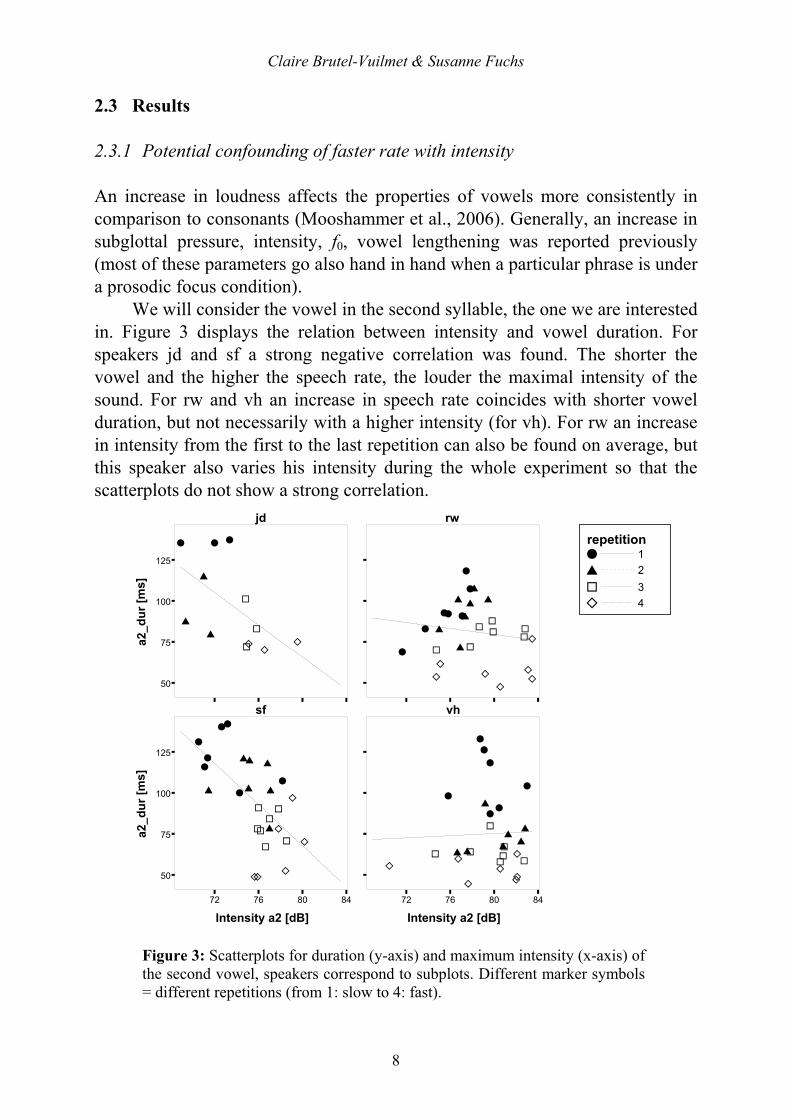
We will consider the vowel in the second syllable, the one we are interested in. Figure 3 displays the relation between intensity and vowel duration. For speakers jd and sf a strong negative correlation was found. The shorter the vowel and the higher the speech rate, the louder the maximal intensity of the sound. For rw and vh an increase in speech rate coincides with shorter vowel duration, but not necessarily with a higher intensity (for vh). For rw an increase in intensity from the first to the last repetition can also be found on average, but this speaker also varies his intensity during the whole experiment so that the scatterplots do not show a strong correlation.
W 1X 2G 3H 4
repetition
50
75
100
125
a2_d
ur [m
s]
W
X
GH
W
X
G
H
W
X
G H
jd rw
sf vh
W
X
G
H
WX
GH
W X
G
H
W
X
G
H
WX
G
H
W
X
G
H
W
X
GH
72 76 80 84
Intensity a2 [dB]
50
75
100
125
a2_d
ur [m
s] W
X
G
H
W
X
G
W
X
G
H
W
X
GH
W
XG
H
W
X
G
H
WX
G
H
72 76 80 84
Intensity a2 [dB]
W
XGH
W
XG
H
W
X
G
H
W
X
GH
W
X
G
H
W
X
G
H
W
XGH
Figure 3: Scatterplots for duration (y-axis) and maximum intensity (x-axis) of the second vowel, speakers correspond to subplots. Different marker symbols = different repetitions (from 1: slow to 4: fast).
Rate effects on aerodynamics of intervocalic stops
9
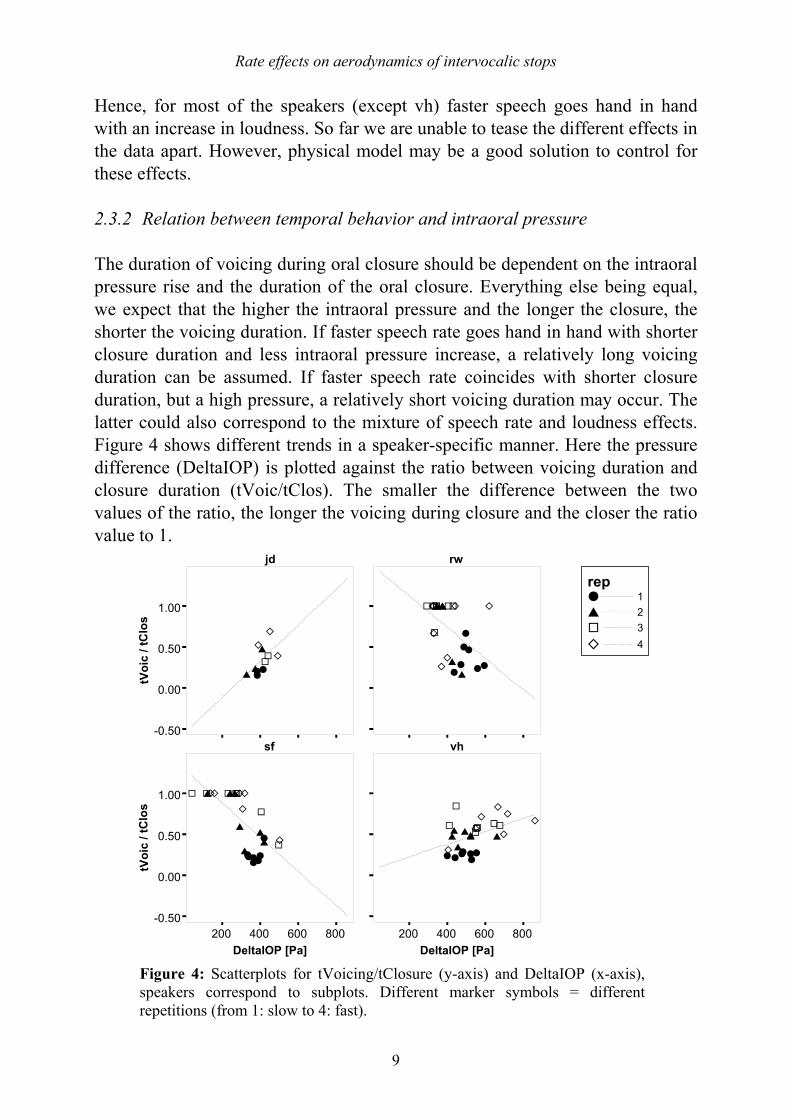
Hence, for most of the speakers (except vh) faster speech goes hand in hand with an increase in loudness. So far we are unable to tease the different effects in the data apart. However, physical model may be a good solution to control for these effects. 2.3.2 Relation between temporal behavior and intraoral pressure The duration of voicing during oral closure should be dependent on the intraoral pressure rise and the duration of the oral closure. Everything else being equal, we expect that the higher the intraoral pressure and the longer the closure, the shorter the voicing duration. If faster speech rate goes hand in hand with shorter closure duration and less intraoral pressure increase, a relatively long voicing duration can be assumed. If faster speech rate coincides with shorter closure duration, but a high pressure, a relatively short voicing duration may occur. The latter could also correspond to the mixture of speech rate and loudness effects. Figure 4 shows different trends in a speaker-specific manner. Here the pressure difference (DeltaIOP) is plotted against the ratio between voicing duration and closure duration (tVoic/tClos). The smaller the difference between the two values of the ratio, the longer the voicing during closure and the closer the ratio value to 1.
W 1X 2G 3H 4
rep
-0.50
0.00
0.50
1.00
tVoi
c / t
Clo
s
WXG HW
XH
WXG
H
jd rw
sf vh
WX
GH W
X GH
W
XG
HW
X
GH
W
XG H
W
XG H
W
XG
H
200 400 600 800DeltaIOP [Pa]
-0.50
0.00
0.50
1.00
tVoi
c / t
Clo
s
W
X
GH
W
X G
WX
G H
W
X
GH
WX
GH
W
X
G
H
W
X
G
H
200 400 600 800DeltaIOP [Pa]
WX
G
H W
XG H
W
XGH
W
X G
H
W
X G
H
W
XG H
W
X
G
H
Figure 4: Scatterplots for tVoicing/tClosure (y-axis) and DeltaIOP (x-axis), speakers correspond to subplots. Different marker symbols = different repetitions (from 1: slow to 4: fast).

Claire Brutel-Vuilmet & Susanne Fuchs
10
For all speakers it can be seen that the faster the speech rate, the closer the ratio gets to 1, i.e. the greater the voicing proportion to the closure. The slower the speech rate, the greater the temporal difference between the two parameters. Considering the temporal behavior in relation to the intraoral pressure development under various rates, speaker-specific strategies are found. For the speakers jd and vh an increasing intraoral pressure goes hand in hand with an increase in speech rate whereas for speakers rw and sf this relation is complementary.
Spearman Rho correlation coefficients for the different temporal and pressure relations are depicted in the table below.
Table 1: Spearman Rho correlation coefficients, P-values (* P<0.05, **P<0.001, ***P<0.001), number of samples included (N) for DeltaIOP with voicing duration, closure duration and the ratio tVoicing/tClosure, split by speaker.
speaker tVoicing tClosure tVoicing/tClosureJd DeltaIOP r (Spearman Rho) 0.57 -0.75 0.65 P-value 0.067 0.008** 0.029* N 11 11 11Rw DeltaIOP r (Spearman Rho) -0.08 0.63 -0.51 P-value 0.789 0.000*** 0.005** N 13 28 28Sf DeltaIOP r (Spearman Rho) 0.02 0.75 -0.74 P-value 0.950 0.000*** 0.000*** N 15 27 27Vh DeltaIOP r (Spearman Rho) 0.46 -0.47 0.50 P-value 0.014* 0.012* 0.006** N 28 28 28
Table 1 clearly shows that the development of intraoral pressure is closely linked to the duration of the oral closure. Additionally, the ratio between voicing and closure duration correlates with the pressure development. However, these correlations are sometimes positive and sometimes negative and we assume that they correspond to the following two strategies:
1. Speakers with a positive correlation between closure duration and intraoral pressure are those ones who either increase the amount of coarticulation between adjacent phonemes or reduce their spatial target.
2. Speakers with a negative correlation are those ones who speed up their articulation without a spatial reduction or an increase in coarticulation.
The second strategy can be tested by means of the set-up we used for modeling the aerodynamics of intervocalic stops.

Rate effects on aerodynamics of intervocalic stops
11
3 Rate effects on aerodynamics in model data In this part we describe the system used to gather the model data, obtained with a simplified model of the phonation system. We provide the details of the experimental set-up, the analysis procedure, and the results on the influence of speech rate. 3.1 Method The set-up which has been developed by GISPA-lab for a few years presented in Figure 5 is composed of (Ruty et al., 2007):
1. air compressor and air reservoir (model of the lungs, not seen on the picture),
2. a replica of self-oscillating vocal folds (latex tubes vibrating due to air flow),
3. a resonator (rigid tube, oversimplified vocal tract) 4. a constriction having an adjustable height (to simulate oral or lip
constriction) This set-up does not pretend to be a realistic model of the phonation system, but is used to reproduce different physical mechanisms occurring during speech production, in simplified and controlled configurations.
Figure 5: Experimental setup: 2- vocal folds replica; 3- tract; 4- constriction. Measurements The air pressure can be measured in different positions. In this paper only two points are considered: P0 is the alimentation pressure measured 2cm before the vocal folds replica (related to the subglottal pressure) and P2 is the pressure measured in the tube, a few centimeters before the constriction (related to the intraoral pressure). An optic sensor is used to measure the height of the
3
4
22
4

Claire Brutel-Vuilmet & Susanne Fuchs
12
constriction h3 (the width of the constriction is fixed). Pacou is the acoustical pressure measured at the output of the tube (see Figures 5 and 6).
Figure 6: Definition of the studied physical parameters.
The motion of the constriction can be controlled by a motorized system or just by hand. The use of the motorized system imposes a sinusoidal evolution of h3 (in this case the duration of closure is not adjustable). By hand, both speed and time of closure can be controlled, but less accurately. In this study, several values of the alimentation pressure P0 have been chosen ranging from P0=800Pa to P0=1400Pa.
The constriction is placed at the end of the tube, which simulates thus a configuration near to the production of the bilabial stop /p/. The resonator is a simple cylindrical tube, but more realistic geometries could be considered.
Some specificities of the experimental setup have to be taken into account to understand the differences to real speech data: 1. The boundaries of the tract are rigid, so that the volume of the tract remains constant, even during closure. 2. The air supply is continuous. It means that even if the tube is completely closed, the incident air flow is not stopped, it results in an increase of the pressure in the air reservoir (see paragraph 3.2.3). 3. The magnitude of the constriction motion can not be larger than about 2mm, i.e. the tract is always constricted (P2 never reaches 0). 3.2 Data analysis 3.2.1 Definition of the main parameters The different parameters used to characterize the data are presented in Figure 7.
The closure duration is directly obtained from the signal h3, representing the opening height of h3 at the constriction. It is defined by tClosuremod= CLOSoffmod-CLOSonmod, where CLOSonmod is the beginning of the decrease of h3 (beginning of the closing gesture), and CLOSoffmod is the beginning of the increase of h3 (end of closure and beginning of opening).
∆P ∆Pc
constriction
h3 flow P2 P0 Pacou

Rate effects on aerodynamics of intervocalic stops
13
The duration of voicing is defined by tVoicingmod=VOICoffmod-CLOSonmod, where VOICoffmod is determined from the pressure signals P0 or P2 as the offset of voicing.
DeltaIOPmod should be the maximum value of the pressure P2 during the closure. In fact, since the air supply is continuous, P0 and P2 increase slightly during the closure. So we chose DeltaIOPmod as the value of P2 observed when P2 begins to behave similar to P0.
Figure 7: Temporal landmarks for closure onset (CLOSonmod), closure offset (CLOSoffmod), voicing offset (VOICoffmod) and definition of DeltaIOPmod; 1st track: pressures P0 and P2, 2nd track: height of the constriction h3, 3rd track: acoustic signal.
3.2.2 The relation between subglottal and intraoral pressure A minimum value of P0 (or DeltaIOP) is needed to allow the self oscillations of the vocal folds replica. Figure 8 presents two recordings measured for two different values of the alimentation pressure P0, allowing or preventing the vibration of the vocal folds replica. (With the constriction, the pressure P0 should be higher than about 800Pa to obtain oscillations. Without any constriction, 300Pa is enough).
58 58.5 59 59.5 60 60.5 61 61.50
1000
2000
Pre
ssur
e [P
a]
P0P2
58 58.5 59 59.5 60 60.5 61 61.50
0.5
1
open
ing
h3 [
mm
]
58 58.5 59 59.5 60 60.5 61 61.5
0
Time [s]
Aco
ustic
Pre
ssur
e
h3
PacoutVoicingmod
DeltaIOPmod
CLOSoffmodtClosuremod
VOICoffmodCLOSonmod

Claire Brutel-Vuilmet & Susanne Fuchs
14
Figure 8: Pressure measurements obtained with (a) P0<1000Pa: no oscillations of the vocal folds replica (b) P0>1000Pa: self-oscillations of the vocal folds replica.
3.2.3 The influence of the speed of closure
Figure 9 shows an example of a recording in which the motion of the constriction is controlled by hand, to slowly shorten the closure duration.
Figure 9: Model measurements with variations of the closure speed – Complete closure, 1st track: pressures P0 and P2, 2nd track height of the constriction h3.
It can be seen that each closure is associated with an increase of the pressure P2 followed by the stop of the oscillations. Each opening phase is associated with a decrease of P2 and the resumption of the oscillations.
0 20 40 60 80 1000
500
1000
1500
2000
2500
Time [s]
Pres
sure
[Pa
]
P0P2
0 10 20 30 40 50 60 70 800
500
1000
1500
2000
2500
Time [s]
Pres
sure
[Pa
]
P0P2
(a) (b)
0 20 40 60 80 100-2000
0
2000
4000
Pres
sure
[Pa
]
P0P2
0 20 40 60 80 1000
0.5
1
1.5
Time [s]
open
ing
h3 [
mm
]
h3

Rate effects on aerodynamics of intervocalic stops
15
For a complete closure (h3→0, Figure 9), P2 increases until it reaches the alimentation pressure P0. Note that the slow general increase of both P0 and P2 during the closure phases is due to the continuous air supply.
Figure 10: Model measurements with variations of the closure speed – No complete closure, 1st track: pressures P0 and P2, 2nd track height of the constriction h3.
When the closure is not complete (h3→0.5mm, Figure 10), the maximum value of P2 during the closure stays lower than the alimentation pressure P0. Moreover, the pressure P0 and the maximum of P2 are constant during the closure phases. Even if the air supply is continuous, the opening height at the constriction is enough to avoid an increase of P0 and P2 during the closure phase.
When the motion of the constriction becomes too fast in comparison to the response time of the vocal folds replica, the self sustained motion of the vocal folds replica becomes rather difficult. Figure 11 displays measurements obtained for two different speeds of closure (complete closure, sinusoidal motorized motion). It is clearly shown that the oscillations are very weak for the highest speed (graph (b)), which is a limit of the setup.
0 20 40 60 80 100 120 140-1000
0
1000
2000
Pre
ssur
e [P
a]
P0P2
0 20 40 60 80 100 120 1400
0.5
1
1.5
open
ing
[mm
]
Time [s]
h3

Claire Brutel-Vuilmet & Susanne Fuchs
16
(a)
(b)
Figure 11: Model measurements with 2 different speeds of closure (a) self oscillations of vocal folds replica, (b) very weak motion of vocal folds replica, 1st track: pressures P0 and P2, 2nd track height of the constriction h3.
3.2.4 Comparison with the previous definition of the closure duration In Figure 12, CLOSonmod and CLOSoffmod defined from the signal h3 are compared to CLOSon and CLOSoff defined from the second derivative of the filtered pressure signal P2 (definition used in the analysis of real speech data, see 2.2, and applied on P2 measurements). Even if some discrepancies are observed and should be considered, it is confirmed that the extrema of the second derivative of the filtered intraoral pressure signal are relevant indicators for determining the closure duration, defined as the time between the beginning of the closure gesture and the beginning of the opening gesture.
However, we also noticed that the h3 signal contains more information than the second derivative of P2. It clearly shows beginning and end of the closure and opening gestures.
0 10 20 30 40 50 60 70
0
1000
2000
Pre
ssur
e [P
a]
P0P2
0 10 20 30 40 50 60 700
0.5
1
Time [s]
open
ing
h3 [
mm
]
h3
0 10 20 30 40 50
0
1000
2000
Pre
ssur
e [P
a]
P0P2
0 10 20 30 40 500
0.5
1
Time [s]
open
ing
h3 [
mm
]
h3

Rate effects on aerodynamics of intervocalic stops
17
Figure 12: Comparison of CLOSon, CLOSoff (from the 2nd derivative of the filtered P2 signal), CLOSonmod and CLOSoffmod (from h3 signal).
3.3 Results 3.3.1 General considerations Even if our experimental setup is a very simplified model used to reproduce the main phonation mechanisms, it mimics some interesting features. The evolutions of the acoustical pressure and the air pressure in the tract observed during a closure of the tube (Figure 7) are quite comparable to real speech during the production of intervocalic stops (Figure 2).
The closure of the tract results in an increase in the intraoral pressure P2 up to a threshold value. This increase results in the stop of the oscillations of the vocal folds replica. Then, the reopening is followed by a decrease of the intraoral pressure, which allows the resumption of the oscillations.
For a complete closure, the threshold value of P2 is equal to the alimentation pressure P0 (normal stop production). For an incomplete closure, the threshold value is lower than P0, depending on the minimum height of the constriction (leaky production).
However, some characteristics of the experimental setup should be considered to explain some observations: The continuous air supply results in a slow increase of P0 and P2 during closure phases in case of complete closure, which is of course not observed in real speech data. Moreover, due to the restricted maximum height of the constriction (h3max = about 2mm), the pressure P2 does not decrease until P2=0Pa during the opening phase because
72.8 73 73.2 73.4 73.6 73.8 74 74.2
-1
-0.5
0
0.5
1
h32nd derivative of P2 filtered
CLOSon CLOSoff
CLOSoffmodCLOSonmod

Claire Brutel-Vuilmet & Susanne Fuchs
18
the tract always presents an obstruction. For instance, in Figure 7 the mean value of P2 during the opening phase is about 500Pa. 3.3.2 Influence of speed of closure Several measurements have been carried out: 2 tube lengths (L=20cm, 30cm), different threshold values of P0, and different speed of closure controlled by hand.
For each recording and for each closure, the parameters CLOSonmod, CLOSoffmod', VOICoffmod and DeltaIOPmod are computed.
Figure 13 represents the ratio between the voicing duration tVoicmod and the closure duration tClosmod as a function of DeltaIOPmod with P0 ranging between 800 Pa (p1) and 1400 Pa (p4).
Figure 13: tVoic_mod/tClos_mod (y-axis) as function of DeltaIOP_mod (x-axis) for L=20cm (on the right) and L=30cm (on the left), with P0= 800Pa (p1), 1000Pa (p2), 1200Pa (p3), 1400Pa (p4).
These data show that the relative voicing duration globally increases with DeltaIOP, which is an expected physical result. Indeed, an increase of DeltaIOP corresponding to an increase of the alimentation pressure P0, results in a longer time to reach the threshold pressure drop (∆P=P0-P2)stop associated to the resumption of the oscillations of the vocal folds replica.
For these model data, the maximum value of P0 and the closure duration are independently controlled (independent control of the alimentation pressure and of the motion of the constriction). The geometry of the tract is also fixed (rigid tract). Consequently, we are closer to the second strategy (see p.10), without spatial reduction and without increase of coarticulation.
L=30cm A p1G p2R p3D p4
P0
1000 1250 1500 1750
DeltaIOP_mod [Pa]
0.22
0.24
0.26
0.28
0.30
_
A
A G
G
G
GG
G
G
G
GR
R
R
R
RR
R
R
R
R
RD
D
D D
D
D
D
D
D
DD
D
1000 1250 1500 1750
DeltaIOP_mod [Pa]
0.20
0.30
0.40
tVoi
c / t
Clo
s_m
od [s
]
A A
A
A
A
A
A
AG
G
G
GG
G
G
G
G
G
RR
R
RRR
RRRR
R
R
D D
D
D
DD
D
DD
D
D
L=20cm

Rate effects on aerodynamics of intervocalic stops
19
The results are consistent with results obtained for speakers jd and vh (positive slopes in Figure 4), which seems to confirm that these speakers do not use spatial reduction at faster speech rate (second strategy).
Unfortunately, we never obtain model measurements with a ratio tVoic_mod/ tClos_mod = 1 (complete voicing during closure), because we can not get oscillations of the vocal folds replica for fast constriction motion, so we can not analyze cases without devoicing. 4 Conclusions Two experimental methods have been developed and compared to gain a better understanding of aerodynamic properties in speech, especially during the production of intervocalic stops, focusing on the development of the intraoral pressure and the influence of speech rate.
Real speech data have been recorded of 4 native speakers of German. The analysis of intraoral pressure, voicing during closure phase, and closure duration shows that speech rate is heavily correlated to intensity (and hence, with the maximum of intraoral pressure). It confirms also that results are highly speaker specific and that different articulatory strategies should be considered.
Model data obtained from a mechanical replica with realistic physical behavior show a similar global intraoral pressure development as were found in real speech data. The analysis of the ratio between voicing during closure and closure duration confirmed our hypothesis that voicing is maintained longer when speech rate variations go hand in hand with loudness changes.
We conclude that an increase in speech rate coincides with a longer voicing during closure in the intervocalic stop. On the one hand this strategy can be attributed to a reduced spatial target and an increase in the amount of coarticulation, lowering intraoral pressure and sustaining voicing during closure. On the other hand, the data for 2 speakers of German and the model data can be attributed to a larger intraoral pressure going hand in hand with an increase in loudness (Note that this is only true for a certain vocal tract length).
Finally, this work has also shown that even if the experimental model is very simplified, it can be used to test various hypotheses on the aerodynamic properties concerning speech in controlled conditions.
The next step will be to compare these experimental data to theoretical data, in order to validate or improve new theoretical physical modeling.

Claire Brutel-Vuilmet & Susanne Fuchs
20
5 Acknowledgements This work was supported by a grant from the German Research Council (DFG) and is carried out within the framework of P2R program of the French ministry the French-German Network POPAART. We would like to thank Jörg Dreyer for the development of the experimental set-up and John Tamena for proof-reading. This work is dedicated to Dieter Fuchs. 6 References Arkebauer, H.J., Hixon, T.J. & Hardy, J.C. (1967). Peak intraoral air pressures during speech.
Journal of Speech and hearing Research 10: 196-208.
Bickley, C. (1991). Vocal fold vibration in a computer model of a larynx. In Gauffin, J. & Hammarberg, B. (eds.) Vocal Fold Physiology : Acoustic, Perceptual and Physiology Aspects of Voice Mechanisms. 37-46.
Boersma, P. & Weenink, D. (2006). Praat: doing phonetics by computer (Version 4.4.20) [Computer program]. http://www.praat.org/.
Brown, W.S. & McGlone, R.E. (1969). Relation of intraoral air pressure to oral cavity size. Phonetica 21: 321-331.
Byrd, D.; Tan, C. C. (1996). Saying consonant clusters quickly. Journal of Phonetics 24: 263-282.
Edwards, J., Beckman, M.E. & Fletcher, J. (1991) The articulatory kinematics of final lengthening Journal of the Acoustical Society of America 89(1): 369-382.
Fuchs, S. & Koenig, L. (2006). On the articulation, aerodynamics, and acoustics of voiceless consonant clusters. ISSP Ubatuba Brazil: 19-26.
Gibbon, F. E. & Lee, A. (accpeted) Producing turbulent speech sounds in the context of cleft palate. In Fuchs, S., Toda, M., Zygis, M. & Shadle, C. (eds.) On the Phonetics and Phonology of Turbulent Sounds. Mouton de Gryuter.
Hertegård, S., Gauffin, J. & Lindestad, P.-Å. (1995) A comparison of subglottal and intraoral pressure measurements during phonation. Journal of Voice 9(2): 149-155.
Huber, J.E., Stathopoulos, E.T. & Sussman, J.E. (2004) The control of aerodynamics, acoustics, and perceptual characteristics during speech production. Journal of the Acoustical Society of America 116(4): 2345-2353.
Malécot, A. (1969a). The lenis-fortis opposition: Its physiological parameters. Journal of the Acoustical Society of America 47(6/2): 1588-1592.
Malécot, A. (1969b). The effect of syllabic rate and loudness on the force of articulation of American stops and fricatives. Phonetica 19: 205-216.
McGowan, R.S., Koenig, L.L. & Löfqvist, A. (1995). Vocal tract aerodynamics in /aCa/ utterances: Simulations. Speech Communication 16: 67-88.

Rate effects on aerodynamics of intervocalic stops
21
Mooshammer, C., Hoole, P. & Geumann, A. (2006). Interarticulator cohesion within coronal consonant production. Journal of the Acoustical Society of America 120(2): 1028-1039.
Koenig, L. & Fuchs, S. (2006). The time course of intraoral pressure changes during the formation and release of consonants and consonant clusters of German. ISSP Ubatuba Brazil, 349-356.
Lindblom, B.E.F. (1963) Spectrographic study of vowel reduction. Journal of the Acoustical Society of America 35(11): 1773-1781.
Löfqvist, A., Koenig, L.L. & McGowan, R. (1995). Vocal tract aerodynamics in /aCa/ utterances: Measurements. Speech Communication 16: 49-66.
Pelorson, X. Hofmans, G. Ranucci, M. & Bosch, R. (1997) On the fluid mechanics of bilabial plosives. Speech Communication 22: 155-172
Pfitzinger, H. (2001). Phonetische Analyse der Sprechgeschwindigkeit. Forschungsberichte des Instituts für Phonetik und Sprachliche Kommunikation der Universität München (FIPKM) 38, 117-264.
Ruty, N. Pelorson, X. & Van Hirtum, A. (2007) An in vitro setup to test the relevance and the accuracy of low-order vocal folds models. Journal of the Acoustical Society of America 121(1): 479-490.
Tuller, B. & Kelso, J.A.S. (1984) The timing of articulatory gestures: Evidence for relational invariants. Journal of the Acoustical Society of America 76(4): 1030-1036.
Van Hirtum, A., Ruty, N., Pelorson, X., Fuchs, S. & Perrier, P. (2004) Laryngeal adjustment in the production of voiceless consonants: II. Physical modelling. Proc. of the ICVPB Marseille.
Weitkus, K. (1931). Experimentelle Untersuchung der Laut- und Silbendauer im deutschen Satz. PhD Dissertation at the University of Bonn.
Warren, D.W., Putnam Rochet, A., Dalston, R.M. & Mayo, R. (1992) Controlling changes in vocal tract resistance. Journal of the Acoustical Society of America 91(5): 2947-2953.