Rate Case Summary - eei. · PDF fileRate Case Summary Q2 2008 FINANCIAL UPDATE ... Stock...
12
Rate Case Summary Q2 2008 FINANCIAL UPDATE QUARTERLY REPORT OF THE U.S. SHAREHOLDER-OWNED ELECTRIC UTILITY INDUSTRY
Transcript of Rate Case Summary - eei. · PDF fileRate Case Summary Q2 2008 FINANCIAL UPDATE ... Stock...

Rate Case Summary
Q2 2008 FINANCIAL UPDATE QUARTERLY REPORT OF THE U.S. SHAREHOLDER-OWNED ELECTRIC UTILITY INDUSTRY

About EEI The Edison Electric Institute is the association of U.S. shareholder-owned electric companies. Our members serve 95% of the ultimate customers in the shareholder-owned segment of the industry, and represent approximately 70% of the U.S. electric power industry. We also have 79 international electric companies as Affiliate mem-bers and more than 190 industry suppliers and related organiza-tions as Associate members.
About EEI’s Quarterly Financial Updates EEI’s quarterly financial updates present industry trend analyses and financial data covering 70 U.S. shareholder-owned electric utility companies. These 70 companies include 61 electric utility holding companies whose stocks are traded on major U.S. stock exchanges and nine electric utilities who are subsidiaries of non-utility or foreign companies. Financial updates are published for the following topics:
Dividends Fuel Stock Performance Income Statement Credit Ratings Balance Sheet Construction Cash Flow Statement Rate Case Summary Business Segmentation
For EEI Member Companies The EEI Finance and Accounting Division is developing current year and historical data sets that cover a wide range of industry financial and operating metrics. We look forward to serving as a resource for member companies who wish to produce customized industry financial data and trend analyses for use in:
Investor relations studies and presentations
Internal company presentations
Performance benchmarking
Peer group analyses
Annual and quarterly reports to shareholders
We Welcome Your Feedback EEI is interested in ensuring that our financial publications and industry data sets best address the needs of member companies and the financial community. We welcome your comments, suggestions and inquiries. Contact: Mark Agnew Manager, Financial Analysis (202) 508-5049, [email protected] Amanda Morey Financial Analyst (202) 508-5526, [email protected]
Future EEI Finance Meetings 43rd EEI Financial Conference November 9-12, 2008 Marriott Desert Ridge Phoenix, Arizona EEI International Utility Conference March 15-17, 2009 London Hilton on Park Lane London, United Kingdom For more information about EEI Finance Meetings, please contact Debra Henry, (202) 508-5496, [email protected]
Edison Electric Institute 701 Pennsylvania Avenue, N.W. Washington, D.C. 20004-2696 202-508-5000 www.eei.org
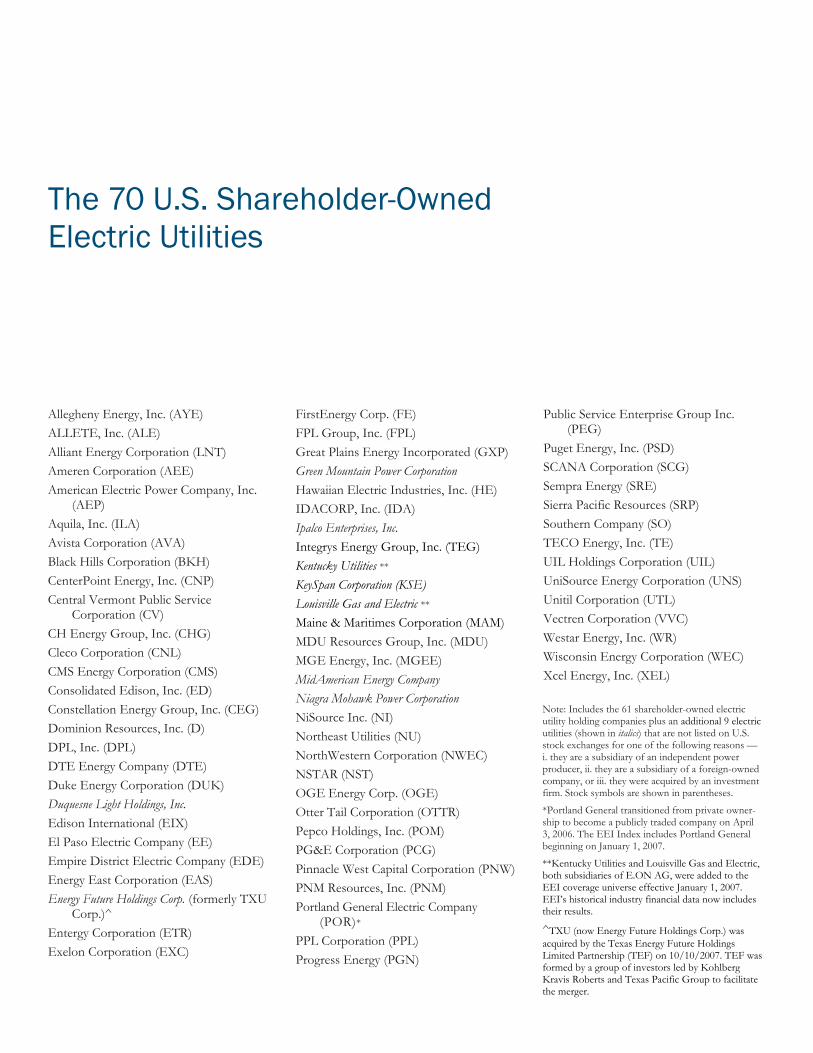
The 70 U.S. Shareholder-Owned Electric Utilities
Allegheny Energy, Inc. (AYE) ALLETE, Inc. (ALE) Alliant Energy Corporation (LNT) Ameren Corporation (AEE) American Electric Power Company, Inc.
(AEP) Aquila, Inc. (ILA) Avista Corporation (AVA) Black Hills Corporation (BKH) CenterPoint Energy, Inc. (CNP) Central Vermont Public Service
Corporation (CV) CH Energy Group, Inc. (CHG) Cleco Corporation (CNL) CMS Energy Corporation (CMS) Consolidated Edison, Inc. (ED) Constellation Energy Group, Inc. (CEG) Dominion Resources, Inc. (D) DPL, Inc. (DPL) DTE Energy Company (DTE) Duke Energy Corporation (DUK) Duquesne Light Holdings, Inc. Edison International (EIX) El Paso Electric Company (EE) Empire District Electric Company (EDE) Energy East Corporation (EAS) Energy Future Holdings Corp. (formerly TXU
Corp.)^
Entergy Corporation (ETR) Exelon Corporation (EXC)
FirstEnergy Corp. (FE) FPL Group, Inc. (FPL) Great Plains Energy Incorporated (GXP) Green Mountain Power Corporation Hawaiian Electric Industries, Inc. (HE) IDACORP, Inc. (IDA) Ipalco Enterprises, Inc. Integrys Energy Group, Inc. (TEG) Kentucky Utilities ** KeySpan Corporation (KSE) Louisville Gas and Electric ** Maine & Maritimes Corporation (MAM) MDU Resources Group, Inc. (MDU) MGE Energy, Inc. (MGEE) MidAmerican Energy Company Niagra Mohawk Power Corporation NiSource Inc. (NI) Northeast Utilities (NU) NorthWestern Corporation (NWEC) NSTAR (NST) OGE Energy Corp. (OGE) Otter Tail Corporation (OTTR) Pepco Holdings, Inc. (POM) PG&E Corporation (PCG) Pinnacle West Capital Corporation (PNW) PNM Resources, Inc. (PNM) Portland General Electric Company
(POR)* PPL Corporation (PPL) Progress Energy (PGN)
Public Service Enterprise Group Inc. (PEG)
Puget Energy, Inc. (PSD) SCANA Corporation (SCG) Sempra Energy (SRE) Sierra Pacific Resources (SRP) Southern Company (SO) TECO Energy, Inc. (TE) UIL Holdings Corporation (UIL) UniSource Energy Corporation (UNS) Unitil Corporation (UTL) Vectren Corporation (VVC) Westar Energy, Inc. (WR) Wisconsin Energy Corporation (WEC) Xcel Energy, Inc. (XEL)
Note: Includes the 61 shareholder-owned electric utility holding companies plus an additional 9 electric utilities (shown in italics) that are not listed on U.S. stock exchanges for one of the following reasons — i. they are a subsidiary of an independent power producer, ii. they are a subsidiary of a foreign-owned company, or iii. they were acquired by an investment firm. Stock symbols are shown in parentheses.
*Portland General transitioned from private owner-ship to become a publicly traded company on April 3, 2006. The EEI Index includes Portland General beginning on January 1, 2007.
**Kentucky Utilities and Louisville Gas and Electric, both subsidiaries of E.ON AG, were added to the EEI coverage universe effective January 1, 2007. EEI’s historical industry financial data now includes their results.
^TXU (now Energy Future Holdings Corp.) was acquired by the Texas Energy Future Holdings Limited Partnership (TEF) on 10/10/2007. TEF was formed by a group of investors led by Kohlberg Kravis Roberts and Texas Pacific Group to facilitate the merger.

Companies Listed by Category (as of 12/31/07) Please refer to the Quarterly Financial Updates webpage for previous years’ lists.
G iven the diversity of utility holding company corporate strategies, no single company categorization approach will be
useful for all EEI members and utility industry analysts. Never-the-less, we believe the following classification provides an informative framework for tracking financial trends and the capital markets’ response to business strategies as companies depart from the tradi-tional regulated utility model. Regulated 80%+ of total assets are regulated Mostly Regulated 50% to 80% of total assets are regulated Diversified Less than 50% of total assets are regulated
Categorization of the 61 publicly traded utility holding compa-nies is based on year-end business segmentation data presented in 10Ks, supplemented by discussions with company IR departments. Categorization of the nine non-publicly traded companies (shown in italics) is based on estimates derived from FERC Form 1 data and information provided by parent company IR departments.
The EEI Finance and Accounting Division continues to evaluate our approach to company categorization and business segmentation. In addition, we can produce customized categoriza-tion and peer group analyses in response to member company requests. We welcome comments, suggestions and feedback from EEI member companies and the financial community.
Regulated (44 of 70)
ALLETE, Inc. Ameren Corporation American Electric Power Company, Inc. Aquila, Inc. Avista Corporation Central Vermont Public Service Corporation CH Energy Group, Inc. Cleco Corporation CMS Energy Corporation Consolidated Edison, Inc. DPL, Inc. Duquesne Light Holdings, Inc. El Paso Electric Company Empire District Electric Company Energy East Corporation Great Plains Energy Incorporated Green Mountain Power Corporation IDACORP, Inc. IPALCO Enterprises, Inc. Kentucky Utilities KeySpan Corporation Louisville Gas and Electric Maine & Maritimes Corporation MGE Energy, Inc. Niagara Mohawk Power Corporation Northeast Utilities
NorthWestern Energy NSTAR PG&E Corporation Pinnacle West Capital Corporation PNM Resources, Inc. Portland General Electric Company Progress Energy Puget Energy, Inc. Sierra Pacific Resources Southern Company TECO Energy, Inc. UIL Holdings Corporation UniSource Energy Corporation Unitil Corporation Vectren Corporation Westar Energy, Inc. Wisconsin Energy Corporation Xcel Energy, Inc. Mostly Regulated (19 of 70)
Alliant Energy Corporation CenterPoint Energy, Inc. Dominion Resources, Inc. DTE Energy Company Duke Energy Corporation Edison International Entergy Corporation Exelon Corporation
First Energy Corp. FPL Group, Inc. Integrys Energy Group MidAmerican Energy Holdings NiSource Inc. OGE Energy Corp. Otter Tail Corporation Pepco Holdings, Inc. PPL Corporation Public Service Enterprise Group, Inc. SCANA Corporation Diversified (7 of 70)
Allegheny Energy, Inc. Black Hills Corporation Constellation Energy Group, Inc. Energy Future Holdings* Hawaiian Electric Industries, Inc. MDU Resources Group, Inc. Sempra Energy
Note: Based on assets at 12/31/07 *TXU (now Energy Future Holdings Corp.) was acquired by the Texas Energy Future Holdings Limited Partnership (TEF) on 10/10/2007. TEF was formed by a group of investors led by Kohlberg Kravis Roberts and Texas Pacific Group to facilitate the merger.

Q2 2008
Rate Case Summary
COMMENTARY ROE Eight general rate cases were filed in the second quarter. The long-term trend of rising rate case activity (see Chart I) is being driven by rising fuel costs, labor and materials cost inflation, and rising capital spending for environmental up-grades and new generation needed to meet growing power demand and to replace aging infrastructure.
The average awarded ROE was 10.41% in Q2, an uptick from the previous quarter but not significant enough to indi-cate a change in the long-term trend of lower allowed ROEs. Declining interest rates account for most of the long-term decline, but more recent attempts by utility commissions to constrain rising rates are also a likely factor.
The industry average requested ROE in Q2 was 10.93% — the lowest in our 20-year historical dataset — which fur-
ther confirms the downward trend in ROEs. The lowest re-quested ROE in Q2 was Consolidated Edison’s 10.0% (Con Ed is currently operating under a 9.1% ROE, awarded in its previous case filed last year. This is the lowest in the nation
I. U.S. Electric Output (GWh)
1
HIGHLIGHTS
■nEight general rate cases were filed in the second quar-ter. The industry’s average requested ROE in Q2 was 10.93% — the lowest in our 20-year historical dataset — which further confirms the long-term downward trend in requested and awarded ROEs. ■nThe main drivers of Q2’s filed cases included infra-structure investment, general operations and maintenance (O&M) cost inflation, and sharply rising fuel and pur-chased power costs. ■nWhile pricing and rate design are always a part of rate cases these appeared a bit more prominent in Q2, par-ticularly when intended to accommodate conservation, such as decoupling, critical peak pricing, green pricing and real-time pricing.
I. Number of Rate Cases Filed: 1990 — Q2 2008 (Quarterly)
EEI Q2 2008 Financial Update
U.S. Shareholder-Owned Electric Utilities
0
5
10
15
20
25
Source: SNL Financial / Regulatory Research Assoc. and EEI Rate Department
II. Average Awarded ROE : 1990 — Q2 2008 (Quarterly)
9.510.010.511.011.512.012.513.013.5
U.S. Shareholder-Owned Electric Utilities
Source: SNL Financial / Regulatory Research Assoc. and EEI Rate Department
%
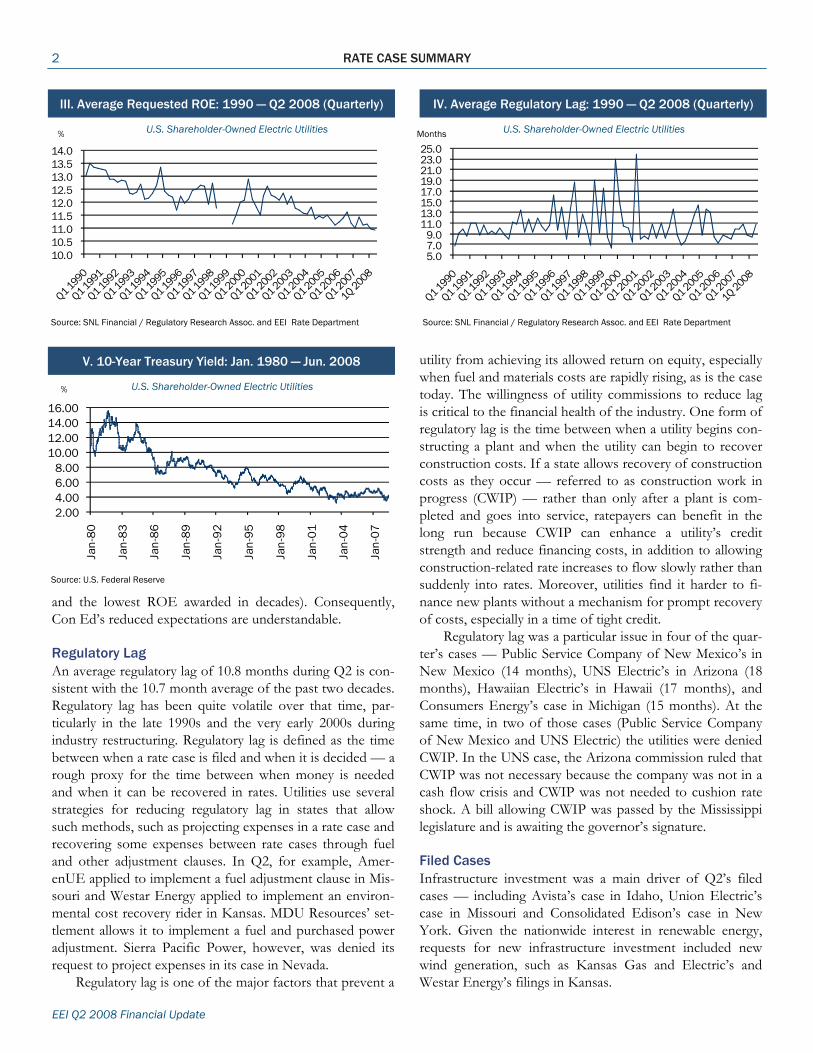
and the lowest ROE awarded in decades). Consequently, Con Ed’s reduced expectations are understandable.
Regulatory Lag An average regulatory lag of 10.8 months during Q2 is con-sistent with the 10.7 month average of the past two decades. Regulatory lag has been quite volatile over that time, par-ticularly in the late 1990s and the very early 2000s during industry restructuring. Regulatory lag is defined as the time between when a rate case is filed and when it is decided — a rough proxy for the time between when money is needed and when it can be recovered in rates. Utilities use several strategies for reducing regulatory lag in states that allow such methods, such as projecting expenses in a rate case and recovering some expenses between rate cases through fuel and other adjustment clauses. In Q2, for example, Amer-enUE applied to implement a fuel adjustment clause in Mis-souri and Westar Energy applied to implement an environ-mental cost recovery rider in Kansas. MDU Resources’ set-tlement allows it to implement a fuel and purchased power adjustment. Sierra Pacific Power, however, was denied its request to project expenses in its case in Nevada.
Regulatory lag is one of the major factors that prevent a
utility from achieving its allowed return on equity, especially when fuel and materials costs are rapidly rising, as is the case today. The willingness of utility commissions to reduce lag is critical to the financial health of the industry. One form of regulatory lag is the time between when a utility begins con-structing a plant and when the utility can begin to recover construction costs. If a state allows recovery of construction costs as they occur — referred to as construction work in progress (CWIP) — rather than only after a plant is com-pleted and goes into service, ratepayers can benefit in the long run because CWIP can enhance a utility’s credit strength and reduce financing costs, in addition to allowing construction-related rate increases to flow slowly rather than suddenly into rates. Moreover, utilities find it harder to fi-nance new plants without a mechanism for prompt recovery of costs, especially in a time of tight credit.
Regulatory lag was a particular issue in four of the quar-ter’s cases — Public Service Company of New Mexico’s in New Mexico (14 months), UNS Electric’s in Arizona (18 months), Hawaiian Electric’s in Hawaii (17 months), and Consumers Energy’s case in Michigan (15 months). At the same time, in two of those cases (Public Service Company of New Mexico and UNS Electric) the utilities were denied CWIP. In the UNS case, the Arizona commission ruled that CWIP was not necessary because the company was not in a cash flow crisis and CWIP was not needed to cushion rate shock. A bill allowing CWIP was passed by the Mississippi legislature and is awaiting the governor’s signature.
Filed Cases Infrastructure investment was a main driver of Q2’s filed cases — including Avista’s case in Idaho, Union Electric’s case in Missouri and Consolidated Edison’s case in New York. Given the nationwide interest in renewable energy, requests for new infrastructure investment included new wind generation, such as Kansas Gas and Electric’s and Westar Energy’s filings in Kansas.
10.010.511.011.512.012.513.013.514.0
2 RATE CASE SUMMARY
EEI Q2 2008 Financial Update
III. Average Requested ROE: 1990 — Q2 2008 (Quarterly)
U.S. Shareholder-Owned Electric Utilities
Source: SNL Financial / Regulatory Research Assoc. and EEI Rate Department
V. 10-Year Treasury Yield: Jan. 1980 — Jun. 2008
U.S. Shareholder-Owned Electric Utilities
Source: U.S. Federal Reserve
IV. Average Regulatory Lag: 1990 — Q2 2008 (Quarterly)
U.S. Shareholder-Owned Electric Utilities
Source: SNL Financial / Regulatory Research Assoc. and EEI Rate Department
5.07.09.0
11.013.015.017.019.021.023.025.0
2.004.006.008.00
10.0012.0014.0016.00
Jan
-80
Jan
-83
Jan
-86
Jan
-89
Jan
-92
Jan
-95
Jan
-98
Jan
-01
Jan
-04
Jan
-07
%
%
Months

RATE CASE SUMMARY 3
EEI Q2 2008 Financial Update
VI. Rate Case Data: From Tables I-V
U.S. Shareholder-Owned Electric Utilities
Number of Average Average Average Average Quarter Rate Cases Filed Awarded ROE Requested ROE 10-Year Treasury Yield Regulatory Lag Q4 1988 1 NA 14.30 8.96 NA Q1 1989 4 NA 15.26 9.21 NA Q2 1989 4 NA 13.30 8.77 NA Q3 1989 14 NA 13.65 8.11 NA Q4 1989 13 NA 13.47 7.91 NA Q1 1990 6 12.62 13.00 8.42 6.71 Q2 1990 20 12.85 13.51 8.68 9.07 Q3 1990 6 12.54 13.34 8.70 9.90 Q4 1990 8 12.68 13.31 8.40 8.61 Q1 1991 13 12.66 13.29 8.02 11.00 Q2 1991 17 12.67 13.23 8.13 11.00 Q3 1991 15 12.49 12.89 7.94 8.70 Q4 1991 12 12.42 12.90 7.35 10.70 Q1 1992 6 12.38 12.77 7.30 8.90 Q2 1992 15 11.83 12.86 7.38 9.61 Q3 1992 11 12.03 12.81 6.62 9.00 Q4 1992 12 12.14 12.36 6.74 10.10 Q1 1993 6 11.84 12.33 6.28 8.87 Q2 1993 7 11.64 12.39 5.99 8.10 Q3 1993 5 11.15 12.70 5.62 11.20 Q4 1993 9 11.04 12.12 5.61 10.90 Q1 1994 15 11.07 12.15 6.07 13.40 Q2 1994 10 11.13 12.37 7.08 9.28 Q3 1994 11 12.75 12.66 7.33 11.80 Q4 1994 4 11.24 13.36 7.84 9.26 Q1 1995 10 11.96 12.44 7.48 12.00 Q2 1995 10 11.32 12.26 6.62 10.40 Q3 1995 8 11.37 12.19 6.32 9.50 Q4 1995 5 11.58 11.69 5.89 10.60 Q1 1996 3 11.46 12.25 5.91 16.30 Q2 1996 9 11.46 11.96 6.72 9.80 Q3 1996 4 10.76 12.13 6.78 14.00 Q4 1996 4 11.56 12.48 6.34 8.12 Q1 1997 4 11.08 12.50 6.56 13.80 Q2 1997 5 11.62 12.66 6.70 18.70 Q3 1997 3 12.00 12.63 6.24 8.33 Q4 1997 4 11.06 11.93 5.91 12.70 Q1 1998 2 11.31 12.75 5.59 10.20 Q2 1998 7 12.20 11.78 5.60 7.00 Q3 1998 1 11.65 NA 5.20 19.00 Q4 1998 5 12.30 12.11 4.67 9.11 Q1 1999 1 10.40 NA 4.98 17.60 Q2 1999 3 10.94 11.17 5.54 8.33 Q3 1999 3 10.75 11.57 5.88 6.33 Q4 1999 4 11.10 12.00 6.14 23.00 Q1 2000 3 11.08 12.10 6.48 15.10 Q2 2000 1 11.00 12.90 6.18 10.50 Q3 2000 2 11.68 12.13 5.89 10.00 Q4 2000 8 12.50 11.81 5.57 7.50 Q1 2001 3 11.38 11.50 5.05 24.00 Q2 2001 7 10.88 12.24 5.27 8.00 Q3 2001 7 10.78 12.64 4.98 8.62 Q4 2001 6 11.57 12.29 4.77 8.00 Q1 2002 4 10.05 12.22 5.08 10.80 Q2 2002 6 11.41 12.08 5.10 8.16 Q3 2002 4 11.25 12.36 4.26 11.00 Q4 2002 6 11.57 11.92 4.01 8.25

RATE CASE SUMMARY 4
EEI Q2 2008 Financial Update
NA = Not available Source: SNL Financial / Regulatory Research Assoc. and EEI Rate Department
VI. Rate Case Data: From Tables I-V (cont.)
U.S. Shareholder-Owned Electric Utilities
Number of Average Average Average Average Quarter Rate Cases Filed Awarded ROE Requested ROE 10-Year Treasury Yield Regulatory Lag Q1 2003 3 11.49 12.24 3.92 10.20 Q2 2003 10 11.16 11.76 3.62 13.60 Q3 2003 5 9.95 11.69 4.23 8.80 Q4 2003 10 11.09 11.57 4.29 6.83 Q1 2004 5 11.00 11.54 4.02 7.66 Q2 2004 8 10.64 11.81 4.60 10.00 Q3 2004 6 10.75 11.35 4.30 12.50 Q4 2004 5 10.91 11.48 4.17 14.40 Q1 2005 4 10.55 11.41 4.30 8.71 Q2 2005 12 10.13 11.49 4.16 13.70 Q3 2005 8 10.84 11.32 4.21 13.00 Q4 2005 10 10.57 11.14 4.49 8.44 Q1 2006 11 10.38 11.23 4.57 7.33 Q2 2006 18 10.39 11.38 5.07 8.83 Q3 2006 7 10.06 11.64 4.90 8.33 Q4 2006 12 10.38 11.19 4.63 8.11 Q1 2007 11 10.30 11.00 4.68 9.88 Q2 2007 16 10.27 11.44 4.85 9.82 Q3 2007 8 10.02 11.13 4.73 10.80 Q4 2007 11 10.44 11.16 4.26 8.75 Q1 2008 7 10.15 10.98 3.66 7.33 Q2 2008 8 10.41 10.93 3.89 10.80
After the past year’s sharp rise in global fuel commodity prices, it likely comes as no surprise that fuel, purchased power and related expenses also figured prominently in Q2’s filed cases. Examples include Wisconsin Public Ser-vice’s filing in Wisconsin and Avista’s in Idaho. Operation and maintenance (O&M) expenses also accounted for a healthy part of the impetus for the quarter’s rate increase requests. Examples here also include Wisconsin Public Ser-vice’s filing in Wisconsin, as well as Union Electric’s filing in Missouri.
While pricing and rate design are always a part of rate cases these appeared a bit more prominent in Q2, particu-larly when intended to accommodate conservation, such as decoupling, critical peak pricing, green pricing and real-time pricing. Wisconsin Public Service’s case in Wisconsin is a good example, as the company requested each of these dif-ferent conservation-related pricing modalities.
Decided Cases Employee Incentives It was a difficult quarter for recovery of employee incen-tives. In Public Service Company of New Mexico’s case, the commission disallowed 80% of an employee incentive pro-
gram viewing it as related to earnings per share goals and not to goals that benefit the customer. In the case of the officer incentive programs, 100% was disallowed. In UNS’s case, the commission disallowed a small amount of the re-quest associated with the utility’s executive retirement plan and stock-based compensation.
Company Incentives MDU Resources in Montana was allowed to implement a fuel and purchased power adjustment with a 90/10 sharing mechanism for changes in fuel and purchased power costs and for off-system sales. However, the New Mexico com-mission denied Public Service Company of New Mexico the sharing of off-system sales revenues, as the commission found the company did not need any additional incentive to maximize off-system sales. In Michigan, the commission approved Consumers Energy’s electric choice incentive mechanism; if open access sales increase or decrease more than 5% from an amount approved in rates, a charge or credit will be implemented.
Conservation and the Environment The second quarter was not as favorable a time for recovery of conservation and environmental expenses as one might expect. In New Mexico, the commission denied Public Ser-

5 RATE CASE SUMMARY
EEI Q2 2008 Financial Update
VII. Summary of Rate Cases Filed in 2008
U.S. Shareholder-Owned Electric Utilities
Q1 2008 Date Filed: 1/31/2008 Company/Commission: Indiana Michigan Power/IN Request: 9.1% increase, $82.4 million, 11.5% ROE, 8.1% ROR Key Drivers: Increased operating expenses and implementation of a
reliability enhancement (infrastructure) tracking mechanism, a DSM/energy efficiency program tracker (including costs of re-duced usage), and off-system sales margin tracker, a PJM tracker, and an environmental compliance cost tracker.
Expected Decision Date: 12/2008 Date Filed: 2/22/2008 Company/Commission: Wisconsin Power and Light/WI Request: 9.1% increase, $93.3 million, 10.8% ROE, 10.08% ROR Key Drivers: Increased expenditures for electric generation, environ-
mental compliance, renewable energy, energy efficiency and conservation, and transmission and distribution. Expected Decision Date: 12/2008 Date Filed: 2/27/2008 Company/Commission: Portland General Electric/OR Request: 8.9% increase, $145.9 million, 10.75% ROE, 8.66% ROR Key Drivers: Updates to power and fuel costs, higher O&M expenses,
regulatory compliance costs, and system upgrades. Expected Decision Date: 12/2008 Date Filed: 2/29/2008 Company/Commission: Appalachian Power/WV Request: 16.7% increase, $156.3 million, 10.5% ROE, 7.65% ROR Key Drivers: The bulk of the increase reflects increased fuel and purchased power costs. Increase also reflects environmental compliance construction. Expected Decision Date: 7/2008 Date Filed: 3/4/2008 Company/Commission: Avista/WA Request: 10.3% increase, $36.6 million, 10.8% ROE, 8.2% ROR Key Drivers: Fuel expenses, plant investments, and expansion costs. Expected Decision Date: 2/2009 Date Filed: 3/7/2008 Company/Commission: Idaho Power/ID Request: 1.4% increase, $9 million, 8.1% ROR Key Drivers: New generation. Expected Decision Date: NA Date Filed: 3/24/2008 Company/Commission: Arizona Public Service/AZ Request: 14.1% increase, $371.7 million, 11.5% ROE, 8.87% ROR Key Drivers: Fuel and purchased power costs, hook-up fees and new
generation. Expected Decision Date: 7/2009 Q2 2008 Date Filed: 4/1/2008 Company/Commission: Wisconsin Public Service/WI Request: 8.9% increase, $87.5 million, 10.9% ROE, 9.29% ROR Key Drivers: Absence of refund associated with decommissioning a
nuclear plant that commission had required be used to reduce revenue requirement; costs of new generation; new environ-
mental, transmission and generation maintenance expenses; fuel and fuel-related expenses; decoupling proposal; expan-sions of critical peak pricing program; expansion of green pric-ing program; adding a real-time pricing rate.
Expected Decision Date: 12/2008 Date Filed: 4/2/2008 Company/Commission: Avista/ID Request: 16.7% increase, $32.3 million, 10.8% ROE, 8.74% ROR Key Drivers: Generation and delivery system investments and in-
creased fuel and purchased power costs. Expected Decision Date: 11/2008 Date Filed: 4/4/2008 Company/Commission: Union Electric/MO Request: 12.1% increase, $250.8 million, 10.9% ROE, 8.31% ROR Key Drivers: Infrastructure investment; increased operating costs (in
particular fuel and purchased power costs); implementation of a fuel adjustment clause; costs to make improvements benefit-ing reliability.
Expected Decision Date: 3/2009 Date Filed: 5/2/2008 Company/Commission: Minnesota Power/MN Request: 9.69% increase, $45 million, 11.15% ROE Key Drivers: Higher O&M expenses and increased regulatory compli-
ance costs. Expected Decision Date: 3/2009 Date Filed: 5/9/2008 Company/Commission: Consolidated Edison Company of New York/
NY Request: 5.8% increase, $654.1 million, 10% ROE, 7.86% ROR Key Drivers: Infrastructure additions, the costs of energy conserva-
tion programs, increased property taxes. Expected Decision Date: 3/2009 Date Filed:5/28/2008 Company/Commission: Kansas Gas and Electric/KS Request: 14.9% increase, $87.6 million, 10.95% ROE, 8.69% ROR Key Drivers: New generation (including wind generation) and ice
storm recovery. Expected Decision Date: 1/2009 Date Filed: 5/28/2008 Company/Commission: Westar Energy/KS Request: 15% increase, $90 million, 10.95% ROE, 8.68% ROR Key Drivers: New generation, including wind generation; ice storm
recovery; and implementation of an environmental cost recov-ery rider.
Expected Decision Date: 1/2009 Date Filed: 5/30/2008 Company/Commission: Appalachian Power/VA Request: 23.9% increase, $207.9 million, 11.75% ROE, 8.63% ROR Key Drivers: Expenses that had not been recovered during rate
freeze. Expected Decision Date: 1/2009 Source: SNL Financial / Regulatory Research Assoc. and EEI Rate Department

6 RATE CASE SUMMARY
EEI Q2 2008 Financial Update
VIII. Summary of Rate Cases Decided in 2008
U.S. Shareholder-Owned Electric Utilities
Q1 2008 Date: 1/8/2008 Company/State: Northern States Power Company Wisconsin/WI Allowed: 8.1% increase, $39.4 million, 10.75% ROE, 9.67% ROR Comments: The Commission allowed a fully forecasted test year and
moderately adjusted ROE downward in keeping with the Com-mission policy of gradual adjustments in rate cases. The Com-mission adopted a higher electric sales forecast and lower fuel and purchase power costs than those proposed by the com-pany, thus reducing the revenue requirement.
Date: 1/17/2008 Company/State: Wisconsin Electric Power/WI Allowed: 6.6% increase, $148.4 million, 10.75% ROE, 9.26% ROR Comments: A two-step increase split roughly equally between 2008
and 2009 offsets what would have been a greater increase using distribution of proceeds from sale of generation. The Commission reduced the equity component of capital structure by treating the equity investment in Wisconsin Electric’s trans-mission operator (American Transmission Company) as a non-utility investment. The Commission reduced A&G expenses to reflect certain compensation, pension and benefit expenses that the Commission ruled did not benefit ratepayers. Some other adjustments related to differences between the com-pany’s and the Commission’s forecasts.
Date: 1/28/2008 Company/State: Connecticut Light & Power/CT Allowed: 2.4% increase, $98 million, 9.4% ROE, 7.42% ROR Comments: Increase to be implemented in two steps. Much of the
reason for the low ROE relates to details in determining rate of return. At issue were proxy group determination, data to be used in determining earnings per share growth, market-to-book adjustment, risk-free rate, data used in determining risk pre-mium, and ROE flotation cost adjustment. The Commission adopted a 48.99% equity capital structure, finding it adequate for the company to attract capital. CL&P had argued for a higher equity component to help with its cash shortage. Among other items contributing to lower recovery than requested were ex-tending the recovery period of amounts merchant generators owed company, depreciation adjustments, reduction to incen-tive compensation amounts, and reduction to storm reserve. Expenses in excess of budget associated with a customer ser-vice integration project were deferred to a future proceeding. The Commission also rejected the implementation of a decoup-ling mechanism, although decoupling is statutorily supported in Connecticut. The Commission found that a significant portion of CL&P’s revenues are already decoupled and that the company is likely to achieve forecast sales. Instead, the Commission ordered the company to submit in its next rate case a proposal for a sliding residential customer charge that would recover less distribution revenue through energy charges.
Date: 1/30/2008 Company/State: Potomac Electric Power/DC Allowed: 8.2% increase, $28.3 million, 10% ROE, 7.96% ROR Comments: The Commission declined to approve a revenue decoup-
ling mechanism for Pepco, but will consider the proposal in a separate proceeding. The Commission found the decoupling proposal raised legal issues related to public notice and com-ments on rate changes. The Commission said that it primarily
relies on the discounted cash flow methodology to determine cost of equity, because it “most reliably focuses the analysis on comparable companies or proxy groups.” However, the Commis-sion thought the proxy group that Pepco submitted did not ac-curately reflect Pepco’s risk profile. The Commission rejected an adjustment that Pepco proposed to capture reduction in usage from higher electricity prices, because the Commission said Pepco did not support the adjustment with sufficient testi-mony on price elasticity in the DC service territory. The Commis-sion also rejected some executive incentive compensation as not benefiting ratepayers, saying the goals of the incentive com-pensation program were not customer service based. Pepco proposed an adjustment mechanism that would true up pen-sion and other post retirement benefit expenses, saying varia-tions in such expenses are not within Pepco management con-trol. The Commission rejected the proposal, saying normal re-covery
creates the right incentive for Pepco to control such costs. Date: 1/31/2008 Company/State: Central Vermont Public Service/VT Allowed: 2.3% increase, $6.4 million, 10.71% ROE, 8.5% ROR Comments: Settlement stipulates that, if the Commission approves
an alternative regulation plan for Central Vermont, the ROE will be reduced by 50 basis points, ROR will be reduced by 0.25%, and revenue requirement will be reduced by $1.4 million. An-other stipulation is that Central Vermont hire an outside con-sultant to conduct a business process review of company op-erations. The settlement also restricts employee levels, incen-tive compensation, and base salary increases for company offi-cers. Officer incentives are eliminated, employee incentives are reduced by half, and officer base salary increases are restricted to the percentage of union base pay increases until the com-pany achieves investment grade debt ratings.
Date: 2/28/2008 Company/State: Idaho Power Company/ID Allowed: 5.2% increase, $32.1 million, 8.1% ROR Comments: Settlement requires parties to engage in good faith ef-
fort to consider forecasted test year and company’s need for timely rate relief.
Date: 2/29/2008 Company/State: Fitchburg Gas & Electric Light/MA Allowed: 3% distribution-only increase, $2.1 million, 10.25% ROE,
8.38% ROR Comments: The Department of Public Utilities adopted an ROE
“within a reasonable range” and that will preserve the com-pany’s “financial integrity, allow it to attract capital on reason-able terms,” and will be comparable to companies of similar risk. DPU excluded security deposit for independent system operator from rate base, ruling that it is a transmission-related charge in this distribution only rate case. DPU also excluded post-2007 advanced metering infrastructure costs from rate base as insignificant and reduced amortization expenses for capitalized software, because it found the software was still in service and not near retirement.
Date: 3/12/2008 Company/State: PacifiCorp/WY Allowed: 4.7% increase, $23 million, 10.25% ROE, 8.29% ROR Comments: NA

RATE CASE SUMMARY
EEI Q2 2008 Financial Update
VIII. Summary of Rate Cases Decided in 2008 (cont.)
U.S. Shareholder-Owned Electric Utilities
Date: 3/25/2008 Company/State: Consolidated Edison of New York/NY Allowed: $425.3 million increase, 9.1% ROE, 7.34% ROR Comments: The commission moderated the rate increase through
the use of property tax refunds, adjustment to the depreciation reserve deficiency, and other adjustments. The PSC said that it did not limit itself to “issue-by-issue analysis,” but had taken into account “strongly held views by the public, and the officials that represent them.” The PSC also said that it is “taking action to stabilize the upward pressure on electric rates that the com-pany’s construction requirements and operations” are produc-ing. The PSC is asking the company for a 5-year forecast of expenses and demonstrated consideration of rate mitigation. The PSC adopted a capital structure including unregulated op-erations, contrary to the company’s stand-alone capital struc-ture proposal. The PSC also excluded from rates the company’s variable pay plan that the PSC rules is incentive compensation that should be recovered based on improved corporate per-formance. The PSC said that Con Ed’s overall spending was greater than targeted, without sufficient support. The PSC al-lowed the company to implement a revenue decoupling mecha-nism, but rejected an associated weather normalization provi-sion as too complex and subject to gaming. The PSC also re-jected the company’s revenue-per-customer approach to de-coupling in favor of a total class revenue approach.
Q2 2008 Date: 4/22/2008 Company/State: MDU Resources/MT Allowed: 11.5% increase, $4.1 million, 10.25% ROE, 8.58% ROR Comments: Case was partially settled. Settlement allows company to
implement a fuel and purchased power adjustment with a 90/10 sharing mechanism for changes in fuel and purchased power costs and for off-system sales margins. Final order post-poned until the next rate case with inclusion of new generation.
Date: 4/24/2008 Company/State: Public Service Company of New Mexico/NM Allowed: 6.2% increase, $34.4 million, 10.1% ROE, 8.24% ROR Comments: 14 month regulatory lag in this case. The commission
denied the company’s request to implement an environmental surcharge. The commission also denied the utility’s request for construction work in progress and for a sharing of off-system sales revenues. The commission found that the company did not need any additional incentive to maximize off-system sales. The commission also adopted a higher capacity factor for some generation, resulting in an imputation of more off-system sales and an additional disallowance. Differences in estimates of sales of SO2 allowances resulted in another disallowance. The commission also disallowed 80% of an employee incentive pro-gram as related to achievement of earning per share goals as opposed to goals that benefit the customer.
Date: 5/1/2008 Company/State: Hawaiian Electric/HI Allowed: 3.7% increase, $44.9 million, 10.7% ROE, 8.66% ROR Comments: Commission, in this partially settled case, denied inclu-
sion of company’s prepaid pension asset in rate base as not used and useful in providing service. Commission also disal-
lowed some company-sponsored conservation-related advertis-ing expenses.
Date: 5/27/2008 Company/State: UNS Electric/AZ Allowed: 2.6% increase, $4 million, 10% ROE, 9.02% ROR Comments: Order issued 18 months after filing date. Order denies
construction work-in-progress requested by company, because company was not in a cash flow crisis and construction work-in-progress in this case is not necessary to defray rate shock. Small disallowances also recorded for rate case expense, ex-ecutive retirement plan and stock based compensation, long term incentive plan for non-union employees, worker’s compen-sation, and pension and benefits expense.
Date: 5/30/2008 Company/State: Idaho Power/ID Allowed: $8.9 million increase, 8.1% ROR Comments: The increase reflects the recovery of the addition of new
generation and some limited transmission facilities. Date: 6/10/2008 Company/State: Consumers Energy/MI Allowed: 6.3% increase, $221 million, 10.7% ROE, 6.93% ROR Comments: Commission approved an electric choice incentive
mechanism proposed by company. If open access sales in-crease or decrease more than 5% from amount approved in rates, a charge or credit would be implemented. Commission also reduced allowed ROE from previous award, because the commission determined that improved capital structure and divestiture of nuclear assets lessened the risk for investors. However, the commission believes that by setting allowed ROE above midpoint of 57 comparison companies, the commission is recognizing the company’s efforts to improve customer ser-vice, safety, system reliability, and financial management.
Date: 6/27/2008 Company/State: Sierra Pacific Power/NV Allowed: $87 million increase, 10.6% ROE, 8.41% ROR Comments: The commission ruled that the company did not meet
the burden of proof necessary to support a future test year. (New legislation authorized utilities to base rates on a future test year under certain conditions. The commission rejected this first attempt under the new law.)
Date: 6/27/2008 Company/State: Appalachian Power/WV Allowed: $106.1 million increase, 10.5% ROE, 7.65% ROR Comments: Bulk of the increase is attributable to increases in fuel
and purchase power charges, reliability-related cost surcharge, and environmental construction surcharge.
Source: SNL Financial / Regulatory Research Assoc. and EEI Rate Department
7

8 RATE CASE SUMMARY
vice Company of New Mexico’s attempt to implement an environmental surcharge, and in Hawaii, the commission denied some of Hawaiian Electric’s company-sponsored conservation-related advertising expenses.
These actions aside, much is happening across the in-dustry in the energy efficiency and conservation arenas. For instance, Puget Sound Energy is launching improved energy efficiency programs, including home energy use analysis (including installation of in-home energy use monitors and reports on how usage compares with other homes), 70% funding for commercial and industrial lighting retrofits, and 100% credit for builders for achieving energy efficiency standards above current codes. Puget Sound Energy’s pro-grams would save enough energy over the next 20 years to supply Seattle, Bellevue, Bellingham and Olympia com-bined. Under the utility’s current energy efficiency incen-tives, customers have doubled their electricity savings over the past five years. However, prospective future savings can-not offset all the likely demand growth in the utility’s terri-tory.
Xcel Energy in North Dakota has proposed a conserva-tion program in which customers get discounted energy audits and low cost compact fluorescent lighting, among other benefits. The Long Island Power Authority (LIPA) is launching a program in which a small fee on residential cus-tomer bills will fund three programs that promote purchase of efficient products and efficiency upgrades in homes. An additional two programs targeting commercial customers will encourage energy efficient new construction, renova-tions, replacements and retrofits.
Legislative Efforts Maryland legislators approved two bills in the second quar-ter aimed at reducing the state’s energy consumption by 15% by 2015. The state’s electric utilities are responsible for a 10% reduction, and the Maryland Energy Agency is re-sponsible for creating programs for the remaining 5%. In addition, half of the proceeds of the state’s auction of car-bon dioxide emission allowances will fund programs to re-duce energy consumption. And the state’s renewable re-quirement has been increased to 20% by 2022. (For more
information on state renewable portfolio standards, please see the Fuel quarterly financial updates.)
Also in Q2, New York State continued to advance its plan to reduce electricity consumption by 15%, relative to the current trend, by 2015. And a Los Angeles City Council committee has tentatively approved a plan to set higher rates for customers who use the most electricity.
Fuel Because this report covers base rate cases, not single-issue cases such as fuel adjustment cases, the effects of fuel on the industry might appear somewhat understated. Many utilities recover rapidly increasing fuel costs through fuel adjustment clauses and single-issue proceedings. Utilities that cannot may suffer short-term cash flow impairment until they file for and get recovery in a base rate case (creating a form of regulatory lag). Recent dramatic in-creases in fuel costs — visible to us all at the gas pump — produced the need for double-digit rate increases at several utilities in Q2.
Dominion Virginia Power said its fuel costs have risen more than 200% since 2004. It requested and received an 18% increase in a fuel-only case. The company does not make a profit on such fuel adjustments and is attempting to lighten the burden on low-income customers by increasing the number eligible for its budget billing plan.
Allegheny Power’s agreement to absorb rising fuel costs in Virginia has been difficult for the utility, which is on course to lose more than $100 million this year in the state on a revenue base of $187 million.
Public Service Company of New Mexico said in Q2 that, without a fuel adjustment clause, the company’s bond rating would slip into junk status. The New Mexico com-mission recently allowed the company to implement an emergency fuel and purchased power cost adjustment clause.
In an interesting twist on fuel cost recovery, Oklahoma Gas and Electric has proposed to recover only 50% of higher fuel prices during the summer months, when fuel is generally the most expensive, and to delay recovery of the remaining 50% until the cooler fall and winter months.■
EEI Q2 2008 Financial Update