Rare-EventAnalysis in FlowCytometry - Insermcytobase.montp.inserm.fr/ftp/Biblio/Donnenberg Rare...
27
Transcript of Rare-EventAnalysis in FlowCytometry - Insermcytobase.montp.inserm.fr/ftp/Biblio/Donnenberg Rare...
CLINICS IN
LABORATORY
ELSEVIER MEDICINESAUNDERS MBLJU-11NB
Clin Lab Med 27 (2007) 627-652
Rare-Event Analysis in Flow Cytometry
Albert D. Donnenberg, PhD*,
Vera S. Donnenberg, PhD
University of Pittsburgh School of Medicine, Hillman Cancer Research Center Suite2.42c,
5117 Center Avenue, Pittsburgh, PA 15213-2582, USA
Not everything that can be counted counts, and not everything that counts can
be counted.
Albert Einstein (1879-1955)
Rare-event analysis is the art of finding a needle in a haystack, confirming
that it really is a needle, and proceeding to make measurements to determine
precisely what kind of needle it is. The frequency of the event of interest, and
the signal-to-noise ratio of the method used to detect the event are the two
most important factors.
Investigators who use the term, "rare-event analysis," usually are refer
ring to detection of events that occur at a frequency of 1 in 1000 (0.1%)
or less, although the record claimed in the literature has long stood at 1
in 10,000,000 (0.00001%) for tumor cells spiked into peripheral blood [1].
Detecting an event at low frequency requires a high signal-to-noise ratio
and the acquisition of a large number of events. Technical aspects of rare-
event detection have been reviewed in several articles [2-6] and are discussed
here in a practical context, with two real-life examples.
A growing number of flow cytometry-based assays depend on rare-event
detection. These include assays developed for basic science and for clinical
applications. All of these assays were possible, but impractical, using con
ventional-speed flow analyzers (eg, Becton Dickinson FACSCalibur and
Beckman Coulter Elite XL), which have maximum acquisition speed of
1000 to 3000 events per second. The high-speed analysis afforded by the
most recent generation of cytometers and sorters makes the routine
This work was supported by grants BC044784 and BCO32981 from the Department of
Defense, a grant from the National Institutes of Health National Institute of Arthritis and
Musculoskelctal and Skin Diseases (NO1 AR9 2239), and the generous support of the
Hillman Foundation.
* Corresponding author.
E-mail address: [email protected] (A.D. Donnenberg).
0272-2712/07/S - see front matter © 2007 Published by Elscvier Inc.
doi: 10.1016/j.cll.2007.05.013 labmed.theclinics.com
628 DONNENBERG & DONNENBERG
acquisition of large data files practical for the first time, but in many cases
this has only moved the bottleneck from data acquisition to data analysis.
New software, taking advantage of parallel processing and the ability to ad
dress large blocks of random access memory directly, is on the horizon, re
moving the last obstacle to routine performance of rare-event assays.
A survey of rare-event applications
The major histocompatibility complex (MHC)/tetramer assay has been
developed to detect peptide-specific T cells [7]. Peptides are presented to T
cells in the context of PE or allophycocyanine (APC)-labeled self-MHC tet
ramers. Tetramers bind specifically to T cells having the appropriate recep
tor. MHC class I tetramers, which detect peptide-specific CD8+ T cells, have
been well characterized, whereas MHC class II tetramers, recognized by
CD4+ T cells, now are coming into use. Tetramer methodology is gaining
popularity for study of infectious diseases, response to vaccines, tumor im
munology, and basic immunology. Beckman Coulter Immunomics has com
mercialized tetramers for a variety of research applications. Tetramers that
are not available commercially can be custom manufactured by the National
Institutes of Health Tetramer Facility [8]. MHC allele protein production,
folding, and quality control are free to approved investigators. Requestors
incur the cost of peptide production and shipping. Reagents are quality con
trolled and are labeled by the facility with commercially manufactured strep-
tavidin-allophycocyanin or streptavidin-phycoerythrin (PE) fluorophores.
Typically, 50,000 to more than 1 million events are acquired per sample,
depending on the frequency of the cells specifically binding the antigenic epi-
tope of interest. Samples usually are human peripheral blood; cell availabil
ity and cytometer/analysis time usually limit the application.
Analysis of rare T-cell subsets
These include antigen-specific cytokine secreting cells [9], in vivo apopto-
tic T cells [10], and analysis of V beta repertoire on T cells [11]. The latter
has been commercialized by Beckman Coulter in a kit (IOTest Beta
Mark) allowing simultaneous detection of three distinct V beta specificities
using only two fluorescence parameters, fluorescein isothiocyanate [FITC]
and PE. V beta detection has many research and clinical applications, in
cluding assessment of T-cell clonality. A recent Medline search on V beta
and flow cytometry pulled up 204 citations.
Oncology
Detection of minimal residual disease and early relapse were among the
first applications of rare-event technology. Large numbers of human periph
eral blood leukocytes are assayed for one or more markers present on tumor
RARE-EVENT ANALYSIS IN FLOW CYTOMETRY 629
cells but absent in peripheral blood leukocytes. These include DNA ploidy
[12], differentiation markers [13], and cytokeratin-positive/CD45~ cells [14].
The same principle has been used in a Food and Drug Administration-li
censed test, which first immunomagnetically preseparates circulating cells
positive for an epithelial cell marker before detecting CD45" cytokeratin+
cells by automated fluorescence microscopy [15,16]. The advent of more
rapid and efficient rare-event analysis may allow such analyses to be per
formed in clinical laboratories by flow cytometry.
Cancer stem cells
The cancer stem cell paradigm has created quite a stir among cancer re
searchers, purporting as it does to identify the cancer-initiating cell [17]
and the source of therapy-resistant recurrent disease [18-20]. Cancer
stem cells are rare events within tumors, and candidate populations are
characterized by the expression of a particular adhesion marker profile
(CD44+ CD24~) [21]; the expression of CD 133 [22], a marker first de
scribed on hematopoietic progenitor cells; the expression of the stem cell
markers, CD90 and CD117 [19,20]; and multidrug resistance expression
[19] and activity [20,23]. A rare-event problem par excellence, detection
of cancer stem cells in disaggregated solid tumor samples, has to cope
with the presence of cell clusters, dead cell, debris, autofluorescent cells,
and the potential for tumors to harbor normal stem cells involved in
wound healing and endothelial stem cells engaged in the generation of
new blood vessels.
Hematopoietic stem cell research and transplantation
Applications in this rapidly growing field include quantification of side
population (SP) cells, very early pluripotential hematopoietic progenitor
cells present at extremely low frequency [24,25]; analysis of hematopoietic
progenitor cell differentiation and phosphorylation [26]; and chemokine ex
pression [27]. Quantification of hematopoietic progenitor cells in stem cell
autografts, allografts, and in the blood of patients who have undergone
stem cell mobilization is a routine clinical test, which has been commercial
ized by Beckman Coulter and Becton Dickinson. CD34+ cells themselves
are heterogeneous; quantification of the CD34+ CD38" subset promises
to provide a better clinical predictor of engraftment than measurement of
total CD34+ cells [28,29]. Because these subsets are rare, CD34 subsetting
has not been adopted on a routine basis. The detection of microchimerism
in the peripheral blood of solid organ transplant recipients also has potential
for clinical research and clinical monitoring applications [30].
It also has been recognized that the bone marrow harbors rare endothe
lial [31] and mesenchymal [32] stem cells, both recognizable by their distinc
tive patterns of marker expression. Similarly, circulating endothelial cells are
630 DONNENBERG & DONNENBERG
proposed as a biomarker of vessel injury [33]. It is likely that flow cytometry
also will prove increasingly useful for characterizing and isolating stem cells
from solid tissues.
Detection offetal cells in maternal blood
Prenatal diagnosis is facilitated by the detection of fetal cells in maternal
blood [34-36]. This also is of interest to transplantation immunologists, be
cause cells of fetal origin can be detected in the maternal circulation up to
27 years after pregnancy [37].
Detection of leukocytes in leukocyte-depleted platelet products
Platelet products routinely are leukocyte depleted to prevent spread of vi
ral diseases, such as cytomegalovirus, to patients who are thrombocytopenic
who also may be immunocompromised. Residual B cells can harbor latent
Epstein-Barr virus [38]. Quantification of leukocytes in these components
is critical to quality assessment [39], but the residual leukocyte count can
be as low as 10 cells/mL of product. In the authors' laboratory, using a con
ventional-speed analyzer, it takes several hours to quantify and phenotype
leukocytes in leukoreduced platelet components [40]. A commercially avail
able in vitro diagnostic assay (LeucoCOUNT, Becton Dickinson), which de
tects the binding of propidium iodide to the DNA of nucleated cells but does
not provide immunophenotypic information, can be performed in a few
minutes per sample. The lower limit of detection of this assay, however, is
in the range of 1000 cells/mL, according to the data provided on the package
insert. Because the signal-to-noise ratio (discussed later) of propidium io
dide-positive events is very high, the sensitivity of this assay could be in
creased tenfold simply by the application of high-speed cytometry.
Detection of cells injected or infusedfor biotherapy
Cellular therapy is an increasingly important research area with many op
portunities for clinical application. In experimental models, therapeutic cells
can be either transfected with the gene encoding a fluorescent protein
marker, such as enhanced green fluorescent protein (EGFP), or marked
with a tracking dye. Detection of these cells in the target tissue often is of
critical importance. The authors have been able to detect DiD-labeled den
dritic cells homing to the lymph nodes of rhesus macaques at a frequency of
1/38,000. The multiparameter analysis was performed at conventional
speeds and required 20 to 30 minutes acquisition per tube [41]. Tracking
dyes, such as carboxyfluorescein diacetate succinimidyl ester, not only allow
detection of infused cells but also permit a reconstruction of their history of
proliferation, because staining intensity decreases by half in each succeeding
generation [42].
RARE-EVENT ANALYSIS IN FLOW CYTOMETRY 631
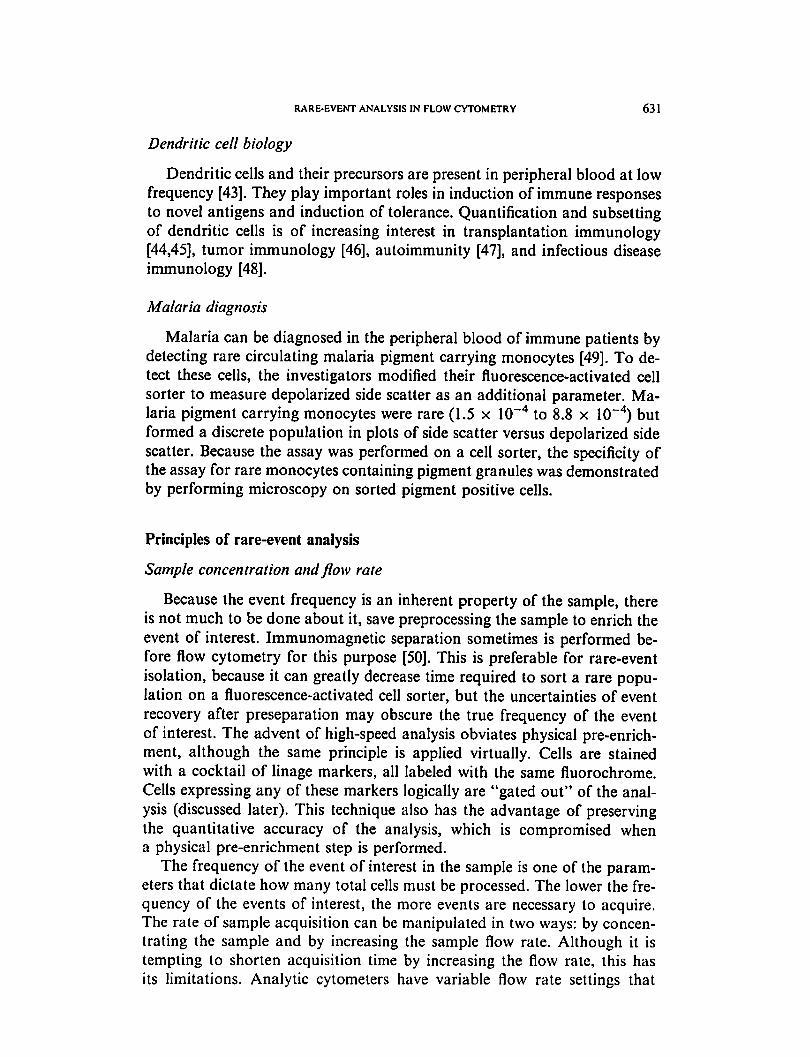
Dendritic cell biology
Dendritic cells and their precursors are present in peripheral blood at low
frequency [43]. They play important roles in induction of immune responses
to novel antigens and induction of tolerance. Quantification and subsetting
of dendritic cells is of increasing interest in transplantation immunology
[44,45], tumor immunology [46], autoimmunity [47], and infectious disease
immunology [48].
Malaria diagnosis
Malaria can be diagnosed in the peripheral blood of immune patients by
detecting rare circulating malaria pigment carrying monocytes [49]. To de
tect these cells, the investigators modified their fluorescence-activated cell
sorter to measure depolarized side scatter as an additional parameter. Ma
laria pigment carrying monocytes were rare (1.5 x 10~4 to 8.8 x 10~~4) but
formed a discrete population in plots of side scatter versus depolarized side
scatter. Because the assay was performed on a cell sorter, the specificity of
the assay for rare monocytes containing pigment granules was demonstrated
by performing microscopy on sorted pigment positive cells.
Principles of rare-event analysis
Sample concentration andflow rate
Because the event frequency is an inherent property of the sample, there
is not much to be done about it, save preprocessing the sample to enrich the
event of interest. Immunomagnetic separation sometimes is performed be
fore flow cytometry for this purpose [50]. This is preferable for rare-event
isolation, because it can greatly decrease time required to sort a rare popu
lation on a fluorescence-activated cell sorter, but the uncertainties of event
recovery after preseparation may obscure the true frequency of the event
of interest. The advent of high-speed analysis obviates physical pre-enrich-
ment, although the same principle is applied virtually. Cells are stained
with a cocktail of linage markers, all labeled with the same fluorochrome.
Cells expressing any of these markers logically are "gated out" of the anal
ysis (discussed later). This technique also has the advantage of preserving
the quantitative accuracy of the analysis, which is compromised when
a physical pre-enrichment step is performed.
The frequency of the event of interest in the sample is one of the param
eters that dictate how many total cells must be processed. The lower the fre
quency of the events of interest, the more events are necessary to acquire.
The rate of sample acquisition can be manipulated in two ways: by concen
trating the sample and by increasing the sample flow rate. Although it is
tempting to shorten acquisition time by increasing the flow rate, this has
its limitations. Analytic cytometers have variable flow rate settings that
632 DONNENBERG & DONNENBERG
correspond to the rate (microliters per minute) at which sample is drawn
into the cytometer. An increase in the flow rate is accomplished by increas
ing the sample pressure relative to the sheath pressure. This results in a wider
sample stream within the sheath fluid stream, increasing the opportunity for
two cells to pass through the detection system at the same time (coinci
dence). It also increases the coefficient of variation of all of the measured pa
rameters. Within the limits of the specifications of the cytometer used, it is
better to maximize the event rate by optimizing the sample concentration.
For example, if a cytometer draws sample at 1 microliter per second, the
sample concentration (cells/mL) divided by 1000 is approximately equally
to the sample acquisition rate in cells per second. In this example, concen
trating the sample to 30 x 106 cells/mL yields a sample acquisition rate of
30,000 per second. Even high-speed cytometers, such as the Dako MoFlo
and CyAn or Becton Dickinson FACSAria and LSRII, behave like conven
tional-speed instruments if the sample concentration is too low. Conversely,
there is no advantage to concentrating the sample beyond the capacity of the
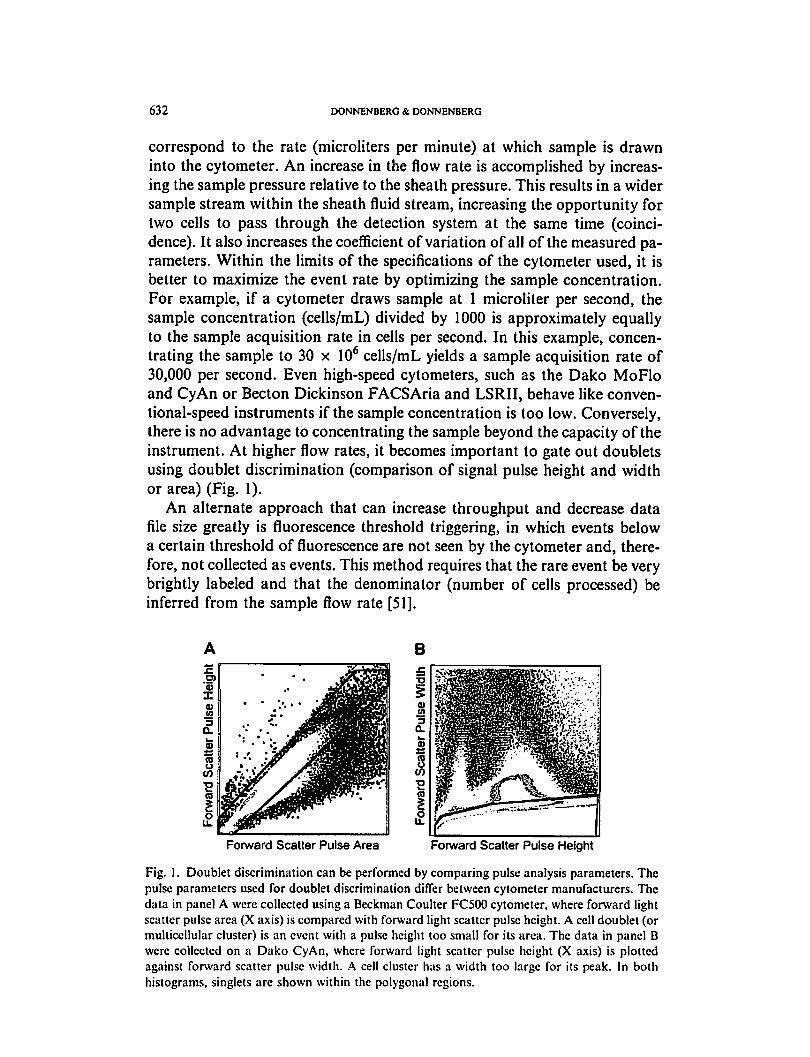
instrument. At higher flow rates, it becomes important to gate out doublets
using doublet discrimination (comparison of signal pulse height and width
or area) (Fig. 1).
An alternate approach that can increase throughput and decrease data
file size greatly is fluorescence threshold triggering, in which events below
a certain threshold of fluorescence are not seen by the cytometer and, there
fore, not collected as events. This method requires that the rare event be very
brightly labeled and that the denominator (number of cells processed) be
inferred from the sample flow rate [51].
Forward Scatter Pulse Area Forward Scatter Pulse Height
Fig. 1. Doublet discrimination can be performed by comparing pulse analysis parameters. The
pulse parameters used for doublet discrimination differ between cytometer manufacturers. The
data in panel A were collected using a Beckman Coulter FC500 cytometer, where forward light
scatter pulse area (X axis) is compared with forward light scatter pulse height. A cell doublet (or
multicellular cluster) is an event with a pulse height too small for its area. The data in panel B
were collected on a Dako CyAn, where forward light scatter pulse height (X axis) is plotted
against forward scatter pulse width. A cell cluster has a width too large for its peak. In both
histograms, singlets arc shown within the polygonal regions.
RARE-EVENT ANALYSIS IN FLOW CYTOMETRY 633
Signal-to-noise ratio
The signal-to-noise ratio sets an absolute limit on the lowest frequency
of events that can be detected before they are overwhelmed by back
ground. The critical task of enhancing the signal-to-noise ratio may be ap
proached from the standpoint of minimizing noise and maximizing signal.
Noise is defined as anything that creates spurious signals that can be con
fused with the signals (fluorescence or light scatter) used to define the
event of interest. Noise can result from nonspecific binding of a fluorescent
probe, the presence of autofluorescent biomolecules, the presence of coin
cident events or cell clusters, or sporadic mechanical or electrical perturba
tions (including sample carryover). Dead or dying cells are particularly
bad actors. The techniques to minimize these factors and to maximize sig
nal are discussed later.
Two important factors bear on the signal-to-noise ratio: the difference in
fluorescence intensity between negative and positive populations and the
dispersion of these two populations (usually expressed as their coefficients
of variation). Some membrane dyes give very bright homogeneous signals
and, therefore, place cells far from noise. When using combinations of fluo-
rochrome-conjugated antibodies, the authors often reserve PE for the most
critical measurement, because the excitation and emissions spectra are
widely separated and the extinction coefficient and quantum yield are high
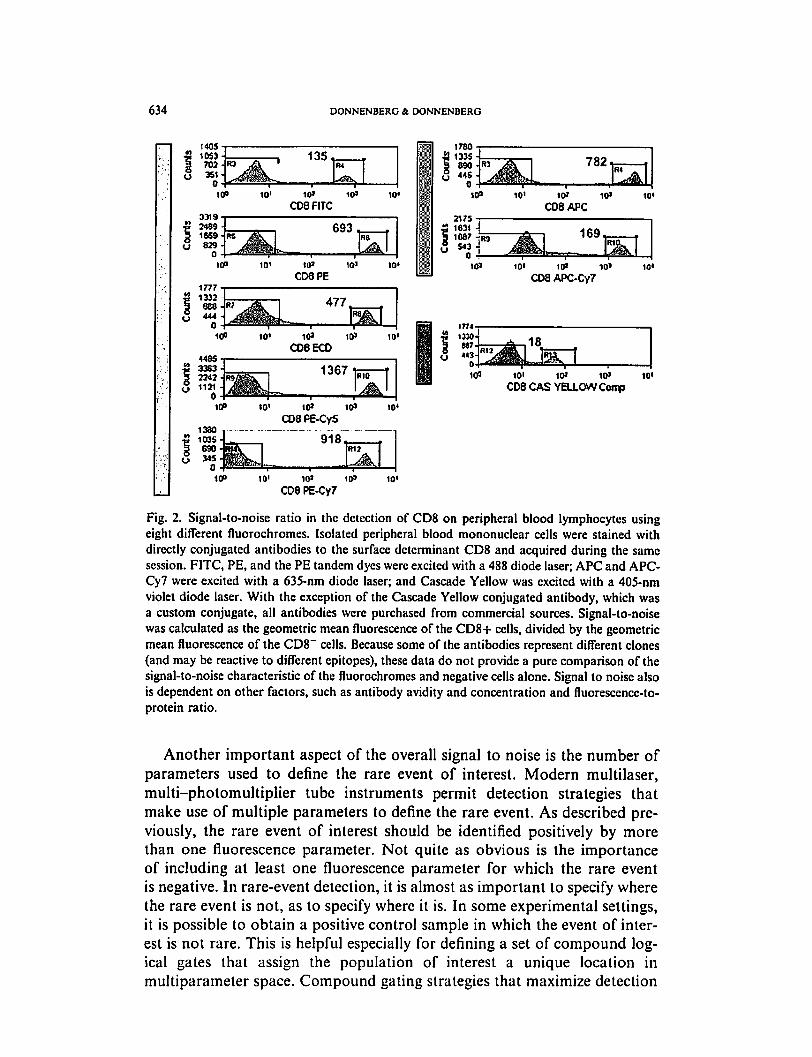
compared with other commonly available fluorochromes [52]. Fig. 2 illus
trates the detection of CD8 on peripheral blood lymphocytes using eight dif
ferent fluorochromes where signal-to-noise ratios ranged from 18 (Cascade
Yellow excited by a 405-nm violet laser) to 1367 (PE-Cy5 excited by a 488-
nm blue laser). In Fig. 2, signal to noise was calculated as a simple ratio of
geometric mean fluorescence intensity in the CD8+ population divided by
that of the negative population. An alternative means of looking at signal
versus noise is the mean channel separation, which is calculated by taking
the difference of fluorescence intensities divided by a pooled SD of both
populations. This latter method has the advantage of taking into account
the spread of the negative and positive populations.
Tagging cells with antibodies conjugated to brightly labeled fluorescent
immunobeads also can result in a significant increase in signal-to-noise ratio
compared with immunofluorescent staining. This method has been used to
detect fetal red blood cells in the maternal circulation at a frequency of 1
per 100,000 [53].
When autofluorescent myeloid cells, cellular debris, or red blood cells in
terfere with rare-event detection, it often is possible to move them out of the
way by targeting them with a specific antibody. For example, Owens and
Loken used CD 14 to move monocytes and granulocytes away from
CD344" progenitor cells [54]. The authors have used a similar strategy to per
form functional assays on dendritic cells that comprise a small proportion of
bronchoalveolar lavage cells [6].
634 DONNENBERG & DONNENBERG
135,
10'
CO8FITC
693,R8
C08PE
1780
1335
8S0
44S
0
2175
782
10' 10' 10'
CD8APC
10'
5 1631 4S 1087 -■
543 -
10" IO» 10»
C08 APC-Cy7
477
10'
448$
3363-12242-
112) -
0
10» IIP
CD8EC0
10'
1367 1
IT74
CD8 CAS YELLOW Contp
1330
•8 103$-3 690
100 10' 10* 10>
CO8 PE-Cy5
918,
10*
R12
10° 10' 1O> 1O» 10«
CO8 PE-Cy7
Fig. 2. Signal-to-noise ratio in the detection of CD8 on peripheral blood lymphocytes using
eight different fluorochromes. Isolated peripheral blood mononuclear cells were stained with
directly conjugated antibodies to the surface determinant CD8 and acquired during the same
session. FITC, PE, and the PE tandem dyes were excited with a 488 diode laser; APC and APC-
Cy7 were excited with a 635-nm diode laser; and Cascade Yellow was excited with a 405-nm
violet diode laser. With the exception of the Cascade Yellow conjugated antibody, which was
a custom conjugate, all antibodies were purchased from commercial sources. Signal-to-noise
was calculated as the geometric mean fluorescence of the CD8+ cells, divided by the geometric
mean fluorescence of the CD8~ cells. Because some of the antibodies represent different clones
(and may be reactive to different epitopes), these data do not provide a pure comparison of the
signal-to-noise characteristic of the fluorochromes and negative cells alone. Signal to noise also
is dependent on other factors, such as antibody avidity and concentration and fluorescence-to-
protein ratio.
Another important aspect of the overall signal to noise is the number of
parameters used to define the rare event of interest. Modern multilaser,
multi-photomultiplier tube instruments permit detection strategies that
make use of multiple parameters to define the rare event. As described pre
viously, the rare event of interest should be identified positively by more
than one fluorescence parameter. Not quite as obvious is the importance
of including at least one fluorescence parameter for which the rare event
is negative. In rare-event detection, it is almost as important to specify where
the rare event is not, as to specify where it is. In some experimental settings,
it is possible to obtain a positive control sample in which the event of inter
est is not rare. This is helpful especially for defining a set of compound log
ical gates that assign the population of interest a unique location in
multiparameter space. Compound gating strategies that maximize detection
RARE-EVENT ANALYSIS IN FLOW CYTOMETRY 635
of events in the positive control while minimizing false-positive events in the
negative control can be determined empirically and applied to the experi
mental data. Such analyses are performed after the fact, on listmode data
files. Using these principles, Gross and colleagues [1] were able to detect
a breast carcinoma cell line spiked into peripheral blood at a frequency of
1 cell per 10,000,000. This rivals the sensitivity of the polymerase chain re
action assay and seems to be the current world record for rare-event detec
tion by flow cytometry.
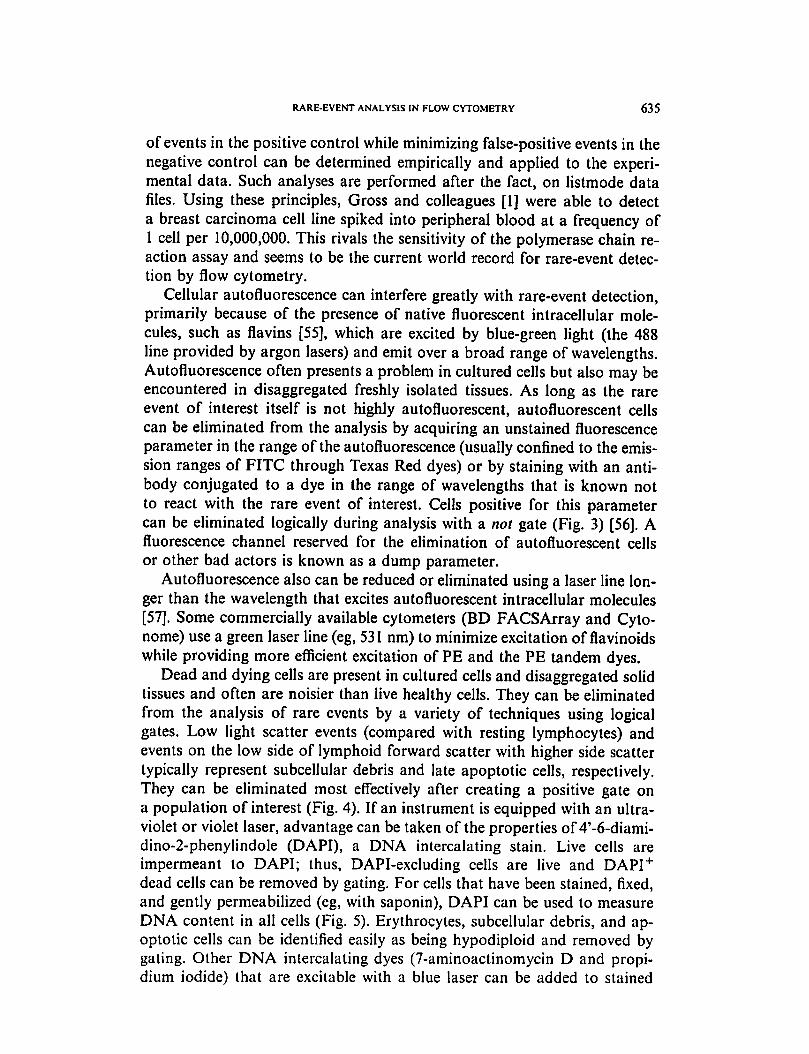
Cellular autofluorescence can interfere greatly with rare-event detection,
primarily because of the presence of native fluorescent intracellular mole
cules, such as flavins [55], which are excited by blue-green light (the 488
line provided by argon lasers) and emit over a broad range of wavelengths.
Autofluorescence often presents a problem in cultured cells but also may be
encountered in disaggregated freshly isolated tissues. As long as the rare
event of interest itself is not highly autofluorescent, autofluorescent cells
can be eliminated from the analysis by acquiring an unstained fluorescence
parameter in the range of the autofluorescence (usually confined to the emis
sion ranges of FITC through Texas Red dyes) or by staining with an anti
body conjugated to a dye in the range of wavelengths that is known not
to react with the rare event of interest. Cells positive for this parameter
can be eliminated logically during analysis with a not gate (Fig. 3) [56]. A
fluorescence channel reserved for the elimination of autofluorescent cells
or other bad actors is known as a dump parameter.
Autofluorescence also can be reduced or eliminated using a laser line lon
ger than the wavelength that excites autofluorescent intracellular molecules
[57]. Some commercially available cytometers (BD FACSArray and Cyto-
nome) use a green laser line (eg, 531 nm) to minimize excitation of flavinoids
while providing more efficient excitation of PE and the PE tandem dyes.
Dead and dying cells are present in cultured cells and disaggregated solid
tissues and often are noisier than live healthy cells. They can be eliminated
from the analysis of rare events by a variety of techniques using logical
gates. Low light scatter events (compared with resting lymphocytes) and
events on the low side of lymphoid forward scatter with higher side scatter
typically represent subcellular debris and late apoptotic cells, respectively.
They can be eliminated most effectively after creating a positive gate on
a population of interest (Fig. 4). If an instrument is equipped with an ultra
violet or violet laser, advantage can be taken of the properties of 4'-6-diami-
dino-2-phenylindole (DAPI), a DNA intercalating stain. Live cells are
impermeant to DAPI; thus, DAPI-excluding cells are live and DAPI+
dead cells can be removed by gating. For cells that have been stained, fixed,
and gently permeabilized (eg, with saponin), DAPI can be used to measure
DNA content in all cells (Fig. 5). Erythrocytes, subcellular debris, and ap
optotic cells can be identified easily as being hypodiploid and removed by
gating. Other DNA intercalating dyes (7-aminoactinomycin D and propi-
dium iodide) that are excitable with a blue laser can be added to stained
636 DONNENBERG& DONNENBERG
NOT CD14 NOT dead cells AND CD3
CD14Gate(A) Extended Lymph Gate (B) CD3*Gate(C) (B and C) and not A
1000
000Ui, a.1 an ui' Si 3 U-;1 ,;„■ ■■.-: *m'>n mm--
FL3CD3ECO FL4CD8PC5
1000
Dump gate
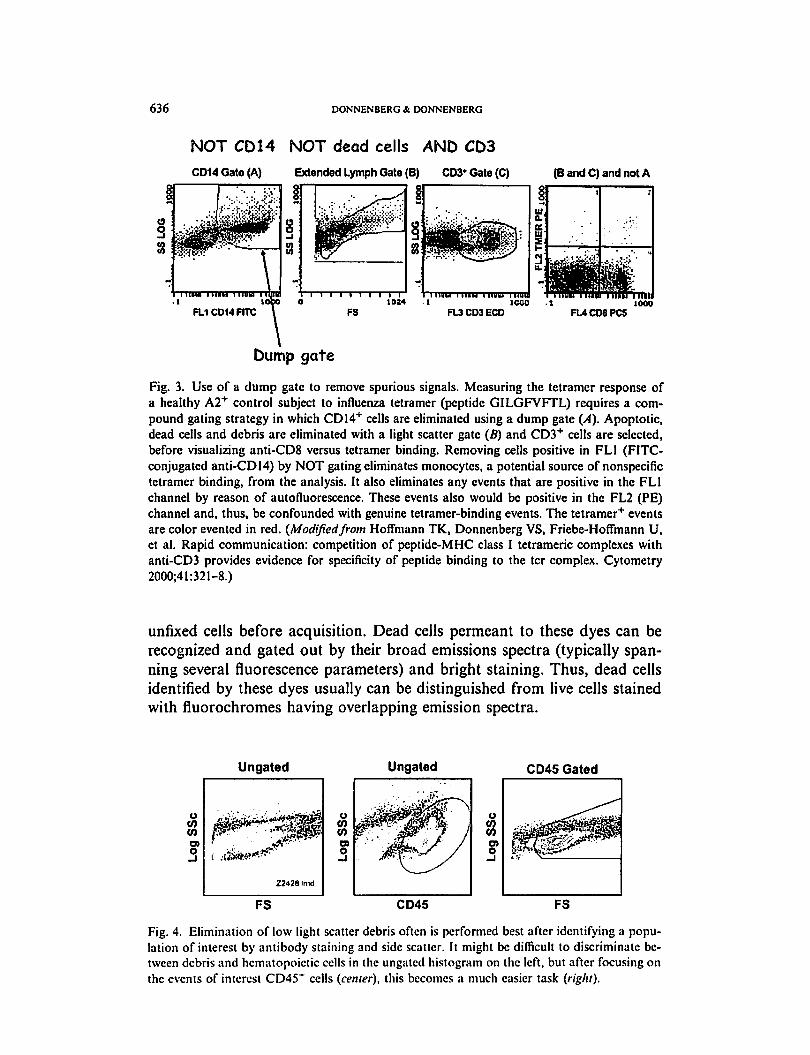
Fig. 3. Use of a dump gate to remove spurious signals. Measuring the tetramer response of
a healthy A2+ control subject to influenza tetramer (peptide GILGFVFTL) requires a com
pound gating strategy in which CD14+ cells are eliminated using a dump gate (A). Apoptotic,
dead cells and debris are eliminated with a light scatter gate (5) and CD3+ cells are selected,
before visualizing anti-CD8 versus tetramer binding. Removing cells positive in FL1 (FITC-
conjugated anti-CD 14) by NOT gating eliminates monocytes, a potential source of nonspecific
tetramer binding, from the analysis. It also eliminates any events that are positive in the FL1
channel by reason of autofluorescence. These events also would be positive in the FL2 (PE)
channel and, thus, be confounded with genuine tetramcr-binding events. The tetramer+ events
are color evented in red. (Modifiedfrom Hoffmann TK, Donnenberg VS, Friebe-HofTmann U,
et al. Rapid communication: competition of peptide-MHC class I tetrameric complexes with
anti-CD3 provides evidence for specificity of peptide binding to the tcr complex. Cytometry
2000;41:321-8.)
unfixed cells before acquisition. Dead cells permeant to these dyes can be
recognized and gated out by their broad emissions spectra (typically span
ning several fluorescence parameters) and bright staining. Thus, dead cells
identified by these dyes usually can be distinguished from live cells stained
with fluorochromes having overlapping emission spectra.
Ungated Ungated CD45 Gated
u
coco
o>o_l 1 .Cfcafc,.
22438 inn)
O
CflCO
n
0
FS CD45
Fig. 4. Elimination of low light scatter debris often is performed best after identifying a popu
lation of interest by antibody staining and side scatter. It might be difficult to discriminate be
tween debris and hematopoietic cells in the ungated histogram on the left, but after focusing on
the events of interest CD45+ cells (center), this becomes a much easier task (right).
RARE-EVENT ANALYSIS IN FLOW CYTOMETRY 637
Gated on Singlets
£ '■
FSc Pulse Height FSc Pulse Height
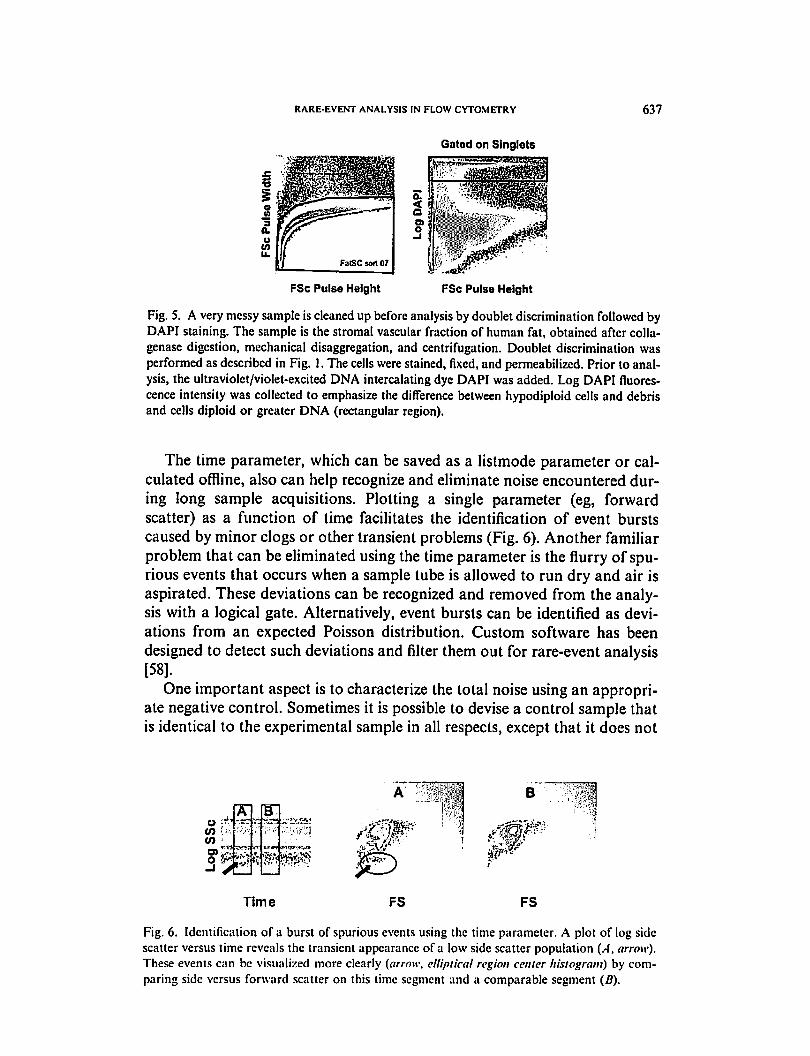
Fig. 5. A very messy sample is cleaned up before analysis by doublet discrimination followed by
DAPI staining. The sample is the stromal vascular fraction of human fat, obtained after colla-
genase digestion, mechanical disaggregation, and centrifugation. Doublet discrimination was
performed as described in Fig. I. The cells were stained, fixed, and permeabilized. Prior to anal
ysis, the ultraviolet/violet-excited DNA intercalating dye DAPI was added. Log DAPI fluores
cence intensity was collected to emphasize the difference between hypodiploid cells and debris
and cells diploid or greater DNA (rectangular region).
The time parameter, which can be saved as a listmode parameter or cal
culated offline, also can help recognize and eliminate noise encountered dur
ing long sample acquisitions. Plotting a single parameter (eg, forward
scatter) as a function of time facilitates the identification of event bursts
caused by minor clogs or other transient problems (Fig. 6). Another familiar
problem that can be eliminated using the time parameter is the flurry of spu
rious events that occurs when a sample tube is allowed to run dry and air is
aspirated. These deviations can be recognized and removed from the analy
sis with a logical gate. Alternatively, event bursts can be identified as devi
ations from an expected Poisson distribution. Custom software has been
designed to detect such deviations and filter them out for rare-event analysis
[58].
One important aspect is to characterize the total noise using an appropri
ate negative control. Sometimes it is possible to devise a control sample that
is identical to the experimental sample in all respects, except that it does not
TO:■■ ^ /
B
■
Time FS FS
Fig. 6. Identification of a burst of spurious events using the time parameter. A plot of log side
scatter versus time reveals the transient appearance of a low side scatter population [A. arrow).
These events can be visualized more clearly (arrow, elliptical region center histogram) by com
paring side versus forward scatter on this time segment and a comparable segment (B).
638 DONNENBERG & DONNENBERG
contain the rare event of interest (eg, peripheral blood from a non-MHC A2
individual in an MHC A2 tetramer-binding assay or blood from a cancer-
free normal subject in a circulating cancer cell assay). In other cases, it
may be necessary to resort to control reagents, such as isotype-matched fluo-
rochrome-conjugated antibodies. In the latter case, a few caveats apply: the
control reagent must be similar to the experimental reagent with respect to
the ratio of fluorescent dye to protein (for commercial reagents, this is sel
dom on the package insert but sometimes this can be determined by a call
to the vendor), and it must be used at the same concentration. Additionally,
staining must be designed so that the same gating strategy used to detect the
rare event can be applied to the negative control sample. Roederer [59] has
called this the fluorescence minus one approach. As an example, consider
detection of CD34+ cells (hematopoietic progenitor cells) in peripheral
blood using the two-color combination and anti-CD45 FITC and anti-
CD34 PE. CD34+ progenitor cells have characteristic light scatter and
CD45 expression but relatively dim CD34 expression. Thus, when CD34+
cells are present at low frequency, they can be difficult to detect. The analytic
strategy used to pull them away from noise is to first create a gate based on
side scatter and CD45 expression [60]. This gate contains the CD34+ cells
(still a rare population among mostly lymphoid cells) but excludes myeloid
cells that interfere with CD34 detection because of autofluorescence and
nonspecific antibody binding. If two irrelevant isotype-matched conjugated
antibodies (eg, IgGj-FITC plus IgG,-PE) were used as a negative control, it
would be impossible to duplicate the gating strategy used to identify the
population in which CD34+ progenitor cells were identified (ie, cells with in
termediate CD45 expression and low side scatter). Thus, the appropriate
negative control is anti-CD45 FITC plus IgGrPE or plus anti-CD34 PE ad
mixed with a great excess of unlabeled anti-CD34. Beckman Coulter has
used the latter strategy in their commercial CD34 enumeration kit. Using
either of these controls, the amount of total noise in the system, hence the
limits of sensitivity of the assay, can be determined by looking at the fre
quency of spuriously positive events (IgGrPE positive) within the same
CD45-scatter gate used to identify the CD34+ cells. In this context, an iden
tical number of events must be acquired for the negative control sample as
for the experimental sample. Resist the temptation to acquire fewer events
because there is nothing there. If the frequency of spuriously positive events
is 0.02% (1 in 5000), it is impossible to use this assay to detect CD34+ cells
present at a frequency of 1 in 10,000, no matter how many events are ac
quired! Thus, the frequency of false-positive events (noise) determines the
lower limit of detection. It follows that there is a point of diminishing return
beyond which acquiring a greater number of events increases the precision
of the rare event frequency estimate but does not increase the sensitivity
of the assay.
After determining the lower limit of detection, the optimal number of
cells to be acquired routinely can be determined empirically for a given
RARE-EVENT ANALYSIS IN FLOW CYTOMETRY 639
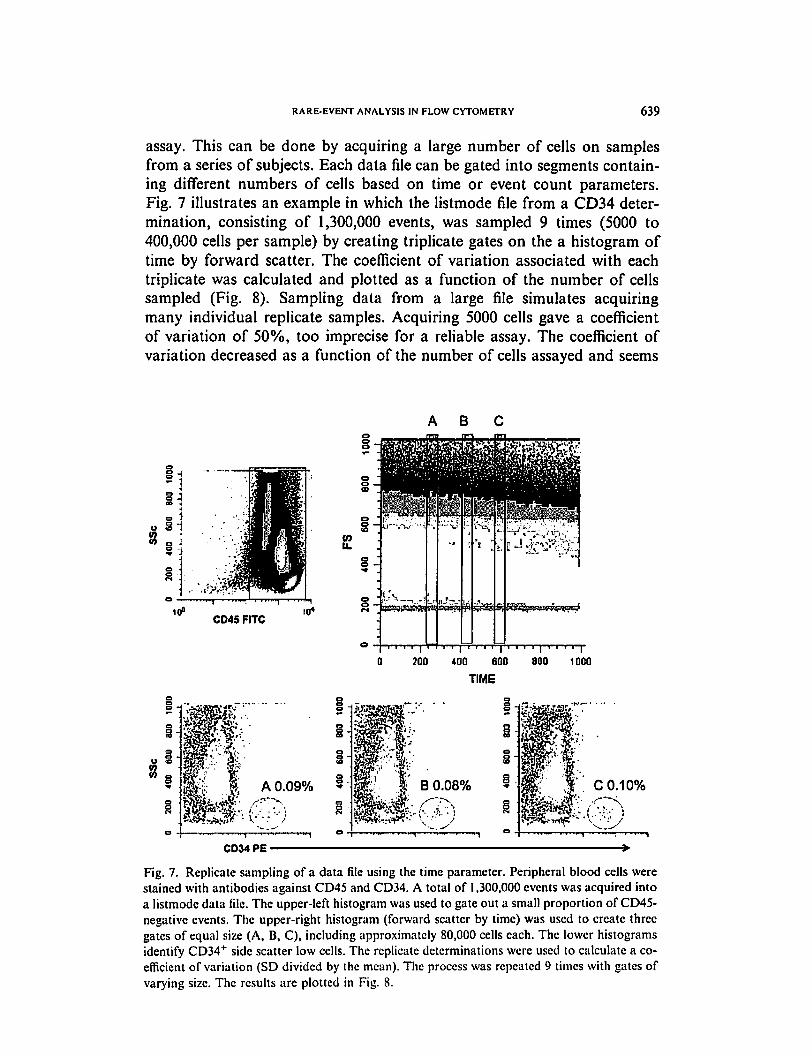
assay. This can be done by acquiring a large number of cells on samples
from a series of subjects. Each data file can be gated into segments contain
ing different numbers of cells based on time or event count parameters.
Fig. 7 illustrates an example in which the listmode file from a CD34 deter
mination, consisting of 1,300,000 events, was sampled 9 times (5000 to
400,000 cells per sample) by creating triplicate gates on the a histogram of
time by forward scatter. The coefficient of variation associated with each
triplicate was calculated and plotted as a function of the number of cells
sampled (Fig. 8). Sampling data from a large file simulates acquiring
many individual replicate samples. Acquiring 5000 cells gave a coefficient
of variation of 50%, too imprecise for a reliable assay. The coefficient of
variation decreased as a function of the number of cells assayed and seems
ABC
CD45 FITC
200 400 600 800 1000
TIME
3A 0.09%
§
B 0.08% C 0.10%
CD34 PE ■
Fig. 7. Replicate sampling of a data file using the time parameter. Peripheral blood cells were
stained with antibodies against CD45 and CD34. A total of 1,300,000 events was acquired into
a listmode data file. The upper-left histogram was used to gate out a small proportion of CD45-
negative events. The upper-right histogram (forward scatter by time) was used to create three
gates of equal size (A, B, C), including approximately 80,000 cells each. The lower histograms
identify CD34+ side scatter low cells. The replicate determinations were used to calculate a co
efficient of variation (SD divided by the mean). The process was repeated 9 times with gates of
varying size. The results are plotted in Fig. 8.
640 DONNENBERG & DONNENBERG
60
50
40
30
20 -
10 -
1000
•
: V
IIII10000 100000
Number of Cells Analyzed
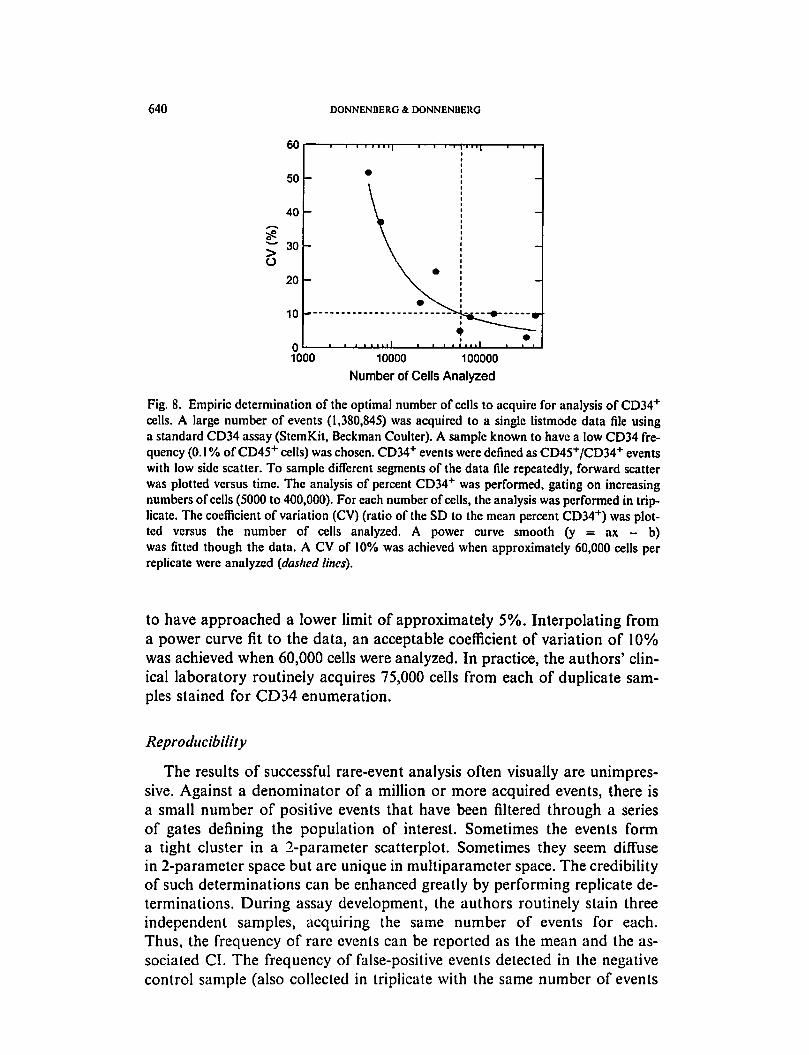
Fig. 8. Empiric determination of the optimal number of cells to acquire for analysis of CD34+
cells. A large number of events (1,380,845) was acquired to a single listmode data file using
a standard CD34 assay (StemK.it, Beckman Coulter). A sample known to have a low CD34 fre
quency (0.1 % of CD45+ cells) was chosen. CD34+ events were defined as CD45+/CD34+ events
with low side scatter. To sample different segments of the data file repeatedly, forward scatter
was plotted versus time. The analysis of percent CD34"1" was performed, gating on increasing
numbers of cells (5000 to 400,000). For each number of cells, the analysis was performed in trip
licate. The coefficient of variation (CV) (ratio of the SD to the mean percent CD34+) was plot
ted versus the number of cells analyzed. A power curve smooth (y = ax - b)
was fitted though the data. A CV of 10% was achieved when approximately 60,000 cells per
replicate were analyzed {dashed lines).
to have approached a lower limit of approximately 5%. Interpolating from
a power curve fit to the data, an acceptable coefficient of variation of 10%
was achieved when 60,000 cells were analyzed. In practice, the authors' clin
ical laboratory routinely acquires 75,000 cells from each of duplicate sam
ples stained for CD34 enumeration.
Reproducibility
The results of successful rare-event analysis often visually are unimpres
sive. Against a denominator of a million or more acquired events, there is
a small number of positive events that have been filtered through a series
of gates defining the population of interest. Sometimes the events form
a tight cluster in a 2-parameter scatterplot. Sometimes they seem diffuse
in 2-parameter space but are unique in multiparameter space. The credibility
of such determinations can be enhanced greatly by performing replicate de
terminations. During assay development, the authors routinely stain three
independent samples, acquiring the same number of events for each.
Thus, the frequency of rare events can be reported as the mean and the as
sociated CI. The frequency of false-positive events detected in the negative
control sample (also collected in triplicate with the same number of events
RARE-EVENT ANALYSIS IN FLOW CYTOMETRY 641
as the experimental sample) also is reported, and a lower limit of detection
calculated as the upper 99th percentile of negative control is interpreted as
the lower limit of detection [56]. If replicate samples cannot be acquired,
a gating method similar to that used for Fig. 7 can be used to divide the
file into three equal time segments. These segments then are analyzed sepa
rately, and the mean and SD determined. This method accounts for any in-
homogeneity in the data file resulting from sampling or instrument
performance, but unlike running three independent samples, it does not ac
count for variability resulting from sample preparation.
Specialized analytic software
The emergence of rare-event detection as an increasingly important appli
cation of flow cytometry has left somewhat of a software gap. Throughout
this article, examples are presented in which data files consisting of 5 to 14
parameters measured on as many as 10 million events have been analyzed.
Until recently, this could have been a painful procedure, owing to the fact
that neither the native software supplied with cytometers nor aftermarket
offline analysis products have been designed to analyze large data files. To
cite a particularly egregious example, the authors transported their fastest
workstation, dual monitors, and an external hard drive to a cottage in the
Allegheny Mountains to complete the analysis of a languishing dataset dur
ing a family vacation. The dataset consisted of approximately 50 eight-color
data files of 250,000 to 2.5 million events each, identifying stem cell marker-
positive cells among rare solid tumor cells expressing the multiple drug re
sistance transporter, ABCG2 [19]. The authors honored their resolution to
rise early and work without interruption until noon every day during the
10-day holiday. Braving inexplicable software crashes sending them back
to square one, excruciating refresh intervals each time a region or a gate
was adjusted, and all manner of additional indignities, the analysis was
barely completed in the allotted time.
This story was related to Microsoft, which wished to publicize the devel
opment internally, by Applied Cytometry Systems of Sheffield, United
Kingdom, of a new generation of flow cytometry software that makes effi
cient use of scalable parallel processing and Microsoft's new 64-bit XP
and Vista operating systems. The authors have the new software, dubbed
Venturi, now nearing commercial release, running eight simultaneous hyper-
threads on a dual-core, dual-processor 64-bit workstation. In addition to
a conventional data analysis space in which histograms, logical gates, and
analytic regions are created, the software provides a preview matrix of all
possible one- and two-parameter histograms. This preview can be focused
on populations defined by any gale created within the analysis space. A dou
ble click on any graph on the preview page copies it to the analysis space,
where regions and other analysis tools can be applied. This provides an un
precedented opportunity for data exploration. Because of the extensive use
642 DONNENBERG & DONNENBERG
of directly addressable random access memory and the efficient division of
data calculations and display into parallel processes, complex analyses of
large data files can be performed with unprecedented speed and less mental
anguish. It is likely that Venturi will set a new standard for the analysis of
large data files. By way of disclosure, the authors have a collaborative rela
tionship with Applied Cytometry Systems but serve as unpaid consultants
without financial interest in the company.
Statistical analysis of rare-event datasets
Data analysis almost always involves the comparison of groups of data.
The most common and powerful tests of statistical confirmatory analysis,
such as the Student / test and linear regression analysis, assume that the
data are distributed normally. Normally distributed data are symmetric
and bell shaped. The mean gives the center of the distribution and the SD de
scribes the spread. When a test, such as the Student t test, is used to compare
data from two groups, only three parameters are used in the test: the mean
values of the two groups and a pooled estimate of the SD. If these parameters
describe the dataset well, tests assuming normality are appropriate. The Stu
dent / test is what is known as a robust test. This means that the data need not
fit the normal distribution perfectly in order for the test to be valid. This said,
most rare-event data are log-normally distributed and require transforma
tion before statistical analysis. Applying the Student / test to raw rare-event
data almost always results in overestimation of the mean values (because of
the skewness of the distribution) and overestimation of the SD, resulting in
a loss of statistical power. Several tools exist to check a dataset for normality;
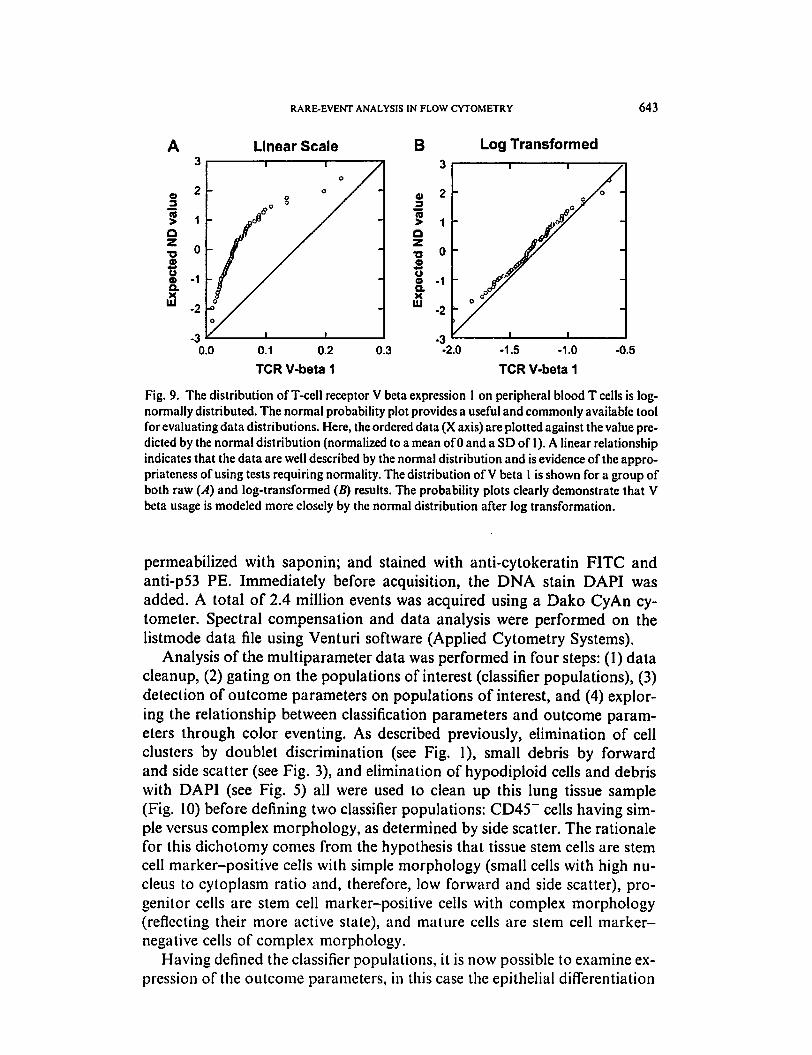
the most common is the normal probability plot (Fig. 9). Raw and log-trans
formed data can be plotted. The plot showing the most linear relationship
between observed results and results predicted by the normal model help
choosing between analyzing raw or transformed data.
Rare-event detection: two examples
Detection of cells expressing stem cell markers in normal human lung
tissue
Performing rare-event flow cytometry on cells from solid organs presents
several challenges. Tissue fragments must be digested and disaggregated me
chanically before staining. Even the most meticulous preparation leaves cell
clusters, dead cells, and cellular debris, all of which can interfere with anal
ysis. In this example, human lung tissue was minced using a Becton Dickin
son Medimachine, filtered though a 70-jj. cell strainer, digested with
collagenase, and separated on a Ficoll-Hypaque gradient. The resulting
single cell suspension was stained with the following antibodies: CD90-
ECD, ABCG2-PC5, CD117-PC7, CD133 APC, and CD45-APCC7; fixed;
RARE-EVENT ANALYSIS IN FLOW CYTOMETRY 643
Linear Scale B Log Transformed
0.1 0.2
TCR V-beta 1
0.3 -1.5 -1.0
TCR V-beta 1
-0.5
Fig. 9. The distribution of T-cell receptor V beta expression 1 on peripheral blood T cells is log-
normally distributed. The normal probability plot provides a useful and commonly available tool
for evaluating data distributions. Here, the ordered data (X axis) are plotted against the value pre
dicted by the normal distribution (normalized to a mean of0 and a SD of 1). A linear relationship
indicates that the data are well described by the normal distribution and is evidence of the appro
priateness of using tests requiring normality. The distribution ofV beta I is shown for a group of
both raw (A) and log-transformed (B) results. The probability plots clearly demonstrate that V
beta usage is modeled more closely by the normal distribution after log transformation.
permeabilized with saponin; and stained with anti-cytokeratin FITC and
anti-p53 PE. Immediately before acquisition, the DNA stain DAPI was
added. A total of 2.4 million events was acquired using a Dako CyAn cy-
tometer. Spectral compensation and data analysis were performed on the
listmode data file using Venturi software (Applied Cytometry Systems).
Analysis of the multiparameter data was performed in four steps: (1) data
cleanup, (2) gating on the populations of interest (classifier populations), (3)
detection of outcome parameters on populations of interest, and (4) explor
ing the relationship between classification parameters and outcome param
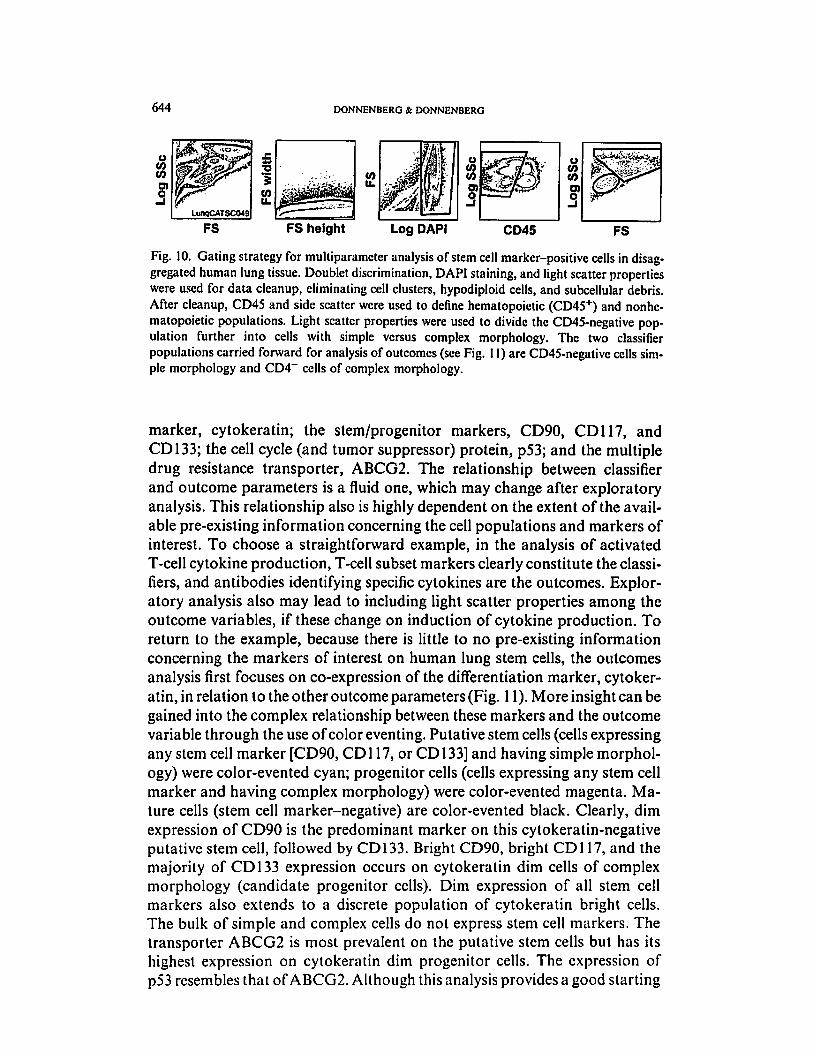
eters through color eventing. As described previously, elimination of cell
clusters by doublet discrimination (see Fig. 1), small debris by forward
and side scatter (see Fig. 3), and elimination of hypodiploid cells and debris
with DAPI (see Fig. 5) all were used to clean up this lung tissue sample
(Fig. 10) before defining two classifier populations: CD45~ cells having sim
ple versus complex morphology, as determined by side scatter. The rationale
for this dichotomy comes from the hypothesis that tissue stem cells are stem
cell marker-positive cells with simple morphology (small cells with high nu
cleus to cytoplasm ratio and, therefore, low forward and side scatter), pro
genitor cells are stem cell marker-positive cells with complex morphology
(reflecting their more active state), and mature cells are stem cell marker-
negative cells of complex morphology.
Having defined the classifier populations, it is now possible to examine ex
pression of the outcome parameters, in this case the epithelial differentiation
644 DONNENBERG & DONNENBERG
FS height Log DAPI CD45
Fig. 10. Gating strategy for multiparameter analysis of stem cell marker-positive cells in disag
gregated human lung tissue. Doublet discrimination, DAPI staining, and light scatter properties
were used for data cleanup, eliminating cell clusters, hypodiploid cells, and subcellular debris.
After cleanup, CD45 and side scatter were used to define hematopoietic (CD45+) and nonhe-
matopoietic populations. Light scatter properties were used to divide the CD45-negative pop
ulation further into cells with simple versus complex morphology. The two classifier
populations carried forward for analysis of outcomes (see Fig. 11) are CD45-negative cells sim
ple morphology and CD4" cells of complex morphology.
marker, cytokeratin; the stem/progenitor markers, CD90, CD117, and
CD 133; the cell cycle (and tumor suppressor) protein, p53; and the multiple
drug resistance transporter, ABCG2. The relationship between classifier
and outcome parameters is a fluid one, which may change after exploratory
analysis. This relationship also is highly dependent on the extent of the avail
able pre-existing information concerning the cell populations and markers of
interest. To choose a straightforward example, in the analysis of activated
T-cell cytokine production, T-cell subset markers clearly constitute the classi
fiers, and antibodies identifying specific cytokines are the outcomes. Explor
atory analysis also may lead to including light scatter properties among the
outcome variables, if these change on induction of cytokine production. To
return to the example, because there is little to no pre-existing information
concerning the markers of interest on human lung stem cells, the outcomes
analysis first focuses on co-expression of the differentiation marker, cytoker
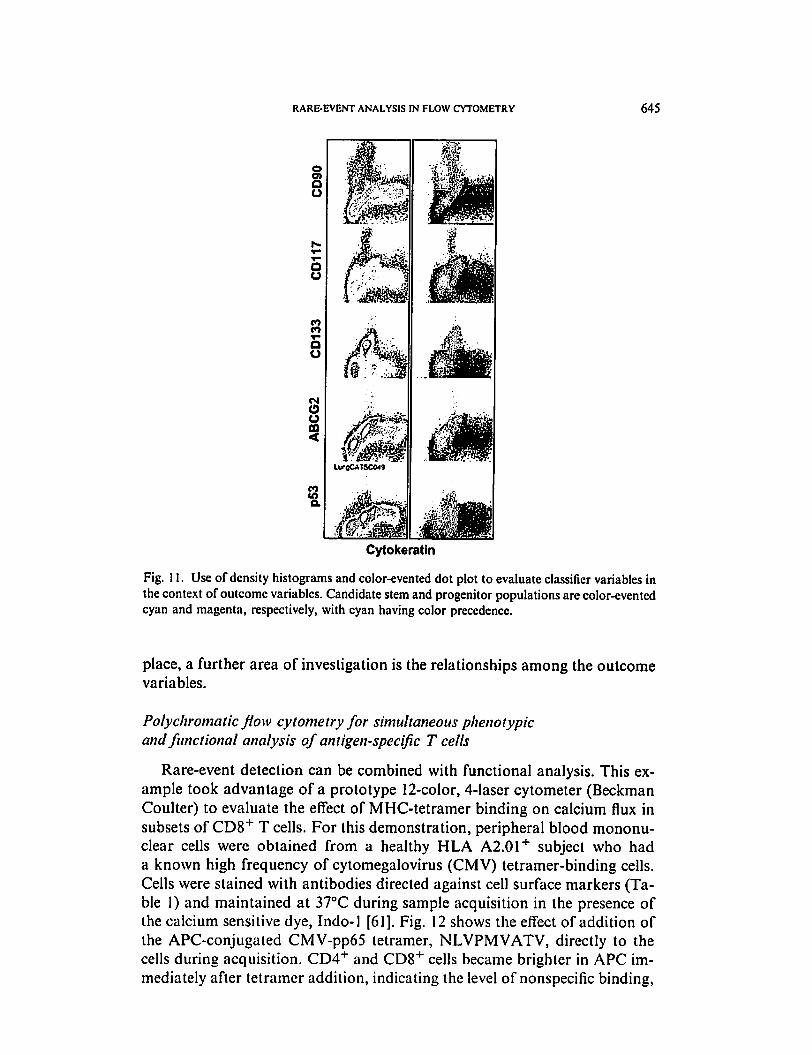
atin, in relation to the other outcome parameters (Fig. 11). More insight can be
gained into the complex relationship between these markers and the outcome
variable through the use ofcolor eventing. Putative stem cells (cells expressing
any stem cell marker [CD90, CD117, or CD 133] and having simple morphol
ogy) were color-evented cyan; progenitor cells (cells expressing any stem cell
marker and having complex morphology) were color-evented magenta. Ma
ture cells (stem cell marker-negative) are color-evented black. Clearly, dim
expression of CD90 is the predominant marker on this cytokeratin-negative
putative stem cell, followed by CD133. Bright CD90, bright CD117, and the
majority of CD 133 expression occurs on cytokeratin dim cells of complex
morphology (candidate progenitor cells). Dim expression of all stem cell
markers also extends to a discrete population of cytokeratin bright cells.
The bulk of simple and complex cells do not express stem cell markers. The
transporter ABCG2 is most prevalent on the putative stem cells but has its
highest expression on cytokeratin dim progenitor cells. The expression of
p53 resembles that ofABCG2. Although this analysis provides a good starting
RARE-EVENT ANALYSIS IN FLOW CYTOMETRY 645
o>
QU
OO
<>m
EO
Cytokeratin
Fig. 11. Use of density histograms and color-evented dot plot to evaluate classifier variables in
the context of outcome variables. Candidate stem and progenitor populations are color-evented
cyan and magenta, respectively, with cyan having color precedence.
place, a further area of investigation is the relationships among the outcome
variables.
Polychromatic flow cytometry for simultaneous phenotypic
andfunctional analysis of antigen-specific T cells
Rare-event detection can be combined with functional analysis. This ex
ample took advantage of a prototype 12-color, 4-laser cytometer (Beckman
Coulter) to evaluate the effect of MHC-tetramer binding on calcium flux in
subsets of CD8+ T cells. For this demonstration, peripheral blood mononu-
clear cells were obtained from a healthy HLA A2.01+ subject who had
a known high frequency of cytomegalovirus (CMV) tetramer-binding cells.
Cells were stained with antibodies directed against cell surface markers (Ta
ble 1) and maintained at 37°C during sample acquisition in the presence of
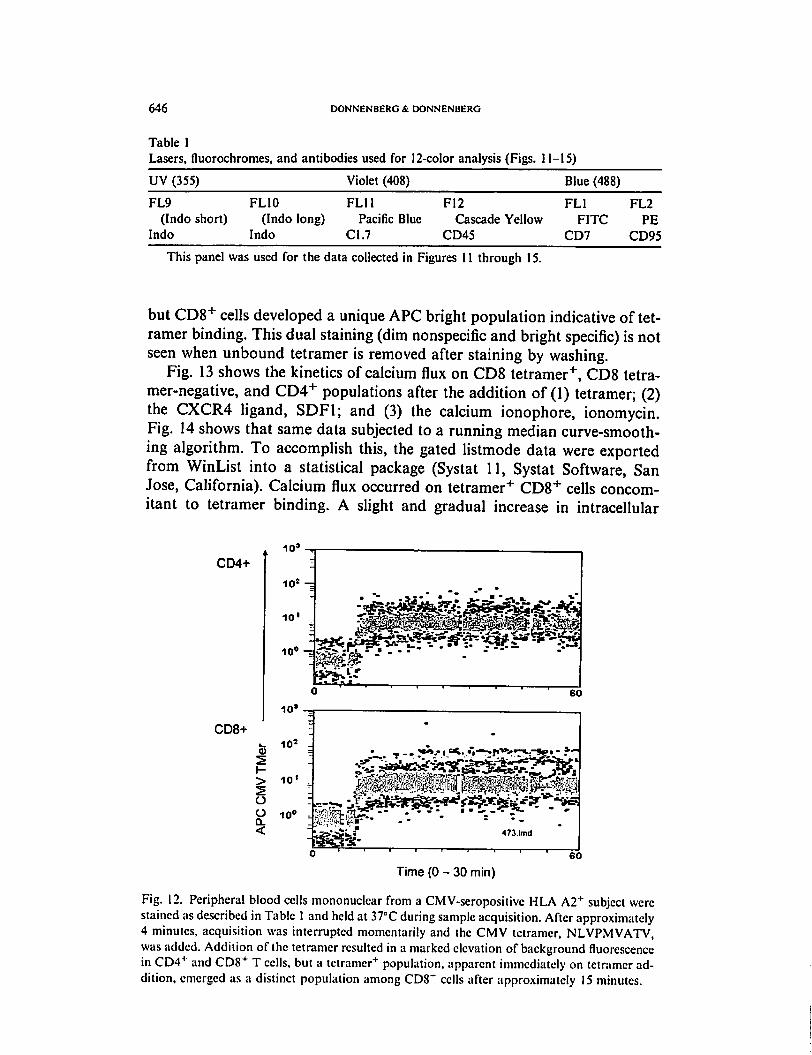
the calcium sensitive dye, Indo-1 [61]. Fig. 12 shows the effect of addition of
the APC-conjugated CMV-pp65 tetramer, NLVPMVATV, directly to the
cells during acquisition. CD4+ and CD8+ cells became brighter in APC im
mediately after tetramer addition, indicating the level of nonspecific binding,
646 DONNENBERG & DONNENBERG
Table 1
Lasers, fluorochromes, and antibodies used for 12-color analysis (Figs. 11-15)
UV (355) Violet (408) Blue (488)
FL9 FL10 FLU F12 FL1 FL2
(Indo short) (Indo long) Pacific Blue Cascade Yellow FITC PE
Indo Indo C1.7 CD45 CD7 CD95
This panel was used for the data collected in Figures 11 through 15.
but CD8+ cells developed a unique APC bright population indicative of tet
ramer binding. This dual staining (dim nonspecific and bright specific) is not
seen when unbound tetramer is removed after staining by washing.
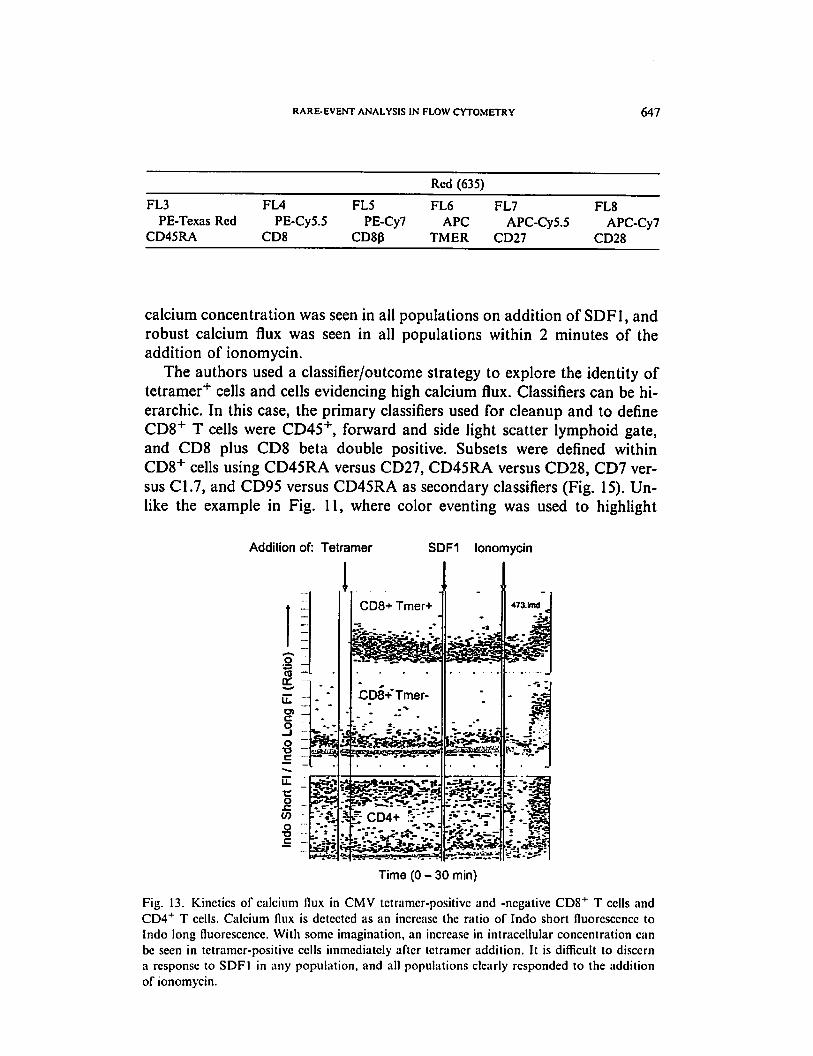
Fig. 13 shows the kinetics of calcium flux on CD8 tetramer+, CD8 tetra-
mer-negative, and CD4+ populations after the addition of (1) tetramer; (2)
the CXCR4 ligand, SDF1; and (3) the calcium ionophore, ionomycin.
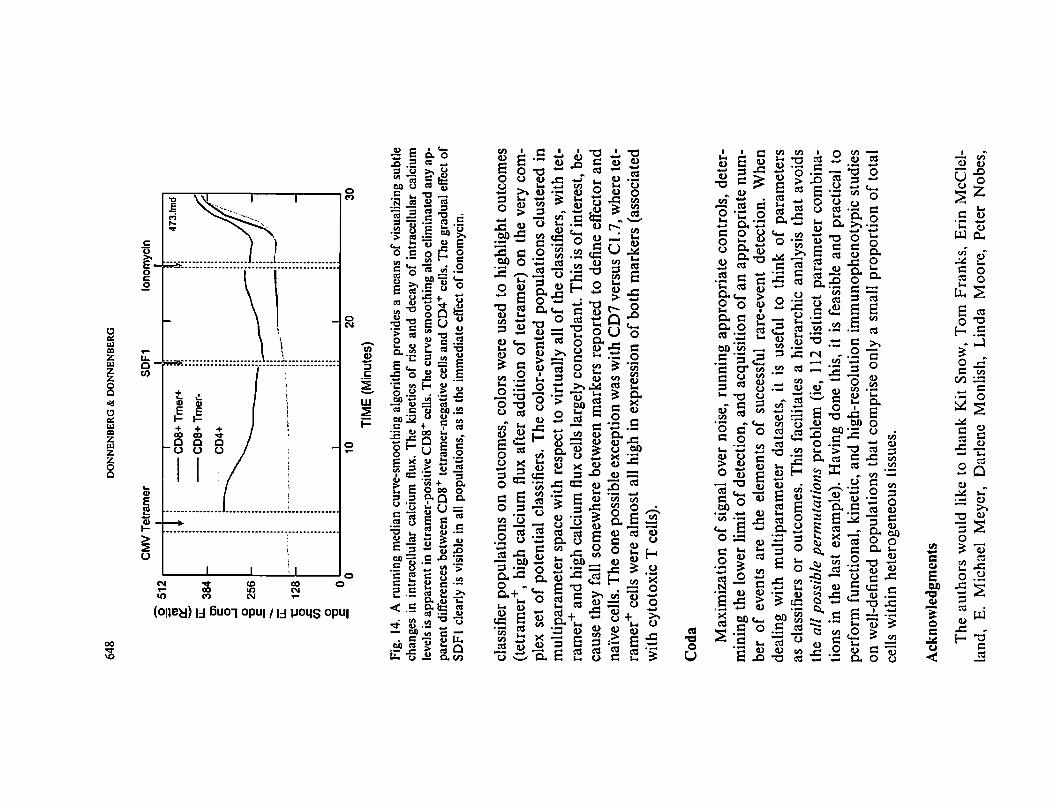
Fig. 14 shows that same data subjected to a running median curve-smooth
ing algorithm. To accomplish this, the gated listmode data were exported
from WinList into a statistical package (Systat 11, Systat Software, San
Jose, California). Calcium flux occurred on tetramer+ CD8+ cells concom
itant to tetramer binding. A slight and gradual increase in intracellular
CD4+
CD8+
<D
o
O
<
10s -
10'
Time (0 - 30 min)
Fig. 12. Peripheral blood cells mononuclear from a CMV-seropositive HLA A2+ subject were
stained as described in Table 1 and held at 37°C during sample acquisition. After approximately
4 minutes, acquisition was interrupted momentarily and the CMV tetramer, NLVPMVATV,
was added. Addition of the tetramer resulted in a marked elevation of background fluorescence
in CD4' and CD8+ T cells, but a tetramer+ population, apparent immediately on tetramer ad
dition, emerged as a distinct population among CDS* cells after approximately 15 minutes.
RARE-EVENT ANALYSIS IN FLOW CYTOMETRY 647
Red (635)
FL3
PE-Texas Red
CD45RA
FL4 FL5 FL6 FL7 FL8
PE-Cy5.5 PE-Cy7 APC APC-Cy5.5 APC-Cy7
CD8 CD8P TMER CD27 CD28
calcium concentration was seen in all populations on addition of SDFI, and
robust calcium flux was seen in all populations within 2 minutes of the
addition of ionomycin.
The authors used a classifier/outcome strategy to explore the identity of
tetramer+ cells and cells evidencing high calcium flux. Classifiers can be hi
erarchic. In this case, the primary classifiers used for cleanup and to define
CD8+ T cells were CD45+, forward and side light scatter lymphoid gate,
and CD8 plus CD8 beta double positive. Subsets were defined within
CD8+ cells using CD45RA versus CD27, CD45RA versus CD28, CD7 ver
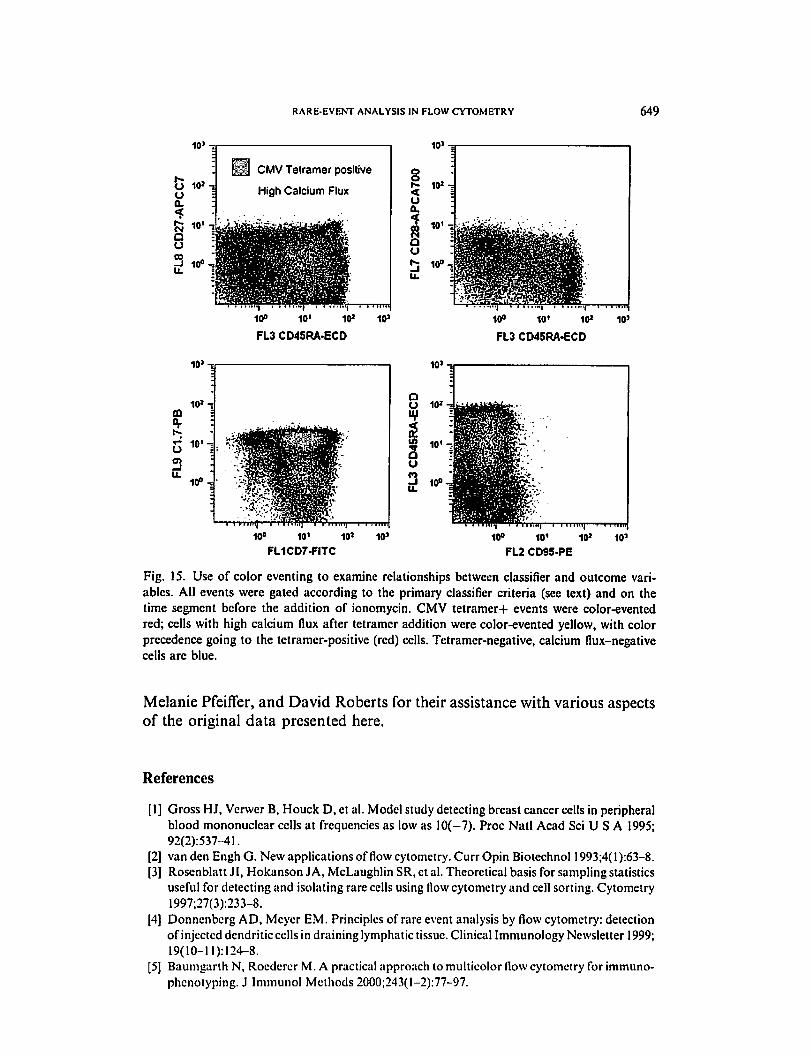
sus C1.7, and CD95 versus CD45RA as secondary classifiers (Fig. 15). Un
like the example in Fig. 11, where color eventing was used to highlight
Addition of: Tetramer SDF1 Ionomycin
Time (0 - 30 min)
Fig. 13. Kinetics of calcium flux in CMV tetramer-positive and -negative CD8+ T cells and
CD4+ T cells. Calcium flux is detected as an increase the ratio of Indo short fluorescence to
Indo long fluorescence. With some imagination, an increase in intraccllular concentration can
be seen in tetramer-positive cells immediately after tetramer addition. It is difficult to discern
a response to SDFI in any population, and all populations clearly responded to the addition
of ionomycin.
648
DONNENBERC&DONNENBERG
CMV
Tetramer
SDF1
lonomycin
o512
c o
384
•825
6
LL S
128
o ■o
-0
CD8+Tmer+
CD8+Tmer*
CD4+
473.!md
10
20
30
TIME
(Minutes)
Fig.
14.A
runningmediancurve-smoothingalgorithmprovidesameans
ofvisualizingsubtle
changes
inintracellularcalcium
flux.The
kinetics
of
rise
and
decay
of
intracellularcalcium
leve
lsisapparent
intctramer-positiveCD8+
cell
s.Thecurvesmoothingalso
eliminatedanyap
parentdifferencesbetweenCD8+
tetr
amer
-neg
ativ
ecellsandCD4+
cells.Thegradual
effect
of
SDFI
clearly
isvisiblein
allpopulations,
as
istheimmediate
effe
ctofionomycin.
classifier
populationsonoutcomes,colorswereused
tohighlightoutcomes
(tetramer+,highcalcium
flux
afteradditionoftetramer)on
theverycom
plex
setofpotential
clas
sifi
ers.
The
color-eventedpopulations
clustered
in
multiparameterspacewith
respect
tovirtually
allofthe
classifiers,
with
tet
rame
r"1"
andhighcalcium
flux
cell
slargelyconcordant.This
isofin
tere
st,be
causethey
fall
somewherebetweenmarkers
reportedtodefine
effe
ctor
and
naive
cells.TheonepossibleexceptionwaswithCD7
versusC1.7,where
tet
ramer4"
cellswerealmost
allhigh
inex
pres
sion
ofbothmarkers
(ass
ocia
ted
withcytotoxicT
cells).
Coda
Maximizationofsignalover
noise,
runningappropriate
controls,deter
miningthelower
limitofdetection,and
acquisitionofanappropriatenum
ber
of
events
are
the
elements
of
successful
rare-event
detection.When
dealing
with
multiparameter
datasets,
itis
useful
to
think
ofparameters
as
classifiersoroutcomes.
This
faci
lita
tesa
hierarchic
analysis
thatavoids
the
allpossiblepermutationsproblem
(ie,
112
distinctparametercombina
tions
inthe
last
example).Havingdone
this,
itis
feasibleand
practical
to
perform
functional,
kinetic,and
high-resolutionimmunophenotypic
studies
on
well-definedpopulations
thatcompriseonlyasmallproportionoftotal
cell
swithinheterogeneous
tiss
ues.
Acknowledgments
The
authorswould
like
tothank
KitSnow,Tom
Franks,
ErinMcClel-
land,
E.
Michael
Meyer,
Darlene
Monlish,
Linda
Moore,
Peter
Nobes,
RARE-EVENT ANALYSIS IN FLOW CYTOMETRY 649
CMV Tetramer positive
High Calcium Flux
10'
cQ
3
10*-5
I
oa.
au
10»-|
10. ]
10°^
108 10' 10*
FL3 CD4SRA-ECD
10° 10' 10»
FL3 CD45RA-ECD
10'
10° 10' 10J
FL1CD7-FITC
10° 10' 10* 10'
FL2 CD95-PE
Fig. 15. Use of color eventing to examine relationships between classifier and outcome vari
ables. All events were gated according to the primary classifier criteria (see text) and on the
time segment before the addition of ionomycin. CMV tetramer+ events were color-evented
red; cells with high calcium flux after tetramer addition were color-evented yellow, with color
precedence going to the tetramer-positive (red) cells. Tetramer-negative, calcium flux-negative
cells are blue.
Melanie Pfeiffer, and David Roberts for their assistance with various aspects
of the original data presented here.
References
[1] Gross HJ, Verwer B, Houck D, et al. Model study detecting breast cancer cells in peripheral
blood mononuclear cells at frequencies as low as 10(-7). Proc Natl Acad Sci U S A 1995;
92(2):537-41.
[2] van den Engh G. New applications of flow cytometry. Curr Opin Biotechnol 1993;4( 1 ):63-8.
[3] Rosenblatt JI, Hokanson JA, McLaughlin SR, ct al. Theoretical basis for sampling statistics
useful for detecting and isolating rare cells using flow cytometry and cell sorting. Cytometry
1997;27(3):233-8.
(4] Donncnbcrg AD, Meyer EM. Principles of rare event analysis by flow cytometry: detection
ofinjected dendritic cells in draining lymphatic tissue. Clinical Immunology Newsletter 1999;
19(10-11):124-8.
[5] Baumgarth N, Roedcrer M. A practical approach to multicolor flow cytometry for immuno-
phenotyping. J Immunol Methods 2000;243(l-2):77-97.
650 DONNENBERG & DONNENBERG
[6] Donnenberg VS, Donnenberg AD. Identification, rare-event detection and analysis of den
dritic cell subsets in broncho-alveolar lavage fluid and peripheral blood by flow cytometry.
Front Biosci 2003;8:sl 175-80.
[7] Altman JD, Moss PAH, Goulder PR, et al. Phenotypic analysis of antigen-specific T lym
phocytes. Science 1996;274:94-6.
[8] NIH Tetramer Core Facility at Emory University. Available at: http://rcscarch.yerkes.
emory.edu/tetramer_core/index.html. Accessed June 18, 2007.
[9] Maino VC, Picker LJ. Identification of functional subsets by flow cytometry: intracellular
detection of cytokine expression. Cytometry I998;34(5):2O7-I5.
[ 10] Listman JA, Wang Y, Castro JE, et al. Detection ofrare apoptotic T cells in vivo. Cytometry
1998;33(3):340-7.
[11] Muraro PA, Jacobsen M, Necker A, et al. Rapid identification of local T cell expansion in
inflammatory organ diseases by flow cytometric T cell receptor Vbeta analysis. J Immunol
Methods 2000;246( 1 -2): 131 -43.
[ 12] Walle AJ, Niedermayer W. Aneuploidy as a marker of minimal residual disease in leukemia.
Cancer Detect Prev 1985;8(l-2):303-15.
[13] Ryan DH, Mitchell SJ, Hennessy LA, et al. Improved detection of rare CALLA-positive
cells in peripheral blood using multiparameter flow cytometry. J Immunol Methods 1984;
74(1): 115-28.
[14] Hussain M, Kukuruga M, Biggar S, et al. Prostate cancer: flow cytometric methods for de
tection of bone marrow micrometastases. Cytometry 1996;26(l):40-6.
[15] Balic M, Dandachi N, Hofmann G, et al. Comparison of two methods for enumerating cir
culating tumor cells in carcinoma patients. Cytometry B Clin Cytom 2005;68(l):25-30.
[16] Allard WJ, Matera J, Miller MC, et al. Tumor cells circulate in the peripheral blood of all
major carcinomas but not in healthy subjects or patients with nonmalignant diseases. Clin
Cancer Res 2004;10(20):6897-904.
[17] Dick JE. Breast cancer stem cells revealed. Proc Natl Acad Sci U S A 2003;100(7):3547-9.
[18] Donnenberg VS, Donnenberg AD. Multiple drug resistance in cancer revisited: the cancer
stem cell hypothesis. J Clin Pharmacol 2005;45(8):872-7.
[19] Donnenberg VS, Luketich JD, Landreneau RJ, et al. Tumorigenic epithelial stem cells and
their normal counterparts. Ernst Schering Res Found Workshop, in press.
[20] Donnenberg VS, Landreneau RJ, Donnenberg AD. Tumorigenic stem and progenitor cells:
implications for the therapeutic index of anti-cancer agents. J Control Release, in press.
[21] Al-Hajj M, Wicha MS, Benito-Hernandez A, et al. Prospective identification of tumorigenic
breast cancer cells. Proc Natl Acad Sci U S A 2003;l00(7):3983-8.
[22] Singh SK, Hawkins C, Clarke ID, et al. Identification ofhuman brain tumour initiating cells.
Nature 2004;432(7015):396-40l.
[23] Szotek PP, Pieretti-Vanmarcke R, Masiakos PT, et al. Ovarian cancer side population de
fines cells with stem cell-like characteristics and Mullerian Inhibiting Substance responsive
ness. Proc Natl Acad Sci U S A 2006;103(30): 11154-9.
[24] Goodell MA, Brose K, Paradis G, et al. Isolation and functional properties of murine hema-
topoietic stem cells that are replicating in vivo. J Exp Med 1996; 183(4): 1797-806.
[25] Zhou S, Schuetz JD, Bunting KD, et al. The ABC transporter Bcrpl/ABCG2 is expressed in
a wide variety ofstem cells and is a molecular determinant ofthe side-population phenotype.
Nat Med 2001 ;7(9): 1028-34.
[26] Muller C, Bonmann M, Cassens U, et al. Flow cytometric analysis of protein phosphoryla-
tion in the hematopoetic system. Leuk Lymphoma 1998;29(3-4):351-60.
[27] Rosu-Myles M, Khandaker M, Wu DM, et al. Characterization of chemokine receptors ex
pressed in primitive blood cells during human hematopoietic ontogeny. Stem Cells 2000;
18(5):374-81.
[28] Henon PH, Sovalat H, Bourderont D. Importance of CD34+ cell subsets in autologous
PBSC transplantation: the mulhouse experience using CD34+CD38- cells as predictive
tool for hematopoietic cngraftnicnt. J Biol Regul Homeost Agents 2001; 15(1):62-7.
RARE-EVENT ANALYSIS IN FLOW CYTOMETRY 651
[29] Pratt G, Rawstron AC, English AE, et al. Analysis of CD34+ cell subsets in stem cell har
vests can more reliably predict rapidity and durability of engraftmcnt than total CD34+
cell dose, but steady state levels do not correlate with bone marrow reserve. Br J Hacmatol
2001;114(4):937-43.
[30] Shapiro R, Rao AS, Fontes P, et al. Combined simultaneous kidney/bone marrow trans
plantation. Transplantation 1995;60(l 2): 1421-5.
[31] Ribatti D. The discovery of endothelial progenitor cells. An historical review. Leuk Res
2007;31(4):439-44.
[32] Jones EA, English A, Kinsey SE, et al. Optimization of a flow cytometry-based protocol for
detection and phenotypic characterization of multipotent mesenchymal stromal cells from
human bone marrow. Cytometry B Clin Cytom 2006;70(6):391-9.
[33] George F, Brisson C, Poncelet P, et al. Rapid isolation of human endothelial cells from
whole blood using S-Endol monoclonal antibody coupled to immuno-magnetic beads:
demonstration of endothelial injury after angioplasty. Thromb Haemost 1992;67(1):
147-53.
[34] Bohmer RM, Zhen D, Bianchi DW. Identification of fetal nucleated red cells in co-cultures
from fetal and adult peripheral blood: differential effects of serum on fetal and adult eryth-
ropoiesis. Prenat Diagn 1999; 19(7):628-36.
[35] Geifman-Holtzman O, Makhlouf F, Kaufman L, et al. The clinical utility of fetal cell sorting
to determine prenatally fetal E/e or e/e Rh genotype from peripheral maternal blood. Am J
Obstet Gynecol 2000;183(2):462-8.
[36] Bajaj S, Welsh JB, Leif RC, et al. Ultra-rare-event detection performance of a custom
scanning cytometer on a model preparation of fetal nRBCs. Cytometry 2000;39(4):
285-94.
[37] Bianchi DW, Zickwolf GK, Weil GJ, et al. Male fetal progenitor cells persist in maternal
blood for as long as 27 years postpartum. Proc Natl Acad Sci U S A 1996;93(2):705-8.
[38] Qu L, Triulzi DJ, Rowe DT, ct al. Stability of Lymphocytes and EBV during RBC Storage.
Vox Sanguinis 2007;92:125-9.
[39] Garritsen HS, Sibrowski W. Flow cytometric determination of leukocytes and lymphocyte
subsets in thrombocytapheresis products. Beitr Infusionsther Transfusionsmed 1994;32:
401-4.
[40] Triulzi DJ, Meyer EM, Donnenberg AD. WBC subset analysis of WBC-reduced platelet
components. Transfusion 2000;40(7):771-80.
[41] Barrat-BoyesSM.ZimmerMI, HarshyneLA.etal. Maturation and trafficking ofmonocyte-
derived dendritic cells in monkeys: implications for dendritic cell-based vaccines. J Immunol
2000;164:2487-95.
[42] Parish CR. Fluorescent dyes for lymphocyte migration and proliferation studies. Immunol
Cell Biol l999;77(6):499-508.
[43] Donnenberg VS, O'Connell PJ, Logar AJ, et al. Rare event analysis of circulating human
dendritic cell subsets and their presumptive mouse counterparts. Transplantation 2001;
72(12): 1946-51.
[44] Mcllroy D, Troadcc C, Grassi F, et al. Investigation of human spleen dendritic cell pheno-
type and distribution reveals evidence of in vivo activation in a subset oforgan donors. Blood
2001;97(ll):3470-7.
[45] Morelli AE, Hackstein H, Thomson AW. Potential of tolerogenic dendritic cells for trans
plantation. Scmin Immunol 2001;13(5):323-35.
[46] Fong L, Brockstedt D, Benike C, et al. Dendritic cells injected via different routes induce im
munity in cancer patients. J Immunol 2001;166(6):4254-9.
[47] Kuwana M, Kaburaki J, Wright TM, ct al. Induction of antigen-specific human CD4(+) T
cell ancrgy by peripheral blood DC2 precursors. Eur J Immunol 2001 ;31 (9):2547-57.
[48] Liau S, Yancovitz SR, Qurcshi MN, et al. The number ofCD la+ large low-density cells with
dendritic cell features is increased in the peripheral blood of HIV+ patients. Clin Immunol
Immunopathol 1994;70(3): 190-7.
652 DONNENBERG & DONNENBERG
[49] Kramer B, Grobusch MP, Suttorp N, et al. Relative frequency of malaria pigment-carrying
monocytcs of nonimmune and semi-immune patients from flow cytometric depolarized side
scatter. Cytometry 2001 ;45(2): 133-40.
[50] Medina F, Segundo C, Brieva JA. Purification of human tonsil plasma cells: pre-enrichment
step by immunomagnetic selection of CD31(+) cells. Cytometry 2000;39(3):231-4.
[51] Rehse MA, Corpuz S, Heimfeld S, et al. Use of fluorescence threshold triggering and high
speed flow cytometry for rare event detection. Cytometry 1995;22(4):317—22.
[52] Shapiro HM. Practical flow cytometry. 4th edition. Hoboken (NJ): John Wiley and Sons;
2003.
[53] Cupp JE, Leary JF, Cernichiari E, et al. Rare-event analysis methods for detection of fetal
red blood cells in maternal blood. Cytometry 1984;5(2): 138-44.
[54] Owens M, Loken MR. Flow cytometry principles for clinical laboratory practice: quality as
surance for quantitative immunophenotyping. New York: Wylie-Liss; 1995. p. 111-28.
[55] Aubin JE. Autofluorescence of viable cultured mammalian cells. J Histochem Cytochem
1979;27(l):36-43.
[56] Hoffmann TK, Donnenberg VS, Friebe-Hoffmann U, et al. Rapid communication: compe
tition of peptide-MHC class I tetrameric complexes with anti-CD3 provides evidence for
specificity of peptide binding to the tcr complex. Cytometry 2000;41:321-8.
[57] Telford W, Murga M, Hawley T, et al. DPSS yellow-green 561-nm lasers for improved fluo-
rochrome detection by flow cytometry. Cytometry A 2005;68(l):36-44.
[58] Gross HJ, Verwer B, Houck D, et al. Detection of rare cells at a frequency ofone per million
by flow cytometry. Cytometry 1993; 14(5): 519-26.
[59] Roedcrcr M. Spectral compensation for flow cytometry: visualization artifacts, limitations,
and caveats. Cytometry 2001;45(3): 194-205.
[60] Sutherland DR, Anderson L, Keeney M, et al. The ISHAGE guidelines for CD34+ cell de
termination by flow cytometry. International Society of Hematotherapy and Graft Engi
neering. J Hematother 1996;5(3):213-26.
[61] June CH, Ledbettcr JA, Rabinovitch PS, et al. Distinct patterns of transmembrane calcium
flux and intracellular calcium mobilization after differentiation antigen cluster 2 (E rosette
receptor) or 3 (T3) stimulation of human lymphocytes. J Clin Invest 1986;77(4): 1224-32.