Accountable Care Organizations Engaging Patients and Their ...
Rapid Review 9
Accountable Care
Organizations and the
Canadian Context
Peckham A, Rudoler D, Bhatia D, Fakim S, Allin S, Marchildon G
November 2018
ii
This report was produced by the North American Observatory on Health Systems and Policies.
The views expressed by the authors are not intended to represent the views of reviewers or partners of
the North American Observatory on Health Systems and Policies.
Suggested citation:
Peckham A, Rudoler D, Bhatia D, Fakim S, Allin S, Marchildon G. (2018). Accountable Care Organizations
and the Canadian Context. Toronto: North American Observatory on Health Systems and Policies. Rapid
Review (No. 9).
Acknowledgements:
We would like to gratefully acknowledge the support of Ruth Lavergne, Patrick Farrell, and Alex Titeu.
Please address requests about the publication to:
North American Observatory on Health Systems and Policies
155 College Street, Suite 425
Toronto, ON M5T 3M6
© North American Observatory on Health Systems and Policies 2018

iii
Table of Contents Introduction and Background ....................................................................................................................... 3
Methods ........................................................................................................................................................ 3
Literature Search Strategy ........................................................................................................................ 3
Objectives 1 and 2 ................................................................................................................................. 3
Objective 3 ............................................................................................................................................ 3
Analytic Overview ......................................................................................................................................... 5
Objective 1: The ACO Experience in the United States............................................................................. 5
Brief History of the Development of ACO Models ................................................................................ 5
Key Characteristics of Public ACO Models in the United States ........................................................... 5
Common Elements Across ACO Models ............................................................................................... 7
Objective 2: The ACO Evidence in the United States ................................................................................ 9
Utilization .............................................................................................................................................. 9
Cost ....................................................................................................................................................... 9
Quality and Patient Outcomes ............................................................................................................ 10
Objective 3: The ACO Experience in Canada ........................................................................................... 10
Ontario ................................................................................................................................................ 10
Alberta ................................................................................................................................................. 11
Conclusion ................................................................................................................................................... 12
Appendix 1: ACO Evaluation Studies in US (2015-2018) ............................................................................. 13
References .................................................................................................................................................. 24
2
Introduction and Background
Since the establishment of Accountable Care Organizations (ACO) in the United Stated (US), under the
Patient Protection and Affordable Care Act in 2010, there has been much consideration as to the
potential for ACOs to be adopted in the Canadian context as a means to improve health care delivery
and costs (Guta, Wilson, & Lavis, 2016; Huynh et al., 2014). ACOs include groups of doctors, hospitals,
and other health care providers, who voluntarily come together to deliver and coordinate high quality
care to the patients they serve (Centers for Medicare and Medicaid Services, 2013). They broadly aim to
achieve better coordinated and integrated care by aligning incentives among providers and payers.
The need for improved integration across hospitals and community services is widely recognised within
Canada (Health Canada, 2004; Lazar, 2011; Lazar, Lavis, Forest, & Church, 2013; Romanow, 2002). There
is a wide range of opinions about whether elements of ACOs may be one way to achieve this goal. Some
argue that ACOs are the route to improved health systems while others see them as a means to cutting
services or a path towards “privatization” (Alderwick, Shortell, Briggs, & Fisher, 2018; Moberly, 2017).
Beginning in 1997, Canada has been pushing to integrate, re-organize, and strengthen our health system
in line with the health ministers’ Renewed Vision for Canada’s Health System (Conference of
Provincial/Territorial Ministers of Health, 1997). Beyond the goals of integration and coordination,
financial sustainability remains a top concern for the Canadian health care system. More recently, there
has been interest in achieving the following “Triple Aim Outcomes”: improving the patient/caregiver
experience of care, improving population health, and keeping per capita costs of healthcare sustainable.
As ACOs continue to expand across the US, there is also a growing body of literature evaluating these
models. As of January 2018, there were 480 public ACO models within the US (Centers for Medicare &
Medicaid Services, 2018b), with several models receiving wide-ranging attention from policy makers
across the globe: Kaiser Permanente, the Cleveland Clinic, and the Geiringer Health System. However, an
understanding of how ACOs are formed, and how incentives are aligned remains limited.
Despite this growing attention, there is also limited understanding of the extent to which the ACO model
could be implemented within the Canadian context. To fill this gap, we conducted a rapid review of the
secondary literature to highlight the key characteristics of ACOs, and identify if there have been any
reforms within Canada that resemble these organizations as they exist in the US. We conclude with an
assessment of the degree to which the ACO model has adapted to the Canadian context.
This rapid review intended to address three broad objectives:
1. To characterize public ACOs, in particular their approach to shared savings and financial risk,
accountability and monitoring, as well as funding and incentive mechanisms
2. To synthesize the results of evaluations of ACOs conducted between 2015-2018 in the US
3. To explore initiatives across Canada with respect to implementing ACO-like models based on
criteria identified in objective one.

North American Observatory on Health Systems and Policies
3
Methods
Literature Search Strategy Objectives 1 and 2 We used a combination of structured and iterative techniques to obtain the relevant evidence. First, we
conducted an open search in Google and the Health Systems Evidence Service
(healthsystemsevidence.org) to identify current literature reviews on ACOs. In addition, we searched
Medline (Ovid) using the exploded Medical Subject Heading (MeSH) term “Accountable Care
Organizations” strictly using the “reviews only” filter (optimized sensitivity and specificity) and
combining search terms using the “AND” Boolean operator. We also searched the Data & Reports
section of the Centers for Medicare and Medicaid Services (CMS) website (cms.gov) using the term
“accountable care organization(s)”. We scanned the reference lists of the retrieved publications for
relevant sources, including a rapid synthesis conducted by the McMaster Health Forum (Guta et al.,
2016), a systematic review (Kaufman, Spivack, Stearns, Song, & O’Brien, 2017), and a white paper (Koury
et al., 2014). In this search we identified a framework for evaluating ACOs and searched for papers in
PubMed that had cited this framework (Fisher, Shortell, Kreindler, Van Citters, & Larson, 2012).
Subsequent references were found by way of a snowballing technique. We performed all searches on
September 18-19, 2018.
Eligibility criteria: We included sources in the rapid review if they (1) explicitly aimed to define ACOs or
classify their taxonomies (Objective 1), or (2) evaluated the impact of ACOs during the past three years
(Objective 2).
Objective 3 Objective 3 involved a search to identify relevant Canadian examples across provincial/territorial (P/T)
jurisdictions. We searched Medline (Ovid interface) on September 25, 2018 with the MeSH term
“Canada/” combined using the Boolean operator “AND” with the following MeSH terms: (1)
“Accountable Care Organizations/” (2 results) or (2) “Reimbursement, Incentive/,” limited to publication
years 2015-2018 (12 results). One reviewer screened the retrieved titles and included sources
addressing federal- or province-level health system initiatives. For reasons of feasibility, we excluded
studies pertaining to health services related to a specific health condition (e.g., cancer screening,
diabetes control, and childhood immunization).
We conducted a Custom Google grey literature search (Canadian government documents and Canadian
health departments and agencies) on September 26, 2018 to supplement the secondary literature
search. We developed keywords pertaining to the two defining concepts of ACOs, identified from the
first rapid review: (1) collaborative health service delivery and (2) accountability for quality of care (e.g.
“collaborative accountability,” “collaborative care,” “collaborative practice,” “accountable care
systems,” “accountable care services”).
Finally, we scanned websites of individual Canadian provinces for current initiatives that aim to increase
provider accountability and reorganize health service delivery and financing. Once we identified possible
models, an open search was conducted using model-specific terms (e.g., “health links”). We then
4
assessed the Canadian programs based on the common characteristics of ACOs as identified in objective
1. We provided a summary of the program provided it incorporated two or more of the following
characteristics:
1. A defined population of patients/clients
2. A shared savings agreement between providers and payer
3. A network of providers
4. Access to shared health or medical records
5. A mission to achieve all domains of the Triple Aim Outcomes
Limitations: This was a review completed over the course of 10 business days and therefore is not a
comprehensive assessment. Rather, it is a rapid synthesis of recent evaluations of ACOs across the US
and descriptions of programs that appear to incorporate some features of ACO models that exist within
Canada.

North American Observatory on Health Systems and Policies
5
Analytic Overview
Objective 1: The ACO Experience in the United States
Brief History of the Development of ACO Models The first iteration of an ACO was a demonstration program implemented by the Centres for Medicare
and Medicaid Services (CMS) in 2005. The pilot, called the “Physician Group Practice Demonstration”
was in place from 2005 to 2010, It included incentive payments for providers to coordinate care for
Medicare beneficiaries. Under this program, physician groups earned bonus payments for any savings
generated, and for performance based on 32 quality measures (Centers for Medicare & Medicaid
Services, 2011).
As one of the first ACO-like models developed in the US, the experience of the Physician Group Practice
Demonstration program, informed the roll-out of additional ACO models (Guta et al. 2016). Scholars at
Dartmouth College had initially proposed the concept of an ACO to shift providers out of the fee-for-
service (FFS) payment model and into a model that pays provider groups for their ability to achieve
efficiencies in care delivery. The ACO model, formally implemented as part of the Affordable Care Act
(2010), permits hospitals, networks of physician groups, or partnerships between physician groups and
hospitals to participate in a shared savings program. A shared savings program allows providers who
incur costs below an established threshold to share in all or part of the difference between actual costs
and the threshold. Costs are shared on the condition that lowered costs do not occur at the expense of
the quality of care provided.
The original criteria establishing an ACO was quite loose and contributed to considerable heterogeneity
in the application of the ACO model. In the following sections we highlight the different iterations of this
approach, paying particular attention to public ACO models, as well as the characteristics they have in
common.
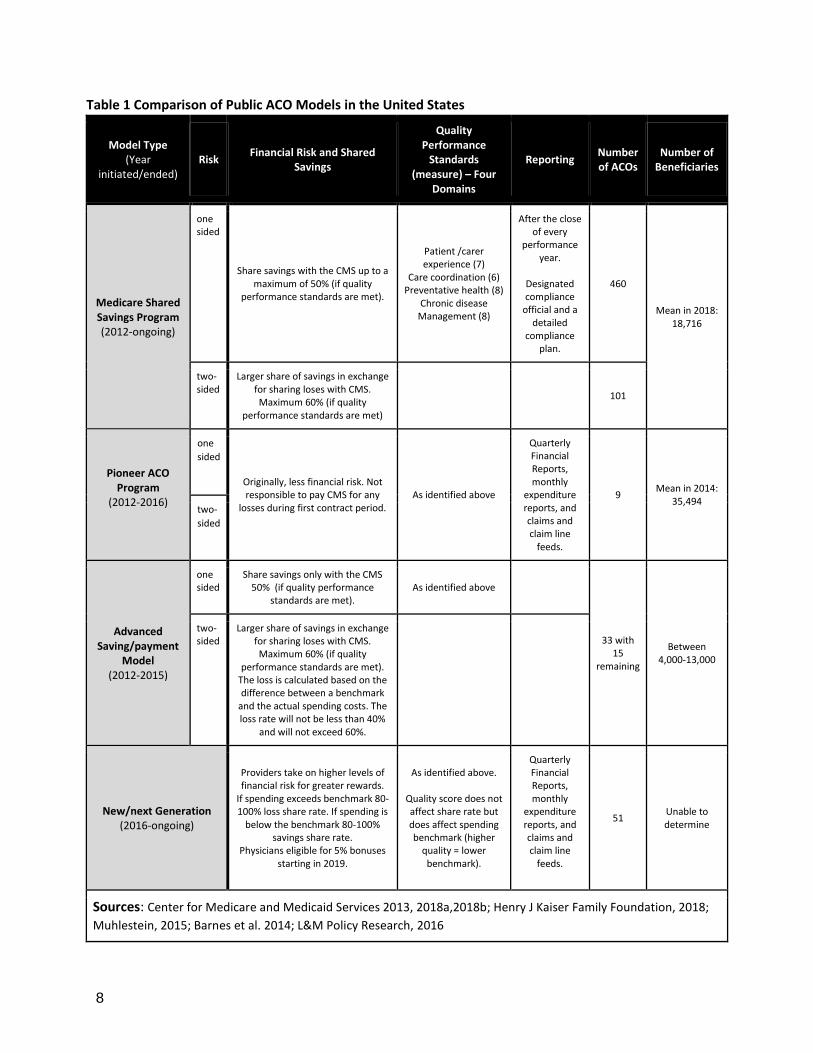
Key Characteristics of Public ACO Models in the United States As of January 2018, there were 480 public shared savings program ACOs across 50 states, Washington,
D.C., and Puerto Rico, up from 404 in 2015 (Centers for Medicare & Medicaid Services 2018b).
While different entities could sponsor an ACO, between 2010 and 2012 hospital systems were the
predominant entity involved in the ACO model. In 2013, physician led groups surpassed hospitals
accounting for 51% of all ACOs. A small number of ACOs are led by insurers and community
organizations, yet providers run the ACO even in these models (Barnes et al., 2014). There are a total of
324 (58%) of Medicare Shared Savings Program (MSSP) ACOs that involve physicians, hospitals, and
other facilities (58%) (Centers for Medicare and Medicaid Services, 2018b).

6
There is a wide variety of ACO contracts in place in the US that involve both public and private payers.
There are three primary types of public Medicare ACO structures, with Medicare Shared Savings
Program (MSSP) being the largest federal program (Please see Table 1).1
The second model is the Pioneer ACO model, which ran as a demonstration between 2012 and 2016.
This model targeted hospitals or provider groups with existing health information technology
infrastructures and with experience providing coordinated, managed, and patient-centered care. These
organizations had at least 15,000 assigned beneficiaries (5,000 for rural ACOs). Organizations had to
apply to and be selected by the CMS based on the strength of their applications in demonstrating their
infrastructure capabilities and past experience with coordinated care. The CMS selected 32
organizations to participate in this model with eight currently in operation (Centers for Medicare and
Medicaid Services, 2018a).
The third model is the Advanced Savings (or payment) model (ASM). This new model aimed to engage
providers from across the care continuum (involving hospitals, primary care, and community
organizations). The ASM constitutes a subgroup of MSSP ACOs, designed to encourage smaller and more
rural health care organizations, lacking the infrastructure and beneficiaries to participate in MSSP, to
adopt the ACO model. In this model, the CMS provides ACOs one up-front payment and 24 monthly
payments adjusted for the number of historically assigned beneficiaries to cover the costs of
establishing and running an ACO (L&M Policy Research, 2916).
All ACOs participate in a shared savings program. Specifically, providers must meet at least 70% out of a
total of 33 quality indicators categorized in each of the following four domains: (1) patient experience of
care, (2) care coordination and safety, (3) preventive healthcare, and (4) chronic disease management
(US Government Accountability Office, 2015). ACOs must sign a three-year contract (based on three
calendar years beginning January 1 no matter the start date of the program). Benchmarks are
determined based on three calendar years immediately preceding the start of the agreement period.
Basically, the CMS estimates its future spending through a process of modifying payments and
benchmarks to reflect the degree of illness. This process is done through the use of Medicare cost
amounts and diagnosis codes.2
Under shared savings models, providers are reimbursed via FFS, and at the end of the year split savings
with the payer (as measured against predetermined benchmarks). If providers are embedded within
models that share both savings and losses (e.g., “two-sided” MSP as noted in Table 1), they are also
entitled to a larger proportion of these savings, due to increased risk. Public ACO models do not rely on
global budgets and capitated payment models like private ACO structures. In the former, providers
receive a budget based on population case-mix, and if costs at the end of the year are below the global
1 Though beyond the scope of this rapid review, there are also two primary models for private ACOs – insurance-led and provider-driven (usually hospitals and physician organizations)–although in both cases providers lead the ACO. 2 For a detailed description and break down refer to Centers for Medicare & Medicaid Services (2015) and Centers for Medicare & Medicaid Services (2018). Shared savings and losses and assignment methodology. Retrieved from https://www.cms.gov/Medicare/Medicare-Fee-for-Service-Payment/sharedsavingsprogram/Downloads/Shared-Savings-Losses-Assignment-Spec-V6.pdf
North American Observatory on Health Systems and Policies
7
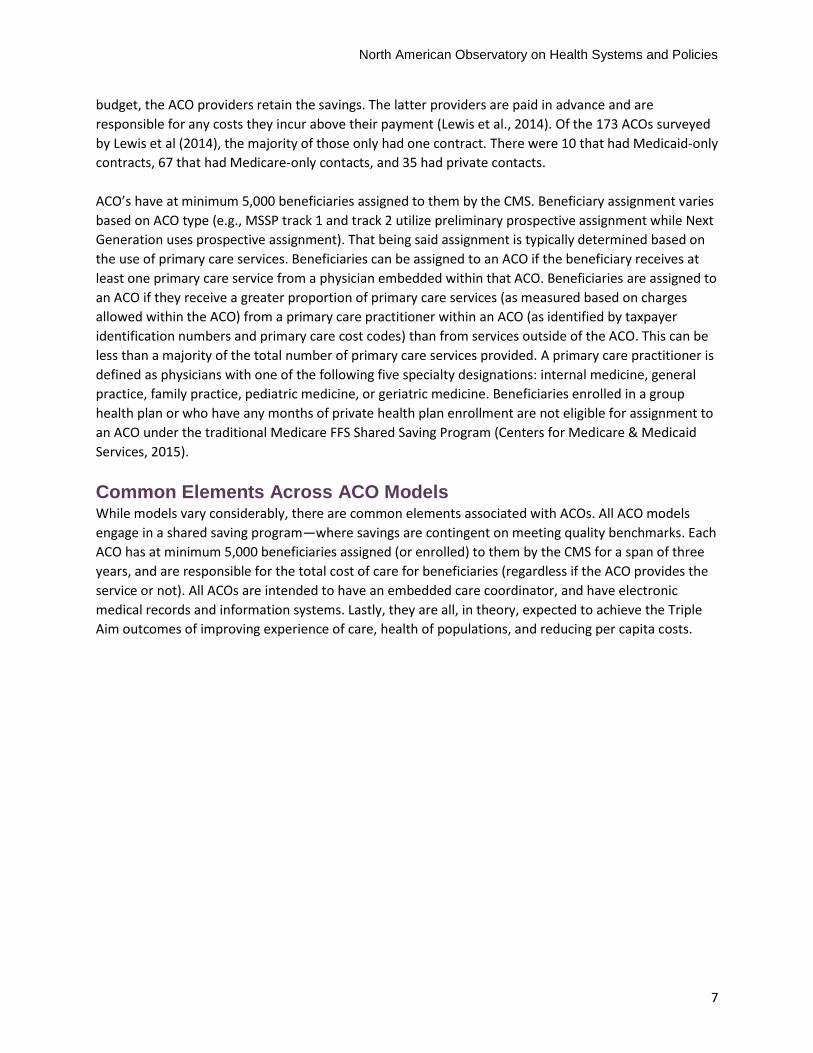
budget, the ACO providers retain the savings. The latter providers are paid in advance and are
responsible for any costs they incur above their payment (Lewis et al., 2014). Of the 173 ACOs surveyed
by Lewis et al (2014), the majority of those only had one contract. There were 10 that had Medicaid-only
contracts, 67 that had Medicare-only contacts, and 35 had private contacts.
ACO’s have at minimum 5,000 beneficiaries assigned to them by the CMS. Beneficiary assignment varies
based on ACO type (e.g., MSSP track 1 and track 2 utilize preliminary prospective assignment while Next
Generation uses prospective assignment). That being said assignment is typically determined based on
the use of primary care services. Beneficiaries can be assigned to an ACO if the beneficiary receives at
least one primary care service from a physician embedded within that ACO. Beneficiaries are assigned to
an ACO if they receive a greater proportion of primary care services (as measured based on charges
allowed within the ACO) from a primary care practitioner within an ACO (as identified by taxpayer
identification numbers and primary care cost codes) than from services outside of the ACO. This can be
less than a majority of the total number of primary care services provided. A primary care practitioner is
defined as physicians with one of the following five specialty designations: internal medicine, general
practice, family practice, pediatric medicine, or geriatric medicine. Beneficiaries enrolled in a group
health plan or who have any months of private health plan enrollment are not eligible for assignment to
an ACO under the traditional Medicare FFS Shared Saving Program (Centers for Medicare & Medicaid
Services, 2015).
Common Elements Across ACO Models While models vary considerably, there are common elements associated with ACOs. All ACO models
engage in a shared saving program—where savings are contingent on meeting quality benchmarks. Each
ACO has at minimum 5,000 beneficiaries assigned (or enrolled) to them by the CMS for a span of three
years, and are responsible for the total cost of care for beneficiaries (regardless if the ACO provides the
service or not). All ACOs are intended to have an embedded care coordinator, and have electronic
medical records and information systems. Lastly, they are all, in theory, expected to achieve the Triple
Aim outcomes of improving experience of care, health of populations, and reducing per capita costs.
8
Table 1 Comparison of Public ACO Models in the United States
Model Type (Year
initiated/ended) Risk
Financial Risk and Shared Savings
Quality Performance
Standards (measure) – Four
Domains
Reporting Number of ACOs
Number of Beneficiaries
Medicare Shared Savings Program (2012-ongoing)
one sided
Share savings with the CMS up to a maximum of 50% (if quality
performance standards are met).
Patient /carer experience (7)
Care coordination (6) Preventative health (8)
Chronic disease Management (8)
After the close of every
performance year.
Designated compliance
official and a detailed
compliance plan.
460
Mean in 2018: 18,716
two- sided
Larger share of savings in exchange for sharing loses with CMS. Maximum 60% (if quality
performance standards are met)
101
Pioneer ACO Program
(2012-2016)
one
sided
Originally, less financial risk. Not responsible to pay CMS for any
losses during first contract period. As identified above
Quarterly Financial Reports, monthly
expenditure reports, and claims and claim line
feeds.
9 Mean in 2014:
35,494 two-
sided
Advanced Saving/payment
Model (2012-2015)
one sided
Share savings only with the CMS 50% (if quality performance
standards are met). As identified above
33 with 15
remaining
Between 4,000-13,000
two- sided
Larger share of savings in exchange for sharing loses with CMS. Maximum 60% (if quality
performance standards are met). The loss is calculated based on the difference between a benchmark
and the actual spending costs. The loss rate will not be less than 40%
and will not exceed 60%.
New/next Generation (2016-ongoing)
Providers take on higher levels of financial risk for greater rewards.
If spending exceeds benchmark 80-100% loss share rate. If spending is
below the benchmark 80-100% savings share rate.
Physicians eligible for 5% bonuses starting in 2019.
As identified above.
Quality score does not affect share rate but does affect spending benchmark (higher
quality = lower benchmark).
Quarterly Financial Reports, monthly
expenditure reports, and claims and claim line
feeds.
51 Unable to determine
Sources: Center for Medicare and Medicaid Services 2013, 2018a,2018b; Henry J Kaiser Family Foundation, 2018;
Muhlestein, 2015; Barnes et al. 2014; L&M Policy Research, 2016
North American Observatory on Health Systems and Policies
9
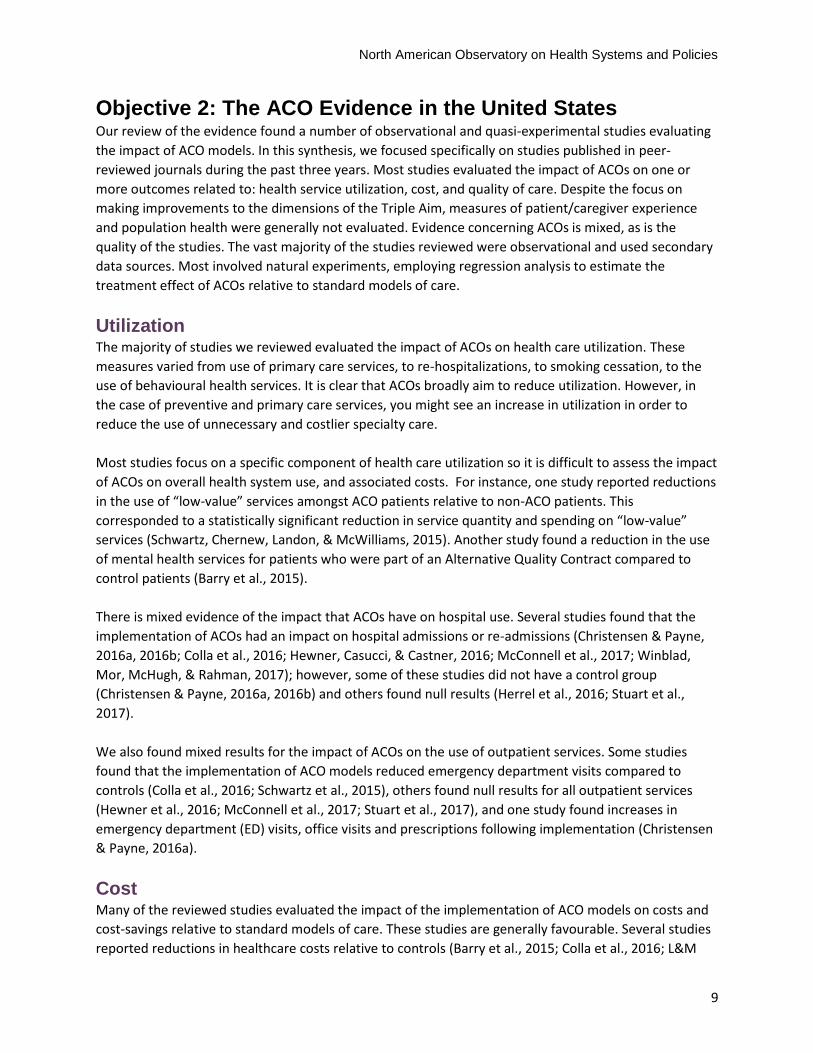
Objective 2: The ACO Evidence in the United States Our review of the evidence found a number of observational and quasi-experimental studies evaluating
the impact of ACO models. In this synthesis, we focused specifically on studies published in peer-
reviewed journals during the past three years. Most studies evaluated the impact of ACOs on one or
more outcomes related to: health service utilization, cost, and quality of care. Despite the focus on
making improvements to the dimensions of the Triple Aim, measures of patient/caregiver experience
and population health were generally not evaluated. Evidence concerning ACOs is mixed, as is the
quality of the studies. The vast majority of the studies reviewed were observational and used secondary
data sources. Most involved natural experiments, employing regression analysis to estimate the
treatment effect of ACOs relative to standard models of care.
Utilization The majority of studies we reviewed evaluated the impact of ACOs on health care utilization. These
measures varied from use of primary care services, to re-hospitalizations, to smoking cessation, to the
use of behavioural health services. It is clear that ACOs broadly aim to reduce utilization. However, in
the case of preventive and primary care services, you might see an increase in utilization in order to
reduce the use of unnecessary and costlier specialty care.
Most studies focus on a specific component of health care utilization so it is difficult to assess the impact
of ACOs on overall health system use, and associated costs. For instance, one study reported reductions
in the use of “low-value” services amongst ACO patients relative to non-ACO patients. This
corresponded to a statistically significant reduction in service quantity and spending on “low-value”
services (Schwartz, Chernew, Landon, & McWilliams, 2015). Another study found a reduction in the use
of mental health services for patients who were part of an Alternative Quality Contract compared to
control patients (Barry et al., 2015).
There is mixed evidence of the impact that ACOs have on hospital use. Several studies found that the
implementation of ACOs had an impact on hospital admissions or re-admissions (Christensen & Payne,
2016a, 2016b; Colla et al., 2016; Hewner, Casucci, & Castner, 2016; McConnell et al., 2017; Winblad,
Mor, McHugh, & Rahman, 2017); however, some of these studies did not have a control group
(Christensen & Payne, 2016a, 2016b) and others found null results (Herrel et al., 2016; Stuart et al.,
2017).
We also found mixed results for the impact of ACOs on the use of outpatient services. Some studies
found that the implementation of ACO models reduced emergency department visits compared to
controls (Colla et al., 2016; Schwartz et al., 2015), others found null results for all outpatient services
(Hewner et al., 2016; McConnell et al., 2017; Stuart et al., 2017), and one study found increases in
emergency department (ED) visits, office visits and prescriptions following implementation (Christensen
& Payne, 2016a).
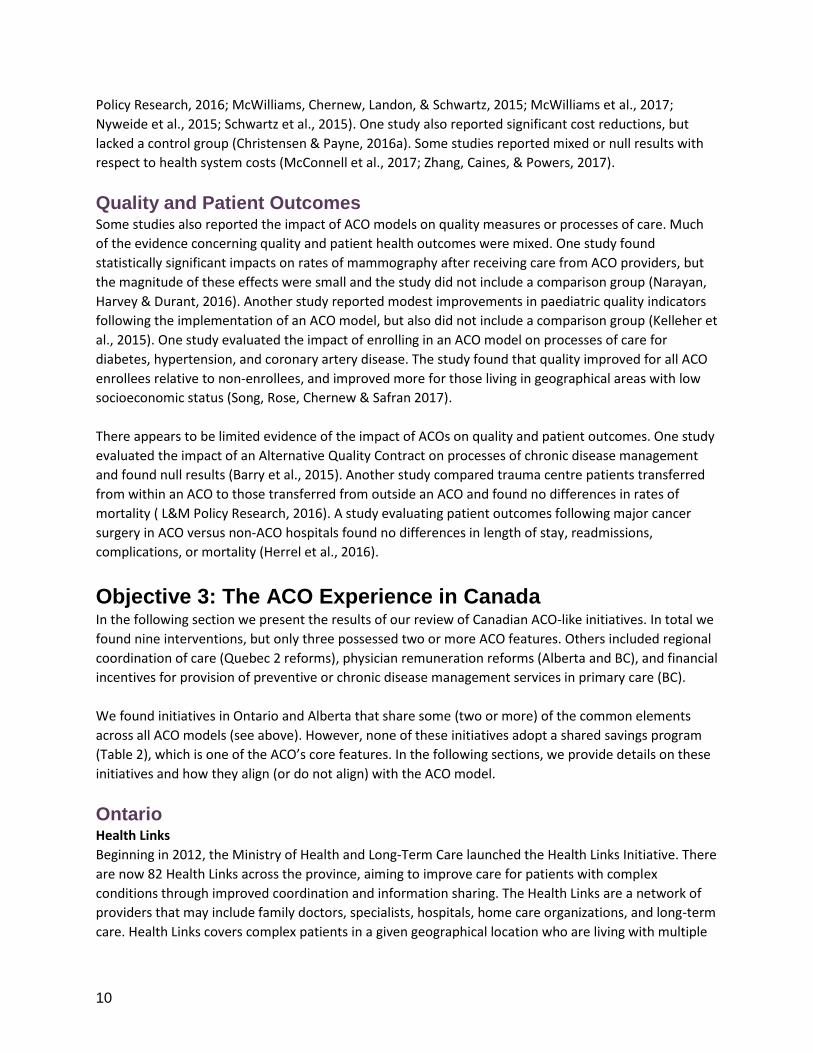
Cost Many of the reviewed studies evaluated the impact of the implementation of ACO models on costs and
cost-savings relative to standard models of care. These studies are generally favourable. Several studies
reported reductions in healthcare costs relative to controls (Barry et al., 2015; Colla et al., 2016; L&M
10
Policy Research, 2016; McWilliams, Chernew, Landon, & Schwartz, 2015; McWilliams et al., 2017;
Nyweide et al., 2015; Schwartz et al., 2015). One study also reported significant cost reductions, but
lacked a control group (Christensen & Payne, 2016a). Some studies reported mixed or null results with
respect to health system costs (McConnell et al., 2017; Zhang, Caines, & Powers, 2017).
Quality and Patient Outcomes Some studies also reported the impact of ACO models on quality measures or processes of care. Much
of the evidence concerning quality and patient health outcomes were mixed. One study found
statistically significant impacts on rates of mammography after receiving care from ACO providers, but
the magnitude of these effects were small and the study did not include a comparison group (Narayan,
Harvey & Durant, 2016). Another study reported modest improvements in paediatric quality indicators
following the implementation of an ACO model, but also did not include a comparison group (Kelleher et
al., 2015). One study evaluated the impact of enrolling in an ACO model on processes of care for
diabetes, hypertension, and coronary artery disease. The study found that quality improved for all ACO
enrollees relative to non-enrollees, and improved more for those living in geographical areas with low
socioeconomic status (Song, Rose, Chernew & Safran 2017).
There appears to be limited evidence of the impact of ACOs on quality and patient outcomes. One study
evaluated the impact of an Alternative Quality Contract on processes of chronic disease management
and found null results (Barry et al., 2015). Another study compared trauma centre patients transferred
from within an ACO to those transferred from outside an ACO and found no differences in rates of
mortality ( L&M Policy Research, 2016). A study evaluating patient outcomes following major cancer
surgery in ACO versus non-ACO hospitals found no differences in length of stay, readmissions,
complications, or mortality (Herrel et al., 2016).
Objective 3: The ACO Experience in Canada In the following section we present the results of our review of Canadian ACO-like initiatives. In total we
found nine interventions, but only three possessed two or more ACO features. Others included regional
coordination of care (Quebec 2 reforms), physician remuneration reforms (Alberta and BC), and financial
incentives for provision of preventive or chronic disease management services in primary care (BC).
We found initiatives in Ontario and Alberta that share some (two or more) of the common elements
across all ACO models (see above). However, none of these initiatives adopt a shared savings program
(Table 2), which is one of the ACO’s core features. In the following sections, we provide details on these
initiatives and how they align (or do not align) with the ACO model.
Ontario Health Links
Beginning in 2012, the Ministry of Health and Long-Term Care launched the Health Links Initiative. There
are now 82 Health Links across the province, aiming to improve care for patients with complex
conditions through improved coordination and information sharing. The Health Links are a network of
providers that may include family doctors, specialists, hospitals, home care organizations, and long-term
care. Health Links covers complex patients in a given geographical location who are living with multiple

North American Observatory on Health Systems and Policies
11
chronic diseases, mental illness and/or addictions. One of the providers of the Health Links is intended
to play a coordinator role (the degree to which this occurs and the success of this role remains unclear),
and each patient is supposed to have a coordinated care plan. One purpose of Health Links is to improve
communication and coordination between different providers to reduce gaps in care and duplication of
services. Health Links does not have access to shared electronic health records, shared savings
mechanisms, nor can we find specific mention of the intention to achieve Triple Aim goals.
Integrated Comprehensive Care Program—Bundled Care Demonstration Project
The Integrated Comprehensive Care program was the first team to pioneer the bundled care model in
Ontario in 2015. This approach is implemented in the Hamilton Niagara Haldimand Brant Local Health
Integration Network. This model targets three client groups (hip and knee replacement, lung cancer
surgery, and chronic conditions such as lung disease and heart failure). There is a team of care
coordinators that organize the client’s care from acute setting to community settings. The primary aim
of this demonstration project is to prevent readmissions and complications. Those members of the team
have a shared electronic health record and facilitate communication through the use of technology.
Alberta Primary Health Care Integration Network
The Primary Health Care (PHC) Integration Network connects zones of Alberta Health Services with
primary care networks, Strategic Clinical Networks, Alberta Health, and academic partners who work
together to make improvements to care transitions. In particular, the PHC Integration Network’s mission
is to make improvements in the domains of the Triple Aim by enhancing care transitions for persons at
risk of avoidable hospitalization and emergency department visits.
Table 2: Canadian ACO-like Models
Canadian ACO-like Models Features of ACO models
Prov.
Defined Population 1
Shared Savings 2
Network of providers 3
Electronic Health
Records 4
Embedded Care Coordination 5
Triple Aim
Goals 6
Health Links ON ✔ ✔ ✔
Integrated Comprehensive Care Demonstration Project (ICCP)
ON ✔
✔ ✔ ✔
Primary Health Care Integration Network
AB ✔ ✔
1. Providers in model share responsibility for coordinating care for a defined population of patients/clients. 2. Provider in model can retain savings generated through improved quality and efficiencies in care delivery. 3. Linkage of provider networks (e.g., physician groups, hospitals, other care provider organizations). 4. Patients and provider networks have access to shared electronic health (or at the very least medical) records. 5. embedded care coordinator that supports an individual through the care delivery system. 6. Mission of the model is to make improvements in all domains of the Triple Aim.

12
Health Links, and the ICCP both have defined populations they are intending to serve. The PHC
Integration network does not and it appears to take on a more general population focus working to
improve care transitions for all Albertans. All models are attempting to bring together networks of
providers, a common trend among many of the initiatives across Canada. Electronic health records that
span beyond traditional medical care remain underdeveloped across Canadian jurisdictions with small
jurisdiction specific initiatives growing (e.g., Champlain BASE eConsult Service, and Alberta Netcare e-
referral technology). Alberta seems to be the one province that is fully taking on the Triple Aim
outcomes and using them to promote integration, communication, and networks of providers.
Conclusion
With the possible exception of cost savings, the evidence for the effectiveness of ACO models remains
mixed. Two primary challenges appear to exist across Canada with respect to implementing ACO-like
models. First, access to and use of shared electronic health records continue to offer limited function
across the Canadian context. A challenge that becomes increasingly difficult for ACO-like models that are
attempting to span boundaries across health and social care divides. Second, care coordination
continues to remain a challenge across Canadian jurisdictions. While the ACO model was intended to
incentivise value based care, the incentive structure also has potential for unintended challenges where
providers and hospitals report incorrectly and attempt to attract low-risk patients to balance out
indicators.
At the same time, a shared savings program would permit publicly funded hospitals and provider
networks to generate revenue for themselves through savings and efficiencies in care delivery. This
would be novel in the Canadian context, where such savings would typically be returned to governments
and reallocated to other areas of public interest. It is unclear if and how accountability mechanisms
could be revised sufficiently in order to allow for this type of redistribution of public dollars.
North American Observatory on Health Systems and Policies
13
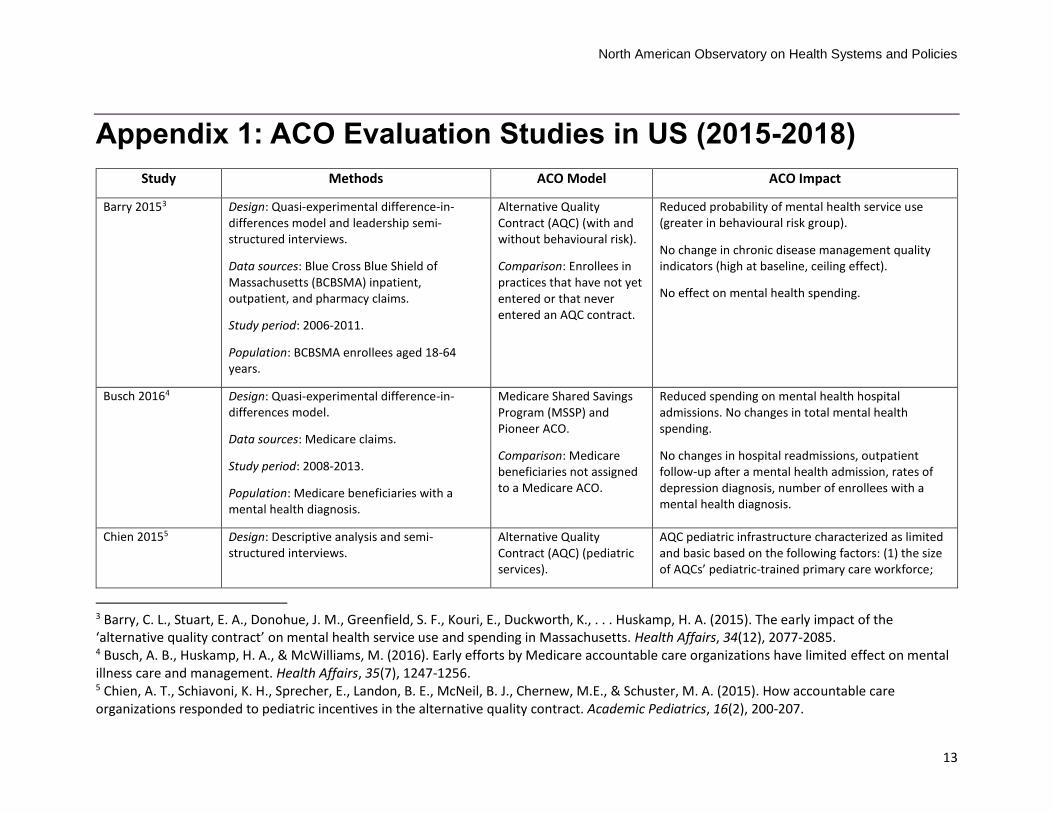
Appendix 1: ACO Evaluation Studies in US (2015-2018)
Study Methods ACO Model ACO Impact
Barry 20153
Design: Quasi-experimental difference-in-differences model and leadership semi-structured interviews.
Data sources: Blue Cross Blue Shield of Massachusetts (BCBSMA) inpatient, outpatient, and pharmacy claims.
Study period: 2006-2011.
Population: BCBSMA enrollees aged 18-64 years.
Alternative Quality Contract (AQC) (with and without behavioural risk).
Comparison: Enrollees in practices that have not yet entered or that never entered an AQC contract.
Reduced probability of mental health service use (greater in behavioural risk group).
No change in chronic disease management quality indicators (high at baseline, ceiling effect).
No effect on mental health spending.
Busch 20164
Design: Quasi-experimental difference-in-differences model.
Data sources: Medicare claims.
Study period: 2008-2013.
Population: Medicare beneficiaries with a mental health diagnosis.
Medicare Shared Savings Program (MSSP) and Pioneer ACO.
Comparison: Medicare beneficiaries not assigned to a Medicare ACO.
Reduced spending on mental health hospital admissions. No changes in total mental health spending.
No changes in hospital readmissions, outpatient follow-up after a mental health admission, rates of depression diagnosis, number of enrollees with a mental health diagnosis.
Chien 20155 Design: Descriptive analysis and semi-structured interviews.
Alternative Quality Contract (AQC) (pediatric services).
AQC pediatric infrastructure characterized as limited and basic based on the following factors: (1) the size of AQCs’ pediatric-trained primary care workforce;
3 Barry, C. L., Stuart, E. A., Donohue, J. M., Greenfield, S. F., Kouri, E., Duckworth, K., . . . Huskamp, H. A. (2015). The early impact of the ‘alternative quality contract’ on mental health service use and spending in Massachusetts. Health Affairs, 34(12), 2077-2085. 4 Busch, A. B., Huskamp, H. A., & McWilliams, M. (2016). Early efforts by Medicare accountable care organizations have limited effect on mental illness care and management. Health Affairs, 35(7), 1247-1256. 5 Chien, A. T., Schiavoni, K. H., Sprecher, E., Landon, B. E., McNeil, B. J., Chernew, M.E., & Schuster, M. A. (2015). How accountable care organizations responded to pediatric incentives in the alternative quality contract. Academic Pediatrics, 16(2), 200-207.

14
Data sources: Massachusetts Health Quality Partners 2011 Provider Database (MHQP-PD) and American Hospital Association 2009 Annual Survey Database (AHA-ASD).
Study period: 2009-2010.
Population: ACO medical and operational directors.
Comparison: None. (2) the range of pediatric-trained primary care providers’ pediatric subspecialist types; (3) the scope of AQC pediatric inpatient services.
Christensen 2016a6 Design: Retrospective cohort.
Data sources: Medicaid claims.
Study period: 2013-2015.
Population: Pediatric Medicaid enrollees at Children’s Hospitals and Clinics (CHC) of Minnesota.
Integrated Health Partnership (Pediatric Medicaid ACO).
Comparison: None.
Continuous receipt of pediatric primary care services from ACO for 2 years associated with reduced inpatient days, but increase in office visits, emergency department visits, and use of pharmaceuticals.
Changes in health service utilization were mirrored by cost reductions.
Christensen 2016b7 Design: Retrospective cohort.
Data sources: Medicaid claims.
Study period: 2013-2015.
Population: Pediatric Medicaid enrollees at Children’s Hospitals and Clinics (CHC) of Minnesota (< 20 years of age).
Integrated Health Partnership (Pediatric Medicaid ACO).
Comparison: None.
Continuous receipt of pediatric primary care services from ACO for 2 years associated with reduced 30-day readmission rate at hospitals other than the discharging hospital, but not the discharging hospital.
Reduction in the cost per inpatient episode of care for all patients.
Colla 20168 Design: Quasi-experimental difference-in-differences model.
Medicare Shared Savings Program (MSSP).
Reduction in beneficiary-level spending in ACO Medicare beneficiaries and clinically vulnerable subgroup.
6 Christensen, E. W., & Payne, N. R. (2016a). Effect of attribution length on the use and cost of health care for a pediatric Medicaid accountable care organization. JAMA Pediatrics, 170(2), 148-154. 7 Christensen, E. W., & Payne, N. R. (2016b). Pediatric inpatient readmissions in an accountable care organization. The Journal of Pediatrics, 170, 113-119. 8 Colla, C. H., Lewis, V. A., Kao, L. S., O’Malley, J., Chang, C. H., & Fisher, E. S. (2016). Association between Medicare accountable care organization implementation and spending among clinically vulnerable beneficiaries. JAMA Internal Medicine, 176(8), 1167-1175.
North American Observatory on Health Systems and Policies
15
Data sources: Medicare claims.
Study period: 2009-2013.
Population: Medicare beneficiaries (general) and clinically-vulnerable subgroup (at least 3 hierarchical condition categories, HCC).
Comparison: Medicare beneficiaries not assigned to a Medicare ACO.
Reduction in hospitalizations, emergency department visits in both general and clinically-vulnerable ACO groups.
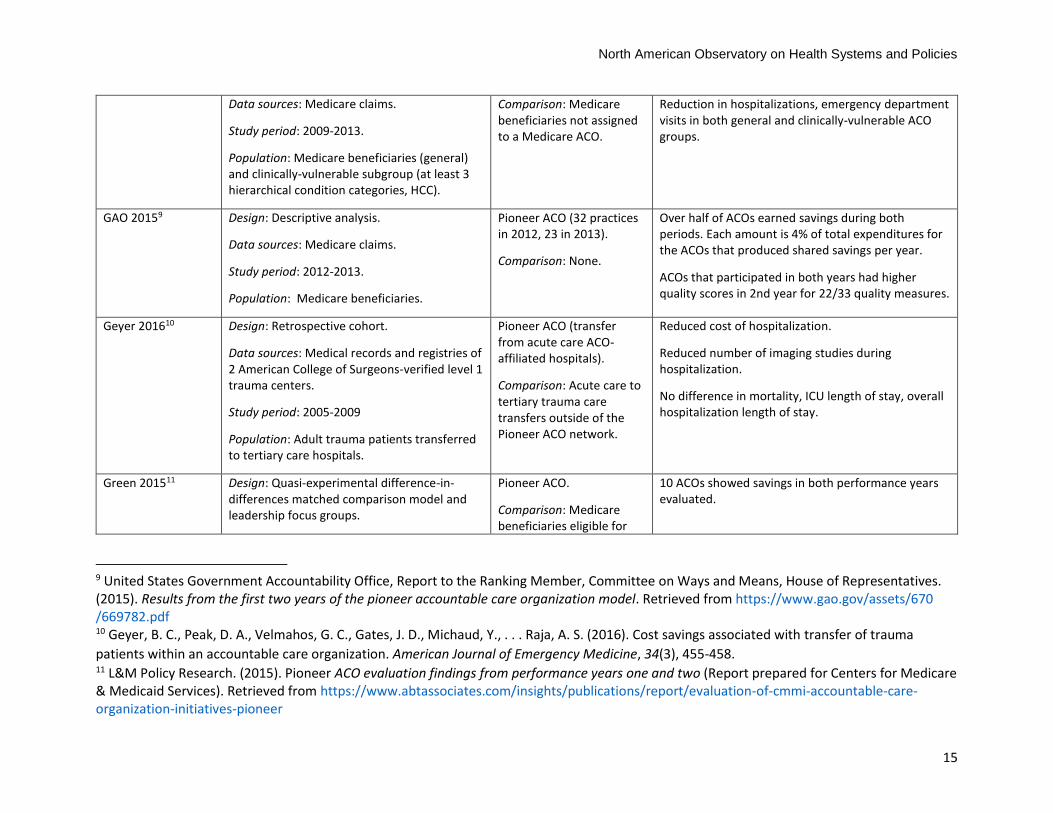
GAO 20159
Design: Descriptive analysis.
Data sources: Medicare claims.
Study period: 2012-2013.
Population: Medicare beneficiaries.
Pioneer ACO (32 practices in 2012, 23 in 2013).
Comparison: None.
Over half of ACOs earned savings during both periods. Each amount is 4% of total expenditures for the ACOs that produced shared savings per year.
ACOs that participated in both years had higher quality scores in 2nd year for 22/33 quality measures.
Geyer 201610 Design: Retrospective cohort.
Data sources: Medical records and registries of 2 American College of Surgeons-verified level 1 trauma centers.
Study period: 2005-2009
Population: Adult trauma patients transferred to tertiary care hospitals.
Pioneer ACO (transfer from acute care ACO-affiliated hospitals).
Comparison: Acute care to tertiary trauma care transfers outside of the Pioneer ACO network.
Reduced cost of hospitalization.
Reduced number of imaging studies during hospitalization.
No difference in mortality, ICU length of stay, overall hospitalization length of stay.
Green 201511 Design: Quasi-experimental difference-in-differences matched comparison model and leadership focus groups.
Pioneer ACO.
Comparison: Medicare beneficiaries eligible for
10 ACOs showed savings in both performance years evaluated.
9 United States Government Accountability Office, Report to the Ranking Member, Committee on Ways and Means, House of Representatives. (2015). Results from the first two years of the pioneer accountable care organization model. Retrieved from https://www.gao.gov/assets/670 /669782.pdf 10 Geyer, B. C., Peak, D. A., Velmahos, G. C., Gates, J. D., Michaud, Y., . . . Raja, A. S. (2016). Cost savings associated with transfer of trauma
patients within an accountable care organization. American Journal of Emergency Medicine, 34(3), 455-458. 11 L&M Policy Research. (2015). Pioneer ACO evaluation findings from performance years one and two (Report prepared for Centers for Medicare & Medicaid Services). Retrieved from https://www.abtassociates.com/insights/publications/report/evaluation-of-cmmi-accountable-care-organization-initiatives-pioneer

16
Data sources: Medicare claims.
Study period: 2012-2013.
Population: Medicare beneficiaries.
but not assigned to Pioneer or MSSP ACO.
Green 201612
Design: Quasi-experimental difference-in-differences model, key informant interviews, and physician surveys.
Data sources: Medicare claims.
Study period: 2012-2014.
Population: Medicare beneficiaries.
Advance Payment (AP) ACO (20 practices in 2012, 36 in 2013).
Comparison: Medicare beneficiaries in the AP ACO market, not assigned to any Medicare ACO.
No significant change in quality indicators or Medicare spending.
More AP ACO physicians were involved in the decision to participate in an ACO model. Compared to physicians in non-AP ACO models, more AP ACO-involved physicians agreed that the ACO model is effective at providing high-quality cost-effective care and that staying competitive in the local market is important .
Herrell 201613 Design: Quasi-experimental difference-in-differences matched comparison model and leadership semi-structured interviews.
Data sources: Medicare claims, American Hospital Association Annual Survey, Medicare Provider Analysis and Review (MEDPAR) file.
Study period: 2011-2013.
Population: Medicare beneficiaries aged 65 years and older undergoing major surgical resection for colorectal, bladder, esophageal, kidney, liver, ovarian, pancreatic, lung, or prostate cancer.
Medicare Shared Savings Program (MSSP).
Comparison: Acute care and critical access hospitals not affiliated with ACO.
No difference in 30-day mortality rate, complication rate, prolonged length of stay rate, and adverse perioperative outcomes.
12 L&M Policy Research. (2016). Advance payment ACO final report (Report prepared for Centers for Medicare & Medicaid Services). Retrieved from https://innovation.cms.gov/Files/reports/advpayaco-fnevalrpt.pdf 13 Herrell, L. A., Norton, E. C., Hawken, S. R., Ye, Z., Hollenbeck, B. K., & Miller, D. C. (2016). Early impact of Medicare accountable care
organizations on cancer surgery outcomes. Cancer, 122(17), 2739-2746.
North American Observatory on Health Systems and Policies
17
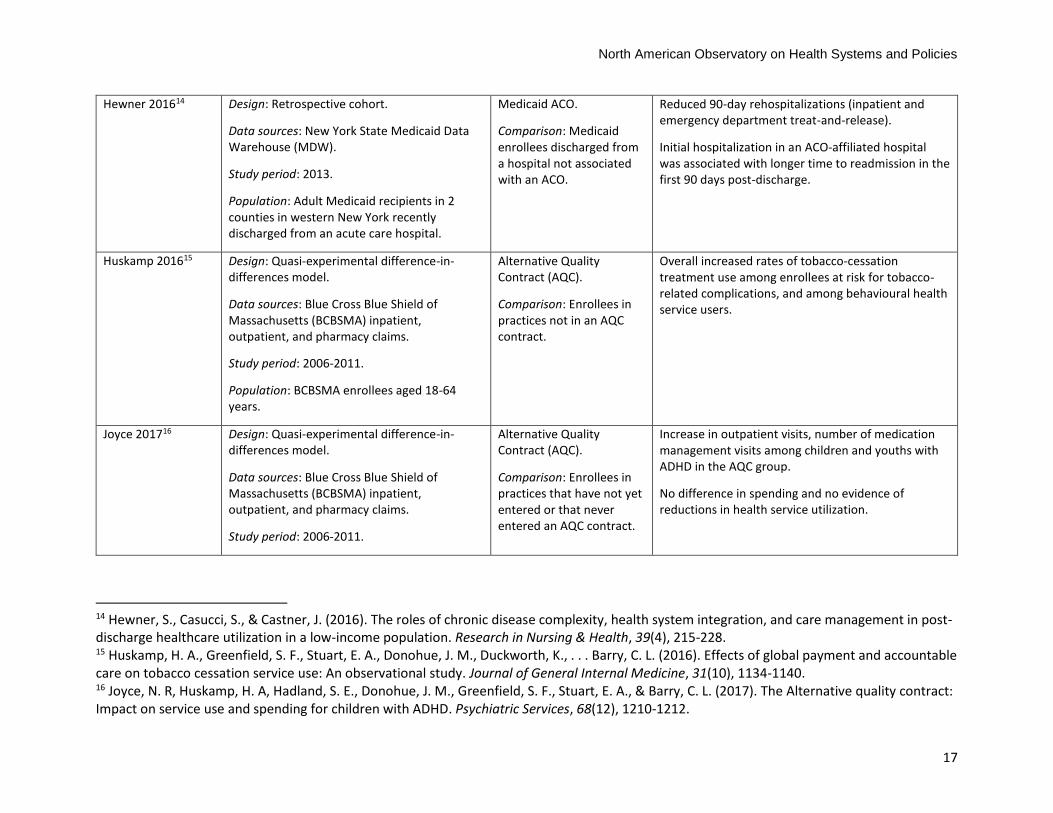
Hewner 201614 Design: Retrospective cohort.
Data sources: New York State Medicaid Data Warehouse (MDW).
Study period: 2013.
Population: Adult Medicaid recipients in 2 counties in western New York recently discharged from an acute care hospital.
Medicaid ACO.
Comparison: Medicaid enrollees discharged from a hospital not associated with an ACO.
Reduced 90-day rehospitalizations (inpatient and emergency department treat-and-release).
Initial hospitalization in an ACO-affiliated hospital was associated with longer time to readmission in the first 90 days post-discharge.
Huskamp 201615 Design: Quasi-experimental difference-in-differences model.
Data sources: Blue Cross Blue Shield of Massachusetts (BCBSMA) inpatient, outpatient, and pharmacy claims.
Study period: 2006-2011.
Population: BCBSMA enrollees aged 18-64 years.
Alternative Quality Contract (AQC).
Comparison: Enrollees in practices not in an AQC contract.
Overall increased rates of tobacco-cessation treatment use among enrollees at risk for tobacco-related complications, and among behavioural health service users.
Joyce 201716 Design: Quasi-experimental difference-in-differences model.
Data sources: Blue Cross Blue Shield of Massachusetts (BCBSMA) inpatient, outpatient, and pharmacy claims.
Study period: 2006-2011.
Alternative Quality Contract (AQC).
Comparison: Enrollees in practices that have not yet entered or that never entered an AQC contract.
Increase in outpatient visits, number of medication management visits among children and youths with ADHD in the AQC group.
No difference in spending and no evidence of reductions in health service utilization.
14 Hewner, S., Casucci, S., & Castner, J. (2016). The roles of chronic disease complexity, health system integration, and care management in post-discharge healthcare utilization in a low-income population. Research in Nursing & Health, 39(4), 215-228. 15 Huskamp, H. A., Greenfield, S. F., Stuart, E. A., Donohue, J. M., Duckworth, K., . . . Barry, C. L. (2016). Effects of global payment and accountable care on tobacco cessation service use: An observational study. Journal of General Internal Medicine, 31(10), 1134-1140. 16 Joyce, N. R, Huskamp, H. A, Hadland, S. E., Donohue, J. M., Greenfield, S. F., Stuart, E. A., & Barry, C. L. (2017). The Alternative quality contract: Impact on service use and spending for children with ADHD. Psychiatric Services, 68(12), 1210-1212.
18
Population: BCBSMA enrollees aged 20 years and younger diagnosed with attention-deficit and hyperactivity disorder (ADHD).
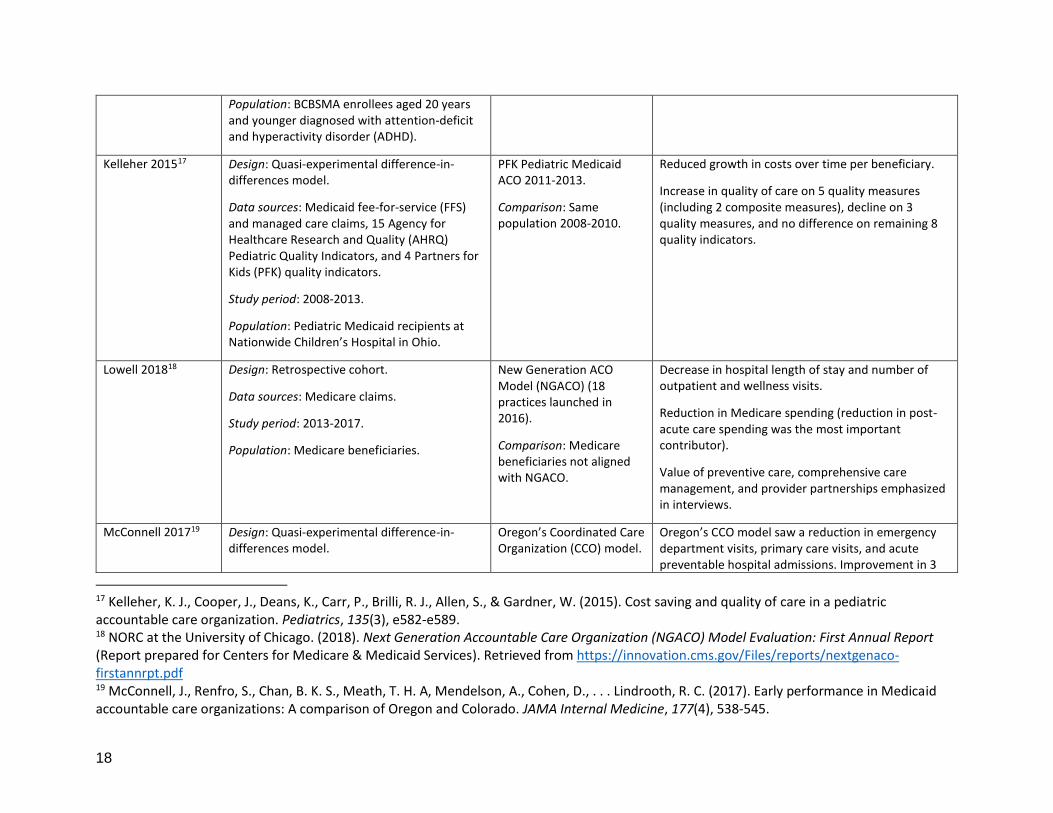
Kelleher 201517 Design: Quasi-experimental difference-in-differences model.
Data sources: Medicaid fee-for-service (FFS) and managed care claims, 15 Agency for Healthcare Research and Quality (AHRQ) Pediatric Quality Indicators, and 4 Partners for Kids (PFK) quality indicators.
Study period: 2008-2013.
Population: Pediatric Medicaid recipients at Nationwide Children’s Hospital in Ohio.
PFK Pediatric Medicaid ACO 2011-2013.
Comparison: Same population 2008-2010.
Reduced growth in costs over time per beneficiary.
Increase in quality of care on 5 quality measures (including 2 composite measures), decline on 3 quality measures, and no difference on remaining 8 quality indicators.
Lowell 201818
Design: Retrospective cohort.
Data sources: Medicare claims.
Study period: 2013-2017.
Population: Medicare beneficiaries.
New Generation ACO Model (NGACO) (18 practices launched in 2016).
Comparison: Medicare beneficiaries not aligned with NGACO.
Decrease in hospital length of stay and number of outpatient and wellness visits.
Reduction in Medicare spending (reduction in post-acute care spending was the most important contributor).
Value of preventive care, comprehensive care management, and provider partnerships emphasized in interviews.
McConnell 201719 Design: Quasi-experimental difference-in-differences model.
Oregon’s Coordinated Care Organization (CCO) model.
Oregon’s CCO model saw a reduction in emergency department visits, primary care visits, and acute preventable hospital admissions. Improvement in 3
17 Kelleher, K. J., Cooper, J., Deans, K., Carr, P., Brilli, R. J., Allen, S., & Gardner, W. (2015). Cost saving and quality of care in a pediatric accountable care organization. Pediatrics, 135(3), e582-e589. 18 NORC at the University of Chicago. (2018). Next Generation Accountable Care Organization (NGACO) Model Evaluation: First Annual Report (Report prepared for Centers for Medicare & Medicaid Services). Retrieved from https://innovation.cms.gov/Files/reports/nextgenaco-firstannrpt.pdf 19 McConnell, J., Renfro, S., Chan, B. K. S., Meath, T. H. A, Mendelson, A., Cohen, D., . . . Lindrooth, R. C. (2017). Early performance in Medicaid accountable care organizations: A comparison of Oregon and Colorado. JAMA Internal Medicine, 177(4), 538-545.

North American Observatory on Health Systems and Policies
19
Data sources: Medicaid claims.
Study period: 2010-2014.
Population: Oregon and Colorado Medicaid beneficiaries.
Comparison: Colorado Accountable Care Collaborative (ACC).
of 4 measures of access and 1 of 4 measures of appropriateness of care were also observed.
Oregon’s and Colorado’s Medicaid ACO models exhibited similar performance on standardized expenditures for selected services. Oregon’s model, marked by a large federal investment and movement to global budgets, was associated with improvements in some measures of utilization, access, and quality.
McWilliams 201520 Design: Quasi-experimental difference-in-differences model.
Data sources: Medicare claims.
Study period: 2009-2012.
Population: Medicare beneficiaries.
Pioneer ACOs.
Comparison: Local non-participating providers.
Reduction in spending; savings greater in ACOs with higher-than-local average baseline spending than in those with lower-than-local average baseline spending. Similar savings in ACOs with financial integration between hospitals and physician groups and those without, as well as between ACOs that withdrew from the program and those that did not.
McWilliams 201621 Design: Quasi-experimental difference-in-differences model.
Data sources: Medicare claims.
Study period: 2009-2013.
Population: Medicare beneficiaries.
Medicare Shared Savings Program (MSSP).
Comparison: Medicare beneficiaries not aligned with ACO.
Increased total and per beneficiary savings; savings consistently greater in independent primary care groups than in hospital-integrated groups among 2012 and 2013 MSSP entrants.
No difference on the use of low-value services. But Improvement on some quality indicators.
McWilliams 201722 Design: Descriptive analysis.
Data sources: Medicare claims.
Medicare Shared Savings Program (MSSP).
Reduction in post-acute spending driven by reductions in acute inpatient care, discharges to facilities other than home, and length of skilled nursing facility (SNF) stays.
20 McWilliams, J. M., Chernew, M. E., Landon, B. E., & Schwartz, A. L. (2015). Performance differences in year 1 of pioneer accountable care organizations. New England Journal of Medicine, 372(20), 1927-1936. 21 McWilliams, J. M., Hatfield, L. A., Chernew, M. E., Landon, B. E., & Schwartz, A. L. (2016). Early performance of accountable care organizations in Medicare. New England Journal of Medicine, 374(24), 2357-2366. 22McWilliams, J. M., Gilstrap, L. G., Stevenson, D. G., Chernew, M. E., Huskamp, H. A., & Grabowski, D. C. (2017). Changes in postacute care in the Medicare Shared Savings Program. JAMA Internal Medicine, 177(4), 518-526.

20
Study period: 2009-2014.
Population: Medicare beneficiaries.
Comparison: Medicare beneficiaries not aligned with ACO.
No difference in 30-day readmissions, use of highly rated SNF, or mortality.
McWilliams 201823
Design: Descriptive analysis.
Data sources: Medicare claims.
Study period: 2015-2016.
Population: Medicare beneficiaries.
ACO Investment Model (AIM) (47 practices in 36 states during study period).
Comparison: None.
Reduction in beneficiary-level and aggregate Medicare spending.
Reduction in spending mirrored by reduced acute care inpatient visits, reduced post-acute care days, reduced emergency visits.
Muhlestein 201624 Design: Descriptive analysis.
Data sources: Medicare claims, Medicare’s
acute Inpatient Prospective Payment Systems (IPPS) final rule data files, and Leavitt
Partners ACO database.
Study period: 2013-2016.
Population: Nationwide hospitals.
Hospitals that became Medicare or commercial ACOs.
Comparison: Hospitals that did not become Medicare or commercial ACOs.
ACO hospitals performed better on the Hospital Readmissions Reduction Program (HRRP), but not on the Hospital Value-Based Purchasing Program (HVBP) or the Hospital-Acquired Conditions (HAC) Reduction Program. Hospitals joining ACOs did increasingly better than their peers on the HRRP, but had inconsistent results year-over-year with the HVBP.
Narayan 201625
Design: Retrospective cohort.
Data sources: Medicare claims.
Study period: 2012-2014.
Population: Screen-eligible female enrollees aged 40-69 years.
Medicare Shared Savings Program (MSSP) (208 practices enrolled for >1 year during study period).
Comparison: None.
Increase in biennial mammography utilization (ACO-20 quality indicator), but no correlation with overall ACO-composite quality score.
No difference in mammography utilization between ACOs that showed cost savings and those that did not.
23 Abt Associates. (2018). Evaluation of the accountable care organization investment model: AIM impacts in the first performance year (Report prepared for Centers for Medicare & Medicaid Services). Retrieved from https://innovation.cms.gov/Files/reports/aim-firstannrpt.pdf 24 Muhlestein, D., Tu, T., de Lisle, K., & Merrill, T. (2016). Hospital participation in ACOs associated with other value-based program improvement. American Journal of Managed Care, 22(7), e241-e248. 25 Narayan, A. K., Harvey, S. C., Durand, D. J. (2017). Impact of Medicare shared savings program accountable care organizations at screening mammography: A retrospective cohort study. Radiology, 282(2), 437-442.

North American Observatory on Health Systems and Policies
21
Nyweide 201526
Design: Quasi-experimental difference-in-differences model.
Data sources: Medicare claims.
Study period: 2010-2013.
Population: Medicare beneficiaries with full Part A and B coverage.
Pioneer ACO.
Comparison: Medicare beneficiaries in the same markets, eligible but not assigned to Pioneer ACO.
Reduced utilization of physician services, emergency department, and post-acute care.
Lower rate of spending increase (per beneficiary and aggregate).
Higher mean score for timely care and clinician communication.
Peiris 201627 Design: Descriptive analysis.
Data sources: National Survey of Accountable Care Organizations (NSACO), matched with publicly reported Medicare performance data (Medicare ACOs only).
Study period: 2012-2015.
Population: 399 ACOs surveyed by NSACO.
Commercial ACO – an ACO that had at least one contract with a private payer (with or without Medicare or Medicaid contracts).
Comparison: Non-commercial ACO – an ACO that had contracts only with Medicare, Medicaid, or both.
Compared to non-commercial ACOs, commercial ACOs tended to have a higher degree of engagement in disease-monitoring activities, have taken action in the areas of care processes, unnecessary hospitalizations, and specialist referral processes. More commercial ACOs were investing in processes to reduce emergency department use and taking steps to reduce overuse of health services identified by Choosing Wisely (ABIM-affiliated campaign aimed at reducing unnecessary tests and treatments in health care) as having low value.
Schwartz 201528
Design: Quasi-experimental difference-in-differences model.
Data sources: Medicare claims.
Study period: 2009-2012.
Population: Medicare beneficiaries with full Part A and B coverage.
Pioneer ACO.
Comparison: Medicare beneficiaries attributed to other healthcare providers.
Reduced utilization of low-value services (low to no clinical benefit).
Reduced spending on low-value services.
26 Nyweide, D. J, Lee, W., Cuerdon, T. T., Pham, H. H., Cox, M., Rajkumar, R., & Conway, P.H. (2015). Association of pioneer accountable care organizations vs traditional Medicare fee for service with spending, utilization, and patient experience. JAMA, 213(21), 2152-2161. 27 Peiris, D., Phipps-Taylor, M. C., Stachowski, C. A., Kao, L. S., Shortell, S. M., . . . Colla, C.H. (2016). ACOs holding commercial contracts are larger and more efficient than noncommercial ACOs. Health Affairs, 35(10), 1849-1856. 28 Schawrtz, A. L., Chernew, M. E., Landon, B. E., & McWilliams, J. M. (2015). Changes in low-value services in year 1 of the Medicare Pioneer accountable care organization program. JAMA Internal Medicine, 175(11), 1815-1825.
22
Shortell 201529 Design: National survey with semi-structured interviews and site visits.
Data sources: National Survey of Patient Activation and Engagement (PAE).
Study period: 2012-2014.
Population: Nation-wide ACOs.
Nation-wide ACOs (regardless of payer or institution type).
Comparison: None.
Greater ACO use of PAE activities at the point-of-care may influence more positive leadership perceptions of the impact of PAE investments on ACO costs, quality, and outcomes of care. Important practices associated with greater PAE include high-level leadership commitment, goal-setting supported by adequate resources, extensive provider training and use of inter-disciplinary care teams, and frequent monitoring and reporting on progress.
Song 201730 Design: Descriptive analysis.
Data sources: Blue Cross Blue Shield of Massachusetts (BCBSMA) claims and American Community Survey from the Census Bureau.
Study period: 2006-2012.
Population: BCBSMA enrollees.
Alternative Quality Contract (AQC).
Comparison: Enrollees in practices not part of an AQC contract.
Improvement in process-related quality indicators, with greater improvement in areas with lower socioeconomic status compared to those with higher socioeconomic status.
No difference in spending or health outcomes, such as hemoglobin A1c, low-density lipoprotein cholesterol, and blood pressure targets in patients with diabetes, coronary heart disease, and hypertension, respectively.
Stuart 201731
Design: Quasi-experimental difference-in-differences model.
Data sources: Blue Cross Blue Shield of Massachusetts (BCBSMA) inpatient, outpatient, and pharmacy claims.
Study period: 2006-2011.
Alternative Quality Contract (AQC) (with and without behavioural risk).
Comparison: Enrollees in practices that have not yet entered or that never entered an AQC contract.
With behavioural risk: no change in substance-use disorder (SUD) service utilization, SUD spending, or SUD performance metrics.
Without behavioural risk: increase in SUD services, reduction in SUD medication use, mixed SUD performance metrics changes.
29 Shortell, S. M., Sehgal, N. J., Bibi, S., Ramsay, P. P., Neuhauser, L., Colla, C. H., & Lewis, V. A. (2015). An early assessment of accountable care organizations’ efforts to engage patients and their families. Medical Care Research and Review, 72(5), 580-604. 30 Song, Z., Rose, S., Chernew, M. E., & Safran, D. G. (2017). Lower- versus higher-income populations in the alternative quality contract: Improved quality and similar spending. Health Affairs, 36(1), 74-82. 31 Stuart, E. A., Barry, C. L., Donohue, J. M., Greenfield, S. F., Duckworth, K., Song, Z., . . . Mechanic R. (2017). Effects of accountable care and payment reform on substance use disorder treatment: Evidence from the initial three years of the alternative quality contract. Addiction, 112(1), 124-133.
North American Observatory on Health Systems and Policies
23
Population: BCBSMA enrollees aged 13-64 years (at least 1 year of enrollment).
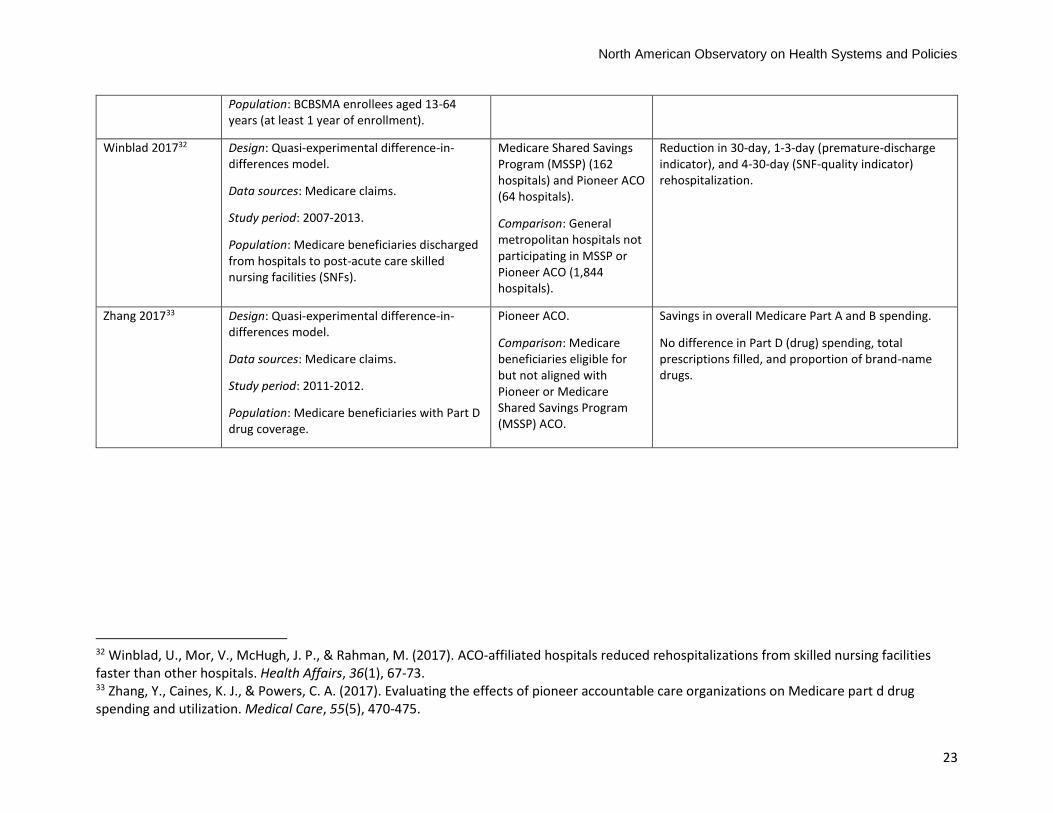
Winblad 201732 Design: Quasi-experimental difference-in-differences model.
Data sources: Medicare claims.
Study period: 2007-2013.
Population: Medicare beneficiaries discharged from hospitals to post-acute care skilled nursing facilities (SNFs).
Medicare Shared Savings Program (MSSP) (162 hospitals) and Pioneer ACO (64 hospitals).
Comparison: General metropolitan hospitals not participating in MSSP or Pioneer ACO (1,844 hospitals).
Reduction in 30-day, 1-3-day (premature-discharge indicator), and 4-30-day (SNF-quality indicator) rehospitalization.
Zhang 201733
Design: Quasi-experimental difference-in-differences model.
Data sources: Medicare claims.
Study period: 2011-2012.
Population: Medicare beneficiaries with Part D drug coverage.
Pioneer ACO.
Comparison: Medicare beneficiaries eligible for but not aligned with Pioneer or Medicare Shared Savings Program (MSSP) ACO.
Savings in overall Medicare Part A and B spending.
No difference in Part D (drug) spending, total prescriptions filled, and proportion of brand-name drugs.
32 Winblad, U., Mor, V., McHugh, J. P., & Rahman, M. (2017). ACO-affiliated hospitals reduced rehospitalizations from skilled nursing facilities faster than other hospitals. Health Affairs, 36(1), 67-73. 33 Zhang, Y., Caines, K. J., & Powers, C. A. (2017). Evaluating the effects of pioneer accountable care organizations on Medicare part d drug spending and utilization. Medical Care, 55(5), 470-475.

24
References
Alderwick, H., Shortell, S. M., Briggs, A. D., & Fisher, E. S. (2018). Can accountable care organizations really improve the English NHS? Lessons from the United States. British Medical Journal, 360(K921), 1-5. doi:10.1136/BMJ.K921
Barnes, A., Unruh, L., Chukmaitov, A., & van Ginneken, E. (2014). Accountable care organizations in the
USA: Types, developments and challenges. Health Policy, 118(1), 1-7. doi: 10.1016/j.healthpol
.2014.07.019
Barry, C. L., Stuart, E. A., Donohue, J. M., Greenfield, S. F., Kouri, E., Duckworth, K., . . . Huskamp, H. A.
(2015). The early impact of the ‘Alternative Quality Contract’ on mental health service use and
spending in Massachusetts. Health Affairs, 34(12), 2077-2085. doi: 10.1377/hlthaff.2015.0685
Centers for Medicare & Medicaid Services. (2011). Medicare physician group practice demonstration.
Retrieved from https://innovation.cms.gov/Files/Migrated-Medicare-Demonstration-
x/PGP_Fact_Sheet.pdf
Centers for Medicare & Medicaid Services. (2013). Accountable care organizations (ACOs): General
information. Retrieved from http://innovation.cms.gov/initiatives/aco/
Centers for Medicare & Medicaid Services. (2015). Medicare shared saving and losses and assignment
methodology. Retrieved from https://www.cms.gov/Medicare/Medicare-Fee-for-Service-
Payment/sharedsavingsprogram/Downloads/Shared-Savings-Losses-Assignment-Spec-V4.pdf
Centers for Medicare & Medicaid Services. (2018a). Pioneer ACO model. Retrieved from https:
//innovation.cms.gov/initiatives/Pioneer-ACO-Model/
Centers for Medicare & Medicaid Services. (2018b). Shared savings program fast facts. Retrieved from
https://www.cms.gov/Medicare/Medicare-Fee-for-Service-Payment/sharedsavingsprogram
/program-data.html
Christensen, E. W., & Payne, N. R. (2016a). Effect of attribution length on the use and cost of health care
for a pediatric Medicaid accountable care organization. JAMA Pediatrics, 170(2), 148-154. doi:
10.1001/jamapediatrics.2015.3446
Christensen, E. W., & Payne, N. R. (2016b). Pediatric inpatient readmissions in an accountable care
organization. The Journal of Pediatrics, 170, 113-119. doi: 10.1016/j.jpeds.2015.11.022
Colla, C. H., Lewis, V. A., Kao, L.-S., O’Malley, A. J., Chang, C.-H., & Fisher, E. S. (2016). Association
between Medicare accountable care organization implementation and spending among
clinically vulnerable beneficiaries. JAMA Internal Medicine, 176(8), 1167-1175. doi: 10.1001
/jamainternmed.2016.2827
Conference of Provincial/Territorial Ministers of Health. (1997). A renewed vision for Canada's health system. Winnipeg, MB.
Fisher, E. S., Shortell, S. M., Kreindler, S. A., Van Citters, A. D., & Larson, B. K. (2012). A framework for
evaluating the formation, implementation, and performance of accountable care organizations.
Health Affairs, 31(11), 2368-2378. doi: 10.1377/hlthaff.2012.0544
Geyer, B. C., Peak, D. A., Velmahos, G. C., Gates, J. D., Michaud, Y., Petrovick, L., . . . Raja, A. S. (2016).
Cost savings associated with transfer of trauma patients within an accountable care
organization. The American Journal of Emergency Medicine, 34(3), 455-458. doi: 10.1016
/j.ajem.2015.11.067
North American Observatory on Health Systems and Policies
25
Guta, A., Wilson, M., & Lavis, J. N. (2016). Rapid Synthesis: Examining the impacts of accountable care
organizations on patient experience, population health and costs. Retrieved from https://www.mcmasterforum.org/docs/default-source/product-documents/rapid-responses/examining-the-impacts-of-accountable-care-organizations-on-patient-experience-population-health-and-costs.pdf?sfvrsn=2
Health Canada. (2014). Royal Commission on Health Services 1961-1964. Retrieved from https://www .canada.ca/en/health-canada/services/health-care-system/commissions-inquiries/federal-commissions-health-care/royal-commission-health-services.html
Henry J Kaiser Family Foundation. (2018). Side-by-side comparison: Medicare accountable care
organizations (ACO) models. Retrieved from https://www.kff.org/interactive/side-by-side-
comparison-medicare-accountable-care-organization-aco-models/
Herrel, L. A., Norton, E. C., Hawken, S. R., Ye, Z., Hollenbeck, B. K., & Miller, D. C. (2016). Early impact of
Medicare accountable care organizations on cancer surgery outcomes. Cancer, 122(17), 2739-
2746. doi: 10.1002/cncr.30111
Hewner, S., Casucci, S., & Castner, J. (2016). The roles of chronic disease complexity, health system
integration, and care management in post‐discharge healthcare utilization in a low‐income
population. Research in Nursing & Health, 39(4), 215-228. doi: 10.1002/nur.21731
Huynh, T. M., Baker, G. R., Bierman, A., Klein, D., Rudoler, D., Sharpe, G., . . . Brown, A. D. (2014). Exploring accountable care in Canada. In Final Report to the Ministry of Health and Long-Term Care and the Canadian Foundation for Healthcare Improvement. Ottawa, Canada: Canadian Foundation for Healthcare Improvement.
Kaufman, B. G., Spivack, B. S., Stearns, S. C., Song, P. H., & O’Brien, E. C. (2017). Impact of accountable
care organizations on utilization, care, and outcomes: A systematic review. Medical Care
Research and Review, 00(0), 1-36. doi: 10.1177/1077558717745916
Kelleher, K. J., Cooper, J., Deans, K., Carr, P., Brilli, R. J., Allen, S., & Gardner, W. (2015). Cost saving and
quality of care in a pediatric accountable care organization. Pediatrics, 135(3), e582-e589. doi:
10.1542/peds.2014-2725
Koury, C., Iannaccone, L., Strunk, A., Udelson, A., Boaz, A., Cianci, C., . . . Keale, M. (2014). The
accountable care organization summit: A white paper on findings, outcomes, and challenges.
Hospital Topics, 92(2), 44-57. doi: 10.1080/00185868.2014.906839
Lazar, H. (2011). Many degrees of policy freedom: The federal government's role in care for seniors. Retrieved from Institute for Research on Public Policy: http://irpp.org/research-studies/many-degrees-of-policy-freedom/
Lazar, H., Lavis, J. N., Forest, P., & Church, J. (2013). Paradigm freeze: Why it is so hard to reform health-care policy in Canada. Montreal and Kingston, Canada: McGill-Queen's University Press.
Lewis, V., Colla, C., Schpero, W., Shortell, S., & Fisher, E. (2014). ACO contracting with private and public payers: A baseline comparative analysis. American Journal of Managed Care, 20(12), 1008-1014.
L&M Policy Research. (2015). Evaluation of cmmi accountable care organization initiatives: Pioneer ACO evaluation findings from performance years one and two (Report prepared for Centers for Medicare & Medicaid Services). Retrieved from https://www.abtassociates.com/insights /publications/report/evaluation-of-cmmi-accountable-care-organization-initiatives-pioneer
L&M Policy Research. (2016). Advance payment ACO final report (Report prepared for Centers for Medicare & Medicaid Services). Retrieved from https://innovation.cms.gov/Files/reports /advpayaco-fnevalrpt.pdf
26
McConnell, K. J., Renfro, S., Chan, B. K., Meath, T. H., Mendelson, A., Cohen, D., . . . Lindrooth, R. C.
(2017). Early performance in Medicaid accountable care organizations: A comparison of Oregon
and Colorado. JAMA Internal Medicine, 177(4), 538-545. doi: 10.1001/jamainternmed.2016
.9098
McWilliams, J. M., Chernew, M. E., Landon, B. E., & Schwartz, A. L. (2015). Performance differences in
year 1 of pioneer accountable care organizations. New England Journal of Medicine, 372(20),
1927-1936. doi: 10.1056/NEJMsa1414929
McWilliams, J. M., Gilstrap, L. G., Stevenson, D. G., Chernew, M. E., Huskamp, H. A., & Grabowski, D. C.
(2017). Changes in postacute care in the Medicare shared savings program. JAMA Internal
Medicine, 177(4), 518-526. doi: 10.1001/jamainternmed.2016.9115
Moberly, T. (2017). Accountable care systems and accountable care organizations in the NHS: Progress
or route to privatisation. British Medical Journal, 358(j4105), 1-2. doi: 10.1377/hlthaff.2014
.0373
Muhlestein, D. (2015). Growth and dispersion of accountable care organizations in 2015. Health Affairs
Blog. Retrieved from https://www.healthaffairs.org/do/10.1377/hblog20150331.045829/full/
Nyweide, D. J., Lee, W., Cuerdon, T. T., Pham, H. H., Cox, M., Rajkumar, R., & Conway, P. H. (2015).
Association of pioneer accountable care organizations vs traditional Medicare fee for service
with spending, utilization, and patient experience. JAMA, 313(21), 2152-2161. doi: 10.1001
/jama.2015.4930
Romanow, R. J. (2002). Building on values: the future of health care in Canada. Retrieved from http: //publications.gc.ca/collections/Collection/CP32-85-2002E.pdf
Schwartz, A. L., Chernew, M. E., Landon, B. E., & McWilliams, J. M. (2015). Changes in low-value services
in year 1 of the Medicare pioneer accountable care organization program. JAMA Internal
Medicine, 175(11), 1815-1825. doi: 10.1001/jamainternmed.2015.4525
Song, Z., Rose, S., Chernew, M.E., & Safran, D.G. (2017). Lower- versus higher-income populations in the
alternative quality contract: Improved quality and similar spending. Health Affairs, 36(1), 74-82.
doi: 10.1377/hlthaff.2016.0682
Stuart, E. A., Barry, C. L., Donohue, J. M., Greenfield, S. F., Duckworth, K., Song, Z., . . . Chernew, M. E.
(2017). Effects of accountable care and payment reform on substance use disorder treatment:
Evidence from the initial 3 years of the alternative quality contract. Addiction, 112(1), 124-133.
doi: 10.1111/add.13555
United States Government Accountability Office, Report to the Ranking Member, Committee on Ways and Means, House of Representatives. (2015). Results from the first two years of the Pioneer Accountable Care Organization Model. Retreived from https://www.gao.gov/assets/670/669782 .pdf
Winblad, U., Mor, V., McHugh, J. P., & Rahman, M. (2017). ACO-affiliated hospitals reduced
rehospitalizations from skilled nursing facilities faster than other hospitals. Health Affairs, 36(1),
67-73. doi: 10.1377/hlthaff.2016.0759
Zhang, Y., Caines, K. J., & Powers, C. A. (2017). Evaluating the effects of pioneer accountable care
organizations on Medicare part d drug spending and utilization. Medical Care, 55(5), 470-475.
doi: 10.1097/MLR.0000000000000686

The North American Observatory on Health Systems and Policies (NAO) is a collaborative partnership of
interested researchers, health organizations, and governments promoting evidence-informed health
system policy decision-making. Due to the high degree of health system decentralization in the United
States and Canada, the NAO is committed to focusing attention on comparing health systems and
policies at the provincial and state level in federations.