Rapid, direct and non-destructive assessment of fossil ...
44
Rapid, direct and non-destructive assessment of fossil organic matter via microRaman spectroscopy Citation Ferralis, Nicola, Emily D. Matys, Andrew H. Knoll, Christian Hallmann, and Roger E. Summons. 2016. “Rapid, Direct and Non-Destructive Assessment of Fossil Organic Matter via microRaman Spectroscopy.” Carbon 108 (November): 440–449. doi:10.1016/j.carbon.2016.07.039. Published Version doi:10.1016/j.carbon.2016.07.039 Permanent link http://nrs.harvard.edu/urn-3:HUL.InstRepos:33973837 Terms of Use This article was downloaded from Harvard University’s DASH repository, and is made available under the terms and conditions applicable to Open Access Policy Articles, as set forth at http:// nrs.harvard.edu/urn-3:HUL.InstRepos:dash.current.terms-of-use#OAP Share Your Story The Harvard community has made this article openly available. Please share how this access benefits you. Submit a story . Accessibility
Transcript of Rapid, direct and non-destructive assessment of fossil ...
Rapid, direct and non-destructive assessment of fossil organic matter via microRaman spectroscopy
CitationFerralis, Nicola, Emily D. Matys, Andrew H. Knoll, Christian Hallmann, and Roger E. Summons. 2016. “Rapid, Direct and Non-Destructive Assessment of Fossil Organic Matter via microRaman Spectroscopy.” Carbon 108 (November): 440–449. doi:10.1016/j.carbon.2016.07.039.
Published Versiondoi:10.1016/j.carbon.2016.07.039
Permanent linkhttp://nrs.harvard.edu/urn-3:HUL.InstRepos:33973837
Terms of UseThis article was downloaded from Harvard University’s DASH repository, and is made available under the terms and conditions applicable to Open Access Policy Articles, as set forth at http://nrs.harvard.edu/urn-3:HUL.InstRepos:dash.current.terms-of-use#OAP
Share Your StoryThe Harvard community has made this article openly available.Please share how this access benefits you. Submit a story .
Accessibility
1
Rapid, direct and non-destructive assessment of fossil organic matter via microRaman spectroscopy Nicola Ferralisa,1 Emily D. Matysb, Andrew H. Knollc, Christian Hallmannb,d, Roger E. Summonsb,1 aDepartment of Materials Science and Engineering, Massachusetts Institute of Technology, Cambridge, MA 02139, USA bDepartment of Earth Atmospheric and Planetary Sciences, Massachusetts Institute of Technology, Cambridge, MA 02139, USA cDepartment of Organismic and Evolutionary Biology, Harvard University, Cambridge, MA 02138, USA dPresent address: Max Planck Institute for Biogeochemistry, Jena, Germany and MARUM, University of Bremen, Germany. 1 To whom the correspondence may be addressed. Email: [email protected] and [email protected] A manuscript prepared for Carbon Abstract Raman spectroscopy is widely used to evaluate the nature and potential origins of
carbonaceous matter in Earth’s oldest rocks and minerals. It is also the tool that will be
used for organic detection on the next vehicles to remotely explore the surface of Mars.
Here we present, for the first time, a novel quantitative method in which previously
neglected Raman spectral features are correlated directly, linearly, and with excellent
accuracy, to the microchemistry of carbonaceous materials through the elemental H:C
ratio, regardless of contamination. We show applicability and predictive capabilities of
this methodology in evaluating H:C ratios between 0.01 and 0.65 in Archean and type III
kerogens. We demonstrate its application to chemical microRaman mapping by statistical
analysis of a 750Ma microfossil and its encompassing sediments. Raman-derived H:C
data can also be used to estimate the degree to which kerogen C-isotopic data has been
shifted from its original values due to the effects of metamorphism. The new
methodology directly and non-invasively affords spatially resolved assessments of
organic matter preservation and microscale chemical diversity within any geologically
2
preserved terrestrial or extraterrestrial sample, including in the use of organic matter in
technological applications.
1. Introduction The demonstrated facile, and non-destructive deployment of Raman spectroscopy to
identify key chemical parameters in organic matter makes it extremely compelling for
spatially-resolved quantitative geological and petrochemical surveys of the chemistry of
organic matter (OM), as well as for the recent innovative use of OM for technological
applications, such as thin films for electronics [1]. Several techniques can spatially
resolve carbon chemistry such as laser desorption ionization (LDI) coupled to Fourier
transform ion cyclotron resonance mass spectrometry (FTICR-MS) and Time-of-Flight -
Secondary Ion Mass Spectrometry (TOF-SIMS) [2, 3]. Yet, Raman spectroscopy has the
potential to allow quantitative evaluation of carbon chemistry, while non-invasively
preserving the specimen chemistry and morphology, and with minimal specimen
preparation. Such flexibility is particularly of interest for its application to detection and
characterization of organic matter were sample preservation is essential, such as for
organic fossils, both in terrestrial and - potentially - extraterrestrial samples [4-6].
A resurgence in interest in quantitative assessments of carbon chemistry of highly
aromatic organic matter is also motivated by the challenges in understanding in the
origins and early evolution of life on the Earth and, possibly, elsewhere in the solar
system, which has been heightened by recent successes of NASA’s Mars Science
Laboratory Mission. Sedimentological and geochemical features of ancient sedimentary
rocks indicate the presence in Mars’ past of potentially habitable environments
characterized by the extended presence of standing water [7]. A complementary search
for indigenous, well-preserved OM, however, has been less conclusive, this due in part,
by the lack of a spatially resolved quantitative method for rapid screening of chemical
preservation of OM. For example, to date, discoveries have been limited to the detection
of small organic molecules during pyrolysis-gas chromatography-mass spectrometry (py-
GC-MS) experiments in Mars [8]. On Mars, the search for preserved organic matter, and
3
the determination of its chemical composition, has been particularly hindered by the
highly reactive, strongly oxidizing nature of surface sediments activated by the invasive,
high energy probe, which present obstacles to both preservation and the thermal
volatilization and pyrolysis approaches for detection that have so far been deployed in
landed missions [9-12].
Similarly, the analysis of OM in Earth’s oldest sedimentary rocks has been subject to
multiple combinations of problems. OM is ubiquitous in ancient terrestrial sediments and
often occurs in great abundance, even in rocks more than 2.5 billion years old [13-15].
Here, the key problems are interpretive and revolve around establishing whether or not
preserved organic molecules are syngenetic and indigenous to the rocks in which they
occur [16, 17], identifying and excluding contamination artifacts [18] and seeing past the
destructive and confounding effects of thermal metamorphism [15] and ionizing
radiation [19].
Raman spectroscopy and microscopy have been used extensively to characterize, often
with submicron spatial resolution the OM of kerogens and microscopic fossils in both
sedimentary rocks [20] and extra-planetary materials [21-24]. In particular, laser-Raman
mapping with submicron-scale resolution was used to establish positive correlations
between optically discernible microscopic fossils and the carbonaceous nature of their
preserved walls or envelopes [25-27]. In studies of interplanetary dust particles and
meteorites, Raman spectroscopy conducted at sub-micron resolution is able to identify
heterogeneities in chemical composition of the OM, a feature that speaks to its origin by
means of multiple chemical processes [24, 28].
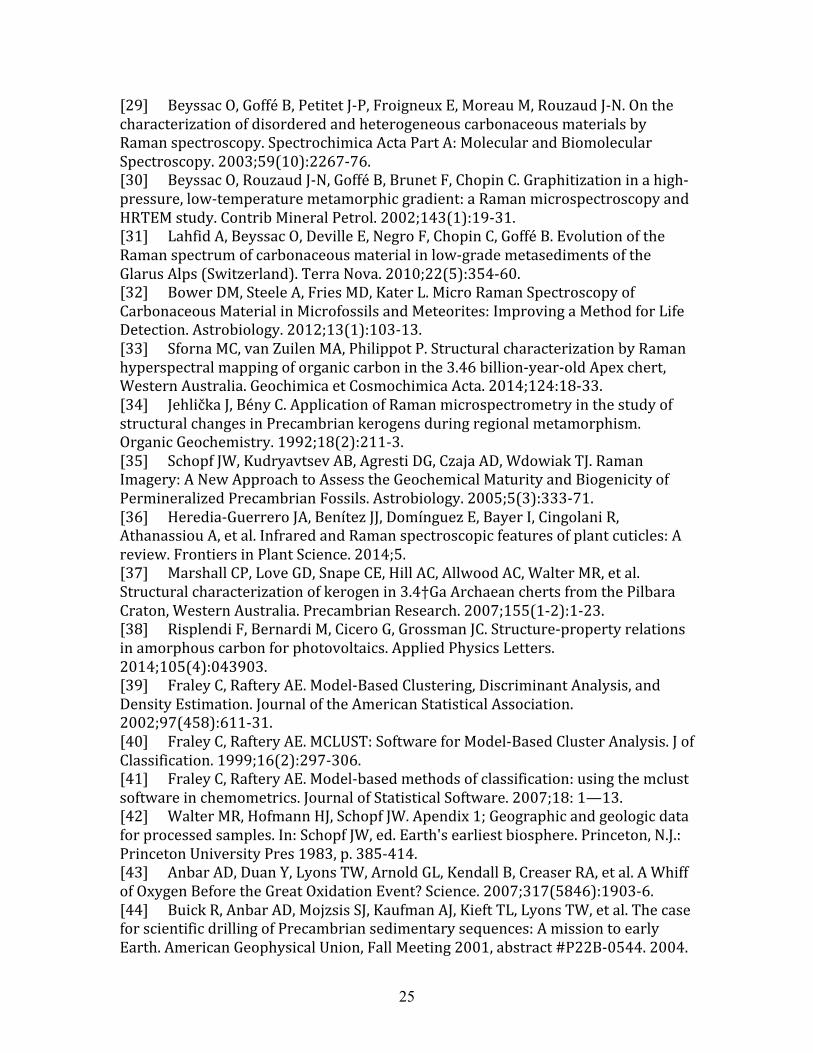
Many authors have identified systematic changes in Raman spectra that accompany the
thermal maturation and metamorphism of sediments. Comparative analyses of
metamorphic rocks in relation to their thermal maturation document the evolution of the
Raman D bands and the sharpening of the G band (Fig. 1) as a result of the progressive
graphitization of sedimentary OM [29-33]. Similarly, early observations of Precambrian
kerogens suggested that loss of the D band and sharpening of the G band accompanied
4
increasing metamorphic grade [34], while Schopf and colleagues developed a Raman
Index of Preservation (RIP) [35] and observed positive correlations with Raman-based
parameters, H:C and other indices of the maturity of microscopic fossils. Conversely,
other techniques (such as FTIR) can provide a semi-quantitative, spatially resolved
assessment of functional chemistry for biological and low maturity kerogen [36], and yet,
any chemical assessment is qualitative at best for mature OM by the very low spectral
contribution from aliphatics, while being predominantly dominated by aromatic
compounds [37].
In the present study, we build on this foundation and document a novel suite of
microchemical characterization tools that allow in situ, non-destructive, and unique
approximation of the H:C ratio of mature organic matter from the micron to the
millimeter scale. We provide accurate direct calibrations of the spectral response of a
suite of chemically diverse, mature organic matter samples to elemental H:C for a range
between 0.01 and 0.65 using Raman spectroscopy. The spatial upscaling enabled by the
technique is designed to provide a maturity population distribution from the nanoscale to
conventionally used macro-scale averaged parameters (such as vitrinite reflectance). The
derivation of elemental H:C ratios directly from analyses of Raman spectra affords a tool
for rapidly and remotely evaluating bulk OM composition on future missions to Mars. On
Earth, the approach is ideal for facile and inexpensive examination of spatial variations in
the chemical composition of microscopic fossils or the regional maturity trends across
sedimentary basins in order to identify the best preserved organic matter for more
detailed geobiological study. It can be immediately used to determine H:C for OM-
derived electronic grade thin films and therefore infer their optical properties [38].
2. Materials and Methods 2.1 Raman spectroscopy. Micro-Raman spectra were acquired using a Horiba LabRAM
800 HR spectrometer in a confocal configuration equipped with a He-Ne (632.817 nm)
laser as the excitation source and a Peltier-cooled CCD detector. The laser was focused
on the sample with a 400 nm confocal hole using the 100X objective under reflected
illumination. The laser spot on the sample was ~800 nm in diameter and had a power of
5
~4 mW at the sample surface. A calibrated edge high band filter (lowest wavenumber:
~70 cm-1) was used to minimize the elastic backscattered signal. The method for spectral
fitting and background subtraction can be found in SI.
2.2 Cluster Analysis of Raman maps. Identification of clusters or phases within a map
through correlation of Raman spectral features are carried out using cluster analysis based
on the mixture modeling [39] as implemented in the R-package MClust [40, 41]. Further
details in the SI.
2.3 Isolated Kerogen Samples. Kerogen samples (Table S1) with a well-characterized as
well as uniform chemical fingerprint (H:C and mineralogy) were chosen for the
calibration of Raman spectral features such as intensity peak ratios with macroscopic H:C
ratios (between 0.01 and 0.65 by elemental analysis). For the purpose, a total of 16
samples (age range: 1.4-3.9 Gy) from the Precambrian Paleobiology Research Group
(PPRG) [42], were provided by JW Schopf. Isolated type III kerogens from the Penn
State Coal bank (Department of Energy Coal Samples – DECS) were used were also
used. Additional samples from two Agouron Institute Drilling Projects in Australia
(samples with the AIDP identifier) and South Africa (Samples with the GKF and GKP
identifiers), which were used in recent geochemical studies of organic matter-rich
Neoarchean sediments from the Pilbara [43, 44] and Kaapvaal Cratons [14, 18, 45-48]
were included to evaluate their H:C using the calibration above. Details of kerogen
selection and isolation are available in SI.
2.4 Organic Fossil. The application of the novel Raman method here developed to
mapping was done using a thin section of silicified coastal carbonate containing
organically preserved fossils of the protist Trachyhystrichosphaera aimika, from the 750
Ma Draken Formation, Spitsbergen. The fossil is deposited in the Paleobotanical
Collections of the Harvard University Herbaria, collection number 62371.
3. Results and discussion
6
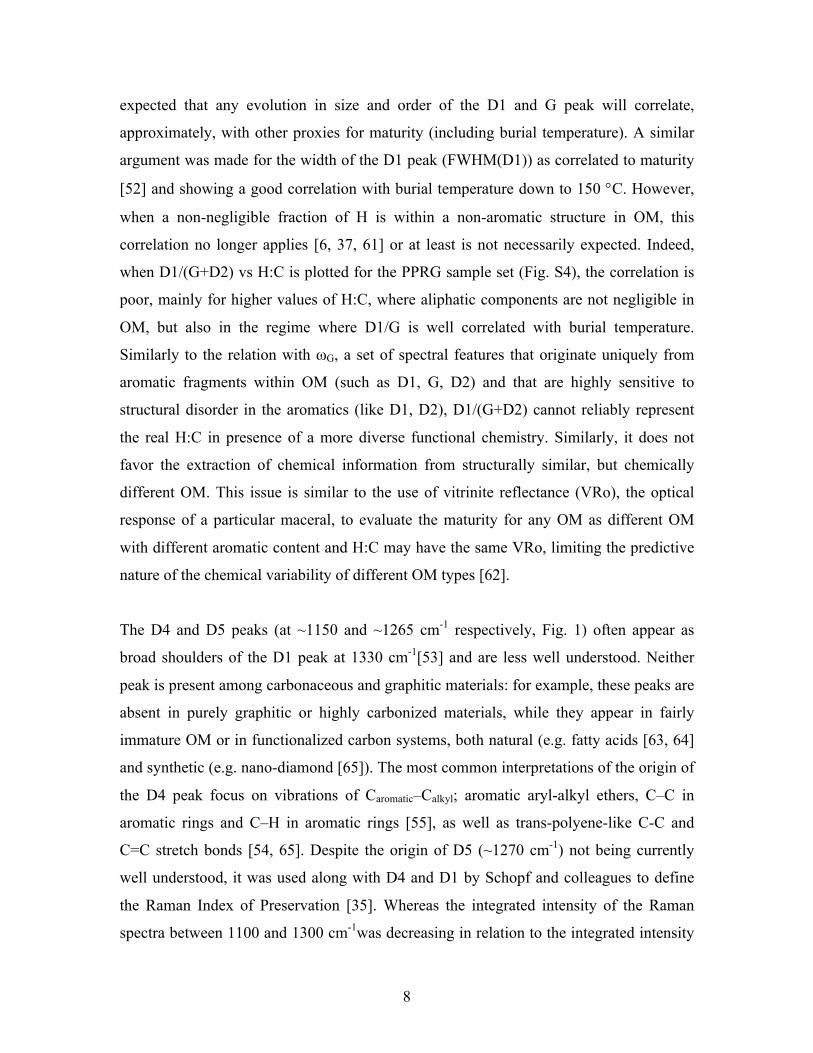
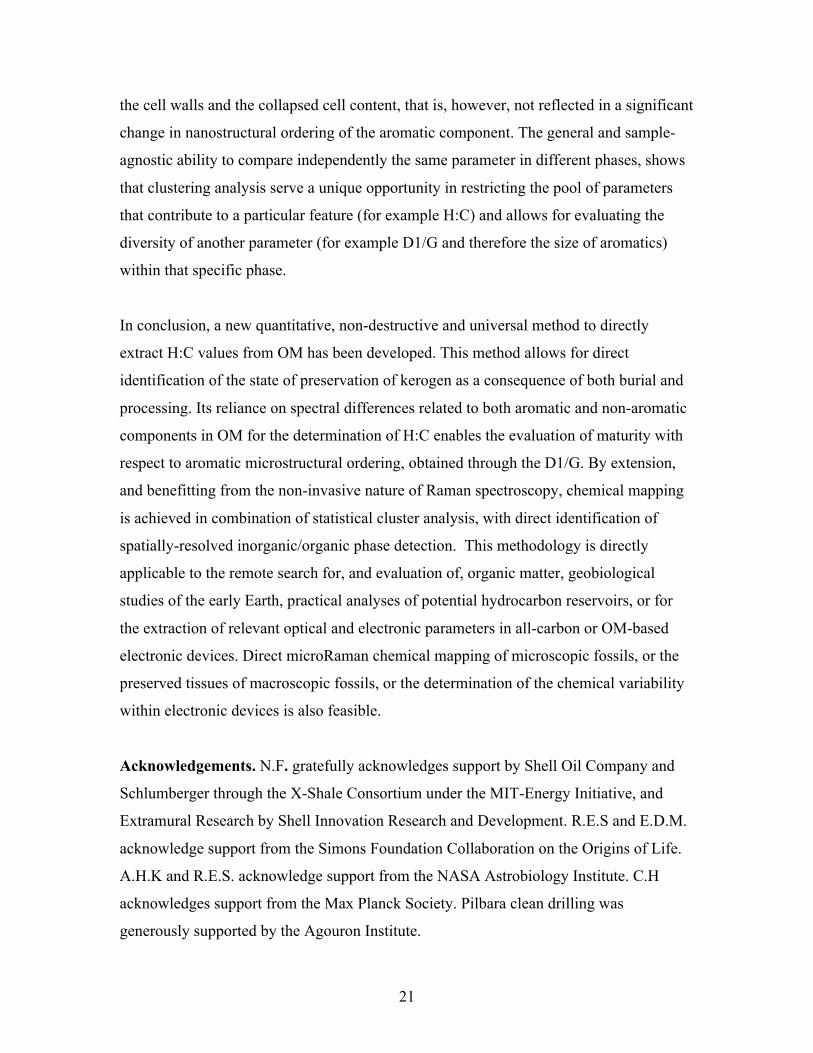
The conventional approach to interpreting Raman spectra relies on characterization of the
intensity and width of two of the major bands, the G peak and D peak complex [49] (Fig.
1). The G peak (at 1582 cm-1) is related to an in-plane sp2 bond stretching shear vibration
within the aromatic ring in a large, graphene-like cluster. The full-width, half-max of the
G peak (FWHM) ωG increases monotonically with the degree of disorder in the graphitic
lattice [49], either by defects within the aromatic clusters or through scattering by their
edges. In the context of OM, it is expected that the size of aromatic clusters will increase
with maturity, hence a correlation between ωG and maturity is expected. To test this
hypothesis, we extracted ωG from a set of previously well-studied kerogens from the
collection of the Precambrian Paleobiology Research Group (PPRG), Table S1 [50].
The data are plotted against the nominal H:C ratio of each sample (Fig. S1). The
correlation, while acceptable, is indirect: ωG is related only to the size of aromatic
clusters, which themselves are not directly related to H:C. Therefore, it is expected that
the double correlation between ωG vs maturity and maturity vs H:C will lead to a
correlation between ωG and H:C. In essence, while ωG can be used to represent the
maturation process of a given OM, it does not represent a proxy for a defined chemical
entity such as the elemental H:C ratio. The limitation of such correlations to aromatic
hydrocarbons hinders their applicability to complex non-aromatic functional groups
present in OM. Furthermore, in the case of low maturity OM, the estimation of ωG is
further complicated by the presence of a shoulder band D2 related to intravalley defects
in the aromatic structure [51]. Accounting for D2 may ultimately be possible for high
maturity O, where the peak can distinctively be separated from the G peak and ωD2
(FWHM(D2)) and effectively be used in itself as a maturity indicator [52]. However, its
range of applicability is ultimately restricted to the case where it can be deconvoluted
from the G peak.
7
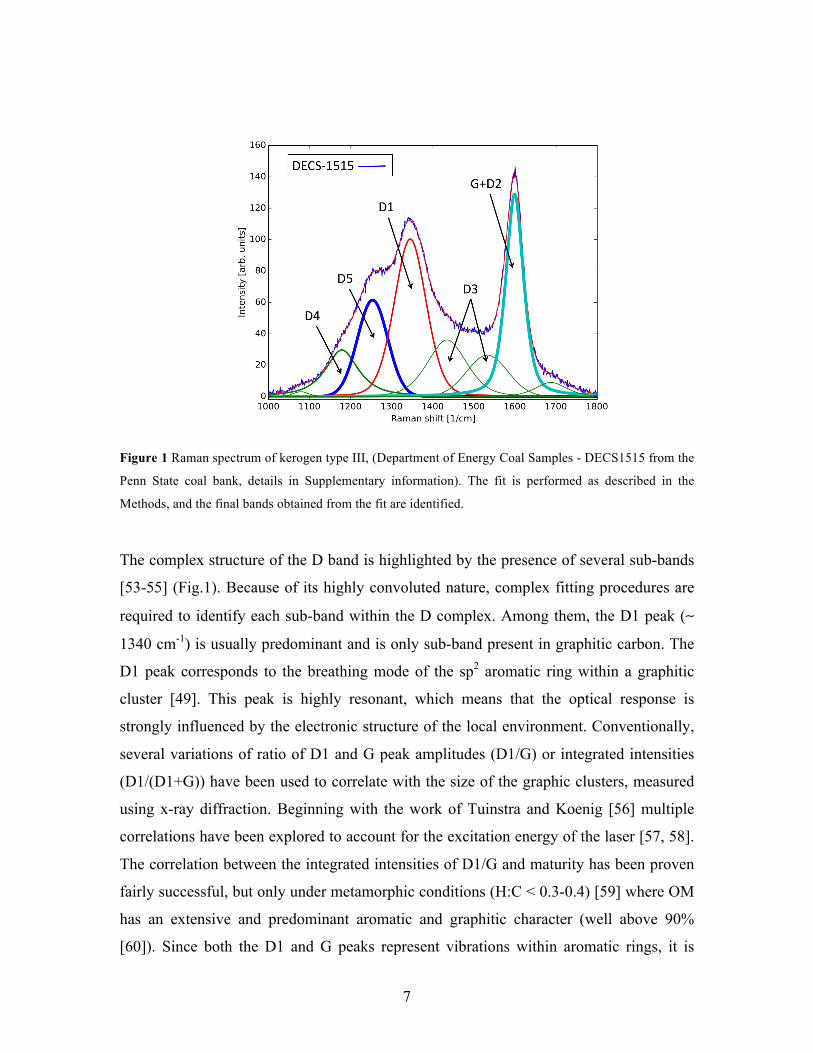
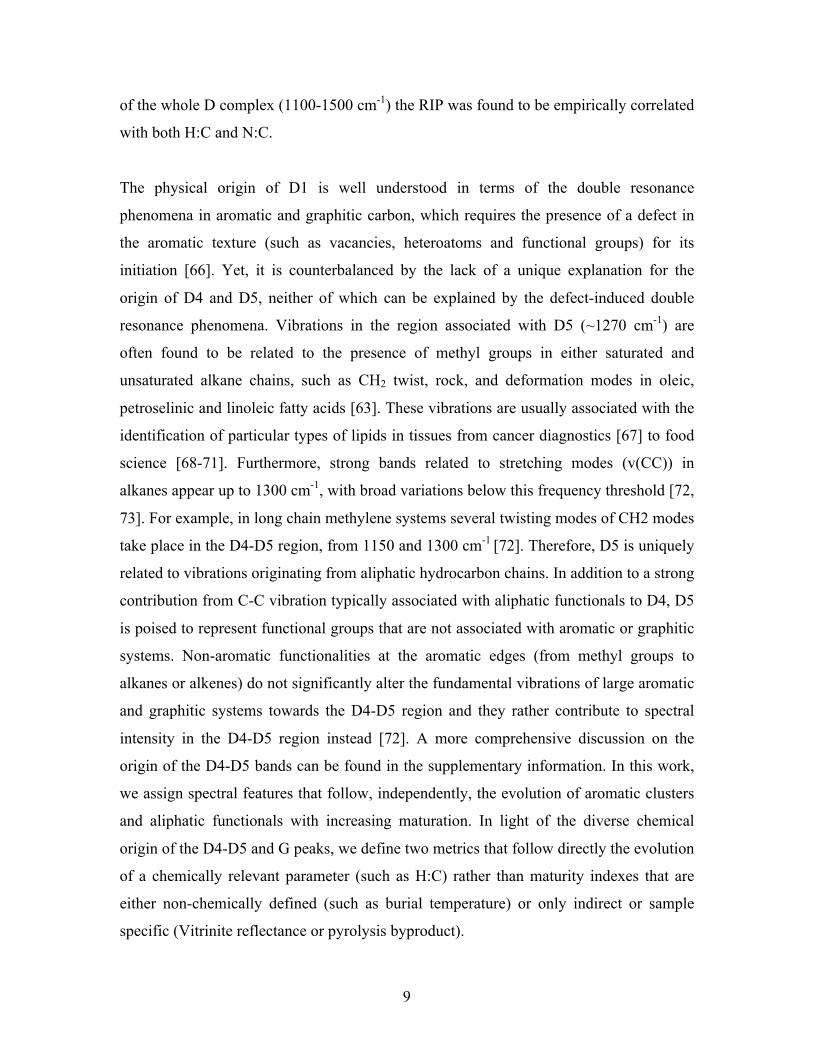
Figure 1 Raman spectrum of kerogen type III, (Department of Energy Coal Samples - DECS1515 from the
Penn State coal bank, details in Supplementary information). The fit is performed as described in the
Methods, and the final bands obtained from the fit are identified.
The complex structure of the D band is highlighted by the presence of several sub-bands
[53-55] (Fig.1). Because of its highly convoluted nature, complex fitting procedures are
required to identify each sub-band within the D complex. Among them, the D1 peak (∼
1340 cm-1) is usually predominant and is only sub-band present in graphitic carbon. The
D1 peak corresponds to the breathing mode of the sp2 aromatic ring within a graphitic
cluster [49]. This peak is highly resonant, which means that the optical response is
strongly influenced by the electronic structure of the local environment. Conventionally,
several variations of ratio of D1 and G peak amplitudes (D1/G) or integrated intensities
(D1/(D1+G)) have been used to correlate with the size of the graphic clusters, measured
using x-ray diffraction. Beginning with the work of Tuinstra and Koenig [56] multiple
correlations have been explored to account for the excitation energy of the laser [57, 58].
The correlation between the integrated intensities of D1/G and maturity has been proven
fairly successful, but only under metamorphic conditions (H:C < 0.3-0.4) [59] where OM
has an extensive and predominant aromatic and graphitic character (well above 90%
[60]). Since both the D1 and G peaks represent vibrations within aromatic rings, it is
8
expected that any evolution in size and order of the D1 and G peak will correlate,
approximately, with other proxies for maturity (including burial temperature). A similar
argument was made for the width of the D1 peak (FWHM(D1)) as correlated to maturity
[52] and showing a good correlation with burial temperature down to 150 °C. However,
when a non-negligible fraction of H is within a non-aromatic structure in OM, this
correlation no longer applies [6, 37, 61] or at least is not necessarily expected. Indeed,
when D1/(G+D2) vs H:C is plotted for the PPRG sample set (Fig. S4), the correlation is
poor, mainly for higher values of H:C, where aliphatic components are not negligible in
OM, but also in the regime where D1/G is well correlated with burial temperature.
Similarly to the relation with ωG, a set of spectral features that originate uniquely from
aromatic fragments within OM (such as D1, G, D2) and that are highly sensitive to
structural disorder in the aromatics (like D1, D2), D1/(G+D2) cannot reliably represent
the real H:C in presence of a more diverse functional chemistry. Similarly, it does not
favor the extraction of chemical information from structurally similar, but chemically
different OM. This issue is similar to the use of vitrinite reflectance (VRo), the optical
response of a particular maceral, to evaluate the maturity for any OM as different OM
with different aromatic content and H:C may have the same VRo, limiting the predictive
nature of the chemical variability of different OM types [62].
The D4 and D5 peaks (at ~1150 and ~1265 cm-1 respectively, Fig. 1) often appear as
broad shoulders of the D1 peak at 1330 cm-1[53] and are less well understood. Neither
peak is present among carbonaceous and graphitic materials: for example, these peaks are
absent in purely graphitic or highly carbonized materials, while they appear in fairly
immature OM or in functionalized carbon systems, both natural (e.g. fatty acids [63, 64]
and synthetic (e.g. nano-diamond [65]). The most common interpretations of the origin of
the D4 peak focus on vibrations of Caromatic–Calkyl; aromatic aryl-alkyl ethers, C–C in
aromatic rings and C–H in aromatic rings [55], as well as trans-polyene-like C-C and
C=C stretch bonds [54, 65]. Despite the origin of D5 (~1270 cm-1) not being currently
well understood, it was used along with D4 and D1 by Schopf and colleagues to define
the Raman Index of Preservation [35]. Whereas the integrated intensity of the Raman
spectra between 1100 and 1300 cm-1was decreasing in relation to the integrated intensity
9
of the whole D complex (1100-1500 cm-1) the RIP was found to be empirically correlated
with both H:C and N:C.
The physical origin of D1 is well understood in terms of the double resonance
phenomena in aromatic and graphitic carbon, which requires the presence of a defect in
the aromatic texture (such as vacancies, heteroatoms and functional groups) for its
initiation [66]. Yet, it is counterbalanced by the lack of a unique explanation for the
origin of D4 and D5, neither of which can be explained by the defect-induced double
resonance phenomena. Vibrations in the region associated with D5 (~1270 cm-1) are
often found to be related to the presence of methyl groups in either saturated and
unsaturated alkane chains, such as CH2 twist, rock, and deformation modes in oleic,
petroselinic and linoleic fatty acids [63]. These vibrations are usually associated with the
identification of particular types of lipids in tissues from cancer diagnostics [67] to food
science [68-71]. Furthermore, strong bands related to stretching modes (v(CC)) in
alkanes appear up to 1300 cm-1, with broad variations below this frequency threshold [72,
73]. For example, in long chain methylene systems several twisting modes of CH2 modes
take place in the D4-D5 region, from 1150 and 1300 cm-1 [72]. Therefore, D5 is uniquely
related to vibrations originating from aliphatic hydrocarbon chains. In addition to a strong
contribution from C-C vibration typically associated with aliphatic functionals to D4, D5
is poised to represent functional groups that are not associated with aromatic or graphitic
systems. Non-aromatic functionalities at the aromatic edges (from methyl groups to
alkanes or alkenes) do not significantly alter the fundamental vibrations of large aromatic
and graphitic systems towards the D4-D5 region and they rather contribute to spectral
intensity in the D4-D5 region instead [72]. A more comprehensive discussion on the
origin of the D4-D5 bands can be found in the supplementary information. In this work,
we assign spectral features that follow, independently, the evolution of aromatic clusters
and aliphatic functionals with increasing maturation. In light of the diverse chemical
origin of the D4-D5 and G peaks, we define two metrics that follow directly the evolution
of a chemically relevant parameter (such as H:C) rather than maturity indexes that are
either non-chemically defined (such as burial temperature) or only indirect or sample
specific (Vitrinite reflectance or pyrolysis byproduct).
10
Ideally, the distinct nature of the D4 and D5 peaks from D1 would allow for perfect
statistical independence, so that the integrated intensity over the region corresponding to
each peak would suffice for analysis. However, the broadness and close proximity of
such peaks in the form of shoulder fundamentally limit the applicability of this method,
as the contribution to the intensity from the tail of a peak (from D1, for example) is
accounted in the intensity from the others. To limit the contribution from neighboring
peaks, a PseudoVoigt peak fit is performed as described in the Methods.
In devising a metric that independently tracks Raman peaks associated with aliphatics
and aromatics, we further limit the contribution to aliphatic peaks such as D4 and D5
from neighboring peaks that originate from aromatics by tracking the integrated intensity
of the G and D2 bands, rather than D1. While, G and D2 have physically different origin
within an aromatic or graphitic cluster, their presence is strictly related to the aromatic
component only. Ideally, given D2 variability both in intensity and width as function of
defects (such as physical defects in the aromatic structure or presence of heteroatoms), G
alone would serve as the ideal reference band for aromatic. Yet, for smaller aromatic
clusters in low maturity OM, the blueshift of the G peak towards higher wavenumbers
due to confinement effects leads to the G and D2 peaks merging into a single broad peak
[4, 33, 74]. Therefore, within this work, we use the sum of the integrated intensity of the
fitted G and D2 peaks when the peak can be discriminated or, otherwise, the overall fit of
the G+D2 band. We note that this method allows for the elimination from any cross-
contribution from D1 to D4 and D5. Indeed, when ID5/(IG+ID2) or the
(ID4+ID5)/(IG+ID2) are plotted against ID1/(IG+ID2) no meaningful correlation is
found (Fig. S5).
11
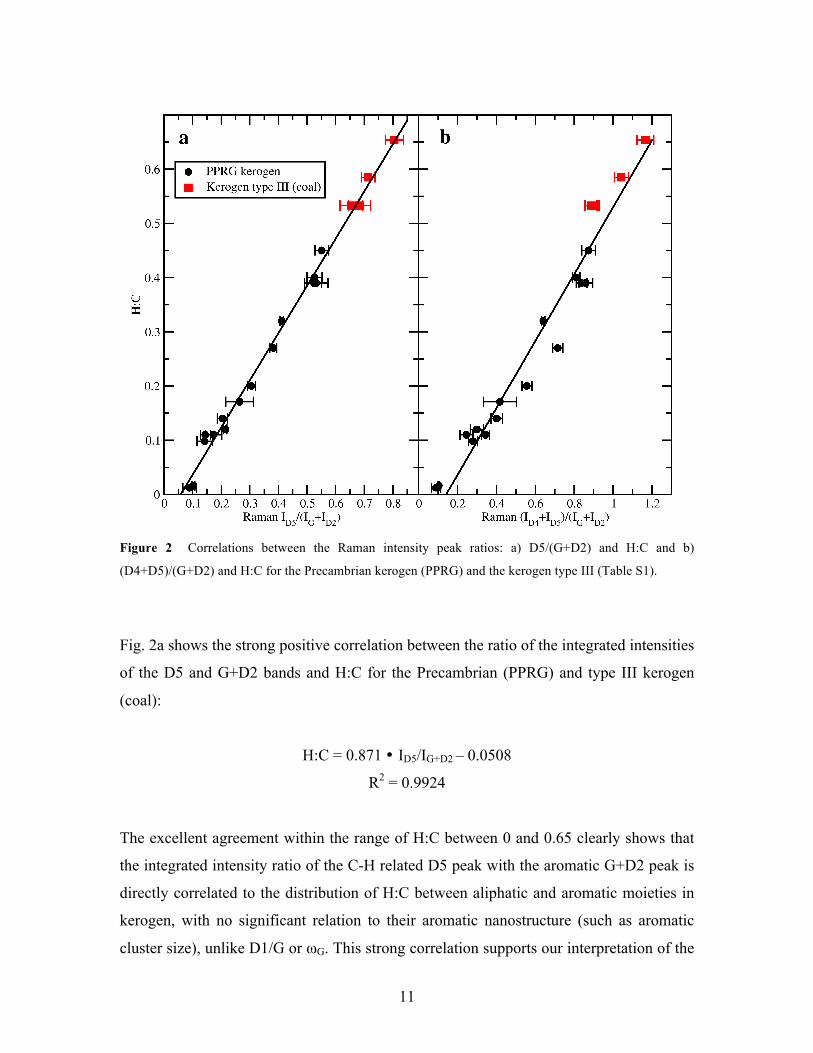
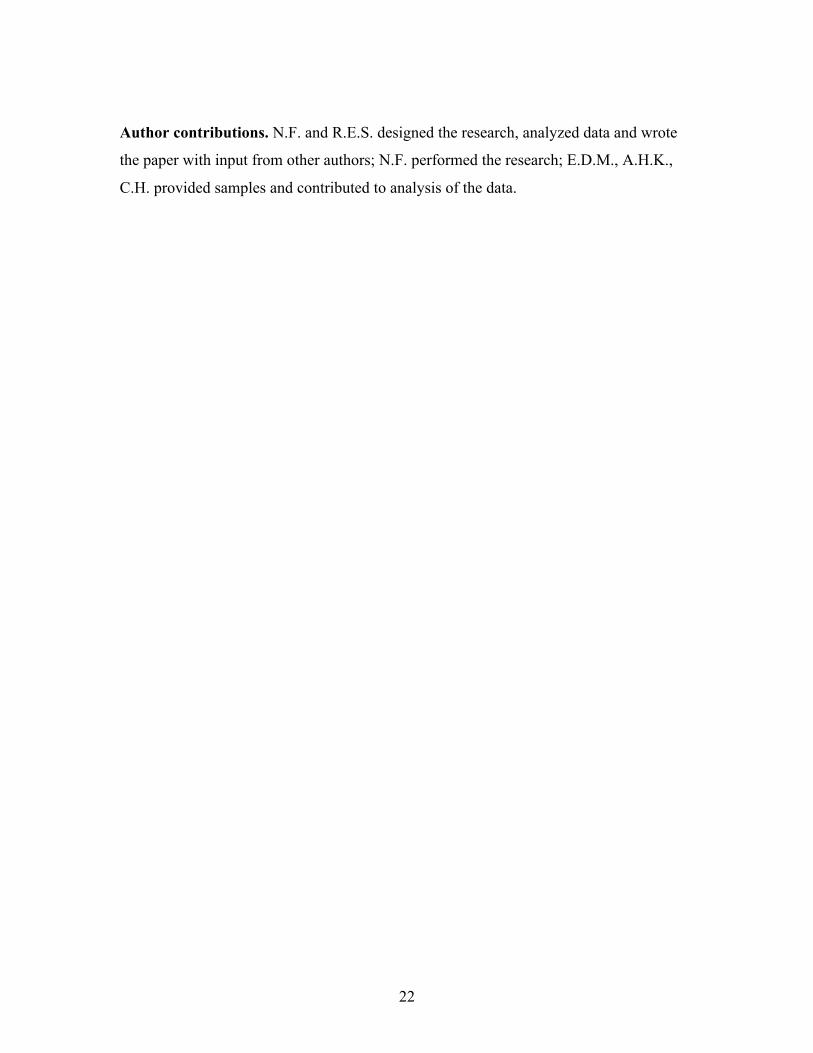
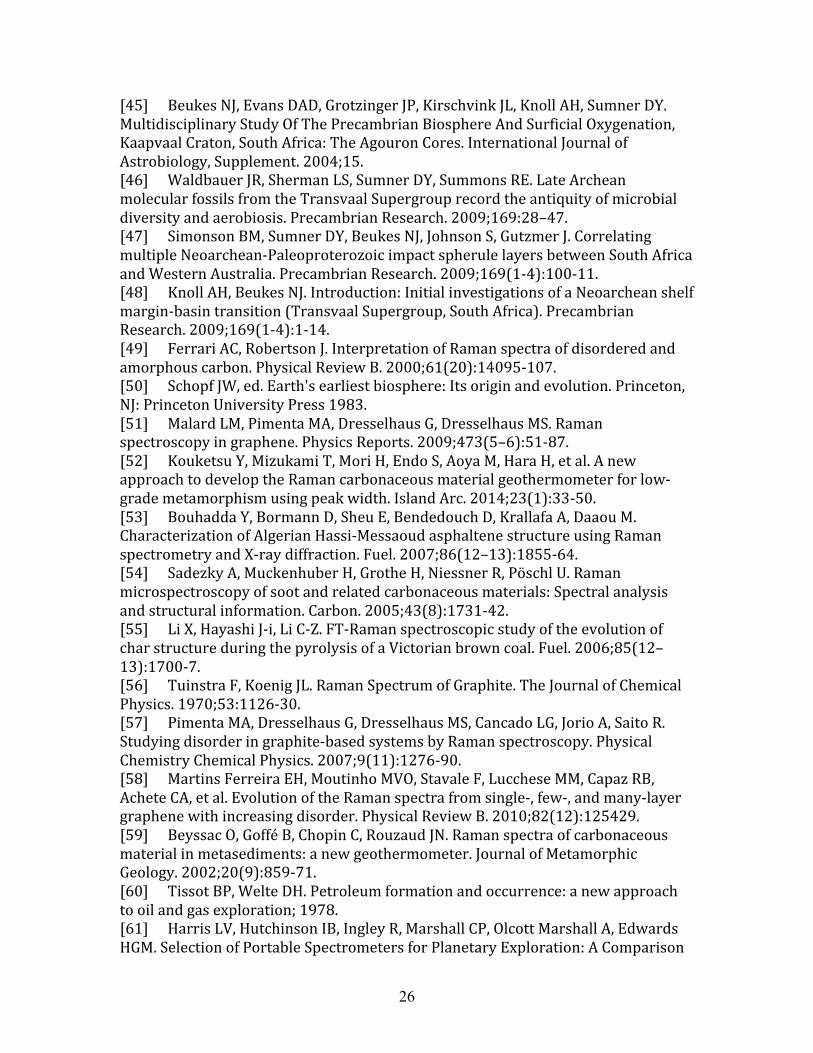
Figure 2 Correlations between the Raman intensity peak ratios: a) D5/(G+D2) and H:C and b)
(D4+D5)/(G+D2) and H:C for the Precambrian kerogen (PPRG) and the kerogen type III (Table S1).
Fig. 2a shows the strong positive correlation between the ratio of the integrated intensities
of the D5 and G+D2 bands and H:C for the Precambrian (PPRG) and type III kerogen
(coal):
H:C = 0.871 � ID5/IG+D2 – 0.0508
R2 = 0.9924
The excellent agreement within the range of H:C between 0 and 0.65 clearly shows that
the integrated intensity ratio of the C-H related D5 peak with the aromatic G+D2 peak is
directly correlated to the distribution of H:C between aliphatic and aromatic moieties in
kerogen, with no significant relation to their aromatic nanostructure (such as aromatic
cluster size), unlike D1/G or ωG. This strong correlation supports our interpretation of the
12
origin of the D5 peak based on C and H within aliphatic chains. A similar correlation is
found for the ratio:
(D4+D5)/(G+D2) (Fig. 2b, H:C = 0.6024 � (ID4 + ID5)/IG+D2 – 0.0739
R2 = 0.9548
To our knowledge, this is the first time a linear, direct relation is proposed that links a
Raman spectral feature to elemental H:C. We note that for highly mature kerogens (H:C
< 0.15), the very low concentration of aliphatics and related C-H groups results in a
strong reduction in intensity of the D5 peak. The persistence of the D4 peak under these
conditions, where aliphatic carbons are not expected, can be attributed to the presence of
C–C on aromatic rings that may persist at higher maturity [55]. As the intensity of D5
may approach negligible values at high maturity, making the fit more unreliable,
(D4+D5)/(G+D2) may be better suited for H:C < 0.15.
The higher limit for the estimate of H:C from D5/(G+D2) and (D4 + D5)/(G+D2) is
imposed uniquely by the ability to discriminate accurately between the D5 and G peak
intensity of a given spectrum and its fluorescence-induced background. With a 633 nm
excitation wavelength, the onset of strong fluorescence is for H:C ~0.6-0.65. However,
instruments using higher energy excitations up to UV, such SHERLOC, slated to fly on
the Mars2020 rover mission [75] would either limit fluorescence or completely remove it,
allowing for the application of this method beyond current limits.
The correlation found between the RIP index and N:C (in addition to H:C, Schopf et al.
2005) might cast doubt on the relation with between D5/(G+D2) and H:C inferring that is
not a direct consequence to the physical interpretation of the origin of the D5, G and D2
bands and can be potentially affected by heteroatoms. However, the very poor correlation
between D5/(G+D2) and N:C (Figure S6) reflects the poor correlation between the
nominal values of H:C and N:C within the PPRG sample set (Figure S7). The effects of
heteroatoms on D5/(G+D2) is a priori unexpected, as no major C-N bond is realistically
expected within the 1100-1700 cm-1 spectral range. The excellent correlation with H:C,
and not with N:C, further confirm the direct dependence of D5/(G+D2) from H:C.
13
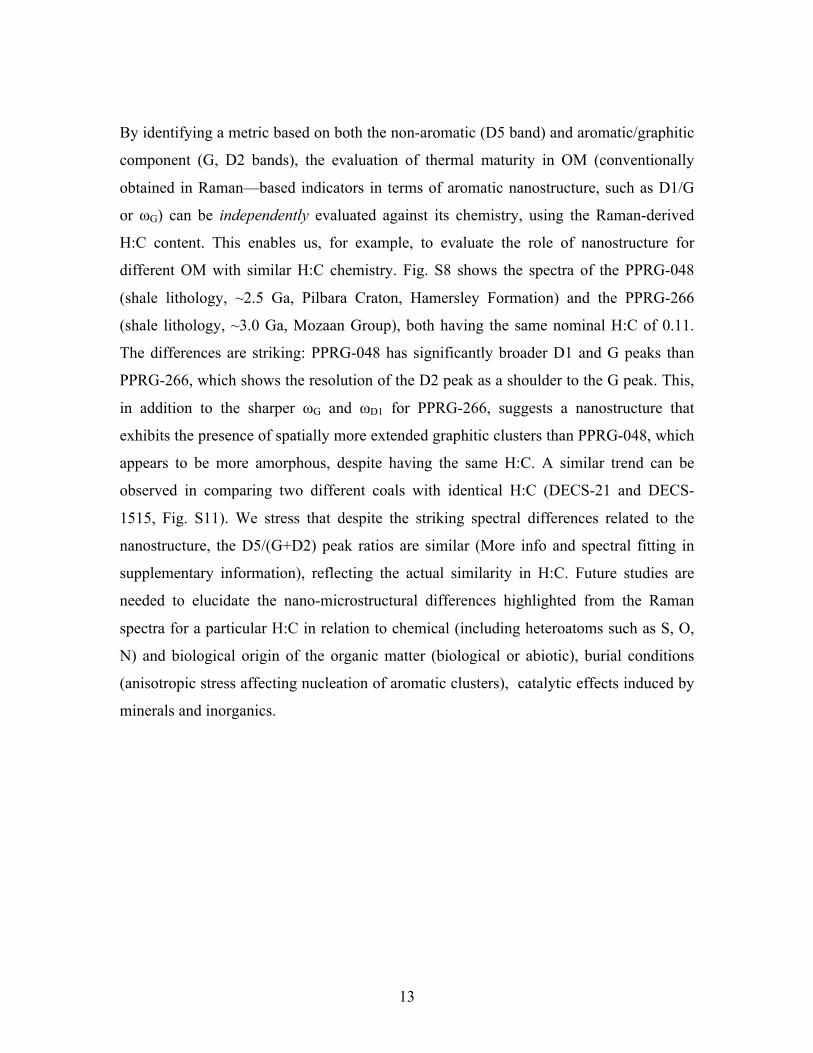
By identifying a metric based on both the non-aromatic (D5 band) and aromatic/graphitic
component (G, D2 bands), the evaluation of thermal maturity in OM (conventionally
obtained in Raman—based indicators in terms of aromatic nanostructure, such as D1/G
or ωG) can be independently evaluated against its chemistry, using the Raman-derived
H:C content. This enables us, for example, to evaluate the role of nanostructure for
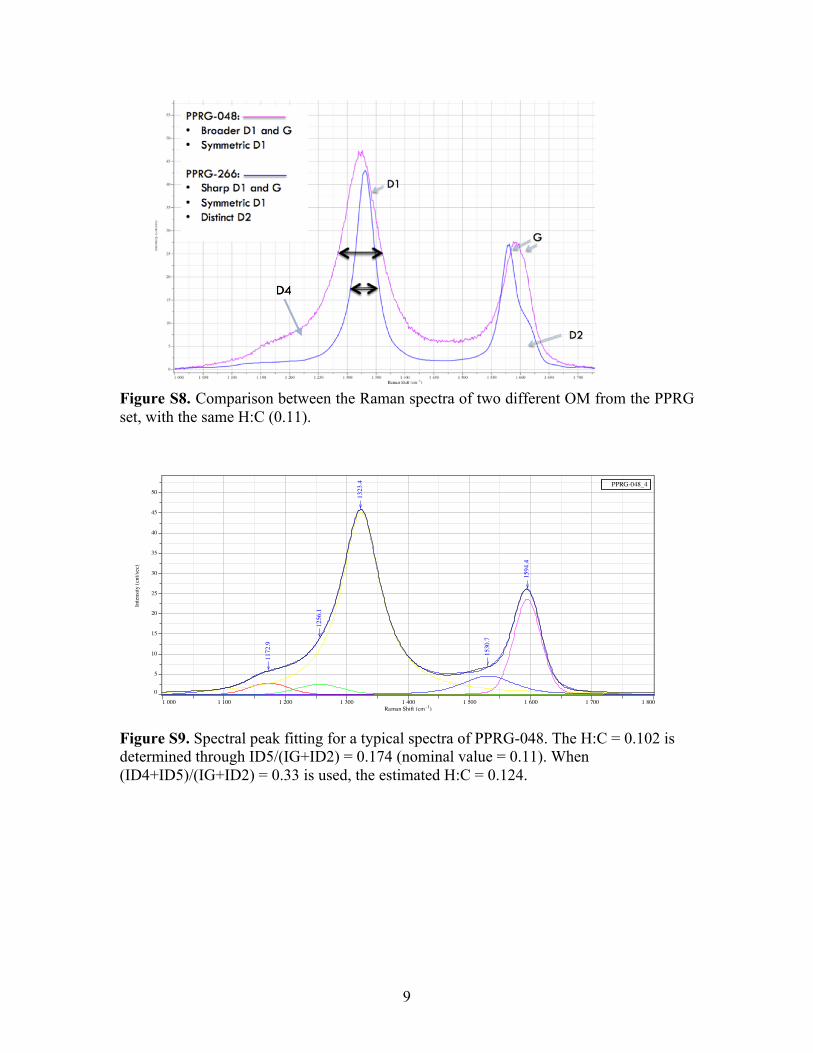
different OM with similar H:C chemistry. Fig. S8 shows the spectra of the PPRG-048
(shale lithology, ~2.5 Ga, Pilbara Craton, Hamersley Formation) and the PPRG-266
(shale lithology, ~3.0 Ga, Mozaan Group), both having the same nominal H:C of 0.11.
The differences are striking: PPRG-048 has significantly broader D1 and G peaks than
PPRG-266, which shows the resolution of the D2 peak as a shoulder to the G peak. This,
in addition to the sharper ωG and ωD1 for PPRG-266, suggests a nanostructure that
exhibits the presence of spatially more extended graphitic clusters than PPRG-048, which
appears to be more amorphous, despite having the same H:C. A similar trend can be
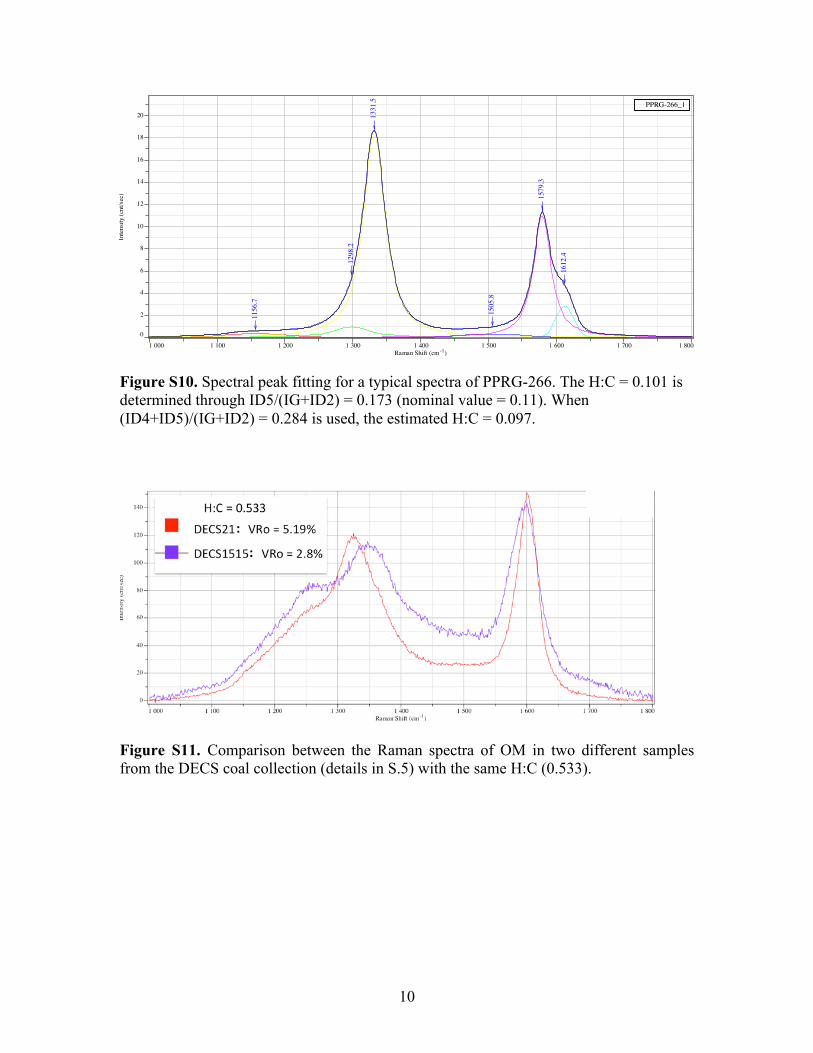
observed in comparing two different coals with identical H:C (DECS-21 and DECS-
1515, Fig. S11). We stress that despite the striking spectral differences related to the
nanostructure, the D5/(G+D2) peak ratios are similar (More info and spectral fitting in
supplementary information), reflecting the actual similarity in H:C. Future studies are
needed to elucidate the nano-microstructural differences highlighted from the Raman
spectra for a particular H:C in relation to chemical (including heteroatoms such as S, O,
N) and biological origin of the organic matter (biological or abiotic), burial conditions
(anisotropic stress affecting nucleation of aromatic clusters), catalytic effects induced by
minerals and inorganics.
14
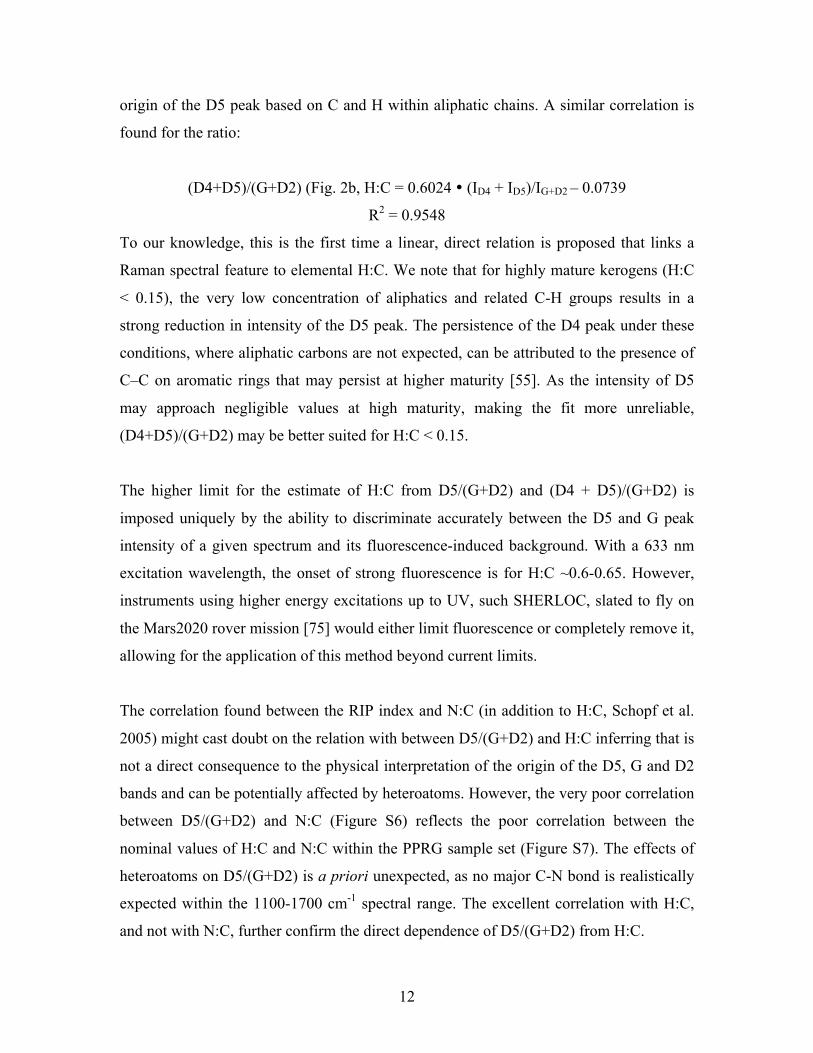
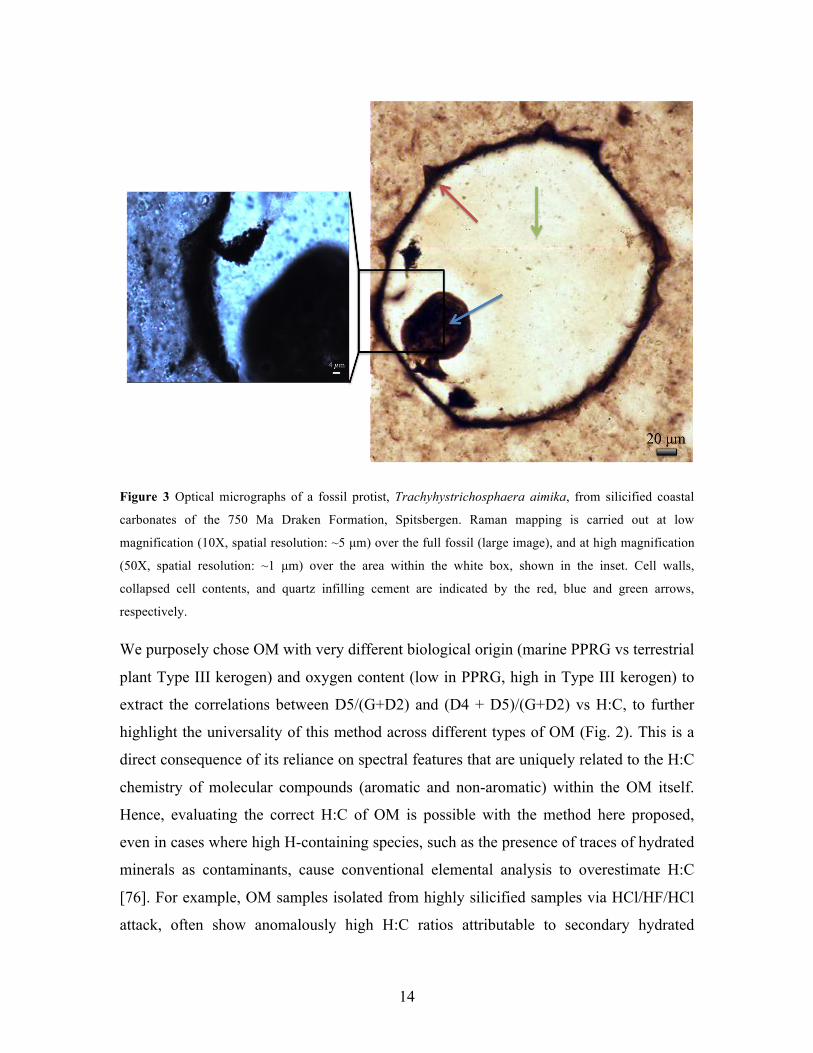
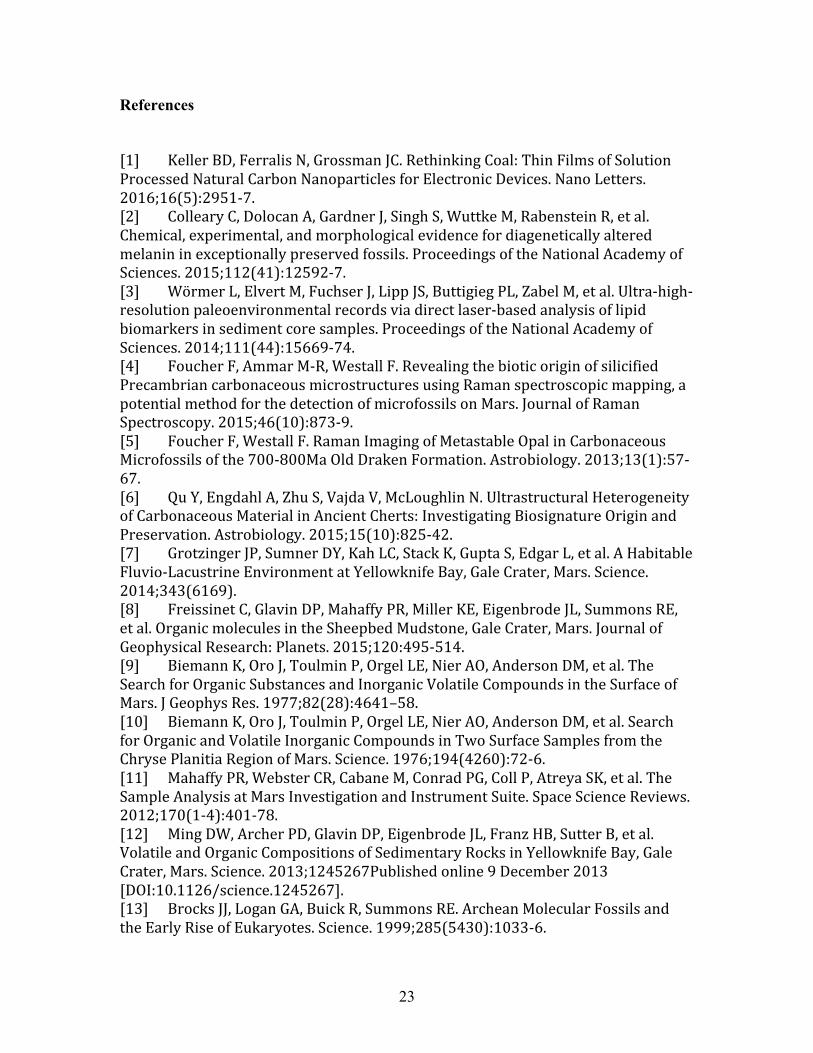
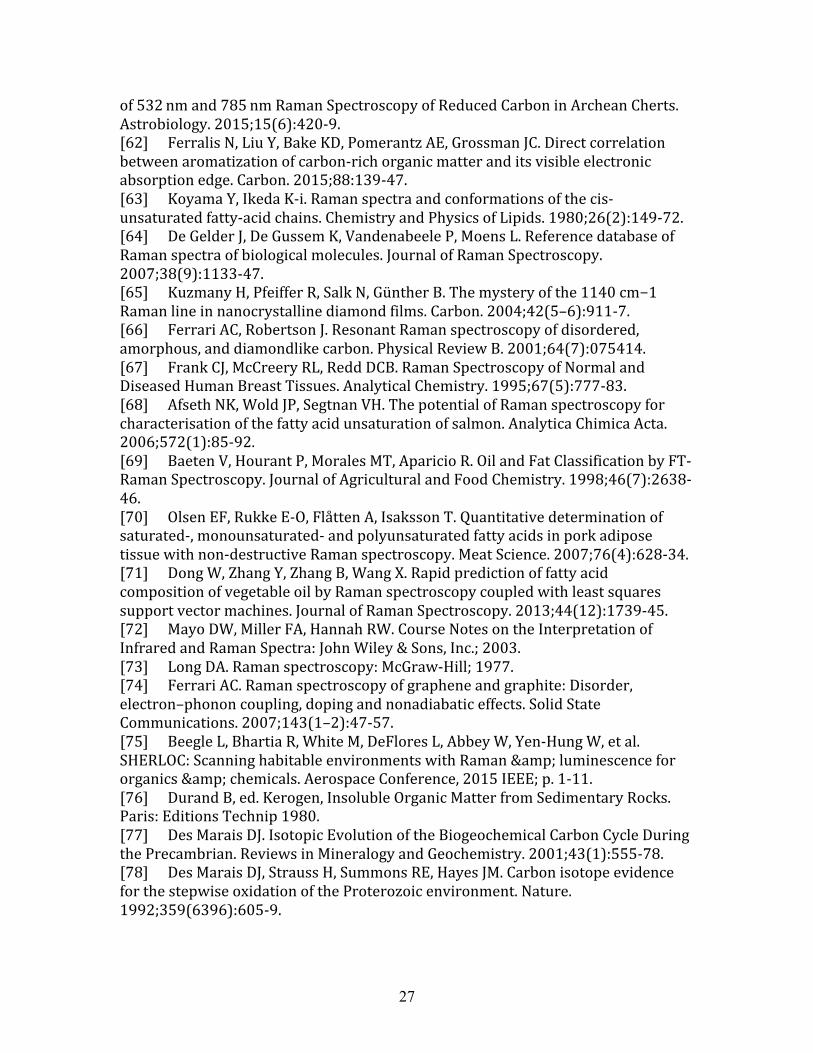
Figure 3 Optical micrographs of a fossil protist, Trachyhystrichosphaera aimika, from silicified coastal
carbonates of the 750 Ma Draken Formation, Spitsbergen. Raman mapping is carried out at low
magnification (10X, spatial resolution: ~5 µm) over the full fossil (large image), and at high magnification
(50X, spatial resolution: ~1 µm) over the area within the white box, shown in the inset. Cell walls,
collapsed cell contents, and quartz infilling cement are indicated by the red, blue and green arrows,
respectively.
We purposely chose OM with very different biological origin (marine PPRG vs terrestrial
plant Type III kerogen) and oxygen content (low in PPRG, high in Type III kerogen) to
extract the correlations between D5/(G+D2) and (D4 + D5)/(G+D2) vs H:C, to further
highlight the universality of this method across different types of OM (Fig. 2). This is a
direct consequence of its reliance on spectral features that are uniquely related to the H:C
chemistry of molecular compounds (aromatic and non-aromatic) within the OM itself.
Hence, evaluating the correct H:C of OM is possible with the method here proposed,
even in cases where high H-containing species, such as the presence of traces of hydrated
minerals as contaminants, cause conventional elemental analysis to overestimate H:C
[76]. For example, OM samples isolated from highly silicified samples via HCl/HF/HCl
attack, often show anomalously high H:C ratios attributable to secondary hydrated
15
mineral contaminants. An example of the extent of such over-estimation is shown in Fig.
S14 for the AIDP kerogens that were prepared as above but without additional kerogen
purification steps. Here, a significant number of the analyzed samples display a nominal
H:C between 25 and 100% higher that measured using the D5/(G+D2) ratio. The
consequences for the systematic application of this method to OM in complex lithologies
are far-reaching: it allows for the verification of OM preservation not only in terms of
burial conditions, but also with respect to kerogen processing and isolation. It can be
argued that kerogen isolation, required for H:C elemental analysis, is in fact no longer
needed for the method proposed here, so long as the Raman spectral signature of OM is
significantly strong to be detected over fluorescence.
Potential uses for the elemental H:C ratio data acquired in this way would be to rapidly
and accurately discern the extent to which thermal metamorphism might have affected
the preservation of hydrocarbon biomarkers [18]. Taken a step further, the elemental H:C
ratios can be used to estimate and correct for positive shifts in the d13C values of highly
mature ancient kerogens, as has been observed by in several studies [15, 77-81]. A small
sample of such calculations (Table S1) confirms that organic matter preserved in Archean
sedimentary sequences is, on average, more 13C-depleted than that found in younger
times consistent with other observations that the Archean carbon cycle must have
operated in fundamentally different ways prior to and following the oxygenation of
Earth’s ocean-atmosphere system [14, 78, 82-84]. Furthermore, because kerogen
isolation is unnecessary, this method may be applied directly to OM still embedded
within its original host rock provided the organic domains are of sufficient size. In this
context, microRaman spectroscopy could afford valuable augmentation for SIMS isotope
analysis of organically-preserved fossils. Being non-destructive, samples could be first
screened in this way to identify chemical differences at small spatial scales to prioritize
regions for detailed SIMS measurements [85-87].
The preservation of OM within its inorganic framework favors investigation of the
spatially resolved variability of H:C through the D5/(G+D2) Raman ratio, within a
particular fossilized object or among several visibly or functionally different objects
16
within the same rock. As an example, we analyzed the protistan microfossil
Trachyhystrichosphaera aimika, preserved in silicified coastal carbonates of the ca. 750
Ma Draken Formation, Spitsbergen [88]. The OM in this ca. 300 µm wide fossil occurs
in a well preserved cell wall and collapsed cell contents within its interior (Fig. 3).
Raman mapping on this fossil was recently performed to investigate the heterogeneity
and potential biotic origin of the OM in organic fossil based on the evolution of structural
order, rather then chemical composition [4-6]. With this work, we set to perform Raman
mapping at different magnifications to quantitatively probe the relation of spectral
sensitivity to differences in H:C across the sample in relation to length-scale. At low
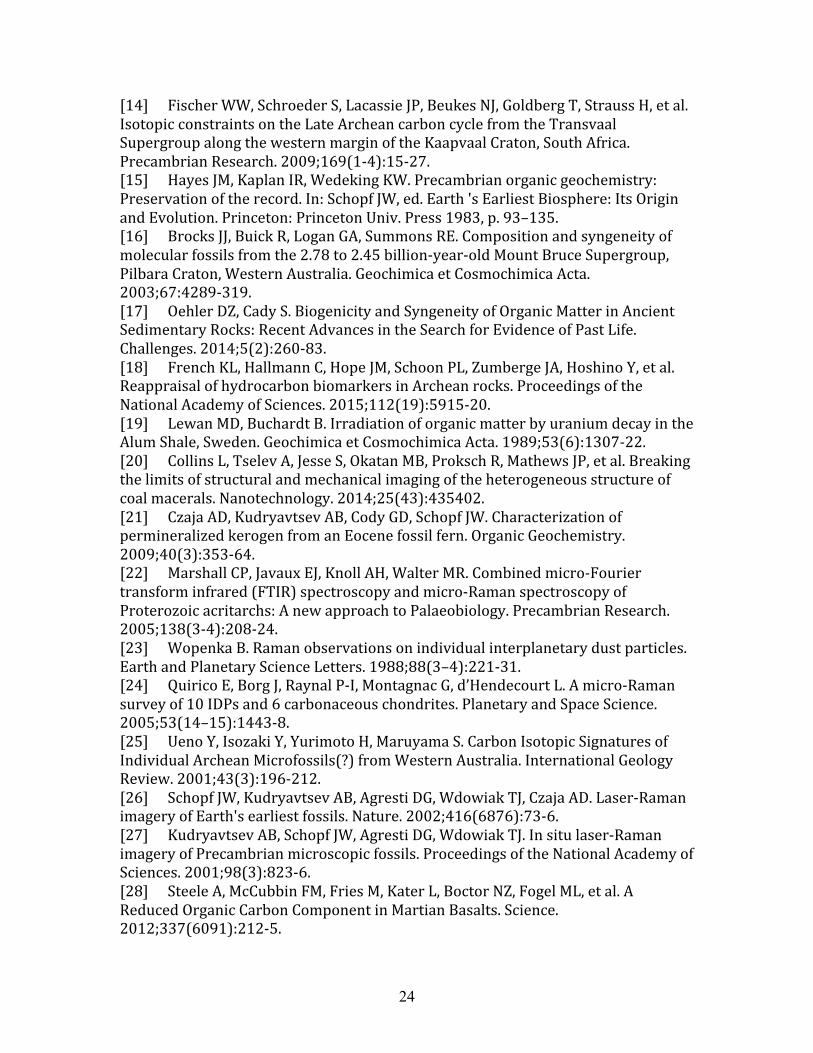
magnification (10x, spatial resolution of ~5 µm), the integrated intensity of the G peak
mapped across the full fossil is shown in Fig. 4a. The absence of significant OM in the
quartz core (green arrow, Fig. 3) is clearly highlighted by the almost negligible intensity
of the G peak in this material. Strong G peak intensity is observed from the collapsed
cytoplasm, the cell walls, and in the space probed outside the cell walls, which is
pigmented by abundant particulate OM. Despite the strong presence of quartz outside the
cell walls, residual organic matter is clearly detected. And despite the observation that
OM is presented in morphologically distinct entities of differing relative abundance (from
the strength of the G peak), there is little variability in the H:C ratio that can be extracted
from the intensity ratio D5/(G+D2) (Fig. 4b). This is not unexpected, as thermal
maturation at the micron-scale should lead to similar H:C values during diagenesis.
However, while strong differences are not expected, phase discrimination based on weak
spectral differences in relation to H:C and nanostructural ordering can be achieved using
a statistical approach based on cluster analysis [40, 41] (Details in Methods and
Supporting Information).
The approach followed in this study is based on mixture modeling and implements
maximum likelihood estimation and Bayesian Information Criteria (BIC) to identify the
most likely model and the number of clusters. Two complementary approaches are
followed in defining the clustering parameters, in addition to the H:C ratio and FWHM of
the G peak, ωG: 1) intensity peak ratios (D1/(G+D2), D5/(G+D2), (D4+D5+D1)/ (G+D2),
(D4+D5)/ (G+D2)) or 2) absolute intensities (D1, D4, D5, G+D2).
17
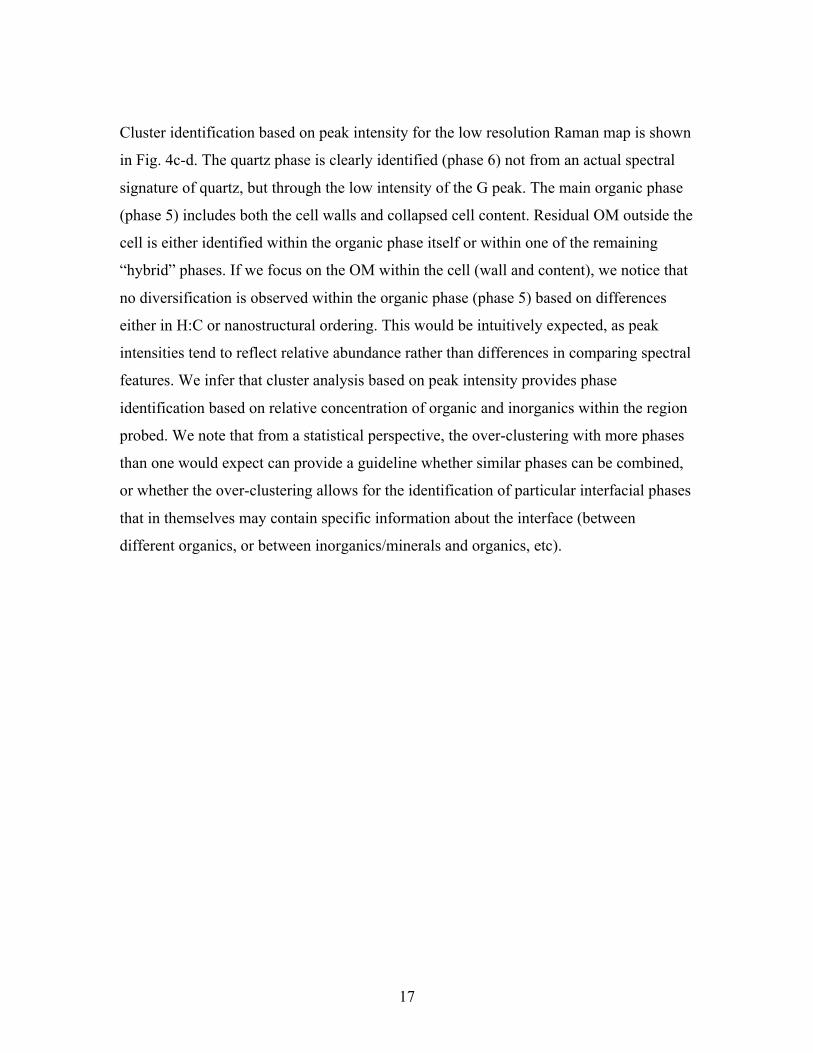
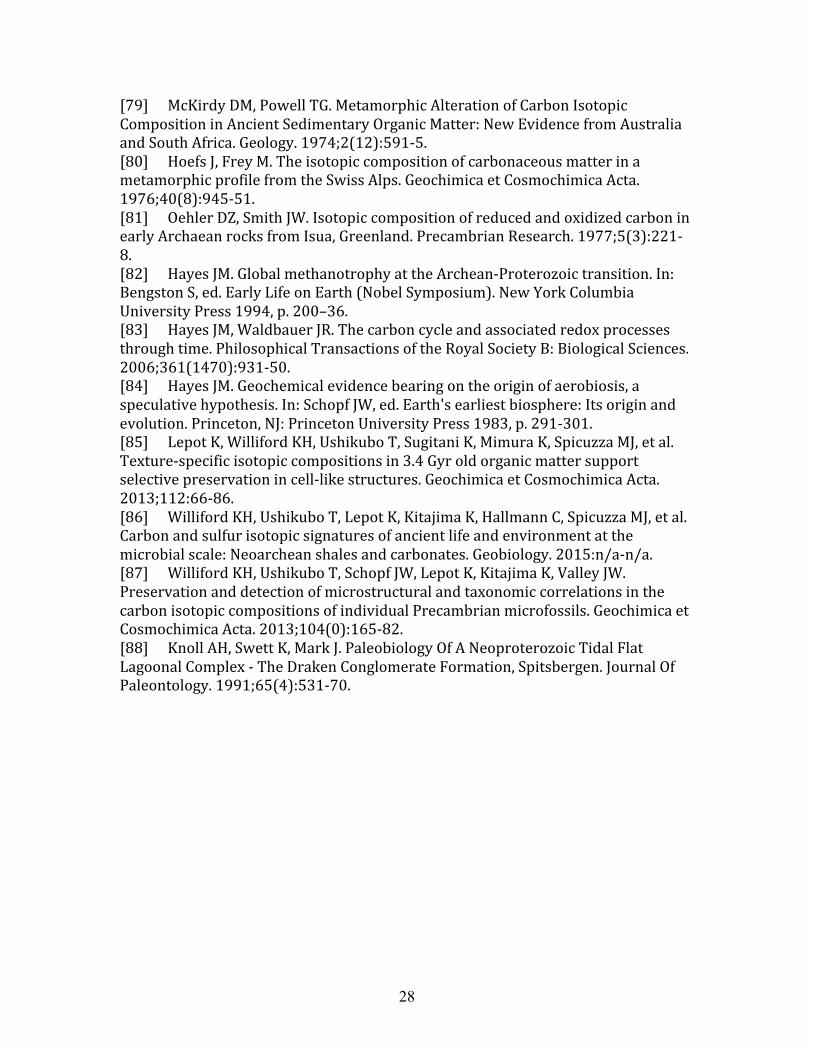
Cluster identification based on peak intensity for the low resolution Raman map is shown
in Fig. 4c-d. The quartz phase is clearly identified (phase 6) not from an actual spectral
signature of quartz, but through the low intensity of the G peak. The main organic phase
(phase 5) includes both the cell walls and collapsed cell content. Residual OM outside the
cell is either identified within the organic phase itself or within one of the remaining
“hybrid” phases. If we focus on the OM within the cell (wall and content), we notice that
no diversification is observed within the organic phase (phase 5) based on differences
either in H:C or nanostructural ordering. This would be intuitively expected, as peak
intensities tend to reflect relative abundance rather than differences in comparing spectral
features. We infer that cluster analysis based on peak intensity provides phase
identification based on relative concentration of organic and inorganics within the region
probed. We note that from a statistical perspective, the over-clustering with more phases
than one would expect can provide a guideline whether similar phases can be combined,
or whether the over-clustering allows for the identification of particular interfacial phases
that in themselves may contain specific information about the interface (between
different organics, or between inorganics/minerals and organics, etc).
18
Figure 4 Low resolution Raman map (magnification 10x) of the protistan microfossil
Trachyhystrichosphaera aimika. (a) Map of the integrated intensity of the G peak; (b) map of the H:C ratio
extracted from the D5/(G+D2) intensity peak ratio. Cluster analysis including intensity peak intensity (D1,
D4, D5, G+D2) identifies 6 different phases. (c) The G peak intensity vs H:C is plotted to highlight the
heterogeneity in H:C in relation to a particular phase. We note that collapsed cell content (blue arrow in
Fig. 3), has a higher average H:C than the cell walls (red arrow in Fig. 3) (d) The Raman map is plotted
against the assigned detected phase. Phase 6 is the quartz core (green arrow in Fig. 3) within the cell walls.
Phase 5 corresponds to the organic matter in the cell wall and collapsed cell content.
19
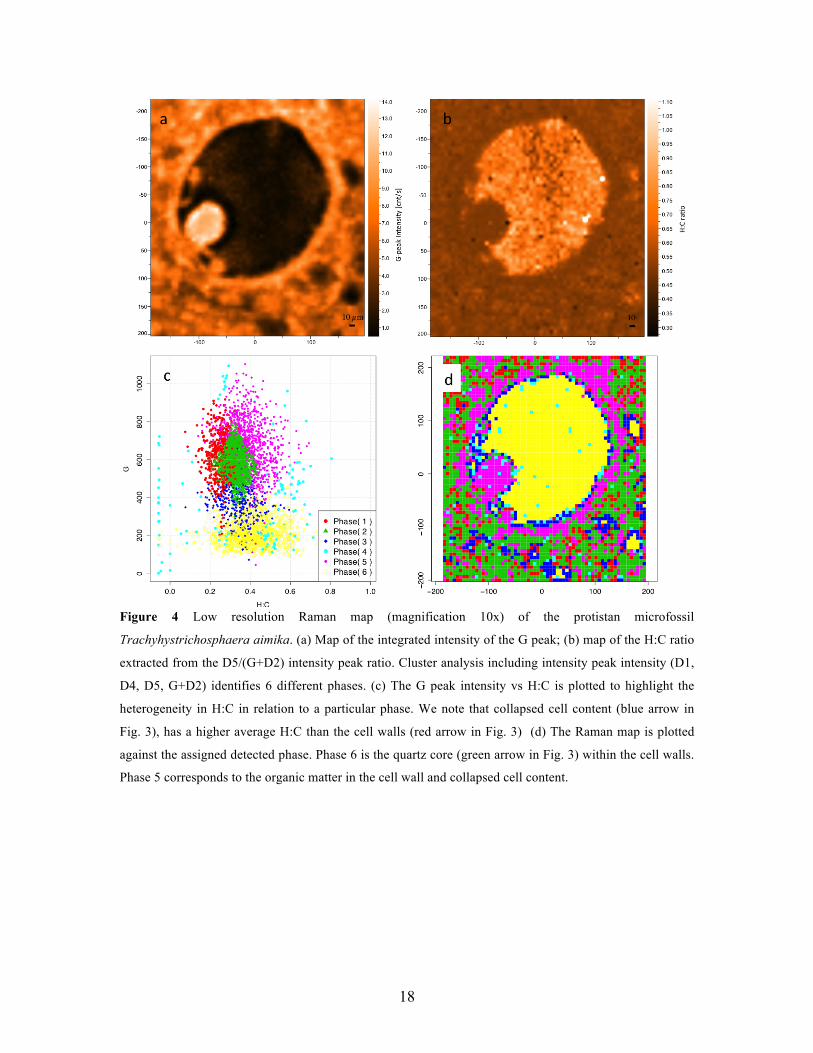
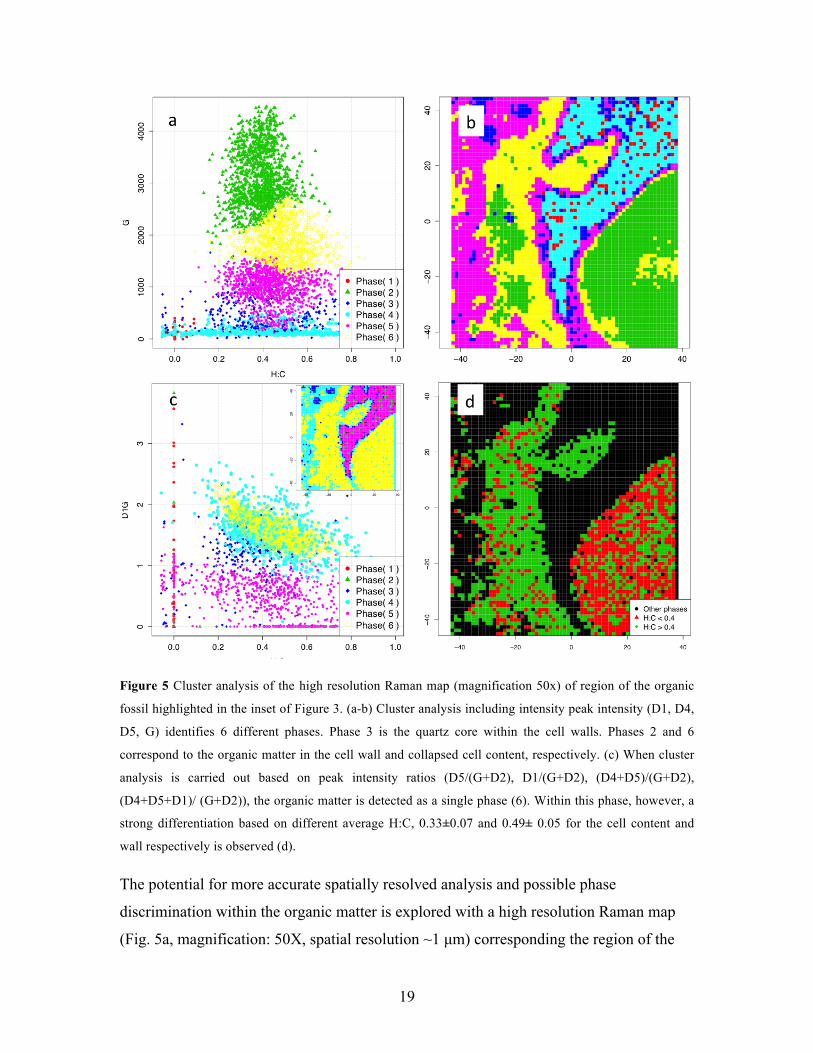
Figure 5 Cluster analysis of the high resolution Raman map (magnification 50x) of region of the organic
fossil highlighted in the inset of Figure 3. (a-b) Cluster analysis including intensity peak intensity (D1, D4,
D5, G) identifies 6 different phases. Phase 3 is the quartz core within the cell walls. Phases 2 and 6
correspond to the organic matter in the cell wall and collapsed cell content, respectively. (c) When cluster
analysis is carried out based on peak intensity ratios (D5/(G+D2), D1/(G+D2), (D4+D5)/(G+D2),
(D4+D5+D1)/ (G+D2)), the organic matter is detected as a single phase (6). Within this phase, however, a
strong differentiation based on different average H:C, 0.33±0.07 and 0.49± 0.05 for the cell content and
wall respectively is observed (d).
The potential for more accurate spatially resolved analysis and possible phase
discrimination within the organic matter is explored with a high resolution Raman map
(Fig. 5a, magnification: 50X, spatial resolution ~1 µm) corresponding the region of the
20
organic fossil highlighted in Fig. 3. The intensity-based cluster analysis still correctly
identifies the inorganic phase (Phase 4, cyan in Fig 5b-c). Two distinct phases are
identified for the OM, from collapsed cell content and walls (phase 2 and 6, green and
purple in Fig. 5b-c). The collapsed cell content is predominant in phase 2, while the cell
wall is equally divided between the phase 2 and 6. In addition to OM abundance, the
distinction in two separate OM phases appears to be partially driven by differences in
H:C, as reflected by the average H:C ratios for the two phases (0.38±0.10 and 0.49±0.10
for phase 2 and 6 respectively), with a threshold in H:C between the two phases of about
0.4. The convolution between the distribution of H:C ratios and difference in OM
concentration limits phase identification based uniquely on H:C within the OM. A clear
example is given by the cell wall, which includes both phases despite having a fairly
homogeneous H:C.
Cluster analysis based on peak intensity ratios removes the variability introduced by
varying concentrations of OM, leaving only variability in H:C (through D5/(G+D2)) and
order in the aromatic nanostructure (D1/G). The results of the clustering based on peak
intensity ratio are shown in Fig. 5c. The OM is identified as a unique phase (phase 6,
yellow in Fig. 5c). Additional OM outside the cell walls is identified by phase 4 (cyan).
The main organic phase 6, appears to span a wide H:C range from 0.2 to 0.7. Such broad
variability is only weakly reflected in the limited variability in D1/G (Fig. 5c), providing
additional insight on the limited reliability of D1/G (associated with ordering and size of
aromatic clusters) as a metric to assess chemical (rather than structural) variability in
OM. In essence, the limited variability in D1/G leaves H:C as the only diversifier
chemical composition. As a result, what appears to be a fairly continuous distribution of
H:C values in the OM (Fig. 5c) result in a single and chemically heterogeneous OM
phase. Yet, when the previously identified threshold in H:C (~0.4) is introduced to the
single OM phase (Fig. 5d), a striking differentiation in H:C appears between the cell
content and wall, based uniquely on original chemical differences between the two
cellular constituents. A relation between structural and chemical diversity may still exists,
since a similar differentiation in structural order was observed between cell content and
cell walls [6]. We conclude that a significant chemical differentiation still exists between
21
the cell walls and the collapsed cell content, that is, however, not reflected in a significant
change in nanostructural ordering of the aromatic component. The general and sample-
agnostic ability to compare independently the same parameter in different phases, shows
that clustering analysis serve a unique opportunity in restricting the pool of parameters
that contribute to a particular feature (for example H:C) and allows for evaluating the
diversity of another parameter (for example D1/G and therefore the size of aromatics)
within that specific phase.
In conclusion, a new quantitative, non-destructive and universal method to directly
extract H:C values from OM has been developed. This method allows for direct
identification of the state of preservation of kerogen as a consequence of both burial and
processing. Its reliance on spectral differences related to both aromatic and non-aromatic
components in OM for the determination of H:C enables the evaluation of maturity with
respect to aromatic microstructural ordering, obtained through the D1/G. By extension,
and benefitting from the non-invasive nature of Raman spectroscopy, chemical mapping
is achieved in combination of statistical cluster analysis, with direct identification of
spatially-resolved inorganic/organic phase detection. This methodology is directly
applicable to the remote search for, and evaluation of, organic matter, geobiological
studies of the early Earth, practical analyses of potential hydrocarbon reservoirs, or for
the extraction of relevant optical and electronic parameters in all-carbon or OM-based
electronic devices. Direct microRaman chemical mapping of microscopic fossils, or the
preserved tissues of macroscopic fossils, or the determination of the chemical variability
within electronic devices is also feasible.
Acknowledgements. N.F. gratefully acknowledges support by Shell Oil Company and
Schlumberger through the X-Shale Consortium under the MIT-Energy Initiative, and
Extramural Research by Shell Innovation Research and Development. R.E.S and E.D.M.
acknowledge support from the Simons Foundation Collaboration on the Origins of Life.
A.H.K and R.E.S. acknowledge support from the NASA Astrobiology Institute. C.H
acknowledges support from the Max Planck Society. Pilbara clean drilling was
generously supported by the Agouron Institute.
22
Author contributions. N.F. and R.E.S. designed the research, analyzed data and wrote
the paper with input from other authors; N.F. performed the research; E.D.M., A.H.K.,
C.H. provided samples and contributed to analysis of the data.
23
References
[1] KellerBD,FerralisN,GrossmanJC.RethinkingCoal:ThinFilmsofSolutionProcessedNaturalCarbonNanoparticlesforElectronicDevices.NanoLetters.2016;16(5):2951-7.[2] CollearyC,DolocanA,GardnerJ,SinghS,WuttkeM,RabensteinR,etal.Chemical,experimental,andmorphologicalevidencefordiageneticallyalteredmelanininexceptionallypreservedfossils.ProceedingsoftheNationalAcademyofSciences.2015;112(41):12592-7.[3] WörmerL,ElvertM,FuchserJ,LippJS,ButtigiegPL,ZabelM,etal.Ultra-high-resolutionpaleoenvironmentalrecordsviadirectlaser-basedanalysisoflipidbiomarkersinsedimentcoresamples.ProceedingsoftheNationalAcademyofSciences.2014;111(44):15669-74.[4] FoucherF,AmmarM-R,WestallF.RevealingthebioticoriginofsilicifiedPrecambriancarbonaceousmicrostructuresusingRamanspectroscopicmapping,apotentialmethodforthedetectionofmicrofossilsonMars.JournalofRamanSpectroscopy.2015;46(10):873-9.[5] FoucherF,WestallF.RamanImagingofMetastableOpalinCarbonaceousMicrofossilsofthe700-800MaOldDrakenFormation.Astrobiology.2013;13(1):57-67.[6] QuY,EngdahlA,ZhuS,VajdaV,McLoughlinN.UltrastructuralHeterogeneityofCarbonaceousMaterialinAncientCherts:InvestigatingBiosignatureOriginandPreservation.Astrobiology.2015;15(10):825-42.[7] GrotzingerJP,SumnerDY,KahLC,StackK,GuptaS,EdgarL,etal.AHabitableFluvio-LacustrineEnvironmentatYellowknifeBay,GaleCrater,Mars.Science.2014;343(6169).[8] FreissinetC,GlavinDP,MahaffyPR,MillerKE,EigenbrodeJL,SummonsRE,etal.OrganicmoleculesintheSheepbedMudstone,GaleCrater,Mars.JournalofGeophysicalResearch:Planets.2015;120:495-514.[9] BiemannK,OroJ,ToulminP,OrgelLE,NierAO,AndersonDM,etal.TheSearchforOrganicSubstancesandInorganicVolatileCompoundsintheSurfaceofMars.JGeophysRes.1977;82(28):4641–58.[10] BiemannK,OroJ,ToulminP,OrgelLE,NierAO,AndersonDM,etal.SearchforOrganicandVolatileInorganicCompoundsinTwoSurfaceSamplesfromtheChrysePlanitiaRegionofMars.Science.1976;194(4260):72-6.[11] MahaffyPR,WebsterCR,CabaneM,ConradPG,CollP,AtreyaSK,etal.TheSampleAnalysisatMarsInvestigationandInstrumentSuite.SpaceScienceReviews.2012;170(1-4):401-78.[12] MingDW,ArcherPD,GlavinDP,EigenbrodeJL,FranzHB,SutterB,etal.VolatileandOrganicCompositionsofSedimentaryRocksinYellowknifeBay,GaleCrater,Mars.Science.2013;1245267Publishedonline9December2013[DOI:10.1126/science.1245267].[13] BrocksJJ,LoganGA,BuickR,SummonsRE.ArcheanMolecularFossilsandtheEarlyRiseofEukaryotes.Science.1999;285(5430):1033-6.
24
[14] FischerWW,SchroederS,LacassieJP,BeukesNJ,GoldbergT,StraussH,etal.IsotopicconstraintsontheLateArcheancarboncyclefromtheTransvaalSupergroupalongthewesternmarginoftheKaapvaalCraton,SouthAfrica.PrecambrianResearch.2009;169(1-4):15-27.[15] HayesJM,KaplanIR,WedekingKW.Precambrianorganicgeochemistry:Preservationoftherecord.In:SchopfJW,ed.Earth'sEarliestBiosphere:ItsOriginandEvolution.Princeton:PrincetonUniv.Press1983,p.93–135.[16] BrocksJJ,BuickR,LoganGA,SummonsRE.Compositionandsyngeneityofmolecularfossilsfromthe2.78to2.45billion-year-oldMountBruceSupergroup,PilbaraCraton,WesternAustralia.GeochimicaetCosmochimicaActa.2003;67:4289-319.[17] OehlerDZ,CadyS.BiogenicityandSyngeneityofOrganicMatterinAncientSedimentaryRocks:RecentAdvancesintheSearchforEvidenceofPastLife.Challenges.2014;5(2):260-83.[18] FrenchKL,HallmannC,HopeJM,SchoonPL,ZumbergeJA,HoshinoY,etal.ReappraisalofhydrocarbonbiomarkersinArcheanrocks.ProceedingsoftheNationalAcademyofSciences.2015;112(19):5915-20.[19] LewanMD,BuchardtB.IrradiationoforganicmatterbyuraniumdecayintheAlumShale,Sweden.GeochimicaetCosmochimicaActa.1989;53(6):1307-22.[20] CollinsL,TselevA,JesseS,OkatanMB,ProkschR,MathewsJP,etal.Breakingthelimitsofstructuralandmechanicalimagingoftheheterogeneousstructureofcoalmacerals.Nanotechnology.2014;25(43):435402.[21] CzajaAD,KudryavtsevAB,CodyGD,SchopfJW.CharacterizationofpermineralizedkerogenfromanEocenefossilfern.OrganicGeochemistry.2009;40(3):353-64.[22] MarshallCP,JavauxEJ,KnollAH,WalterMR.Combinedmicro-Fouriertransforminfrared(FTIR)spectroscopyandmicro-RamanspectroscopyofProterozoicacritarchs:AnewapproachtoPalaeobiology.PrecambrianResearch.2005;138(3-4):208-24.[23] WopenkaB.Ramanobservationsonindividualinterplanetarydustparticles.EarthandPlanetaryScienceLetters.1988;88(3–4):221-31.[24] QuiricoE,BorgJ,RaynalP-I,MontagnacG,d’HendecourtL.Amicro-Ramansurveyof10IDPsand6carbonaceouschondrites.PlanetaryandSpaceScience.2005;53(14–15):1443-8.[25] UenoY,IsozakiY,YurimotoH,MaruyamaS.CarbonIsotopicSignaturesofIndividualArcheanMicrofossils(?)fromWesternAustralia.InternationalGeologyReview.2001;43(3):196-212.[26] SchopfJW,KudryavtsevAB,AgrestiDG,WdowiakTJ,CzajaAD.Laser-RamanimageryofEarth'searliestfossils.Nature.2002;416(6876):73-6.[27] KudryavtsevAB,SchopfJW,AgrestiDG,WdowiakTJ.Insitulaser-RamanimageryofPrecambrianmicroscopicfossils.ProceedingsoftheNationalAcademyofSciences.2001;98(3):823-6.[28] SteeleA,McCubbinFM,FriesM,KaterL,BoctorNZ,FogelML,etal.AReducedOrganicCarbonComponentinMartianBasalts.Science.2012;337(6091):212-5.
25
[29] BeyssacO,GofféB,PetitetJ-P,FroigneuxE,MoreauM,RouzaudJ-N.OnthecharacterizationofdisorderedandheterogeneouscarbonaceousmaterialsbyRamanspectroscopy.SpectrochimicaActaPartA:MolecularandBiomolecularSpectroscopy.2003;59(10):2267-76.[30] BeyssacO,RouzaudJ-N,GofféB,BrunetF,ChopinC.Graphitizationinahigh-pressure,low-temperaturemetamorphicgradient:aRamanmicrospectroscopyandHRTEMstudy.ContribMineralPetrol.2002;143(1):19-31.[31] LahfidA,BeyssacO,DevilleE,NegroF,ChopinC,GofféB.EvolutionoftheRamanspectrumofcarbonaceousmaterialinlow-grademetasedimentsoftheGlarusAlps(Switzerland).TerraNova.2010;22(5):354-60.[32] BowerDM,SteeleA,FriesMD,KaterL.MicroRamanSpectroscopyofCarbonaceousMaterialinMicrofossilsandMeteorites:ImprovingaMethodforLifeDetection.Astrobiology.2012;13(1):103-13.[33] SfornaMC,vanZuilenMA,PhilippotP.StructuralcharacterizationbyRamanhyperspectralmappingoforganiccarboninthe3.46billion-year-oldApexchert,WesternAustralia.GeochimicaetCosmochimicaActa.2014;124:18-33.[34] JehličkaJ,BényC.ApplicationofRamanmicrospectrometryinthestudyofstructuralchangesinPrecambriankerogensduringregionalmetamorphism.OrganicGeochemistry.1992;18(2):211-3.[35] SchopfJW,KudryavtsevAB,AgrestiDG,CzajaAD,WdowiakTJ.RamanImagery:ANewApproachtoAssesstheGeochemicalMaturityandBiogenicityofPermineralizedPrecambrianFossils.Astrobiology.2005;5(3):333-71.[36] Heredia-GuerreroJA,BenítezJJ,DomínguezE,BayerI,CingolaniR,AthanassiouA,etal.InfraredandRamanspectroscopicfeaturesofplantcuticles:Areview.FrontiersinPlantScience.2014;5.[37] MarshallCP,LoveGD,SnapeCE,HillAC,AllwoodAC,WalterMR,etal.Structuralcharacterizationofkerogenin3.4†GaArchaeanchertsfromthePilbaraCraton,WesternAustralia.PrecambrianResearch.2007;155(1-2):1-23.[38] RisplendiF,BernardiM,CiceroG,GrossmanJC.Structure-propertyrelationsinamorphouscarbonforphotovoltaics.AppliedPhysicsLetters.2014;105(4):043903.[39] FraleyC,RafteryAE.Model-BasedClustering,DiscriminantAnalysis,andDensityEstimation.JournaloftheAmericanStatisticalAssociation.2002;97(458):611-31.[40] FraleyC,RafteryAE.MCLUST:SoftwareforModel-BasedClusterAnalysis.JofClassification.1999;16(2):297-306.[41] FraleyC,RafteryAE.Model-basedmethodsofclassification:usingthemclustsoftwareinchemometrics.JournalofStatisticalSoftware.2007;18:1—13.[42] WalterMR,HofmannHJ,SchopfJW.Apendix1;Geographicandgeologicdataforprocessedsamples.In:SchopfJW,ed.Earth'searliestbiosphere.Princeton,N.J.:PrincetonUniversityPres1983,p.385-414.[43] AnbarAD,DuanY,LyonsTW,ArnoldGL,KendallB,CreaserRA,etal.AWhiffofOxygenBeforetheGreatOxidationEvent?Science.2007;317(5846):1903-6.[44] BuickR,AnbarAD,MojzsisSJ,KaufmanAJ,KieftTL,LyonsTW,etal.ThecaseforscientificdrillingofPrecambriansedimentarysequences:AmissiontoearlyEarth.AmericanGeophysicalUnion,FallMeeting2001,abstract#P22B-0544.2004.
26
[45] BeukesNJ,EvansDAD,GrotzingerJP,KirschvinkJL,KnollAH,SumnerDY.MultidisciplinaryStudyOfThePrecambrianBiosphereAndSurficialOxygenation,KaapvaalCraton,SouthAfrica:TheAgouronCores.InternationalJournalofAstrobiology,Supplement.2004;15.[46] WaldbauerJR,ShermanLS,SumnerDY,SummonsRE.LateArcheanmolecularfossilsfromtheTransvaalSupergrouprecordtheantiquityofmicrobialdiversityandaerobiosis.PrecambrianResearch.2009;169:28–47.[47] SimonsonBM,SumnerDY,BeukesNJ,JohnsonS,GutzmerJ.CorrelatingmultipleNeoarchean-PaleoproterozoicimpactspherulelayersbetweenSouthAfricaandWesternAustralia.PrecambrianResearch.2009;169(1-4):100-11.[48] KnollAH,BeukesNJ.Introduction:InitialinvestigationsofaNeoarcheanshelfmargin-basintransition(TransvaalSupergroup,SouthAfrica).PrecambrianResearch.2009;169(1-4):1-14.[49] FerrariAC,RobertsonJ.InterpretationofRamanspectraofdisorderedandamorphouscarbon.PhysicalReviewB.2000;61(20):14095-107.[50] SchopfJW,ed.Earth'searliestbiosphere:Itsoriginandevolution.Princeton,NJ:PrincetonUniversityPress1983.[51] MalardLM,PimentaMA,DresselhausG,DresselhausMS.Ramanspectroscopyingraphene.PhysicsReports.2009;473(5–6):51-87.[52] KouketsuY,MizukamiT,MoriH,EndoS,AoyaM,HaraH,etal.AnewapproachtodeveloptheRamancarbonaceousmaterialgeothermometerforlow-grademetamorphismusingpeakwidth.IslandArc.2014;23(1):33-50.[53] BouhaddaY,BormannD,SheuE,BendedouchD,KrallafaA,DaaouM.CharacterizationofAlgerianHassi-MessaoudasphaltenestructureusingRamanspectrometryandX-raydiffraction.Fuel.2007;86(12–13):1855-64.[54] SadezkyA,MuckenhuberH,GrotheH,NiessnerR,PöschlU.Ramanmicrospectroscopyofsootandrelatedcarbonaceousmaterials:Spectralanalysisandstructuralinformation.Carbon.2005;43(8):1731-42.[55] LiX,HayashiJ-i,LiC-Z.FT-RamanspectroscopicstudyoftheevolutionofcharstructureduringthepyrolysisofaVictorianbrowncoal.Fuel.2006;85(12–13):1700-7.[56] TuinstraF,KoenigJL.RamanSpectrumofGraphite.TheJournalofChemicalPhysics.1970;53:1126-30.[57] PimentaMA,DresselhausG,DresselhausMS,CancadoLG,JorioA,SaitoR.Studyingdisorderingraphite-basedsystemsbyRamanspectroscopy.PhysicalChemistryChemicalPhysics.2007;9(11):1276-90.[58] MartinsFerreiraEH,MoutinhoMVO,StavaleF,LuccheseMM,CapazRB,AcheteCA,etal.EvolutionoftheRamanspectrafromsingle-,few-,andmany-layergraphenewithincreasingdisorder.PhysicalReviewB.2010;82(12):125429.[59] BeyssacO,GofféB,ChopinC,RouzaudJN.Ramanspectraofcarbonaceousmaterialinmetasediments:anewgeothermometer.JournalofMetamorphicGeology.2002;20(9):859-71.[60] TissotBP,WelteDH.Petroleumformationandoccurrence:anewapproachtooilandgasexploration;1978.[61] HarrisLV,HutchinsonIB,IngleyR,MarshallCP,OlcottMarshallA,EdwardsHGM.SelectionofPortableSpectrometersforPlanetaryExploration:AComparison
27
of532 nmand785 nmRamanSpectroscopyofReducedCarboninArcheanCherts.Astrobiology.2015;15(6):420-9.[62] FerralisN,LiuY,BakeKD,PomerantzAE,GrossmanJC.Directcorrelationbetweenaromatizationofcarbon-richorganicmatteranditsvisibleelectronicabsorptionedge.Carbon.2015;88:139-47.[63] KoyamaY,IkedaK-i.Ramanspectraandconformationsofthecis-unsaturatedfatty-acidchains.ChemistryandPhysicsofLipids.1980;26(2):149-72.[64] DeGelderJ,DeGussemK,VandenabeeleP,MoensL.ReferencedatabaseofRamanspectraofbiologicalmolecules.JournalofRamanSpectroscopy.2007;38(9):1133-47.[65] KuzmanyH,PfeifferR,SalkN,GüntherB.Themysteryofthe1140cm−1Ramanlineinnanocrystallinediamondfilms.Carbon.2004;42(5–6):911-7.[66] FerrariAC,RobertsonJ.ResonantRamanspectroscopyofdisordered,amorphous,anddiamondlikecarbon.PhysicalReviewB.2001;64(7):075414.[67] FrankCJ,McCreeryRL,ReddDCB.RamanSpectroscopyofNormalandDiseasedHumanBreastTissues.AnalyticalChemistry.1995;67(5):777-83.[68] AfsethNK,WoldJP,SegtnanVH.ThepotentialofRamanspectroscopyforcharacterisationofthefattyacidunsaturationofsalmon.AnalyticaChimicaActa.2006;572(1):85-92.[69] BaetenV,HourantP,MoralesMT,AparicioR.OilandFatClassificationbyFT-RamanSpectroscopy.JournalofAgriculturalandFoodChemistry.1998;46(7):2638-46.[70] OlsenEF,RukkeE-O,FlåttenA,IsakssonT.Quantitativedeterminationofsaturated-,monounsaturated-andpolyunsaturatedfattyacidsinporkadiposetissuewithnon-destructiveRamanspectroscopy.MeatScience.2007;76(4):628-34.[71] DongW,ZhangY,ZhangB,WangX.RapidpredictionoffattyacidcompositionofvegetableoilbyRamanspectroscopycoupledwithleastsquaressupportvectormachines.JournalofRamanSpectroscopy.2013;44(12):1739-45.[72] MayoDW,MillerFA,HannahRW.CourseNotesontheInterpretationofInfraredandRamanSpectra:JohnWiley&Sons,Inc.;2003.[73] LongDA.Ramanspectroscopy:McGraw-Hill;1977.[74] FerrariAC.Ramanspectroscopyofgrapheneandgraphite:Disorder,electron–phononcoupling,dopingandnonadiabaticeffects.SolidStateCommunications.2007;143(1–2):47-57.[75] BeegleL,BhartiaR,WhiteM,DeFloresL,AbbeyW,Yen-HungW,etal.SHERLOC:ScanninghabitableenvironmentswithRaman&luminescencefororganics&chemicals.AerospaceConference,2015IEEE;p.1-11.[76] DurandB,ed.Kerogen,InsolubleOrganicMatterfromSedimentaryRocks.Paris:EditionsTechnip1980.[77] DesMaraisDJ.IsotopicEvolutionoftheBiogeochemicalCarbonCycleDuringthePrecambrian.ReviewsinMineralogyandGeochemistry.2001;43(1):555-78.[78] DesMaraisDJ,StraussH,SummonsRE,HayesJM.CarbonisotopeevidenceforthestepwiseoxidationoftheProterozoicenvironment.Nature.1992;359(6396):605-9.
28
[79] McKirdyDM,PowellTG.MetamorphicAlterationofCarbonIsotopicCompositioninAncientSedimentaryOrganicMatter:NewEvidencefromAustraliaandSouthAfrica.Geology.1974;2(12):591-5.[80] HoefsJ,FreyM.TheisotopiccompositionofcarbonaceousmatterinametamorphicprofilefromtheSwissAlps.GeochimicaetCosmochimicaActa.1976;40(8):945-51.[81] OehlerDZ,SmithJW.IsotopiccompositionofreducedandoxidizedcarboninearlyArchaeanrocksfromIsua,Greenland.PrecambrianResearch.1977;5(3):221-8.[82] HayesJM.GlobalmethanotrophyattheArchean-Proterozoictransition.In:BengstonS,ed.EarlyLifeonEarth(NobelSymposium).NewYorkColumbiaUniversityPress1994,p.200–36.[83] HayesJM,WaldbauerJR.Thecarboncycleandassociatedredoxprocessesthroughtime.PhilosophicalTransactionsoftheRoyalSocietyB:BiologicalSciences.2006;361(1470):931-50.[84] HayesJM.Geochemicalevidencebearingontheoriginofaerobiosis,aspeculativehypothesis.In:SchopfJW,ed.Earth'searliestbiosphere:Itsoriginandevolution.Princeton,NJ:PrincetonUniversityPress1983,p.291-301.[85] LepotK,WillifordKH,UshikuboT,SugitaniK,MimuraK,SpicuzzaMJ,etal.Texture-specificisotopiccompositionsin3.4Gyroldorganicmattersupportselectivepreservationincell-likestructures.GeochimicaetCosmochimicaActa.2013;112:66-86.[86] WillifordKH,UshikuboT,LepotK,KitajimaK,HallmannC,SpicuzzaMJ,etal.Carbonandsulfurisotopicsignaturesofancientlifeandenvironmentatthemicrobialscale:Neoarcheanshalesandcarbonates.Geobiology.2015:n/a-n/a.[87] WillifordKH,UshikuboT,SchopfJW,LepotK,KitajimaK,ValleyJW.PreservationanddetectionofmicrostructuralandtaxonomiccorrelationsinthecarbonisotopiccompositionsofindividualPrecambrianmicrofossils.GeochimicaetCosmochimicaActa.2013;104(0):165-82.[88] KnollAH,SwettK,MarkJ.PaleobiologyOfANeoproterozoicTidalFlatLagoonalComplex-TheDrakenConglomerateFormation,Spitsbergen.JournalOfPaleontology.1991;65(4):531-70.
1
Supplementary Information
Rapid, direct and non-destructive assessment of fossil organic matter via microRaman spectroscopy Nicola Ferralis, Emily D. Matys, Andrew H. Knoll, Christian Hallmann, Roger E. Summons
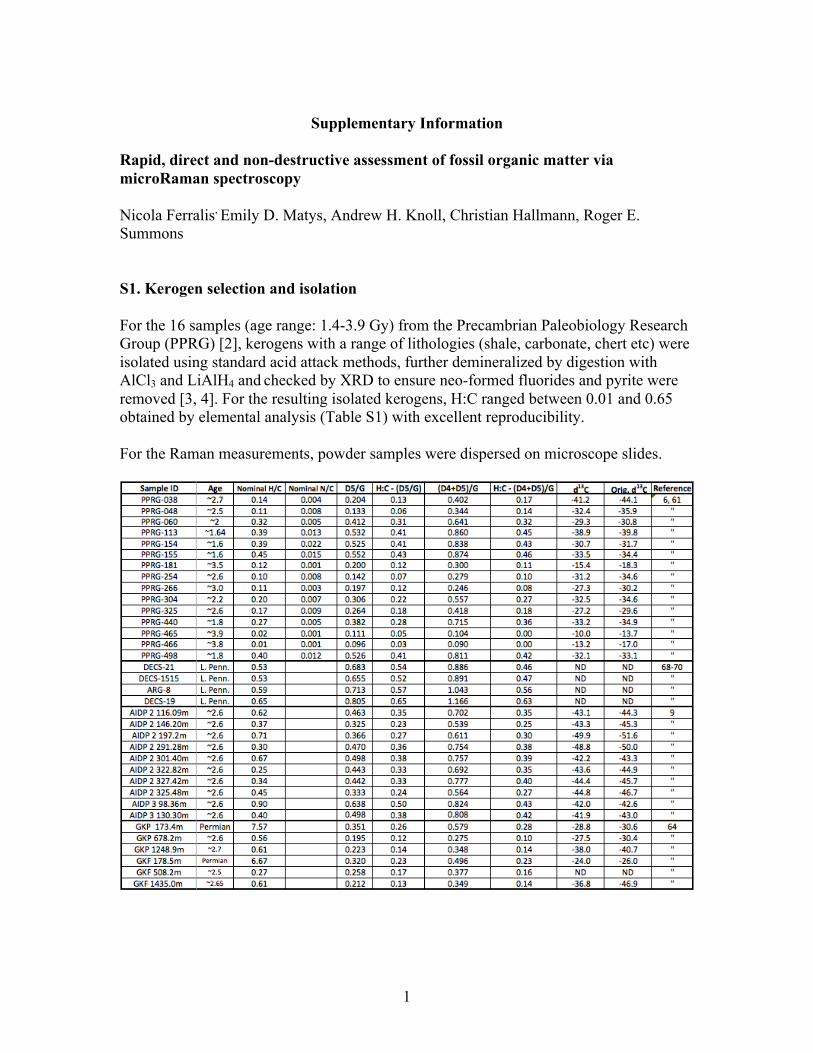
S1. Kerogen selection and isolation For the 16 samples (age range: 1.4-3.9 Gy) from the Precambrian Paleobiology Research Group (PPRG) [2], kerogens with a range of lithologies (shale, carbonate, chert etc) were isolated using standard acid attack methods, further demineralized by digestion with AlCl3 and LiAlH4 and checked by XRD to ensure neo-formed fluorides and pyrite were removed [3, 4]. For the resulting isolated kerogens, H:C ranged between 0.01 and 0.65 obtained by elemental analysis (Table S1) with excellent reproducibility. For the Raman measurements, powder samples were dispersed on microscope slides.
2
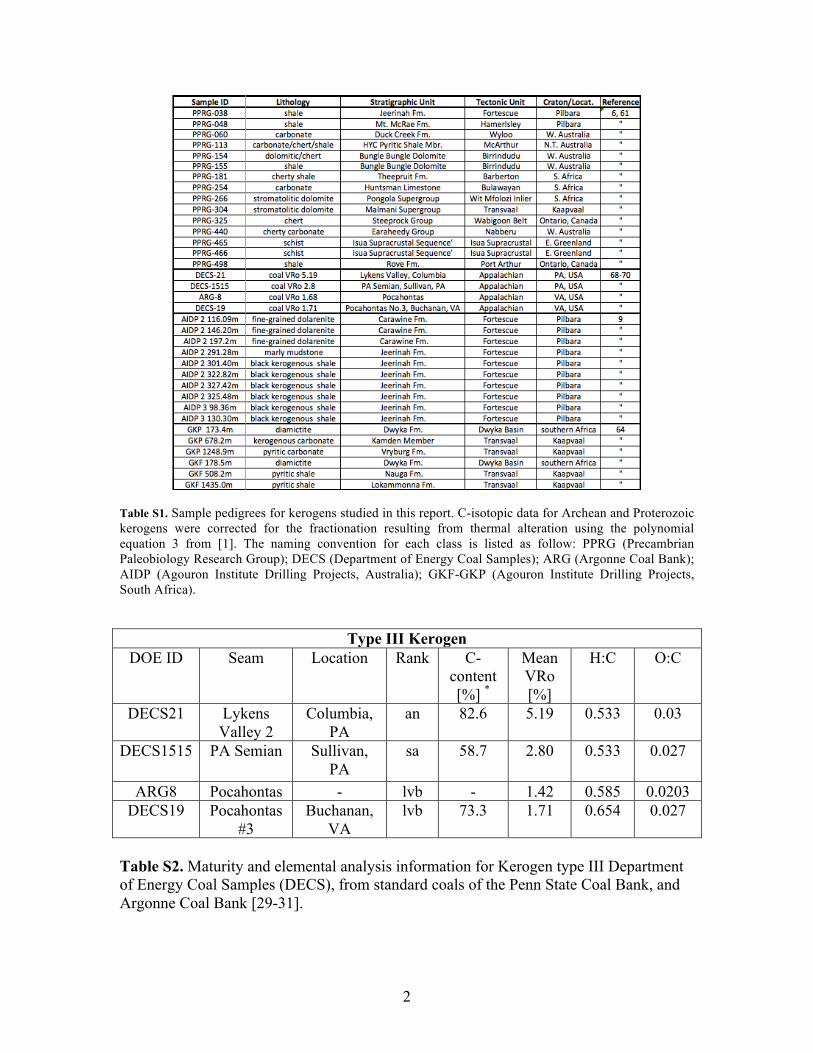
Table S1. Sample pedigrees for kerogens studied in this report. C-isotopic data for Archean and Proterozoic kerogens were corrected for the fractionation resulting from thermal alteration using the polynomial equation 3 from [1]. The naming convention for each class is listed as follow: PPRG (Precambrian Paleobiology Research Group); DECS (Department of Energy Coal Samples); ARG (Argonne Coal Bank); AIDP (Agouron Institute Drilling Projects, Australia); GKF-GKP (Agouron Institute Drilling Projects, South Africa).
Type III Kerogen
DOE ID Seam Location Rank C-content [%] *
Mean VRo [%]
H:C O:C
DECS21 Lykens Valley 2
Columbia, PA
an 82.6 5.19 0.533 0.03
DECS1515 PA Semian Sullivan, PA
sa 58.7 2.80 0.533 0.027
ARG8 Pocahontas - lvb - 1.42 0.585 0.0203 DECS19 Pocahontas
#3 Buchanan,
VA lvb 73.3 1.71 0.654 0.027
Table S2. Maturity and elemental analysis information for Kerogen type III Department of Energy Coal Samples (DECS), from standard coals of the Penn State Coal Bank, and Argonne Coal Bank [29-31].
3
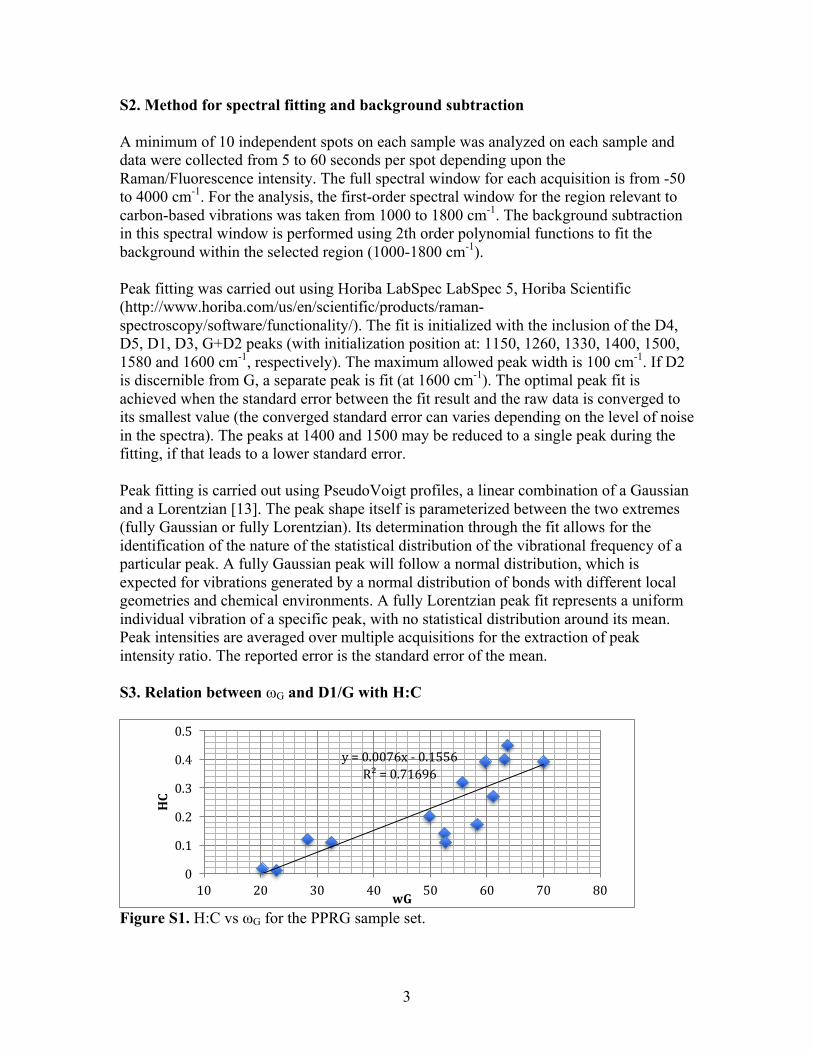
S2. Method for spectral fitting and background subtraction A minimum of 10 independent spots on each sample was analyzed on each sample and data were collected from 5 to 60 seconds per spot depending upon the Raman/Fluorescence intensity. The full spectral window for each acquisition is from -50 to 4000 cm-1. For the analysis, the first-order spectral window for the region relevant to carbon-based vibrations was taken from 1000 to 1800 cm-1. The background subtraction in this spectral window is performed using 2th order polynomial functions to fit the background within the selected region (1000-1800 cm-1). Peak fitting was carried out using Horiba LabSpec LabSpec 5, Horiba Scientific (http://www.horiba.com/us/en/scientific/products/raman-spectroscopy/software/functionality/). The fit is initialized with the inclusion of the D4, D5, D1, D3, G+D2 peaks (with initialization position at: 1150, 1260, 1330, 1400, 1500, 1580 and 1600 cm-1, respectively). The maximum allowed peak width is 100 cm-1. If D2 is discernible from G, a separate peak is fit (at 1600 cm-1). The optimal peak fit is achieved when the standard error between the fit result and the raw data is converged to its smallest value (the converged standard error can varies depending on the level of noise in the spectra). The peaks at 1400 and 1500 may be reduced to a single peak during the fitting, if that leads to a lower standard error. Peak fitting is carried out using PseudoVoigt profiles, a linear combination of a Gaussian and a Lorentzian [13]. The peak shape itself is parameterized between the two extremes (fully Gaussian or fully Lorentzian). Its determination through the fit allows for the identification of the nature of the statistical distribution of the vibrational frequency of a particular peak. A fully Gaussian peak will follow a normal distribution, which is expected for vibrations generated by a normal distribution of bonds with different local geometries and chemical environments. A fully Lorentzian peak fit represents a uniform individual vibration of a specific peak, with no statistical distribution around its mean. Peak intensities are averaged over multiple acquisitions for the extraction of peak intensity ratio. The reported error is the standard error of the mean. S3. Relation between ωG and D1/G with H:C
Figure S1. H:C vs ωG for the PPRG sample set.
y=0.0076x- 0.1556R²=0.71696
0
0.1
0.2
0.3
0.4
0.5
10 20 30 40 50 60 70 80
HC
wG
4
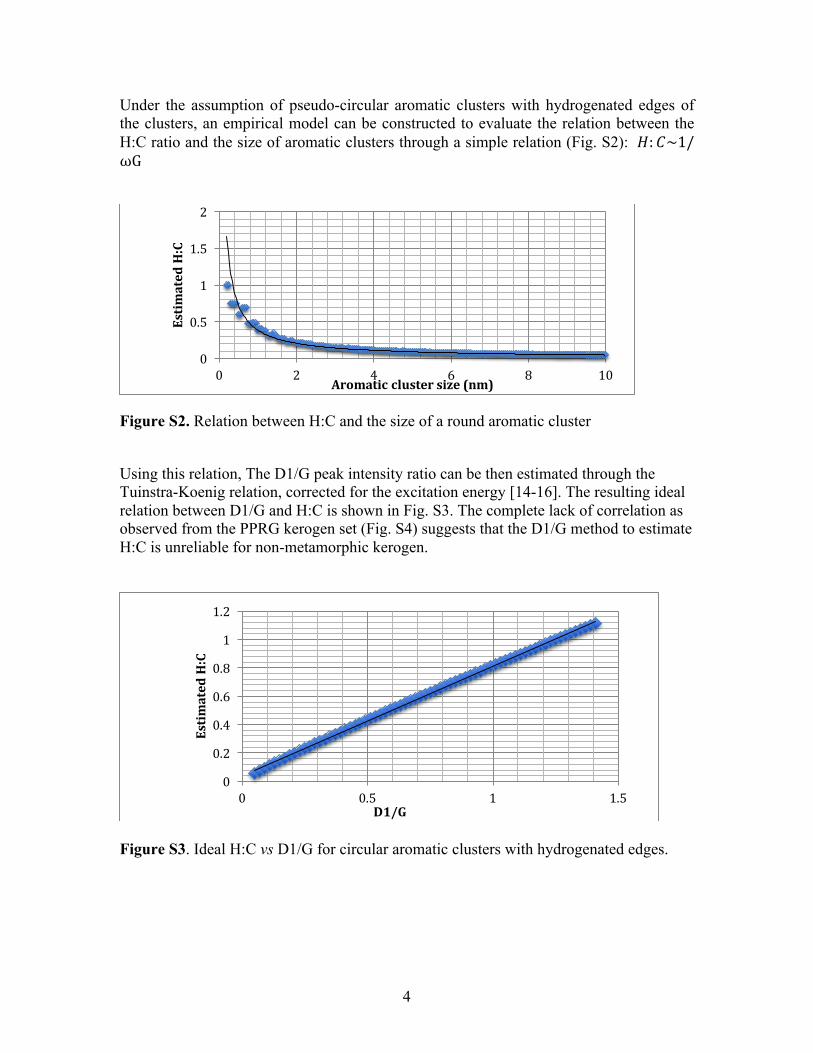
Under the assumption of pseudo-circular aromatic clusters with hydrogenated edges of the clusters, an empirical model can be constructed to evaluate the relation between the H:C ratio and the size of aromatic clusters through a simple relation (Fig. S2): 𝐻: 𝐶~1/ωG
Figure S2. Relation between H:C and the size of a round aromatic cluster
Using this relation, The D1/G peak intensity ratio can be then estimated through the Tuinstra-Koenig relation, corrected for the excitation energy [14-16]. The resulting ideal relation between D1/G and H:C is shown in Fig. S3. The complete lack of correlation as observed from the PPRG kerogen set (Fig. S4) suggests that the D1/G method to estimate H:C is unreliable for non-metamorphic kerogen.
Figure S3. Ideal H:C vs D1/G for circular aromatic clusters with hydrogenated edges.
0
0.5
1
1.5
2
0 2 4 6 8 10
Estim
atedH:C
Aromaticclustersize(nm)
0
0.2
0.4
0.6
0.8
1
1.2
0 0.5 1 1.5
Estim
atedH:C
D1/G
5
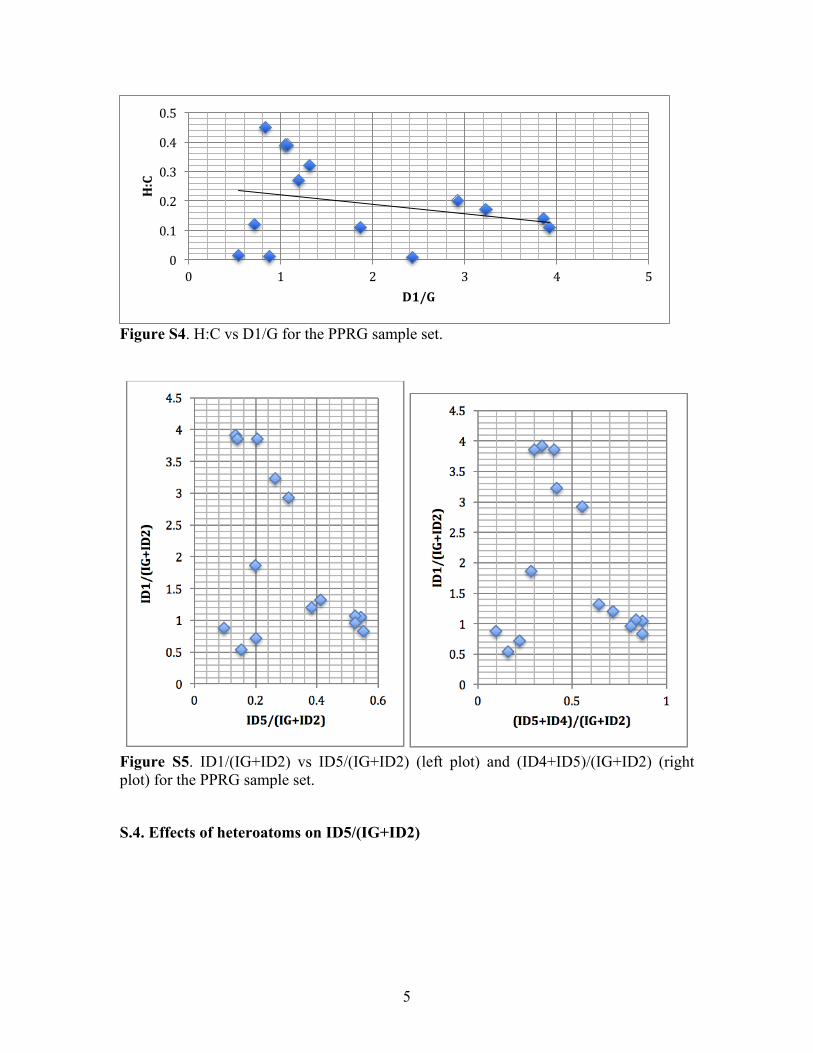
Figure S4. H:C vs D1/G for the PPRG sample set.
Figure S5. ID1/(IG+ID2) vs ID5/(IG+ID2) (left plot) and (ID4+ID5)/(IG+ID2) (right plot) for the PPRG sample set.
S.4. Effects of heteroatoms on ID5/(IG+ID2)
0
0.1
0.2
0.3
0.4
0.5
0 1 2 3 4 5
H:C
D1/G
6
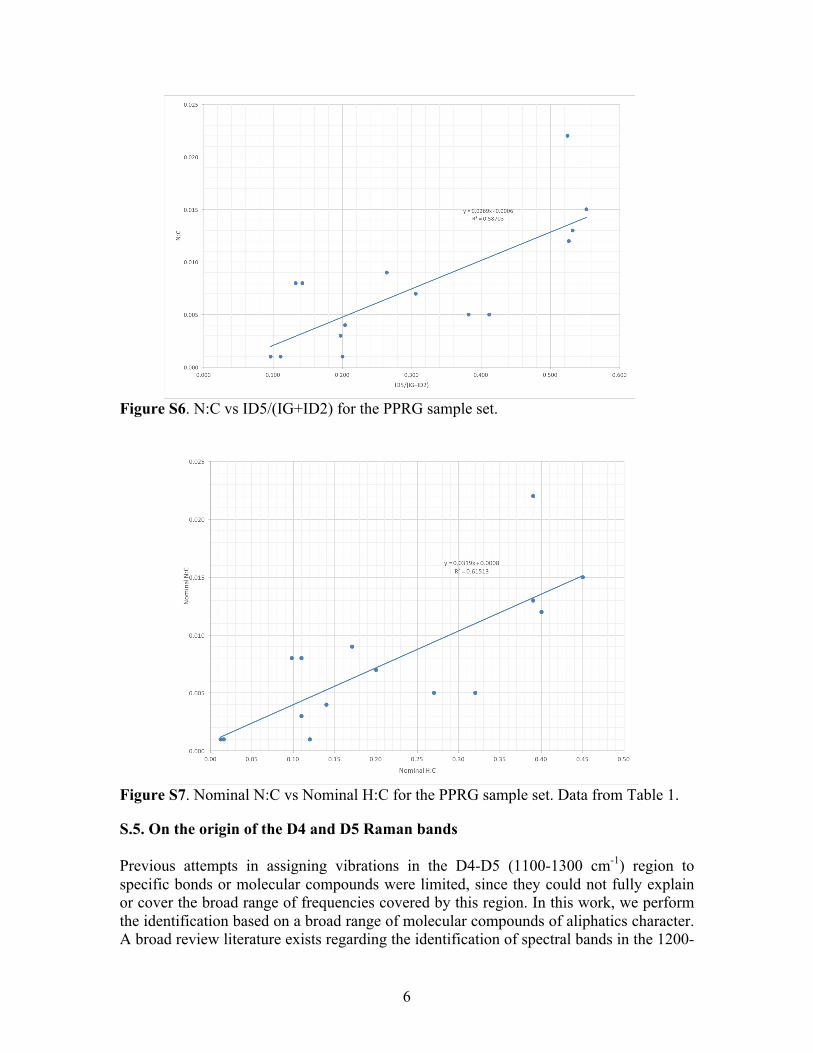
Figure S6. N:C vs ID5/(IG+ID2) for the PPRG sample set.
Figure S7. Nominal N:C vs Nominal H:C for the PPRG sample set. Data from Table 1.
S.5. On the origin of the D4 and D5 Raman bands Previous attempts in assigning vibrations in the D4-D5 (1100-1300 cm-1) region to specific bonds or molecular compounds were limited, since they could not fully explain or cover the broad range of frequencies covered by this region. In this work, we perform the identification based on a broad range of molecular compounds of aliphatics character. A broad review literature exists regarding the identification of spectral bands in the 1200-
7
1300 cm-1region for aliphatic compounds e.g. [17, 18]. A particularly fitting class of organic compounds, fatty acids, have been widely studied with Raman spectroscopy to evaluate their state of saturation. The Raman bands in the D4-D5 region are used as metric indicators for saturation for uses in multiple disciplines from medical diagnostics [19] to food science to characterize the type of lipids [20-23]. In this work, we used fatty acids as a proxy of molecular compounds where deformation modes of CH species (both C-H and =C-H) typical of long saturated and unsaturated alkane chains can be found in the D4-D5 spectral region [20, 24]. Such C-H deformation modes directly relate to H:C in aliphatics systems. However, in addition to these, several other modes exists from aliphatic compounds that directly affect H:C. Strong bands related to stretching modes (v(CC)) in alkanes appear up to 1300 cm-1, with broad variations below this frequency threshold (Chapter 2 of [18]). For example, in long chain methylene systems several twisting modes of CH2 modes take place in the D4-D5 region, from 1150 and 1300 cm-1 (Fig. 2.12 in [18]). The extreme diversity within different families of alkanes is consistent with the lack of a pronounced individual peak. Such variety is the result of the dependence of the coupled wagging and twisting vibrations in C-H with the nature of the adjacent carbons, and any change in the character of such carbons will affect the twisting mode [17, 18]. While such modes are usually very weak in IR, they are very strong for Raman. Other examples of non-aromatic compounds exist with frequencies in the D5 region: for example, allenes C=C=C stretch vibration is at 1076 cm-1 (Chapter 4 in [18]). This points to the fact that other aliphatic vibration appears to in this region. The presence of functionalities in allenes (or the use of deuterium), shows significant downwards deviations in the stretch vibration, further enriching the presence of spectral signal below 1300 [18]. Therefore, such assignment leads to a direct link between the signal strength in the D4-D5 region and H:C uniquely from aliphatics. Since the contribution of aliphatics to the G peak is essentially absent (as G is purely of aromatic character), the ratio reflects directly the amount o H:C from aliphatics in relation to aromatics. Furthermore, any contribution from unsaturated hydrocarbons with at least one C=C (alkenes) is not significant in the D4-D5, since most stretch vibrations appear in the region >1650, while out of-plane modes are in the <990 region, outside of the region of interest (Chapter 5 of [18]). The question of whether C-H in aromatics contribute directly to the D4-D5 region is addressed by noting that hydrogenated edges of aromatic clusters do not exhibit any vibration in this region (see table 5.4 in [18]). Ring stretching modes (such D1, ~1330 cm-1) and shear modes (G at ~1580-1600 cm-1) are typical vibrations for large aromatics. The presence of atomic hydrogen on their edges does not affect the spectra. C-C stretch vibrations at aromatic edges by added methyl groups (for example in hexamethyl benzene or toluene) do not significantly affect ring stretching or shear modes [18]. It is worth nothing, however, that the actual C-C stretch and rocking modes between the benzene ring and the methyl group in toluene occurs in the D4-D5 region 1040 and 1155, 1200 [25]. In this case, as for aliphatics, the additional methyl group on the benzene ring is accounted in the D4-D5 in the total H:C.
8
In essence, the observed correlation between (D4+D5)/G or D5/G and H:C is a direct representation of the concentration of CH species (and therefore also methyl groups) in aliphatics or aliphatic chains attached to aromatic clusters. If the material would have no aliphatic moieties (i.e. purely aromatics), H:C would be determined uniquely by the hydrogen termination at edges around small aromatic clusters (as discussed in the elswhere), which for extended aromatic systems, it is very low. If the same clusters would include aliphatic chains (or alicyclics) the significant increase in D4-D5 as a result from a diverse set of vibrations associated with these molecules, leads to the increase in H:C that is indeed observed. This is consistent with the observation of strong vibrations in the lattice of fatty acids, and in general to aliphatic systems, in the region of relevance. S.6. Decoupling aromatic ordering and nanostructure from H:C through the Raman spectra The striking difference in the Raman spectra of two different samples whose OM carries the same H:C ratio is shown through two examples, within the PPRG sample set (Fig. S6) and the DECS coal sample set (Fig. S7). We highlight the spectral fits for PPRG-048 (Fig. S7) and PPRG-266 (Fig. S8) as well as DECS-21 (Fig. S10) and DECS-1515 (Fig. S11). The extracted value of H:C from ID5/(IG+iD2) is very similar for the two PPRG and DECS samples and nearly identical to their nominal value (0.11 and 0.533 for the PPRG and DECS samples, respectively), despite the significant spectral differences. Further insight on the nanostructure can be gained by analyzing the shape of the fitting profile of each single peak. By purposefully avoiding constraining the shape of the peak to either a Lorentzian or a Gaussian through the use of a Pseudo-Voigt profile, we find that D1 is usually a perfect Gaussian regardless of the type of organic matter or its maturity. This is consistent with the defect-induced activation of the peak, as it originates from a stochastic distribution of electronic and vibrational states around defects. The G peak however shows a higher degree of variability. For highly graphitic organic matter (PPRG-266, Fig. S6) the shape of G is purely Lorentzian: this is consistent with the peak arising from a single shear vibration within the aromatic plane. For slightly less ordered organic matter (PPRG-048, Fig. S6), there is a 10% Gaussian component in the G peak that can be associated with a small distribution of vibrational frequencies around for the G peak in perfect graphite, possibly induced by deformations, strain or defects. This is consistent with a system where we can no longer associate aromatic clusters with extended graphene sheets, but with aromatic clusters with different size and shape; therefore no single vibration is effectively responsible for the G peak and its increased width.
9
Figure S8. Comparison between the Raman spectra of two different OM from the PPRG set, with the same H:C (0.11).
Figure S9. Spectral peak fitting for a typical spectra of PPRG-048. The H:C = 0.102 is determined through ID5/(IG+ID2) = 0.174 (nominal value = 0.11). When (ID4+ID5)/(IG+ID2) = 0.33 is used, the estimated H:C = 0.124.
0
5
10
15
20
25
30
35
40
45
50
Inte
nsity
(cnt
/sec
)
1 000 1 100 1 200 1 300 1 400 1 500 1 600 1 700 1 800Raman Shift (cm-1)
PPRG-048_4
159
4.4
117
2.9
125
6.1
132
3.4
153
0.7
10
Figure S10. Spectral peak fitting for a typical spectra of PPRG-266. The H:C = 0.101 is determined through ID5/(IG+ID2) = 0.173 (nominal value = 0.11). When (ID4+ID5)/(IG+ID2) = 0.284 is used, the estimated H:C = 0.097.
Figure S11. Comparison between the Raman spectra of OM in two different samples from the DECS coal collection (details in S.5) with the same H:C (0.533).
0
2
4
6
8
10
12
14
16
18
20In
tens
ity (c
nt/s
ec)
1 000 1 100 1 200 1 300 1 400 1 500 1 600 1 700 1 800Raman Shift (cm-1)
PPRG-266_1
161
2.4
115
6.7
129
8.2
133
1.5
150
5.8
157
9.3
11
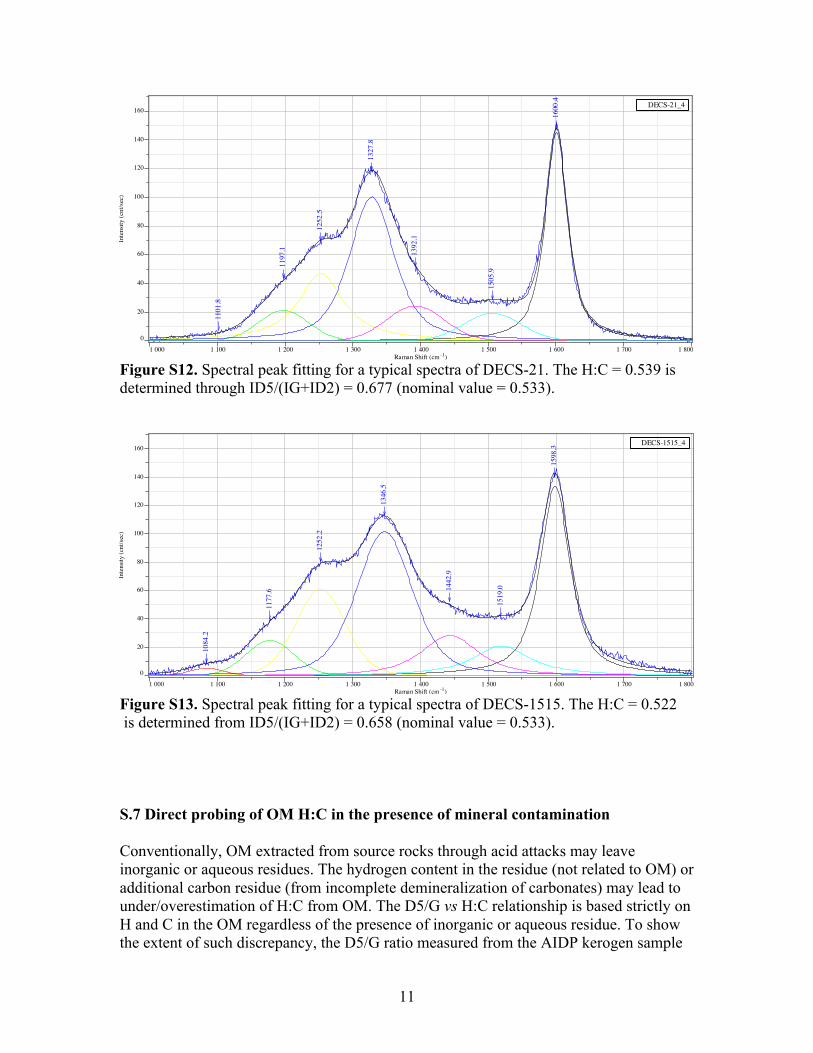
Figure S12. Spectral peak fitting for a typical spectra of DECS-21. The H:C = 0.539 is determined through ID5/(IG+ID2) = 0.677 (nominal value = 0.533).
Figure S13. Spectral peak fitting for a typical spectra of DECS-1515. The H:C = 0.522 is determined from ID5/(IG+ID2) = 0.658 (nominal value = 0.533). S.7 Direct probing of OM H:C in the presence of mineral contamination Conventionally, OM extracted from source rocks through acid attacks may leave inorganic or aqueous residues. The hydrogen content in the residue (not related to OM) or additional carbon residue (from incomplete demineralization of carbonates) may lead to under/overestimation of H:C from OM. The D5/G vs H:C relationship is based strictly on H and C in the OM regardless of the presence of inorganic or aqueous residue. To show the extent of such discrepancy, the D5/G ratio measured from the AIDP kerogen sample
0
20
40
60
80
100
120
140
160In
tens
ity (c
nt/s
ec)
1 000 1 100 1 200 1 300 1 400 1 500 1 600 1 700 1 800Raman Shift (cm-1)
DECS-21_4
160
0.4
110
1.8
119
7.1
125
2.5
132
7.8
139
2.1
150
5.9
0
20
40
60
80
100
120
140
160
Inte
nsity
(cnt
/sec
)
1 000 1 100 1 200 1 300 1 400 1 500 1 600 1 700 1 800Raman Shift (cm-1)
DECS-1515_4
159
8.3
108
4.2
117
7.6
125
2.2
134
6.5
144
2.9
151
9.0
12
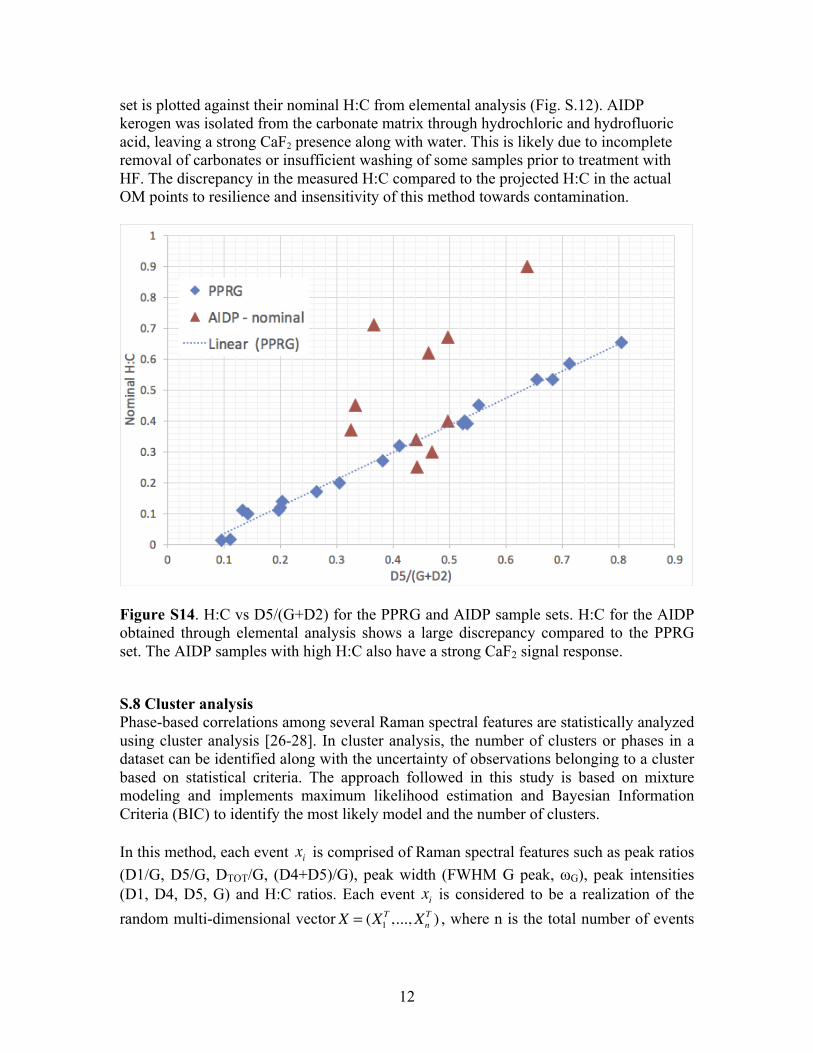
set is plotted against their nominal H:C from elemental analysis (Fig. S.12). AIDP kerogen was isolated from the carbonate matrix through hydrochloric and hydrofluoric acid, leaving a strong CaF2 presence along with water. This is likely due to incomplete removal of carbonates or insufficient washing of some samples prior to treatment with HF. The discrepancy in the measured H:C compared to the projected H:C in the actual OM points to resilience and insensitivity of this method towards contamination.
Figure S14. H:C vs D5/(G+D2) for the PPRG and AIDP sample sets. H:C for the AIDP obtained through elemental analysis shows a large discrepancy compared to the PPRG set. The AIDP samples with high H:C also have a strong CaF2 signal response.
S.8 Cluster analysis Phase-based correlations among several Raman spectral features are statistically analyzed using cluster analysis [26-28]. In cluster analysis, the number of clusters or phases in a dataset can be identified along with the uncertainty of observations belonging to a cluster based on statistical criteria. The approach followed in this study is based on mixture modeling and implements maximum likelihood estimation and Bayesian Information Criteria (BIC) to identify the most likely model and the number of clusters. In this method, each event xi is comprised of Raman spectral features such as peak ratios (D1/G, D5/G, DTOT/G, (D4+D5)/G), peak width (FWHM G peak, ωG), peak intensities (D1, D4, D5, G) and H:C ratios. Each event xi is considered to be a realization of the random multi-dimensional vector X = (X1
T ,...,XnT ) , where n is the total number of events
13
(i.e. total number of points in a Raman map). The probability density function f (xi ) of the observed data xi in Xi in a G-component mixture is
f (xi,Ψ) = τ kk=1
g
∑ φ(xi;µk,Σk )
(3) where 𝜏* is the probability that an observation belongs to the 𝑘-th component ( 𝜏* =-
*./1 ), Ψ = (τ1,...,τ k,ξ
T )T with ξ containing the (unknown) group mean µk and the covariance matrix 𝚺* and φ(xi;µk,Σk ) corresponding to the multi-variate normal density
𝜙 𝑥3, 𝜇*, 𝚺* =𝑒𝑥𝑝 −12 (𝑥3 − 𝜇*)
< 𝚺* =/(𝑥3 − 𝜇*)
det(2𝜋𝚺*)
(4)
The likelihood for data consisting of 𝑛 independent observations assuming normal mixture model with 𝐺 components is given by:
𝜏*𝜙 𝑥3, 𝜇*, 𝚺*
-
*./
E
3./
(5)
The best model is identified by fitting models with differing parameterization and/or number of components to the data by maximum likelihood, and then by implementing a statistical criterion for model selection, (here Bayesian Information Criteria (BIC)). References [1] DesMaraisDJ.IsotopicEvolutionoftheBiogeochemicalCarbonCycleDuringthePrecambrian.ReviewsinMineralogyandGeochemistry.2001;43(1):555-78.[2] WalterMR,HofmannHJ,SchopfJW.Apendix1;Geographicandgeologicdataforprocessedsamples.In:SchopfJW,ed.Earth'searliestbiosphere.Princeton,N.J.:PrincetonUniversityPres1983,p.385-414.[3] WedekingKW,HayesJM,MatzigkeitU.ProceduresofOrganicGeochemicalAnalysis.In:SchopfJW,ed.Earth'sEarliestBiosphere:ItsOriginandEvolution.Princeton:PrincetonUniv.Press1983,p.428-41.[4] HayesJM,KaplanIR,WedekingKW.Precambrianorganicgeochemistry:Preservationoftherecord.In:SchopfJW,ed.Earth'sEarliestBiosphere:ItsOriginandEvolution.Princeton:PrincetonUniv.Press1983,p.93–135.[5] AnbarAD,DuanY,LyonsTW,ArnoldGL,KendallB,CreaserRA,etal.AWhiffofOxygenBeforetheGreatOxidationEvent?Science.2007;317(5846):1903-6.[6] BuickR,AnbarAD,MojzsisSJ,KaufmanAJ,KieftTL,LyonsTW,etal.ThecaseforscientificdrillingofPrecambriansedimentarysequences:AmissiontoearlyEarth.AmericanGeophysicalUnion,FallMeeting2001,abstract#P22B-0544.2004.[7] BeukesNJ,EvansDAD,GrotzingerJP,KirschvinkJL,KnollAH,SumnerDY.MultidisciplinaryStudyOfThePrecambrianBiosphereAndSurficialOxygenation,
14
KaapvaalCraton,SouthAfrica:TheAgouronCores.InternationalJournalofAstrobiology,Supplement.2004;15.[8] FischerWW,SchroederS,LacassieJP,BeukesNJ,GoldbergT,StraussH,etal.IsotopicconstraintsontheLateArcheancarboncyclefromtheTransvaalSupergroupalongthewesternmarginoftheKaapvaalCraton,SouthAfrica.PrecambrianResearch.2009;169(1-4):15-27.[9] WaldbauerJR,ShermanLS,SumnerDY,SummonsRE.LateArcheanmolecularfossilsfromtheTransvaalSupergrouprecordtheantiquityofmicrobialdiversityandaerobiosis.PrecambrianResearch.2009;169:28–47.[10] SimonsonBM,SumnerDY,BeukesNJ,JohnsonS,GutzmerJ.CorrelatingmultipleNeoarchean-PaleoproterozoicimpactspherulelayersbetweenSouthAfricaandWesternAustralia.PrecambrianResearch.2009;169(1-4):100-11.[11] KnollAH,BeukesNJ.Introduction:InitialinvestigationsofaNeoarcheanshelfmargin-basintransition(TransvaalSupergroup,SouthAfrica).PrecambrianResearch.2009;169(1-4):1-14.[12] FrenchKL,HallmannC,HopeJM,SchoonPL,ZumbergeJA,HoshinoY,etal.ReappraisalofhydrocarbonbiomarkersinArcheanrocks.ProceedingsoftheNationalAcademyofSciences.2015;112(19):5915-20.[13] IdaT,AndoM,TorayaH.Extendedpseudo-VoigtfunctionforapproximatingtheVoigtprofile.JournalofAppliedCrystallography.2000;33(6):1311-6.[14] TuinstraF,KoenigJL.RamanSpectrumofGraphite.TheJournalofChemicalPhysics.1970;53:1126-30.[15] PimentaMA,DresselhausG,DresselhausMS,CancadoLG,JorioA,SaitoR.Studyingdisorderingraphite-basedsystemsbyRamanspectroscopy.PhysicalChemistryChemicalPhysics.2007;9(11):1276-90.[16] MartinsFerreiraEH,MoutinhoMVO,StavaleF,LuccheseMM,CapazRB,AcheteCA,etal.EvolutionoftheRamanspectrafromsingle-,few-,andmany-layergraphenewithincreasingdisorder.PhysicalReviewB.2010;82(12):125429.[17] LongDA.Ramanspectroscopy:McGraw-Hill;1977.[18] MayoDW,MillerFA,HannahRW.CourseNotesontheInterpretationofInfraredandRamanSpectra:JohnWiley&Sons,Inc.;2003.[19] FrankCJ,McCreeryRL,ReddDCB.RamanSpectroscopyofNormalandDiseasedHumanBreastTissues.AnalyticalChemistry.1995;67(5):777-83.[20] BaetenV,HourantP,MoralesMT,AparicioR.OilandFatClassificationbyFT-RamanSpectroscopy.JournalofAgriculturalandFoodChemistry.1998;46(7):2638-46.[21] AfsethNK,WoldJP,SegtnanVH.ThepotentialofRamanspectroscopyforcharacterisationofthefattyacidunsaturationofsalmon.AnalyticaChimicaActa.2006;572(1):85-92.[22] DongW,ZhangY,ZhangB,WangX.RapidpredictionoffattyacidcompositionofvegetableoilbyRamanspectroscopycoupledwithleastsquaressupportvectormachines.JournalofRamanSpectroscopy.2013;44(12):1739-45.[23] OlsenEF,RukkeE-O,FlåttenA,IsakssonT.Quantitativedeterminationofsaturated-,monounsaturated-andpolyunsaturatedfattyacidsinporkadiposetissuewithnon-destructiveRamanspectroscopy.MeatScience.2007;76(4):628-34.
15
[24] KoyamaY,IkedaK-i.Ramanspectraandconformationsofthecis-unsaturatedfatty-acidchains.ChemistryandPhysicsofLipids.1980;26(2):149-72.[25] WilmshurstJK,BernsteinHJ.TheinfraredandRamanspectraoftoluene,tolueneα-d3,m-xyleneandm-xylene-αα′-d6.CanadianJournalofChemistry.1957;35(8):911-25.[26] FraleyC,RafteryAE.MCLUST:SoftwareforModel-BasedClusterAnalysis.JofClassification.1999;16(2):297-306.[27] FraleyC,RafteryAE.Model-BasedClustering,DiscriminantAnalysis,andDensityEstimation.JournaloftheAmericanStatisticalAssociation.2002;97(458):611-31.[28] FraleyC,RafteryAE.Model-basedmethodsofclassification:usingthemclustsoftwareinchemometrics.JournalofStatisticalSoftware.2007;18:1—13. [29]. Argonne Premium Coal Bank (2012), now handled by the PSU Coal Bank. Analytical data: http://web.anl.gov/PCS/report/part2.html [30]. Herrin, J.M., Deming D., Thermal Conductivity of U.S. Coals, 1996, Journal of Geophysical Research v. 101, No B11 pp. 25381-25386 [31]. Penn State Coal Bank (2012), Energy Institute, Penn State University. Analytical data: http://www.energy.psu.edu/sites/default/files/files/CSB_Fact%20Sheet.pdf