Rapat Konsolidasi Persiapan Eco2 Cities Conference di...
19
Day1, Plenary 8, No.2 BAPPENAS, Indonesia 1 1 Rapat Konsolidasi Persiapan Eco2 Cities Conference di Yokohama (15 Oktober 2010) Deputi Bidang Pengembangan Regional & Otonomi Daerah Dr. Max H. Pohan 2 Current Conditions Urbanization Impacts : High density on big cities High density on big cities High density on fringe area Urban population > Rural population 2015: urban population(59,3%) > rural (40,7%) 2025: urban population(67,5%)>rural(32,5%) 2015: Jakarta 9 th world megapolitan, Followed by Surabaya-Medan as Asian megapolitan. 34 new cities formed in the last decade, now total 98 autonomy cities Forming of new cities Forming of new cities Big cities’s population growth expansion of growth to non- housing area;
-
Upload
truongkiet -
Category
Documents
-
view
235 -
download
0
Transcript of Rapat Konsolidasi Persiapan Eco2 Cities Conference di...
Day1, Plenary 8, No.2BAPPENAS, Indonesia
1
1
Rapat Konsolidasi Persiapan Eco2 Cities Conference di Yokohama
(15 Oktober 2010)
Deputi Bidang PengembanganRegional & Otonomi Daerah
Dr. Max H. Pohan
2
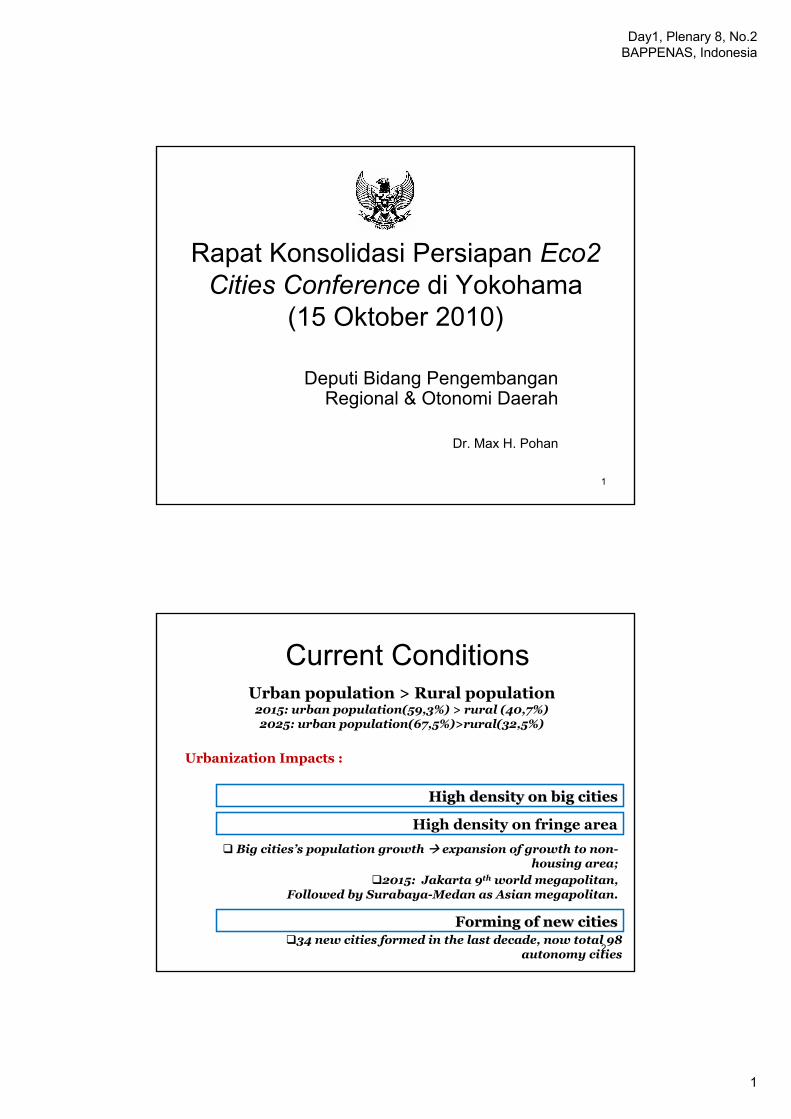
Current Conditions
Urbanization Impacts :
High density on big citiesHigh density on big cities
High density on fringe area
Urban population > Rural population2015: urban population(59,3%) > rural (40,7%)2025: urban population(67,5%)>rural(32,5%)
2015: Jakarta 9th world megapolitan,Followed by Surabaya-Medan as Asian megapolitan.
34 new cities formed in the last decade, now total 98 autonomy cities
Forming of new citiesForming of new cities
Big cities’s population growth expansion of growth to non-housing area;
Day1, Plenary 8, No.2BAPPENAS, Indonesia
2
3
Tantangan PembangunanPerkotaan
4
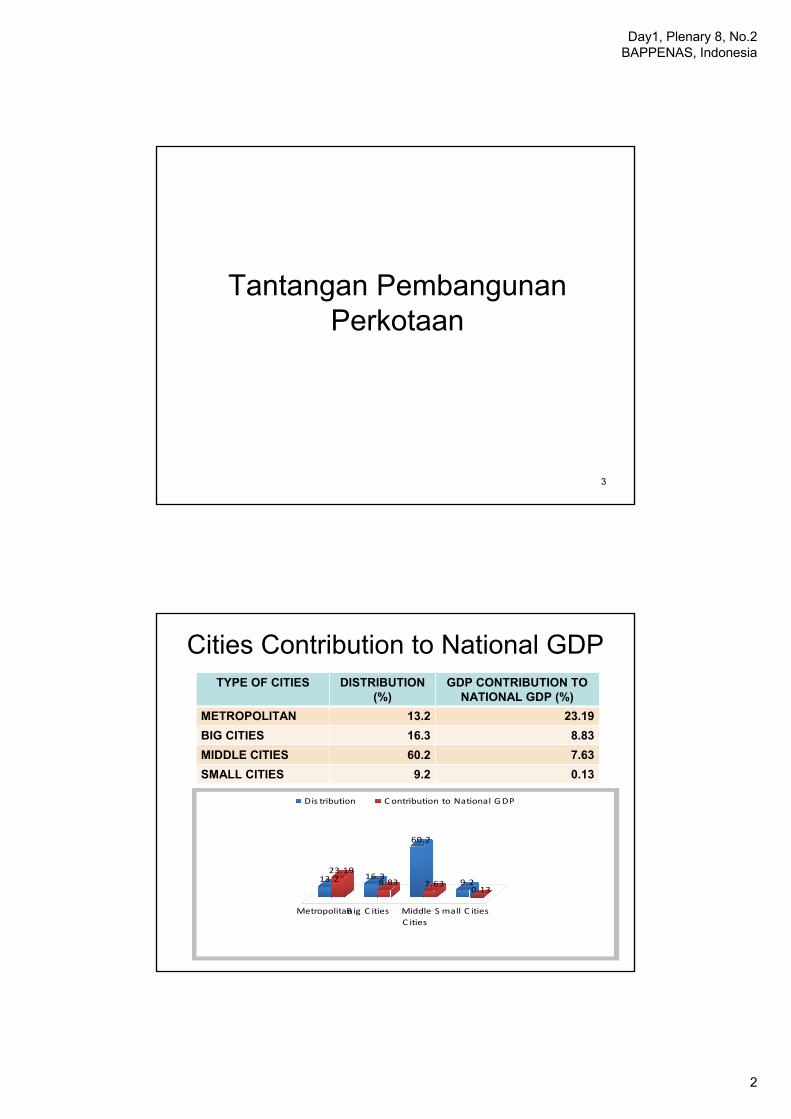
Cities Contribution to National GDPTYPE OF CITIES DISTRIBUTION
(%)GDP CONTRIBUTION TO
NATIONAL GDP (%)METROPOLITAN 13.2 23.19BIG CITIES 16.3 8.83MIDDLE CITIES 60.2 7.63SMALL CITIES 9.2 0.13
13.223.19
16.38.83
60.2
7.63 9.20.13
MetropolitanB ig C ities MiddleC ities
S mall C ities
Dis tribution C ontribution to National GDP

Day1, Plenary 8, No.2BAPPENAS, Indonesia
3
5
CHALLENGE : REGIONAL DISPARITYBigger regional disparity (gap) after decentralization and regional autonomy implementation
Pertumbuhan Ekonomi dan Indeks Kesenjangan Indonesia Tahun 1994-2006
-15%
-10%
-5%
0%
5%
10%
1994 1995 1996 1997 1998 1999 2000 2001 2002 2003 2004 2005 2006
Tahun
Pert
umbu
han
Ekon
omi (
dala
m %
)
1.2
1.25
1.3
1.35
1.4
1.45
1.5
Kov
aria
ns P
DR
B
Prov
insi
se-
Indo
nesi
a
Pertumbuhan Ekonomi Kovarians PDRB Provinsi se-Indonesia
Source : Regional Economy Analysis, Bappenas, 2007
6
01020304050607080
Nanggroe
Aceh …
Sumatera Utara
Sumatera Barat
Riau
Jambi
Sumatera Selatan
Ben gkulu
Lampu
ngKe
pulauan Bangka …
Kepu
lauan Riau
DKI Jakarta
Jawa Barat
Jawa Tengah
DI. Yogyakarta
Jawa Timur
Banten Bali
Kalim
antan Barat
Kalim
antan Tengah
Kalim
antan Selatan
Kalim
antan Timur
Sulawesi U
tara
Sulawesi Ten
gah
Sulawesi Selatan
Sulawesi Ten
ggara
Gorontalo
Nusa Ten
ggara Barat
Nusa Ten
ggara Timur
Maluku
Maluku Utara
Papu
a
PDRB Per Kapita
PDRB Nasional
6
Provinces with highest GDP per capita : (1)provinces with high population density : DKI Jakarta, Jatim, Jabar, Jateng;(2)provinces rich in natural resources : Kaltim, NAD, Papua,Riau
REGIONAL DISPARITY : FROM REGIONAL GDP PER REGIONAL DISPARITY : FROM REGIONAL GDP PER CAPITA (2008) (Million CAPITA (2008) (Million RupiahsRupiahs))
Source : BPS, 2008

Day1, Plenary 8, No.2BAPPENAS, Indonesia
4
7
Challenge : Globalization
Source: World Competitiveness Report 2009, WEF
WORLD COMPETITIVENESS INDEXof INDONESIA compared to OTHER COUNTRY
0,001,002,003,004,005,006,007,00
Indon
esia
Singapura
Mala
ysia
Vietnam
Korea
Selatan
China
Jepan
gIn
dia
Ingg
ris
Amerika S
erikat
Inde
x 2005200620072008
World Competitiveness Report (2008)Infrastructure Application of technologyHuman resources that high educated and vocationalInstitutional
Regional Economic Governance (2008)
• Business climate • Regional physical infrastructure• Business development insights • Government-private partnership
8
8
DOING BUSINESS IN INDONESIA (COMPETITIVENESS INDICATOR)
In 2010, Indonesia is in rank 122 from 178 countries, improving from rank 129 in the previous year. Indonesia also considered quite successful in reforming several policies related to investment climate improvement. Indonesia’s rank in various international finance organization is also improving.
Yogyakarta has the shortest time to started a business.Jakarta has the lowest cost to started a business.
Sumber: IFC (2009)
Time and cost to start a business in Indonesia

Day1, Plenary 8, No.2BAPPENAS, Indonesia
5
9
• Archipelago with ±17.500 islands. • Long shoreline (81.000 km) vulnerable to extreme
climate• Most regions in Indonesia are vulnerable to tektonik and
volcanic earth quake, and tsunami. • The Global Climate Change Model predicted that
Indonesia will experiencing 1,8 – 1 degree temperature rising in 2020-2050 (baseline 1961-1990)
• Emission reduction should be done or else the sea level will raised up to 60 cm in 2070 (ADB, 1994).
Challenge : Climate Change
10Climate Change Threats : Water crisis, sanitation, energy, food crisis, increase in flooding 10
8
85
33
108
37
45
8
9
10
0 30 60 90 120
Kekeringan
Gempa bumi
Epidemi
BanjirLongsor
Gunung Berapi
Tsunami
Kebakaran hutan
Angin topan
Based on the OFDA/CRED International Disaster Database (2007), 10 biggest disaster in Indonesia happened after 1990. Mostly are climate related disaster such as flood, drought, forest fires, and epidemy.

Day1, Plenary 8, No.2BAPPENAS, Indonesia
6
11
Impacts on Water Resources• Water shortage
No Area Supply (S)
Demand (D)
Balance2009
(S – D)
Balance 2015s
(S – D)
Balance 2030s
(S – D) 1. Sumatra 111,077.65 37,805.55 73,272.10 48,420.07 -67,101.34 2. Java-Bali 31,636.50 100,917.77 -69,281.27 -118,374.36 -454,000.33 3. Kalimantan 140,005.55 11,982.78 128,022.77 118,423.17 88,821.14 4. Sulawesi 34,787.55 21,493.34 13,294.21 13,490.80 -21,021.99 5. Nusa Tenggara 7,759.70 2,054.04 5,705.66 -17,488.89 -67,848.68 6. Molucca s 15,457.10 540.23 14,916.87 12,648.91 9,225.75 7. Papua 350,589.65 385.58 350,204.07 325,937.74 315,647.73 W a ter Su pply W ate r De ma nd
existi ng
M /Y
ear
3
Indonesia Water Balance (2009 and 2015 & 2030 Projections)
12
Impacts on Forestry• Flora and fauna alteration. Temperature rise will be the selection
factor. • Forest fires caused by temperature rise around the forest. Forest
fires also caused the extinction of biodiversity.
Forest Fires in Indonesia

Day1, Plenary 8, No.2BAPPENAS, Indonesia
7
13
COASTAL POPULATION IN SEVERAL COUNTRIES VULNERABLE TO SEA LEVEL RISE
About 50%-60% Indonesia population reside in the coastal area, so the threats are not only for the infrastructure and economical assets but also to the population’s source of living such as marine and fishery.
Source: G. McGranahan, D. Balk, dan B. Anderson, Low Elevation Coastal Zone (LECZ) Urban-Rural Population Estimates
Impacts on Marine and FisherySea water temperature rise crushed the coral and fish habitats, and triggered the fish migration to cooler area disadvantage for the fishermen.
14
Impacts on Agriculture and Health
• Climate change causing : (1) season shifts and rainfall pattern changes, (2) delay in planting and harvest season, (3) planting/harvest failure because of the flood, and (4) landslide and drought. All of the above are the cause of the food production declining and affecting the national food security.
• Increase in frequency of disease caused by mosquitos.• Contamination on clean water supply, causing disease such as
diarrhea, leptospirosis, and other skin disease. • Acute respiratory tract infection become a threat as an impact
from forest fires.

Day1, Plenary 8, No.2BAPPENAS, Indonesia
8
15
Climate Change Policies• 2007 National Action Plan on Climate Change as an initial
guidelines for cross-sectoral coordination in formulation policies to adapt and mitigate climate change.
• 2009 Indonesia committed to reduce the green house gas emission by 26 percent in 2020 (without any intervention, business as usual) or 41 percent (with support from another countries/international organizations).
• Adaptation and mitigation efforts are included in the sustainable development framework (economy, social, and enviroment).
• Considering its widespreading impacts, the adaptation and mitigation policies are cross-sectoral policies, to be implemented in one national policy framework.
16
Climate Change Challenges in Urban Area
UrbanizationUrbanization
Intensive infrastructure usage
Intensive infrastructure usage
High economic activities
Population density
Spatial Planning
Mechanism
Spatial Planning
Mechanism
Climate Change
Adaptation in Cities
Development
Climate Change
Adaptation in Cities
Development
GAP
FloodFlood
Declining health condition
Social vulnerability
Declining infrastructure quality
Declining economic growth

Day1, Plenary 8, No.2BAPPENAS, Indonesia
9
17
Strategic Issues of Urban Development
1. Incomplete urban development policy, and unsynchronized urban development laws
2. High poverty rate3. High social vulnerability4. Low utilization of social and cultural capital of urban society5. Lack of inter-cities cooperation (incl. its institution) in public sector
management 6. Low local government capacity in urban planning, development, and
management, including good governance principles implementation7. Low inclusion of environment management and disaster mitigation in
urban management8. Low investments and economic development9. Low public services quality and provision10.Low urban land use and spatial planning implementation control
18
National Policy and Strategies on Urban Development

Day1, Plenary 8, No.2BAPPENAS, Indonesia
10
19
NATIONAL URBAN SYSTEM BY LAW NO 26/2008:Linkage of national urban center - regional urban center - local
urban center
ECONOMIC REGIONAL DEVELOPMENT SYSTEM: Linkage of rural-urban development
MEDIUM TERM DEVELOPMENT PLAN
2010-2014
LONG TERM DEVELOPMENT PLAN
2005-2025
THE ROLE OF MEDIUM AND SMALL CITIES
DEVELOPMENT
URBAN
ENGINE OF GROWTH PEOPLE CENTERED
Big Cities/Metropolitan Management System
Global economy&traditional and informal economy
Creating market hierarchy for medium and small cities and rural
Human needs on physical, social, and environment aspect
Climate change anticipation and disaster mitigation
METROPOLITAN AND BIG CITIES MANAGEMENT
POLICY DIRECTION: URBAN DEVELOPMENT
20
Policies and Strategies : RPJMN 2010-2014• Preparing urban development policy and synchronizing all laws
related to urban development • Reducing urban poverty • Reducing urban social vulnerability and criminalities • Increasing utilization of urban community’ social and cultural
capital • Strengthening co-operations between cities and its institutions • Strengthening local government capacity in development
planning, management and implementation, including good governance principles implementation
• Strengthening the integration of environmental management and disaster mitigation in the urban management system
• Increasing urban economic and investment development • Delivering public services based on the Urban Services
Standard • Enhancing spatial planning implementation and urban land use
control
Day1, Plenary 8, No.2BAPPENAS, Indonesia
11
21
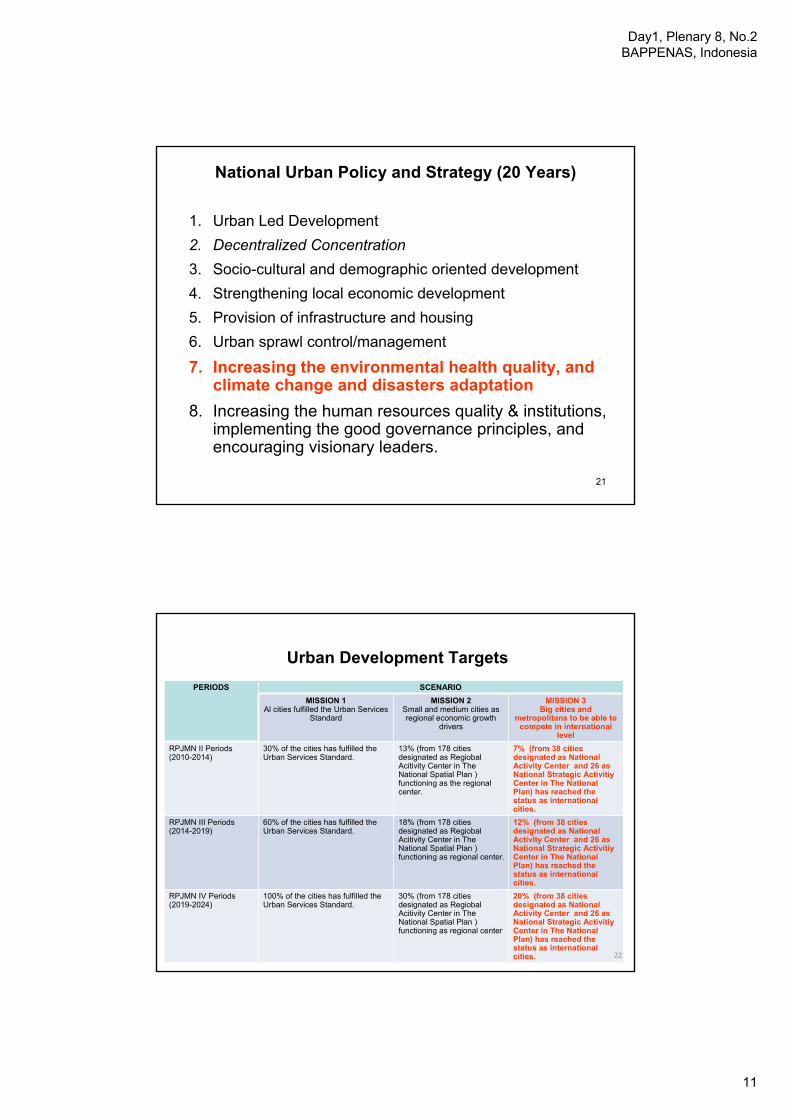
National Urban Policy and Strategy (20 Years)
1. Urban Led Development2. Decentralized Concentration3. Socio-cultural and demographic oriented development4. Strengthening local economic development5. Provision of infrastructure and housing6. Urban sprawl control/management
7. Increasing the environmental health quality, and climate change and disasters adaptation
8. Increasing the human resources quality & institutions, implementing the good governance principles, and encouraging visionary leaders.
22
Urban Development TargetsPERIODS SCENARIO
MISSION 1Al cities fulfilled the Urban Services
Standard
MISSION 2Small and medium cities as regional economic growth
drivers
MISSION 3Big cities and
metropolitans to be able to compete in international
levelRPJMN II Periods (2010-2014)
30% of the cities has fulfilled the Urban Services Standard.
13% (from 178 cities designated as Regiobal Acitivity Center in The National Spatial Plan ) functioning as the regional center.
7% (from 38 cities designated as National Activity Center and 26 as National Strategic Activitiy Center in The National Plan) has reached the status as international cities.
RPJMN III Periods(2014-2019)
60% of the cities has fulfilled the Urban Services Standard.
18% (from 178 cities designated as Regiobal Acitivity Center in The National Spatial Plan ) functioning as regional center.
12% (from 38 cities designated as National Activity Center and 26 as National Strategic Activitiy Center in The National Plan) has reached the status as international cities.
RPJMN IV Periods (2019-2024)
100% of the cities has fulfilled the Urban Services Standard.
30% (from 178 cities designated as Regiobal Acitivity Center in The National Spatial Plan ) functioning as regional center
20% (from 38 cities designated as National Activity Center and 26 as National Strategic Activitiy Center in The National Plan) has reached the status as international cities. 22
Day1, Plenary 8, No.2BAPPENAS, Indonesia
12
23
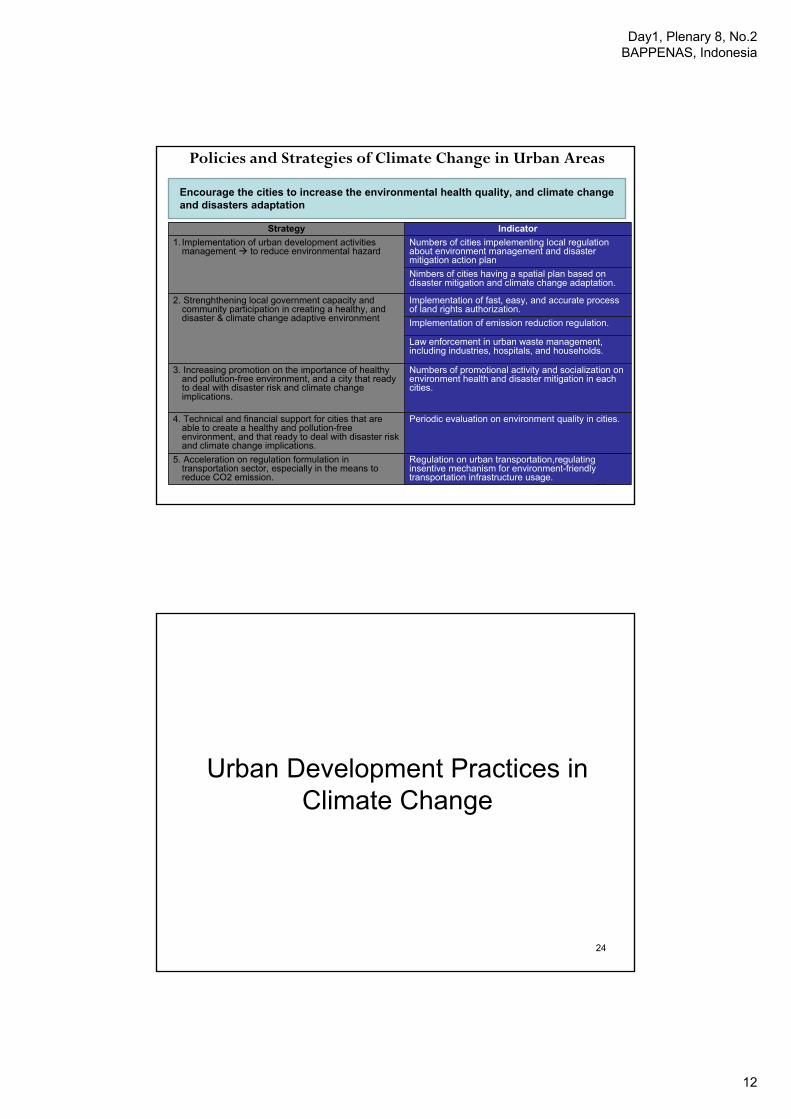
Encourage the cities to increase the environmental health quality, and climate change and disasters adaptation
Strategy Indicator1. Implementation of urban development activities
management to reduce environmental hazardNumbers of cities impelementing local regulation about environment management and disaster mitigation action planNimbers of cities having a spatial plan based on disaster mitigation and climate change adaptation.
2. Strenghthening local government capacity and community participation in creating a healthy, and disaster & climate change adaptive environment
Implementation of fast, easy, and accurate process of land rights authorization. Implementation of emission reduction regulation.
Law enforcement in urban waste management, including industries, hospitals, and households.
3. Increasing promotion on the importance of healthy and pollution-free environment, and a city that ready to deal with disaster risk and climate change implications.
Numbers of promotional activity and socialization on environment health and disaster mitigation in each cities.
4. Technical and financial support for cities that are able to create a healthy and pollution-free environment, and that ready to deal with disaster risk and climate change implications.
Periodic evaluation on environment quality in cities.
5. Acceleration on regulation formulation in transportation sector, especially in the means to reduce CO2 emission.
Regulation on urban transportation,regulating insentive mechanism for environment-friendly transportation infrastructure usage.
Policies and Strategies of Climate Change in Urban Areas
24
Urban Development Practices in Climate Change

Day1, Plenary 8, No.2BAPPENAS, Indonesia
13
25
The Green Building Concept
RegulationsBasis • Law No. 23 Year 1997 : Environment Management• Law No. 26 Year 2007 : Spatial Arrangement• Law No. 28 Year 2002 : Buildings • Law No. 5 Year 1992 : Heritage Items On the Process• Several disseminations about the Buildings and Environment Law has
been conducted• Green Building Guidelines will be developed and legalized with
Government Law. • The Ministry of Public Works’ new building will be developed by using
the concept. The building will be the first building in Indonesia certified by the Green Building Council as a Green Building.
26
Design Certification for Vital Project Development and Environmental Impact Analysis
Regulations• Law No. 27 Year 1999 : Environmental Impact Analysis• Design certifications from Minister of Public Works are
mandatory for the development of vital project. • The Environmental Impact Analysis must be conducted for
projects that potentially affected the environment (physic, economic, social-cultural, and public health)
• The certification can only be given after the developer fulfilled the requirements such as Detail Engineering Design and Environmental Impact Analysis
• The Environmental Impact Analysis is mandatory based on Law No. 27 Year 1999 : Environmental Impact Analysis

Day1, Plenary 8, No.2BAPPENAS, Indonesia
14
27
Strategy of Climate Change Adaptation and Mitigation
Regulations • Law No. 23 Year 1997 : Environment Management• Law No. 26 Year 2007 : Spatial ArrangementPrograms and Practices• The strategy of climate change mitigation conducted by
implementing various environment-friendly approach such as garden city, ecocity, Transit Oriented Development (TOD), and Low Carbon Green City Model. While, the strategy of climate change adaptationconducted by re-using the local wisdom aspects in developing the strategy to adapt climate change
• Some programs related to the strategy of climate change adaptation and mitigation are : Spatial Planning Quality Improvement Program, Sustainable City Competition, and utilization of abandoned lands
• Community empowerment in the Spatial Planning Quality Improvement Program includes community participation and empowerment in the critical land recovery and flood management.
• The Sustainable City Competition held to accommodate community initiatives to protect and preserve their local environment condition
28
Community Based-3 R (Reduce, Reuse, Recycle)
Regulations• Law Number 18 Year 2008 : Waste Management • Minister of Public Works Regulation Number 12 Year 2006 : National
Waste Management Development Policy and Strategy • Community Based 3R Guide BookPrograms and Practices• Aim to help local government in enhancing community awareness in
waste reduction. The target of the program is to reduce the waste volume by 20% in each city
• Working units in provinces do the assistances and co-ordinations with city/municipal’ government and community
• Community participation via Independent Community Group is the main part of the program
• In 2010, there has been 43 program locations (from 127 locations as target) implementing the 3R program.

Day1, Plenary 8, No.2BAPPENAS, Indonesia
15
29
Ecological CitiesRegulations:o Objectives:
Integrating natural and artificial components;Efficiency and optimalization of resources utilization Waste minimization and recyclingReduce the city dependence to the hinterland
o IndicatorsMeasuring the performance of policies / programsAssessing trends / tendenciesProvide information for the decision makersIncreasing public concerns and awarenessSetting targetsDefine planning objectivesComparing conditions between places Early warning
30
Regional Environmental Sustainability Cities Program (RESCP)
Regulations• Focus on Clean Air, Clean Water, and
Clean Land• Generic and applicable to most cities• Cities to measure respective environmental
performance• Indicators can be further refined and
expanded after gaining experiences

Day1, Plenary 8, No.2BAPPENAS, Indonesia
16
31
Open Green Space Improvement
Regulations• Minister of Home Affairs Regulation No. 1
Year 2007 : Urban Open Green Space Management
Practices• Facilitate local governments in improving
the amount and quality of open green spaces in the cities
32
• Preparation of street vendors arrangement model to increase their role in city economic development Conducted in 3 urban areas : Medan-Binjai-Deli Serdang-Karo, Kendal-Demak-Ungaran-Salatiga-Semarang-Purwodadi, and Makassar-Sungguminasa-Takalar-Maros
• Strenghtening the local government capacity intraditional market management and development
• Facilitation to local governments in improving theurban sanitation quality

Day1, Plenary 8, No.2BAPPENAS, Indonesia
17
33
Community Based Environmental Friendly Village (Kampung Ramah Lingkungan) in Palembang City
Programs and Practices• Strategy to control pollution, to improve land support system and
environment quality, and to arrange the environment in the smallest area unit in Palembang (RT) with active participation from all the community components to develop sustainable city
• Every village has to propose 2 RT as the Kampung Ramah Lingkungan.• Kampung Ramah Lingkungan must fulfilled:
Community organization in charge of environment management Garbage sorting and garbage processing (3R, organic fertilizer, etc)Clean water Neighborhood sanitation Trees spreading around the neighborhood Temporary Disposal Site and garbage bins No garbage/litter on the roadsOrnamental plants, medicinal plants Renewable energy
34
Programs and Practices in Yogyakarta City
Air Quality Improvement
• Biking Program (SEGO SEGAWE)• Street Garden Program • Emission Test • Increasing the amount of open green space
Drink Water Quality Improvement
• Stimulus Program for Ultra Filtration Water Processing System
• Chlordifuser Program

Day1, Plenary 8, No.2BAPPENAS, Indonesia
18
35
Regulations• Adopt Copenhagen Commitment to reduce 30% of
CO2 emission in 2030 Practices • Busway, and Mass Rapid Transit (MRT) to
reduce private vehicles usage• Improve the quality of solid waste management
cooperation with private sector • Green building regulations and building codes
implementation • Mangrove preservation in northern Jakarta • Solar panel for street lighting
Programs and Practices in DKI Jakarta Province
36
Follow Up Actions?National :• Sinergy and commitment from all sectors related to sustainable urban
development. • National Urban Development Coordination Team to facilitate
coordination and sinergy process between urban development stakeholders.
Local (City) Government: • Actions that could be done immediately to implement sustainable
urban dev’t concept?• Interregional cooperation framework to support the implementation of
sustainable urban dev’t concept?
International Donors:• Facilitation for local government to implement the sustainable urban
development. • Training for local government in city planning and management with
mainstreaming in climate change adaptation

Day1, Plenary 8, No.2BAPPENAS, Indonesia
19
37
THANK YOU.