L-4 HUMIDITY AND PRECIPITATION_L-4 HUMIDITY AND PRECIPITATION.pdf
Upload
nguyenkhuongCategory
view
226download
0
1
Raoult’s law revisited: accurately predicting equilibrium relative humidity points for humidity control experiments. Michael G. Bowlera,*, David R. Bowlerb and Matthew W. Bowlerc,d,*
a) Department of Physics, University of Oxford, Keble Road, Oxford, OX1 3RH, UK b) Department of Physics and Astronomy, University College London, Gower St, London, WC1E 6BT, UK c) European Molecular Biology Laboratory, Grenoble Outstation, 71 avenue des Martyrs, CS 90181 F-38042 Grenoble, France d) Unit for Virus Host Cell Interactions, Univ. Grenoble Alpes-EMBL-CNRS, 71 avenue des Martyrs, CS 90181 F-38042 Grenoble, France *Corresponding authors: Michael G. Bowler Department of Physics, University of Oxford, Keble Road, Oxford OX1 3RH UK Email: [email protected] Matthew W. Bowler European Molecular Biology Laboratory, Grenoble Outstation, 71 avenue des Martyrs, CS 90181 F-38042 Grenoble France Email: [email protected] Synopsis: The equilibrium relative humidity values for a number of the most commonly used precipitants in biological macromolecule crystallisation have been measured using a new humidity control device. A simple argument in statistical mechanics demonstrates that the saturated vapour pressure of a solvent is proportional to its mole fraction in an ideal solution (Raoult’s Law). The same argument can be extended to the case where solvent and solute molecules are of different size. Key words: controlled dehydration, macromolecular crystallography, Flory-Huggins entropy, Statistical mechanics

2
Abstract The humidity surrounding a sample is an important variable in scientific experiments.
Biological samples in particular require not just a humid atmosphere but often a relative
humidity (RH) that is in equilibrium with a stabilizing solution required to maintain the
sample in the same state during measurements. The controlled dehydration of
macromolecular crystals can lead to significant increases in crystal order, which often leads
to higher diffraction quality. Devices that can accurately control the humidity surrounding
crystals on a beamline have led to this technique being increasingly adopted, as experiments
become easier and more reproducible. Matching the relative humidity to the mother liquor is
the first step to allow the stable mounting of a crystal. In previous work, we measured the
equilibrium relative humidity for a range of concentrations of the most commonly used
precipitants and showed how this related to Raoult’s law for the equilibrium vapour pressure
of water above a solution. However, a discrepancy between measured values and those
predicted by theory could not be explained. Here, we have used a more precise humidity
control device to determine equilibrium relative humidity points. The new results are in
agreement with Raoult’s law. We also present a simple argument in statistical mechanics
demonstrating that the saturated vapour pressure of a solvent is proportional to its mole
fraction in an ideal solution: Raoult’s Law. The same argument can be extended to the case
where solvent and solute molecules are of different size, as is the case with polymers. The
results provide a framework for the correct maintenance of the RH surrounding samples.

3
1.0 Introduction
Sample environments that control relative humidity (RH) are important in many experiments
where a wide variety of samples require specific RH values to maintain sample integrity or
RH is a parameter to be varied. Humidity control has been an important parameter in the
study of lipid bilayers (Lin et al., 2007), amyloid fibers (McDonald et al., 2008), small
molecule crystallography (Mo & Ramsoskar, 2009) as well as coherent X-ray diffraction
microscopy of cells (Takayama & Nakasako, 2012). In biological crystallography, changing
the RH can often induce phase changes in crystals of macromolecules with the concomitant
improvement in the quality of observed diffraction. This has been observed since the earliest
days of macromolecular crystallography (Berthou et al., 1972; Einstein & Low, 1962; Huxley
& Kendrew, 1953; Perutz, 1946) and is most easily effected by altering the molar fraction of
water in the crystal solution or by changing the RH of the air surrounding a crystal. Many
successful examples are in the literature (Adachi et al., 2009; Bowler et al., 2006; Cramer et
al., 2000; Fratini et al., 1982; Gupta et al., 2010; Heras et al., 2003; Hu et al., 2011; Kadlec
et al., 2011; Kuo et al., 2003; Nakamura et al., 2007; Sam et al., 2006; Vijayalakshmi et al.,
2008; Yap et al., 2007; Zerrad et al., 2011). Several specific devices have been developed to
control the humidity surrounding a crystal (Einstein, 1961; Sjogren et al., 2002; Pickford et
al., 1993) with modern devices mounted at X-ray sources or synchrotron beamlines
(Kiefersauer et al., 2000; Russi et al., 2011; Sanchez-Weatherby et al., 2009). The ability to
change the relative humidity while characterizing changes via diffraction allows any changes
undergone by the crystal to be seen in real time and increases the chances of characterizing a
beneficial phase change.
The HC1 was developed at the EMBL Grenoble to be a user friendly device
compatible with a complex beamline environment (Sanchez-Weatherby et al., 2009). It
produces an air stream with a controlled relative humidity using a dispensing nozzle, in the

4
same manner as cryo-stream devices produce a nitrogen flow at 100 K, and is therefore easy
to integrate with most diffractometers. It supplies a stream of humid air at a RH determined
by a dew point controller acting on a water saturated air supply. The device is now installed
at laboratories and synchrotrons across the world (Bowler, et al., 2015), resulting in many
successful experiments (Hu et al., 2011; Kadlec et al., 2011; Malinauskaite et al., 2014;
Oliete et al., 2013). The device can also be used for ambient temperature data collection
(Bowler, et al., 2015; Russi et al., 2011) where the RH must be matched to the mother liquor
to prevent dehydration of the crystal. The first step in these experiments is to define the
equilibrium point between the RH and the mother liquor of the sample. This is an essential
step as it defines the starting point for the experiments and maintains the crystal in a stable
environment when the mother liquor is removed. In order to facilitate this stage we measured
the equilibrium RH points for a variety of solutions commonly used for the crystallization of
proteins and nucleic acids (Wheeler et al., 2012). This provided a starting point for most
experiments and the results obtained were compared with Raoult’s law for the equilibrium
vapour pressure of water above a solution (and for solutions of polymers, with a
generalisation). The measurements made were consistently higher than those predicted by
Raoult’s law and a satisfactory explanation for the discrepancy could not be found. Here, we
have repeated the measurements using a device based on the HC1 but with higher precision
in the control of RH. The new measurements are in very good agreement with Raoult’s law.
Because of its importance, we present a simple explanation for Raoult’s law using statistical
mechanics and also show how this treatment can be extended to polymer solutions, where
Raoult’s law breaks down. These results illuminate the machinery underlying a long observed
phenomenon and allow the accurate prediction of humid atmospheres for specific sample
requirements that is applicable to a wide variety of fields.
5
2.0 Experimental Procedures
Relative humidity measurements Solutions of PEG were made gravimetrically at concentrations between 50.0% and
10% w/w. Stock solutions of salts at 3 M were made and then diluted to reach the desired
concentration. A round 600 μm Micromount (MiTeGen, Ithica, NY, USA) was mounted on
either the BM14 or MASSIF-1 (Bowler, et al., 2015; Nurizzo et al., 2016) diffractometers
with a HC-Lab (Arinax, 259, Rue du Rocher de Lorzier, 38430 Moirons, France) mounted at
a distance of 5 mm from the loop. The HC-Lab is based on the original HC1 developed at the
EMBL, Grenoble (Sanchez-Weatherby et al., 2009) but with improvements in the dew point
controller, temperature measurement, and calculation of relative humidity. These
developments have led to a device with superior control and stability of relative humidity
levels. In order to determine the equilibrium RH a drop of solution (typically 2 μl) was placed
on the loop with a pipette. The diameter of the drop was measured using specific image
analysis software. The humidity was adjusted until the drop diameter was stable. This was
repeated a few times until the drop diameter was stable upon initial placement on the loop.
Each measurement was repeated three times at ambient temperatures between 21 and 24.0oC.
3.0 Results
3.1 Agreement between measured equilibria and predicted values
In previous work we measured the RH equilibrium points for a range of solutions commonly
used in protein crystallization and examined the results in terms of Raoult’s law and the
Flory-Huggins model for the entropy of mixing of polymers (Bowler, et al., 2015; Wheeler et
al., 2012). While the measured values provided a starting point for humidity control
experiments and Raoult’s law should be a good explanation for the observed results, there

6
was a considerable discrepancy between the two (Wheeler et al., 2012). Measured values
were consistently 1 to 3% higher than those predicted which were attributed to the condenser
used in the device being rather inaccurate at humidity values above 96%. Repeating these
measurements using the new humidity control device, the HC-lab, the discrepancy is no
longer significant (Figures 1A and 2A). The results now obtained from the HC-lab are also in
agreement with detailed studies of the activity of water above salt (Robinson, 1945; Wishaw
& Stokes, 1954) and polymer solutions (Sadeghi & Shahebrahimi, 2011; Sadeghi &
Ziamajidi, 2006) (Figures 1B and 2B), with the salt solution measurements made in this study
appearing to be more accurate. This now brings the control of relative humidity surrounding
crystals into line with measurements made using dedicated and accurate devices as well as
theoretical calculations.
3.2 Derivation of the origin of Raoult’s Law
Raoult’s Law is for the reduction of the saturated vapour pressure above a solvent when a
mole fraction x of some solute is dissolved within it. If the vapour pressure above the pure
solvent is then the vapour pressure of the solvent above the solution is given by
1 (1)
It is of course an idealisation, but is remarkably good, particularly at low mole fractions of
the solute. Originally empirical (Raoult, 1887), from what principles can it be derived? Any
such derivations depend on the assumption of an ideal solution, meaning that within the body
of the solution the elements of the solute are near identical to the elements of the solvent (and
yet for a non-volatile solute the solute cannot enter the vapour phase). In thermodynamics,
equilibrium at constant temperature and pressure corresponds to a minimum of the Gibbs’

7
function G and hence liquid-vapour equilibrium requires equal chemical potentials. The
chemical potential of the solvent vapour phase is the same as that of the solvent, both above
the pure liquid solvent and above a solution. The chemical potential in the solution is reduced
by mixing; thermodynamic arguments are used to turn an entropy of mixing into the change
of chemical potential. Thermodynamics does not deal with the mechanisms underlying these
steps and it seems reasonable to ask, first, how the vapour pressure can be affected by the
number of ways of arranging fixed numbers of two kinds of molecules and, secondly, why is
there no apparent role for a work function related to the latent heat of vaporisation?
Raoult’s Law is the direct result of the dilution of the solvent by the solute and can be
extracted by applying elementary statistical mechanics. The machinery involves the energy
levels the confined components can occupy and, in the simplest case of non-ideal solutions,
differences in work functions are both important and easily calculated.
3.2.1 Statistical mechanics It is a truth universally acknowledged that any system (such as an atom in a box) that has
energy levels and is in thermal equilibrium at temperature T has a probability of occupying
a given level proportional to exp where k is Boltzmann’s constant. This is because the
vast majority of possible configurations consistent with a prescribed total energy have this
distribution. Thus for the macroscopic phenomena we are concerned with sums or averages
over very many individual microscopic systems (here atoms, ions or molecules). For pure
solvent we divide the energy levels into two classes, those in the liquid and those in the
vapour phases. They are separated by a step in energy, a work function W, and so the number
, from a total of N atoms, found in a state of energy above W in the vapour is given by
/ ∑ exp ∑ exp (2)
8
For a given temperature, the total number of atoms in the vapour is found by summing the
numerator above over the index i. As the vapour energies start above the energy levels in the
liquid by the work function W (closely related to the latent heat) the fraction of atoms in the
vapour contains a suppression factor of exp . We are not yet concerned with this factor,
or with the details of the structure of the energy levels. It suffices that for a given temperature
and container, the number of atoms in the vapour phase is a fraction y of the total number of
solvent atoms N. The fraction y is determined by the work function, the temperature and by
the detailed structure of the energy levels, determined by the volumes available. If a fraction
x of the solvent atoms are removed and replaced by Nx units of solute, changing nothing else,
the volume of the container does not change and neither the detailed structure of the energy
levels nor the work function for solvent atoms change because of the close identity of the
solvent and solute units in an ideal solution. The fraction of solvent atoms in the vapour
phase does not change and because there are now only (1-x)N atoms of solvent, the number
of atoms of solvent in the vapour phase is reduced by a factor (1-x). Hence, the reduced
vapour pressure and Raoult’s law.
This simple argument is indubitably correct, given the assumptions of an ideal solution.
The flux of solvent molecules leaving the surface is reduced by a factor (1-x) and for
equilibrium both the returning flux and the number density of solvent molecules in the vapour
phase are also reduced by a factor (1- x); directly the result of the smaller concentration of
solvent molecules. This approach can be extended to non-ideal solutions (such as solutions of
polymers) but is more complicated because of the need to calculate differences in work
functions.

9
3.2.2 Some technical details concerning volume
A second result from elementary statistical mechanics removes a potential objection
to the above argument. What if the volume of pure solvent is reduced? If the volumes of
liquid and of vapour are being held constant, the number of vapour atoms is (for fixed
temperature) a definite fraction of the number of atoms in the liquid phase. The more general
result is that the concentration of atoms in the vapour phase is a definite fraction of the
concentration of atoms in the liquid phase. The vapour pressure above a liquid in a sealed
container does not, in equilibrium, depend on the volume of liquid in the container. Thus (1-
x)N atoms of solvent in the container without xN atoms of dissolved solute, would not (and
does not) result in a pressure reduced by (1-x). The reason is rather technical; the energy
levels for atoms in the vapour are those of particle waves confined within the volume
between the liquid surface and the walls of the container. For an ideal gas, the number of
energy levels in a given interval of energy is proportional to the volume – the spacing goes
down as the volume goes up. If the volume available to vapour doubles, the number of levels
in some interval Δ at also doubles and hence so does the number of molecules in the
vapour. Thus the concentration of atoms in the vapour phase is constant as the volume
increases - the pressure remains the same. Similarly, the molecules in the liquid roam
throughout the liquid volume and their wave functions are constrained by the walls (and the
liquid surface). If the volume of liquid is reduced, the sum over the populations of liquid
energy levels is reduced because there are fewer of them. The spacing of energy levels in the
liquid has gone up with the reduction in volume and the concentration in the liquid remains
the same. Thus the saturated vapour pressure above the liquid remains constant as the ratio of
vapour volume to liquid volume is increased, until of course all the atoms originally in the
liquid are in the vapour phase. Thereafter, as the volume is increased (by pulling back on a
piston perhaps) the vapour density and so the pressure along the isotherm fall.
10
When solvent molecules extracted are replaced by solute, the solute molecules make up the
missing liquid volume. This makes available to the reduced number of solvent molecules the
same energy level structures in both the liquid and vapour phases. This dependence of the
energy level density on free range volume results in the concentration of atoms in the vapour
phase being a definite fraction of the concentration in the solution. It is important for
considering the vapour pressure above solutions that are not ideal; for example, polymers.
Finally, it is essential for understanding the thermodynamic treatment and entropy of mixing.
3.2.3. Solutions of molecules of different sizes
Suppose now that instead of replacing a fraction of molecules of solvent with molecules of
solute pre-empting the same volume, solute molecules require a different volume. For the
case of polymers, such as polyethylene glycol, the specific volume will be larger,
substantially larger for the heavier long chain polymers. Let there be molecules of solvent
of specific volume , similarly for the solute , . The volume occupied by the liquid
solution is and the concentration of solvent molecules is less than for pure
solvent occupying the same volume. The ratio of concentrations of the solvent molecules in
the solution to pure solvent gives a factor in the vapour pressure ratio of
(3)
This factor reduces to Raoult’s law as the specific volumes of solvent and solute
approach equality. This is not the whole story because the difference in work functions for
solvent phase transitions is not zero except in this limit. The following simple calculation
yields the requisite difference in work functions. The work function is the work that has to be
done when removing a molecule against the cohesive forces in the liquid and any

11
contribution from ambient pressure. If a molecule is instead added, the volume it pre-empts
acquires negative potential energy and hence the work done is - ∆ . Consider the operation
of replacing a molecule of solvent by one of solute. The liquid expands by a volume ∆
and this volume contains a negative potential energy density. The effective
pressure P must balance that from the thermal energy density and so is given by
(4) Thus, the work that has to be done to make the replacement is given by
(5) This is made up of two pieces, the work necessary to insert a molecule of solute (a
contribution to the chemical potential ) and the work necessary to extract a molecule of
solvent ( . As → 0, the solution approaches pure solvent, identifying the difference
in the work that has to be done to deliver one molecule of solvent to the solution as opposed
to pure solvent as
∆ ↑
(6) This can be verified by calculating the work done against pressure to insert a solvent
molecule into the solution as opposed to the same volume of pure solvent. Calculate the
(pressure related) work done inserting an atom of 1 into a solution and also calculate the work
done inserting an additional atom into a volume of pure species 1. In both cases ∆ .
The pressure in solution is given by

12
as in (eq. 4) and the pressure in pure solvent is ⁄ . Then
∆ ∆ 1
and this also yields (eq. 6).
The difference in work functions for removing atoms to the vapour phase, ∆ ↓, is the
negative of (eq. 6). The effect on relative humidity is an exponential factor
exp ∆ ↓exp ∆
↑
The concentration ratio (eq. 3) multiplied by this factor yields the relative humidity of the
solvent
exp
(7) The first factor on the right hand side is the volume fraction of solvent in the solution and
reduces to Raoult’s law as the specific volumes become equal. The second factor goes to
unity in this same limit. It is less obvious that (eq. 7) also reduces to Raoult’s law in the limit
of extreme dilution, regardless of the ratio of specific volumes – but it is so.
This expression (eq. 7), derived using elementary notions from statistical mechanics,
is the same as that derived using thermodynamics and the Flory-Huggins entropy of mixing
devised for polymer solutions (Flory, 1942; Flory, 1970) or, equivalently, Hildebrand’s
entropy of solution of molecules of different size (Hildebrand, 1947). In such treatments both
factors in (eq. 7) emerge from matching chemical potentials. Our treatment clarifies the

13
physical meaning of the factors – the first factor is concentration ratio; the second
(exponential) factor embodies the difference in work functions. In the appendix we discuss
the relationship between simple statistical mechanics and thermodynamic arguments,
addressing in particular the significance of entropy of mixing.
4.0 Discussion
The control of the relative humidity surrounding samples is important to maintain their
integrity and study the effects of increased or decreased humidity. Here we have established
that the theoretical calculation of RH values we previously determined (Bowler, et al., 2015;
Wheeler et al., 2012) are in satisfactory agreement with a humidity control device used on
protein crystallography beamlines. As the predicted values are also in complete agreement
with measurements made using specific devices, the previous discrepancies can be ascribed
to shortcomings in the control of RH in the HC1c used. We have also determined the origin
of the observed vapour pressure changes above solutions of solutes. If N units of a liquid
solvent are in an equilibrium where liquid and vapour phases coexist, a fixed fraction are (for
a given temperature) in the vapour phase. If the number of units is reduced to N(1-x), if all
else remains unchanged, because of the presence of Nx units of the solute in an ideal solution,
then the number of units in the vapour phase (and hence the pressure) are reduced by the
same factor (1-x), Raoult’s Law. For unequal sizes of solvent and solute components, the
dilution factor has to be multiplied by an exponentiated work function. These results provide
a solid basis on which to predict the relative humidities required to maintain a wide variety of
samples and solutions in homeostasis.

14
Acknowledgements
M.W.B thanks Babu Manjestay and Hassan Belrahli (EMBL, Grenoble) for access to the HC-
Lab on beamline BM14 and Ralf Siebrecht and Jaouhar Nasri (Arinax) for stimulating
discussions.

15
References
Adachi, H., Umena, Y., Enami, I., Henmi, T., Kamiya, N. & Shen, J. R. (2009). Towards
structural elucidation of eukaryotic photosystem II: Purification, crystallization and
preliminary X-ray diffraction analysis of photosystem II from a red alga, BBA-
Bioenergetics 1787, 121-128.
Berthou, J., Cesbron, F. & Laurent, A. (1972). New Experimental Method for Direct
Determination of Water-Content of Protein Crystals, J. Mol Biol 71, 809-&.
Bowler, M. W., Montgomery, M. G., Leslie, A. G. & Walker, J. E. (2006). Reproducible
improvements in order and diffraction limit of crystals of bovine mitochondrial F1-
ATPase by controlled dehydration, Acta Cryst. D 62, 991-995.
Bowler, M. W., Mueller, U., Weiss, M. S., Sanchez-Weatherby, J., Sorensen, T. L. M.,
Thunnissen, M. M. G. M., Ursby, T., Gobbo, A., Russi, S., Bowler, M. G.,
Brockhauser, S., Svensson, O. & Cipriani, F. (2015). Automation and Experience of
Controlled Crystal Dehydration: Results from the European Synchrotron HC1
Collaboration, Cryst Growth Des 15, 1043-1054.
Bowler, M. W., Nurizzo, D., Barrett, R., Beteva, A., Bodin, M., Caserotto, H., Delageniere,
S., Dobias, F., Flot, D., Giraud, T., Guichard, N., Guijarro, M., Lentini, M., Leonard,
G. A., McSweeney, S., Oskarsson, M., Schmidt, W., Snigirev, A., von Stetten, D.,
Surr, J., Svensson, O., Theveneau, P. & Mueller-Dieckmann, C. (2015). MASSIF-1: a
beamline dedicated to the fully automatic characterization and data collection from
crystals of biological macromolecules, J Synch Rad 22, 1540-1547.
Cramer, P., Bushnell, D. A., Fu, J. H., Gnatt, A. L., Maier-Davis, B., Thompson, N. E.,
Burgess, R. R., Edwards, A. M., David, P. R. & Kornberg, R. D. (2000). Architecture
of RNA polymerase II and implications for the transcription mechanism, Science 288,
640-649.

16
Einstein, J. R. (1961). Humidity Control Device for Buerger Precession Camera, J Sci Instr
38, 449-&.
Einstein, J. R. & Low, B. W. (1962). Insulin - Some Shrinkage Stages of Sulfate and Citrate
Crystals, Acta Cryst. 15, 32-&.
Flory, P. J. (1942). Thermodynamics of High Polymer-Solutions, J Chem Phys 10, 51-61.
Flory, P. J. (1970). Fifteenth Spiers Memorial Lecture. Thermodynamics of polymer
solutions, Discussions Faraday Soc 49, 7-29.
Fratini, A. V., Kopka, M. L., Drew, H. R. & Dickerson, R. E. (1982). Reversible Bending and
Helix Geometry in a B-DNA Dodecamer - cgcgaattbrcgcg, J Biol Chem 257, 4686-
4707.
Gupta, V., Gupta, R. K., Khare, G., Salunke, D. M., Surolia, A. & Tyagi, A. K. (2010).
Structural Ordering of Disordered Ligand-Binding Loops of Biotin Protein Ligase
into Active Conformations as a Consequence of Dehydration, Plos One 5, -.
Heras, B., Edeling, M. A., Byriel, K. A., Jones, A., Raina, S. & Martin, J. L. (2003).
Dehydration converts DsbG crystal diffraction from low to high resolution, Structure
11, 139-145.
Hildebrand, J. H. (1947). The Entropy of Solution of Molecules of Different Size, J Chem
Phys 15, 225-228.
Hu, N. J., Iwata, S., Cameron, A. D. & Drew, D. (2011). Crystal structure of a bacterial
homologue of the bile acid sodium symporter ASBT, Nature 478, 408-411.
Huxley, H. E. & Kendrew, J. C. (1953). Discontinuous Lattice Changes in Haemoglobin
Crystals, Acta Cryst. 6, 76-80.

17
Kadlec, J., Hallacli, E., Lipp, M., Holz, H., Sanchez-Weatherby, J., Cusack, S. & Akhtar, A.
(2011). The molecular basis for the recruitment of MOF and MSL3 into the dosage
compensation complex by MSL1, Nature Struct. Mol. Biol. 18, 142-149.
Kiefersauer, R., Than, M. E., Dobbek, H., Gremer, L., Melero, M., Strobl, S., Dias, J. M.,
Soulimane, T. & Huber, R. (2000). A novel free-mounting system for protein crystals:
transformation and improvement of diffraction power by accurately controlled
humidity changes, J App Cryst 33, 1223-1230.
Kuo, A., Bowler, M. W., Zimmer, J., Antcliff, J. F. & Doyle, D. A. (2003). Increasing the
diffraction limit and internal order of a membrane protein crystal by dehydration, J
Struct Biol 141, 97-102.
Lin, J.-M., Lin, T.-L. & Jeng, U.-S. (2007). Time-resolved grazing-incidence small-angle X-
ray scattering studies of lipid multibilayers with the insertion of amyloid peptide
during the swelling process, J App Cryst 40, s367-s372.
Malinauskaite, L., Quick, M., Reinhard, L., Lyons, J. A., Yano, H., Javitch, J. A. & Nissen,
P. (2014). A mechanism for intracellular release of Na+ by neurotransmitter/sodium
symporters, Nat Struct Mol Biol 21, 1006-1012.
McDonald, M., Kendall, A., Tanaka, M., Weissman, J. S. & Stubbs, G. (2008). Enclosed
chambers for humidity control and sample containment in fiber diffraction, J App
Cryst 41, 206-209.
Mo, F. & Ramsoskar, K. (2009). A sample cell for diffraction studies with control of
temperature, relative humidity and applied electric field, J App Cryst 42, 531-534.
Nakamura, A., Wada, C. & Miki, K. (2007). Expression and purification of F-plasmid RepE
and preliminary X-ray crystallographic study of its complex with operator DNA, Acta
Cryst. F 63, 346-349.

18
Nurizzo, D., Bowler, M. W., Caserotto, H., Dobias, F., Giraud, T., Surr, J., Guichard, N.,
Papp, G., Guijarro, M., Mueller-Dieckmann, C., Flot, D., McSweeney, S., Cipriani,
F., Theveneau, P. & Leonard, G. A. (2016). RoboDiff: combining a sample changer
and goniometer for highly automated macromolecular crystallography experiments,
Acta Cryst. D 72, 966-975.
Oliete, R., Pous, J., Rodriguez-Puente, S., Abad-Zapatero, C. & Guasch, A. (2013). Elastic
and inelastic diffraction changes upon variation of the relative humidity environment
of PurE crystals, Acta Cryst. D 69, 194-212.
Perutz, M. F. (1946). The composition and swelling properties of haemoglobin crystals,
Trans. Faraday Soc B42, 187-195.
Pickford, M. G., Garman, E. F., Jones, E. Y. & Stuart, D. I. (1993). A design of crystal
mounting cell that allows the controlled variation of humidity at the protein crystal
during X-ray diffraction, J App Cryst 26, 465-466.
Raoult, F.-M. (1887). C. R. Acad. Sci. Paris 104, 1430-1433.
Robinson, R. A. (1945). The Vapour Pressures of Solutions of Potassium Chloride and
Sodium Chloride, Trans. Proc. Roy. Soc. NZ 75, 203-217.
Russi, S., Juers, D. H., Sanchez-Weatherby, J., Pellegrini, E., Mossou, E., Forsyth, V. T.,
Huet, J., Gobbo, A., Felisaz, F., Moya, R., McSweeney, S. M., Cusack, S., Cipriani,
F. & Bowler, M. W. (2011). Inducing phase changes in crystals of macromolecules:
Status and perspectives for controlled crystal dehydration, J. Struct. Biol 175, 236-
243.
Sadeghi, R. & Shahebrahimi, Y. (2011). Vapor-Liquid Equilibria of Aqueous Polymer
Solutions from Vapor-Pressure Osmometry and Isopiestic Measurements, J. Chem
Eng Data 56, 789-799.

19
Sadeghi, R. & Ziamajidi, F. (2006). Water activities of ternary mixtures of poly(ethylene
glycol), NaCl and water over the temperature range of 293.15 K to 313.15 K, J Chem
Thermo 38, 1335-1343.
Sam, M. D., Abbani, M. A., Cascio, D., Johnson, R. C. & Clubb, R. T. (2006).
Crystallization, dehydration and preliminary X-ray analysis of excisionase (Xis)
proteins cooperatively bound to DNA, Acta Cryst. F 62, 825-828.
Sanchez-Weatherby, J., Bowler, M. W., Huet, J., Gobbo, A., Felisaz, F., Lavault, B., Moya,
R., Kadlec, J., Ravelli, R. B. G. & Cipriani, F. (2009). Improving diffraction by
humidity control: a novel device compatible with X-ray beamlines, Acta Cryst. D 65,
1237-1246.
Sjogren, T., Carlsson, G., Larsson, G., Hajdu, A., Andersson, C., Pettersson, H. & Hajdu, J.
(2002). Protein crystallography in a vapour stream: data collection, reaction initiation
and intermediate trapping in naked hydrated protein crystals, J App Cryst 35, 113-
116.
Takayama, Y. & Nakasako, M. (2012). Humidity-controlled preparation of frozen-hydrated
biological samples for cryogenic coherent x-ray diffraction microscopy, Rev Sci Instr
83, 054301.
Vijayalakshmi, L., Krishna, R., Sankaranarayanan, R. & Vijayan, M. (2008). An asymmetric
dimer of beta-lactoglobulin in a low humidity crystal form - Structural changes that
accompany partial dehydration and protein action, Proteins - Struct Func Bioinf 71,
241-249.
Wheeler, M. J., Russi, S., Bowler, M. G. & Bowler, M. W. (2012). Measurement of the
equilibrium relative humidity for common precipitant concentrations: facilitating
controlled dehydration experiments, Acta Cryst. F 68, 111-114.

20
Wishaw, B. F. & Stokes, R. H. (1954). Activities of aqueous ammonium sulphate solutions at
25, Trans Faraday Soc 50, 952-954.
Yap, T. L., Chen, Y. L., Xu, T., Wen, D. Y., Vasudevan, S. G. & Lescar, J. (2007). A multi-
step strategy to obtain crystals of the dengue virus RNA-dependent RNA polymerase
that diffract to high resolution, Acta Cryst. F 63, 78-83.
Zerrad, L., Merli, A., Schroder, G. F., Varga, A., Graczer, E., Pernot, P., Round, A., Vas, M.
& Bowler, M. W. (2011). A spring-loaded release mechanism regulates domain
movement and catalysis in phosphoglycerate kinase, J Biol Chem 286, 14040-14048.

Figure
Figure precipitand theStokes, calculatHC-Lab
legends
1. Plot showtants or adde measured
1954) andted RH fromb (A) more
wing the eqditives in mad vapour prd sodium cm Raoult’s accurately r
quilibrium reacromolecuressures abchloride (Rlaw (Whee
reflect the p
21
elative humular crystallobove solutioRobinson, 19eler et al., 2predicted va
midity for saogenesis mons of amm945) soluti
2012). The alues from R
alt solutionseasured usin
monium sulons (B). Tmeasureme
Raoult’s Law
s commonlying the HC-lphate (Wi
The lines shents made uw.
y used as -Lab (A) shaw & how the
using the

Figure as preci(A) and2011; Smodifie
2. Plot showipitants or ad the measurSadeghi & Zed for polym
wing the eqadditives in red vapour p
Ziamajidi, 2mer solution
quilibrium remacromolepressures ab006) (B). T
ns (Bowler,
22
elative hum
ecular crystabove PEG s
The lines shoet al., 2015
midity for PEallogenesissolutions froow the calcu5).
EG solutionmeasured uom (Sadeghulated RH f
ns commonlyusing the HChi & Shahebfrom Raoult
y used C-Lab brahimi, t’s law

23
Appendix. Statistical mechanics, entropy and chemical potentials The origin of Raoult’s law lies in the freedom of the units of solvent and of solute to roam all
through the volume of liquid. For the assumptions of an ideal solution access of both solvent
and solute to the whole volume results in energy levels available (to the solvent) for a given
volume, unchanged from those in pure solvent and the density of (energy) states is
proportional to volume. Entropy of mixing codes these same ideas in the language of
thermodynamics.
Suppose that we can decompose a system into many identical pieces having energy
levels . This complex system is in thermal equilibrium at some temperature T, with an
exponential distribution in energy of the components. Let the total energy of our complex
system be U. The following relations apply:
∑ exp
where ∑ exp / A small change in the internal energy U can be written as Δ ∑ Δ ∑ Δ ∑ ∆ The last term corresponds to taking a common potential out from the levels and vanishes if
there is no change in the number of components in the system. The first term is the result of
slightly redistributing the population over the energy levels . It represents the addition of
heat. The second term corresponds to the energy levels changing with no change of
population – doing it very slowly. If the volume slowly increases the energy levels slowly sag

24
and the system does work. Thus the equivalent expression in thermodynamics is the first law
in the form
Δ Δ Δ ∆
where the last term is called chemical work and is the chemical potential. (Generally, each
species of atom has its own chemical potential.) If everything is done very slowly and
reversibly
Δ Δ
where S is the thermodynamic entropy going back to Carnot. We are identifying the heat term
in the first law with
Δ Δ
Express the energy of the ith level in terms of its population = / For fixed N the sum of Δ is zero and so the term in ln z drops out and Δ Δ ∑ = Δ demonstrating the equivalence of the Carnot and Boltzmann entropies. Thus the entropy associated with N units (atoms, molecules, ions …) distributed over these
energy levels, in equilibrium at temperature T, is
The probabilities involve the normalising factor z, a sum over all energy levels. The value
depends on the level density. The more levels the components are spread over, the smaller the
individual and the larger the entropy.
Substitution of the expressions for the exponential probabilities yields for the entropy

25
Rewriting the sum for z as an integral
exp ⁄
The density of states factor depends on (which integrates out) and is linearly
proportional to the volume available to the wandering molecules. Consider taking a volume
of solvent and a volume of solute. (This is most easily envisaged if the solute is also a
liquid. Otherwise pretend that there is a solute liquid with the properties the solute will
display in the solution). Before mixing the two together each has its entropy, appropriate to
volumes and respectively. After mixing, both solvent and solute have access to a total
volume . For an ideal solution nothing else has changed and so taking the difference
of entropy after and before the mixing
(A.1) This is the entropy of mixing and arises entirely from the increased density of energy levels
as more volume is made available for units of both solvent and solute to roam at random.
(These volumes are defined by the boundaries confining the liquids, setting boundary
conditions and hence determining the quantised energy levels.)
Since we are looking at mixing of two forms of condensed matter, each with the same
specific volume (ideal solution again) the above expression for the entropy of mixing can also
be written with and replaced by and respectively. The result is essentially
identical to the product of k (Boltzmann’s constant) and the logarithm of the number of
different ways of arranging and units. This is a purely combinatorial problem and the
number of perceptibly different ways is given by
!! !
26
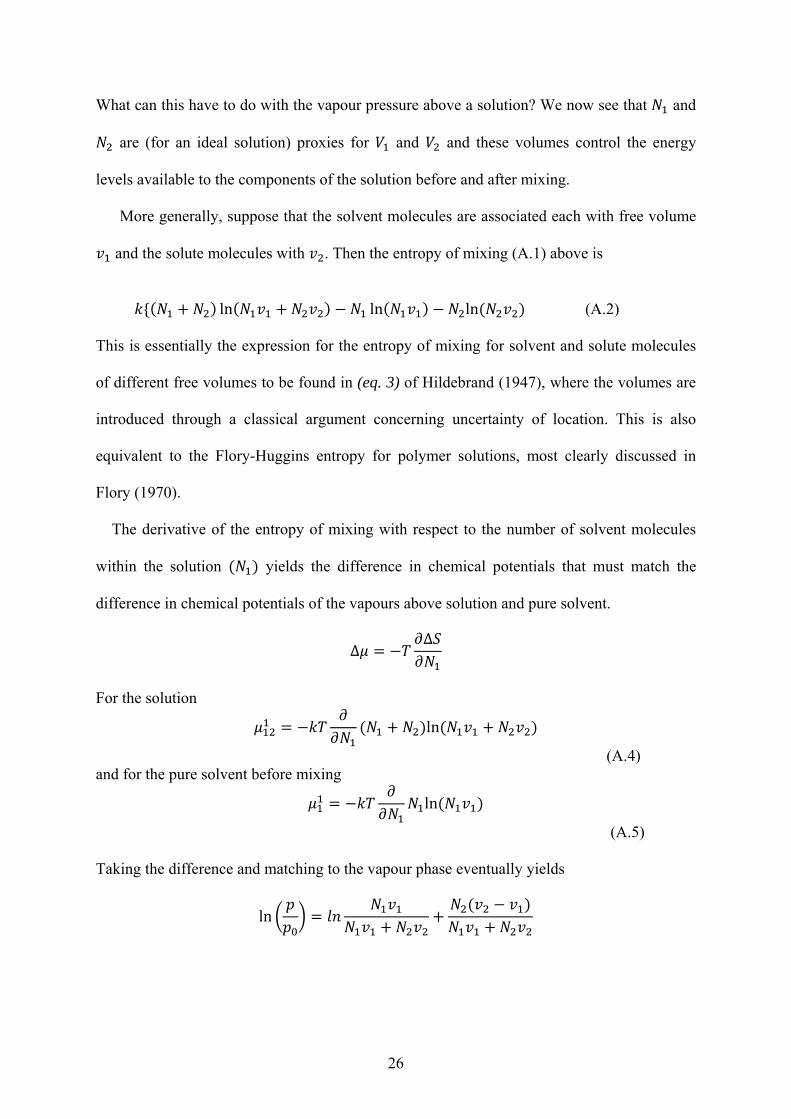
What can this have to do with the vapour pressure above a solution? We now see that and
are (for an ideal solution) proxies for and and these volumes control the energy
levels available to the components of the solution before and after mixing.
More generally, suppose that the solvent molecules are associated each with free volume
and the solute molecules with . Then the entropy of mixing (A.1) above is
ln ln ln (A.2) This is essentially the expression for the entropy of mixing for solvent and solute molecules
of different free volumes to be found in (eq. 3) of Hildebrand (1947), where the volumes are
introduced through a classical argument concerning uncertainty of location. This is also
equivalent to the Flory-Huggins entropy for polymer solutions, most clearly discussed in
Flory (1970).
The derivative of the entropy of mixing with respect to the number of solvent molecules
within the solution yields the difference in chemical potentials that must match the
difference in chemical potentials of the vapours above solution and pure solvent.
∆∆
For the solution
ln
(A.4) and for the pure solvent before mixing
ln
(A.5) Taking the difference and matching to the vapour phase eventually yields
ln

27
equation (6) of Hildebrand (1947). Then the relative humidity of the solvent above such a
solution is
exp
(A.6) Equation (A.6) is identical to (eq. 7). In section 3.2.3 we calculated the difference in work functions for the solvent in a solution of
volume V and pure solvent in the same volume. This result can also be obtained from the
differential of the difference of entropies of the solution and pure solvent in equal volumes.
The only terms that survive in the difference are ( for the solution and
for the pure solvent. The volume V is
= The relevant difference in chemical potentials is then
(A.7)
The negative of this is the difference in work functions, needed to complete the ratio of
vapour pressures at the end of section 3.2.3. The result (A.7) above of course agrees with (eq.
6).