Rankings of the States 2019 and Estimates of School ...
79
Rankings of the States 2019 and Estimates of School Statistics 2020 NEA Research June 2020 Reproduction: No part of this report may be reproduced in any form without permission from NEA Research, except by NEA-affiliated associations. Any reproduction of the report materials must include the usual credit line and the copyright notice. Address communications to NEA Research, 1201 16th Street, NW, St. 721; Washington, DC 20036 or by email to [email protected]. Copyright © 2020 by the National Education Association All Rights Reserved
Transcript of Rankings of the States 2019 and Estimates of School ...
Rankings of the States 2019
and
Estimates of School Statistics 2020
NEA Research June 2020
Reproduction: No part of this report may be reproduced in any form without permission from NEA
Research, except by NEA-affiliated associations. Any reproduction of the report materials must include the
usual credit line and the copyright notice. Address communications to NEA Research, 1201 16th Street,
NW, St. 721; Washington, DC 20036 or by email to [email protected].
Copyright © 2020 by the
National Education Association
All Rights Reserved

This page intentionally left blank

Contents
Foreword ....................................................................................................................................................... 5
Executive Summary ...................................................................................................................................... 7
Part I. Rankings 2019 Highlights .......................................................................................................... 7
Part II. Estimates 2020 Highlights ........................................................................................................ 8
Part III. National Trends 2011-20 Highlights ....................................................................................... 9
Technical Notes .......................................................................................................................................... 13
RANKINGS 2019 ...................................................................................................................................... 15
Series A—Enrollment and Attendance ....................................................................................................... 16
Series B—Faculty ....................................................................................................................................... 21
Series C—School Revenues ....................................................................................................................... 28
Series D—School Expenditures .................................................................................................................. 35
ESTIMATES 2020 .................................................................................................................................... 39
Series E—Students and Faculty .................................................................................................................. 40
Series F—School Revenues and Expenditures ........................................................................................... 49
NATIONAL TRENDS 2011-20 ............................................................................................................... 59
Series G—Students and Faculty ................................................................................................................. 60
Series H—School Revenues and Expenditures .......................................................................................... 67
Glossary ...................................................................................................................................................... 75
State Notes for Rankings and Estimates ..................................................................................................... 78
3

This page intentionally left blank
4
Foreword
The data presented in this report provide facts about the extent to which local, state, and national
governments commit resources to public education. As one might expect in a nation as diverse as the United
States—with respect to economics, geography, and politics—the level of commitment to education varies
on a state-by-state basis. Thus, NEA Research offers this report to its state and local affiliates as well as to
researchers, policy makers, and the public as a tool to examine public education programs and services.
Part I of this report—Rankings 2019—provides state-level data on an array of topics relevant to the complex
enterprise of public education. Since the 1960s, Rankings has presented facts and figures useful in
determining how states differ from one another—and from national averages—on important school
statistics such as student attendance, teacher employment and average salary, and school revenues and
expenditures. Of course, no set of tables tells the entire story of a state’s education offerings. Consideration
of factors such as a state’s tax system, provisions for other public services, and population characteristics
also are needed. Therefore, it is unwise to draw conclusions based solely on individual statistics in this
report.
Part II of this report—Estimates 2020—is in its 75th year of production. Estimates provides data tables
projecting public school enrollment, employment and compensation of personnel, and finances, as reported
by individual state departments of education. Not surprisingly, interest in the improvement and renewal of
public education continues to capture the attention of the nation.
Part III of this report—National Trends 2011‒20—presents summary data of national trends in student
enrollment and attendance, staff salaries, sources of school funding, and levels of educational expenditures
in the previous ten years. Such trends at the national level have been based on data reported state by state.
Public education in the United States is a joint enterprise between local, state, and federal governments.
Yet, progress in improving public education stems primarily from the efforts of state education agencies,
local districts, and individual schools. These public organizations deserve credit for recognizing that
spending for education needs to be acknowledged as an investment in our nation’s most valuable resource—
students. Similarly, this publication represents a collective effort that goes well beyond the staff of the
National Education Association. Individual state departments of education and the NEA’s state affiliates
participate in collecting and assembling the data presented in this report. As a result, the NEA appreciates
and acknowledges the cooperation it receives from all those whose efforts make this publication possible.
NEA Research
June 2020
5

This page intentionally left blank
6
Executive Summary
NEA Research collects, maintains, and analyzes data on issues and trends affecting the nation’s public
education systems, their employees, and students. This report, Rankings of the States 2019 and Estimates
of School Statistics 2020, contains data primarily based on information from state departments of education.
Significant highlights of the report are below.
Part I. Rankings 2019 Highlights
Enrollment and Attendance
In fall 2018, U.S. public schools enrolled 50,314,320 students, an increase of 0.1 percent over fall 2017.
The largest percentage enrollment growth from fall 2017 to fall 2018 occurred in the District of Columbia
(7.4%), North Dakota (1.7%), and Arizona (1.7%).
Student enrollment declined in 23 states from fall 2017 to fall 2018. The greatest declines were in West
Virginia (-1.8%), Mississippi (-1.5%), and Michigan (-1.0%).
The number of students in average daily attendance (ADA) increased by 0.3 percent nationwide, from
47,042,686 in 2017‒18 to 47,175,970 in 2018‒19.
High School Graduates
A total of 3,359,289 students graduated from high school in 2018‒19, up 0.8 percent from 3,333,546 in
2017‒18.
Classroom Teachers
U.S. public schools employed 3,195,571 teachers in 2018‒19. Texas (358,533), California (288,715), and
New York (211,029) employed the most teachers, while the District of Columbia (7,067), Wyoming
(7,198), and Alaska (7,889) employed the fewest.
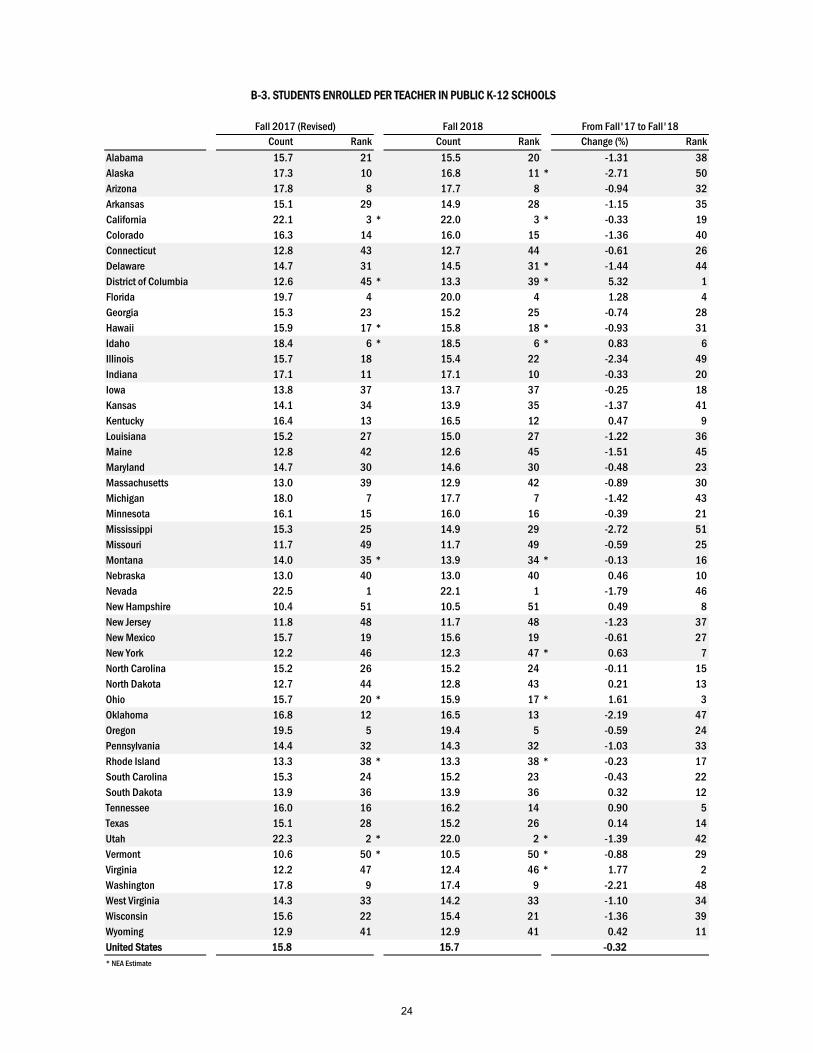
The average number of students enrolled per teacher decreased slightly (-0.3%) from 15.8 in 2017‒18 to
15.7 in 2018‒19. States with the highest number of students enrolled per teacher in fall 2018 were Nevada
(22.1), Utah (22.0), and California (22.0).
States with the lowest student-teacher ratios in fall 2018 were New Hampshire (10.5), Vermont (10.5), and
Missouri (11.7).
7
Teacher Salary
The national average public school teacher salary for 2018–19 was $62,304. State average teacher salaries
ranged from those in New York ($85,889), California ($83,059), and Massachusetts ($82,042) at the high
end to Mississippi ($45,105), West Virginia ($47,681) and New Mexico ($47,826) at the low end.
The national average one-year change in public school teacher salaries from 2017–18 to 2018–19 was 2.5
percent. The largest one-year decrease was in Louisiana (-0.1%), and the largest one-year increase was in
Washington (31.2%).
School Revenue
State and local governments continue to be the primary sources of public school funding. State funds
constituted 46.7 percent of public school revenue in 2017‒18 and 46.9 percent in 2018–19. Local funds
contributed similar shares in both 2017‒18 (45.7%) and 2018‒19 (45.5%). In those two years, federal funds
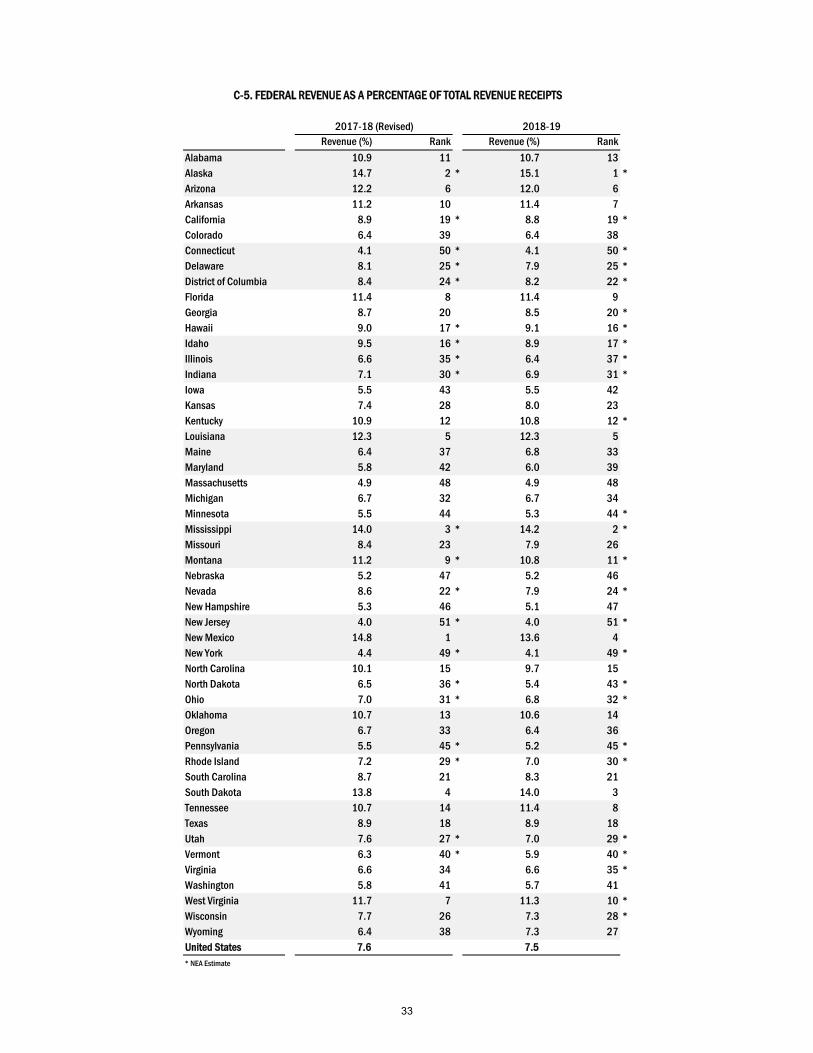
constituted 7.6 percent and 7.5 percent, respectively, of K‒12 education revenue.
Expenditures per Student
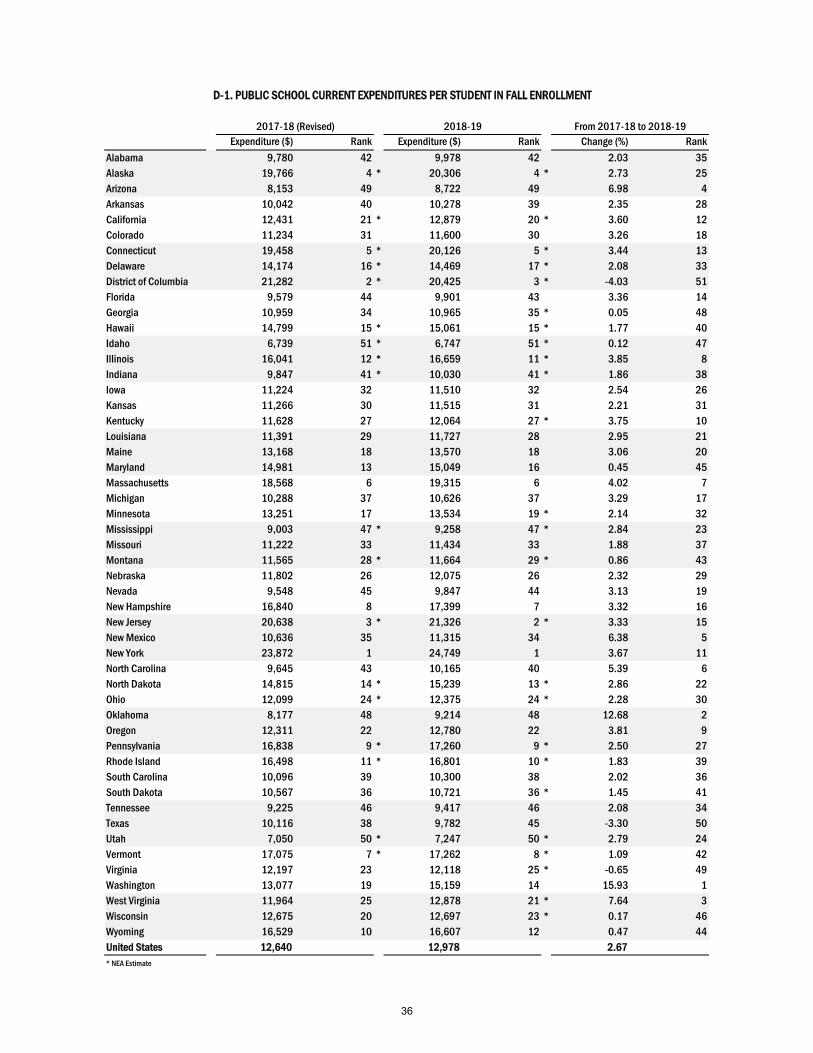
The national average per-student expenditure in 2018‒19 based on fall enrollment was $12,978, a gain of
2.7 percent from $12,640 in 2017‒18. The following states had the highest per-student expenditures: New
York ($24,749), New Jersey ($21,326), and the District of Columbia ($20,425). Idaho ($6,747), Utah
($7,247), and Arizona ($8,722) had the lowest per-student expenditures.
Part II. Estimates 2020 Highlights
Enrollment
Public school enrollment is expected to increase by an estimated 0.4 percent from 2018‒19 (50,314,320) to
2019‒20 (50,502,103).
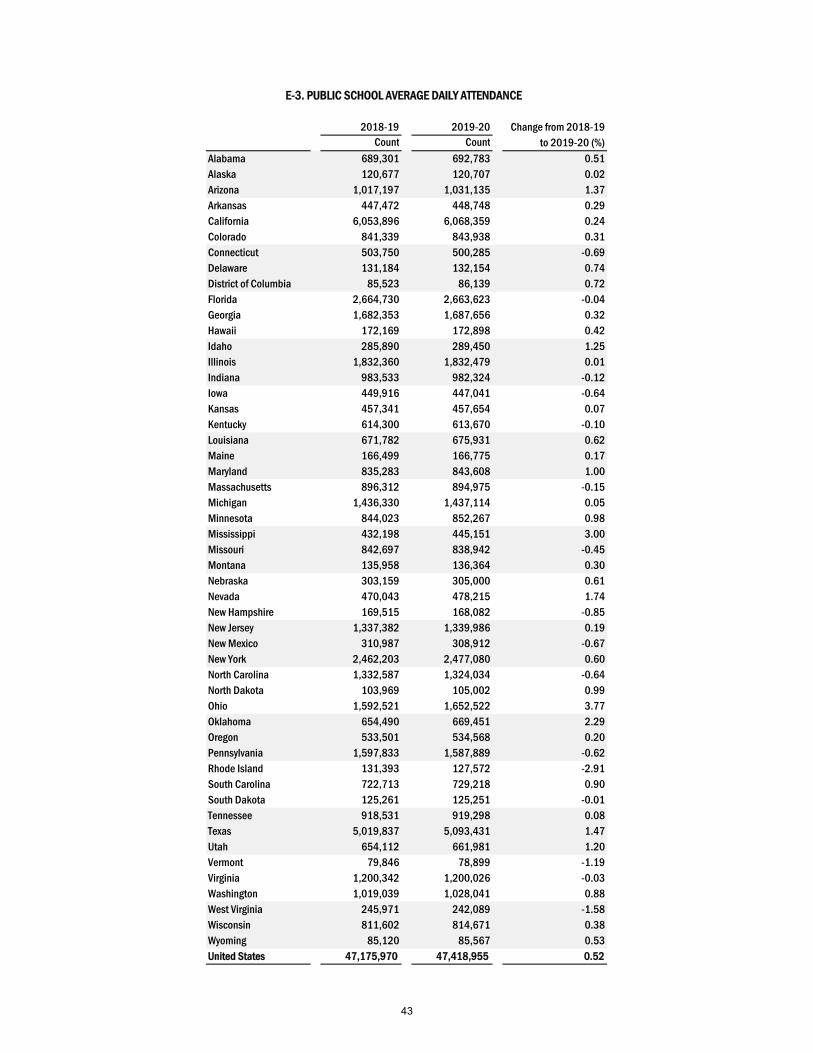
Average Daily Attendance
The number of students in average daily attendance is projected to grow by 0.5 percent from 47,175,970 in
2018‒19 to 47,418,955 in 2019‒20.
High School Graduates
A total of 3,380,868 students are expected to graduate from high school in 2019‒20, up 0.6 percent from
3,359,289 in 2018‒19.
Instructional Staff
The total number of instructional staff is expected to increase by 1.2 percent from 3,792,530 in 2018‒19 to
3,836,185 in 2019‒20.
8
Classroom Teachers
The number of public school classroom teachers is predicted to grow by 0.5 percent from 3,195,571 in 2018‒19 to 3,211,228 in 2019‒20.
Instructional Staff and Classroom Teacher Salaries
The average salary of instructional staff is projected to increase to $66,126 in 2019‒20, a gain of 2.4 percent
from 2018‒19.
The average classroom teacher salary for 2019‒20 is projected to increase by 2.2 percent over 2018‒
19, from $62,304 to $63,645.
School Revenue
State governments are expected to provide 47.5 percent of public school financial support for 2019‒20, up
0.6 percentage points from 2018‒19. For 2019‒20, the federal government’s contribution to public
elementary and secondary school revenues is estimated to be 7.4 percent, versus 7.5 percent in 2018‒19. In
2019-20, the contribution from local government is an estimated 45.1 percent, a slight decrease from 45.5
percent the previous year.
Student Expenditures
Expenditures per student in fall enrollment are projected to increase by 3.1 percent to $13,384 in 2019‒20,
up from $12,978 in 2018‒19. This rate compares with a 3.5 percent increase in total current expenditures.
Part III. National Trends 2011-20 Highlights
School Districts
The number of school districts increased by 1.2 percent, from 16,361 in 2010‒11 to an estimated 16,551 in
2019‒20. Of these 16,551 school districts, 16,333 (98.7%) are operating school districts.
Fall Enrollment
Public school enrollment registered 2.8 percent growth from fall 2010 (49,110,216) to fall 2019
(50,502,103).
Average Daily Attendance
The total number of students measured by average daily attendance increased by an estimated 3.0 percent
over the past decade, from 46,024,595 in 2010‒11 to 47,418,955 in 2019‒20.
9
High School Graduates
An estimated 3,380,868 high school students will graduate in 2019‒20, representing growth of 7.7 percent
from 3,138,036 graduates in 2010‒11.
Instructional Staff
Public schools employed an estimated 3,836,185 instructional staff in 2019‒20, an increase of 6.3 percent
compared to 3,608,336 in 2010‒11.
Classroom Teachers
The number of K‒12 classroom teachers is estimated to be 3,211,228 in 2019‒20, an increase of 3.6 percent compared to 3,101,076 in 2010‒11.
Instructional Staff and Classroom Teacher Salaries
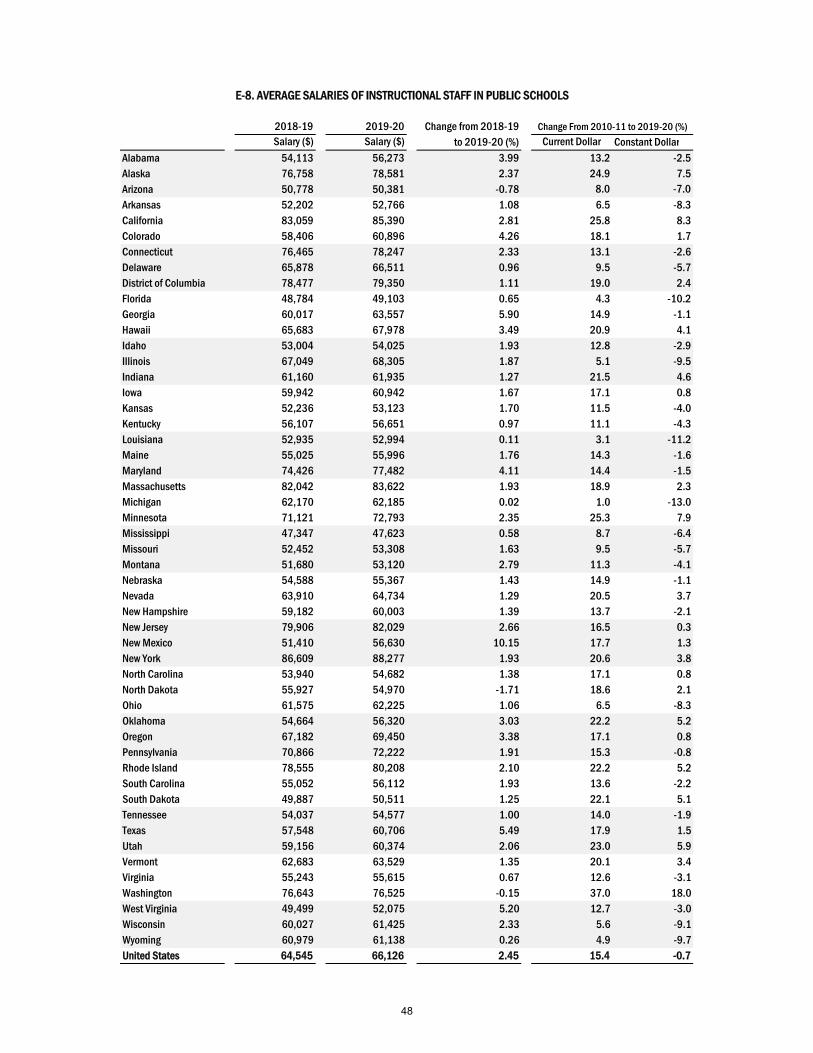
The national average instructional staff salary for 2019‒20 is estimated at $66,126, representing a gain of
15.4 percent since 2010‒11 ($57,323).
The average classroom teacher salary is estimated at $63,645 for the 2019‒20 school year, an increase of 14.1 percent over $55,759 in 2010‒11.
Inflation-adjusted Salaries
Significant differences exist between average salaries in current dollars versus constant dollars. Current-
dollar growth over the years since 2010‒11 has been substantial for both instructional staff and classroom
teachers. In contrast, when the effects of price inflation are considered, the average classroom teacher
salary decreased by an estimated 1.7 percent from 2010‒11 to 2019‒20, while the average salary for instructional staff declined by an estimated 0.7 percent.
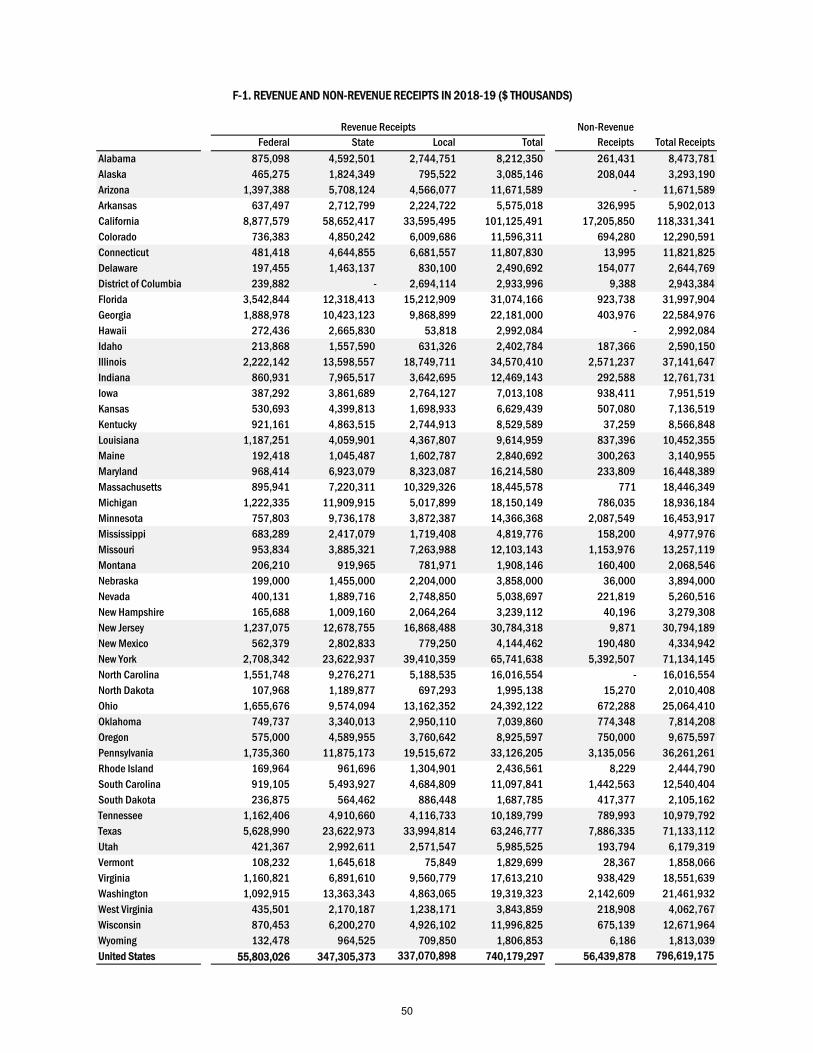
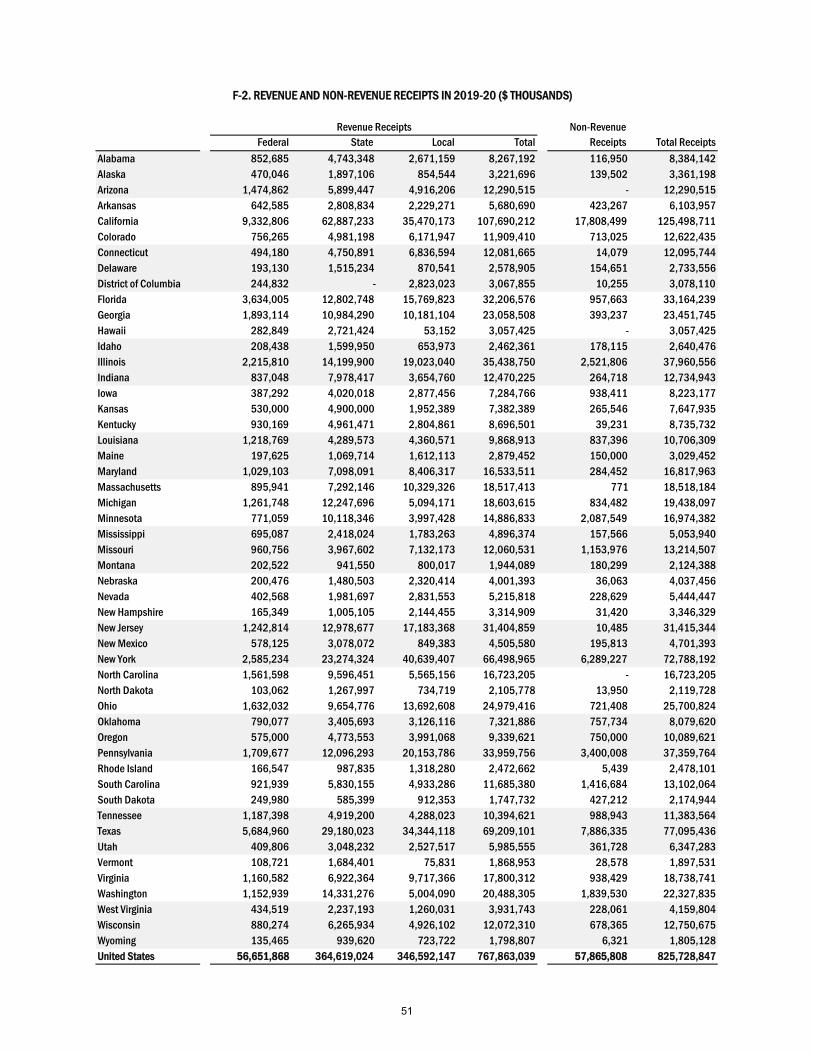
Total Receipts
Total national public school revenue and nonrevenue receipts for 2019‒20 are estimated at $825.7 billion,
an increase of 31.8 percent since 2010‒11. When adjusted for inflation, total receipts increased an estimated
13.5 percent over the decade.
Revenue Receipts
From 2010‒11 to 2019‒20, public school revenue receipts rose by an estimated 29.8 percent. Adjusting for
inflation, these revenues increased 11.8 percent over the decade.
During this 10-year period, the share of state funding ranged between 45.3 and 47.5 percent of total revenue
receipts. State education resources increased by 36.3 percent from school year 2011 to 2020, but increased
17.3 percent when adjusted for inflation. Local governments contributed similar shares of school revenue
receipts as the state governments.
From 2010‒11 to 2019‒20, the federal share dropped from 11.3 to 7.4 percent. Federal resources decreased
by 15.2 percent in current dollars and 27.0 percent when adjusted for inflation.
10
Total Expenditures
The total amount to be spent for current expenditures, capital outlay, and interest payments increased 28.5
percent from 2010‒11 to 2019‒20. Adjusting for the effects of price inflation, total expenditures increased
by 10.7 percent over the decade.
Current Expenditures
Current expenditures for public schools grew from $525.6 billion in 2010‒11 to $675.9 billion in 2019‒20,
a 28.6 percent increase. Current expenditures grew by 10.7 percent during the 10 years in inflation-adjusted
dollars.
Current Expenditure per Student in Enrollment
Over the last decade, average per-student expenditure rose by 25.1 percent from $10,703 to $13,384. After
inflation adjustment, the expenditure per student in enrollment increased by 7.7 percent.
Current Expenditure per Student in Average Daily Attendance
Average expenditure per student in average daily attendance increased 24.8 percent since 2011. The average
expenditure increased by 7.5 percent over the decade after being adjusted for inflation.
11

This page intentionally left blank
12
Technical Notes
The first part of this publication, Rankings 2019, contains ranking statistics of public elementary and
secondary schools for the 50 states and the District of Columbia. The education data are the most recent
actual or estimated data collected primarily from state departments of education. All tables on schools and
students, teachers and instructional staff, school revenues, and education expenditures have been updated
from the previous edition.
The second part, Estimates 2020, presents public school data for the 50 states and the District of Columbia
based on survey responses from state education agencies. State department of education contacts are asked
to provide estimated data for the current year (2019–20) and revisions to four years of historical data, as
necessary. Therefore, data for school years 2015‒16 through 2018‒19 were subject to revision as a result
of the 2019 surveys. The estimated data featured in this report are for the current school year (2019‒20)
and the previous school year (2018‒19). These data are provided on a state-by-state basis. All figures
represent projections by state education agencies—or NEA Research—as of September 2019.
NEA Research submits current-year estimates of educational statistics to each state’s Department of
Education for verification or revision each year. The figures are generated primarily using time series
analyses, which are standard statistical techniques designed to make predictions for the current year using
numerical data from prior years. If an education department does not replace these projections with its own
estimated data and NEA Research cannot find an equivalent source of data on the state department of
education website, this report uses an estimate generated either from a time-series model that uses past
Rankings & Estimates data or from one of two sources: the American Community Survey (ACS) for
average salaries, or NCES for non-salary data points. Which estimate source is used depends on NEA’s
knowledge of an individual state’s trends and policy actions over time, the quality of that state’s existing
Rankings & Estimates data, and the size of the state, as ACS data are most accurate for states with larger
populations.
The last part, National Trends 2011‒20, highlights summary public school statistics for the United States
over the last decade on students, teachers and instructional staff, school revenues, and education
expenditures.
NEA Research has calculated salary estimates using American Community Survey data for states that have
not reported such data for some years.
Note that throughout this publication school years may be indicated in several equivalent ways. More
specifically, the school year from September 2018 through June 2019 may be shown as “2018–19,” or it
may be indicated by shorthand as “2019,” or “19.”
Also note that some totals in certain tables may not sum exactly because of rounding. Dollar values are
expressed in “current dollars” unless otherwise noted.
The Consumer Price Index for all Urban Consumers is applied for computation of constant dollar salary,
revenue, and expenditure data.
13

This page intentionally left blank
14
Rankings 2019
15
SERIES A - ENROLLMENT AND ATTENDANCE
A-1. OPERATING PUBLIC SCHOOL DISTRICTS
A-2. PUBLIC SCHOOL TOTAL FALL ENROLLMENT
A-3. PUBLIC SCHOOL AVERAGE DAILY ATTENDANCE
A-4. NUMBER OF PUBLIC HIGH SCHOOL GRADUATES
16
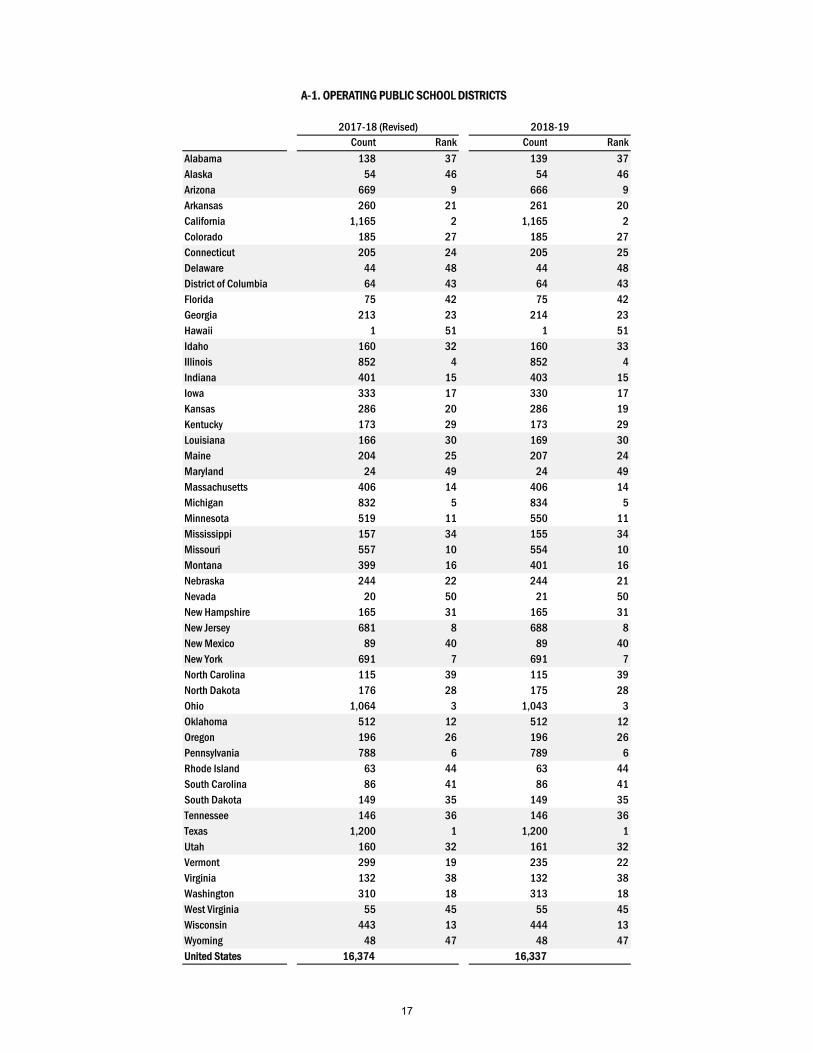
Count Rank Count Rank
Alabama 138 37 139 37Alaska 54 46 54 46Arizona 669 9 666 9Arkansas 260 21 261 20California 1,165 2 1,165 2Colorado 185 27 185 27Connecticut 205 24 205 25Delaware 44 48 44 48District of Columbia 64 43 64 43Florida 75 42 75 42Georgia 213 23 214 23Hawaii 1 51 1 51Idaho 160 32 160 33Illinois 852 4 852 4Indiana 401 15 403 15Iowa 333 17 330 17Kansas 286 20 286 19Kentucky 173 29 173 29Louisiana 166 30 169 30Maine 204 25 207 24Maryland 24 49 24 49Massachusetts 406 14 406 14Michigan 832 5 834 5Minnesota 519 11 550 11Mississippi 157 34 155 34Missouri 557 10 554 10Montana 399 16 401 16Nebraska 244 22 244 21Nevada 20 50 21 50New Hampshire 165 31 165 31New Jersey 681 8 688 8New Mexico 89 40 89 40New York 691 7 691 7North Carolina 115 39 115 39North Dakota 176 28 175 28Ohio 1,064 3 1,043 3Oklahoma 512 12 512 12Oregon 196 26 196 26Pennsylvania 788 6 789 6Rhode Island 63 44 63 44South Carolina 86 41 86 41South Dakota 149 35 149 35Tennessee 146 36 146 36Texas 1,200 1 1,200 1Utah 160 32 161 32Vermont 299 19 235 22Virginia 132 38 132 38Washington 310 18 313 18West Virginia 55 45 55 45Wisconsin 443 13 444 13Wyoming 48 47 48 47United States 16,374 16,337
2017-18 (Revised) 2018-19
A-1. OPERATING PUBLIC SCHOOL DISTRICTS
17
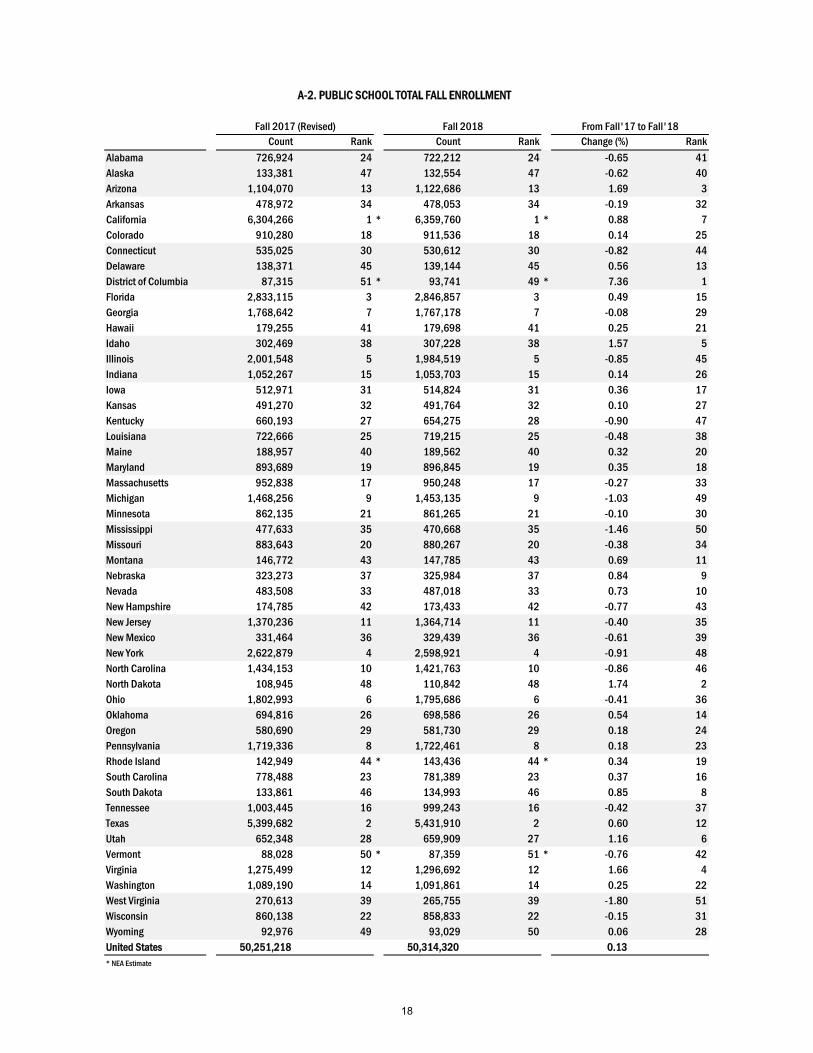
Count Rank Count Rank Change (%) Rank
Alabama 726,924 24 722,212 24 -0.65 41Alaska 133,381 47 132,554 47 -0.62 40Arizona 1,104,070 13 1,122,686 13 1.69 3Arkansas 478,972 34 478,053 34 -0.19 32California 6,304,266 1 * 6,359,760 1 * 0.88 7Colorado 910,280 18 911,536 18 0.14 25Connecticut 535,025 30 530,612 30 -0.82 44Delaware 138,371 45 139,144 45 0.56 13District of Columbia 87,315 51 * 93,741 49 * 7.36 1Florida 2,833,115 3 2,846,857 3 0.49 15Georgia 1,768,642 7 1,767,178 7 -0.08 29Hawaii 179,255 41 179,698 41 0.25 21Idaho 302,469 38 307,228 38 1.57 5Illinois 2,001,548 5 1,984,519 5 -0.85 45Indiana 1,052,267 15 1,053,703 15 0.14 26Iowa 512,971 31 514,824 31 0.36 17Kansas 491,270 32 491,764 32 0.10 27Kentucky 660,193 27 654,275 28 -0.90 47Louisiana 722,666 25 719,215 25 -0.48 38Maine 188,957 40 189,562 40 0.32 20Maryland 893,689 19 896,845 19 0.35 18Massachusetts 952,838 17 950,248 17 -0.27 33Michigan 1,468,256 9 1,453,135 9 -1.03 49Minnesota 862,135 21 861,265 21 -0.10 30Mississippi 477,633 35 470,668 35 -1.46 50Missouri 883,643 20 880,267 20 -0.38 34Montana 146,772 43 147,785 43 0.69 11Nebraska 323,273 37 325,984 37 0.84 9Nevada 483,508 33 487,018 33 0.73 10New Hampshire 174,785 42 173,433 42 -0.77 43New Jersey 1,370,236 11 1,364,714 11 -0.40 35New Mexico 331,464 36 329,439 36 -0.61 39New York 2,622,879 4 2,598,921 4 -0.91 48North Carolina 1,434,153 10 1,421,763 10 -0.86 46North Dakota 108,945 48 110,842 48 1.74 2Ohio 1,802,993 6 1,795,686 6 -0.41 36Oklahoma 694,816 26 698,586 26 0.54 14Oregon 580,690 29 581,730 29 0.18 24Pennsylvania 1,719,336 8 1,722,461 8 0.18 23Rhode Island 142,949 44 * 143,436 44 * 0.34 19South Carolina 778,488 23 781,389 23 0.37 16South Dakota 133,861 46 134,993 46 0.85 8Tennessee 1,003,445 16 999,243 16 -0.42 37Texas 5,399,682 2 5,431,910 2 0.60 12Utah 652,348 28 659,909 27 1.16 6Vermont 88,028 50 * 87,359 51 * -0.76 42Virginia 1,275,499 12 1,296,692 12 1.66 4Washington 1,089,190 14 1,091,861 14 0.25 22West Virginia 270,613 39 265,755 39 -1.80 51Wisconsin 860,138 22 858,833 22 -0.15 31Wyoming 92,976 49 93,029 50 0.06 28United States 50,251,218 50,314,320 0.13* NEA Estimate
A-2. PUBLIC SCHOOL TOTAL FALL ENROLLMENT
Fall 2017 (Revised) Fall 2018 From Fall'17 to Fall'18
18
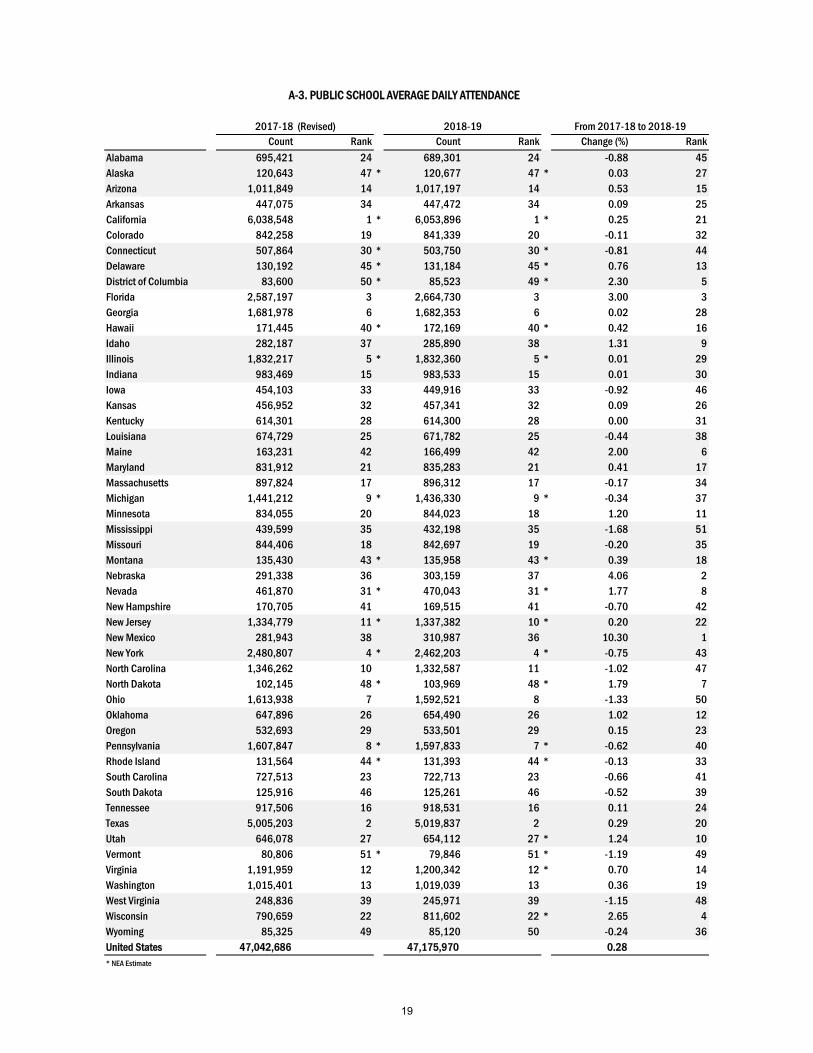
Count Rank Count Rank Change (%) Rank
Alabama 695,421 24 689,301 24 -0.88 45Alaska 120,643 47 * 120,677 47 * 0.03 27Arizona 1,011,849 14 1,017,197 14 0.53 15Arkansas 447,075 34 447,472 34 0.09 25California 6,038,548 1 * 6,053,896 1 * 0.25 21Colorado 842,258 19 841,339 20 -0.11 32Connecticut 507,864 30 * 503,750 30 * -0.81 44Delaware 130,192 45 * 131,184 45 * 0.76 13District of Columbia 83,600 50 * 85,523 49 * 2.30 5Florida 2,587,197 3 2,664,730 3 3.00 3Georgia 1,681,978 6 1,682,353 6 0.02 28Hawaii 171,445 40 * 172,169 40 * 0.42 16Idaho 282,187 37 285,890 38 1.31 9Illinois 1,832,217 5 * 1,832,360 5 * 0.01 29Indiana 983,469 15 983,533 15 0.01 30Iowa 454,103 33 449,916 33 -0.92 46Kansas 456,952 32 457,341 32 0.09 26Kentucky 614,301 28 614,300 28 0.00 31Louisiana 674,729 25 671,782 25 -0.44 38Maine 163,231 42 166,499 42 2.00 6Maryland 831,912 21 835,283 21 0.41 17Massachusetts 897,824 17 896,312 17 -0.17 34Michigan 1,441,212 9 * 1,436,330 9 * -0.34 37Minnesota 834,055 20 844,023 18 1.20 11Mississippi 439,599 35 432,198 35 -1.68 51Missouri 844,406 18 842,697 19 -0.20 35Montana 135,430 43 * 135,958 43 * 0.39 18Nebraska 291,338 36 303,159 37 4.06 2Nevada 461,870 31 * 470,043 31 * 1.77 8New Hampshire 170,705 41 169,515 41 -0.70 42New Jersey 1,334,779 11 * 1,337,382 10 * 0.20 22New Mexico 281,943 38 310,987 36 10.30 1New York 2,480,807 4 * 2,462,203 4 * -0.75 43North Carolina 1,346,262 10 1,332,587 11 -1.02 47North Dakota 102,145 48 * 103,969 48 * 1.79 7Ohio 1,613,938 7 1,592,521 8 -1.33 50Oklahoma 647,896 26 654,490 26 1.02 12Oregon 532,693 29 533,501 29 0.15 23Pennsylvania 1,607,847 8 * 1,597,833 7 * -0.62 40Rhode Island 131,564 44 * 131,393 44 * -0.13 33South Carolina 727,513 23 722,713 23 -0.66 41South Dakota 125,916 46 125,261 46 -0.52 39Tennessee 917,506 16 918,531 16 0.11 24Texas 5,005,203 2 5,019,837 2 0.29 20Utah 646,078 27 654,112 27 * 1.24 10Vermont 80,806 51 * 79,846 51 * -1.19 49Virginia 1,191,959 12 1,200,342 12 * 0.70 14Washington 1,015,401 13 1,019,039 13 0.36 19West Virginia 248,836 39 245,971 39 -1.15 48Wisconsin 790,659 22 811,602 22 * 2.65 4Wyoming 85,325 49 85,120 50 -0.24 36United States 47,042,686 47,175,970 0.28* NEA Estimate
A-3. PUBLIC SCHOOL AVERAGE DAILY ATTENDANCE
2017-18 (Revised) 2018-19 From 2017-18 to 2018-19
19
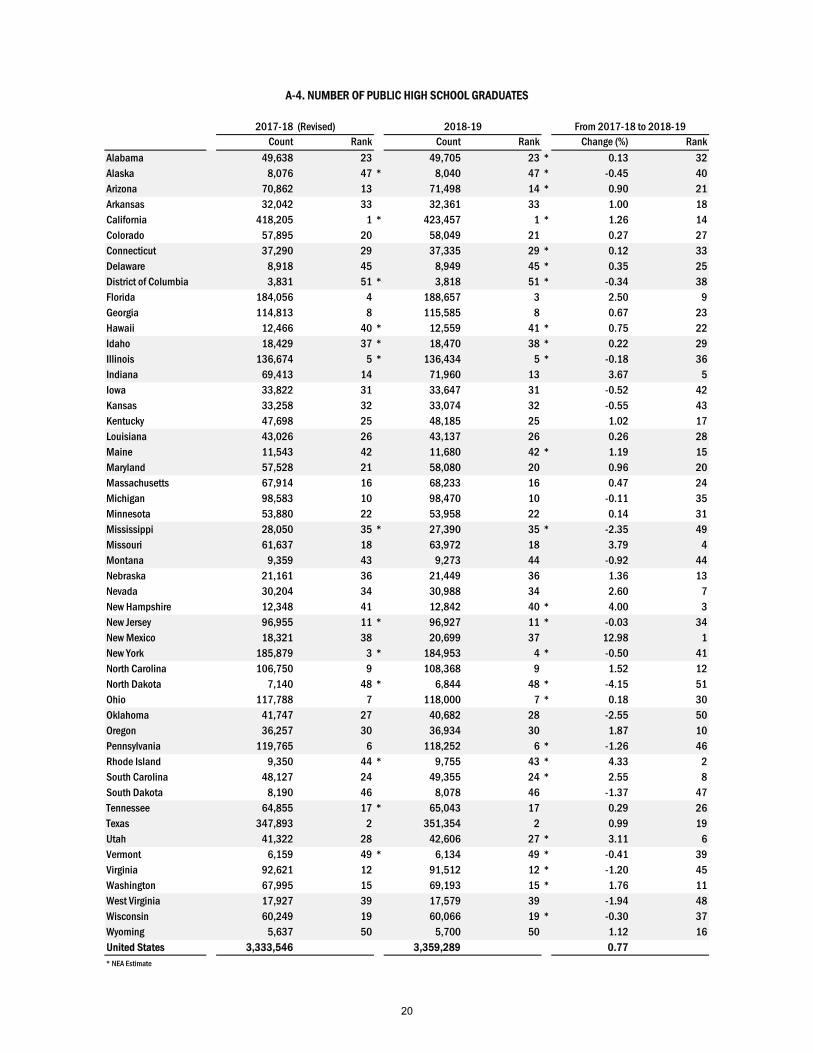
Count Rank Count Rank Change (%) Rank
Alabama 49,638 23 49,705 23 * 0.13 32Alaska 8,076 47 * 8,040 47 * -0.45 40Arizona 70,862 13 71,498 14 * 0.90 21Arkansas 32,042 33 32,361 33 1.00 18California 418,205 1 * 423,457 1 * 1.26 14Colorado 57,895 20 58,049 21 0.27 27Connecticut 37,290 29 37,335 29 * 0.12 33Delaware 8,918 45 8,949 45 * 0.35 25District of Columbia 3,831 51 * 3,818 51 * -0.34 38Florida 184,056 4 188,657 3 2.50 9Georgia 114,813 8 115,585 8 0.67 23Hawaii 12,466 40 * 12,559 41 * 0.75 22Idaho 18,429 37 * 18,470 38 * 0.22 29Illinois 136,674 5 * 136,434 5 * -0.18 36Indiana 69,413 14 71,960 13 3.67 5Iowa 33,822 31 33,647 31 -0.52 42Kansas 33,258 32 33,074 32 -0.55 43Kentucky 47,698 25 48,185 25 1.02 17Louisiana 43,026 26 43,137 26 0.26 28Maine 11,543 42 11,680 42 * 1.19 15Maryland 57,528 21 58,080 20 0.96 20Massachusetts 67,914 16 68,233 16 0.47 24Michigan 98,583 10 98,470 10 -0.11 35Minnesota 53,880 22 53,958 22 0.14 31Mississippi 28,050 35 * 27,390 35 * -2.35 49Missouri 61,637 18 63,972 18 3.79 4Montana 9,359 43 9,273 44 -0.92 44Nebraska 21,161 36 21,449 36 1.36 13Nevada 30,204 34 30,988 34 2.60 7New Hampshire 12,348 41 12,842 40 * 4.00 3New Jersey 96,955 11 * 96,927 11 * -0.03 34New Mexico 18,321 38 20,699 37 12.98 1New York 185,879 3 * 184,953 4 * -0.50 41North Carolina 106,750 9 108,368 9 1.52 12North Dakota 7,140 48 * 6,844 48 * -4.15 51Ohio 117,788 7 118,000 7 * 0.18 30Oklahoma 41,747 27 40,682 28 -2.55 50Oregon 36,257 30 36,934 30 1.87 10Pennsylvania 119,765 6 118,252 6 * -1.26 46Rhode Island 9,350 44 * 9,755 43 * 4.33 2South Carolina 48,127 24 49,355 24 * 2.55 8South Dakota 8,190 46 8,078 46 -1.37 47Tennessee 64,855 17 * 65,043 17 0.29 26Texas 347,893 2 351,354 2 0.99 19Utah 41,322 28 42,606 27 * 3.11 6Vermont 6,159 49 * 6,134 49 * -0.41 39Virginia 92,621 12 91,512 12 * -1.20 45Washington 67,995 15 69,193 15 * 1.76 11West Virginia 17,927 39 17,579 39 -1.94 48Wisconsin 60,249 19 60,066 19 * -0.30 37Wyoming 5,637 50 5,700 50 1.12 16United States 3,333,546 3,359,289 0.77* NEA Estimate
A-4. NUMBER OF PUBLIC HIGH SCHOOL GRADUATES
2017-18 (Revised) 2018-19 From 2017-18 to 2018-19
20
SERIES B - FACULTY
B-1. TOTAL INSTRUCTIONAL STAFF IN PUBLIC K-12 SCHOOLS
B-2. NUMBER OF TEACHERS IN PUBLIC K-12 SCHOOLS
B-3. STUDENTS ENROLLED PER TEACHER IN PUBLIC K-12 SCHOOLS
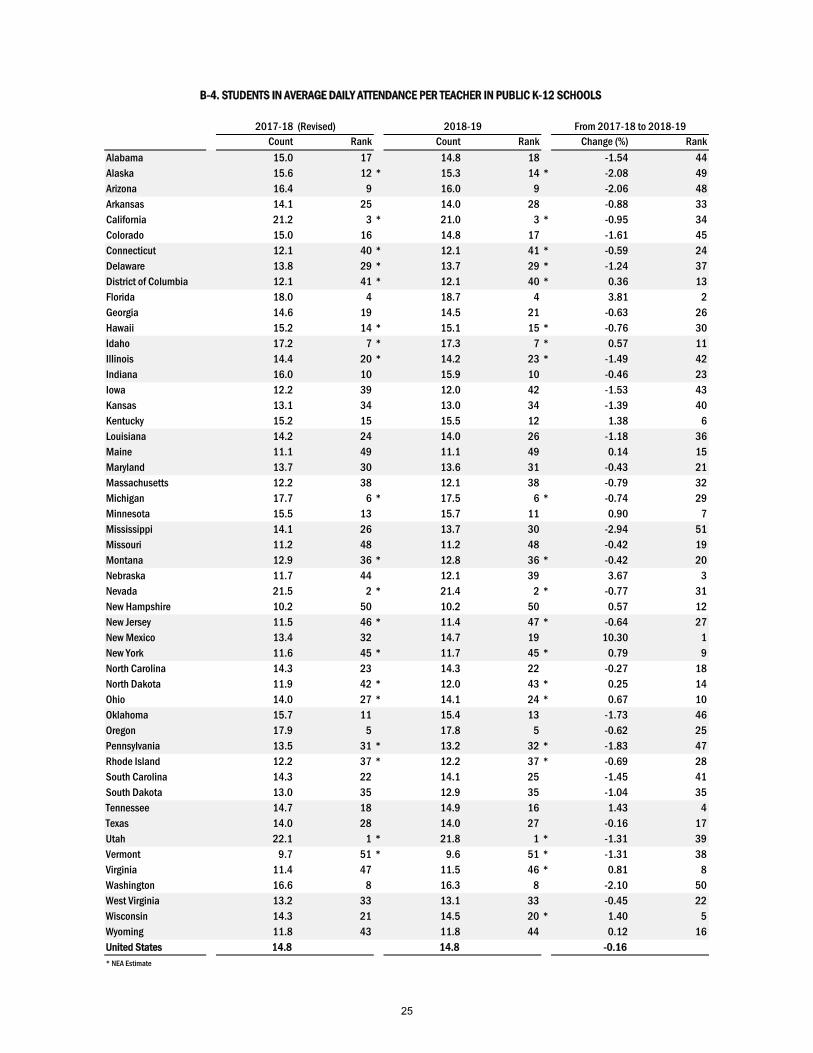
B-4. STUDENTS IN AVERAGE DAILY ATTENDANCE PER TEACHER IN PUBLIC K-12 SCHOOLS
B-5. AVERAGE SALARIES OF INSTRUCTIONAL STAFF IN PUBLIC SCHOOLS
B-6. AVERAGE SALARIES OF PUBLIC SCHOOL TEACHERS
21
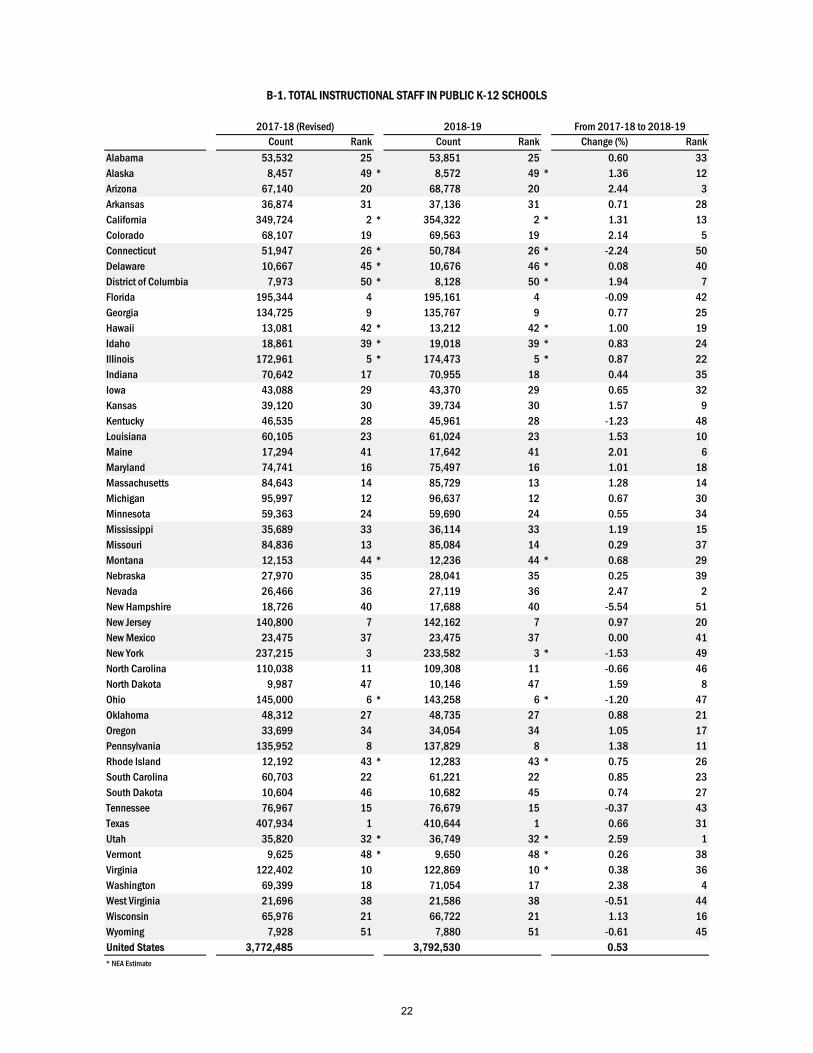
Count Rank Count Rank Change (%) Rank
Alabama 53,532 25 53,851 25 0.60 33Alaska 8,457 49 * 8,572 49 * 1.36 12Arizona 67,140 20 68,778 20 2.44 3Arkansas 36,874 31 37,136 31 0.71 28California 349,724 2 * 354,322 2 * 1.31 13Colorado 68,107 19 69,563 19 2.14 5Connecticut 51,947 26 * 50,784 26 * -2.24 50Delaware 10,667 45 * 10,676 46 * 0.08 40District of Columbia 7,973 50 * 8,128 50 * 1.94 7Florida 195,344 4 195,161 4 -0.09 42Georgia 134,725 9 135,767 9 0.77 25Hawaii 13,081 42 * 13,212 42 * 1.00 19Idaho 18,861 39 * 19,018 39 * 0.83 24Illinois 172,961 5 * 174,473 5 * 0.87 22Indiana 70,642 17 70,955 18 0.44 35Iowa 43,088 29 43,370 29 0.65 32Kansas 39,120 30 39,734 30 1.57 9Kentucky 46,535 28 45,961 28 -1.23 48Louisiana 60,105 23 61,024 23 1.53 10Maine 17,294 41 17,642 41 2.01 6Maryland 74,741 16 75,497 16 1.01 18Massachusetts 84,643 14 85,729 13 1.28 14Michigan 95,997 12 96,637 12 0.67 30Minnesota 59,363 24 59,690 24 0.55 34Mississippi 35,689 33 36,114 33 1.19 15Missouri 84,836 13 85,084 14 0.29 37Montana 12,153 44 * 12,236 44 * 0.68 29Nebraska 27,970 35 28,041 35 0.25 39Nevada 26,466 36 27,119 36 2.47 2New Hampshire 18,726 40 17,688 40 -5.54 51New Jersey 140,800 7 142,162 7 0.97 20New Mexico 23,475 37 23,475 37 0.00 41New York 237,215 3 233,582 3 * -1.53 49North Carolina 110,038 11 109,308 11 -0.66 46North Dakota 9,987 47 10,146 47 1.59 8Ohio 145,000 6 * 143,258 6 * -1.20 47Oklahoma 48,312 27 48,735 27 0.88 21Oregon 33,699 34 34,054 34 1.05 17Pennsylvania 135,952 8 137,829 8 1.38 11Rhode Island 12,192 43 * 12,283 43 * 0.75 26South Carolina 60,703 22 61,221 22 0.85 23South Dakota 10,604 46 10,682 45 0.74 27Tennessee 76,967 15 76,679 15 -0.37 43Texas 407,934 1 410,644 1 0.66 31Utah 35,820 32 * 36,749 32 * 2.59 1Vermont 9,625 48 * 9,650 48 * 0.26 38Virginia 122,402 10 122,869 10 * 0.38 36Washington 69,399 18 71,054 17 2.38 4West Virginia 21,696 38 21,586 38 -0.51 44Wisconsin 65,976 21 66,722 21 1.13 16Wyoming 7,928 51 7,880 51 -0.61 45United States 3,772,485 3,792,530 0.53* NEA Estimate
2017-18 (Revised) 2018-19
B-1. TOTAL INSTRUCTIONAL STAFF IN PUBLIC K-12 SCHOOLS
From 2017-18 to 2018-19
22
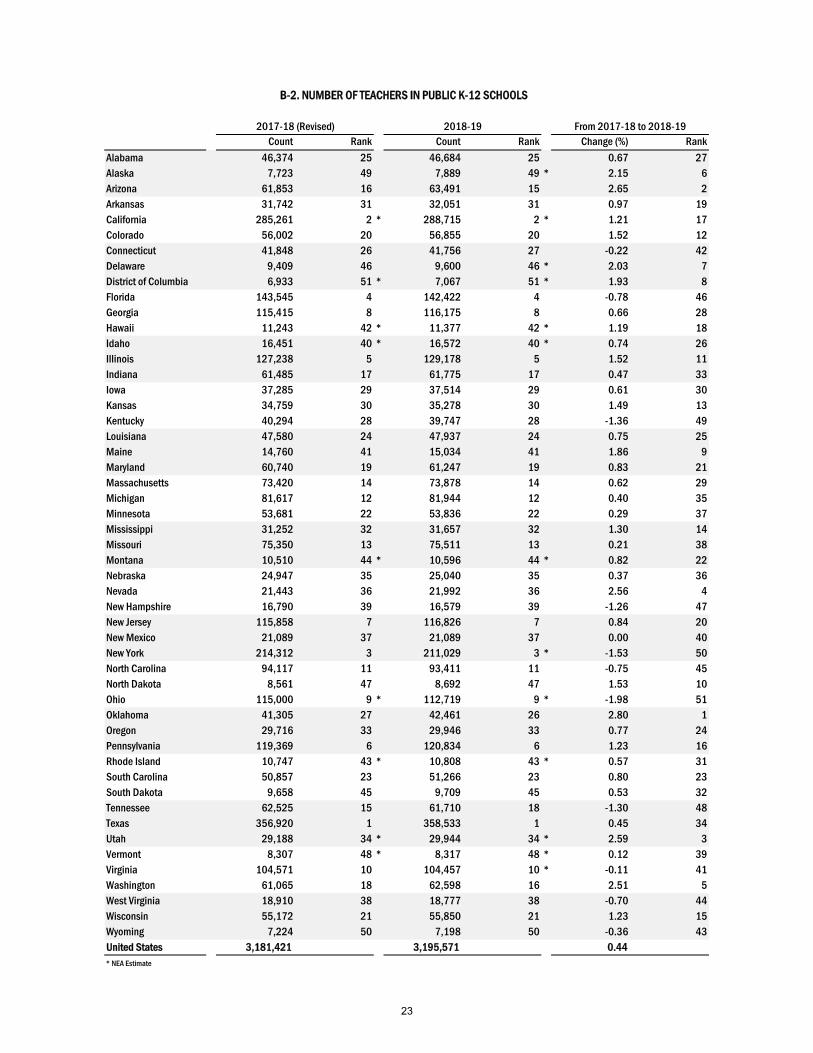
Count Rank Count Rank Change (%) Rank
Alabama 46,374 25 46,684 25 0.67 27Alaska 7,723 49 7,889 49 * 2.15 6Arizona 61,853 16 63,491 15 2.65 2Arkansas 31,742 31 32,051 31 0.97 19California 285,261 2 * 288,715 2 * 1.21 17Colorado 56,002 20 56,855 20 1.52 12Connecticut 41,848 26 41,756 27 -0.22 42Delaware 9,409 46 9,600 46 * 2.03 7District of Columbia 6,933 51 * 7,067 51 * 1.93 8Florida 143,545 4 142,422 4 -0.78 46Georgia 115,415 8 116,175 8 0.66 28Hawaii 11,243 42 * 11,377 42 * 1.19 18Idaho 16,451 40 * 16,572 40 * 0.74 26Illinois 127,238 5 129,178 5 1.52 11Indiana 61,485 17 61,775 17 0.47 33Iowa 37,285 29 37,514 29 0.61 30Kansas 34,759 30 35,278 30 1.49 13Kentucky 40,294 28 39,747 28 -1.36 49Louisiana 47,580 24 47,937 24 0.75 25Maine 14,760 41 15,034 41 1.86 9Maryland 60,740 19 61,247 19 0.83 21Massachusetts 73,420 14 73,878 14 0.62 29Michigan 81,617 12 81,944 12 0.40 35Minnesota 53,681 22 53,836 22 0.29 37Mississippi 31,252 32 31,657 32 1.30 14Missouri 75,350 13 75,511 13 0.21 38Montana 10,510 44 * 10,596 44 * 0.82 22Nebraska 24,947 35 25,040 35 0.37 36Nevada 21,443 36 21,992 36 2.56 4New Hampshire 16,790 39 16,579 39 -1.26 47New Jersey 115,858 7 116,826 7 0.84 20New Mexico 21,089 37 21,089 37 0.00 40New York 214,312 3 211,029 3 * -1.53 50North Carolina 94,117 11 93,411 11 -0.75 45North Dakota 8,561 47 8,692 47 1.53 10Ohio 115,000 9 * 112,719 9 * -1.98 51Oklahoma 41,305 27 42,461 26 2.80 1Oregon 29,716 33 29,946 33 0.77 24Pennsylvania 119,369 6 120,834 6 1.23 16Rhode Island 10,747 43 * 10,808 43 * 0.57 31South Carolina 50,857 23 51,266 23 0.80 23South Dakota 9,658 45 9,709 45 0.53 32Tennessee 62,525 15 61,710 18 -1.30 48Texas 356,920 1 358,533 1 0.45 34Utah 29,188 34 * 29,944 34 * 2.59 3Vermont 8,307 48 * 8,317 48 * 0.12 39Virginia 104,571 10 104,457 10 * -0.11 41Washington 61,065 18 62,598 16 2.51 5West Virginia 18,910 38 18,777 38 -0.70 44Wisconsin 55,172 21 55,850 21 1.23 15Wyoming 7,224 50 7,198 50 -0.36 43United States 3,181,421 3,195,571 0.44* NEA Estimate
B-2. NUMBER OF TEACHERS IN PUBLIC K-12 SCHOOLS
2017-18 (Revised) 2018-19 From 2017-18 to 2018-19
23
Count Rank Count Rank Change (%) Rank
Alabama 15.7 21 15.5 20 -1.31 38Alaska 17.3 10 16.8 11 * -2.71 50Arizona 17.8 8 17.7 8 -0.94 32Arkansas 15.1 29 14.9 28 -1.15 35California 22.1 3 * 22.0 3 * -0.33 19Colorado 16.3 14 16.0 15 -1.36 40Connecticut 12.8 43 12.7 44 -0.61 26Delaware 14.7 31 14.5 31 * -1.44 44District of Columbia 12.6 45 * 13.3 39 * 5.32 1Florida 19.7 4 20.0 4 1.28 4Georgia 15.3 23 15.2 25 -0.74 28Hawaii 15.9 17 * 15.8 18 * -0.93 31Idaho 18.4 6 * 18.5 6 * 0.83 6Illinois 15.7 18 15.4 22 -2.34 49Indiana 17.1 11 17.1 10 -0.33 20Iowa 13.8 37 13.7 37 -0.25 18Kansas 14.1 34 13.9 35 -1.37 41Kentucky 16.4 13 16.5 12 0.47 9Louisiana 15.2 27 15.0 27 -1.22 36Maine 12.8 42 12.6 45 -1.51 45Maryland 14.7 30 14.6 30 -0.48 23Massachusetts 13.0 39 12.9 42 -0.89 30Michigan 18.0 7 17.7 7 -1.42 43Minnesota 16.1 15 16.0 16 -0.39 21Mississippi 15.3 25 14.9 29 -2.72 51Missouri 11.7 49 11.7 49 -0.59 25Montana 14.0 35 * 13.9 34 * -0.13 16Nebraska 13.0 40 13.0 40 0.46 10Nevada 22.5 1 22.1 1 -1.79 46New Hampshire 10.4 51 10.5 51 0.49 8New Jersey 11.8 48 11.7 48 -1.23 37New Mexico 15.7 19 15.6 19 -0.61 27New York 12.2 46 12.3 47 * 0.63 7North Carolina 15.2 26 15.2 24 -0.11 15North Dakota 12.7 44 12.8 43 0.21 13Ohio 15.7 20 * 15.9 17 * 1.61 3Oklahoma 16.8 12 16.5 13 -2.19 47Oregon 19.5 5 19.4 5 -0.59 24Pennsylvania 14.4 32 14.3 32 -1.03 33Rhode Island 13.3 38 * 13.3 38 * -0.23 17South Carolina 15.3 24 15.2 23 -0.43 22South Dakota 13.9 36 13.9 36 0.32 12Tennessee 16.0 16 16.2 14 0.90 5Texas 15.1 28 15.2 26 0.14 14Utah 22.3 2 * 22.0 2 * -1.39 42Vermont 10.6 50 * 10.5 50 * -0.88 29Virginia 12.2 47 12.4 46 * 1.77 2Washington 17.8 9 17.4 9 -2.21 48West Virginia 14.3 33 14.2 33 -1.10 34Wisconsin 15.6 22 15.4 21 -1.36 39Wyoming 12.9 41 12.9 41 0.42 11United States 15.8 15.7 -0.32* NEA Estimate
B-3. STUDENTS ENROLLED PER TEACHER IN PUBLIC K-12 SCHOOLS
Fall 2017 (Revised) Fall 2018 From Fall'17 to Fall'18
24
Count Rank Count Rank Change (%) Rank
Alabama 15.0 17 14.8 18 -1.54 44Alaska 15.6 12 * 15.3 14 * -2.08 49Arizona 16.4 9 16.0 9 -2.06 48Arkansas 14.1 25 14.0 28 -0.88 33California 21.2 3 * 21.0 3 * -0.95 34Colorado 15.0 16 14.8 17 -1.61 45Connecticut 12.1 40 * 12.1 41 * -0.59 24Delaware 13.8 29 * 13.7 29 * -1.24 37District of Columbia 12.1 41 * 12.1 40 * 0.36 13Florida 18.0 4 18.7 4 3.81 2Georgia 14.6 19 14.5 21 -0.63 26Hawaii 15.2 14 * 15.1 15 * -0.76 30Idaho 17.2 7 * 17.3 7 * 0.57 11Illinois 14.4 20 * 14.2 23 * -1.49 42Indiana 16.0 10 15.9 10 -0.46 23Iowa 12.2 39 12.0 42 -1.53 43Kansas 13.1 34 13.0 34 -1.39 40Kentucky 15.2 15 15.5 12 1.38 6Louisiana 14.2 24 14.0 26 -1.18 36Maine 11.1 49 11.1 49 0.14 15Maryland 13.7 30 13.6 31 -0.43 21Massachusetts 12.2 38 12.1 38 -0.79 32Michigan 17.7 6 * 17.5 6 * -0.74 29Minnesota 15.5 13 15.7 11 0.90 7Mississippi 14.1 26 13.7 30 -2.94 51Missouri 11.2 48 11.2 48 -0.42 19Montana 12.9 36 * 12.8 36 * -0.42 20Nebraska 11.7 44 12.1 39 3.67 3Nevada 21.5 2 * 21.4 2 * -0.77 31New Hampshire 10.2 50 10.2 50 0.57 12New Jersey 11.5 46 * 11.4 47 * -0.64 27New Mexico 13.4 32 14.7 19 10.30 1New York 11.6 45 * 11.7 45 * 0.79 9North Carolina 14.3 23 14.3 22 -0.27 18North Dakota 11.9 42 * 12.0 43 * 0.25 14Ohio 14.0 27 * 14.1 24 * 0.67 10Oklahoma 15.7 11 15.4 13 -1.73 46Oregon 17.9 5 17.8 5 -0.62 25Pennsylvania 13.5 31 * 13.2 32 * -1.83 47Rhode Island 12.2 37 * 12.2 37 * -0.69 28South Carolina 14.3 22 14.1 25 -1.45 41South Dakota 13.0 35 12.9 35 -1.04 35Tennessee 14.7 18 14.9 16 1.43 4Texas 14.0 28 14.0 27 -0.16 17Utah 22.1 1 * 21.8 1 * -1.31 39Vermont 9.7 51 * 9.6 51 * -1.31 38Virginia 11.4 47 11.5 46 * 0.81 8Washington 16.6 8 16.3 8 -2.10 50West Virginia 13.2 33 13.1 33 -0.45 22Wisconsin 14.3 21 14.5 20 * 1.40 5Wyoming 11.8 43 11.8 44 0.12 16United States 14.8 14.8 -0.16* NEA Estimate
B-4. STUDENTS IN AVERAGE DAILY ATTENDANCE PER TEACHER IN PUBLIC K-12 SCHOOLS
2017-18 (Revised) 2018-19 From 2017-18 to 2018-19
25
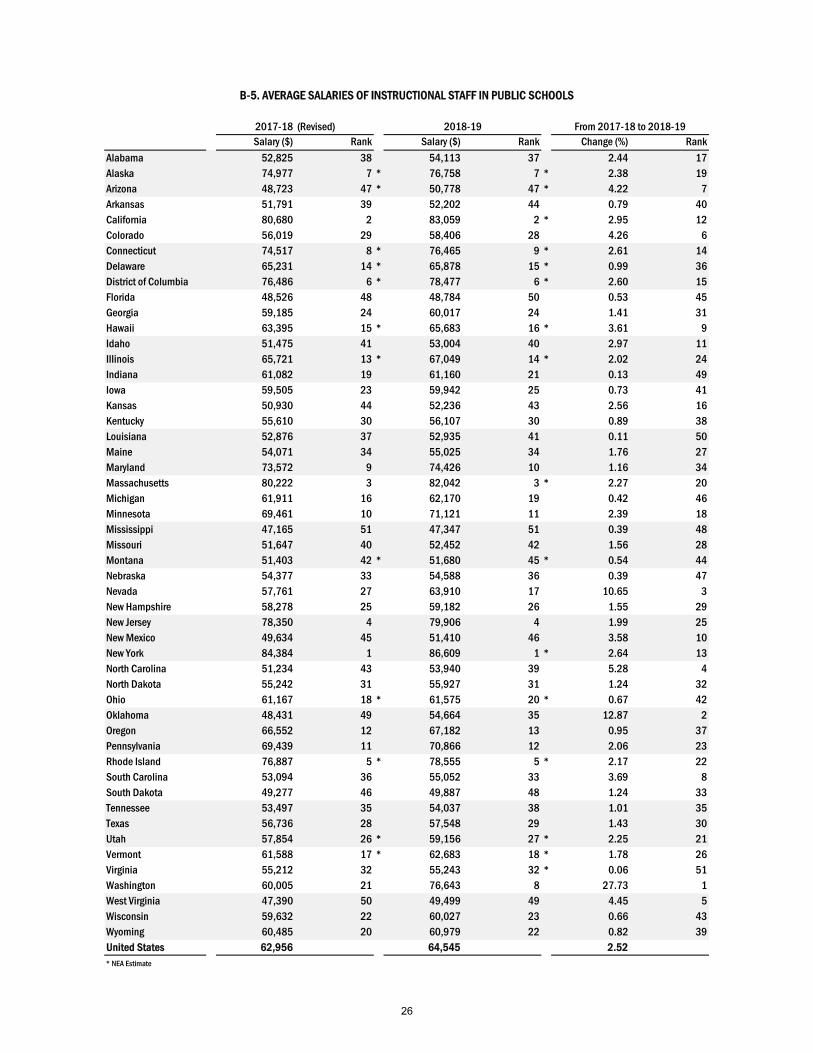
Salary ($) Rank Salary ($) Rank Change (%) Rank
Alabama 52,825 38 54,113 37 2.44 17Alaska 74,977 7 * 76,758 7 * 2.38 19Arizona 48,723 47 * 50,778 47 * 4.22 7Arkansas 51,791 39 52,202 44 0.79 40California 80,680 2 83,059 2 * 2.95 12Colorado 56,019 29 58,406 28 4.26 6Connecticut 74,517 8 * 76,465 9 * 2.61 14Delaware 65,231 14 * 65,878 15 * 0.99 36District of Columbia 76,486 6 * 78,477 6 * 2.60 15Florida 48,526 48 48,784 50 0.53 45Georgia 59,185 24 60,017 24 1.41 31Hawaii 63,395 15 * 65,683 16 * 3.61 9Idaho 51,475 41 53,004 40 2.97 11Illinois 65,721 13 * 67,049 14 * 2.02 24Indiana 61,082 19 61,160 21 0.13 49Iowa 59,505 23 59,942 25 0.73 41Kansas 50,930 44 52,236 43 2.56 16Kentucky 55,610 30 56,107 30 0.89 38Louisiana 52,876 37 52,935 41 0.11 50Maine 54,071 34 55,025 34 1.76 27Maryland 73,572 9 74,426 10 1.16 34Massachusetts 80,222 3 82,042 3 * 2.27 20Michigan 61,911 16 62,170 19 0.42 46Minnesota 69,461 10 71,121 11 2.39 18Mississippi 47,165 51 47,347 51 0.39 48Missouri 51,647 40 52,452 42 1.56 28Montana 51,403 42 * 51,680 45 * 0.54 44Nebraska 54,377 33 54,588 36 0.39 47Nevada 57,761 27 63,910 17 10.65 3New Hampshire 58,278 25 59,182 26 1.55 29New Jersey 78,350 4 79,906 4 1.99 25New Mexico 49,634 45 51,410 46 3.58 10New York 84,384 1 86,609 1 * 2.64 13North Carolina 51,234 43 53,940 39 5.28 4North Dakota 55,242 31 55,927 31 1.24 32Ohio 61,167 18 * 61,575 20 * 0.67 42Oklahoma 48,431 49 54,664 35 12.87 2Oregon 66,552 12 67,182 13 0.95 37Pennsylvania 69,439 11 70,866 12 2.06 23Rhode Island 76,887 5 * 78,555 5 * 2.17 22South Carolina 53,094 36 55,052 33 3.69 8South Dakota 49,277 46 49,887 48 1.24 33Tennessee 53,497 35 54,037 38 1.01 35Texas 56,736 28 57,548 29 1.43 30Utah 57,854 26 * 59,156 27 * 2.25 21Vermont 61,588 17 * 62,683 18 * 1.78 26Virginia 55,212 32 55,243 32 * 0.06 51Washington 60,005 21 76,643 8 27.73 1West Virginia 47,390 50 49,499 49 4.45 5Wisconsin 59,632 22 60,027 23 0.66 43Wyoming 60,485 20 60,979 22 0.82 39United States 62,956 64,545 2.52* NEA Estimate
B-5. AVERAGE SALARIES OF INSTRUCTIONAL STAFF IN PUBLIC SCHOOLS
2017-18 (Revised) 2018-19 From 2017-18 to 2018-19
26
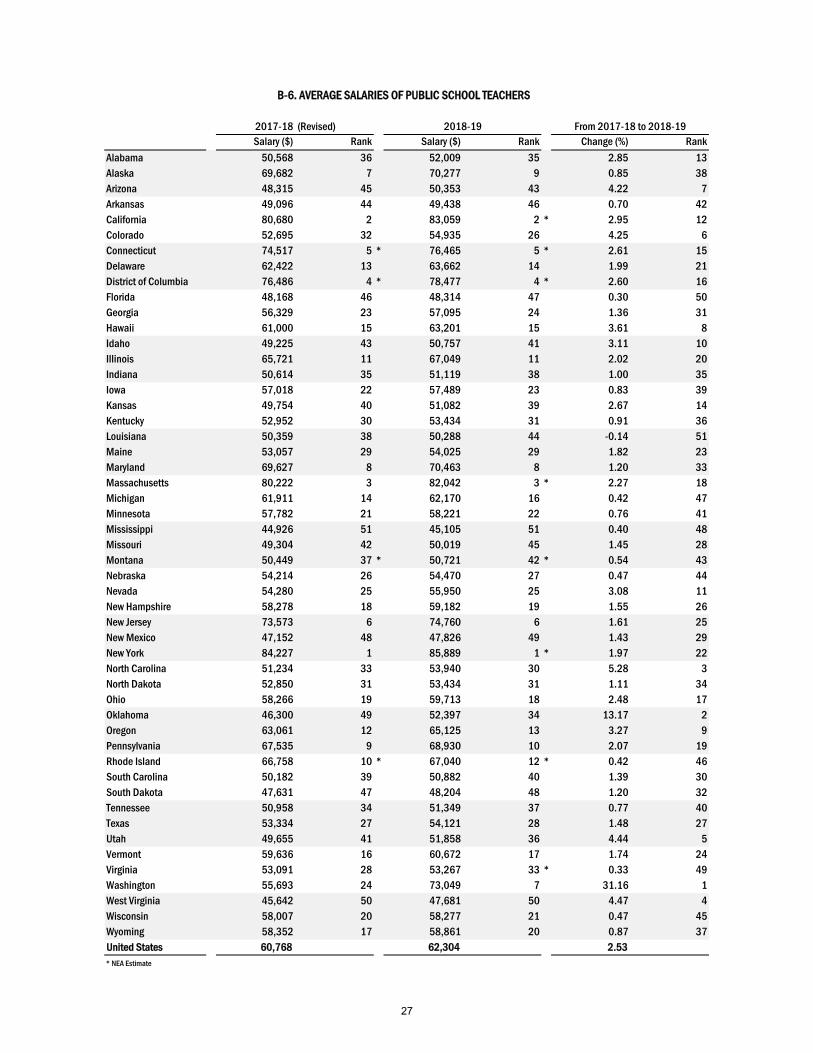
Salary ($) Rank Salary ($) Rank Change (%) Rank
Alabama 50,568 36 52,009 35 2.85 13Alaska 69,682 7 70,277 9 0.85 38Arizona 48,315 45 50,353 43 4.22 7Arkansas 49,096 44 49,438 46 0.70 42California 80,680 2 83,059 2 * 2.95 12Colorado 52,695 32 54,935 26 4.25 6Connecticut 74,517 5 * 76,465 5 * 2.61 15Delaware 62,422 13 63,662 14 1.99 21District of Columbia 76,486 4 * 78,477 4 * 2.60 16Florida 48,168 46 48,314 47 0.30 50Georgia 56,329 23 57,095 24 1.36 31Hawaii 61,000 15 63,201 15 3.61 8Idaho 49,225 43 50,757 41 3.11 10Illinois 65,721 11 67,049 11 2.02 20Indiana 50,614 35 51,119 38 1.00 35Iowa 57,018 22 57,489 23 0.83 39Kansas 49,754 40 51,082 39 2.67 14Kentucky 52,952 30 53,434 31 0.91 36Louisiana 50,359 38 50,288 44 -0.14 51Maine 53,057 29 54,025 29 1.82 23Maryland 69,627 8 70,463 8 1.20 33Massachusetts 80,222 3 82,042 3 * 2.27 18Michigan 61,911 14 62,170 16 0.42 47Minnesota 57,782 21 58,221 22 0.76 41Mississippi 44,926 51 45,105 51 0.40 48Missouri 49,304 42 50,019 45 1.45 28Montana 50,449 37 * 50,721 42 * 0.54 43Nebraska 54,214 26 54,470 27 0.47 44Nevada 54,280 25 55,950 25 3.08 11New Hampshire 58,278 18 59,182 19 1.55 26New Jersey 73,573 6 74,760 6 1.61 25New Mexico 47,152 48 47,826 49 1.43 29New York 84,227 1 85,889 1 * 1.97 22North Carolina 51,234 33 53,940 30 5.28 3North Dakota 52,850 31 53,434 31 1.11 34Ohio 58,266 19 59,713 18 2.48 17Oklahoma 46,300 49 52,397 34 13.17 2Oregon 63,061 12 65,125 13 3.27 9Pennsylvania 67,535 9 68,930 10 2.07 19Rhode Island 66,758 10 * 67,040 12 * 0.42 46South Carolina 50,182 39 50,882 40 1.39 30South Dakota 47,631 47 48,204 48 1.20 32Tennessee 50,958 34 51,349 37 0.77 40Texas 53,334 27 54,121 28 1.48 27Utah 49,655 41 51,858 36 4.44 5Vermont 59,636 16 60,672 17 1.74 24Virginia 53,091 28 53,267 33 * 0.33 49Washington 55,693 24 73,049 7 31.16 1West Virginia 45,642 50 47,681 50 4.47 4Wisconsin 58,007 20 58,277 21 0.47 45Wyoming 58,352 17 58,861 20 0.87 37United States 60,768 62,304 2.53* NEA Estimate
B-6. AVERAGE SALARIES OF PUBLIC SCHOOL TEACHERS
2017-18 (Revised) 2018-19 From 2017-18 to 2018-19
27
SERIES C - SCHOOL REVENUES
C-1. PUBLIC SCHOOL REVENUE RECEIPTS PER STUDENT IN FALL ENROLLMENT
C-2. PUBLIC SCHOOL REVENUE RECEIPTS PER STUDENT IN AVERAGE DAILY ATTENDANCE
C-3. LOCAL REVENUE AS A PERCENTAGE OF TOTAL REVENUE RECEIPTS
C-4. STATE REVENUE AS A PERCENTAGE OF TOTAL REVENUE RECEIPTS
C-5. FEDERAL REVENUE AS A PERCENTAGE OF TOTAL REVENUE RECEIPTS
C-6. LOCAL REVENUE AS A PERCENTAGE OF COMBINED STATE AND LOCAL REVENUE
28
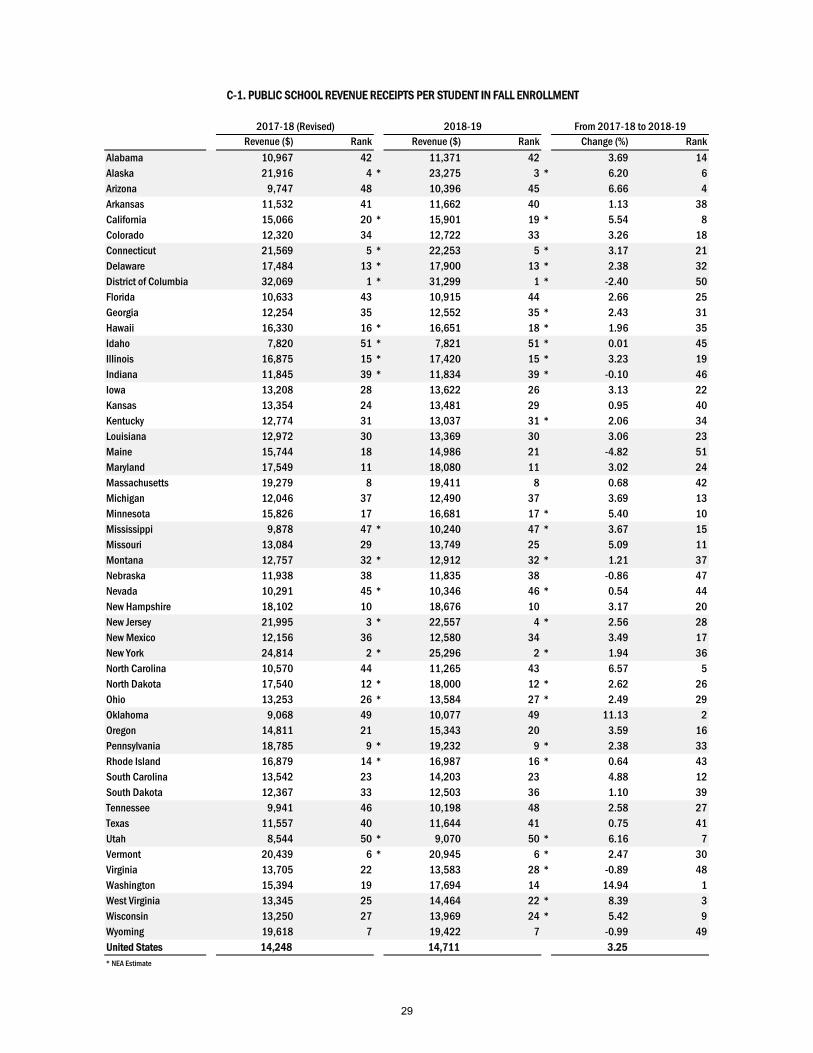
Revenue ($) Rank Revenue ($) Rank Change (%) Rank
Alabama 10,967 42 11,371 42 3.69 14Alaska 21,916 4 * 23,275 3 * 6.20 6Arizona 9,747 48 10,396 45 6.66 4Arkansas 11,532 41 11,662 40 1.13 38California 15,066 20 * 15,901 19 * 5.54 8Colorado 12,320 34 12,722 33 3.26 18Connecticut 21,569 5 * 22,253 5 * 3.17 21Delaware 17,484 13 * 17,900 13 * 2.38 32District of Columbia 32,069 1 * 31,299 1 * -2.40 50Florida 10,633 43 10,915 44 2.66 25Georgia 12,254 35 12,552 35 * 2.43 31Hawaii 16,330 16 * 16,651 18 * 1.96 35Idaho 7,820 51 * 7,821 51 * 0.01 45Illinois 16,875 15 * 17,420 15 * 3.23 19Indiana 11,845 39 * 11,834 39 * -0.10 46Iowa 13,208 28 13,622 26 3.13 22Kansas 13,354 24 13,481 29 0.95 40Kentucky 12,774 31 13,037 31 * 2.06 34Louisiana 12,972 30 13,369 30 3.06 23Maine 15,744 18 14,986 21 -4.82 51Maryland 17,549 11 18,080 11 3.02 24Massachusetts 19,279 8 19,411 8 0.68 42Michigan 12,046 37 12,490 37 3.69 13Minnesota 15,826 17 16,681 17 * 5.40 10Mississippi 9,878 47 * 10,240 47 * 3.67 15Missouri 13,084 29 13,749 25 5.09 11Montana 12,757 32 * 12,912 32 * 1.21 37Nebraska 11,938 38 11,835 38 -0.86 47Nevada 10,291 45 * 10,346 46 * 0.54 44New Hampshire 18,102 10 18,676 10 3.17 20New Jersey 21,995 3 * 22,557 4 * 2.56 28New Mexico 12,156 36 12,580 34 3.49 17New York 24,814 2 * 25,296 2 * 1.94 36North Carolina 10,570 44 11,265 43 6.57 5North Dakota 17,540 12 * 18,000 12 * 2.62 26Ohio 13,253 26 * 13,584 27 * 2.49 29Oklahoma 9,068 49 10,077 49 11.13 2Oregon 14,811 21 15,343 20 3.59 16Pennsylvania 18,785 9 * 19,232 9 * 2.38 33Rhode Island 16,879 14 * 16,987 16 * 0.64 43South Carolina 13,542 23 14,203 23 4.88 12South Dakota 12,367 33 12,503 36 1.10 39Tennessee 9,941 46 10,198 48 2.58 27Texas 11,557 40 11,644 41 0.75 41Utah 8,544 50 * 9,070 50 * 6.16 7Vermont 20,439 6 * 20,945 6 * 2.47 30Virginia 13,705 22 13,583 28 * -0.89 48Washington 15,394 19 17,694 14 14.94 1West Virginia 13,345 25 14,464 22 * 8.39 3Wisconsin 13,250 27 13,969 24 * 5.42 9Wyoming 19,618 7 19,422 7 -0.99 49United States 14,248 14,711 3.25* NEA Estimate
2017-18 (Revised) 2018-19
C-1. PUBLIC SCHOOL REVENUE RECEIPTS PER STUDENT IN FALL ENROLLMENT
From 2017-18 to 2018-19
29
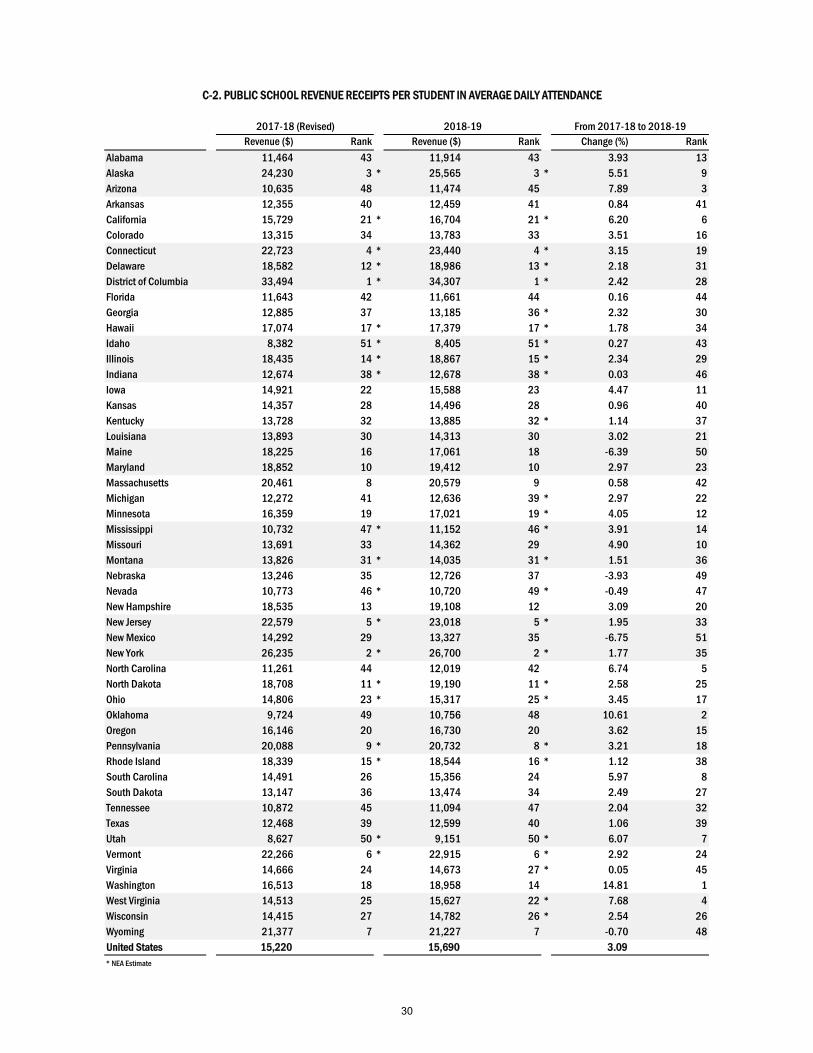
Revenue ($) Rank Revenue ($) Rank Change (%) Rank
Alabama 11,464 43 11,914 43 3.93 13Alaska 24,230 3 * 25,565 3 * 5.51 9Arizona 10,635 48 11,474 45 7.89 3Arkansas 12,355 40 12,459 41 0.84 41California 15,729 21 * 16,704 21 * 6.20 6Colorado 13,315 34 13,783 33 3.51 16Connecticut 22,723 4 * 23,440 4 * 3.15 19Delaware 18,582 12 * 18,986 13 * 2.18 31District of Columbia 33,494 1 * 34,307 1 * 2.42 28Florida 11,643 42 11,661 44 0.16 44Georgia 12,885 37 13,185 36 * 2.32 30Hawaii 17,074 17 * 17,379 17 * 1.78 34Idaho 8,382 51 * 8,405 51 * 0.27 43Illinois 18,435 14 * 18,867 15 * 2.34 29Indiana 12,674 38 * 12,678 38 * 0.03 46Iowa 14,921 22 15,588 23 4.47 11Kansas 14,357 28 14,496 28 0.96 40Kentucky 13,728 32 13,885 32 * 1.14 37Louisiana 13,893 30 14,313 30 3.02 21Maine 18,225 16 17,061 18 -6.39 50Maryland 18,852 10 19,412 10 2.97 23Massachusetts 20,461 8 20,579 9 0.58 42Michigan 12,272 41 12,636 39 * 2.97 22Minnesota 16,359 19 17,021 19 * 4.05 12Mississippi 10,732 47 * 11,152 46 * 3.91 14Missouri 13,691 33 14,362 29 4.90 10Montana 13,826 31 * 14,035 31 * 1.51 36Nebraska 13,246 35 12,726 37 -3.93 49Nevada 10,773 46 * 10,720 49 * -0.49 47New Hampshire 18,535 13 19,108 12 3.09 20New Jersey 22,579 5 * 23,018 5 * 1.95 33New Mexico 14,292 29 13,327 35 -6.75 51New York 26,235 2 * 26,700 2 * 1.77 35North Carolina 11,261 44 12,019 42 6.74 5North Dakota 18,708 11 * 19,190 11 * 2.58 25Ohio 14,806 23 * 15,317 25 * 3.45 17Oklahoma 9,724 49 10,756 48 10.61 2Oregon 16,146 20 16,730 20 3.62 15Pennsylvania 20,088 9 * 20,732 8 * 3.21 18Rhode Island 18,339 15 * 18,544 16 * 1.12 38South Carolina 14,491 26 15,356 24 5.97 8South Dakota 13,147 36 13,474 34 2.49 27Tennessee 10,872 45 11,094 47 2.04 32Texas 12,468 39 12,599 40 1.06 39Utah 8,627 50 * 9,151 50 * 6.07 7Vermont 22,266 6 * 22,915 6 * 2.92 24Virginia 14,666 24 14,673 27 * 0.05 45Washington 16,513 18 18,958 14 14.81 1West Virginia 14,513 25 15,627 22 * 7.68 4Wisconsin 14,415 27 14,782 26 * 2.54 26Wyoming 21,377 7 21,227 7 -0.70 48United States 15,220 15,690 3.09* NEA Estimate
C-2. PUBLIC SCHOOL REVENUE RECEIPTS PER STUDENT IN AVERAGE DAILY ATTENDANCE
2017-18 (Revised) 2018-19 From 2017-18 to 2018-19
30
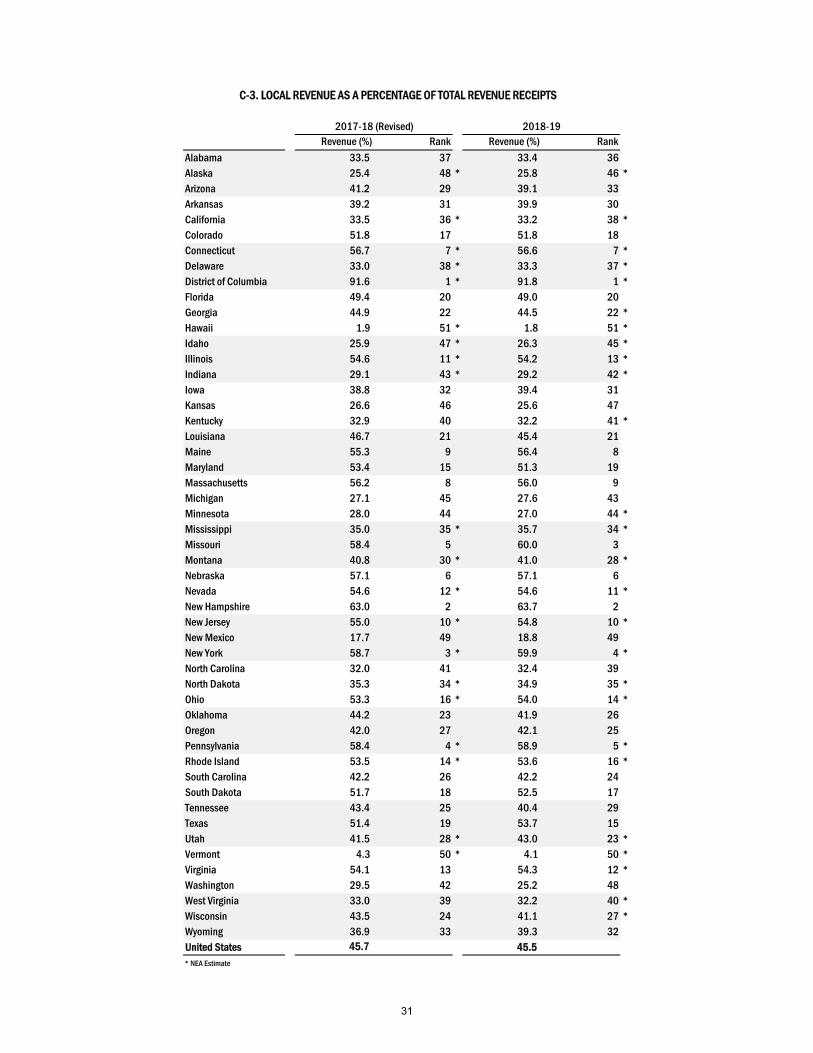
Revenue (%) Rank Revenue (%) Rank
Alabama 33.5 37 33.4 36Alaska 25.4 48 * 25.8 46 *Arizona 41.2 29 39.1 33Arkansas 39.2 31 39.9 30California 33.5 36 * 33.2 38 *Colorado 51.8 17 51.8 18Connecticut 56.7 7 * 56.6 7 *Delaware 33.0 38 * 33.3 37 *District of Columbia 91.6 1 * 91.8 1 *Florida 49.4 20 49.0 20Georgia 44.9 22 44.5 22 *Hawaii 1.9 51 * 1.8 51 *Idaho 25.9 47 * 26.3 45 *Illinois 54.6 11 * 54.2 13 *Indiana 29.1 43 * 29.2 42 *Iowa 38.8 32 39.4 31Kansas 26.6 46 25.6 47Kentucky 32.9 40 32.2 41 *Louisiana 46.7 21 45.4 21Maine 55.3 9 56.4 8Maryland 53.4 15 51.3 19Massachusetts 56.2 8 56.0 9Michigan 27.1 45 27.6 43Minnesota 28.0 44 27.0 44 *Mississippi 35.0 35 * 35.7 34 *Missouri 58.4 5 60.0 3Montana 40.8 30 * 41.0 28 *Nebraska 57.1 6 57.1 6Nevada 54.6 12 * 54.6 11 *New Hampshire 63.0 2 63.7 2New Jersey 55.0 10 * 54.8 10 *New Mexico 17.7 49 18.8 49New York 58.7 3 * 59.9 4 *North Carolina 32.0 41 32.4 39North Dakota 35.3 34 * 34.9 35 *Ohio 53.3 16 * 54.0 14 *Oklahoma 44.2 23 41.9 26Oregon 42.0 27 42.1 25Pennsylvania 58.4 4 * 58.9 5 *Rhode Island 53.5 14 * 53.6 16 *South Carolina 42.2 26 42.2 24South Dakota 51.7 18 52.5 17Tennessee 43.4 25 40.4 29Texas 51.4 19 53.7 15Utah 41.5 28 * 43.0 23 *Vermont 4.3 50 * 4.1 50 *Virginia 54.1 13 54.3 12 *Washington 29.5 42 25.2 48West Virginia 33.0 39 32.2 40 *Wisconsin 43.5 24 41.1 27 *Wyoming 36.9 33 39.3 32United States 45.7 45.5 * NEA Estimate
C-3. LOCAL REVENUE AS A PERCENTAGE OF TOTAL REVENUE RECEIPTS
2017-18 (Revised) 2018-19
31
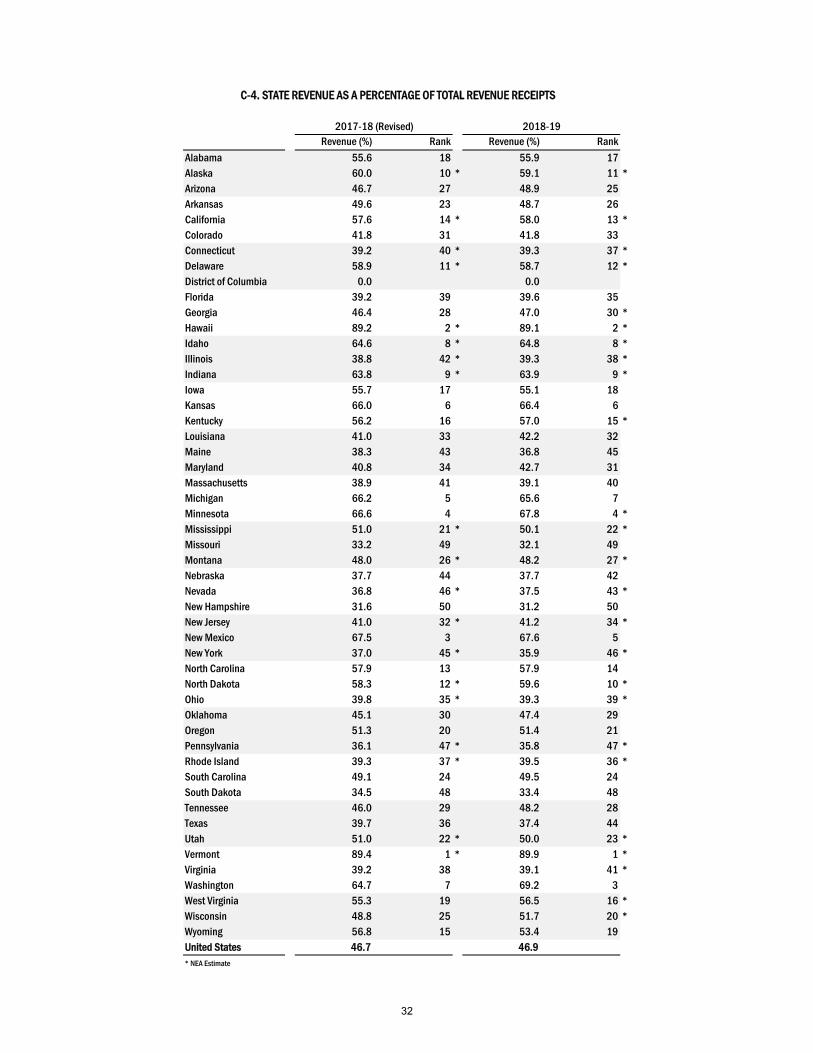
Revenue (%) Rank Revenue (%) Rank
Alabama 55.6 18 55.9 17Alaska 60.0 10 * 59.1 11 *Arizona 46.7 27 48.9 25Arkansas 49.6 23 48.7 26California 57.6 14 * 58.0 13 *Colorado 41.8 31 41.8 33Connecticut 39.2 40 * 39.3 37 *Delaware 58.9 11 * 58.7 12 *District of Columbia 0.0 0.0Florida 39.2 39 39.6 35Georgia 46.4 28 47.0 30 *Hawaii 89.2 2 * 89.1 2 *Idaho 64.6 8 * 64.8 8 *Illinois 38.8 42 * 39.3 38 *Indiana 63.8 9 * 63.9 9 *Iowa 55.7 17 55.1 18Kansas 66.0 6 66.4 6Kentucky 56.2 16 57.0 15 *Louisiana 41.0 33 42.2 32Maine 38.3 43 36.8 45Maryland 40.8 34 42.7 31Massachusetts 38.9 41 39.1 40Michigan 66.2 5 65.6 7Minnesota 66.6 4 67.8 4 *Mississippi 51.0 21 * 50.1 22 *Missouri 33.2 49 32.1 49Montana 48.0 26 * 48.2 27 *Nebraska 37.7 44 37.7 42Nevada 36.8 46 * 37.5 43 *New Hampshire 31.6 50 31.2 50New Jersey 41.0 32 * 41.2 34 *New Mexico 67.5 3 67.6 5New York 37.0 45 * 35.9 46 *North Carolina 57.9 13 57.9 14North Dakota 58.3 12 * 59.6 10 *Ohio 39.8 35 * 39.3 39 *Oklahoma 45.1 30 47.4 29Oregon 51.3 20 51.4 21Pennsylvania 36.1 47 * 35.8 47 *Rhode Island 39.3 37 * 39.5 36 *South Carolina 49.1 24 49.5 24South Dakota 34.5 48 33.4 48Tennessee 46.0 29 48.2 28Texas 39.7 36 37.4 44Utah 51.0 22 * 50.0 23 *Vermont 89.4 1 * 89.9 1 *Virginia 39.2 38 39.1 41 *Washington 64.7 7 69.2 3West Virginia 55.3 19 56.5 16 *Wisconsin 48.8 25 51.7 20 *Wyoming 56.8 15 53.4 19United States 46.7 46.9* NEA Estimate
C-4. STATE REVENUE AS A PERCENTAGE OF TOTAL REVENUE RECEIPTS
2017-18 (Revised) 2018-19
32
Revenue (%) Rank Revenue (%) Rank
Alabama 10.9 11 10.7 13Alaska 14.7 2 * 15.1 1 *Arizona 12.2 6 12.0 6Arkansas 11.2 10 11.4 7California 8.9 19 * 8.8 19 *Colorado 6.4 39 6.4 38Connecticut 4.1 50 * 4.1 50 *Delaware 8.1 25 * 7.9 25 *District of Columbia 8.4 24 * 8.2 22 *Florida 11.4 8 11.4 9Georgia 8.7 20 8.5 20 *Hawaii 9.0 17 * 9.1 16 *Idaho 9.5 16 * 8.9 17 *Illinois 6.6 35 * 6.4 37 *Indiana 7.1 30 * 6.9 31 *Iowa 5.5 43 5.5 42Kansas 7.4 28 8.0 23Kentucky 10.9 12 10.8 12 *Louisiana 12.3 5 12.3 5Maine 6.4 37 6.8 33Maryland 5.8 42 6.0 39Massachusetts 4.9 48 4.9 48Michigan 6.7 32 6.7 34Minnesota 5.5 44 5.3 44 *Mississippi 14.0 3 * 14.2 2 *Missouri 8.4 23 7.9 26Montana 11.2 9 * 10.8 11 *Nebraska 5.2 47 5.2 46Nevada 8.6 22 * 7.9 24 *New Hampshire 5.3 46 5.1 47New Jersey 4.0 51 * 4.0 51 *New Mexico 14.8 1 13.6 4New York 4.4 49 * 4.1 49 *North Carolina 10.1 15 9.7 15North Dakota 6.5 36 * 5.4 43 *Ohio 7.0 31 * 6.8 32 *Oklahoma 10.7 13 10.6 14Oregon 6.7 33 6.4 36Pennsylvania 5.5 45 * 5.2 45 *Rhode Island 7.2 29 * 7.0 30 *South Carolina 8.7 21 8.3 21South Dakota 13.8 4 14.0 3Tennessee 10.7 14 11.4 8Texas 8.9 18 8.9 18Utah 7.6 27 * 7.0 29 *Vermont 6.3 40 * 5.9 40 *Virginia 6.6 34 6.6 35 *Washington 5.8 41 5.7 41West Virginia 11.7 7 11.3 10 *Wisconsin 7.7 26 7.3 28 *Wyoming 6.4 38 7.3 27United States 7.6 7.5* NEA Estimate
C-5. FEDERAL REVENUE AS A PERCENTAGE OF TOTAL REVENUE RECEIPTS
2017-18 (Revised) 2018-19
33

Revenue (%) Rank Revenue (%) Rank
Alabama 37.6 36 37.4 35Alaska 29.7 44 * 30.4 43 *Arizona 46.9 26 44.4 30Arkansas 44.1 31 45.1 28California 36.8 39 * 36.4 37 *Colorado 55.3 20 55.3 18Connecticut 59.1 10 * 59.0 11 *Delaware 35.9 40 * 36.2 39 *District of Columbia 100.0 1 100.0 1Florida 55.7 19 55.3 19Georgia 49.2 23 48.6 22 *Hawaii 2.1 51 * 2.0 51 *Idaho 28.7 48 * 28.8 45 *Illinois 58.5 12 * 58.0 14 *Indiana 31.3 42 * 31.4 42 *Iowa 41.1 32 41.7 33Kansas 28.7 47 27.9 47Kentucky 36.9 38 36.1 40 *Louisiana 53.2 21 51.8 21Maine 59.1 11 60.5 7Maryland 56.7 17 54.6 20Massachusetts 59.1 9 58.9 12Michigan 29.0 46 29.6 44Minnesota 29.6 45 28.5 46 *Mississippi 40.7 33 * 41.6 34 *Missouri 63.7 3 65.2 3Montana 46.0 28 * 45.9 26 *Nebraska 60.2 6 60.2 8Nevada 59.7 8 * 59.3 9 *New Hampshire 66.6 2 67.2 2New Jersey 57.3 15 * 57.1 17 *New Mexico 20.7 49 21.8 49New York 61.3 5 * 62.5 4 *North Carolina 35.5 41 35.9 41North Dakota 37.7 35 * 36.9 36 *Ohio 57.2 16 * 57.9 15 *Oklahoma 49.5 22 46.9 23Oregon 45.0 29 45.0 29Pennsylvania 61.8 4 * 62.2 5 *Rhode Island 57.6 14 * 57.6 16 *South Carolina 46.2 27 46.0 25South Dakota 60.0 7 61.1 6Tennessee 48.5 24 45.6 27Texas 56.4 18 59.0 10Utah 44.9 30 * 46.2 24 *Vermont 4.6 50 * 4.4 50 *Virginia 58.0 13 58.1 13 *Washington 31.3 43 26.7 48West Virginia 37.3 37 36.3 38 *Wisconsin 47.1 25 44.3 31 *Wyoming 39.4 34 42.4 32United States 49.5 49.3* NEA Estimate
C-6. LOCAL REVENUE AS A PERCENTAGE OF COMBINED STATE AND LOCAL REVENUE
2017-18 (Revised) 2018-19
34
SERIES D - SCHOOL EXPENDITURES
D-1. PUBLIC SCHOOL CURRENT EXPENDITURES PER STUDENT IN FALL ENROLLMENT
D-2. PUBLIC SCHOOL CURRENT EXPENDITURES PER STUDENT IN AVERAGE DAILY ATTENDANCE
35
Expenditure ($) Rank Expenditure ($) Rank Change (%) Rank
Alabama 9,780 42 9,978 42 2.03 35Alaska 19,766 4 * 20,306 4 * 2.73 25Arizona 8,153 49 8,722 49 6.98 4Arkansas 10,042 40 10,278 39 2.35 28California 12,431 21 * 12,879 20 * 3.60 12Colorado 11,234 31 11,600 30 3.26 18Connecticut 19,458 5 * 20,126 5 * 3.44 13Delaware 14,174 16 * 14,469 17 * 2.08 33District of Columbia 21,282 2 * 20,425 3 * -4.03 51Florida 9,579 44 9,901 43 3.36 14Georgia 10,959 34 10,965 35 * 0.05 48Hawaii 14,799 15 * 15,061 15 * 1.77 40Idaho 6,739 51 * 6,747 51 * 0.12 47Illinois 16,041 12 * 16,659 11 * 3.85 8Indiana 9,847 41 * 10,030 41 * 1.86 38Iowa 11,224 32 11,510 32 2.54 26Kansas 11,266 30 11,515 31 2.21 31Kentucky 11,628 27 12,064 27 * 3.75 10Louisiana 11,391 29 11,727 28 2.95 21Maine 13,168 18 13,570 18 3.06 20Maryland 14,981 13 15,049 16 0.45 45Massachusetts 18,568 6 19,315 6 4.02 7Michigan 10,288 37 10,626 37 3.29 17Minnesota 13,251 17 13,534 19 * 2.14 32Mississippi 9,003 47 * 9,258 47 * 2.84 23Missouri 11,222 33 11,434 33 1.88 37Montana 11,565 28 * 11,664 29 * 0.86 43Nebraska 11,802 26 12,075 26 2.32 29Nevada 9,548 45 9,847 44 3.13 19New Hampshire 16,840 8 17,399 7 3.32 16New Jersey 20,638 3 * 21,326 2 * 3.33 15New Mexico 10,636 35 11,315 34 6.38 5New York 23,872 1 24,749 1 3.67 11North Carolina 9,645 43 10,165 40 5.39 6North Dakota 14,815 14 * 15,239 13 * 2.86 22Ohio 12,099 24 * 12,375 24 * 2.28 30Oklahoma 8,177 48 9,214 48 12.68 2Oregon 12,311 22 12,780 22 3.81 9Pennsylvania 16,838 9 * 17,260 9 * 2.50 27Rhode Island 16,498 11 * 16,801 10 * 1.83 39South Carolina 10,096 39 10,300 38 2.02 36South Dakota 10,567 36 10,721 36 * 1.45 41Tennessee 9,225 46 9,417 46 2.08 34Texas 10,116 38 9,782 45 -3.30 50Utah 7,050 50 * 7,247 50 * 2.79 24Vermont 17,075 7 * 17,262 8 * 1.09 42Virginia 12,197 23 12,118 25 * -0.65 49Washington 13,077 19 15,159 14 15.93 1West Virginia 11,964 25 12,878 21 * 7.64 3Wisconsin 12,675 20 12,697 23 * 0.17 46Wyoming 16,529 10 16,607 12 0.47 44United States 12,640 12,978 2.67* NEA Estimate
D-1. PUBLIC SCHOOL CURRENT EXPENDITURES PER STUDENT IN FALL ENROLLMENT
2017-18 (Revised) 2018-19 From 2017-18 to 2018-19
36
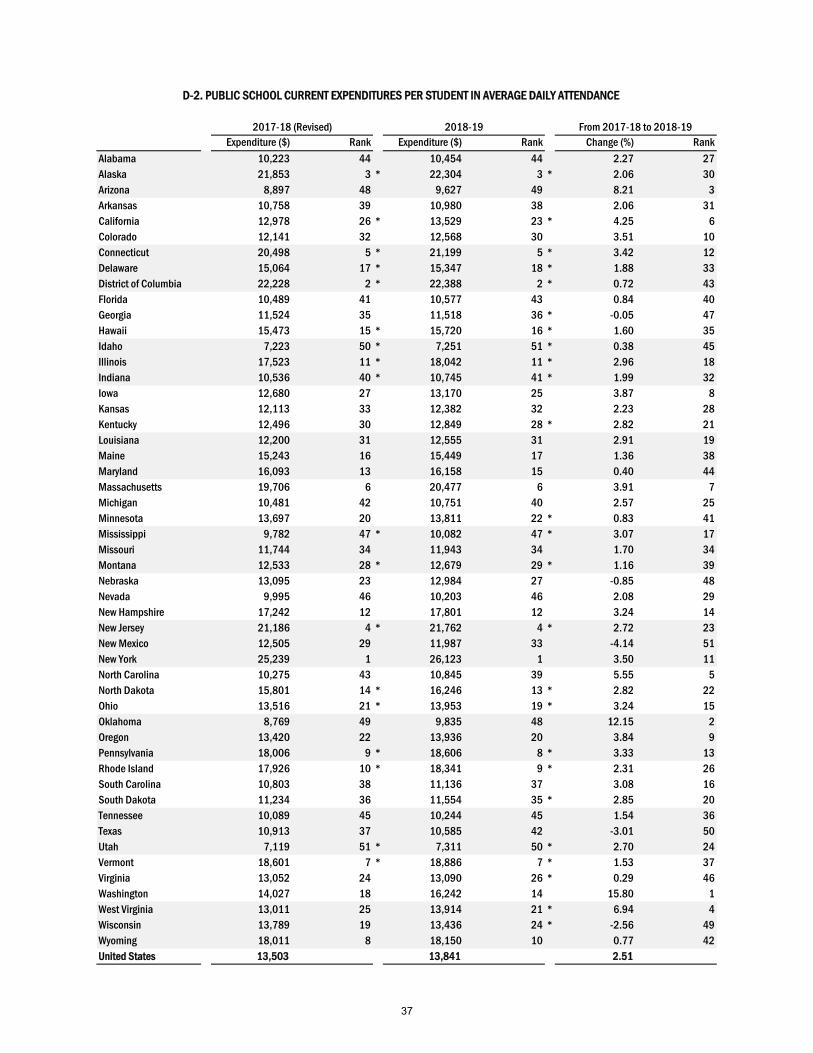
Expenditure ($) Rank Expenditure ($) Rank Change (%) Rank
Alabama 10,223 44 10,454 44 2.27 27Alaska 21,853 3 * 22,304 3 * 2.06 30Arizona 8,897 48 9,627 49 8.21 3Arkansas 10,758 39 10,980 38 2.06 31California 12,978 26 * 13,529 23 * 4.25 6Colorado 12,141 32 12,568 30 3.51 10Connecticut 20,498 5 * 21,199 5 * 3.42 12Delaware 15,064 17 * 15,347 18 * 1.88 33District of Columbia 22,228 2 * 22,388 2 * 0.72 43Florida 10,489 41 10,577 43 0.84 40Georgia 11,524 35 11,518 36 * -0.05 47Hawaii 15,473 15 * 15,720 16 * 1.60 35Idaho 7,223 50 * 7,251 51 * 0.38 45Illinois 17,523 11 * 18,042 11 * 2.96 18Indiana 10,536 40 * 10,745 41 * 1.99 32Iowa 12,680 27 13,170 25 3.87 8Kansas 12,113 33 12,382 32 2.23 28Kentucky 12,496 30 12,849 28 * 2.82 21Louisiana 12,200 31 12,555 31 2.91 19Maine 15,243 16 15,449 17 1.36 38Maryland 16,093 13 16,158 15 0.40 44Massachusetts 19,706 6 20,477 6 3.91 7Michigan 10,481 42 10,751 40 2.57 25Minnesota 13,697 20 13,811 22 * 0.83 41Mississippi 9,782 47 * 10,082 47 * 3.07 17Missouri 11,744 34 11,943 34 1.70 34Montana 12,533 28 * 12,679 29 * 1.16 39Nebraska 13,095 23 12,984 27 -0.85 48Nevada 9,995 46 10,203 46 2.08 29New Hampshire 17,242 12 17,801 12 3.24 14New Jersey 21,186 4 * 21,762 4 * 2.72 23New Mexico 12,505 29 11,987 33 -4.14 51New York 25,239 1 26,123 1 3.50 11North Carolina 10,275 43 10,845 39 5.55 5North Dakota 15,801 14 * 16,246 13 * 2.82 22Ohio 13,516 21 * 13,953 19 * 3.24 15Oklahoma 8,769 49 9,835 48 12.15 2Oregon 13,420 22 13,936 20 3.84 9Pennsylvania 18,006 9 * 18,606 8 * 3.33 13Rhode Island 17,926 10 * 18,341 9 * 2.31 26South Carolina 10,803 38 11,136 37 3.08 16South Dakota 11,234 36 11,554 35 * 2.85 20Tennessee 10,089 45 10,244 45 1.54 36Texas 10,913 37 10,585 42 -3.01 50Utah 7,119 51 * 7,311 50 * 2.70 24Vermont 18,601 7 * 18,886 7 * 1.53 37Virginia 13,052 24 13,090 26 * 0.29 46Washington 14,027 18 16,242 14 15.80 1West Virginia 13,011 25 13,914 21 * 6.94 4Wisconsin 13,789 19 13,436 24 * -2.56 49Wyoming 18,011 8 18,150 10 0.77 42United States 13,503 13,841 2.51
D-2. PUBLIC SCHOOL CURRENT EXPENDITURES PER STUDENT IN AVERAGE DAILY ATTENDANCE
2017-18 (Revised) 2018-19 From 2017-18 to 2018-19
37

This page intentionally left blank
38
Estimates 2020
39

SERIES E - STUDENTS AND FACULTY
E-1. OPERATING PUBLIC SCHOOL DISTRICTS
E-2. PUBLIC SCHOOL TOTAL FALL ENROLLMENT
E-3. PUBLIC SCHOOL AVERAGE DAILY ATTENDANCE
E-4. NUMBER OF PUBLIC HIGH SCHOOL GRADUATES
E-5. NUMBER OF TEACHERS IN PUBLIC K-12 SCHOOLS
E-6. TOTAL INSTRUCTIONAL STAFF IN PUBLIC K-12 SCHOOLS
E-7. AVERAGE SALARIES OF PUBLIC SCHOOL TEACHERS
E-8. AVERAGE SALARIES OF INSTRUCTIONAL STAFF IN PUBLIC SCHOOLS
40
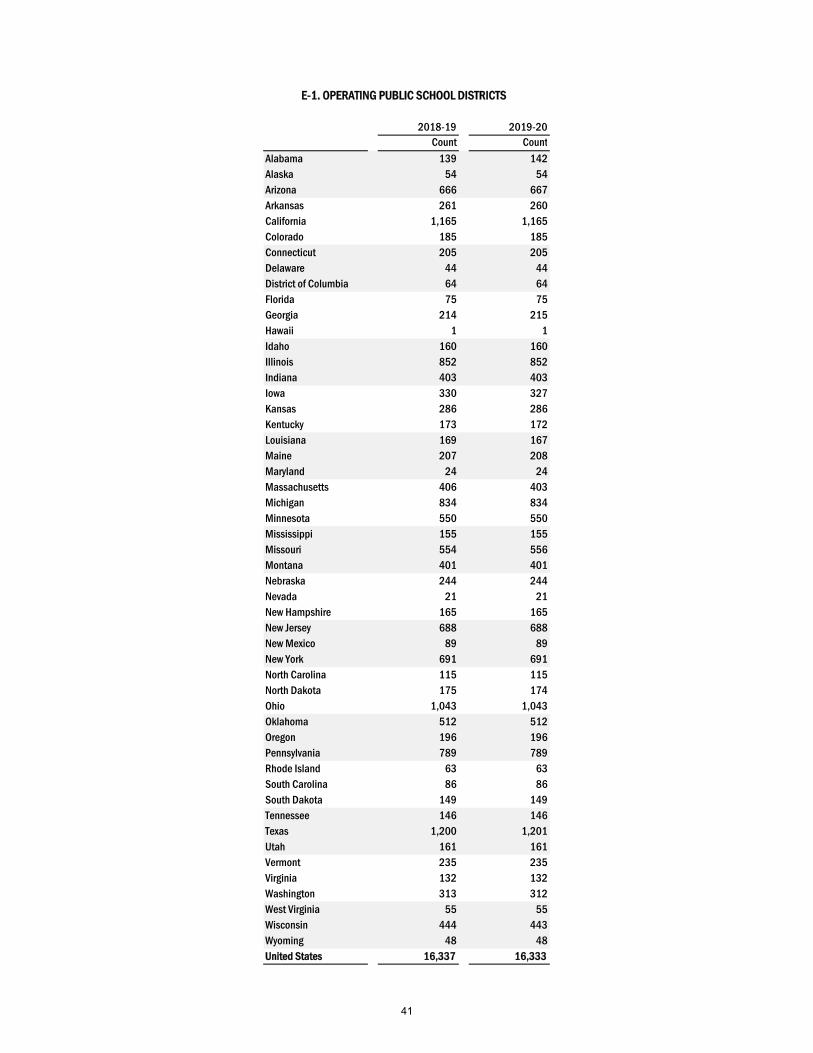
2018-19 2019-20Count Count
Alabama 139 142Alaska 54 54Arizona 666 667Arkansas 261 260California 1,165 1,165Colorado 185 185Connecticut 205 205Delaware 44 44District of Columbia 64 64Florida 75 75Georgia 214 215Hawaii 1 1Idaho 160 160Illinois 852 852Indiana 403 403Iowa 330 327Kansas 286 286Kentucky 173 172Louisiana 169 167Maine 207 208Maryland 24 24Massachusetts 406 403Michigan 834 834Minnesota 550 550Mississippi 155 155Missouri 554 556Montana 401 401Nebraska 244 244Nevada 21 21New Hampshire 165 165New Jersey 688 688New Mexico 89 89New York 691 691North Carolina 115 115North Dakota 175 174Ohio 1,043 1,043Oklahoma 512 512Oregon 196 196Pennsylvania 789 789Rhode Island 63 63South Carolina 86 86South Dakota 149 149Tennessee 146 146Texas 1,200 1,201Utah 161 161Vermont 235 235Virginia 132 132Washington 313 312West Virginia 55 55Wisconsin 444 443Wyoming 48 48United States 16,337 16,333
E-1. OPERATING PUBLIC SCHOOL DISTRICTS
41
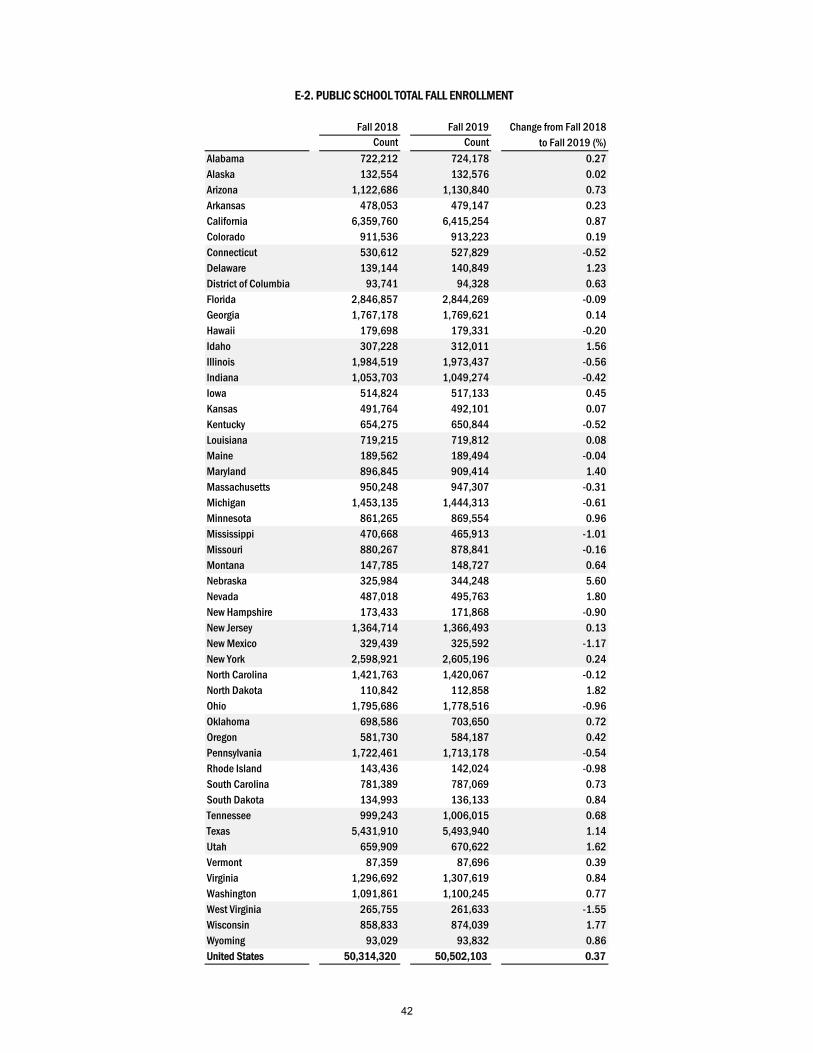
Fall 2018 Fall 2019 Change from Fall 2018Count Count to Fall 2019 (%)
Alabama 722,212 724,178 0.27Alaska 132,554 132,576 0.02Arizona 1,122,686 1,130,840 0.73Arkansas 478,053 479,147 0.23California 6,359,760 6,415,254 0.87Colorado 911,536 913,223 0.19Connecticut 530,612 527,829 -0.52Delaware 139,144 140,849 1.23District of Columbia 93,741 94,328 0.63Florida 2,846,857 2,844,269 -0.09Georgia 1,767,178 1,769,621 0.14Hawaii 179,698 179,331 -0.20Idaho 307,228 312,011 1.56Illinois 1,984,519 1,973,437 -0.56Indiana 1,053,703 1,049,274 -0.42Iowa 514,824 517,133 0.45Kansas 491,764 492,101 0.07Kentucky 654,275 650,844 -0.52Louisiana 719,215 719,812 0.08Maine 189,562 189,494 -0.04Maryland 896,845 909,414 1.40Massachusetts 950,248 947,307 -0.31Michigan 1,453,135 1,444,313 -0.61Minnesota 861,265 869,554 0.96Mississippi 470,668 465,913 -1.01Missouri 880,267 878,841 -0.16Montana 147,785 148,727 0.64Nebraska 325,984 344,248 5.60Nevada 487,018 495,763 1.80New Hampshire 173,433 171,868 -0.90New Jersey 1,364,714 1,366,493 0.13New Mexico 329,439 325,592 -1.17New York 2,598,921 2,605,196 0.24North Carolina 1,421,763 1,420,067 -0.12North Dakota 110,842 112,858 1.82Ohio 1,795,686 1,778,516 -0.96Oklahoma 698,586 703,650 0.72Oregon 581,730 584,187 0.42Pennsylvania 1,722,461 1,713,178 -0.54Rhode Island 143,436 142,024 -0.98South Carolina 781,389 787,069 0.73South Dakota 134,993 136,133 0.84Tennessee 999,243 1,006,015 0.68Texas 5,431,910 5,493,940 1.14Utah 659,909 670,622 1.62Vermont 87,359 87,696 0.39Virginia 1,296,692 1,307,619 0.84Washington 1,091,861 1,100,245 0.77West Virginia 265,755 261,633 -1.55Wisconsin 858,833 874,039 1.77Wyoming 93,029 93,832 0.86United States 50,314,320 50,502,103 0.37
E-2. PUBLIC SCHOOL TOTAL FALL ENROLLMENT
42
2018-19 2019-20 Change from 2018-19Count Count to 2019-20 (%)
Alabama 689,301 692,783 0.51Alaska 120,677 120,707 0.02Arizona 1,017,197 1,031,135 1.37Arkansas 447,472 448,748 0.29California 6,053,896 6,068,359 0.24Colorado 841,339 843,938 0.31Connecticut 503,750 500,285 -0.69Delaware 131,184 132,154 0.74District of Columbia 85,523 86,139 0.72Florida 2,664,730 2,663,623 -0.04Georgia 1,682,353 1,687,656 0.32Hawaii 172,169 172,898 0.42Idaho 285,890 289,450 1.25Illinois 1,832,360 1,832,479 0.01Indiana 983,533 982,324 -0.12Iowa 449,916 447,041 -0.64Kansas 457,341 457,654 0.07Kentucky 614,300 613,670 -0.10Louisiana 671,782 675,931 0.62Maine 166,499 166,775 0.17Maryland 835,283 843,608 1.00Massachusetts 896,312 894,975 -0.15Michigan 1,436,330 1,437,114 0.05Minnesota 844,023 852,267 0.98Mississippi 432,198 445,151 3.00Missouri 842,697 838,942 -0.45Montana 135,958 136,364 0.30Nebraska 303,159 305,000 0.61Nevada 470,043 478,215 1.74New Hampshire 169,515 168,082 -0.85New Jersey 1,337,382 1,339,986 0.19New Mexico 310,987 308,912 -0.67New York 2,462,203 2,477,080 0.60North Carolina 1,332,587 1,324,034 -0.64North Dakota 103,969 105,002 0.99Ohio 1,592,521 1,652,522 3.77Oklahoma 654,490 669,451 2.29Oregon 533,501 534,568 0.20Pennsylvania 1,597,833 1,587,889 -0.62Rhode Island 131,393 127,572 -2.91South Carolina 722,713 729,218 0.90South Dakota 125,261 125,251 -0.01Tennessee 918,531 919,298 0.08Texas 5,019,837 5,093,431 1.47Utah 654,112 661,981 1.20Vermont 79,846 78,899 -1.19Virginia 1,200,342 1,200,026 -0.03Washington 1,019,039 1,028,041 0.88West Virginia 245,971 242,089 -1.58Wisconsin 811,602 814,671 0.38Wyoming 85,120 85,567 0.53United States 47,175,970 47,418,955 0.52
E-3. PUBLIC SCHOOL AVERAGE DAILY ATTENDANCE
43
2018-19 2019-20 Change from 2018-19Count Count to 2019-20 (%)
Alabama 49,705 51,002 2.61Alaska 8,040 8,032 -0.10Arizona 71,498 72,499 1.40Arkansas 32,361 32,762 1.24California 423,457 419,598 -0.91Colorado 58,049 58,203 0.27Connecticut 37,335 37,297 -0.10Delaware 8,949 9,074 1.40District of Columbia 3,818 3,777 -1.07Florida 188,657 193,114 2.36Georgia 115,585 115,925 0.29Hawaii 12,559 12,651 0.73Idaho 18,470 18,612 0.77Illinois 136,434 135,664 -0.56Indiana 71,960 71,696 -0.37Iowa 33,647 33,839 0.57Kansas 33,074 33,135 0.18Kentucky 48,185 49,151 2.00Louisiana 43,137 42,946 -0.44Maine 11,680 11,700 0.17Maryland 58,080 57,467 -1.06Massachusetts 68,233 68,818 0.86Michigan 98,470 98,542 0.07Minnesota 53,958 53,782 -0.33Mississippi 27,390 26,680 -2.59Missouri 63,972 63,849 -0.19Montana 9,273 9,298 0.27Nebraska 21,449 21,611 0.76Nevada 30,988 32,075 3.51New Hampshire 12,842 12,746 -0.75New Jersey 96,927 97,894 1.00New Mexico 20,699 20,594 -0.51New York 184,953 180,734 -2.28North Carolina 108,368 109,500 1.04North Dakota 6,844 6,547 -4.34Ohio 118,000 122,961 4.20Oklahoma 40,682 40,812 0.32Oregon 36,934 37,928 2.69Pennsylvania 118,252 115,824 -2.05Rhode Island 9,755 9,553 -2.07South Carolina 49,355 50,751 2.83South Dakota 8,078 8,069 -0.11Tennessee 65,043 65,242 0.31Texas 351,354 362,296 3.11Utah 42,606 44,438 4.30Vermont 6,134 6,098 -0.59Virginia 91,512 92,087 0.63Washington 69,193 71,159 2.84West Virginia 17,579 17,337 -1.38Wisconsin 60,066 59,882 -0.31Wyoming 5,700 5,617 -1.46United States 3,359,289 3,380,868 0.64
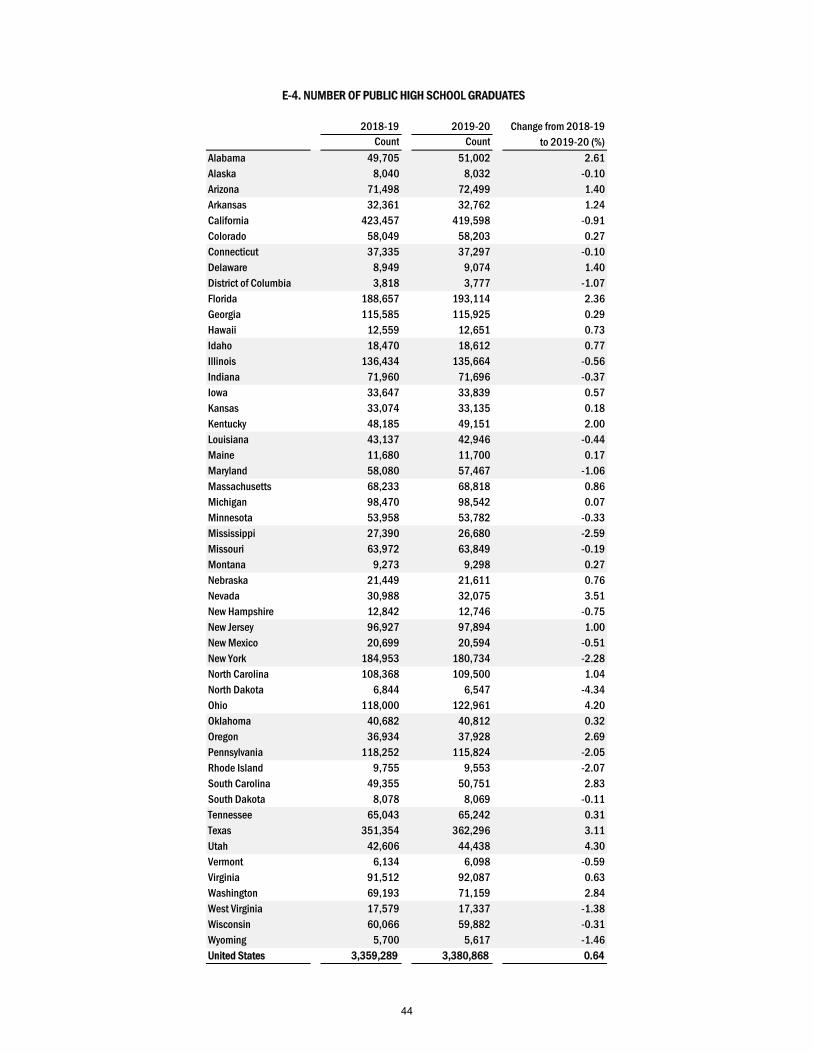
E-4. NUMBER OF PUBLIC HIGH SCHOOL GRADUATES
44
2018-19 2019-20 Change from 2018-19
Count Count to 2019-20 (%)
Alabama 46,684 46,451 -0.50
Alaska 7,889 7,814 -0.95
Arizona 63,491 64,545 1.66
Arkansas 32,051 32,382 1.03
California 288,715 293,619 1.70
Colorado 56,855 57,721 1.52
Connecticut 41,756 41,767 0.03
Delaware 9,600 9,625 0.26
District of Columbia 7,067 7,326 3.66
Florida 142,422 142,122 -0.21
Georgia 116,175 116,898 0.62
Hawaii 11,377 11,306 -0.62
Idaho 16,572 16,872 1.81
Illinois 129,178 129,184 0.00
Indiana 61,775 62,097 0.52
Iowa 37,514 37,825 0.83
Kansas 35,278 35,525 0.70
Kentucky 39,747 39,879 0.33
Louisiana 47,937 47,940 0.01
Maine 15,034 15,200 1.10
Maryland 61,247 62,040 1.29
Massachusetts 73,878 74,411 0.72
Michigan 81,944 81,724 -0.27
Minnesota 53,836 53,727 -0.20
Mississippi 31,657 31,658 0.00
Missouri 75,511 75,466 -0.06
Montana 10,596 10,689 0.88
Nebraska 25,040 25,324 1.13
Nevada 21,992 23,867 8.53
New Hampshire 16,579 16,536 -0.26
New Jersey 116,826 117,689 0.74
New Mexico 21,089 20,820 -1.28
New York 211,029 202,535 -4.03
North Carolina 93,411 93,923 0.55
North Dakota 8,692 10,277 18.24
Ohio 112,719 113,327 0.54
Oklahoma 42,461 43,183 1.70
Oregon 29,946 30,096 0.50
Pennsylvania 120,834 121,431 0.49
Rhode Island 10,808 10,868 0.56
South Carolina 51,266 51,672 0.79
South Dakota 9,709 9,896 1.93
Tennessee 61,710 62,018 0.50
Texas 358,533 363,185 1.30
Utah 29,944 31,253 4.37
Vermont 8,317 8,345 0.34
Virginia 104,457 104,787 0.32
Washington 62,598 62,562 -0.06
West Virginia 18,777 18,697 -0.43
Wisconsin 55,850 56,181 0.59
Wyoming 7,198 6,943 -3.54
United States 3,195,571 3,211,228 0.49
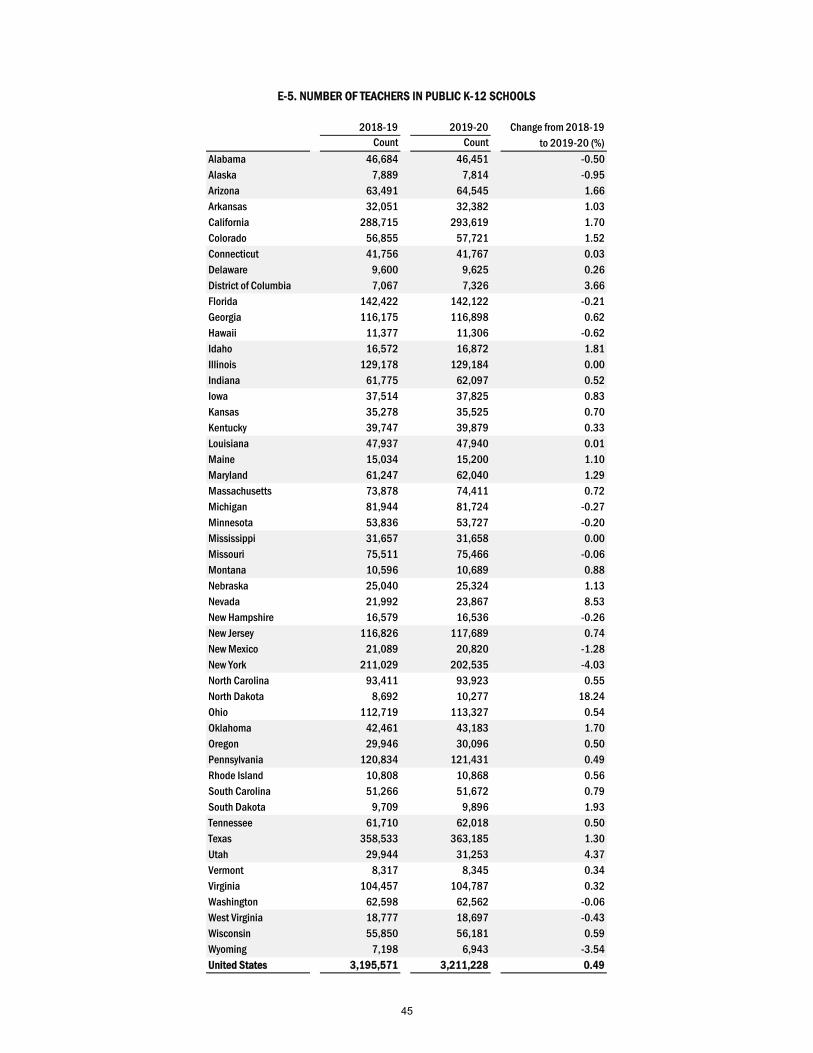
E-5. NUMBER OF TEACHERS IN PUBLIC K-12 SCHOOLS
45
2018-19 2019-20 Change from 2018-19Count Count to 2019-20 (%)
Alabama 53,851 53,633 -0.40Alaska 8,572 8,474 -1.14Arizona 68,778 70,093 1.91Arkansas 37,136 37,459 0.87California 354,322 374,003 5.55Colorado 69,563 71,065 2.16Connecticut 50,784 51,932 2.26Delaware 10,676 10,744 0.64District of Columbia 8,128 8,252 1.53Florida 195,161 194,153 -0.52Georgia 135,767 137,026 0.93Hawaii 13,212 13,105 -0.81Idaho 19,018 19,397 1.99Illinois 174,473 176,006 0.88Indiana 70,955 71,414 0.65Iowa 43,370 43,822 1.04Kansas 39,734 40,061 0.82Kentucky 45,961 46,180 0.48Louisiana 61,024 61,052 0.05Maine 17,642 17,825 1.04Maryland 75,497 76,550 1.39Massachusetts 85,729 86,640 1.06Michigan 96,637 96,718 0.08Minnesota 59,690 59,713 0.04Mississippi 36,114 36,179 0.18Missouri 85,084 85,073 -0.01Montana 12,236 12,281 0.37Nebraska 28,041 28,420 1.35Nevada 27,119 29,591 9.12New Hampshire 17,688 17,453 -1.33New Jersey 142,162 143,358 0.84New Mexico 23,475 23,321 -0.66New York 233,582 227,004 -2.82North Carolina 109,308 109,977 0.61North Dakota 10,146 11,811 16.41Ohio 143,258 145,053 1.25Oklahoma 48,735 49,500 1.57Oregon 34,054 34,273 0.64Pennsylvania 137,829 138,308 0.35Rhode Island 12,283 12,556 2.22South Carolina 61,221 61,792 0.93South Dakota 10,682 10,818 1.27Tennessee 76,679 77,062 0.50Texas 410,644 417,929 1.77Utah 36,749 38,803 5.59Vermont 9,650 9,683 0.34Virginia 122,869 123,407 0.44Washington 71,054 71,028 -0.04West Virginia 21,586 21,535 -0.24Wisconsin 66,722 67,052 0.49Wyoming 7,880 7,601 -3.54United States 3,792,530 3,836,185 1.15
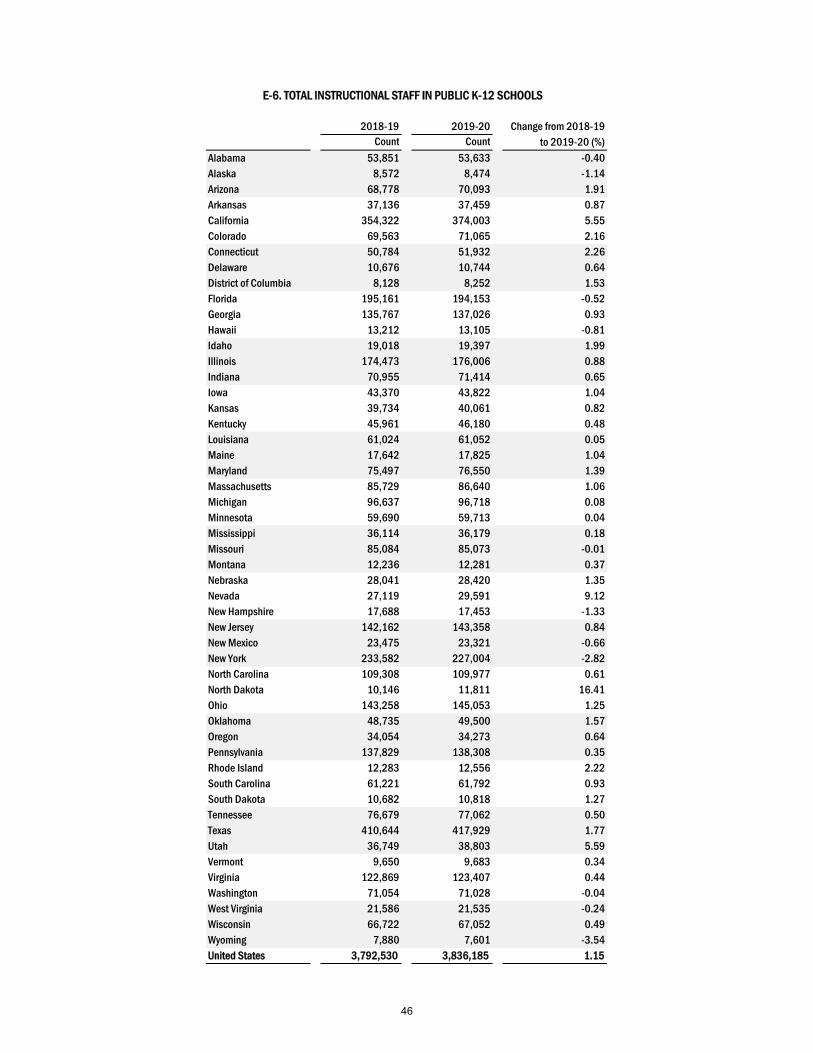
E-6. TOTAL INSTRUCTIONAL STAFF IN PUBLIC K-12 SCHOOLS
46
2018-19 2019-20 Change from 2018-19
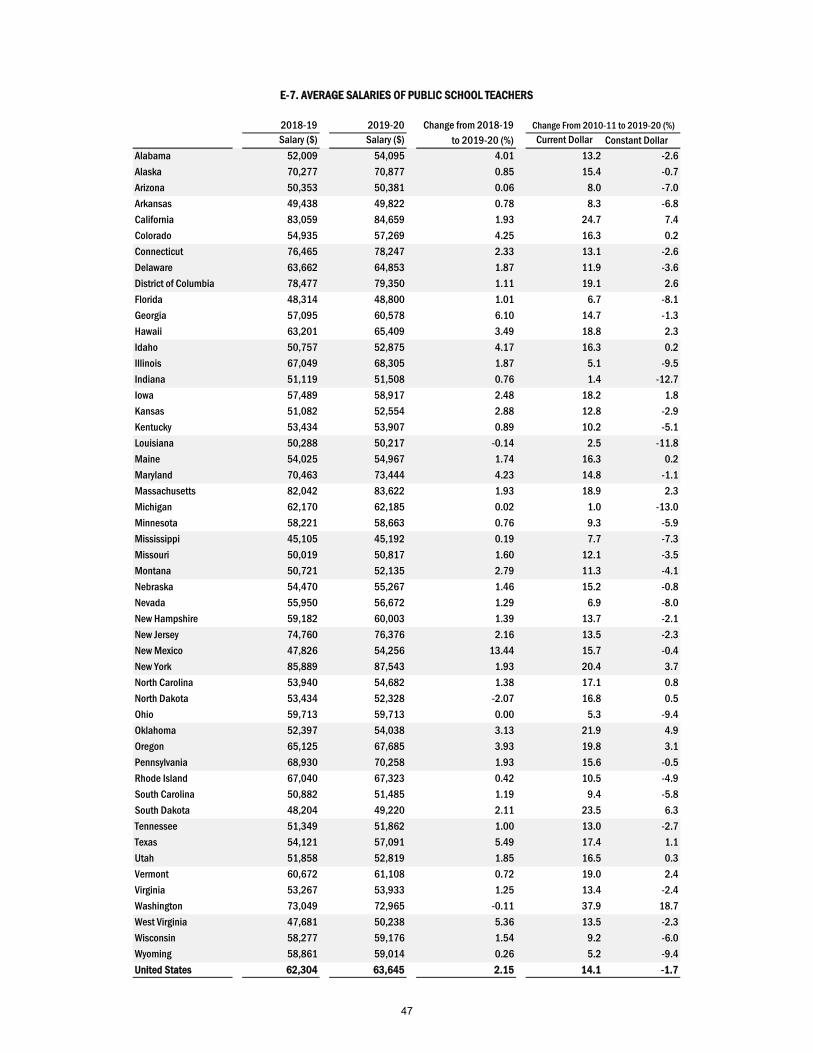
Salary ($) Salary ($) to 2019-20 (%) Current Dollar Constant Dollar
Alabama 52,009 54,095 4.01 13.2 -2.6
Alaska 70,277 70,877 0.85 15.4 -0.7
Arizona 50,353 50,381 0.06 8.0 -7.0
Arkansas 49,438 49,822 0.78 8.3 -6.8
California 83,059 84,659 1.93 24.7 7.4
Colorado 54,935 57,269 4.25 16.3 0.2
Connecticut 76,465 78,247 2.33 13.1 -2.6
Delaware 63,662 64,853 1.87 11.9 -3.6
District of Columbia 78,477 79,350 1.11 19.1 2.6
Florida 48,314 48,800 1.01 6.7 -8.1
Georgia 57,095 60,578 6.10 14.7 -1.3
Hawaii 63,201 65,409 3.49 18.8 2.3
Idaho 50,757 52,875 4.17 16.3 0.2
Illinois 67,049 68,305 1.87 5.1 -9.5
Indiana 51,119 51,508 0.76 1.4 -12.7
Iowa 57,489 58,917 2.48 18.2 1.8
Kansas 51,082 52,554 2.88 12.8 -2.9
Kentucky 53,434 53,907 0.89 10.2 -5.1
Louisiana 50,288 50,217 -0.14 2.5 -11.8
Maine 54,025 54,967 1.74 16.3 0.2
Maryland 70,463 73,444 4.23 14.8 -1.1
Massachusetts 82,042 83,622 1.93 18.9 2.3
Michigan 62,170 62,185 0.02 1.0 -13.0
Minnesota 58,221 58,663 0.76 9.3 -5.9
Mississippi 45,105 45,192 0.19 7.7 -7.3
Missouri 50,019 50,817 1.60 12.1 -3.5
Montana 50,721 52,135 2.79 11.3 -4.1
Nebraska 54,470 55,267 1.46 15.2 -0.8
Nevada 55,950 56,672 1.29 6.9 -8.0
New Hampshire 59,182 60,003 1.39 13.7 -2.1
New Jersey 74,760 76,376 2.16 13.5 -2.3
New Mexico 47,826 54,256 13.44 15.7 -0.4
New York 85,889 87,543 1.93 20.4 3.7
North Carolina 53,940 54,682 1.38 17.1 0.8
North Dakota 53,434 52,328 -2.07 16.8 0.5
Ohio 59,713 59,713 0.00 5.3 -9.4
Oklahoma 52,397 54,038 3.13 21.9 4.9
Oregon 65,125 67,685 3.93 19.8 3.1
Pennsylvania 68,930 70,258 1.93 15.6 -0.5
Rhode Island 67,040 67,323 0.42 10.5 -4.9
South Carolina 50,882 51,485 1.19 9.4 -5.8
South Dakota 48,204 49,220 2.11 23.5 6.3
Tennessee 51,349 51,862 1.00 13.0 -2.7
Texas 54,121 57,091 5.49 17.4 1.1
Utah 51,858 52,819 1.85 16.5 0.3
Vermont 60,672 61,108 0.72 19.0 2.4
Virginia 53,267 53,933 1.25 13.4 -2.4
Washington 73,049 72,965 -0.11 37.9 18.7
West Virginia 47,681 50,238 5.36 13.5 -2.3
Wisconsin 58,277 59,176 1.54 9.2 -6.0
Wyoming 58,861 59,014 0.26 5.2 -9.4
United States 62,304 63,645 2.15 14.1 -1.7
Change From 2010-11 to 2019-20 (%)
E-7. AVERAGE SALARIES OF PUBLIC SCHOOL TEACHERS
47
2018-19 2019-20 Change from 2018-19Salary ($) Salary ($) to 2019-20 (%) Current Dollar Constant Dollar
Alabama 54,113 56,273 3.99 13.2 -2.5Alaska 76,758 78,581 2.37 24.9 7.5Arizona 50,778 50,381 -0.78 8.0 -7.0Arkansas 52,202 52,766 1.08 6.5 -8.3California 83,059 85,390 2.81 25.8 8.3Colorado 58,406 60,896 4.26 18.1 1.7Connecticut 76,465 78,247 2.33 13.1 -2.6Delaware 65,878 66,511 0.96 9.5 -5.7District of Columbia 78,477 79,350 1.11 19.0 2.4Florida 48,784 49,103 0.65 4.3 -10.2Georgia 60,017 63,557 5.90 14.9 -1.1Hawaii 65,683 67,978 3.49 20.9 4.1Idaho 53,004 54,025 1.93 12.8 -2.9Illinois 67,049 68,305 1.87 5.1 -9.5Indiana 61,160 61,935 1.27 21.5 4.6Iowa 59,942 60,942 1.67 17.1 0.8Kansas 52,236 53,123 1.70 11.5 -4.0Kentucky 56,107 56,651 0.97 11.1 -4.3Louisiana 52,935 52,994 0.11 3.1 -11.2Maine 55,025 55,996 1.76 14.3 -1.6Maryland 74,426 77,482 4.11 14.4 -1.5Massachusetts 82,042 83,622 1.93 18.9 2.3Michigan 62,170 62,185 0.02 1.0 -13.0Minnesota 71,121 72,793 2.35 25.3 7.9Mississippi 47,347 47,623 0.58 8.7 -6.4Missouri 52,452 53,308 1.63 9.5 -5.7Montana 51,680 53,120 2.79 11.3 -4.1Nebraska 54,588 55,367 1.43 14.9 -1.1Nevada 63,910 64,734 1.29 20.5 3.7New Hampshire 59,182 60,003 1.39 13.7 -2.1New Jersey 79,906 82,029 2.66 16.5 0.3New Mexico 51,410 56,630 10.15 17.7 1.3New York 86,609 88,277 1.93 20.6 3.8North Carolina 53,940 54,682 1.38 17.1 0.8North Dakota 55,927 54,970 -1.71 18.6 2.1Ohio 61,575 62,225 1.06 6.5 -8.3Oklahoma 54,664 56,320 3.03 22.2 5.2Oregon 67,182 69,450 3.38 17.1 0.8Pennsylvania 70,866 72,222 1.91 15.3 -0.8Rhode Island 78,555 80,208 2.10 22.2 5.2South Carolina 55,052 56,112 1.93 13.6 -2.2South Dakota 49,887 50,511 1.25 22.1 5.1Tennessee 54,037 54,577 1.00 14.0 -1.9Texas 57,548 60,706 5.49 17.9 1.5Utah 59,156 60,374 2.06 23.0 5.9Vermont 62,683 63,529 1.35 20.1 3.4Virginia 55,243 55,615 0.67 12.6 -3.1Washington 76,643 76,525 -0.15 37.0 18.0West Virginia 49,499 52,075 5.20 12.7 -3.0Wisconsin 60,027 61,425 2.33 5.6 -9.1Wyoming 60,979 61,138 0.26 4.9 -9.7United States 64,545 66,126 2.45 15.4 -0.7
E-8. AVERAGE SALARIES OF INSTRUCTIONAL STAFF IN PUBLIC SCHOOLS
Change From 2010-11 to 2019-20 (%)
48
SERIES F - SCHOOL REVENUES AND EXPENDITURES
F-1. REVENUE AND NON-REVENUE RECEIPTS IN 2018-19 ($ THOUSANDS)
F-2. REVENUE AND NON-REVENUE RECEIPTS IN 2019-20 ($ THOUSANDS)
F-3. CHANGES IN REVENUE AND NON-REVENUE RECEIPTS FROM 2018-19 TO 2019-20
F-4. REVENUE BY SOURCE AS A PERCENTAGE OF TOTAL REVENUE RECEIPTS
F-5. PUBLIC SCHOOL EXPENDITURES 2018-19 ($ THOUSANDS)
F-6. PUBLIC SCHOOL EXPENDITURES 2019-20 ($ THOUSANDS)
F-7. CHANGES IN EXPENDITURES FROM 2018-19 TO 2019-20
F-8. PUBLIC SCHOOL CURRENT EXPENDITURES PER STUDENT IN FALL ENROLLMENT
F-9. PUBLIC SCHOOL CURRENT EXPENDITURES PER STUDENT IN AVERAGE DAILY ATTENDANCE
49
Non-RevenueFederal State Local Total Receipts Total Receipts
Alabama 875,098 4,592,501 2,744,751 8,212,350 261,431 8,473,781Alaska 465,275 1,824,349 795,522 3,085,146 208,044 3,293,190Arizona 1,397,388 5,708,124 4,566,077 11,671,589 - 11,671,589Arkansas 637,497 2,712,799 2,224,722 5,575,018 326,995 5,902,013California 8,877,579 58,652,417 33,595,495 101,125,491 17,205,850 118,331,341Colorado 736,383 4,850,242 6,009,686 11,596,311 694,280 12,290,591Connecticut 481,418 4,644,855 6,681,557 11,807,830 13,995 11,821,825Delaware 197,455 1,463,137 830,100 2,490,692 154,077 2,644,769District of Columbia 239,882 - 2,694,114 2,933,996 9,388 2,943,384Florida 3,542,844 12,318,413 15,212,909 31,074,166 923,738 31,997,904Georgia 1,888,978 10,423,123 9,868,899 22,181,000 403,976 22,584,976Hawaii 272,436 2,665,830 53,818 2,992,084 - 2,992,084Idaho 213,868 1,557,590 631,326 2,402,784 187,366 2,590,150Illinois 2,222,142 13,598,557 18,749,711 34,570,410 2,571,237 37,141,647Indiana 860,931 7,965,517 3,642,695 12,469,143 292,588 12,761,731Iowa 387,292 3,861,689 2,764,127 7,013,108 938,411 7,951,519Kansas 530,693 4,399,813 1,698,933 6,629,439 507,080 7,136,519Kentucky 921,161 4,863,515 2,744,913 8,529,589 37,259 8,566,848Louisiana 1,187,251 4,059,901 4,367,807 9,614,959 837,396 10,452,355Maine 192,418 1,045,487 1,602,787 2,840,692 300,263 3,140,955Maryland 968,414 6,923,079 8,323,087 16,214,580 233,809 16,448,389Massachusetts 895,941 7,220,311 10,329,326 18,445,578 771 18,446,349Michigan 1,222,335 11,909,915 5,017,899 18,150,149 786,035 18,936,184Minnesota 757,803 9,736,178 3,872,387 14,366,368 2,087,549 16,453,917Mississippi 683,289 2,417,079 1,719,408 4,819,776 158,200 4,977,976Missouri 953,834 3,885,321 7,263,988 12,103,143 1,153,976 13,257,119Montana 206,210 919,965 781,971 1,908,146 160,400 2,068,546Nebraska 199,000 1,455,000 2,204,000 3,858,000 36,000 3,894,000Nevada 400,131 1,889,716 2,748,850 5,038,697 221,819 5,260,516New Hampshire 165,688 1,009,160 2,064,264 3,239,112 40,196 3,279,308New Jersey 1,237,075 12,678,755 16,868,488 30,784,318 9,871 30,794,189New Mexico 562,379 2,802,833 779,250 4,144,462 190,480 4,334,942New York 2,708,342 23,622,937 39,410,359 65,741,638 5,392,507 71,134,145North Carolina 1,551,748 9,276,271 5,188,535 16,016,554 - 16,016,554North Dakota 107,968 1,189,877 697,293 1,995,138 15,270 2,010,408Ohio 1,655,676 9,574,094 13,162,352 24,392,122 672,288 25,064,410Oklahoma 749,737 3,340,013 2,950,110 7,039,860 774,348 7,814,208Oregon 575,000 4,589,955 3,760,642 8,925,597 750,000 9,675,597Pennsylvania 1,735,360 11,875,173 19,515,672 33,126,205 3,135,056 36,261,261Rhode Island 169,964 961,696 1,304,901 2,436,561 8,229 2,444,790South Carolina 919,105 5,493,927 4,684,809 11,097,841 1,442,563 12,540,404South Dakota 236,875 564,462 886,448 1,687,785 417,377 2,105,162Tennessee 1,162,406 4,910,660 4,116,733 10,189,799 789,993 10,979,792Texas 5,628,990 23,622,973 33,994,814 63,246,777 7,886,335 71,133,112Utah 421,367 2,992,611 2,571,547 5,985,525 193,794 6,179,319Vermont 108,232 1,645,618 75,849 1,829,699 28,367 1,858,066Virginia 1,160,821 6,891,610 9,560,779 17,613,210 938,429 18,551,639Washington 1,092,915 13,363,343 4,863,065 19,319,323 2,142,609 21,461,932West Virginia 435,501 2,170,187 1,238,171 3,843,859 218,908 4,062,767Wisconsin 870,453 6,200,270 4,926,102 11,996,825 675,139 12,671,964Wyoming 132,478 964,525 709,850 1,806,853 6,186 1,813,039United States 55,803,026 347,305,373 337,070,898 740,179,297 56,439,878 796,619,175
F-1. REVENUE AND NON-REVENUE RECEIPTS IN 2018-19 ($ THOUSANDS)
Revenue Receipts
50
Non-RevenueFederal State Local Total Receipts Total Receipts
Alabama 852,685 4,743,348 2,671,159 8,267,192 116,950 8,384,142Alaska 470,046 1,897,106 854,544 3,221,696 139,502 3,361,198Arizona 1,474,862 5,899,447 4,916,206 12,290,515 - 12,290,515Arkansas 642,585 2,808,834 2,229,271 5,680,690 423,267 6,103,957California 9,332,806 62,887,233 35,470,173 107,690,212 17,808,499 125,498,711Colorado 756,265 4,981,198 6,171,947 11,909,410 713,025 12,622,435Connecticut 494,180 4,750,891 6,836,594 12,081,665 14,079 12,095,744Delaware 193,130 1,515,234 870,541 2,578,905 154,651 2,733,556District of Columbia 244,832 - 2,823,023 3,067,855 10,255 3,078,110Florida 3,634,005 12,802,748 15,769,823 32,206,576 957,663 33,164,239Georgia 1,893,114 10,984,290 10,181,104 23,058,508 393,237 23,451,745Hawaii 282,849 2,721,424 53,152 3,057,425 - 3,057,425Idaho 208,438 1,599,950 653,973 2,462,361 178,115 2,640,476Illinois 2,215,810 14,199,900 19,023,040 35,438,750 2,521,806 37,960,556Indiana 837,048 7,978,417 3,654,760 12,470,225 264,718 12,734,943Iowa 387,292 4,020,018 2,877,456 7,284,766 938,411 8,223,177Kansas 530,000 4,900,000 1,952,389 7,382,389 265,546 7,647,935Kentucky 930,169 4,961,471 2,804,861 8,696,501 39,231 8,735,732Louisiana 1,218,769 4,289,573 4,360,571 9,868,913 837,396 10,706,309Maine 197,625 1,069,714 1,612,113 2,879,452 150,000 3,029,452Maryland 1,029,103 7,098,091 8,406,317 16,533,511 284,452 16,817,963Massachusetts 895,941 7,292,146 10,329,326 18,517,413 771 18,518,184Michigan 1,261,748 12,247,696 5,094,171 18,603,615 834,482 19,438,097Minnesota 771,059 10,118,346 3,997,428 14,886,833 2,087,549 16,974,382Mississippi 695,087 2,418,024 1,783,263 4,896,374 157,566 5,053,940Missouri 960,756 3,967,602 7,132,173 12,060,531 1,153,976 13,214,507Montana 202,522 941,550 800,017 1,944,089 180,299 2,124,388Nebraska 200,476 1,480,503 2,320,414 4,001,393 36,063 4,037,456Nevada 402,568 1,981,697 2,831,553 5,215,818 228,629 5,444,447New Hampshire 165,349 1,005,105 2,144,455 3,314,909 31,420 3,346,329New Jersey 1,242,814 12,978,677 17,183,368 31,404,859 10,485 31,415,344New Mexico 578,125 3,078,072 849,383 4,505,580 195,813 4,701,393New York 2,585,234 23,274,324 40,639,407 66,498,965 6,289,227 72,788,192North Carolina 1,561,598 9,596,451 5,565,156 16,723,205 - 16,723,205North Dakota 103,062 1,267,997 734,719 2,105,778 13,950 2,119,728Ohio 1,632,032 9,654,776 13,692,608 24,979,416 721,408 25,700,824Oklahoma 790,077 3,405,693 3,126,116 7,321,886 757,734 8,079,620Oregon 575,000 4,773,553 3,991,068 9,339,621 750,000 10,089,621Pennsylvania 1,709,677 12,096,293 20,153,786 33,959,756 3,400,008 37,359,764Rhode Island 166,547 987,835 1,318,280 2,472,662 5,439 2,478,101South Carolina 921,939 5,830,155 4,933,286 11,685,380 1,416,684 13,102,064South Dakota 249,980 585,399 912,353 1,747,732 427,212 2,174,944Tennessee 1,187,398 4,919,200 4,288,023 10,394,621 988,943 11,383,564Texas 5,684,960 29,180,023 34,344,118 69,209,101 7,886,335 77,095,436Utah 409,806 3,048,232 2,527,517 5,985,555 361,728 6,347,283Vermont 108,721 1,684,401 75,831 1,868,953 28,578 1,897,531Virginia 1,160,582 6,922,364 9,717,366 17,800,312 938,429 18,738,741Washington 1,152,939 14,331,276 5,004,090 20,488,305 1,839,530 22,327,835West Virginia 434,519 2,237,193 1,260,031 3,931,743 228,061 4,159,804Wisconsin 880,274 6,265,934 4,926,102 12,072,310 678,365 12,750,675Wyoming 135,465 939,620 723,722 1,798,807 6,321 1,805,128United States 56,651,868 364,619,024 346,592,147 767,863,039 57,865,808 825,728,847
F-2. REVENUE AND NON-REVENUE RECEIPTS IN 2019-20 ($ THOUSANDS)
Revenue Receipts
51
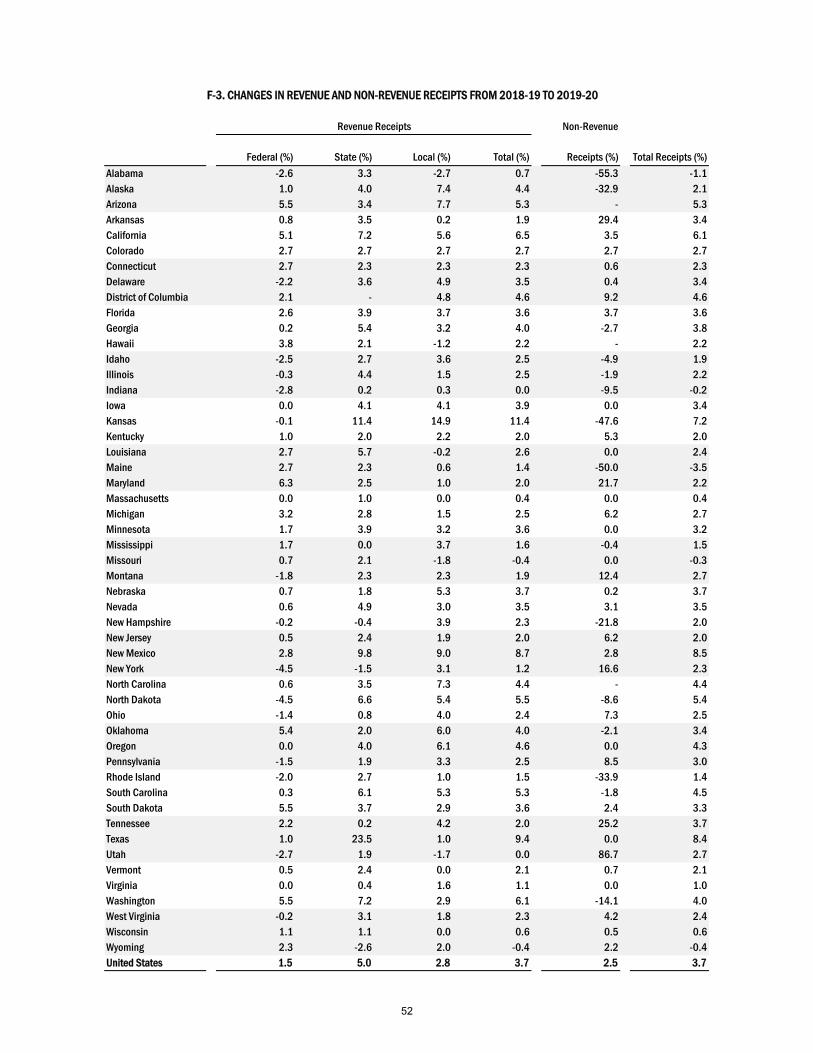
Non-Revenue
Federal (%) State (%) Local (%) Total (%) Receipts (%) Total Receipts (%)
Alabama -2.6 3.3 -2.7 0.7 -55.3 -1.1Alaska 1.0 4.0 7.4 4.4 -32.9 2.1Arizona 5.5 3.4 7.7 5.3 - 5.3Arkansas 0.8 3.5 0.2 1.9 29.4 3.4California 5.1 7.2 5.6 6.5 3.5 6.1Colorado 2.7 2.7 2.7 2.7 2.7 2.7Connecticut 2.7 2.3 2.3 2.3 0.6 2.3Delaware -2.2 3.6 4.9 3.5 0.4 3.4District of Columbia 2.1 - 4.8 4.6 9.2 4.6Florida 2.6 3.9 3.7 3.6 3.7 3.6Georgia 0.2 5.4 3.2 4.0 -2.7 3.8Hawaii 3.8 2.1 -1.2 2.2 - 2.2Idaho -2.5 2.7 3.6 2.5 -4.9 1.9Illinois -0.3 4.4 1.5 2.5 -1.9 2.2Indiana -2.8 0.2 0.3 0.0 -9.5 -0.2Iowa 0.0 4.1 4.1 3.9 0.0 3.4Kansas -0.1 11.4 14.9 11.4 -47.6 7.2Kentucky 1.0 2.0 2.2 2.0 5.3 2.0Louisiana 2.7 5.7 -0.2 2.6 0.0 2.4Maine 2.7 2.3 0.6 1.4 -50.0 -3.5Maryland 6.3 2.5 1.0 2.0 21.7 2.2Massachusetts 0.0 1.0 0.0 0.4 0.0 0.4Michigan 3.2 2.8 1.5 2.5 6.2 2.7Minnesota 1.7 3.9 3.2 3.6 0.0 3.2Mississippi 1.7 0.0 3.7 1.6 -0.4 1.5Missouri 0.7 2.1 -1.8 -0.4 0.0 -0.3Montana -1.8 2.3 2.3 1.9 12.4 2.7Nebraska 0.7 1.8 5.3 3.7 0.2 3.7Nevada 0.6 4.9 3.0 3.5 3.1 3.5New Hampshire -0.2 -0.4 3.9 2.3 -21.8 2.0New Jersey 0.5 2.4 1.9 2.0 6.2 2.0New Mexico 2.8 9.8 9.0 8.7 2.8 8.5New York -4.5 -1.5 3.1 1.2 16.6 2.3North Carolina 0.6 3.5 7.3 4.4 - 4.4North Dakota -4.5 6.6 5.4 5.5 -8.6 5.4Ohio -1.4 0.8 4.0 2.4 7.3 2.5Oklahoma 5.4 2.0 6.0 4.0 -2.1 3.4Oregon 0.0 4.0 6.1 4.6 0.0 4.3Pennsylvania -1.5 1.9 3.3 2.5 8.5 3.0Rhode Island -2.0 2.7 1.0 1.5 -33.9 1.4South Carolina 0.3 6.1 5.3 5.3 -1.8 4.5South Dakota 5.5 3.7 2.9 3.6 2.4 3.3Tennessee 2.2 0.2 4.2 2.0 25.2 3.7Texas 1.0 23.5 1.0 9.4 0.0 8.4Utah -2.7 1.9 -1.7 0.0 86.7 2.7Vermont 0.5 2.4 0.0 2.1 0.7 2.1Virginia 0.0 0.4 1.6 1.1 0.0 1.0Washington 5.5 7.2 2.9 6.1 -14.1 4.0West Virginia -0.2 3.1 1.8 2.3 4.2 2.4Wisconsin 1.1 1.1 0.0 0.6 0.5 0.6Wyoming 2.3 -2.6 2.0 -0.4 2.2 -0.4United States 1.5 5.0 2.8 3.7 2.5 3.7
F-3. CHANGES IN REVENUE AND NON-REVENUE RECEIPTS FROM 2018-19 TO 2019-20
Revenue Receipts
52
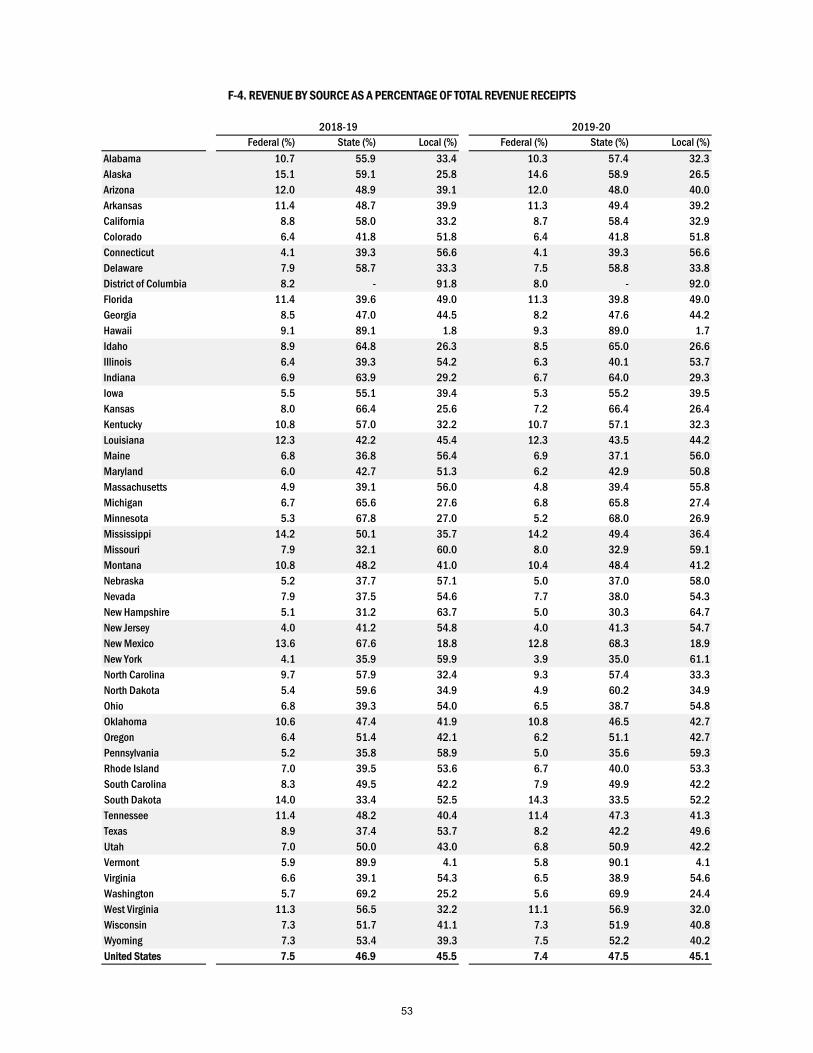
Federal (%) State (%) Local (%) Federal (%) State (%) Local (%)
Alabama 10.7 55.9 33.4 10.3 57.4 32.3Alaska 15.1 59.1 25.8 14.6 58.9 26.5Arizona 12.0 48.9 39.1 12.0 48.0 40.0Arkansas 11.4 48.7 39.9 11.3 49.4 39.2California 8.8 58.0 33.2 8.7 58.4 32.9Colorado 6.4 41.8 51.8 6.4 41.8 51.8Connecticut 4.1 39.3 56.6 4.1 39.3 56.6Delaware 7.9 58.7 33.3 7.5 58.8 33.8District of Columbia 8.2 - 91.8 8.0 - 92.0Florida 11.4 39.6 49.0 11.3 39.8 49.0Georgia 8.5 47.0 44.5 8.2 47.6 44.2Hawaii 9.1 89.1 1.8 9.3 89.0 1.7Idaho 8.9 64.8 26.3 8.5 65.0 26.6Illinois 6.4 39.3 54.2 6.3 40.1 53.7Indiana 6.9 63.9 29.2 6.7 64.0 29.3Iowa 5.5 55.1 39.4 5.3 55.2 39.5Kansas 8.0 66.4 25.6 7.2 66.4 26.4Kentucky 10.8 57.0 32.2 10.7 57.1 32.3Louisiana 12.3 42.2 45.4 12.3 43.5 44.2Maine 6.8 36.8 56.4 6.9 37.1 56.0Maryland 6.0 42.7 51.3 6.2 42.9 50.8Massachusetts 4.9 39.1 56.0 4.8 39.4 55.8Michigan 6.7 65.6 27.6 6.8 65.8 27.4Minnesota 5.3 67.8 27.0 5.2 68.0 26.9Mississippi 14.2 50.1 35.7 14.2 49.4 36.4Missouri 7.9 32.1 60.0 8.0 32.9 59.1Montana 10.8 48.2 41.0 10.4 48.4 41.2Nebraska 5.2 37.7 57.1 5.0 37.0 58.0Nevada 7.9 37.5 54.6 7.7 38.0 54.3New Hampshire 5.1 31.2 63.7 5.0 30.3 64.7New Jersey 4.0 41.2 54.8 4.0 41.3 54.7New Mexico 13.6 67.6 18.8 12.8 68.3 18.9New York 4.1 35.9 59.9 3.9 35.0 61.1North Carolina 9.7 57.9 32.4 9.3 57.4 33.3North Dakota 5.4 59.6 34.9 4.9 60.2 34.9Ohio 6.8 39.3 54.0 6.5 38.7 54.8Oklahoma 10.6 47.4 41.9 10.8 46.5 42.7Oregon 6.4 51.4 42.1 6.2 51.1 42.7Pennsylvania 5.2 35.8 58.9 5.0 35.6 59.3Rhode Island 7.0 39.5 53.6 6.7 40.0 53.3South Carolina 8.3 49.5 42.2 7.9 49.9 42.2South Dakota 14.0 33.4 52.5 14.3 33.5 52.2Tennessee 11.4 48.2 40.4 11.4 47.3 41.3Texas 8.9 37.4 53.7 8.2 42.2 49.6Utah 7.0 50.0 43.0 6.8 50.9 42.2Vermont 5.9 89.9 4.1 5.8 90.1 4.1Virginia 6.6 39.1 54.3 6.5 38.9 54.6Washington 5.7 69.2 25.2 5.6 69.9 24.4West Virginia 11.3 56.5 32.2 11.1 56.9 32.0Wisconsin 7.3 51.7 41.1 7.3 51.9 40.8Wyoming 7.3 53.4 39.3 7.5 52.2 40.2United States 7.5 46.9 45.5 7.4 47.5 45.1
2018-19 2019-20
F-4. REVENUE BY SOURCE AS A PERCENTAGE OF TOTAL REVENUE RECEIPTS
53
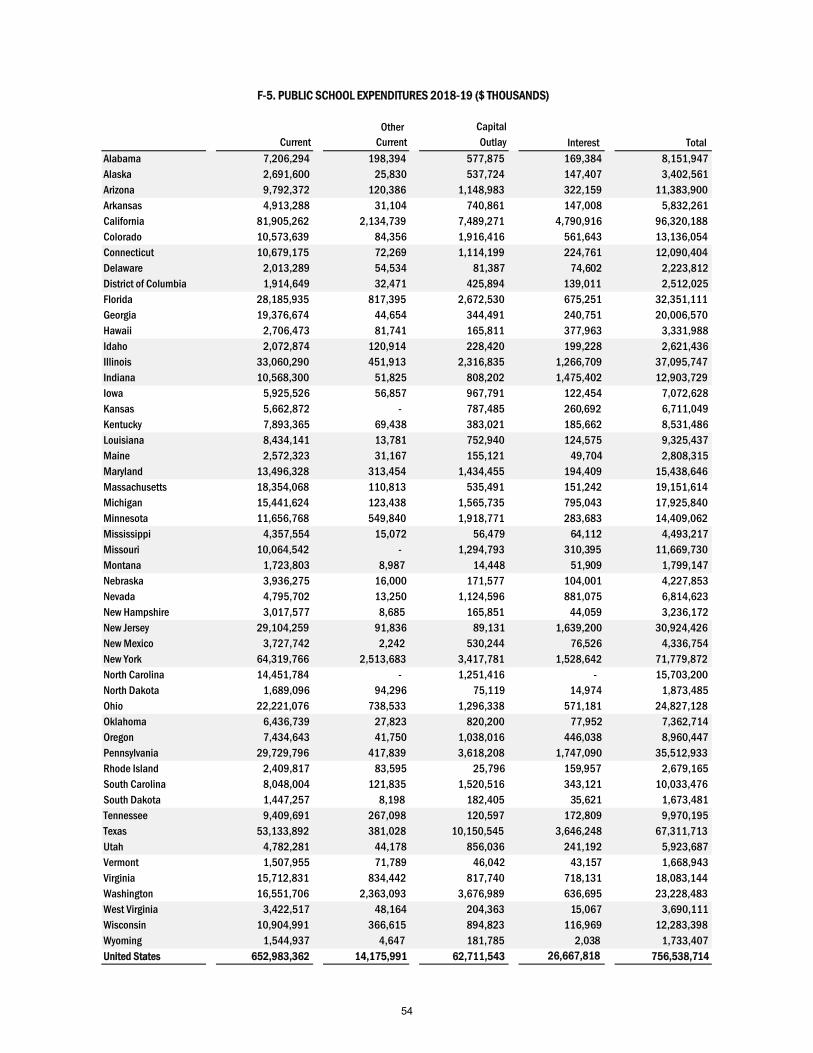
Other Capital Current Current Outlay Interest Total
Alabama 7,206,294 198,394 577,875 169,384 8,151,947 Alaska 2,691,600 25,830 537,724 147,407 3,402,561 Arizona 9,792,372 120,386 1,148,983 322,159 11,383,900 Arkansas 4,913,288 31,104 740,861 147,008 5,832,261 California 81,905,262 2,134,739 7,489,271 4,790,916 96,320,188 Colorado 10,573,639 84,356 1,916,416 561,643 13,136,054 Connecticut 10,679,175 72,269 1,114,199 224,761 12,090,404 Delaware 2,013,289 54,534 81,387 74,602 2,223,812 District of Columbia 1,914,649 32,471 425,894 139,011 2,512,025 Florida 28,185,935 817,395 2,672,530 675,251 32,351,111 Georgia 19,376,674 44,654 344,491 240,751 20,006,570 Hawaii 2,706,473 81,741 165,811 377,963 3,331,988 Idaho 2,072,874 120,914 228,420 199,228 2,621,436 Illinois 33,060,290 451,913 2,316,835 1,266,709 37,095,747 Indiana 10,568,300 51,825 808,202 1,475,402 12,903,729 Iowa 5,925,526 56,857 967,791 122,454 7,072,628 Kansas 5,662,872 - 787,485 260,692 6,711,049 Kentucky 7,893,365 69,438 383,021 185,662 8,531,486 Louisiana 8,434,141 13,781 752,940 124,575 9,325,437 Maine 2,572,323 31,167 155,121 49,704 2,808,315 Maryland 13,496,328 313,454 1,434,455 194,409 15,438,646 Massachusetts 18,354,068 110,813 535,491 151,242 19,151,614 Michigan 15,441,624 123,438 1,565,735 795,043 17,925,840 Minnesota 11,656,768 549,840 1,918,771 283,683 14,409,062 Mississippi 4,357,554 15,072 56,479 64,112 4,493,217 Missouri 10,064,542 - 1,294,793 310,395 11,669,730 Montana 1,723,803 8,987 14,448 51,909 1,799,147 Nebraska 3,936,275 16,000 171,577 104,001 4,227,853 Nevada 4,795,702 13,250 1,124,596 881,075 6,814,623 New Hampshire 3,017,577 8,685 165,851 44,059 3,236,172 New Jersey 29,104,259 91,836 89,131 1,639,200 30,924,426 New Mexico 3,727,742 2,242 530,244 76,526 4,336,754 New York 64,319,766 2,513,683 3,417,781 1,528,642 71,779,872 North Carolina 14,451,784 - 1,251,416 - 15,703,200 North Dakota 1,689,096 94,296 75,119 14,974 1,873,485Ohio 22,221,076 738,533 1,296,338 571,181 24,827,128 Oklahoma 6,436,739 27,823 820,200 77,952 7,362,714 Oregon 7,434,643 41,750 1,038,016 446,038 8,960,447 Pennsylvania 29,729,796 417,839 3,618,208 1,747,090 35,512,933 Rhode Island 2,409,817 83,595 25,796 159,957 2,679,165 South Carolina 8,048,004 121,835 1,520,516 343,121 10,033,476 South Dakota 1,447,257 8,198 182,405 35,621 1,673,481Tennessee 9,409,691 267,098 120,597 172,809 9,970,195 Texas 53,133,892 381,028 10,150,545 3,646,248 67,311,713 Utah 4,782,281 44,178 856,036 241,192 5,923,687 Vermont 1,507,955 71,789 46,042 43,157 1,668,943 Virginia 15,712,831 834,442 817,740 718,131 18,083,144 Washington 16,551,706 2,363,093 3,676,989 636,695 23,228,483 West Virginia 3,422,517 48,164 204,363 15,067 3,690,111Wisconsin 10,904,991 366,615 894,823 116,969 12,283,398 Wyoming 1,544,937 4,647 181,785 2,038 1,733,407 United States 652,983,362 14,175,991 62,711,543 26,667,818 756,538,714
F-5. PUBLIC SCHOOL EXPENDITURES 2018-19 ($ THOUSANDS)
54
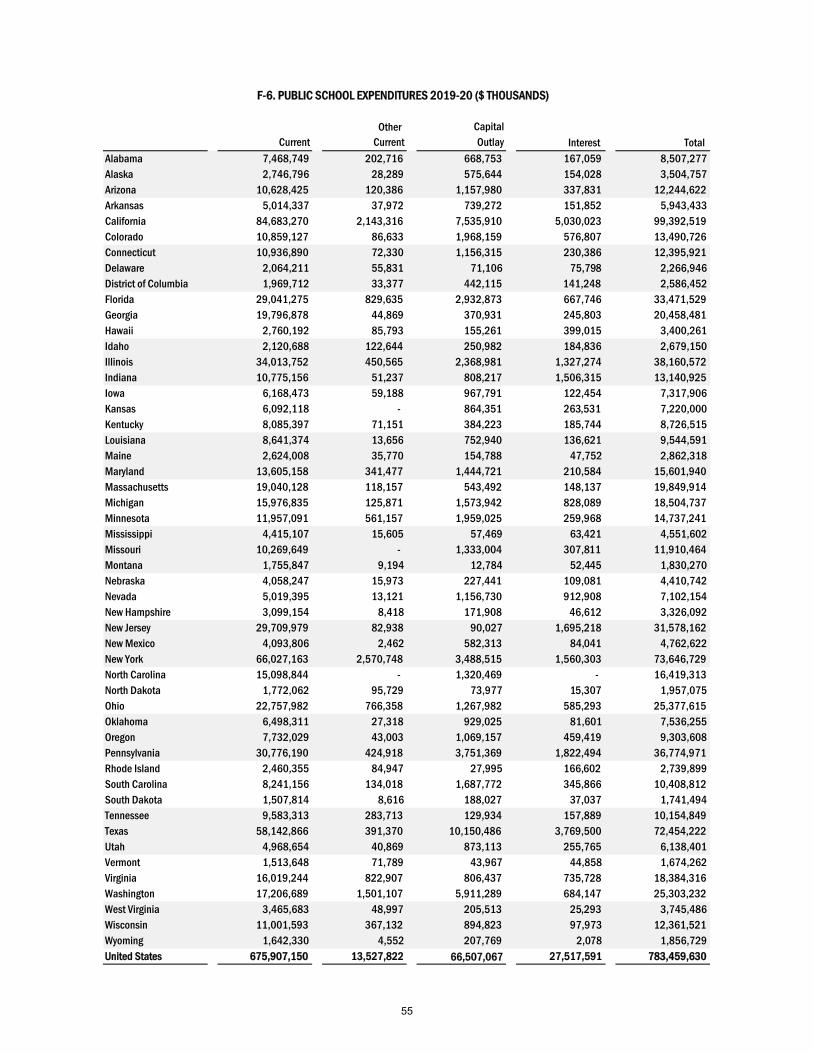
Other Capital Current Current Outlay Interest Total
Alabama 7,468,749 202,716 668,753 167,059 8,507,277 Alaska 2,746,796 28,289 575,644 154,028 3,504,757 Arizona 10,628,425 120,386 1,157,980 337,831 12,244,622 Arkansas 5,014,337 37,972 739,272 151,852 5,943,433 California 84,683,270 2,143,316 7,535,910 5,030,023 99,392,519 Colorado 10,859,127 86,633 1,968,159 576,807 13,490,726 Connecticut 10,936,890 72,330 1,156,315 230,386 12,395,921 Delaware 2,064,211 55,831 71,106 75,798 2,266,946 District of Columbia 1,969,712 33,377 442,115 141,248 2,586,452 Florida 29,041,275 829,635 2,932,873 667,746 33,471,529 Georgia 19,796,878 44,869 370,931 245,803 20,458,481 Hawaii 2,760,192 85,793 155,261 399,015 3,400,261 Idaho 2,120,688 122,644 250,982 184,836 2,679,150 Illinois 34,013,752 450,565 2,368,981 1,327,274 38,160,572 Indiana 10,775,156 51,237 808,217 1,506,315 13,140,925 Iowa 6,168,473 59,188 967,791 122,454 7,317,906 Kansas 6,092,118 - 864,351 263,531 7,220,000 Kentucky 8,085,397 71,151 384,223 185,744 8,726,515 Louisiana 8,641,374 13,656 752,940 136,621 9,544,591 Maine 2,624,008 35,770 154,788 47,752 2,862,318 Maryland 13,605,158 341,477 1,444,721 210,584 15,601,940 Massachusetts 19,040,128 118,157 543,492 148,137 19,849,914 Michigan 15,976,835 125,871 1,573,942 828,089 18,504,737 Minnesota 11,957,091 561,157 1,959,025 259,968 14,737,241 Mississippi 4,415,107 15,605 57,469 63,421 4,551,602 Missouri 10,269,649 - 1,333,004 307,811 11,910,464 Montana 1,755,847 9,194 12,784 52,445 1,830,270 Nebraska 4,058,247 15,973 227,441 109,081 4,410,742 Nevada 5,019,395 13,121 1,156,730 912,908 7,102,154 New Hampshire 3,099,154 8,418 171,908 46,612 3,326,092 New Jersey 29,709,979 82,938 90,027 1,695,218 31,578,162 New Mexico 4,093,806 2,462 582,313 84,041 4,762,622 New York 66,027,163 2,570,748 3,488,515 1,560,303 73,646,729 North Carolina 15,098,844 - 1,320,469 - 16,419,313 North Dakota 1,772,062 95,729 73,977 15,307 1,957,075Ohio 22,757,982 766,358 1,267,982 585,293 25,377,615 Oklahoma 6,498,311 27,318 929,025 81,601 7,536,255 Oregon 7,732,029 43,003 1,069,157 459,419 9,303,608 Pennsylvania 30,776,190 424,918 3,751,369 1,822,494 36,774,971 Rhode Island 2,460,355 84,947 27,995 166,602 2,739,899 South Carolina 8,241,156 134,018 1,687,772 345,866 10,408,812 South Dakota 1,507,814 8,616 188,027 37,037 1,741,494Tennessee 9,583,313 283,713 129,934 157,889 10,154,849 Texas 58,142,866 391,370 10,150,486 3,769,500 72,454,222 Utah 4,968,654 40,869 873,113 255,765 6,138,401 Vermont 1,513,648 71,789 43,967 44,858 1,674,262 Virginia 16,019,244 822,907 806,437 735,728 18,384,316 Washington 17,206,689 1,501,107 5,911,289 684,147 25,303,232 West Virginia 3,465,683 48,997 205,513 25,293 3,745,486Wisconsin 11,001,593 367,132 894,823 97,973 12,361,521 Wyoming 1,642,330 4,552 207,769 2,078 1,856,729 United States 675,907,150 13,527,822 66,507,067 27,517,591 783,459,630
F-6. PUBLIC SCHOOL EXPENDITURES 2019-20 ($ THOUSANDS)
55
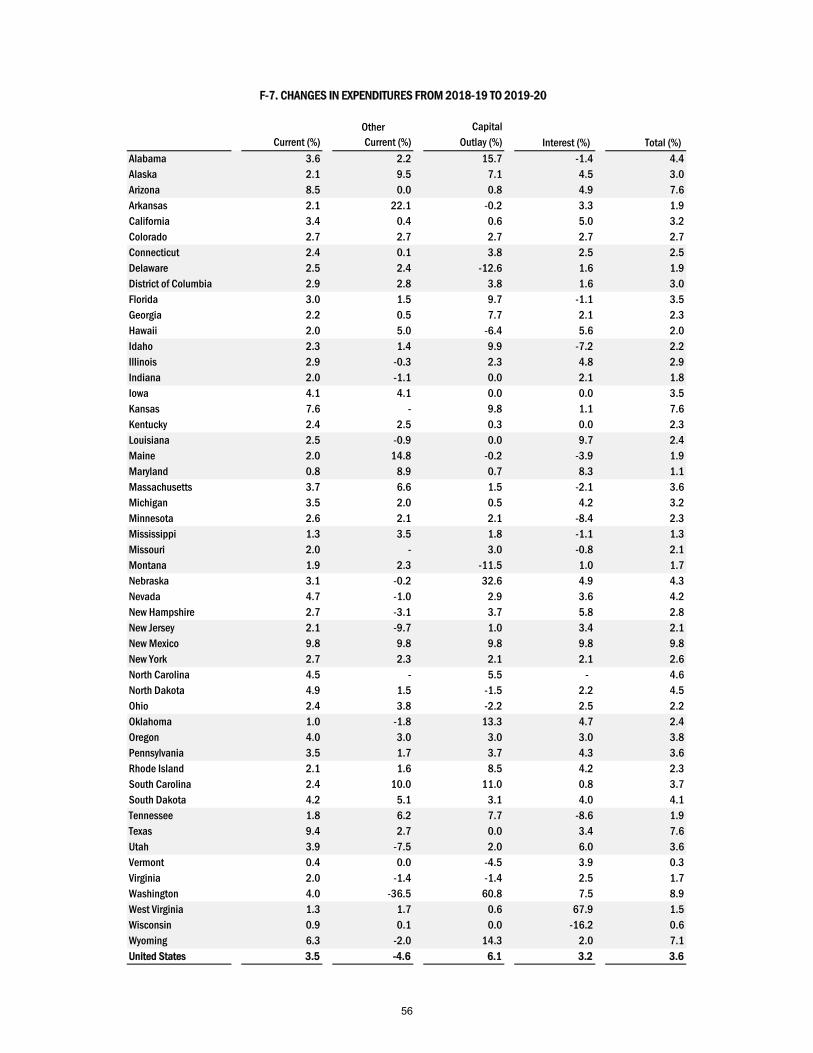
Other Capital Current (%) Current (%) Outlay (%) Interest (%) Total (%)
Alabama 3.6 2.2 15.7 -1.4 4.4Alaska 2.1 9.5 7.1 4.5 3.0Arizona 8.5 0.0 0.8 4.9 7.6Arkansas 2.1 22.1 -0.2 3.3 1.9California 3.4 0.4 0.6 5.0 3.2Colorado 2.7 2.7 2.7 2.7 2.7Connecticut 2.4 0.1 3.8 2.5 2.5Delaware 2.5 2.4 -12.6 1.6 1.9District of Columbia 2.9 2.8 3.8 1.6 3.0Florida 3.0 1.5 9.7 -1.1 3.5Georgia 2.2 0.5 7.7 2.1 2.3Hawaii 2.0 5.0 -6.4 5.6 2.0Idaho 2.3 1.4 9.9 -7.2 2.2Illinois 2.9 -0.3 2.3 4.8 2.9Indiana 2.0 -1.1 0.0 2.1 1.8Iowa 4.1 4.1 0.0 0.0 3.5Kansas 7.6 - 9.8 1.1 7.6Kentucky 2.4 2.5 0.3 0.0 2.3Louisiana 2.5 -0.9 0.0 9.7 2.4Maine 2.0 14.8 -0.2 -3.9 1.9Maryland 0.8 8.9 0.7 8.3 1.1Massachusetts 3.7 6.6 1.5 -2.1 3.6Michigan 3.5 2.0 0.5 4.2 3.2Minnesota 2.6 2.1 2.1 -8.4 2.3Mississippi 1.3 3.5 1.8 -1.1 1.3Missouri 2.0 - 3.0 -0.8 2.1Montana 1.9 2.3 -11.5 1.0 1.7Nebraska 3.1 -0.2 32.6 4.9 4.3Nevada 4.7 -1.0 2.9 3.6 4.2New Hampshire 2.7 -3.1 3.7 5.8 2.8New Jersey 2.1 -9.7 1.0 3.4 2.1New Mexico 9.8 9.8 9.8 9.8 9.8New York 2.7 2.3 2.1 2.1 2.6North Carolina 4.5 - 5.5 - 4.6North Dakota 4.9 1.5 -1.5 2.2 4.5Ohio 2.4 3.8 -2.2 2.5 2.2Oklahoma 1.0 -1.8 13.3 4.7 2.4Oregon 4.0 3.0 3.0 3.0 3.8Pennsylvania 3.5 1.7 3.7 4.3 3.6Rhode Island 2.1 1.6 8.5 4.2 2.3South Carolina 2.4 10.0 11.0 0.8 3.7South Dakota 4.2 5.1 3.1 4.0 4.1Tennessee 1.8 6.2 7.7 -8.6 1.9Texas 9.4 2.7 0.0 3.4 7.6Utah 3.9 -7.5 2.0 6.0 3.6Vermont 0.4 0.0 -4.5 3.9 0.3Virginia 2.0 -1.4 -1.4 2.5 1.7Washington 4.0 -36.5 60.8 7.5 8.9West Virginia 1.3 1.7 0.6 67.9 1.5Wisconsin 0.9 0.1 0.0 -16.2 0.6Wyoming 6.3 -2.0 14.3 2.0 7.1United States 3.5 -4.6 6.1 3.2 3.6
F-7. CHANGES IN EXPENDITURES FROM 2018-19 TO 2019-20
56
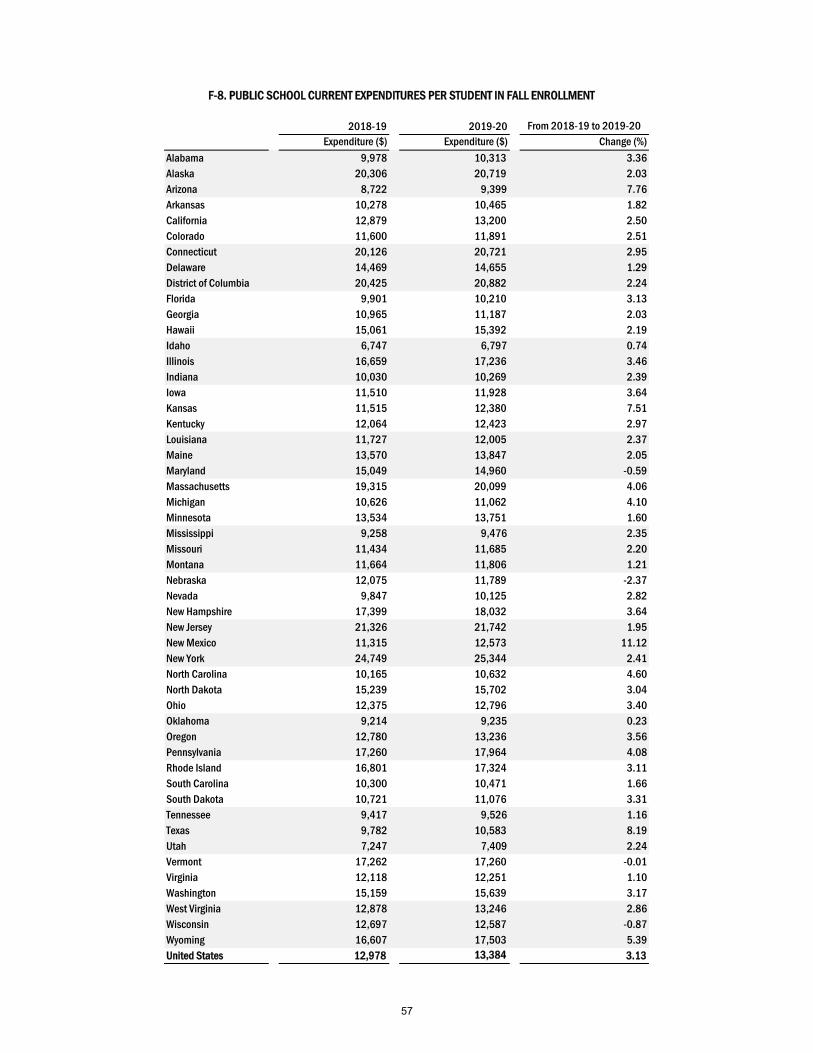
2018-19 2019-20 From 2018-19 to 2019-20Expenditure ($) Expenditure ($) Change (%)
Alabama 9,978 10,313 3.36Alaska 20,306 20,719 2.03Arizona 8,722 9,399 7.76Arkansas 10,278 10,465 1.82California 12,879 13,200 2.50Colorado 11,600 11,891 2.51Connecticut 20,126 20,721 2.95Delaware 14,469 14,655 1.29District of Columbia 20,425 20,882 2.24Florida 9,901 10,210 3.13Georgia 10,965 11,187 2.03Hawaii 15,061 15,392 2.19Idaho 6,747 6,797 0.74Illinois 16,659 17,236 3.46Indiana 10,030 10,269 2.39Iowa 11,510 11,928 3.64Kansas 11,515 12,380 7.51Kentucky 12,064 12,423 2.97Louisiana 11,727 12,005 2.37Maine 13,570 13,847 2.05Maryland 15,049 14,960 -0.59Massachusetts 19,315 20,099 4.06Michigan 10,626 11,062 4.10Minnesota 13,534 13,751 1.60Mississippi 9,258 9,476 2.35Missouri 11,434 11,685 2.20Montana 11,664 11,806 1.21Nebraska 12,075 11,789 -2.37Nevada 9,847 10,125 2.82New Hampshire 17,399 18,032 3.64New Jersey 21,326 21,742 1.95New Mexico 11,315 12,573 11.12New York 24,749 25,344 2.41North Carolina 10,165 10,632 4.60North Dakota 15,239 15,702 3.04Ohio 12,375 12,796 3.40Oklahoma 9,214 9,235 0.23Oregon 12,780 13,236 3.56Pennsylvania 17,260 17,964 4.08Rhode Island 16,801 17,324 3.11South Carolina 10,300 10,471 1.66South Dakota 10,721 11,076 3.31Tennessee 9,417 9,526 1.16Texas 9,782 10,583 8.19Utah 7,247 7,409 2.24Vermont 17,262 17,260 -0.01Virginia 12,118 12,251 1.10Washington 15,159 15,639 3.17West Virginia 12,878 13,246 2.86Wisconsin 12,697 12,587 -0.87Wyoming 16,607 17,503 5.39United States 12,978 13,384 3.13
F-8. PUBLIC SCHOOL CURRENT EXPENDITURES PER STUDENT IN FALL ENROLLMENT
57
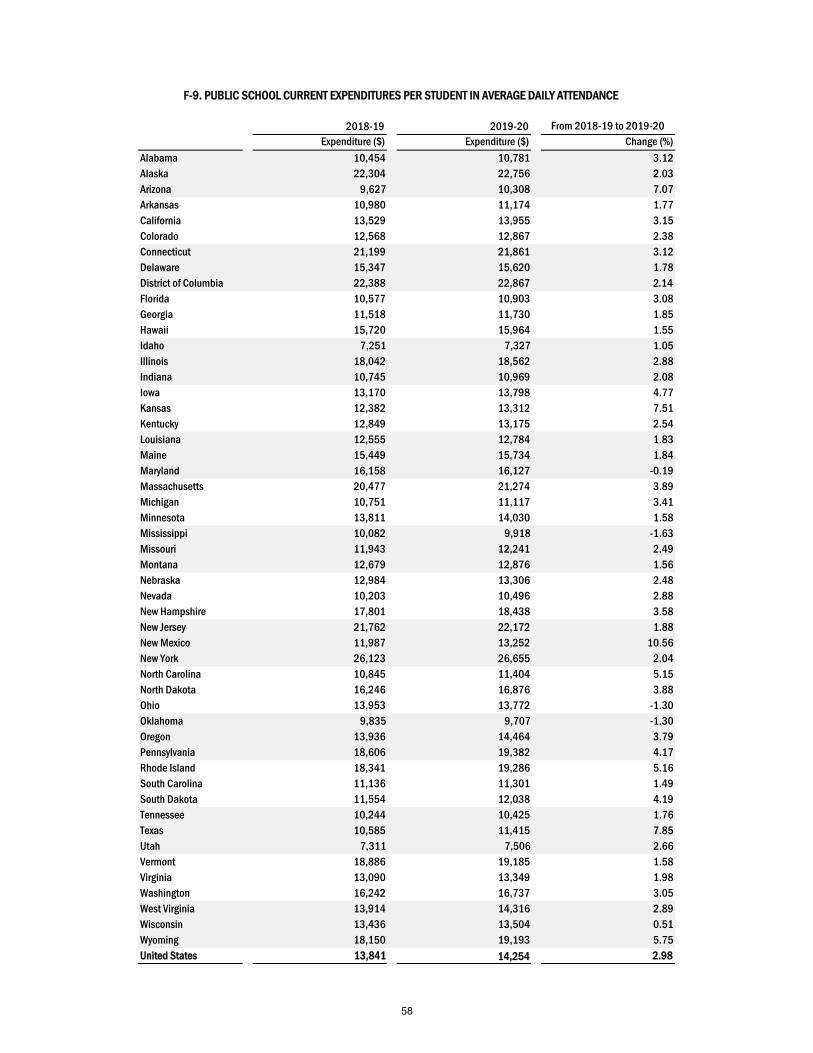
2018-19 2019-20 From 2018-19 to 2019-20Expenditure ($) Expenditure ($) Change (%)
Alabama 10,454 10,781 3.12Alaska 22,304 22,756 2.03Arizona 9,627 10,308 7.07Arkansas 10,980 11,174 1.77California 13,529 13,955 3.15Colorado 12,568 12,867 2.38Connecticut 21,199 21,861 3.12Delaware 15,347 15,620 1.78District of Columbia 22,388 22,867 2.14Florida 10,577 10,903 3.08Georgia 11,518 11,730 1.85Hawaii 15,720 15,964 1.55Idaho 7,251 7,327 1.05Illinois 18,042 18,562 2.88Indiana 10,745 10,969 2.08Iowa 13,170 13,798 4.77Kansas 12,382 13,312 7.51Kentucky 12,849 13,175 2.54Louisiana 12,555 12,784 1.83Maine 15,449 15,734 1.84Maryland 16,158 16,127 -0.19Massachusetts 20,477 21,274 3.89Michigan 10,751 11,117 3.41Minnesota 13,811 14,030 1.58Mississippi 10,082 9,918 -1.63Missouri 11,943 12,241 2.49Montana 12,679 12,876 1.56Nebraska 12,984 13,306 2.48Nevada 10,203 10,496 2.88New Hampshire 17,801 18,438 3.58New Jersey 21,762 22,172 1.88New Mexico 11,987 13,252 10.56New York 26,123 26,655 2.04North Carolina 10,845 11,404 5.15North Dakota 16,246 16,876 3.88Ohio 13,953 13,772 -1.30Oklahoma 9,835 9,707 -1.30Oregon 13,936 14,464 3.79Pennsylvania 18,606 19,382 4.17Rhode Island 18,341 19,286 5.16South Carolina 11,136 11,301 1.49South Dakota 11,554 12,038 4.19Tennessee 10,244 10,425 1.76Texas 10,585 11,415 7.85Utah 7,311 7,506 2.66Vermont 18,886 19,185 1.58Virginia 13,090 13,349 1.98Washington 16,242 16,737 3.05West Virginia 13,914 14,316 2.89Wisconsin 13,436 13,504 0.51Wyoming 18,150 19,193 5.75United States 13,841 14,254 2.98
F-9. PUBLIC SCHOOL CURRENT EXPENDITURES PER STUDENT IN AVERAGE DAILY ATTENDANCE
58
National Trends 2011-20
59
SERIES G - STUDENTS AND FACULTY
G-1. TEN YEAR TREND IN TOTAL NUMBER OF PUBLIC SCHOOL DISTRICTS, SY 2011-2020
G-2. TEN YEAR TREND IN PUBLIC SCHOOL FALL ENROLLMENT, SY 2011-2020
G-3. TEN YEAR TREND IN PUBLIC SCHOOL AVERAGE DAILY ATTENDANCE, SY 2011-2020
G-4. TEN YEAR TREND IN NUMBER OF PUBLIC HIGH SCHOOL GRADUATES, SY 2011-2020
G-5. TEN YEAR TREND IN TOTAL TEACHERS AND INSTRUCTIONAL STAFF, SY 2011-2020
G-6. TEN YEAR TREND IN AVERAGE SALARY OF TEACHERS AND INSTRUCTIONAL STAFF, SY 2011-2020
60
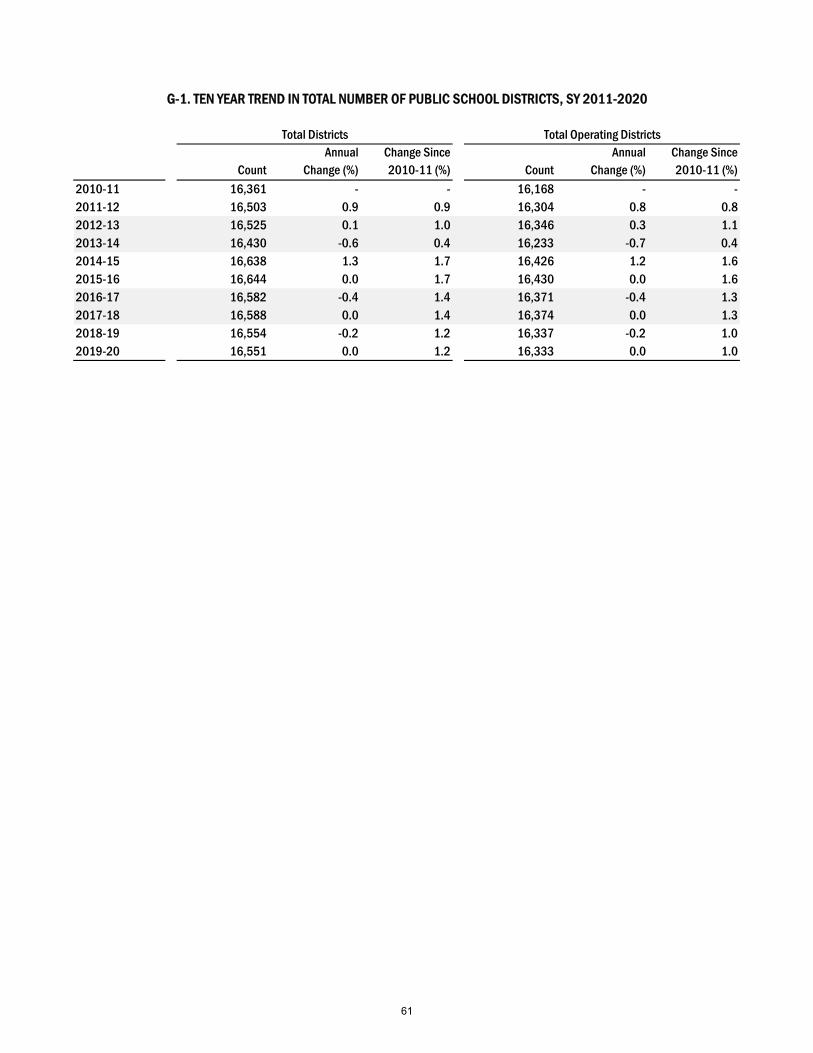
CountAnnual
Change (%)Change Since 2010-11 (%) Count
Annual Change (%)
Change Since 2010-11 (%)
2010-11 16,361 - - 16,168 - -2011-12 16,503 0.9 0.9 16,304 0.8 0.82012-13 16,525 0.1 1.0 16,346 0.3 1.12013-14 16,430 -0.6 0.4 16,233 -0.7 0.42014-15 16,638 1.3 1.7 16,426 1.2 1.62015-16 16,644 0.0 1.7 16,430 0.0 1.62016-17 16,582 -0.4 1.4 16,371 -0.4 1.32017-18 16,588 0.0 1.4 16,374 0.0 1.32018-19 16,554 -0.2 1.2 16,337 -0.2 1.02019-20 16,551 0.0 1.2 16,333 0.0 1.0
Total Districts Total Operating Districts
G-1. TEN YEAR TREND IN TOTAL NUMBER OF PUBLIC SCHOOL DISTRICTS, SY 2011-2020
61
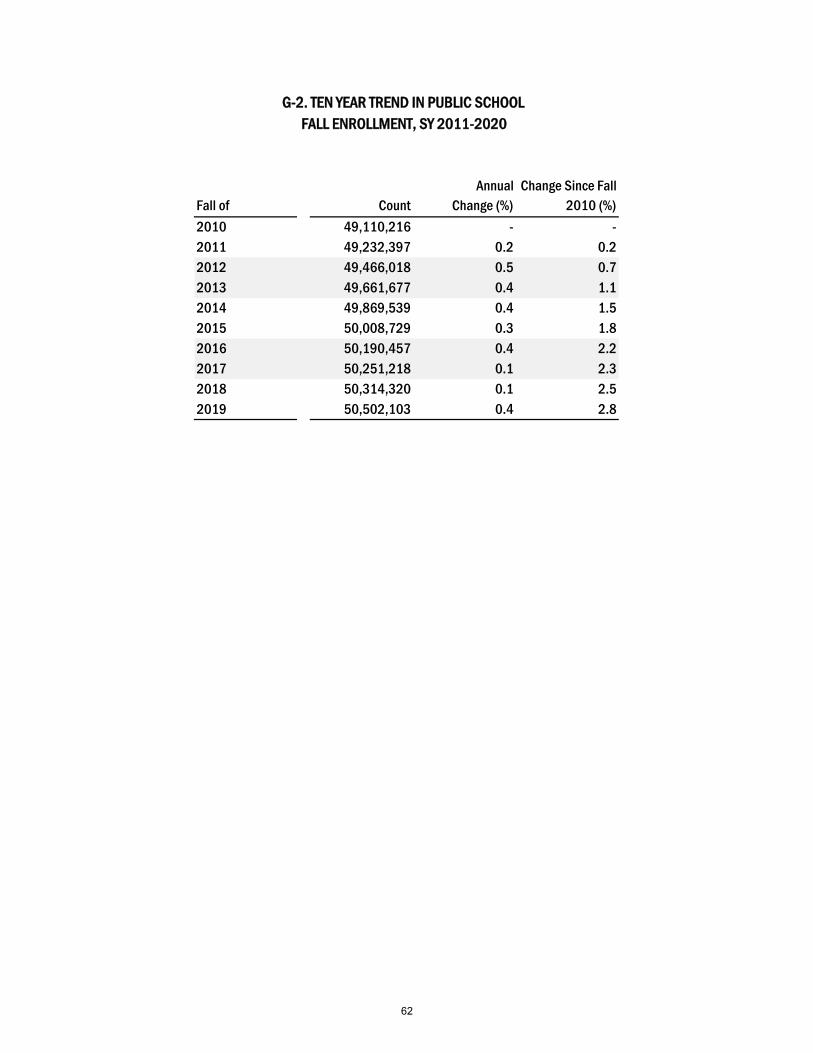
Fall of CountAnnual
Change (%)Change Since Fall
2010 (%)
2010 49,110,216 - -2011 49,232,397 0.2 0.22012 49,466,018 0.5 0.72013 49,661,677 0.4 1.12014 49,869,539 0.4 1.52015 50,008,729 0.3 1.82016 50,190,457 0.4 2.22017 50,251,218 0.1 2.32018 50,314,320 0.1 2.52019 50,502,103 0.4 2.8
G-2. TEN YEAR TREND IN PUBLIC SCHOOL FALL ENROLLMENT, SY 2011-2020
62
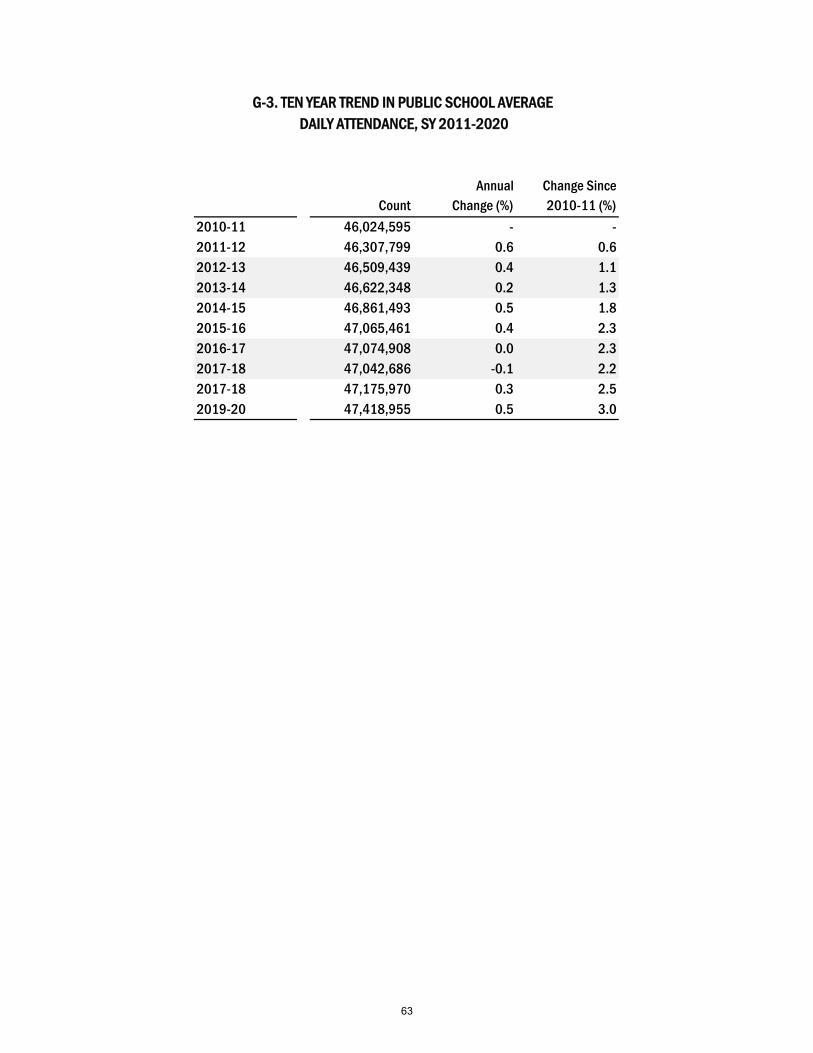
CountAnnual
Change (%)Change Since 2010-11 (%)
2010-11 46,024,595 - -2011-12 46,307,799 0.6 0.62012-13 46,509,439 0.4 1.12013-14 46,622,348 0.2 1.32014-15 46,861,493 0.5 1.82015-16 47,065,461 0.4 2.32016-17 47,074,908 0.0 2.32017-18 47,042,686 -0.1 2.22017-18 47,175,970 0.3 2.52019-20 47,418,955 0.5 3.0
G-3. TEN YEAR TREND IN PUBLIC SCHOOL AVERAGE DAILY ATTENDANCE, SY 2011-2020
63
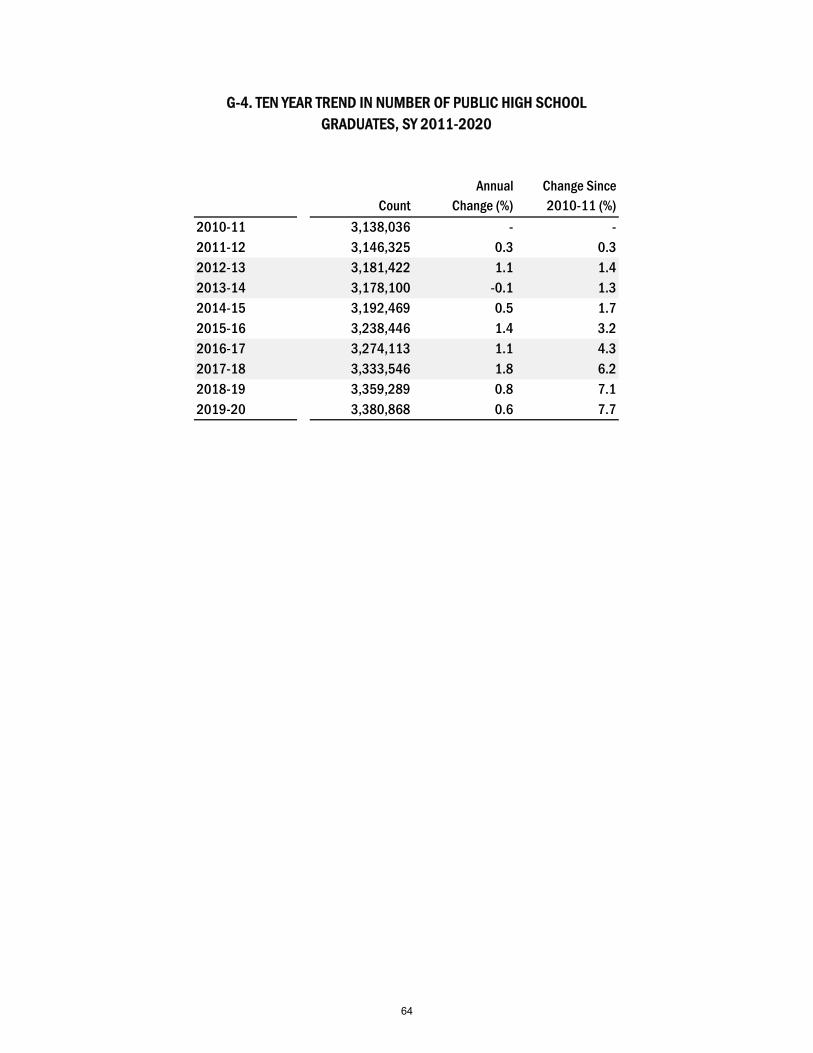
CountAnnual
Change (%)Change Since 2010-11 (%)
2010-11 3,138,036 - -2011-12 3,146,325 0.3 0.32012-13 3,181,422 1.1 1.42013-14 3,178,100 -0.1 1.32014-15 3,192,469 0.5 1.72015-16 3,238,446 1.4 3.22016-17 3,274,113 1.1 4.32017-18 3,333,546 1.8 6.22018-19 3,359,289 0.8 7.12019-20 3,380,868 0.6 7.7
G-4. TEN YEAR TREND IN NUMBER OF PUBLIC HIGH SCHOOL GRADUATES, SY 2011-2020
64
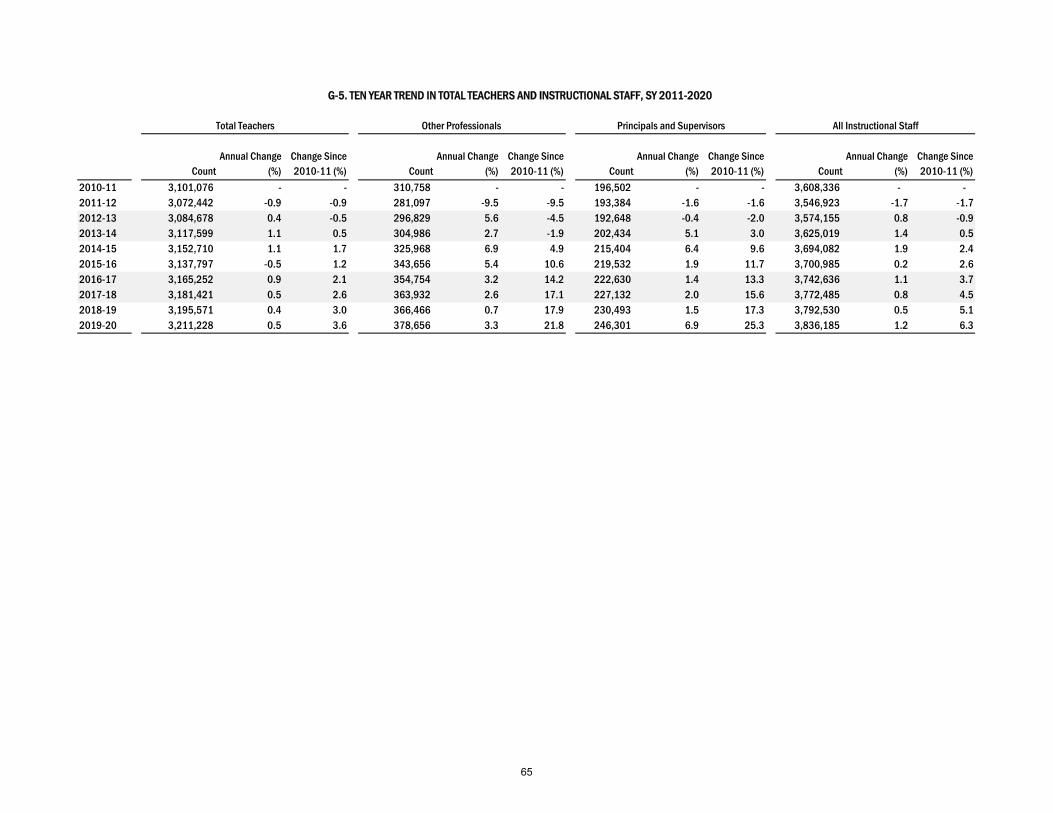
CountAnnual Change
(%)Change Since 2010-11 (%) Count
Annual Change (%)
Change Since 2010-11 (%) Count
Annual Change (%)
Change Since 2010-11 (%) Count
Annual Change (%)
Change Since 2010-11 (%)
2010-11 3,101,076 - - 310,758 - - 196,502 - - 3,608,336 - -2011-12 3,072,442 -0.9 -0.9 281,097 -9.5 -9.5 193,384 -1.6 -1.6 3,546,923 -1.7 -1.72012-13 3,084,678 0.4 -0.5 296,829 5.6 -4.5 192,648 -0.4 -2.0 3,574,155 0.8 -0.92013-14 3,117,599 1.1 0.5 304,986 2.7 -1.9 202,434 5.1 3.0 3,625,019 1.4 0.52014-15 3,152,710 1.1 1.7 325,968 6.9 4.9 215,404 6.4 9.6 3,694,082 1.9 2.42015-16 3,137,797 -0.5 1.2 343,656 5.4 10.6 219,532 1.9 11.7 3,700,985 0.2 2.62016-17 3,165,252 0.9 2.1 354,754 3.2 14.2 222,630 1.4 13.3 3,742,636 1.1 3.72017-18 3,181,421 0.5 2.6 363,932 2.6 17.1 227,132 2.0 15.6 3,772,485 0.8 4.52018-19 3,195,571 0.4 3.0 366,466 0.7 17.9 230,493 1.5 17.3 3,792,530 0.5 5.12019-20 3,211,228 0.5 3.6 378,656 3.3 21.8 246,301 6.9 25.3 3,836,185 1.2 6.3
Total Teachers Other Professionals Principals and Supervisors All Instructional Staff
G-5. TEN YEAR TREND IN TOTAL TEACHERS AND INSTRUCTIONAL STAFF, SY 2011-2020
65
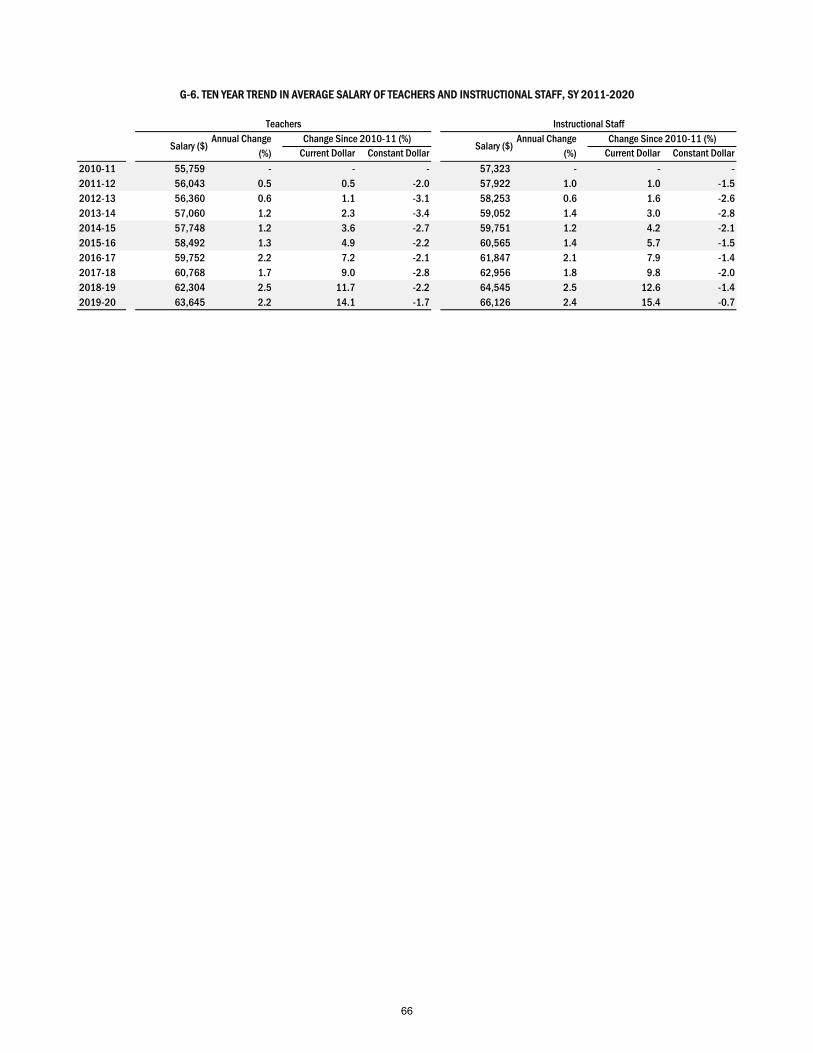
Current Dollar Constant Dollar Current Dollar Constant Dollar
2010-11 55,759 - - - 57,323 - - -2011-12 56,043 0.5 0.5 -2.0 57,922 1.0 1.0 -1.52012-13 56,360 0.6 1.1 -3.1 58,253 0.6 1.6 -2.62013-14 57,060 1.2 2.3 -3.4 59,052 1.4 3.0 -2.82014-15 57,748 1.2 3.6 -2.7 59,751 1.2 4.2 -2.12015-16 58,492 1.3 4.9 -2.2 60,565 1.4 5.7 -1.52016-17 59,752 2.2 7.2 -2.1 61,847 2.1 7.9 -1.42017-18 60,768 1.7 9.0 -2.8 62,956 1.8 9.8 -2.02018-19 62,304 2.5 11.7 -2.2 64,545 2.5 12.6 -1.42019-20 63,645 2.2 14.1 -1.7 66,126 2.4 15.4 -0.7
Change Since 2010-11 (%)Teachers Instructional Staff
G-6. TEN YEAR TREND IN AVERAGE SALARY OF TEACHERS AND INSTRUCTIONAL STAFF, SY 2011-2020
Change Since 2010-11 (%)Salary ($)
Annual Change (%)
Salary ($)Annual Change
(%)
66
SERIES H - SCHOOL REVENUES AND EXPENDITURES
H-1. TEN YEAR TREND IN RECEIPTS FOR PUBLIC SCHOOLS ($ THOUSANDS), SY 2011-2020
H-2. CHANGES IN RECEIPTS BY SOURCE FOR PUBLIC SCHOOLS SINCE SY 2011
H-3. TEN YEAR TREND IN REVENUE BY SOURCE AS A PERCENTAGE OF TOTAL REVENUE RECEIPTS, SY 2011-2020
H-4. TEN YEAR TREND IN EXPENDITURES FOR PUBLIC SCHOOLS ($ THOUSANDS), SY 2011-2020
H-5. CHANGES IN EXPENDITURES FOR PUBLIC SCHOOLS SINCE SY 2011
H-6. TEN YEAR TREND IN CURRENT EXPENDITURES PER STUDENT IN FALL ENROLLMENT, SY 2011-2020
H-7. TEN YEAR TREND IN CURRENT EXPENDITURES PER STUDENT IN AVERAGE DAILY ATTENDANCE, SY 2011-2020
67
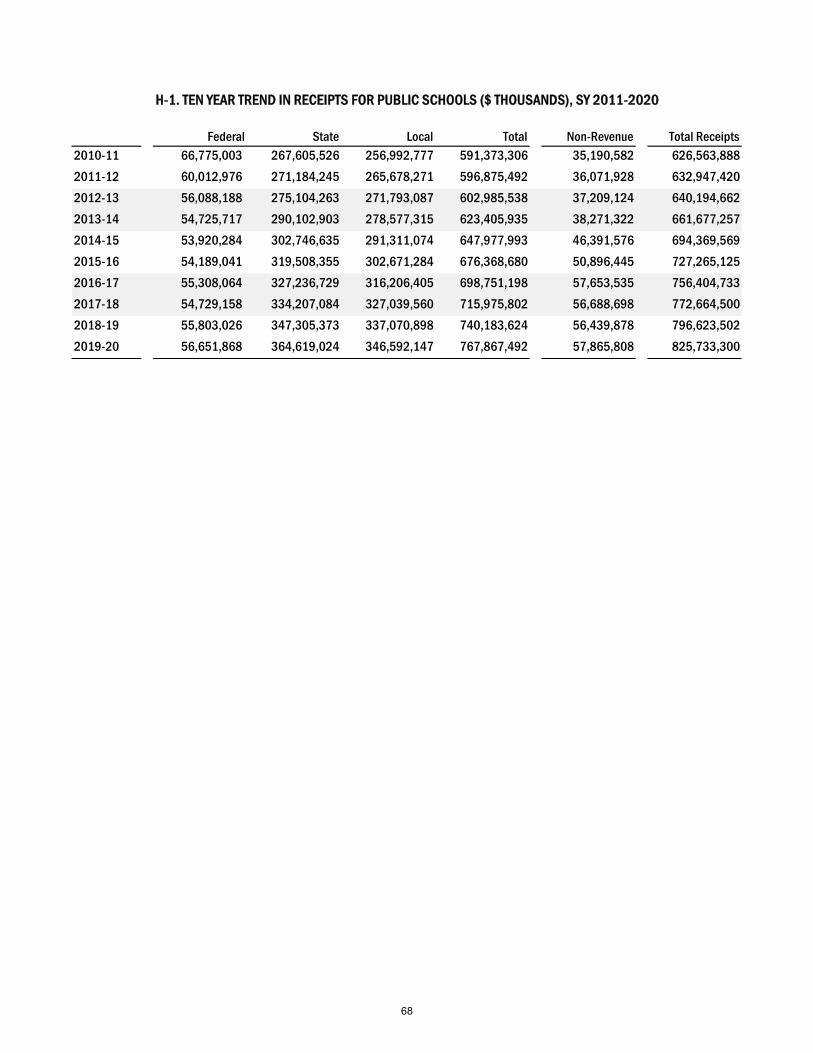
Federal State Local Total Total Receipts2010-11 66,775,003 267,605,526 256,992,777 591,373,306 35,190,582 626,563,888
2011-12 60,012,976 271,184,245 265,678,271 596,875,492 36,071,928 632,947,420
2012-13 56,088,188 275,104,263 271,793,087 602,985,538 37,209,124 640,194,662
2013-14 54,725,717 290,102,903 278,577,315 623,405,935 38,271,322 661,677,257
2014-15 53,920,284 302,746,635 291,311,074 647,977,993 46,391,576 694,369,569
2015-16 54,189,041 319,508,355 302,671,284 676,368,680 50,896,445 727,265,125
2016-17 55,308,064 327,236,729 316,206,405 698,751,198 57,653,535 756,404,733
2017-18 54,729,158 334,207,084 327,039,560 715,975,802 56,688,698 772,664,500
2018-19 55,803,026 347,305,373 337,070,898 740,183,624 56,439,878 796,623,502
2019-20 56,651,868 364,619,024 346,592,147 767,867,492 57,865,808 825,733,300
Non-Revenue
H-1. TEN YEAR TREND IN RECEIPTS FOR PUBLIC SCHOOLS ($ THOUSANDS), SY 2011-2020
68
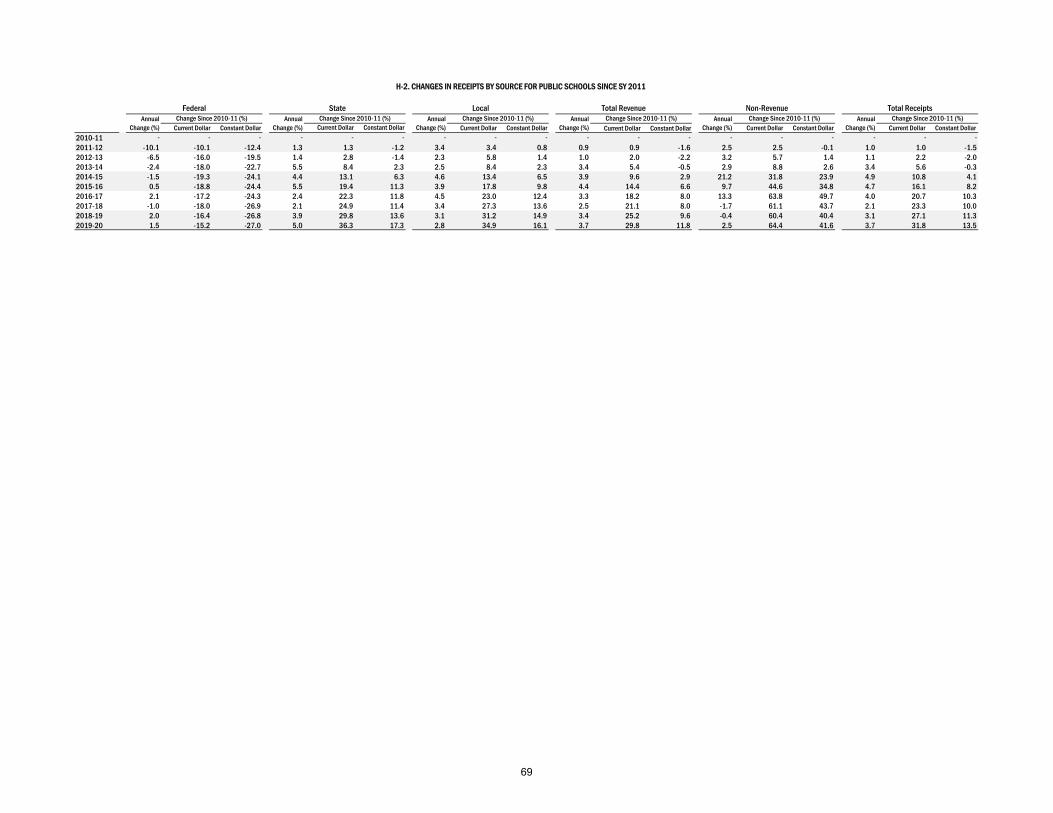
Current Dollar Constant Dollar Current Dollar Constant Dollar Current Dollar Constant Dollar Current Dollar Constant Dollar Current Dollar Constant Dollar Current Dollar Constant Dollar2010-11 - - - - - - - - - - - - - - - - - -
2011-12 -10.1 -10.1 -12.4 1.3 1.3 -1.2 3.4 3.4 0.8 0.9 0.9 -1.6 2.5 2.5 -0.1 1.0 1.0 -1.52012-13 -6.5 -16.0 -19.5 1.4 2.8 -1.4 2.3 5.8 1.4 1.0 2.0 -2.2 3.2 5.7 1.4 1.1 2.2 -2.02013-14 -2.4 -18.0 -22.7 5.5 8.4 2.3 2.5 8.4 2.3 3.4 5.4 -0.5 2.9 8.8 2.6 3.4 5.6 -0.32014-15 -1.5 -19.3 -24.1 4.4 13.1 6.3 4.6 13.4 6.5 3.9 9.6 2.9 21.2 31.8 23.9 4.9 10.8 4.12015-16 0.5 -18.8 -24.4 5.5 19.4 11.3 3.9 17.8 9.8 4.4 14.4 6.6 9.7 44.6 34.8 4.7 16.1 8.22016-17 2.1 -17.2 -24.3 2.4 22.3 11.8 4.5 23.0 12.4 3.3 18.2 8.0 13.3 63.8 49.7 4.0 20.7 10.32017-18 -1.0 -18.0 -26.9 2.1 24.9 11.4 3.4 27.3 13.6 2.5 21.1 8.0 -1.7 61.1 43.7 2.1 23.3 10.02018-19 2.0 -16.4 -26.8 3.9 29.8 13.6 3.1 31.2 14.9 3.4 25.2 9.6 -0.4 60.4 40.4 3.1 27.1 11.32019-20 1.5 -15.2 -27.0 5.0 36.3 17.3 2.8 34.9 16.1 3.7 29.8 11.8 2.5 64.4 41.6 3.7 31.8 13.5
H-2. CHANGES IN RECEIPTS BY SOURCE FOR PUBLIC SCHOOLS SINCE SY 2011
Federal StateAnnual
Change (%)Change Since 2010-11 (%) Annual
Change (%)Change Since 2010-11 (%)
LocalAnnual
Change (%)Change Since 2010-11 (%)
Total RevenueAnnual
Change (%)Change Since 2010-11 (%)
Non-RevenueAnnual
Change (%)Change Since 2010-11 (%)
Total ReceiptsAnnual
Change (%)Change Since 2010-11 (%)
69
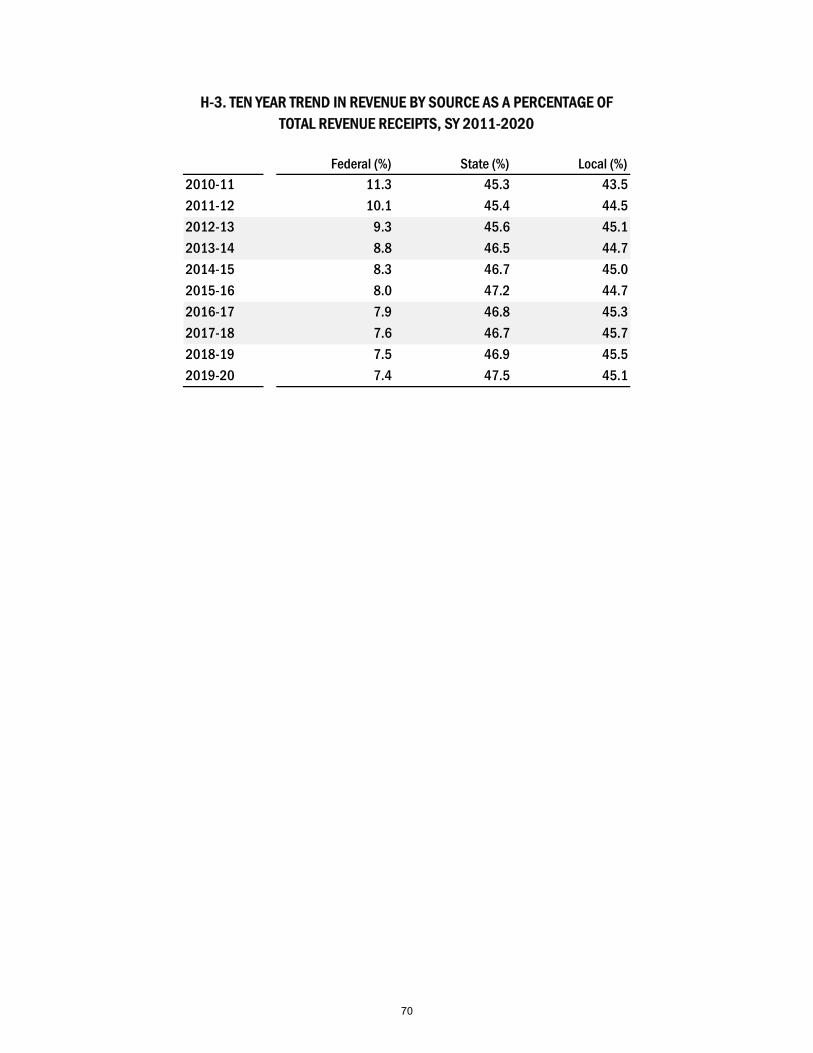
Federal (%) State (%) Local (%)2010-11 11.3 45.3 43.5
2011-12 10.1 45.4 44.5
2012-13 9.3 45.6 45.1
2013-14 8.8 46.5 44.7
2014-15 8.3 46.7 45.0
2015-16 8.0 47.2 44.7
2016-17 7.9 46.8 45.3
2017-18 7.6 46.7 45.7
2018-19 7.5 46.9 45.5
2019-20 7.4 47.5 45.1
H-3. TEN YEAR TREND IN REVENUE BY SOURCE AS A PERCENTAGE OF TOTAL REVENUE RECEIPTS, SY 2011-2020
70
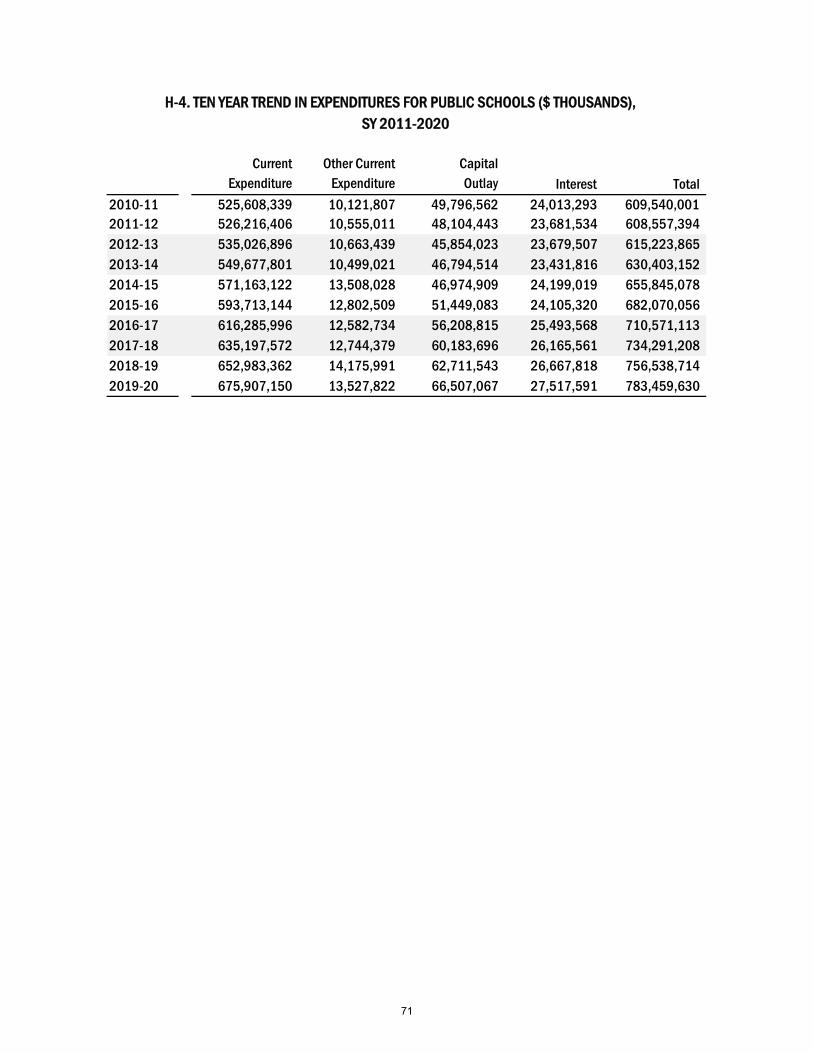
Current Expenditure
Other Current Expenditure
Capital Outlay Interest Total
2010-11 525,608,339 10,121,807 49,796,562 24,013,293 609,540,001 2011-12 526,216,406 10,555,011 48,104,443 23,681,534 608,557,394 2012-13 535,026,896 10,663,439 45,854,023 23,679,507 615,223,865 2013-14 549,677,801 10,499,021 46,794,514 23,431,816 630,403,152 2014-15 571,163,122 13,508,028 46,974,909 24,199,019 655,845,078 2015-16 593,713,144 12,802,509 51,449,083 24,105,320 682,070,056 2016-17 616,285,996 12,582,734 56,208,815 25,493,568 710,571,113 2017-18 635,197,572 12,744,379 60,183,696 26,165,561 734,291,208 2018-19 652,983,362 14,175,991 62,711,543 26,667,818 756,538,714 2019-20 675,907,150 13,527,822 66,507,067 27,517,591 783,459,630
H-4. TEN YEAR TREND IN EXPENDITURES FOR PUBLIC SCHOOLS ($ THOUSANDS), SY 2011-2020
71
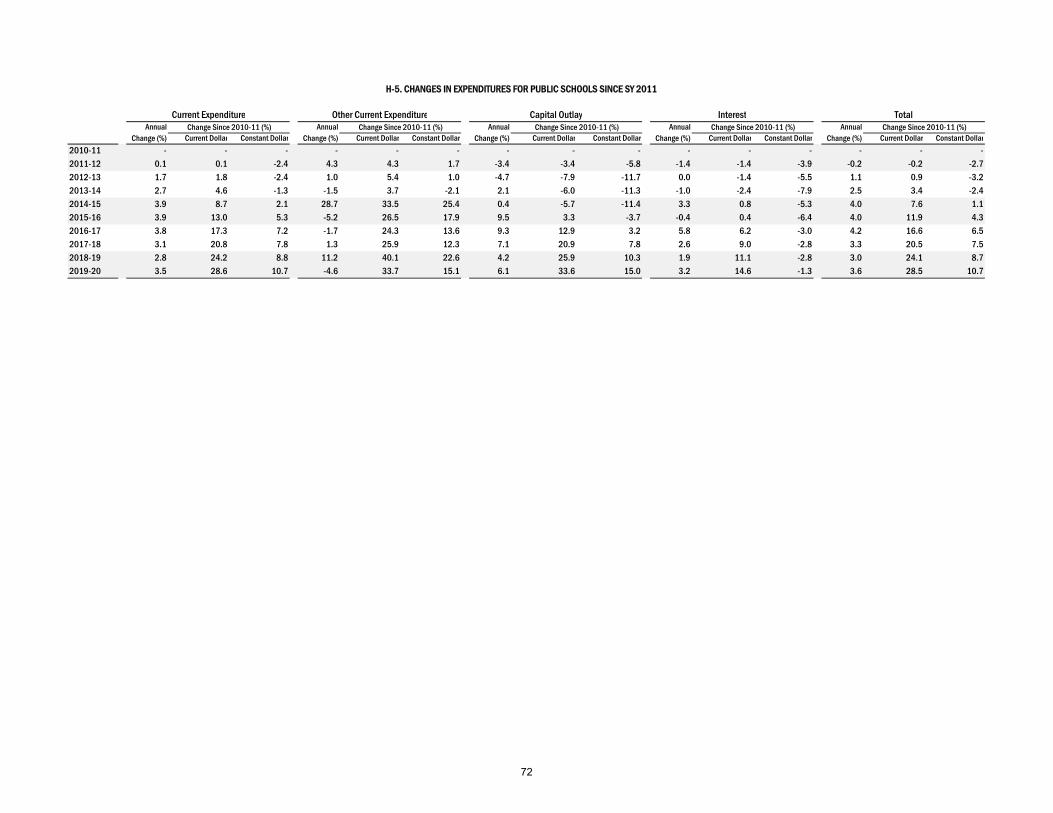
Current Dollar Constant Dollar Current Dollar Constant Dollar Current Dollar Constant Dollar Current Dollar Constant Dollar Current Dollar Constant Dollar
2010-11 - - - - - - - - - - - - - - -
2011-12 0.1 0.1 -2.4 4.3 4.3 1.7 -3.4 -3.4 -5.8 -1.4 -1.4 -3.9 -0.2 -0.2 -2.7
2012-13 1.7 1.8 -2.4 1.0 5.4 1.0 -4.7 -7.9 -11.7 0.0 -1.4 -5.5 1.1 0.9 -3.2
2013-14 2.7 4.6 -1.3 -1.5 3.7 -2.1 2.1 -6.0 -11.3 -1.0 -2.4 -7.9 2.5 3.4 -2.4
2014-15 3.9 8.7 2.1 28.7 33.5 25.4 0.4 -5.7 -11.4 3.3 0.8 -5.3 4.0 7.6 1.1
2015-16 3.9 13.0 5.3 -5.2 26.5 17.9 9.5 3.3 -3.7 -0.4 0.4 -6.4 4.0 11.9 4.3
2016-17 3.8 17.3 7.2 -1.7 24.3 13.6 9.3 12.9 3.2 5.8 6.2 -3.0 4.2 16.6 6.5
2017-18 3.1 20.8 7.8 1.3 25.9 12.3 7.1 20.9 7.8 2.6 9.0 -2.8 3.3 20.5 7.5
2018-19 2.8 24.2 8.8 11.2 40.1 22.6 4.2 25.9 10.3 1.9 11.1 -2.8 3.0 24.1 8.7
2019-20 3.5 28.6 10.7 -4.6 33.7 15.1 6.1 33.6 15.0 3.2 14.6 -1.3 3.6 28.5 10.7
Annual Change (%)
Change Since 2010-11 (%)Annual Change (%)
Change Since 2010-11 (%) Annual Change (%)
Change Since 2010-11 (%) Annual Change (%)
Change Since 2010-11 (%)Annual Change (%)
Change Since 2010-11 (%)
H-5. CHANGES IN EXPENDITURES FOR PUBLIC SCHOOLS SINCE SY 2011
Current Expenditure Other Current Expenditure Interest TotalCapital Outlay
72
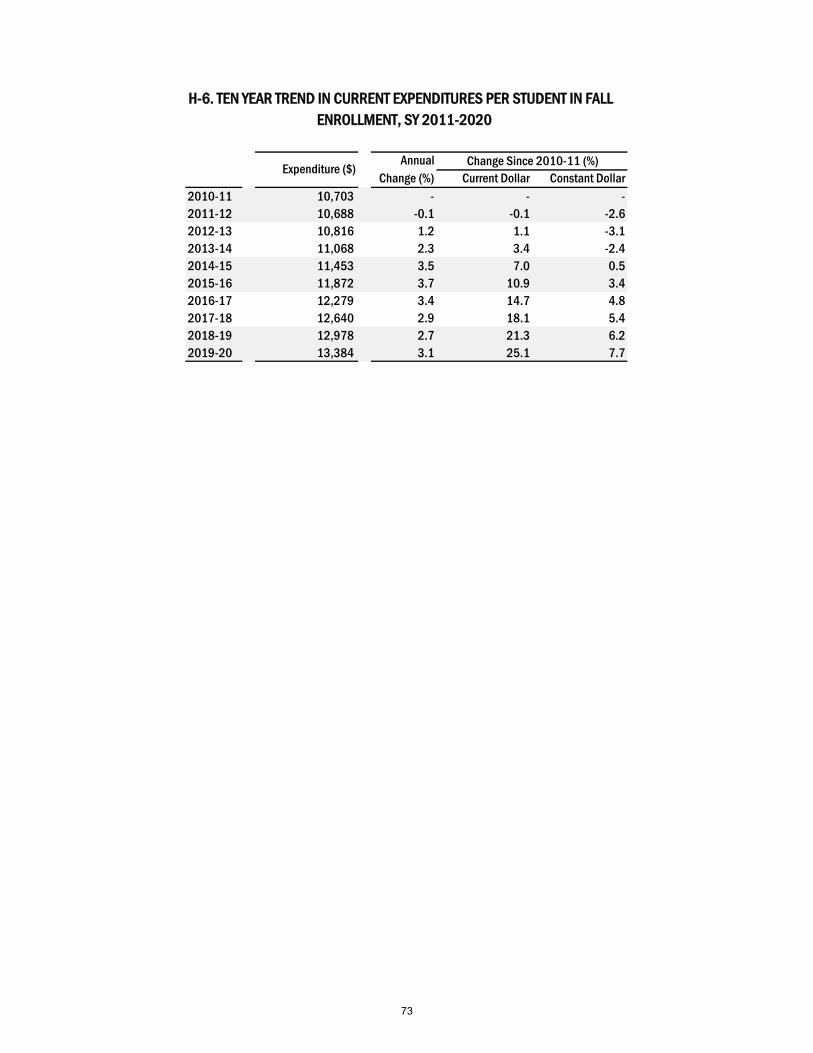
Current Dollar Constant Dollar2010-11 10,703 - - -2011-12 10,688 -0.1 -0.1 -2.62012-13 10,816 1.2 1.1 -3.12013-14 11,068 2.3 3.4 -2.42014-15 11,453 3.5 7.0 0.52015-16 11,872 3.7 10.9 3.42016-17 12,279 3.4 14.7 4.82017-18 12,640 2.9 18.1 5.42018-19 12,978 2.7 21.3 6.22019-20 13,384 3.1 25.1 7.7
Expenditure ($)Annual
Change (%)Change Since 2010-11 (%)
H-6. TEN YEAR TREND IN CURRENT EXPENDITURES PER STUDENT IN FALL ENROLLMENT, SY 2011-2020
73
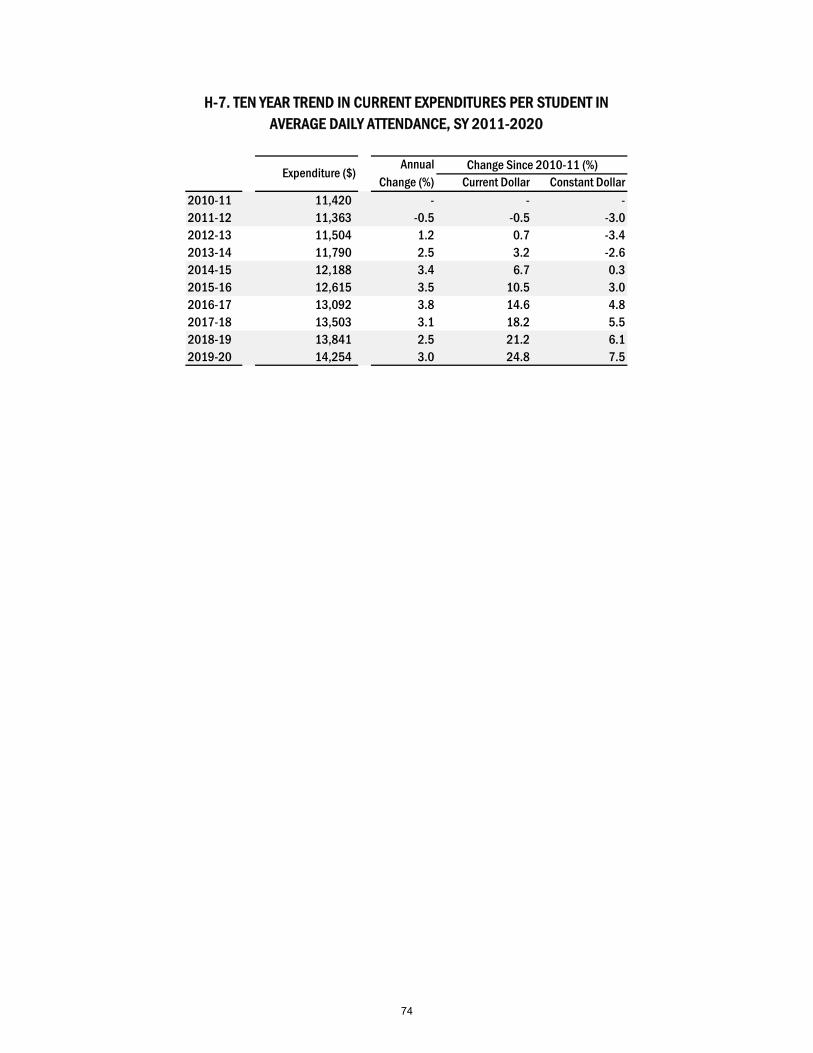
Current Dollar Constant Dollar2010-11 11,420 - - -2011-12 11,363 -0.5 -0.5 -3.02012-13 11,504 1.2 0.7 -3.42013-14 11,790 2.5 3.2 -2.62014-15 12,188 3.4 6.7 0.32015-16 12,615 3.5 10.5 3.02016-17 13,092 3.8 14.6 4.82017-18 13,503 3.1 18.2 5.52018-19 13,841 2.5 21.2 6.12019-20 14,254 3.0 24.8 7.5
H-7. TEN YEAR TREND IN CURRENT EXPENDITURES PER STUDENT IN AVERAGE DAILY ATTENDANCE, SY 2011-2020
Expenditure ($)Annual
Change (%)Change Since 2010-11 (%)
74
Glossary
Average Daily Attendance (ADA): The aggregate attendance of a school during a reporting period divided
by the number of days school is in session during this period. Only days on which the pupils are under the
guidance and direction of teachers should be considered as days in session. The average daily attendance
for groups of schools having varying lengths of terms is the sum of the average daily attendances obtained
for the individual schools.
Average Salary: The arithmetic mean of the salaries of the group described. This figure is the average
gross salary before deductions for Social Security, retirement, health insurance, and so on.
Capital Outlay: An expenditure that results in the acquisition of fixed assets or additions to fixed assets,
which are presumed to have benefits for more than one year. It is an expenditure for land or existing
buildings, improvements of grounds, construction of buildings, additions to buildings, remodeling of
buildings, or initial, additional, and replacement equipment.
Classroom Teacher: A staff member assigned the professional activities of instructing pupils in self-
contained classes or courses or in classroom situations. The number of classroom teachers is usually
expressed in full-time equivalents.
Current Expenditures: The expenditures for operating local public schools, excluding capital outlay and
interest on school debt. These expenditures include such items as salaries for school personnel, fixed
charges, student transportation, school books and materials, and energy costs.
Current Expenditures for Other Programs: Current expenses for summer schools, adult education, post-
high-school vocational education, personnel retraining, and community services; services to private school
pupils, community centers, recreational activities, and public libraries, and so on, when operated by local
school districts and not part of regular public elementary and secondary day-school programs.
Debt: The major portion of all state and local government debt constitutes long-term indebtedness. A
substantial portion of such long-term debt is nonguaranteed debt (i.e., obligations payable solely from
pledged earnings of specific activities or facilities, from special assessments, or from specific nonproperty
taxes).
Education: The provision or support of schools and other education facilities and services.
Elementary School: A school classified as elementary by state and local practice and composed of any
span of grades not above grade 8. A preschool or kindergarten school is included under this heading only
if it is an integral part of an elementary school or a regularly established school system.
Enrollment: A cumulative count of the number of pupils registered during the entire school year. New
entrants are added, but those leaving are not subtracted.
Expenditures: All amounts of money paid out by a government—net of recoveries and other correcting
transactions—other than for retirement of debt, investment in securities, extension of credit, or as agency
transactions. Expenditures include only external transactions of a government and exclude noncash
75
transactions, such as the provision of perquisites or other payments in kind. Aggregates for groups of
governments exclude intergovernmental transactions among the governments involved.
Fall Enrollment: The count of the pupils registered in the fall of the school year, usually in October.
Full-Time Equivalent Employment: A computed statistic representing the number of fulltime employees
that could have been employed if the reported number of hours worked by part-time employees had been
worked by full-time employees. This statistic is calculated separately for each function of a government by
dividing the “part-time hours paid” by the standard number of hours for full-time employees in the particular
government and then adding the resulting quotient to the number of full-time employees.
High School Graduate: A person who receives formal recognition from school authorities for having
completed the prescribed high school course of study; excludes equivalency certificates.
Instructional Staff: Full-time equivalent number of positions, not the number of different individuals
occupying the positions during the school year. In local schools, instructional staff includes all public
elementary and secondary (junior and senior high) day school positions that are in the nature of teaching or
in the improvement of the teaching-learning situation. Includes consultants or supervisors of instruction,
principals, teachers, guidance personnel, librarians, psychological personnel, and other instructional staff.
Excludes administrative staff, attendance personnel, health services personnel, clerical personnel, and
junior college staff. In institutions of higher education, includes those engaged in teaching and related
academic research in junior colleges, colleges, and universities, including those in hospitals, agricultural
experiment stations, and farms.
Interest on Debt: Annual expenditures to pay interest only on long-term debt.
K‒12: Kindergarten through 12th grade. Used for convenience of abbreviation in the Rankings tables;
comprises “Elementary School” and “Secondary School” as defined in this glossary. Thus, as is the case
for “Elementary School,” K‒12 here may include preschool and/or kindergarten but only if it is an integral
part of an elementary school or a regularly established school system.
Noninstructional Staff: In local schools includes administrative and clerical personnel, plant operation
and maintenance employees, bus drivers, and lunchroom, health, and recreational personnel engaged by
school systems. In institutions of higher education includes cafeteria, clerical, and custodial workers in
colleges and universities, hospitals, agricultural experiment stations, and farms.
Nonoperating School District: A school district that does not provide direct instruction for pupils but
contracts with or pays tuition to other districts.
Nonrevenue Receipts: The amount received by local education agencies from the sale of bonds and real
property and equipment, loans, and proceeds from insurance adjustments.
Operating School District: A school district that directly provides instruction for pupils by hiring its own
staff.
Revenue: Revenue receipts for public school purposes derive from three main sources:
76
Local. Local, intermediate, and other sources include all funds for direct expenditures by local and
intermediate districts for school services, for the operation of intermediate departments of
education, for employer contributions to retirement systems and/or Social Security on behalf of
public school employees, for the purchase of materials for distribution of local school districts, and
so on. Includes net receipts from revolving funds or clearing accounts only when such funds are
available for general expenditure by the local board of education. Includes gifts and tuition and fees
received from patrons.
State. Revenue receipts from state sources include all funds for the operation of the state department
of education, for state (employer) contributions to retirement systems and/or Social Security on
behalf of school employees, for grants in aid to intermediate and local school districts for school
purposes (including funds available from state bond issues for such grants and the costs of
textbooks, buses, supplies, etc., purchased by the state for distribution to local school districts), for
the payment of interest on state bonds issued to provide grants to local school districts, and all other
state revenue for public school purposes. Money collected by the state as an agent of a lesser unit
and turned over in like amounts to that unit is not included.
Federal. Revenue receipts from federal sources include money distributed from the federal treasury
either directly to local school districts or through the state and county, including grants for
vocational education, for aid to federally affected areas, for school lunch and milk programs, for
educating Native Americans in local public schools, and money derived from federal forest reserves
and federal oil royalties.
School District: An education agency at the local level that exists primarily to operate public schools or to
contract for public school services. Synonyms are “local basic administrative unit” and “local education
agency.”
Secondary School: A school comprising any span of grades beginning with the next grade following an
elementary or middle school (usually 7, 8, or 9) and ending with or below grade 12. Both junior high schools
and senior high schools are included.
Student-Teacher Ratio: The number of students in the fall enrollment divided by the number of classroom
teachers.
Total Expenditures: Includes all current expenditures, capital outlay, and interest on the school debt.
Total Revenue Receipts: Includes all revenue receipts available for expenditure for current expenses,
capital outlay, and debt service for public schools, including all appropriations from general funds of
federal, state, county, and local governments; receipts from taxes levied for school purposes; income from
permanent school funds and endowments; income from leases of school lands; interest on bank deposits;
tuition; gifts; and so on. Amounts that increase the school indebtedness or that represent exchange of school
property for money are excluded.
77
State Notes for
Rankings and Estimates
The NEA recognizes that each state’s department of education (DOE) has its own system of accounting
and reporting for state executive and legislative branch purposes. As a result, it is not always possible to
obtain completely comparable data for every state. For this reason, NEA Research encourages each state
DOE to include any clarifying information that is necessary for a proper interpretation of the data supplied.
In response, state education departments have provided clarifying and explanatory information. NEA
Research has calculated salary estimates using American Community Survey data for the states that have
not reported such data for some years.
CALIFORNIA: California’s data is derived from the annual report Salary and Benefits Schedule for the
Certificated Bargaining Unit (Form J-90). Participation in the annual survey used to compile this
information is voluntary and thus there is less than 100 percent reporting of all school districts and county
offices. Charter schools are not part of this survey. California’s data reflects the average salary that is paid
to an employee on the certificated salary schedule. The average salary is determined by dividing the total
salary schedule cost by the total certificated full-time equivalent (FTE) employees that are paid on the salary
schedule. This may include certificated employees such as nurses, librarians, and counselors in addition to
teachers. The average represents scheduled salaries only and does not include salaries for extended year,
bonuses for special accomplishments or payment for extra-curricular services such as coaching, drama, or
music. Bonuses for master’s or doctorate degrees are included only if the amounts are an integrated
characteristic of a salary schedule column.
COLORADO: The number of districts now includes boards of cooperative education services (BOCES).
The graduate count was updated to include all students graduating each year, regardless of their anticipated
graduation year.
CONNECTICUT: Salary estimates have been calculated from American Community Survey for school
years since 2016‒17.
DISTRICT OF COLUMBIA: Salary estimates have been calculated from American Community Survey
for school years since 2013‒14.
ILLINOIS: Salary estimates have been calculated from American Community Survey for school years
since 2014‒15.
MISSOURI: School district count includes charter schools in Kansas City and St. Louis.
NEVADA: Nevada collects and reports average daily attendance rates, not the numbers. Hence, reported
figures are NEA estimates.
NEW YORK: New York City districts are reported as one district. The New York Department of Education
does not report Average Daily Attendance; hence, NEA estimates are used.
78

SOUTH DAKOTA: The contracted staff at Abbot House, Ombudsman, and Mitchell High School
technical education classes were included in these figures.
79