
Ranking the States by Fiscal Condition, 2016 Edition
168
Ranking the States by Fiscal Condition 2016 Edition Eileen Norcross and Olivia Gonzalez MERCATUS RESEARCH
-
Upload
hoangnguyet -
Category
Documents
-
view
214 -
download
0
Transcript of Ranking the States by Fiscal Condition, 2016 Edition

Ranking the States by Fiscal Condition2016 Edition
Eileen Norcross and Olivia Gonzalez
MERCATUS RESEARCH

Copyright © 2016 by Eileen Norcross, Olivia Gonzalez, and the Mercatus Center at George Mason University
Release: June 2016
The opinions expressed in Mercatus Research are the authors’ and do not represent official positions of the Mercatus Center or George Mason University.
ABSTRACT
Based on the fiscal year 2014 comprehensive annual financial reports of the 50 states and Puerto Rico, this study ranks states’ fiscal solvency using 14 metrics that assess the extent to which the states can meet short-term bills and longer-term obligations. State finances are analyzed according to five dimensions of solvency: cash, budget, long-run, service-level, and trust fund solvency. These five dimensions are combined to produce an overall ranking of state fiscal sol-vency. Alaska, Nebraska, Wyoming, North Dakota, and South Dakota rank as the top five most fiscally solvent states. Kentucky, Illinois, New Jersey, Mas-sachusetts, and Connecticut rank as the bottom five states, with Puerto Rico taking 51st place.
JEL codes: H2, H3, H7, M410, M420
Keywords: state fiscal condition, fiscal solvency, financial ratios, state financial condition, public finance, state budget, state borrowing, state tax, public pen-sions, deficit, state expenditure, debt, surplus, government bonds, revenue, cash solvency, budget solvency, long-run solvency, service-level solvency
Eileen Norcross and Olivia Gonzalez. “Ranking the States by Fiscal Condition.” 2016 edi-tion. Mercatus Research, Mercatus Center at George Mason University, Arlington, VA, June 2016.

MERCATUS CENTER AT GEORGE MASON UNIVERSIT Y
3
The finances of state governments continue to be shaped by a slug-gish economy and steady but modest revenue growth since the recovery from the Great Recession of 2008 began in 2011. Accord-ing to the Government Accountability Office (GAO), if current tax
rates remain in place, total tax revenues for state and local governments as a percentage of GDP will not return to 2007 levels until 2047.1
These projections are supported by the analysis of the National Association of State Budget Officers (NASBO). In fiscal year (FY) 2014, state revenues grew by only 1.3 percent. That growth was attributable mainly to individuals shifting the reporting of their capital gains and income from 2013 to 2012 to avoid the increase in tax rates.2 When considering the performance of the individual states, NASBO finds that 19 states experienced declines in revenue in FY 2014, whereas revenue projections for FY 2015 and FY 2016 are likely to increase by 3.7 percent and 3.0 percent, respectively.3 Although revenues were weak, states continued to increase spending in FY 2014, though fewer states made midyear budget cuts in FY 2014 and FY 2015—a sign that budget gaps are shrinking. The combination of modest revenues and ongoing spending pressures points not only to the risk of short-term budget gaps, but also to the growing burden that long-term spend-ing commitments place on state finances. Driving the gap between revenues and expenses in the coming decades is the rising cost of state and local spending on Medicaid and healthcare benefits for public-sector employees. To close the fiscal gap, GAO projects that states would have to undertake and maintain a 5 percent cut in state and local spending each year for the next 50 years.4
1. Government Accountability Office, “State and Local Governments’ Fiscal Outlook 2015 Update,” GAO-16-260SP. The report notes that although income and sales tax receipts have increased, “real estate values remain suppressed and property tax receipts continue to lag” (page 2).2. National Association of State Budget Officers, “The Fiscal Survey of the States: An Update of State Fiscal Condition,” Fall 2014, viii.3. National Association of State Budget Officers, “Summary: Spring 2015 Fiscal Survey of the States,” 3.4. Government Accountability Office, “State and Local Governments’ Fiscal Outlook 2015 Update,” 3.

MERCATUS CENTER AT GEORGE MASON UNIVERSIT Y
4
Monitoring trends in state budgets and tax collec-tions is one way to analyze the fiscal health of the states. Budgets present the policy choices of governments. A bud-get is a plan for how a state will spend money in a given fis-cal year—it is not a full accounting of the state’s finances. To know the fiscal position of the state requires an assessment of total assets, debt, and long-term liabilities. Taking stock of a state’s finances may also include analyzing the activi-ties of off-budget enterprises or special authorities. Much of this information is contained in the states’ audited finan-cial statements, known as comprehensive annual financial reports (CAFRs). Each state’s CAFR contains an account-ing of the state’s short-term and long-run fiscal health. It records both the state’s total assets and liabilities and the flow of expenses and revenues for the governmental and business activities of state governments.5
Financial information can help determine whether governments are accountable and responsible stewards of public dollars. It can also point to warning signs of fiscal weakness. Although the CAFR is a data-rich document as a roughly 300-page PDF accounting report, it is not very accessible to the public and policymakers.6 It is also a backward-looking accounting that produces a snap-shot of state finances in one fiscal year, published with a one-year lag. At the time of this analysis, the most recent CAFR available for all 50 states is for FY 2014. Despite
5. The government-wide financial statements in the CAFR organize informa-tion by whether it relates to governmental activities or business-type activities. These two categories combine to represent total primary government activi-ties. Generally, governmental activities are those that are financed with taxes and intergovernmental aid and are typically reported in the state’s govern-mental funds. Business-type activities are primarily financed with charges for goods and services, and are typically reported in the enterprise funds. Dean Michael Mead, An Analyst’s Guide to Government Financial Statements (Norwalk, CT: Governmental Accounting Standards Board, 2012).6. Some criticisms of CAFR reporting have been raised. To what extent do the data and the accounting methods contained in the CAFR accurately and fully represent the government’s fiscal position? Might improve-ments be made to clarify some of the accounting, such as how rainy day fund balances are recorded, or to more clearly enumerate liabilities and assets of governments? See Jonathan Walters, “Are Comprehensive Annual Financial Reports Useless?,” Governing, September 2012.
“Financial information can help determine whether governments are accountable and responsible stewards of public dollars. It can also point to warning signs of fiscal weakness.”

MERCATUS CENTER AT GEORGE MASON UNIVERSIT Y
5
these limitations, the CAFR is the only available public accounting of state finances that allows observers to detect trends and compare fiscal perfor-mance within a state and across the 50 states.
The goal of this research is to operationalize the CAFR by applying 14 basic financial metrics to measure state fiscal health. The aim is to shed light on state accounting and fiscal performance. With several years’ worth of data, these metrics can help establish benchmarks and trend lines and detect signs of fiscal stress or structural financial weakness. These metrics can also point to areas where the underlying reporting and accounting may need improvement or where such data fail to capture the true fiscal condition of a state.
The previous edition of “Ranking the States by Fiscal Condition” ana-lyzed the FY 2013 CAFRs of the 50 states and applied 14 metrics to assess the short-term, medium-term, and long-term fiscal health of the states.7 With another year of data for FY 2014, this update allows us to compare two years’ worth of fiscal performance data in the states and assess the extent to which the metrics and the data reflect true fiscal health. Given the state of its finances and the policy implications of bankruptcy, this year’s analysis includes Puerto Rico, which is also required to produce a CAFR statement.
It is important to stress at the outset that the underlying fiscal metrics are more meaningful than the state’s rank. The rank is a score of relative performance, whereas the underlying metrics measure the actual short-run and long-run sol-vency of the state. Further, these metrics must be interpreted in the context of economic and institutional factors that affect revenue, spending, and debt.
The paper proceeds in three parts. Section 1 reviews the definitions, data, and methodology used to produce the ranking. Section 2 presents an analysis of how states have changed both in absolute terms and according to their ranking between FY 2013 and FY 2014. Section 3 provides an analysis of the top five and bottom five states in the ranking. Section 4 concludes with some recommen-dations for how CAFRs might be made more accessible and how states might consider implementing fiscal metrics to help inform decision-making and com-municate fiscal performance to the public.
1. DEFINITIONS, DATA, AND METHODOLOGY
Fiscal solvency captures whether a state is able to meet its short-term and long-term obligations without incurring excessive debt, engaging in budget
7. Eileen Norcross, “Ranking the States by Fiscal Condition” (Mercatus Research, Mercatus Center at George Mason University, Arlington, VA, July 2015).

MERCATUS CENTER AT GEORGE MASON UNIVERSIT Y
6
gimmicks, or using other evasive tactics. Fiscal solvency may be measured with basic financial ratios that capture the size of a state’s debts relative to assets and its spending relative to revenues. Financial metrics are similar to a patient’s vital signs. They can point to areas of stress or potential risk but can-not provide a full diagnosis of a state’s fiscal condition. Metrics are best used in conjunction with other information and in the context of an individual state’s economic, fiscal, and institutional performance over time. Such an approach considers economic, social, demographic, and policy factors in a state’s overall performance and fiscal experience.
This study applies a method for assessing fiscal condition developed by public administration researchers XiaoHu Wang, Lynda Dennis, and Yuan Sen “Jeff” Tu that defines four types of fiscal solvency.8 These are (1) cash solvency (or liquidity), or the state’s ability to pay its immediate bills over a 30- or 60-day time frame; (2) budget solvency, or the degree to which the state will end the fis-cal year in surplus or deficit; (3) long-run solvency, or the state’s ability to meet long-term spending commitments; and (4) service-level solvency, or how much fiscal “slack” a state has to increase spending should citizens demand more services. This method of measuring fiscal condition is applied by Sarah Arnett and is used to produce a ranking of the states, based on their relative perfor-mance.9 The first edition of “Ranking the States by Fiscal Condition” updated Arnett’s study by changing how service-level solvency is calculated and also adding another dimension of solvency: (5) trust fund solvency, which includes total unfunded pension obligations, other postemployment benefits (OPEB), and total state debt.10
Data
The state fiscal rankings comprise five dimensions of solvency. The first four dimensions—cash, budget, long-run, and service-level solvency—are con-structed using data from the state’s CAFR, particularly the statement of net assets, the statement of activities, and changes in net position. Total primary government activities are assessed, which includes the state’s spending on both government and business-type activities. The fifth dimension of solvency is trust fund solvency. It consists of total outstanding debt data taken from the
8. XiaoHu Wang, Lynda Dennis, and Yuan Sen “Jeff” Tu, “Measuring Financial Condition: A Study of U.S. States,” Public Budgeting & Finance 27, no. 2 (2007): 1–21.9. Sarah Arnett, “State Fiscal Condition: Ranking the 50 States” (Mercatus Working Paper, Mercatus Center at George Mason University, Arlington VA, January 2014).10. Norcross, “Ranking the States by Fiscal Condition.”

MERCATUS CENTER AT GEORGE MASON UNIVERSIT Y
7
CAFR’s statistical section. Data measuring the states’ unfunded pension obli-gations come from the individual actuarial reports for the state governments’ state-administered pension plans. OPEB data come from CAFR statements.
The statement of net assets, also known as the statement of net position, contains the same information as a balance sheet. It indicates the government’s position (or stock) and compares assets with liabilities. The statement of net assets measures how much remains after the government has met its long-term obligations in that year.
The statement of activities is a record of the flow of government spend-ing and revenue collection. It lists the types and amounts of revenues collected (taxes, fees) and the types of spending (programmatic, intergovernmental transfers, debt payments) by category. The statement of activities shows how any shortfalls between revenues and expenses are reconciled.11
These statements are measured on a full accrual basis of accounting. Any transaction that occurred in that fiscal year is recorded, even if cash did not change hands. Table 1 defines each line item used to construct the fiscal ratios.
The line items in table 1 are used to construct 14 indicators that assess five dimensions of a government’s solvency. Table 2 defines each indicator and provides a basic interpretation.
The indicators in table 2 are applied to data gathered from the CAFRs of the 50 states and Puerto Rico for FY 2014. For an overview of state perfor-mance, table 3 provides basic statistics, including the mean, median, standard deviation, and maximum and minimum values for each ratio.
Five Dimensions of Solvency
To rank the states on their short-term and long-term fiscal prospects, the 14 indicators are bundled according to the dimension of solvency they measure. Each indicator is first standardized as a z-score that measures how far the indi-cator is from the mean value. The standardized indicators are summed to create an index for each dimension of solvency and then ranked. This section dis-cusses and interprets each dimension of solvency and the indicators that com-pose the index. Appendix A contains tables with the individual metrics for each state. Appendix B contains the entire methodology. The profiles attached to the end of the paper summarize key information for each state and Puerto Rico, providing a closer look at the underlying data that make up the final ranking.
11. Governmental Accounting Standards Board, “Touring the Financial Report, Part II: The Statement of Activities,” The User’s Perspective, May 2007.

MERCATUS CENTER AT GEORGE MASON UNIVERSIT Y
8
Financial statement Line item Definition Notes
Statement of net assets (net position)
Cash Cash balances at the end of the fiscal year
Statement of net assets (net position)
Cash equivalents Short-term, highly liquid investments convertible to cash either readily or within three months of maturity
Statement of net assets (net position)
Investments Most investments are reported at fair value.
Statement of net assets (net position)
Receivables Funds due from transactions with government (the timing of collections may vary, depending on type)(a)
There are three types of transactions: (1) exchange transactions (e.g., individuals pay the state for college tuition, health services); (2) exchange-like transactions between the state and another party, where the value of the exchange is not equal to the benefits (e.g., licenses, permits, regulatory fees); and (3) nonexchange transactions, where the government gives value to another party without receiving equal value in exchange.(b)
Statement of net assets (net position)
Current assets Assets that are converted into cash or consumed within the year
Statement of net assets (net position)
Current liabilities Obligations due within the year
Resources include accounts payable, short-term debt, and voucher warrants.
Statement of net assets (net position)
Noncurrent liabilities Long-term liabilities due over a few years or several decades, often with interest(c) (listed in order of maturity)
Liabilities include outstanding bonds, net pension obligations,(d) compensated absences, and pollution remediation obligations.
Statement of net assets (net position)
Unrestricted net assets
Assets that may be used for any purpose
“Used for any purpose” does not imply the resource is liquid. A deficit in unrestricted net assets may signal the issuance of new debt and does not indicate fiscal trouble.
Statement of net assets (net position)
Restricted net assets (net position)
Assets that are restricted for a particular purpose (e.g., capital projects, debt service)
Assets are restricted by enabling legislation. They may be expendable or nonexpendable, such as the principal used to fund an endowment.
Statement of net assets (net position)
Total net assets (total net position)
Combined net assets, including capital assets such as land, buildings, equipment, and infrastructure (e.g., roads, bridges, tunnels), less any outstanding debt used to acquire those assets
Capital assets are reported net of related debt. The resources needed to repay capital debt must be provided from other sources because the capital assets themselves cannot be liquidated to fund these liabilities.
Statement of net assets (net position)
Total assets Sum of current, noncurrent, and capital assets
Statement of net assets (net position)
Total liabilities Sum of short- and long-term liabilities
Statement of activities Total taxes All revenues due from taxes levied
Category excludes unrestricted grants, contributions, transfers, and investment earnings.
continued on next page
TABLE 1. FINANCIAL STATEMENT DATA USED TO CONSTRUCT INDICATORS

MERCATUS CENTER AT GEORGE MASON UNIVERSIT Y
9
MERCATUS CENTER AT GEORGE MASON UNIVERSIT Y
9
Financial statement Line item Definition Notes
Changes in net position Total revenue Total taxes plus total general revenue
Category includes unrestricted grants, contributions, transfers, and investment earnings.
Statement of activities Total expenses Total spent on governmental programs, debt service, unemployment compensation, loans, intergovernmental revenue sharing, lotteries, and the operation of government and commissions
On an accrual basis, expenses include costs that were incurred that year (such as earned pension benefits that will not be paid until a future date).
Statement of activities Changes in net assets General revenues and changes in net assets totaled and added to net (expense) revenue totals to produce the change in net assets over the reporting period
Governments report the amount of net assets at the beginning of the year and add or subtract changes in net assets for the year to present ending net assets.(e)
Ratio of debt outstanding (statistical section)
Total primary government debt
Debt issued for governmental activities and business activities (includes general obligation debt, revenue bonds, capital leases, and other project-based bonds)
Total primary government debt excludes off-budget debts of special enterprises, such as universities, special authorities, or utilities, because they are not legally guaranteed by the full faith and credit or taxing authority of the state government.
Annual report for state pensions plans
Unfunded pension liability
Pension plan assets subtracted from pension plan liabilities to calculate the size of the pension plan’s unfunded liability (or liability without any assets backing it)
These figures are reported in the annual reports of pension plans; in the fiscal rankings, the liability is recomputed on the basis of a low-risk or guaranteed discount rate.
Notes to the basic financial statement
OPEB liability The OPEB obligation stated in the notes to the basic financial statement
These data were cross-checked with Standard & Poor’s OPEB data.
(a) Dean Michael Mead, An Analyst’s Guide to Government Financial Statements (Norwalk, CT: Governmental Account-ing Standards Board, 2012), 66. Examining receivables balances over time may help show whether the government’s ability to collect monies is improving or declining.(b) “Minnesota Management & Budget Statewide Operating Policy,” No. 0104-03, July 12, 2012, revised August 2, 2013. The Governmental Accounting Standards Board (GASB) classifies nonexchange transactions into four types: (1) derived tax revenues, or the payment of income or sales taxes to the state; (2) nonexchange revenues, such as prop-erty taxes; (3) government-mandated nonexchange revenues, or federal grants to be used to carry out a mandate; and (4) voluntary nonexchange transactions, such as donations.(c) States vary in reporting what is included in noncurrent liabilities. The notes to the financial statement provide more detail. See GASB, “Touring the Financial Statements, Part IV: Note Disclosures,” The User’s Perspective, December 2009.(d) GASB, “GASB Improves Pension Accounting and Financial Reporting Standards,” news release, June 25, 2012. According to GASB, “net pension obligation” (NPO) is the difference between the annual required contribution (ARC) to fund the benefits earned in that year plus the cost of past earned benefits minus the employer’s actual fiscal year contribution. GASB, “Accounting for Pensions by State and Local Governmental Employees,” Statement No. 27, GASB, November 1994. The NPO recognizes only a portion of the annual expense of the pension plan and is not a measure of the outstanding pension liability. If the state has historically made the full ARC, the NPO is zero. This standard for recording the expense of the pension plan was replaced in fiscal year 2014 with new guidance. GASB, “Summary of Statement 68: Accounting and Financial Reporting for Pensions—An Amendment of GASB Statement No. 27,” State-ment No. 68 June 2012, http://www.gasb.org/jsp/GASB/Pronouncement_C/GASBSummaryPage&cid=1176160219492. (e) GASB, “Touring the Financial Report, Part II: The Statement of Activities,” The User’s Perspective, May 2007, http://gasb.org/cs/ContentServer?c=GASBContent_C&pagename=GASB%2FGASBContent_C%2FUsersArticlePage&cid=1176156736216.
Note: OPEB = other postemployment benefits.
Source: Mead, An Analyst’s Guide.

MERCATUS CENTER AT GEORGE MASON UNIVERSIT Y
10
Financial indicators Definition Interpretation Solvency dimension
1 Cash ratio (Cash + cash equivalents + investments)/current liabilities
Higher ratio indicates greater cash solvency.
Cash
2 Quick ratio (Cash + cash equivalents + investments + receivables)/
current liabilities
Higher ratio indicates greater cash solvency.
Cash
3 Current ratio Current assets/current liabilities Higher ratio indicates greater solvency.
Cash
4 Operating ratio Total revenues/total expenses One or greater indicates budget solvency.
Budget
5 Surplus or deficit per capita
Change in net assets/population Positive ratio indicates budget solvency.
Budget
6 Net asset ratio Restricted and unrestricted net assets/total assets
Higher ratio indicates stronger long-run solvency.
Long-run
7 Long-term liability ratio
Long-term (noncurrent) liabilities/total assets
Lower value indicates greater long-run solvency.
Long-run
8 Long-term liability per capita
Long-term (noncurrent) liabilities/population
Lower value indicates greater long-run solvency.
Long-run
9 Tax to income ratio Total taxes/ state personal income
Higher value indicates lower service-level solvency.
Service-level
10 Revenue to income ratio
Total revenues/state personal income
Higher value indicates lower service-level solvency.
Service-level
11 Expenses to income ratio
Total expenses/state personal income
Higher value indicates lower service-level solvency.
Service-level
12 Debt to income ratio Total primary government debt/state personal income
Higher value indicates lower trust fund solvency.
Trust fund
13 Unfunded pension to income ratio
Unfunded pension liability/state personal income
Higher value indicates lower trust fund solvency.
Trust fund
14 OPEB to income ratio OPEB/state personal income Higher value indicates lower trust fund solvency.
Trust fund
Note: OPEB = other postemployment benefits.
TABLE 2. FINANCIAL INDICATORS USED TO MEASURE FISCAL CONDITION
Cash Solvency
Cash solvency is measured with three ratios: the cash ratio, the quick ratio, and the current ratio. These metrics capture the government’s cash position relative to current or short-term liabilities. They indicate whether a govern-ment can meet bills that are due over a 30- to 60-day horizon. The cash ratio is the sum of the most liquid assets—cash, cash equivalents, and investments—divided by current liabilities.
As table 3 shows, in FY 2014, states’ mean cash ratio is 2.40. On aver-age states have 2.4 times more cash than short-term liabilities. The cash ratio includes only the most liquid assets. Fifteen states and Puerto Rico have cash ratios of less than one, meaning they have less cash on hand than short-term

MERCATUS CENTER AT GEORGE MASON UNIVERSIT Y
11
liabilities. The 15 states with inadequate liquid cash in FY 2014 are Arizona, California, Connecticut, Illinois, Kentucky, Maine, Maryland, Massachusetts, New Hampshire, New Jersey, New York, North Carolina, Pennsylvania, Rhode Island, and Wisconsin. One caveat to the cash ratio metric is that it is the strict-est measure of cash and does not take into account other less liquid cash that can be used to pay for short-term liabilities.
A fuller picture of cash solvency is provided by the quick ratio, which is a measure of cash reserves. It includes cash, cash equivalents, and investments. It also includes receivables that are less liquid and not immediately accessible. The sum of these cash items is divided by current liabilities. A quick ratio greater than one indicates sufficient reserves of cash and assets that may be converted to cash to cover short-term liabilities. On average, states report a quick ratio of 3.18 in FY 2014. Only Illinois and Puerto Rico have a quick ratio of less than one.
The third component of cash solvency is the current ratio, or the percent-age of current liabilities covered by current assets. It is the most comprehensive measure of short-term solvency. A ratio of two or more indicates that short-term assets are twice as large as short-term liabilities, providing a buffer against short-term shocks. The average current ratio for FY 2014 is 3.54.
N Mean Median Standard deviation Maximum Minimum
Cash ratio 51 2.40 1.63 3.23 22.46 0.32
Quick ratio 51 3.18 2.41 3.27 22.81 0.74
Current ratio 51 3.54 2.56 3.34 23.44 0.77
Operating ratio 51 1.06 1.04 0.12 1.55 0.88
Surplus or deficit per capita 51 $448 $180 $1,376 $8,296 −$715
Net asset ratio 51 −0.03 0.09 0.63 0.85 −3.32
Long-term liability ratio 51 0.47 0.28 0.61 3.71 0.03
Long-term liability per capita 51 $3,069 $2,072 $2,960 $16,646 $229
Tax to income ratio 51 0.06 0.06 0.02 0.16 0.03
Revenue to income ratio 51 0.14 0.13 0.06 0.43 0.08
Expenses to income ratio 51 0.13 0.13 0.05 0.34 0.07
Pension to income ratio 51 0.31 0.28 0.13 0.70 0.14
OPEB to income ratio 49 0.03 0.02 0.04 0.17 0.00
Primary debt to income ratio 51 0.06 0.03 0.16 1.13 0.00
Note: OPEB = other postemployment benefits.
Source: Author’s analysis of the most recent comprehensive annual financial reports for all 50 states and Puerto Rico.
TABLE 3. DESCRIPTIVE STATISTICS FOR FY 2014 STATE GOVERNMENT FINANCIAL INDICATORS

MERCATUS CENTER AT GEORGE MASON UNIVERSIT Y
12
As table A1 in appendix A shows, 11 states and Puerto Rico have current ratios of less than two in FY 2014. Those states are Arizona, California, Connecti-cut, Illinois, Maine, Maryland, Massachusetts, New York, Pennsylvania, Rhode Island, and Wisconsin. Other states have very robust current ratios, with assets exceeding liabilities by four or more. Those states include Alabama, Alaska, Flor-ida, Idaho, Missouri, Montana, Nebraska, North Dakota, Ohio, South Dakota, Ten-nessee, Utah, and Wyoming.
Several states exceed the standard benchmarks of these cash metrics by an order of magnitude. The cash, quick, and current ratios for Alaska, North Dakota, South Dakota, Wyoming, Florida, and Utah raise the question of whether a state should have that much cash available. Very high levels of cash may be a sign of excessive tax collections or a mismanagement of resources. Another concern is that including Alaska, with metrics of between 22.46 and 23.44 times cash relative to short-term liabilities, skews the average cash ratio for the states and implies that to do well in this ranking, states should hoard cash.12
Healthy cash and current ratios should exceed two, and the quick ratio should be greater than one, but these measures need not be limitless. The cash metrics point to a possible shortcoming of CAFR reporting. Budget stabilization funds (also known as rainy day funds) are not specifically itemized on the bal-ance sheet, creating difficulty in assessing whether states have sufficient cash to cover a recession, based on the CAFR alone, or whether the cash that is recorded is accessible for fiscal emergencies. States with very high levels of assets, such as Alaska and Wyoming, also operate permanent trusts that contain the proceeds of revenues derived from natural resource exploration. These trusts contain a large amount of principal and cannot be accessed for general spending.
Such details and variation in practice among the states highlight the need for state fiscal reporting that can intuitively convey the short-term fiscal health of state governments. For now, these cash solvency metrics—although basic and blunt—are used to quickly identify states with deep and persistent cash shortfalls, but care should be taken in interpreting the cash solvency data for “top performers.” By contrast, states that have struggled with structural defi-cits are also states with consistently weak cash metrics. Those states include California, Connecticut, Illinois, Maryland, Massachusetts, and Pennsylvania. In such cases, a weak cash position may portend difficulty during a recession.
Most states have enough cash to cover short-term liabilities. Table 4 ranks the states according to cash solvency. The rank is a z-score, or a standardized
12. Removing Alaska and North Dakota from the cash data lowers the mean of the cash ratio from 2.40 to 1.94, the mean of the quick ratio from 3.18 to 2.71, and the mean of the current ratio from 3.54 to 3.11.

MERCATUS CENTER AT GEORGE MASON UNIVERSIT Y
13
Rank State Cash index Rank State Cash index
1. Alaska 18.20 27. Iowa −0.80
2. South Dakota 3.95 28. Virginia −0.84
3. Florida 3.80 29. Indiana −0.94
4. North Dakota 2.64 30. Vermont −1.04
5. Ohio 2.30 31. Kansas −1.06
6. Utah 2.22 32. West Virginia −1.16
7. Montana 1.71 33. Texas −1.19
8. Wyoming 1.47 34. Michigan −1.24
9. Nebraska 1.38 35. Colorado −1.25
10. Tennessee 1.14 36. Wisconsin −1.32
11. Alabama 1.08 37. North Carolina −1.36
12. Missouri 0.60 38. New Jersey −1.37
13. Oklahoma 0.46 39. New Hampshire −1.42
14. Idaho 0.26 40. Kentucky −1.44
15. Arkansas 0.09 41. Rhode Island −1.54
16. Nevada −0.07 42. New York −1.55
17. South Carolina −0.14 43. Maryland −1.77
18. Washington −0.26 44. Maine −1.78
19. Mississippi −0.30 45. Arizona* −1.78
20. Delaware −0.34 46. Pennsylvania −1.80
21. Louisiana −0.43 47. California −1.83
22. Minnesota −0.54 48. Illinois −1.87
23. Hawaii −0.57 49. Connecticut −1.94
24. Oregon −0.65 50. Massachusetts −1.99
25. New Mexico −0.74 51. Puerto Rico −2.23
26. Georgia −0.77
* Maine’s cash solvency score is −1.7805 and Arizona’s is −1.7819. Maine is ranked 44th and Arizona is ranked 45th, though the rounded scores are the same.
Note: The cash solvency index is the sum of the standardized values of the cash, quick, and current ratios.
Source: Authors’ analysis of the most recent comprehensive annual financial reports for all 50 states and Puerto Rico.
TABLE 4. RANKING OF STATES BY CASH SOLVENCY (FISCAL YEAR 2014)
value of the summed cash solvency indicators, which measures how many stan-dard deviations an individual state’s score is above or below the mean for all 50 states. For example, Utah’s cash index is 2.22 standard deviations above the mean, ranking the state sixth for cash solvency. Colorado has a cash index of −1.25, or one standard deviation below the mean. Colorado’s underlying cash metrics indi-cate that the state has a weak cash ratio (1.25) and adequate quick and current ratios (1.76 and 2.01, respectively) that are still below the mean in the states.

MERCATUS CENTER AT GEORGE MASON UNIVERSIT Y
14
Budget Solvency
Budget solvency consists of two ratios that measure whether the state’s revenues match its expenses. The operating ratio is the proportion of total revenues avail-able to cover total expenses. A ratio greater than one indicates that revenues exceed expenses, and the state can pay for spending in fiscal years based on reported revenues. In FY 2014, the average operating ratio is 1.06. In FY 2014, 11 states and Puerto Rico have operating ratios of one or less, as table A2 in appen-dix A shows. These states are Connecticut, Delaware, Hawaii, Illinois, Kentucky, Louisiana, Maine, Maryland, Massachusetts, New Jersey, and Pennsylvania.
The operating ratio is a flag indicating that the state may have to take action to close a budget shortfall in that year. Complementing the operating ratio is the surplus or deficit per capita, which is measured as the change in net assets divided by the state’s population. Net assets measure whether the government has resources remaining after paying its debts. The change in net assets measures the change in the net assets balance for the previous year and current year. Most states recorded a surplus in FY 2014, with an average surplus per capita of $448.13 Many of the same states with weak operating ratios also recorded a deficit. Those states are Connecticut, Delaware, Hawaii, Illinois, Kentucky, Louisiana, Maine, Maryland, Massachusetts, New Jersey, and Pennsylvania, as well as Puerto Rico.
The operating ratio and surplus or deficit per capita form the budget sol-vency index, which allows us to rank the states according to budget solvency, as shown in table 5. The z-scores for budget solvency provide a relative ranking of the states by measuring how close each state is to the mean value for the states. Most states are tightly clustered around the mean. There are exceptions at the top and the bottom. Alaska, Wyoming, and North Dakota each have operating ratios and per capita surpluses far above the average, and far exceeding any deficit in the bottom-performing states, giving these states a high z-score and placing them in the top three for budget solvency. Puerto Rico’s operating ratio of 0.88 and deficit of $715 per capita give it a z-score of −2.30, far below that of the lowest-ranked state (Connecticut).
Long-Run Solvency
The long-run solvency index consists of three metrics. Net asset ratio is the proportion of net assets to total assets. Net assets are those left over after the government has paid its debts. They are a subset of total assets, which include
13. Because the rankings are relative, a state may have a surplus, which is a healthy metric, but a low ranking.

MERCATUS CENTER AT GEORGE MASON UNIVERSIT Y
15
Rank State Budget index Rank State Budget index
1. Alaska 9.85 27. Vermont −0.36
2. Wyoming 5.88 28. Virginia −0.42
3. North Dakota 5.83 29. Mississippi(d) −0.42
4. Texas 0.77 30. Georgia −0.43
5. Utah 0.69 31. Missouri −0.54
6. Idaho 0.68 32. West Virginia −0.55
7. Florida 0.49 33. Alabama −0.56
8. North Carolina 0.28 34. New York(e) −0.56
9. South Dakota 0.24 35. Arkansas −0.58
10. Montana 0.13 36. Tennessee −0.59
11. New Mexico 0.07 37. Michigan −0.67
12. Wisconsin −0.01 38. Kansas −0.74
13. South Carolina −0.02 39. New Hampshire −0.77
14. Nebraska −0.04 40. Maine −0.86
15. Minnesota −0.05 41. Delaware(f) −0.86
16. Oklahoma −0.19 42. Illinois −0.90
17. Oregon −0.19 43. Pennsylvania −0.94
18. Ohio(a) −0.19 44. Hawaii −0.97
19. Colorado −0.21 45. Kentucky −1.03
20. Nevada −0.21 46. Maryland −1.07
21. Arizona(b) −0.21 47. Louisiana −1.29
22. Rhode Island −0.27 48. Massachusetts −1.41
23. California −0.29 49. New Jersey −1.59
24. Iowa(c) −0.29 50. Connecticut −1.69
25. Washington −0.30 51. Puerto Rico −2.30
26. Indiana −0.34
(a) Oklahoma’s budget solvency score is −0.1890, Oregon’s is −0.1891, and Ohio’s is −0.1926. Oklahoma is ranked 16th, Oregon is ranked 17th, and Ohio is ranked 18th, though the rounded scores are the same.(b) Colorado’s budget solvency score is −0.2057, Nevada’s is −0.2074, and Arizona’s is −0.2126. Colorado is ranked 19th, Nevada is ranked 20th, and Arizona is ranked 21st, though the rounded scores are the same.(c) California’s budget solvency score is −0.2858 and Iowa’s is −0.2927. California is ranked 23rd and Iowa is ranked 24th, though the rounded scores are the same.(d) Virginia’s budget solvency score is −0.4161 and Mississippi’s is −0.4189. Virginia is ranked 28th and Mississippi is ranked 29th, though the rounded scores are the same.(e) Alabama’s budget solvency score is −0.5567 and New York’s is −0.5577. Alabama is ranked 33rd and New York is ranked 34th, though the rounded scores are the same.(f) Maine’s budget solvency score is −0.8582 and Delaware’s is −0.8610. Maine is ranked 40th and Delaware is ranked 41st, though the rounded scores are the same.
Note: The budget solvency index is the sum of the standardized values of the change in net assets per capita and the operating ratio.
Source: Authors’ analysis of the most recent comprehensive annual financial reports for all 50 states and Puerto Rico.
TABLE 5. RANKING OF STATES BY BUDGET SOLVENCY (FISCAL YEAR 2014)

MERCATUS CENTER AT GEORGE MASON UNIVERSIT Y
16
capital such as land and government buildings. The greater the amount of net assets relative to total assets, the more the government has on hand to cover long-term liabilities. A portion of net assets is restricted for dedicated purposes. The mean net asset ratio in FY 2014 is −0.03. A high net asset ratio means that the government has more assets available to pay long-term liabilities. The net asset ratio ranges from 0.85 in Alaska to −3.32 in Puerto Rico. Thirteen states have negative net asset ratios, including California, Connecticut, Delaware, Illi-nois, Kentucky, Maryland, Massachusetts, New Jersey, New York, Pennsylva-nia, Rhode Island, Vermont, and Wisconsin.
A negative net asset ratio may be interpreted in a few ways. It may mean that the government is having trouble covering long-term obligations, such as OPEB or pension payments. A negative net asset ratio does not necessarily por-tend fiscal distress. It may be due to the issuance of debt for capital projects, such as school construction, roads, or other infrastructure. Whereas the assets are owned by another entity, such as a school district or special authority, the debt is held by the state. For example, New York has an unrestricted net posi-tion deficit of $48.1 billion in FY 2014. That deficit reflects debts issued by the state that did not result in a capital asset, including securitization of the state’s future tobacco settlement receipts ($2.1 billion), “eliminating the need for sea-sonal borrowing” by the New York Local Government Assistance Corporation ($2.6 billion), borrowing for local highway and bridge projects ($4.2 billion) and local mass transit projects ($1.7 billion), and other grants and expenditures not resulting in state capital assets ($13.3 billion). In addition, New York holds $12.6 billion in OPEB. New York’s CAFR states, “This deficit in unrestricted net position of governmental activities can be expected to continue for as long as the State continues to have obligations outstanding for the purposes other than the acquisition of State governmental capital assets.”14
The second metric that makes up long-run solvency is the long-term liability ratio. This metric represents the proportion of long-term liabilities relative to total assets. Long-term liabilities include outstanding bonds, loans, claims and judgments (rendered against the government in a lawsuit), and com-pensated employee absences. A low ratio of long-term liabilities to total assets signals good fiscal health.
In FY 2014, total state liabilities are on average 47 percent of total assets. Table A3 in appendix A shows 10 states with liabilities totaling 12 percent or less of total assets. Those states are Alaska, Idaho, Indiana, Montana, Nebraska, North Dakota, Oklahoma, South Dakota, Tennessee, and Wyoming. A few states
14. Comprehensive Annual Financial Report for the State of New York, FY 2014, 23.

MERCATUS CENTER AT GEORGE MASON UNIVERSIT Y
17
“States with high levels of taxes, revenues, or expenditures relative to state personal income may have difficulty obtaining increased revenues in a sudden downturn.”
have liabilities that exceed assets by a factor of one or more. Those states are Connecticut, Illinois, Massachusetts, and New Jersey, as well as Puerto Rico. Table 6 presents the ranking of the states according to long-run solvency.
Service-Level Solvency
The three ratios that make up service-level solvency attempt to measure how much “fiscal slack” states have to raise taxes or increase spending by calculating the size of taxes, expenses, and revenues relative to state personal income. States with high levels of taxes, revenues, or expenditures relative to state personal income may have difficulty obtain-ing increased revenues in a sudden downturn.
A higher value of taxes, revenues, or expenditures rela-tive to state personal income indicates that a state may not be able to easily respond to increased demands on the bud-get or the increasing cost of pension or OPEB obligations. One shortcoming of service-level solvency is that these met-rics do not tell us anything about the state’s tax structure or revenue system. These metrics do not indicate whether a state’s tax system is efficient, equitable, volatile, progressive, or regressive. They also do not indicate whether institutional barriers (regulations, statutes) may exist that prevent a state from applying revenues to address budgetary shortfalls.
Two states with very high levels of revenues relative to state personal income are Alaska and North Dakota. Both states have comparatively high expenses relative to state personal income. This factor is a flag indicating that these states, with their dependence on oil revenues, may be tying increased spending to a volatile source of reve-nue. These metrics place them at the bottom of the ranking for service-level solvency. States with a low level of taxes, revenues, and spending relative to personal income are ranked at the top of service-level solvency. These states are New Hampshire, Nevada, Florida, and South Dakota. Table A4 in appendix A provides the individual metrics for each state. Table 7 presents the ranking of states according to service-level solvency.

MERCATUS CENTER AT GEORGE MASON UNIVERSIT Y
18
MERCATUS CENTER AT GEORGE MASON UNIVERSIT Y
18
Rank State Long-run index Rank State Long-run index
1. Nebraska 10.15 27. Arkansas(b) −0.24
2. Alaska 5.07 28. West Virginia −0.26
3. Indiana 3.69 29. Mississippi −0.30
4. Tennessee 2.72 30. Georgia −0.37
5. Oklahoma 2.52 31. Florida −0.48
6. South Dakota 2.50 32. New Hampshire −0.50
7. Wyoming 2.22 33. Oregon −0.53
8. Montana 2.16 34. Vermont −0.74
9. Idaho 1.75 35. Pennsylvania −0.79
10. North Dakota 0.87 36. Louisiana −0.81
11. South Carolina 0.78 37. Wisconsin −0.86
12. New Mexico 0.56 38. Ohio −0.87
13. Iowa 0.55 39. Rhode Island −1.03
14. Colorado 0.49 40. Delaware −1.23
15. Missouri 0.44 41. Washington −1.25
16. Utah 0.40 42. Hawaii −1.27
17. North Carolina 0.39 43. Maryland −1.43
18. Texas 0.28 44. New York −1.62
19. Alabama(a) 0.28 45. Kentucky −1.65
20. Maine 0.24 46. California −1.80
21. Kansas 0.20 47. Connecticut −2.85
22. Arizona 0.02 48. Massachusetts −2.87
23. Minnesota −0.11 49. Illinois −3.19
24. Michigan −0.14 50. New Jersey −3.81
25. Nevada −0.17 51. Puerto Rico −6.89
26. Virginia −0.24
(a) Texas’s long-run solvency score is 0.2801 and Alabama’s is 0.2799. Texas is ranked 18th and Alabama is ranked 19th, though the rounded scores are the same.(b) Virginia’s long-run solvency score is −0.2399 and Arkansas’s is −0.2410. Virginia is ranked 26th and Arkansas is ranked 27th, though the rounded scores are the same.
Note: The long-run solvency index is the sum of the standardized values of the net asset ratio, long-term liability ratio, and long-term liability per capita.
Source: Authors’ analysis of the most recent comprehensive annual financial reports for all 50 states and Puerto Rico.
TABLE 6. RANKING OF STATES BY LONG-RUN SOLVENCY (FISCAL YEAR 2014)

MERCATUS CENTER AT GEORGE MASON UNIVERSIT Y
19
TABLE 7. RANKING OF STATES BY SERVICE-LEVEL SOLVENCY (FISCAL YEAR 2014)
Rank StateService-level
index Rank StateService-level
index
1. New Hampshire 7.24 27. Connecticut −0.15
2. Nevada 6.77 28. California −0.30
3. Florida 4.16 29. Iowa −0.32
4. South Dakota 3.88 30. Michigan −0.39
5. Virginia 3.78 31. Massachusetts −0.70
6. Missouri 3.35 32. Montana −0.75
7. Nebraska 3.06 33. Idaho −0.78
8. Colorado 2.90 34. Rhode Island −1.03
9. Texas 2.37 35. New York −1.13
10. Tennessee 2.10 36. Maine(b) −1.13
11. Kansas 1.85 37. Oregon −1.44
12. Utah 1.70 38. Minnesota −1.47
13. Georgia 1.68 39. Wisconsin −1.72
14. Alabama 1.53 40. Kentucky −1.80
15. Oklahoma 1.47 41. Mississippi −2.13
16. Maryland 1.16 42. Arkansas −2.51
17. Pennsylvania 1.06 43. Hawaii −2.62
18. North Carolina 0.93 44. Wyoming −3.01
19. Arizona 0.88 45. West Virginia −3.06
20. New Jersey 0.81 46. Delaware −3.57
21. Ohio 0.73 47. Vermont −3.90
22. Louisiana 0.70 48. New Mexico −3.97
23. Indiana(a) 0.70 49. North Dakota −5.07
24. South Carolina 0.26 50. Alaska −5.61
25. Illinois 0.24 51. Puerto Rico −6.80
26. Washington 0.06
(a) Louisiana’s service-level solvency score is 0.7019 and Indiana’s is 0.6980. Louisiana is ranked 22nd and Indiana is ranked 23rd, though the rounded scores are the same.(b) New York’s service-level solvency score is −1.1268 and Maine’s is −1.1331. New York is ranked 35th and Maine is ranked 36th, though the rounded scores are the same.
Note: The service-level solvency index is the sum of the standardized values of tax per capita, revenue per capita, and expenses per capita.
Source: Authors’ analysis of the most recent comprehensive annual financial reports for all 50 states and Puerto Rico.
MERCATUS CENTER AT GEORGE MASON UNIVERSIT Y
20
Trust Fund Solvency
Long-run solvency does not capture the full size of the pension and OPEB obligations of states. The liability numbers used for long-run solvency are taken from the statement of net assets and statement of activities. These state-ments measure only a portion of pension liabilities and OPEB but not the total amounts. The fifth dimension of fiscal solvency—trust fund solvency—addresses this issue with three metrics that consider the size of risk-adjusted pension obligations, OPEB, and total debt outstanding relative to state personal income.15 Table A5 in appendix A presents the three ratios.
These metrics account for states’ long-term obligations, each of which comes with different legal, statutory protections. Before interpreting the met-rics, we review each type of long-term liability.
Pensions
States make legal promises to public-sector workers in the form of deferred compensation paid out as pension benefits or healthcare benefits, also called other postemployment benefits.
Pension benefits enjoy statutory or constitutional legal protections in state law, putting them on legal footing with general obligation debt. Not all states offer the same degree or kind of legal protection for pension benefits.16 Some states protect only accrued benefits—those that have been earned to date. An estimated 21 states protect pension benefits that have not yet been earned.17 Owing to these legal guarantees of payment, economists make the case that public pension liabil-ities should be valued like government debt; that is, they represent a commitment to the employee that has a low or no probability of default.
A defined benefit pension is a promise to pay an employee a formula-determined amount upon retirement. It is funded with employee and employer contributions and with the return on investment for those contributions. To determine how much the government should contribute today to fund the benefit it will pay out in the future, one must “discount” the pensions’ future
15. Bureau of Economic Analysis, “State Personal Income 2014,” news release, March 25, 2015, http://www.bea.gov/newsreleases/regional/spi/2015/spi0315.htm. State personal income is “the sum of net earnings by place of residence, property income, and personal current transfer receipts.” It is derived as “the sum of state estimates and the estimate for the District of Columbia; it differs slightly from the estimate of personal income in the national income and product accounts.”16. Amy B. Monahan, “Public Pension Plan Reform: The Legal Framework,” Education, Finance & Policy 5 (2010): 617–46.17. Liz Farmer, “How Are Pensions Protected State-by-State?,” Governing, January 28, 2014, http://www.governing.com/finance101/gov-pension-protections-state-by-state.html.

MERCATUS CENTER AT GEORGE MASON UNIVERSIT Y
21
value to a present value. This calculation requires selecting an interest rate, called a “discount rate.” The way to select the discount rate is a source of debate between government actuaries and economists.18
Until FY 2014, public plans valued pension liabilities according to State-ment No. 27 of the Governmental Accounting Standards Board (GASB 27), which states that a pension liability may be discounted based on the rate of return the plan expects to achieve on its investments.19 On average, most public plans assume they will earn between 7 percent and 8 percent annually on plan assets, which are invested in a mix of equities and fixed income. They use this discount rate—one that represents the returns on a portfolio of mixed invest-ments—to calculate the value of the plan’s liability.20 This approach has a few problems. First, according to economic theory, the value of the plan’s liability is independent of the value of the plan’s assets, much as the value of a home-owner’s mortgage is independent of the value of his or her personal savings. Economic theory holds that a stream of future cash flows (in this case, a stream of future pension benefit payments) should be valued based on the certainty and timing of those payments.21 State pension plans come with a legal guaran-tee of payment, but there is no guarantee that the plan’s assets will return 7.5 percent each year. GASB 27 implies that securing a promised stream of future benefits based on uncertain investment returns without any risk is possible.
Instead, the discount rate selected to value future payments should match the guarantee and certainty of payment. Public pensions are similar in guarantee to government debts. That similarity suggests that the discount rate should match the yield on a government debt instrument, such as the yield on notional 15-year Treasury bonds (currently 3.2 percent). One result of dropping the discount rate from 7.5 percent to 3.2 percent is a dramatic increase in the present value of the liability and the annual required contribution to fund the plan. For every 1 percent change in the discount rate, the pension liability changes by as much as 20 per-cent.22 The effect of this assumption became clear during the Great Recession of
18. Eileen Norcross, “Getting an Accurate Picture of State Pension Liabilities” (Mercatus on Policy, Mercatus Center at George Mason University, Arlington, VA, December 2010).19. Governmental Accounting Standards Board, “Accounting for Pensions by State and Local Governmental Employees” (Statement No. 27, Governmental Accounting Standards Series, November 1994).20. For a comprehensive discussion of pension valuation among private, public, US, and international plans, see US Government Accountability Office, Pension Plan Valuation: View on Using Multiple Measures to Offer a More Complete Financial Picture, September 2014, http://www.gao.gov/assets/670/666287.pdf.21. Franco Modigliani and Merton H. Miller, “The Cost of Capital, Corporation Finance, and the Theory of Investment,” American Economic Review 48 (1958): 261–97; M. Barton Waring, Pension Finance: Putting the Risks and Costs of Defined Benefit Plans Back under Your Control (Hoboken, NJ: Wiley, 2011).22. V. Gopalakrishnan and Timothy F. Sugrue, “The Determinants of Actuarial Assumptions under Pension Accounting Disclosures,” Journal of Financial and Strategic Decisions 8, no. 1 (Spring 1995): 35–41.

MERCATUS CENTER AT GEORGE MASON UNIVERSIT Y
22
2008, because plans did not meet expected asset returns and large funding gaps emerged.
New accounting standards established by Statement No. 68 of the Governmental Accounting Standards Board (GASB 68) apply a mixed approach to measuring public-sector pension liabilities.23 GASB 68 suggests that plans should continue to use the expected return on plan assets to value the funded portion of the liability and to apply the return on a tax-exempt, 20-year, high-grade municipal bond to value the unfunded portion of the liability. One shortcoming of GASB 68 is that it allows plans to continue valuing a portion of pension liabilities with reference to risky asset returns, thus obscuring the full value of the liability and leading to distorted valuations among plans.24
Practically speaking, in FY 2014, states are slowly transitioning to the new standard; some governments are calculating their pension liabilities as part of the report-ing requirements of GASB 68. But they are also continuing to use the previous approach under GASB 27 to estimate liabilities and contribution levels for funding purposes. Going forward, pension liabilities will be calculated dif-ferently under GASB 68, creating difficulty in comparing this year’s pension data in the fiscal rankings with data as they will be reported in future years.
For this year’s fiscal rankings report, pension asset and liability data come from the most recent actuarial reports of the plans that the states offer to their employees, including plans that the states manage but do not contrib-ute to directly. The responsibility for these plans may lie with the municipal or county governments.25 Although a
23. Governmental Accounting Standards Board, “Accounting and Financial Reporting for Pensions: An Amendment of GASB Statement No. 27” (Statement No. 68, Governmental Accounting Standards Series, June 2012).24. John W. Mortimer and Linda R. Henderson, “Measuring Pension Liabilities under GASB Statement No. 68,” Accounting Horizons 28, no. 3 (2014): 421–54.25. It is not clear where the burden may fall should a state-managed and locally financed plan run into trouble. The outcome and legal responsibil-ity would rest on how a court might interpret the statutory or constitu-tional language applying to that individual plan. For that reason, plans that
“According to economic theory, the value of the plan’s liability is independent of the value of the plan’s assets, much as the value of a homeowner’s mortgage is independent of the value of his or her personal savings.”

MERCATUS CENTER AT GEORGE MASON UNIVERSIT Y
23
state does not bear the financial responsibility for many of the multiemployer plans, state and local entities are connected through fiscal relationships. If a state-administered but locally funded pension plan were to experience distress, the municipalities might seek state aid or pension reform measures from the state. That action would present the state with a contingent liability for state-administered but locally funded plans. In this study, we are concerned with measuring the full liability of state-administered plans in order to alert state governments to the fiscal condition of pension systems for which they have administrative responsibility. The plans included in the analysis are listed in table A10 in appendix A. These plans correspond to the state-administered plans identified by the US Census.26
Table A7 of appendix A presents the plans’ total assets and liabilities, unfunded liability, funded ratio, and unfunded liability relative to personal income for state pensions. Because the numbers in state actuarial reports are calculated under GASB 27 and do not reflect the full value of pension liabilities, table A8 presents those figures based on a reestimation of plan liabilities by valuing the plans according to their statutory guarantee and the time horizon over which benefits are due, or according to the risk-free rate, or the yield on notional 15-year Treasury bonds at the close of FY 2014, or 3.2 percent. The net effect increases the total unfunded liability of state pension plans from $1.0 trillion to $4.3 trillion.
Other Postemployment Benefits
Other postemployment benefits are the health and other nonpension ben-efits that state governments offer their employees. These benefits do not carry the same legal protections as pensions and represent a liability that may be impaired, reduced, or eliminated. Thus, for assessing states’ liabili-ties, OPEB pose less of a risk to taxpayers and provide less of a guarantee to beneficiaries.
When the total pension and OPEB liabilities payable to public-sector employees over the coming decades are included, many states are in an acute situation with regard to the large claims on future revenues. In particular, the states that have performed poorly in the fiscal rankings—Illinois, New Jersey, Connecticut, and Pennsylvania—are also notable for their large, unfunded pension liabilities and largely unfunded OPEB. States that have scored well in
are state operated and locally financed are included in this survey. This survey does not include plans that are locally operated and locally financed.26. See US Census Bureau, 2013 Survey of Public Pensions: State and Local Data, http://www.census .gov/govs/retire/historical_data_2013.html.
MERCATUS CENTER AT GEORGE MASON UNIVERSIT Y
23

MERCATUS CENTER AT GEORGE MASON UNIVERSIT Y
24
the fiscal rankings should also heed the possibility that underlying accounting practices can send a state into a downward spiral.
Bonded Debt
For the ranking of bonded debt, debt includes total primary government debt: bonds issued to finance both the governmental activities and business activi-ties of government. Some of these forms of debt are more legally binding than others. General obligation (GO) bonds are those backed by the full faith and credit of the state and are repaid out of general revenues. Because of that legal protection, GO bonds have a low probability of default because the government can impose a tax to repay them. A less senior form of debt are revenue bonds. They are backed by a dedicated source of revenue, and the state is not obligated to repay them in the case of a default. Other types of less secured debts include certificates of participation and lease-purchase agreements for public facilities and equipment.
Many states limit the amount of GO debt the state may issue. Several states prohibit the issuance of GO debt, including Arizona, Colorado, Kansas, and Kentucky.27 These states rely on other forms of debt, including revenue bonds and certificates of participation.
In addition to providing a complete measure of state debt and long-term liabilities, the trust fund solvency metrics help interpret service-level solvency. The degree to which a state has fiscal slack is also dependent on the size of its long-term obligations because they have an effect on future resources.
Table 8 presents the rankings for the states according to trust fund solvency.
Overall Ranking of the States
To construct an overall fiscal ranking of the states, the scores for the five dimensions of solvency are weighted and added together. The weights applied to each dimension for FY 2014 are similar to the weights used in the FY 2013 ranking. Short-term measures are given greater weight than long-term measures: cash and budget solvency scores are each assigned a weight
27. A study by the National Association of Treasurers finds that 27 states have constitutional or statu-tory limits on GO bonds, whereas only four states limit revenue or nonguaranteed debt. Nineteen states limit the total amount of revenue bonds outstanding. Denison, Hackbart, and Moody find that debt limits on GO debt may lead governments to issue “more complex and specialized bonds.” Dwight V. Denison, Merl Hackbart, and Michael Moody, “State Debt Limits: How Many Are Enough?,” Public Budgeting and Finance 26, no. 4 (2006): 22–39.

MERCATUS CENTER AT GEORGE MASON UNIVERSIT Y
25
TABLE 8. RANKING OF STATES BY TRUST FUND SOLVENCY (FISCAL YEAR 2014)
Rank State Trust fund index Rank State Trust fund index
1. Nebraska 8.59 27. Pennsylvania −0.47
2. Oklahoma 6.93 28. Arkansas −0.57
3. Wisconsin 2.14 29. Rhode Island −0.62
4. Tennessee 2.09 30. West Virginia −0.63
5. Indiana 1.80 31. Missouri −0.65
6. Vermont 1.58 32. Michigan −0.66
7. Wyoming 1.12 33. Colorado −0.68
8. North Carolina 0.79 34. Minnesota −0.78
9. South Dakota(a) 0.79 35. South Carolina −0.87
10. Delaware 0.76 36. Alabama −0.88
11. Texas 0.75 37. Oregon −0.91
12. Florida 0.67 38. Montana −0.93
13. North Dakota 0.60 39. Connecticut −1.08
14. Virginia 0.42 40. New Jersey −1.12
15. New Hampshire(b) 0.42 41. Louisiana −1.16
16. Idaho 0.15 42. California −1.22
17. Arizona 0.10 43. Hawaii −1.45
18. Maryland 0.02 44. Nevada −1.52
19. Washington 0.00 45. Kentucky −1.54
20. Massachusetts −0.09 46. Illinois −1.58
21. Georgia −0.11 47. Mississippi −1.60
22. Iowa −0.16 48. Ohio −1.70
23. New York −0.18 49. New Mexico −1.74
24. Maine −0.20 50. Alaska −2.03
25. Kansas −0.21 51. Puerto Rico(c) −2.03
26. Utah −0.33
(a) North Carolina’s trust fund solvency score is 0.7926 and South Dakota’s is 0.7898. North Carolina is ranked 8th and South Dakota is ranked 9th, though the rounded scores are the same.(b) Virginia’s trust fund solvency score is 0.4203 and New Hampshire’s is 0.4162. Virginia is ranked 14th and New Hampshire is ranked 15th, though the rounded scores are the same.(c) Alaska’s trust fund solvency score is −2.0272 and Puerto Rico’s is −2.0298. Alaska is ranked 50th and Puerto Rico is ranked 51st, though the rounded scores are the same.
Note: The trust fund solvency index is the sum of the standardized values of the pension, OPEB, and primary debt to income ratios.
Source: Authors’ analysis of the most recent comprehensive annual financial reports for all 50 states and Puerto Rico.

MERCATUS CENTER AT GEORGE MASON UNIVERSIT Y
26
of 35 percent. The reason is that a weak cash or budget position presents an immediate problem for states in a recession. Long-run, service-level, and trust fund solvency are each assigned a weight of 10 percent, because these indices measure a longer horizon, with solvency affected by future policy decisions and economic factors.
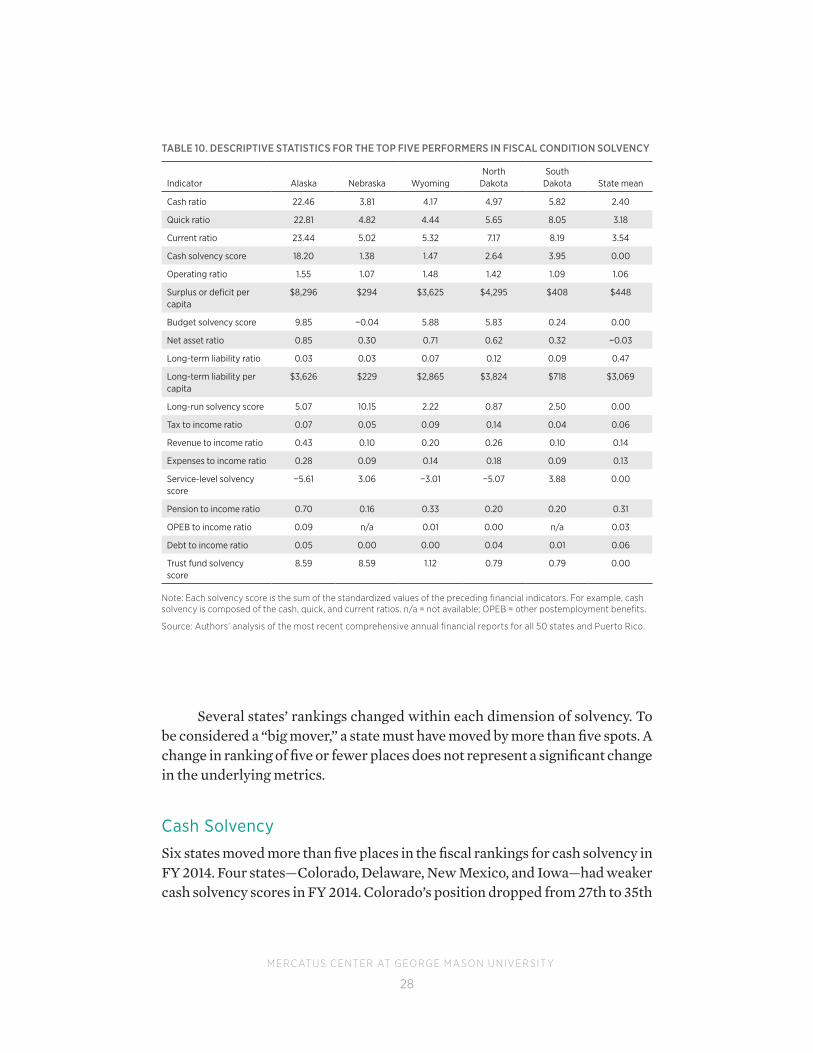
Table 9 ranks the states by fiscal condition. For the third year in a row, states in the top five, such as Alaska and North Dakota, are also states that rely heavily on oil revenue and record a high value of cash relative to short-term liabilities. If more emphasis (weight) were given to the long run, these states would fare relatively worse. The individual solvency rankings show that Alaska performs relatively well in the short run but has large pension liabilities and spending levels relative to state income. Wyoming, Nebraska, and South Dakota perform well on a short-run and longer-run basis owing to low levels of debt, spending, and long-term obligations relative to state personal income. Table 10 shows the descriptive statistics for the five most fiscally solvent states. By con-trast, as table 11 shows, the states that rank toward the bottom include states with ongoing structural deficit problems in addition to long-term debt and pen-sion pressures. These states include Connecticut, Massachusetts, Illinois, New Jersey, and Kentucky.
2. THE BIGGEST MOVERS
Two years’ worth of data on state fiscal performance is not enough to present a trend line, but it does allow us to see how states have changed in one year and to identify any big jumps in performance.28 Because the ranking for a state represents a z-score, which measures how far a state is from the mean value for the 50 states and Puerto Rico, a state’s rank may change for better or worse—since the mean value has changed—but the underlying solvency metrics for that state may remain similar or show a very small change rela-tive to the previous year. This section reviews those states that showed the biggest movement in the rankings within each dimension of solvency and for the overall ranking.
For the most part, states’ fiscal performance in FY 2014 is consistent with their performance in FY 2013. In FY 2014, two states’ overall ranking changed significantly. Delaware dropped from 30th place to 38th and Iowa from 18th place to 25th place in overall fiscal solvency.
28. This analysis raises a question: does a change in ranking signify a qualitative improvement or deterioration in financial position, or does it point to some aspect of the data that requires more con-text, to the limits of the financial metrics, or to the methodology?

MERCATUS CENTER AT GEORGE MASON UNIVERSIT Y
27
TABLE 9. RANKING OF STATES BY FISCAL CONDITION (FISCAL YEAR 2014)
Rank StateFiscal condition
index Rank StateFiscal condition
index
1. Alaska 9.56 27. Kansas(d) −0.44
2. Nebraska 2.65 28. Arkansas −0.50
3. Wyoming 2.60 29. Wisconsin −0.51
4. North Dakota(a) 2.60 30. Oregon −0.58
5. South Dakota 2.18 31. Arizona −0.60
6. Florida 1.94 32. Mississippi −0.65
7. Utah 1.19 33. Louisiana −0.73
8. Oklahoma(b) 1.19 34. New Mexico −0.75
9. Tennessee 0.88 35. Michigan −0.78
10. Montana 0.69 36. Vermont −0.79
11. Ohio 0.56 37. Rhode Island −0.90
12. Idaho 0.44 38. Delaware −0.92
13. Nevada 0.41 39. Pennsylvania −0.97
14. Missouri 0.34 40. West Virginia −0.99
15. Alabama 0.28 41. Maryland −1.02
16. Texas 0.20 42. New York −1.03
17. Indiana 0.17 43. Maine(e) −1.03
18. South Carolina −0.04 44. California −1.07
19. Virginia(c) −0.04 45. Hawaii(f) −1.07
20. New Hampshire −0.05 46. Kentucky −1.36
21. North Carolina −0.17 47. Illinois −1.42
22. Colorado −0.24 48. New Jersey −1.45
23. Georgia −0.30 49. Massachusetts −1.55
24. Washington −0.31 50. Connecticut −1.68
25. Iowa −0.37 51. Puerto Rico −3.15
26. Minnesota −0.44
(a) Wyoming’s fiscal condition score is 2.6047 and North Dakota’s is 2.6043. Wyoming is ranked 3rd and North Dakota ranked 4th, though the rounded scores are the same.(b) Utah’s fiscal condition score is 1.1944 and Oklahoma’s is 1.1899. Utah is ranked 7th and Oklahoma is ranked 8th, though the rounded scores are the same.(c) South Carolina’s fiscal condition score is −0.0351 and Virginia’s is −0.0415. South Carolina is ranked 18th and Virginia is ranked 19th, though the rounded scores are the same.(d) Minnesota’s fiscal condition score is −0.4388 and Kansas’s is −0.4440. Minnesota is ranked 26th and Kansas is ranked 27th, though the rounded scores are the same.(e) New York’s fiscal condition score is −1.0266 and Maine’s is −1.0301. New York is ranked 42nd and Maine is ranked 43rd, though the rounded scores are the same.(f) California’s fiscal condition score is −1.0690 and Hawaii’s is −1.0710. California is ranked 44th and Hawaii is ranked 45th, though the rounded scores are the same.
Note: The fiscal condition index is the sum of the cash, budget, long-run, and service-level solvency indices weighted as follows: (0.35 × cash solvency score) + (0.35 × budget solvency score) + (0.2 × long-run solvency score) + (0.1 × service-level solvency score).
Source: Authors’ analysis of the most recent comprehensive annual financial reports for all 50 states and Puerto Rico.
MERCATUS CENTER AT GEORGE MASON UNIVERSIT Y
28
Several states’ rankings changed within each dimension of solvency. To be considered a “big mover,” a state must have moved by more than five spots. A change in ranking of five or fewer places does not represent a significant change in the underlying metrics.
Cash Solvency
Six states moved more than five places in the fiscal rankings for cash solvency in FY 2014. Four states—Colorado, Delaware, New Mexico, and Iowa—had weaker cash solvency scores in FY 2014. Colorado’s position dropped from 27th to 35th
TABLE 10. DESCRIPTIVE STATISTICS FOR THE TOP FIVE PERFORMERS IN FISCAL CONDITION SOLVENCY
Indicator Alaska Nebraska WyomingNorth
DakotaSouth
Dakota State mean
Cash ratio 22.46 3.81 4.17 4.97 5.82 2.40
Quick ratio 22.81 4.82 4.44 5.65 8.05 3.18
Current ratio 23.44 5.02 5.32 7.17 8.19 3.54
Cash solvency score 18.20 1.38 1.47 2.64 3.95 0.00
Operating ratio 1.55 1.07 1.48 1.42 1.09 1.06
Surplus or deficit per capita
$8,296 $294 $3,625 $4,295 $408 $448
Budget solvency score 9.85 −0.04 5.88 5.83 0.24 0.00
Net asset ratio 0.85 0.30 0.71 0.62 0.32 −0.03
Long-term liability ratio 0.03 0.03 0.07 0.12 0.09 0.47
Long-term liability per capita
$3,626 $229 $2,865 $3,824 $718 $3,069
Long-run solvency score 5.07 10.15 2.22 0.87 2.50 0.00
Tax to income ratio 0.07 0.05 0.09 0.14 0.04 0.06
Revenue to income ratio 0.43 0.10 0.20 0.26 0.10 0.14
Expenses to income ratio 0.28 0.09 0.14 0.18 0.09 0.13
Service-level solvency score
−5.61 3.06 −3.01 −5.07 3.88 0.00
Pension to income ratio 0.70 0.16 0.33 0.20 0.20 0.31
OPEB to income ratio 0.09 n/a 0.01 0.00 n/a 0.03
Debt to income ratio 0.05 0.00 0.00 0.04 0.01 0.06
Trust fund solvency score
8.59 8.59 1.12 0.79 0.79 0.00
Note: Each solvency score is the sum of the standardized values of the preceding financial indicators. For example, cash solvency is composed of the cash, quick, and current ratios. n/a = not available; OPEB = other postemployment benefits.
Source: Authors’ analysis of the most recent comprehensive annual financial reports for all 50 states and Puerto Rico.

MERCATUS CENTER AT GEORGE MASON UNIVERSIT Y
29
TABLE 11. DESCRIPTIVE STATISTICS FOR THE SIX LOWEST PERFORMERS IN FISCAL CONDITION SOLVENCY
Indicator Kentucky IllinoisNew
Jersey Massachusetts ConnecticutPuerto Rico State mean
Cash ratio 0.75 0.63 0.63 0.39 0.46 0.32 2.40
Quick ratio 1.59 0.98 1.99 1.08 1.11 0.74 3.18
Current ratio 2.08 1.39 2.00 1.12 1.19 0.77 3.54
Cash solvency score
−1.44 −1.87 −1.37 −1.99 −1.94 −2.23 0.00
Operating ratio 0.98 0.99 0.94 0.96 0.94 0.88 1.06
Surplus or deficit per capita
−$100 −$40 −$396 −$342 −$505 −$715 $448
Budget solvency score
−1.03 −0.90 −1.59 −1.41 −1.69 −2.30 0.00
Net asset ratio −0.36 −1.14 −1.46 −0.94 −0.88 −3.32 −0.03
Long-term liability ratio
0.56 1.48 2.10 1.53 1.34 3.71 0.47
Long-term liability per capita
$3,933 $6,067 $9,285 $6,237 $9,077 $16,646 $3,069
Long-run solvency score
−1.65 −3.19 −3.81 −2.87 −2.85 −6.89 0.00
Tax to income ratio 0.07 0.06 0.06 0.06 0.06 0.16 0.06
Revenue to income ratio
0.15 0.12 0.11 0.13 0.12 0.30 0.14
Expenses to income ratio
0.15 0.12 0.12 0.14 0.13 0.34 0.13
Service-level solvency score
−1.80 0.24 0.81 −0.70 −0.15 −6.80 0.00
Pension to income ratio
0.47 0.49 0.37 0.24 0.36 0.68 0.31
OPEB to income ratio
0.03 0.06 0.13 0.04 0.08 0.03 0.03
debt to income ratio
0.05 0.06 0.08 0.07 0.09 1.13 0.06
Trust fund solvency score
−1.54 −1.58 −1.12 −0.09 −1.08 −2.03 0.00
Note: Each solvency score is the sum of the standardized values of the preceding financial indicators. For example, cash solvency is composed of the cash, quick, and current ratios. OPEB = other postemployment benefits.
Source: Author’s analysis of the most recent comprehensive annual financial reports for all 50 states and Puerto Rico.

MERCATUS CENTER AT GEORGE MASON UNIVERSIT Y
30
in FY 2014. Delaware’s cash position fell from 14th to 20th because of a decline in cash and pooled investments in FY 2014. Iowa fell 11 places, to 27th, as cash and investments declined by $1.8 billion.29 New Mexico’s rank fell by 6 places, from 19th to 25th. Two states—Maine and Minnesota—had stronger cash sol-vency scores in FY 2014. Maine’s position increased by 6 places, from 50th to 44th. Minnesota’s rank increased by 9 places, from 31st to 22nd in cash sol-vency. Much of that change is driven by a cash increase from $7 billion to $10 billion in FY 2014.
Budget Solvency
Budget solvency comprises two metrics: (1) the operating ratio measures the ratio of revenues to expenses, and (2) the surplus or deficit per capita is the change in net assets divided by state population. Change in net assets measures the change in the ending balance of the government in one fiscal year. Financial position may switch from a deficit to a surplus in one year because of a one-time event, such as a federal transfer or the sale of land. A state may display a deficit in one year because of a one-time spike in costs. Changes in net position balances that are consistently negative (a deficit) may be a flag indicating that the state has a structural deficit or is burdened by a large amount of debt. Any fluctuations in this figure should be evaluated on the basis of the management discussion and analysis contained in each state’s CAFR.
Budget solvency is more sensitive to large changes in ranking because of the fluctuation in surplus or deficits from year to year. In FY 2014, 16 states changed their rank by more than five places within budget solvency.
Six states moved in a significantly positive direction in the budget solvency rankings. Increased tax revenues in North Carolina and Washington resulted in these two states ending FY 2014 with larger surpluses, driving an increase in the operating ratio and higher placement in the rankings for budget solvency.30
29. The CAFR mentions a reclassification of assets for reporting purposes as a result of Statement 65 of the Governmental Accounting Standards Board, causing Iowa to restate its FY 2013 total assets and liabilities. Doing this decreased the state’s reported assets and increased its liabilities for FY 2013, translating into slightly worse financial health in that year than originally reported. This causes the rank changes between 2013 and 2014 to appear larger than they would have appeared if Iowa had not restated its data, because the 2015 ranking used the original numbers in Iowa’s FY 2013 CAFR. However, Iowa’s rank would still have dropped this year if the reclassification had not happened, though by fewer places.30. North Carolina saw increases in miscellaneous revenues, capital gains and contributions, other taxes, and corporate taxes. Washington experienced positive growth in the economy that produced increased revenues from sales and use taxes.

MERCATUS CENTER AT GEORGE MASON UNIVERSIT Y
31
“Budget solvency is more sensitive to large changes in ranking because of the fluctuation in surplus or deficits from year to year. In FY 2014, 16 states changed their rank by more than five places within budget solvency.”
New York’s improvement in budget solvency pushed the state from a deficit of $17 per capita to a surplus of $125 per capita in FY 2014. Vermont’s higher surplus is the result of transfers from the lottery commission to support education spending and gains in the Unemployment Compensation Trust Fund. Ohio undertook a series of measures to close a budget gap, resulting in a surplus per capita of $278 and allowing the state to deposit $995 million into its Budget Stabilization Fund.31 New Mexico improved significantly, moving from a deficit per capita of $20 to a surplus of $493.32
Ten states experienced a drop in budget solvency over the FY 2014 period. Connecticut moved from a small surplus of $29 per capita to a deficit of $505 per capita. The CAFR attributes that deficit to the existence of several long-term obligations, including $6.5 billion in bonds to finance various municipal grant programs; a $2.3 billion pension obligation bond; and $11.6 billion in other long-term obligations, including net pensions, OPEB, and com-pensated absences.33 Hawaii and Michigan both experi-enced a drop in budget solvency because of an increase in expenses and a decrease in revenues in FY 2014.34
New Hampshire’s budget solvency also declined as expenses for health, social services, and education increased more than revenues. Four states—Arizona, Kansas, Maine, and Oregon—experienced a decline in revenues that was larger than the decline in expenses leading to a lower oper-ating ratio. Three of these states—Arizona, Kansas, and Ore-gon—experienced declines in their surpluses, while Maine’s surplus of $240 per capita turned into a deficit of $20 per
31. Ohio CAFR, FY 2014.32. Some of New Mexico’s improvement can be attributed to the fact that this study is comparing FY 2012 financials with those of FY 2014. As of the release of last year’s fiscal rankings study, New Mexico had not yet released its FY 2013 CAFR, so FY 2012 numbers were used. For this analy-sis, New Mexico’s FY 2014 CAFR was available.33. Connecticut CAFR, FY 2014, 20. 34. Hawaii moved from a surplus of $221 per capita to a deficit of $83 per capita because of a $423 million increase in expenses for general govern-ment, public safety, highways, conservation, and education. Hawaii CAFR, FY 2014, 20.

MERCATUS CENTER AT GEORGE MASON UNIVERSIT Y
32
capita. Tennessee reported a smaller increase in assets than in FY 2013 and thus a smaller surplus, resulting in a drop in its budget solvency rank.
Iowa’s ranking for budget solvency dropped from 17 to 24 because of the restatement of net assets for FY 2013 in the FY 2014 CAFR. In a comparison of last year’s reported data with this year’s, Iowa’s surplus per capita fell from $371 to $250, a decrease in net position. Paradoxically, Iowa’s FY 2014 CAFR reports an overall increase in net position for the state. That positive improvement is based on Iowa’s using restated FY 2013 numbers (as opposed to last year’s reported FY 2013 numbers) to calculate the change in net assets for FY 2014. Although Iowa’s ranking dropped in FY 2014, its budgetary position actually improved, when taking the restated data into account. Iowa’s budget solvency change in FY 2014 is a function of the state’s updating last year’s data rather than of a qualitative change in performance.35
Long-Run Solvency
Long-run solvency consists of the net asset ratio, long-term liability ratio, and long-term liabilities per capita. Two states showed a major change in the long-run solvency rankings. Maine fell eight spots, from 12th to 20th. In FY 2014, total liabilities grew relative to total assets because of an increase in bonds issued and the cost of OPEB. Maine’s long-term liability per capita increased from $931 to $1,115. North Carolina’s long-run solvency rank improved from 24th to 17th, driven by a decrease in the proportion of liabilities relative to assets and a decrease in the liability per capita from $1,300 to $1,105.
Service-Level Solvency
The variations in the metrics for service-level solvency are very small between FY 2013 and FY 2014, resulting in little change in ranking among the states in this category. North Carolina improved its service-level solvency by six posi-tions, moving from 24th to 18th.
Trust Fund Solvency
Five states moved more than five spots for trust fund solvency in FY 2014. Colorado improved by six spots, primarily because of decreases in the state’s
35. As explained in footnote 29, the restatement of FY 2013 data affected Iowa’s rank movement in both the cash solvency and budget solvency categories.

MERCATUS CENTER AT GEORGE MASON UNIVERSIT Y
33
unfunded pension and OPEB liabilities. Arizona improved eight spots, primar-ily because of a decrease in reported OPEB liabilities. Three states—Montana, New Jersey, and Washington—declined in the trust fund solvency ranking, by 9, 10, and 6 places, respectively. Montana’s total unfunded pension liability on a risk-adjusted basis grew from $12.3 billion to $15.6 billion, accounting for 38 percent of state personal income.36
3. THE TOP FIVE AND BOTTOM FIVE STATES
We discuss the fiscal performance of the top and bottom five states.
The Top Five States
In this year’s ranking, four of the top-performing states in FY 2013 remain at the top: Alaska, North Dakota, South Dakota, and Nebraska. Wyoming joins the top five, and Florida drops to number six.
Three of the top-performing states—Alaska (1), Wyoming (3), and North Dakota (4)—have high levels of cash, revenues, and assets relative to other states, but they are also largely dependent on oil revenues to finance spending. Interpreting these ratios requires the context provided by the management discussion and analysis in the CAFR, as well as economic and institutional fac-tors affecting state finances.37
The biggest economic risk affecting these states is energy prices. For the fiscal year ending June 30, 2014, all three states reported strong surpluses. Since those figures were reported, oil prices began a steep decline, from $100 per barrel to the current price of $40 per barrel.38 Alaska reported $17 billion in
36. One reason for increased pension liabilities in New Jersey and Montana is that this year’s study includes additional pension plans for New Jersey. In the case of Montana, the FY 2014 actuarial reports for the Montana Public Employees’ Retirement System presents two estimates of the plan’s liabilities based on the effect of legislation that was the subject of a lawsuit during FY 2014. Last year’s study used estimates of the pension liability from the FY 2013 actuarial reports, which took into account HB 454, legislation that has the effect of lowering the actuarial liability. Because the legislation was the subject of litigation at the time the FY 2014 report was produced, this year’s study uses an estimate that disregards the effect of HB 454, thus increasing the size of the liability. Because of this discrepancy, the liability for the retirement system grew by $1.7 billion on a risk-adjusted basis.37. This raises an important question: to what extent are CAFRs helpful in determining risk in state finances? Is the current method of recording cash and assets reflective of the true fiscal posi-tion of the state, and should the CAFR highlight risks associated with revenue structure or spending commitments?38. US Energy Information Administration, “Crude Oil Prices to Remain Relatively Low through 2016 and 2017,” January 13, 2016.
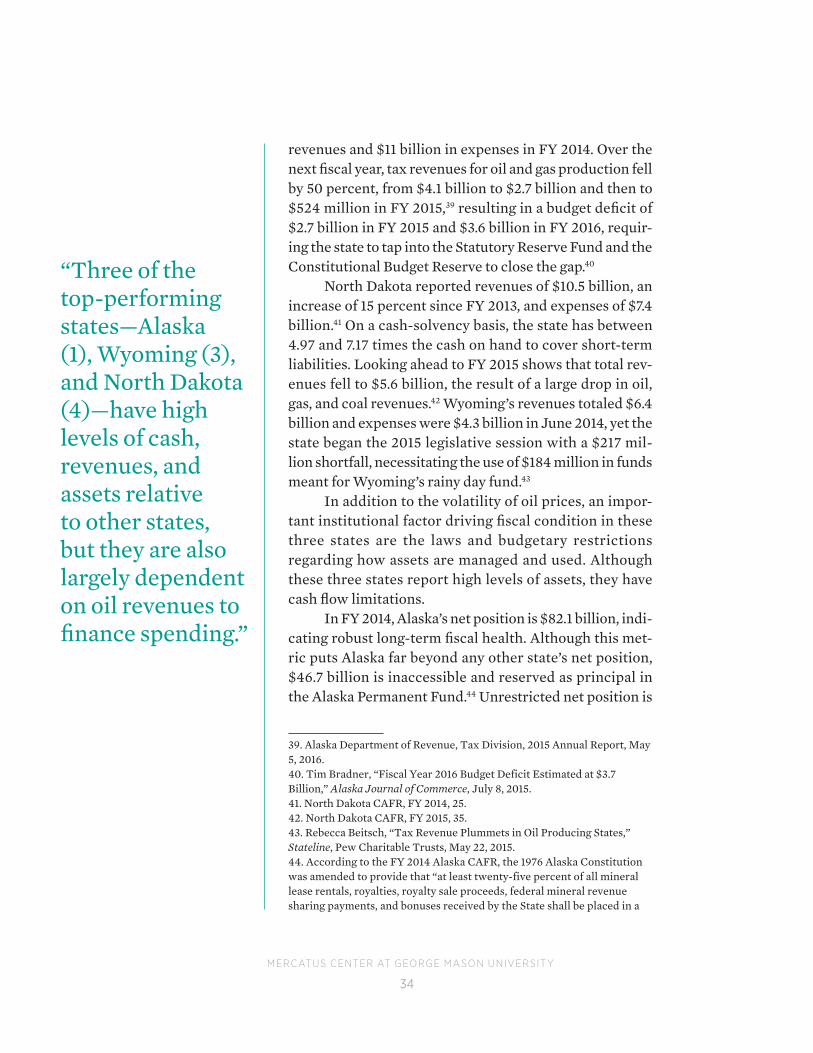
MERCATUS CENTER AT GEORGE MASON UNIVERSIT Y
34
revenues and $11 billion in expenses in FY 2014. Over the next fiscal year, tax revenues for oil and gas production fell by 50 percent, from $4.1 billion to $2.7 billion and then to $524 million in FY 2015,39 resulting in a budget deficit of $2.7 billion in FY 2015 and $3.6 billion in FY 2016, requir-ing the state to tap into the Statutory Reserve Fund and the Constitutional Budget Reserve to close the gap.40
North Dakota reported revenues of $10.5 billion, an increase of 15 percent since FY 2013, and expenses of $7.4 billion.41 On a cash-solvency basis, the state has between 4.97 and 7.17 times the cash on hand to cover short-term liabilities. Looking ahead to FY 2015 shows that total rev-enues fell to $5.6 billion, the result of a large drop in oil, gas, and coal revenues.42 Wyoming’s revenues totaled $6.4 billion and expenses were $4.3 billion in June 2014, yet the state began the 2015 legislative session with a $217 mil-lion shortfall, necessitating the use of $184 million in funds meant for Wyoming’s rainy day fund.43
In addition to the volatility of oil prices, an impor-tant institutional factor driving fiscal condition in these three states are the laws and budgetary restrictions regarding how assets are managed and used. Although these three states report high levels of assets, they have cash flow limitations.
In FY 2014, Alaska’s net position is $82.1 billion, indi-cating robust long-term fiscal health. Although this met-ric puts Alaska far beyond any other state’s net position, $46.7 billion is inaccessible and reserved as principal in the Alaska Permanent Fund.44 Unrestricted net position is
39. Alaska Department of Revenue, Tax Division, 2015 Annual Report, May 5, 2016.40. Tim Bradner, “Fiscal Year 2016 Budget Deficit Estimated at $3.7 Billion,” Alaska Journal of Commerce, July 8, 2015.41. North Dakota CAFR, FY 2014, 25.42. North Dakota CAFR, FY 2015, 35.43. Rebecca Beitsch, “Tax Revenue Plummets in Oil Producing States,” Stateline, Pew Charitable Trusts, May 22, 2015. 44. According to the FY 2014 Alaska CAFR, the 1976 Alaska Constitution was amended to provide that “at least twenty-five percent of all mineral lease rentals, royalties, royalty sale proceeds, federal mineral revenue sharing payments, and bonuses received by the State shall be placed in a
“Three of the top-performing states—Alaska (1), Wyoming (3), and North Dakota (4)—have high levels of cash, revenues, and assets relative to other states, but they are also largely dependent on oil revenues to finance spending.”

MERCATUS CENTER AT GEORGE MASON UNIVERSIT Y
35
$28.3 billion and consists of unrestricted assets that may be used for committed, assigned, and unassigned spending.45
Similarly, North Dakota reports a net position of $17.3 billion, an increase of 22 percent since FY 2013, ranking it 10th for long-run solvency. About 49 per-cent of that amount is categorized as unrestricted. Unrestricted does not mean uncommitted. These assets may have statutory limitations placed on how they are spent. Like Alaska and North Dakota, Wyoming also has a permanent trust into which assets that are restricted for use are deposited, thus inflating the net asset ratio far beyond the national average.
Alaska’s dependence on oil and gas revenues hurts its position for service-level solvency. Total taxes account for 7 percent of total state personal income, slightly higher than average for the states. Revenues account for 43 percent of state personal income. Total expenses are 28 percent of state personal income, twice the national average. The large gap between total taxes and total expenses highlights the degree to which spending in Alaska is dependent on oil revenues.
A similar picture emerges in Wyoming. Total taxes are 9 percent of state personal income, whereas total revenues account for 20 percent of state per-sonal income and expenses are 14 percent, again underscoring the degree to which Wyoming’s spending is reliant on nontax revenues for spending. North Dakota’s revenue mix is slightly more balanced and includes revenues from sales and income taxes, leaving a smaller gap between North Dakota’s spending and total tax revenues.
Alaska also does not fare well in trust fund solvency. Unfunded pension liabilities are large relative to the total income of Alaska residents. On a risk-adjusted basis, total unfunded pension liabilities amount to $28.0 billion, or 70 percent of state personal income. One caveat to note is that unfunded pension liabilities are large relative to resident income, but small relative to Alaska’s total revenues. That is, the state has the means to fund this benefit based on its revenues. Another mitigating factor to note is that Alaska’s public employees’ pension system is closed and not accruing future obligations, thus minimizing the long-term financial risk to the state.
North Dakota’s and Wyoming’s trust fund solvency metrics are very strong.46 These states have very low levels of debt and OPEB obligations.
permanent fund, the principal of which shall be used only for those income-producing investments specifically designated by law as eligible for permanent fund investments. All income from the per-manent fund shall be deposited in the General Fund unless otherwise provided by law” (page 14).45. Alaska CAFR, FY 2014, 14.46. Wyoming’s FY 2014 CAFR and FY 2015 CAFR continue to report the unfunded liability for FY 2013 for the OPEB liability.

MERCATUS CENTER AT GEORGE MASON UNIVERSIT Y
36
Unfunded pension obligations on a risk-adjusted basis are larger than reported and are one area that lawmakers should monitor. On a risk-adjusted basis, North Dakota’s pension obligations are $8.2 billion, or 20 percent of state per-sonal income. Wyoming’s unfunded pension liability of $10.5 billion on a risk-adjusted basis accounts for 33 percent of state personal income, slightly above the national average.
The other top states for FY 2014 are Nebraska (2) and South Dakota (5). Nebraska moved up in the fiscal rankings from fourth place to second place. The state saw improvements in its cash position and assets. Revenues increased slightly in FY 2014, though the state has a small surplus. Nebraska’s revenues exceed expenses, and total taxes as a proportion of state personal income are 5 percent, below the national average. Nebraska carries very low levels of debt: $24 million in total bonded debt and no OPEB obligations. On a risk-adjusted basis, total unfunded pension liabilities are Nebraska’s largest long-term obli-gation, at $13.9 billion, or 16 percent of total state personal income. Together these three metrics give Nebraska its first-place ranking for trust fund solvency.
South Dakota’s fiscal ranking dropped from third place to fifth place in FY 2014. The state’s cash metrics increased. South Dakota has between 5.82 and 8.19 times the cash on hand to cover short-term liabilities, far beyond the benchmark of 2. On a budget-solvency basis, South Dakota’s metrics also increased slightly, with revenues exceeding expenses by 9 percent. Net assets account for 32 percent of total assets, and liabilities amount to 9 percent of total assets. South Dakota’s service-level solvency metrics are the same as in FY 2013, though the state declined in its relative ranking from third place to fourth place. Taxes, revenues, and expenses account for 4, 10, and 9 percent of state personal income, respectively. In FY 2014, the total unfunded pension liability increased from $6.4 billion to $7.7 billion on a risk-adjusted basis, or from 17 percent to 20 percent of state personal income. Debt and OPEB remain small and unchanged.
The Bottom Five States and Puerto Rico
In FY 2014, four of the states that ranked at the bottom last year—New Jersey, Illinois, Massachusetts, and Connecticut—remain weak performers. Kentucky joins the bottom five, ranking 46th for fiscal solvency. These five states share a few commonalities: (1) weak levels of cash solvency, (2) expenses that exceed revenues, (3) a reliance on debt finance, and (4) a large amount of unfunded obligation for pensions and OPEB. This year Puerto Rico is included in the analysis, given its fiscal crisis.

MERCATUS CENTER AT GEORGE MASON UNIVERSIT Y
37
“All five of the bottom-performing states have attempted pension reform, and some of those efforts will make a difference in slowing the growth of these obligations in the long run.”
On a cash-solvency basis, these five states and Puerto Rico have insufficient levels of cash to cover short-term liabilities, with cash and quick ratios of less than two. Massachusetts and Puerto Rico have the weakest cash ratios, of 0.39 and 0.32, respectively. According to the most generous measure of cash solvency, the current ratio, Ken-tucky and New Jersey have ratios of 2.08 and 2.00, respec-tively. Puerto Rico’s cash metrics are insufficient by every measure. By the most generous measure, Puerto Rico has 77 percent of the current assets needed to cover current liabilities.
Each of these states and Puerto Rico reports a deficit per capita and an operating ratio of less than one, indicat-ing that expenses are greater than revenues in FY 2014. Connecticut and New Jersey both share the weakest oper-ating ratios, with revenues covering only 94 percent of expenses. In Puerto Rico, revenues are sufficient to cover only 88 percent of expenses.
The long-run solvency metrics are also very poor in the bottom five states, though the reasons for negative net asset ratios and high levels of liabilities vary. Illinois and New Jersey have the weakest net asset ratios, of −1.14 and −1.46, respectively. New Jersey’s ongoing challenges with debt for school construction bonds, pension bonds, and pay-as-you-go finance for OPEB drive the state’s poor long-term outlook. Long-term liabilities are two times larger than assets. Long-term debt per capita is $9,285, slightly more than in FY 2013. These measures place the Garden State closest to Puerto Rico, which recorded liabilities that are 3.71 times larger than its assets in FY 2014 and a liabil-ity per capita of $16,646. However, New Jersey’s economy and total state income measures are stronger than Puerto Rico’s, which puts New Jersey in a far better position to manage these long-term liabilities.
Illinois’s liabilities exceed total assets by 48 per-cent. In addition, the state’s total liabilities per capita increased from $5,710 to $6,067. Massachusetts’s long-term ratios are also weak. In FY 2014, liabilities exceed assets by $23.4 billion, producing a long-term liability

MERCATUS CENTER AT GEORGE MASON UNIVERSIT Y
38
ratio of 1.53. Massachusetts has a net asset ratio of −0.94 because of debts and pension funding.47 Connecticut’s net asset ratio of −0.88 is driven by a deficit in unrestricted net assets as a result of $6.5 billion in GO bonds for municipal projects, including school construction; $2.3 billion for pension obligation bonds; and $11.6 billion in other long-term liabilities, such as OPEB, net pen-sion expenses, and compensated absences.
All five of the bottom-performing states have attempted pension reform, and some of those efforts will make a difference in slowing the growth of these obligations in the long run. However, legacy obligations for pension and OPEB are likely to continue drawing on state revenues in the coming years.
Regarding trust fund solvency, Illinois and Kentucky have unfunded pen-sion liabilities that represent 49 percent and 47 percent of total state personal income, respectively, with debt and OPEB obligations pushing both states to the bottom of the trust fund solvency rankings. Connecticut’s unfunded pension liabilities, on a risk-adjusted basis, are significant and represent 36 percent of state personal income; adding in OPEB and debt brings the total to 53 percent of state personal income. Massachusetts performs better in this category. New Jersey’s high level of state personal income means that unfunded pension obliga-tions represent 37 percent of resident income; however, OPEB and debt account for 13 percent and 8 percent of state personal income, respectively. Total debt and unfunded obligations represent 58 percent of total state personal income in New Jersey. Puerto Rico’s unfunded pensions alone account for 68 percent of the income of residents, and total debt exceeds the total income of Puerto Rico’s resi-dents by 13 percent—two strong signals that underscore its current fiscal crisis.
4. CONCLUSION
Updating the fiscal condition of the states with another year of data for FY 2014 shows that most states’ fiscal performance remains relatively constant. In addition to allowing us to compare two years of fiscal performance in the states, this year’s fiscal rankings provide some insight into the limits of the CAFR data. Analysts and the public have difficulty knowing the true fiscal position of a state
47. The FY 2014 CAFR for Massachusetts states five reasons for a negative unrestricted net posi-tion: (1) a net liability of $6.17 billion for construction costs related to schools owned and operated by municipalities through the Massachusetts School Building Authority; (2) the transfer of $15.5 billion in assets to the Massachusetts Department of Transportation and the retention of the transportation-related debt associated with those projects; (3) debt issued for nontransportation assets not owned by the commonwealth, including assets held by quasi-public entities, local governments, and hous-ing authorities; (4) pension funding; and (5) the dedication of payments from the Master Settlement Agreement with tobacco companies to fund the OPEB liabilities.

MERCATUS CENTER AT GEORGE MASON UNIVERSIT Y
39
because highly aggregated line items require detailed notes for interpretation. For example, high levels of cash and assets do not necessarily mean that states are invulnerable to budget gaps or fiscal uncertainty.
Barriers may exist that determine how restricted and unrestricted assets may be used. Windfall revenues that are tied to oil, gas, or other natural resources are subject to economic risks and dramatic swings in prices—a fac-tor that is now negatively affecting the budget outlook of several of the top-performing states. These rankings cannot capture the full fiscal performance of a government, but they give us a snapshot of the states’ fiscal health. We hope that by providing comparative metrics over a period of years, this study will point to trends and also to areas where the reporting of these metrics may be improved in order to give the public a clear picture of states’ fiscal health, risks, and outlook.

MERCATUS CENTER AT GEORGE MASON UNIVERSIT Y
40
APPENDIX A: DATA TABLES
TABLE A1. COMPONENTS OF CASH SOLVENCY: CASH, QUICK, AND CURRENT RATIOS FOR THE STATES
State Cash ratio Quick ratio Current ratio State Cash ratio Quick ratio Current ratio
Alabama 3.58 4.15 4.92 Nebraska 3.81 4.82 5.02
Alaska 22.46 22.81 23.44 Nevada 2.07 3.39 3.43
Arizona 0.84 1.10 1.33 New Hampshire 0.64 1.38 2.47
Arkansas 2.65 3.28 3.47 New Jersey 0.63 1.99 2.00
California 0.67 1.03 1.44 New Mexico 1.57 2.13 3.01
Colorado 1.25 1.76 2.01 New York 0.69 1.67 1.70
Connecticut 0.46 1.11 1.19 North Carolina 0.93 1.65 2.09
Delaware 1.90 2.89 3.23 North Dakota 4.97 5.65 7.17
Florida 6.53 7.50 7.52 Ohio 4.64 5.80 6.22
Georgia 1.64 2.44 2.52 Oklahoma 3.09 3.74 3.79
Hawaii 1.93 2.59 2.73 Oregon 1.86 2.46 2.65
Idaho 2.68 3.23 4.08 Pennsylvania 0.75 1.11 1.38
Illinois 0.63 0.98 1.39 Puerto Rico 0.32 0.74 0.77
Indiana 1.41 2.09 2.56 Rhode Island 0.86 1.49 1.73
Iowa 1.57 2.41 2.51 South Carolina 2.19 2.91 3.57
Kansas 1.24 2.20 2.22 South Dakota 5.82 8.05 8.19
Kentucky 0.75 1.59 2.08 Tennessee 3.42 4.54 4.89
Louisiana 1.99 2.48 3.26 Texas 1.29 1.78 2.15
Maine 0.46 1.10 1.74 Utah 4.17 5.98 6.25
Maryland 0.51 1.29 1.52 Vermont 1.28 2.19 2.23
Massachusetts 0.39 1.08 1.12 Virginia 1.63 2.33 2.40
Michigan 1.04 1.77 2.26 Washington 1.74 2.89 3.65
Minnesota 2.04 2.53 2.78 West Virginia 1.50 1.79 2.02
Mississippi 2.37 2.72 3.04 Wisconsin 0.94 1.89 1.95
Missouri 2.26 4.36 4.49 Wyoming 4.17 4.44 5.32
Montana 4.31 4.76 5.67

MERCATUS CENTER AT GEORGE MASON UNIVERSIT Y
41
TABLE A2. COMPONENTS OF BUDGET SOLVENCY: OPERATING RATIO AND SURPLUS OR DEFICIT PER CAPITA
State Operating ratioSurplus or deficit per
capita ($) State Operating ratioSurplus or deficit per
capita ($)
Alabama 1.02 95.99 Nebraska 1.07 294.21
Alaska 1.55 8,296.10 Nevada 1.06 174.18
Arizona 1.05 231.22 New Hampshire 1.00 18.35
Arkansas 1.02 114.27 New Jersey 0.94 −396.19
California 1.04 249.82 New Mexico 1.06 492.55
Colorado 1.05 250.02 New York 1.02 124.88
Connecticut 0.94 −505.15 North Carolina 1.10 400.70
Delaware 0.98 –194.81 North Dakota 1.42 4,295.10
Florida 1.12 440.00 Ohio 1.05 277.69
Georgia 1.03 149.66 Oklahoma 1.05 259.64
Hawaii 0.99 −83.02 Oregon 1.05 299.63
Idaho 1.13 597.49 Pennsylvania 0.99 −55.64
Illinois 0.99 −40.37 Puerto Rico 0.88 −714.97
Indiana 1.04 179.76 Rhode Island 1.04 276.07
Iowa 1.04 249.70 South Carolina 1.07 304.43
Kansas 1.01 27.12 South Dakota 1.09 407.70
Kentucky 0.98 −100.29 Tennessee 1.02 81.50
Louisiana 0.96 −216.01 Texas 1.13 635.29
Maine 1.00 −20.48 Utah 1.14 499.58
Maryland 0.98 −122.33 Vermont 1.03 268.77
Massachusetts 0.96 −342.09 Virginia 1.03 150.74
Michigan 1.01 63.73 Washington 1.04 258.02
Minnesota 1.06 376.90 West Virginia 1.02 130.85
Mississippi 1.03 174.06 Wisconsin 1.06 374.22
Missouri 1.02 98.23 Wyoming 1.48 3,624.75
Montana 1.08 408.56

MERCATUS CENTER AT GEORGE MASON UNIVERSIT Y
42
TABLE A3. COMPONENTS OF LONG-RUN SOLVENCY: NET ASSET RATIO, LONG-TERM LIABILITY RATIO, AND LONG-TERM LIABILITIES PER CAPITA
StateNet asset
ratio
Long-term liability
ratio
Long-term liability per capita ($) State
Net asset ratio
Long-term liability
ratio
Long-term liability per capita ($)
Alabama 0.09 0.20 1,321 Nebraska 0.30 0.03 229
Alaska 0.85 0.03 3,626 Nevada 0.10 0.36 1,477
Arizona 0.15 0.26 1,582 New Hampshire 0.05 0.41 1,866
Arkansas 0.17 0.28 2,217 New Jersey −1.46 2.10 9,285
California −0.40 0.73 4,150 New Mexico 0.47 0.18 2,113
Colorado 0.27 0.21 1,351 New York −0.29 0.62 4,663
Connecticut −0.88 1.34 9,077 North Carolina 0.00 0.19 1,105
Delaware −0.03 0.51 6,226 North Dakota 0.62 0.12 3,824
Florida 0.11 0.34 2,350 Ohio 0.10 0.54 3,579
Georgia 0.06 0.38 1,690 Oklahoma 0.37 0.11 637
Hawaii 0.01 0.64 8,180 Oregon 0.19 0.36 3,175
Idaho 0.35 0.11 957 Pennsylvania −0.11 0.42 1,956
Illinois −1.14 1.48 6,067 Puerto Rico −3.32 3.71 16,646
Indiana 0.22 0.10 406 Rhode Island −0.11 0.48 2,659
Iowa 0.22 0.18 1,339 South Carolina 0.23 0.20 1,061
Kansas 0.12 0.23 1,362 South Dakota 0.32 0.09 718
Kentucky −0.36 0.56 3,933 Tennessee 0.13 0.10 541
Louisiana 0.04 0.44 2,883 Texas 0.37 0.21 2,072
Maine 0.03 0.24 1,115 Utah 0.29 0.18 1,754
Maryland −0.19 0.63 4,266 Vermont −0.03 0.38 2,335
Massachusetts −0.94 1.53 6,237 Virginia 0.00 0.30 1,476
Michigan 0.01 0.33 1,313 Washington 0.03 0.66 7,922
Minnesota 0.16 0.28 1,756 West Virginia 0.12 0.23 2,348
Mississippi 0.06 0.26 1,974 Wisconsin −0.06 0.37 2,701
Missouri 0.07 0.18 1,194 Wyoming 0.71 0.07 2,865
Montana 0.36 0.09 927

MERCATUS CENTER AT GEORGE MASON UNIVERSIT Y
43
TABLE A4. COMPONENTS OF SERVICE-LEVEL SOLVENCY: RATIOS OF TAXES, REVENUES, AND EXPENSES TO TOTAL STATE PERSONAL INCOME
State
Taxes to personal income
Revenues to personal
income
Expenses to personal
income State
Taxes to personal income
Revenues to personal
income
Expenses to personal
income
Alabama 0.04 0.12 0.11 Nebraska 0.05 0.10 0.09
Alaska 0.07 0.43 0.28 Nevada 0.04 0.08 0.07
Arizona 0.05 0.12 0.12 New Hampshire 0.03 0.09 0.09
Arkansas 0.07 0.17 0.17 New Jersey 0.06 0.11 0.12
California 0.06 0.13 0.12 New Mexico 0.07 0.23 0.21
Colorado 0.04 0.11 0.10 New York 0.06 0.14 0.14
Connecticut 0.06 0.12 0.13 North Carolina 0.06 0.12 0.11
Delaware 0.09 0.18 0.19 North Dakota 0.14 0.26 0.18
Florida 0.04 0.10 0.09 Ohio 0.05 0.13 0.12
Georgia 0.04 0.12 0.11 Oklahoma 0.05 0.11 0.11
Hawaii 0.09 0.16 0.16 Oregon 0.06 0.16 0.15
Idaho 0.06 0.15 0.13 Pennsylvania 0.05 0.11 0.12
Illinois 0.06 0.12 0.12 Puerto Rico 0.16 0.30 0.34
Indiana 0.06 0.12 0.11 Rhode Island 0.06 0.15 0.14
Iowa 0.05 0.14 0.14 South Carolina 0.05 0.13 0.12
Kansas 0.05 0.10 0.10 South Dakota 0.04 0.10 0.09
Kentucky 0.07 0.15 0.15 Tennessee 0.05 0.11 0.10
Louisiana 0.04 0.13 0.13 Texas 0.04 0.12 0.10
Maine 0.07 0.14 0.14 Utah 0.06 0.11 0.10
Maryland 0.05 0.11 0.11 Vermont 0.10 0.19 0.19
Massachusetts 0.06 0.13 0.14 Virginia 0.05 0.09 0.09
Michigan 0.06 0.13 0.13 Washington 0.05 0.13 0.13
Minnesota 0.08 0.14 0.13 West Virginia 0.08 0.18 0.18
Mississippi 0.07 0.16 0.16 Wisconsin 0.09 0.14 0.13
Missouri 0.04 0.10 0.10 Wyoming 0.09 0.20 0.14
Montana 0.06 0.14 0.13

MERCATUS CENTER AT GEORGE MASON UNIVERSIT Y
44
TABLE A5. COMPONENTS OF TRUST FUND SOLVENCY: RATIOS OF PRIMARY DEBT, PENSIONS, AND OTHER POSTEMPLOYMENT BENEFITS TO PERSONAL INCOME
State
Primary debt to personal
income
Pensions to personal
income
OPEB to personal income State
Primary debt to personal
income
Pensions to personal
income
OPEB to personal income
Alabama 0.03 0.33 0.06 Nebraska 0.00 0.16 n/a
Alaska 0.05 0.70 0.09 Nevada 0.03 0.48 0.01
Arizona 0.04 0.28 0.00 New Hampshire 0.02 0.21 0.03
Arkansas 0.03 0.29 0.02 New Jersey 0.08 0.37 0.13
California 0.06 0.39 0.01 New Mexico 0.04 0.55 0.04
Colorado 0.02 0.31 0.00 New York 0.05 0.25 0.07
Connecticut 0.09 0.36 0.08 North Carolina 0.02 0.19 0.07
Delaware 0.07 0.18 0.13 North Dakota 0.04 0.20 0.00
Florida 0.03 0.19 0.02 Ohio 0.04 0.54 0.03
Georgia 0.04 0.24 0.03 Oklahoma 0.01 0.25 0.00
Hawaii 0.12 0.44 0.17 Oregon 0.07 0.36 0.00
Idaho 0.02 0.23 0.00 Pennsylvania 0.03 0.28 0.03
Illinois 0.06 0.49 0.06 Puerto Rico 1.13 0.68 0.03
Indiana 0.00 0.16 0.00 Rhode Island 0.05 0.29 0.01
Iowa 0.03 0.26 0.00 South Carolina 0.02 0.34 0.05
Kansas 0.03 0.26 0.00 South Dakota 0.01 0.20 n/a
Kentucky 0.05 0.47 0.03 Tennessee 0.01 0.14 0.00
Louisiana 0.06 0.37 0.03 Texas 0.04 0.19 0.05
Maine 0.02 0.26 0.00 Utah 0.04 0.27 0.00
Maryland 0.05 0.23 0.03 Vermont 0.02 0.15 0.06
Massachusetts 0.07 0.24 0.04 Virginia 0.02 0.21 0.01
Michigan 0.02 0.31 0.05 Washington 0.07 0.23 0.01
Minnesota 0.03 0.33 0.00 West Virginia 0.03 0.30 0.04
Mississippi 0.05 0.50 0.01 Wisconsin 0.05 0.14 0.00
Missouri 0.02 0.31 0.01 Wyoming 0.00 0.33 0.01
Montana 0.01 0.38 0.01
Note: n/a = not available; OPEB = other postemployment benefits.

MERCATUS CENTER AT GEORGE MASON UNIVERSIT Y
45
TABLE A6. STATE DEBT
State
Total general obligation bonds
($ thousands)
Total primary government debt
($ thousands)Personal income
($ thousands)Ratio of debt to personal income
Total primary debt per capita
($)
Alabama 680,476 5,022,733 181,908,767 0.03 1,036
Alaska 691,720 1,929,288 39,792,685 0.05 2,619
Arizona 0 10,067,269 255,092,928 0.04 1,496
Arkansas 1,373,554 3,826,624 112,076,107 0.03 1,290
California 83,950,539 118,171,001 1,939,527,656 0.06 3,045
Colorado 0 6,321,917 261,735,447 0.02 1,180
Connecticut 15,282,000 20,884,115 233,293,455 0.09 5,807
Delaware 1,999,995 3,021,708 43,391,982 0.07 3,230
Florida 11,816,000 27,162,000 850,177,746 0.03 1,365
Georgia 9,437,844 14,622,717 393,593,652 0.04 1,448
Hawaii 5,815,315 7,782,570 65,347,949 0.12 5,482
Idaho 0 1,344,592 60,040,758 0.02 823
Illinois 27,055,000 35,546,086 613,671,539 0.06 2,760
Indiana 0 1,112,599 261,092,396 0.00 169
Iowa 0 3,679,355 139,624,515 0.03 1,184
Kansas 0 3,956,271 130,364,095 0.03 1,362
Kentucky 0 8,228,532 165,044,051 0.05 1,864
Louisiana 3,137,100 12,307,345 195,426,167 0.06 2,647
Maine 399,190 1,201,366 54,195,046 0.02 903
Maryland 8,362,000 17,211,185 323,778,035 0.05 2,880
Massachusetts 19,597,000 26,733,990 396,205,941 0.07 3,963
Michigan 4,313,146 7,411,000 403,726,369 0.02 748
Minnesota 6,906,793 8,840,253 267,389,243 0.03 1,620
Mississippi 4,313,146 5,415,232 103,090,592 0.05 1,809
Missouri 323,395 3,787,515 252,482,438 0.02 625
Montana 127,840 266,076 40,843,525 0.01 260
Nebraska 0 23,740 89,478,670 0.00 13
Nevada 1,786,865 3,593,454 115,671,839 0.03 1,266
New Hampshire 1,621,300 1,623,655 70,020,358 0.02 1,224
New Jersey 2,157,500 41,835,284 515,020,298 0.08 4,681
New Mexico 311,270 3,402,571 77,356,150 0.04 1,631
New York 3,345,000 58,322,000 1,098,102,853 0.05 2,954
North Carolina 3,607,100 8,588,599 389,512,571 0.02 864
North Dakota 0 1,599,742 41,264,895 0.04 2,163

MERCATUS CENTER AT GEORGE MASON UNIVERSIT Y
46
State
Total general obligation bonds
($ thousands)
Total primary government debt
($ thousands)Personal income
($ thousands)Ratio of debt to personal income
Total primary debt per capita
($)
Ohio 9,366,348 17,749,721 489,694,974 0.04 1,531
Oklahoma 131,955 2,371,358 169,227,826 0.01 611
Oregon 5,613,726 11,187,127 163,652,836 0.07 2,818
Pennsylvania 12,674,929 17,656,577 609,679,210 0.03 1,381
Puerto Rico 38,478,000 72,266,800 63,779,000 1.13 20,366
Rhode Island 1,074,750 2,670,021 51,026,876 0.05 2,530
South Carolina 1,320,532 3,389,520 177,242,275 0.02 701
South Dakota 0 486,358 38,631,202 0.01 570
Tennessee 1,996,458 2,342,622 264,965,180 0.01 358
Texas 15,817,000 44,369,000 1,231,084,591 0.04 1,646
Utah 3,271,000 4,903,000 110,841,885 0.04 1,666
Vermont 560,850 595,345 29,090,044 0.02 950
Virginia 742,869 6,855,183 419,184,911 0.02 823
Washington 19,378,000 24,142,000 350,321,729 0.07 3,419
West Virginia 460,428 2,070,945 66,856,850 0.03 1,119
Wisconsin 7,260,853 13,649,780 254,404,802 0.05 2,371
Wyoming 0 29,020 31,885,231 0.00 50

MERCATUS CENTER AT GEORGE MASON UNIVERSIT Y
47
TABLE A7. PENSION LIABILITIES UNDER STATE DISCOUNT RATE ASSUMPTIONS
State (number of plans)
Assets ($ thousands)
Liabilities ($ thousands)
Unfunded liability
($ thousands) Funded ratio (%)
Unfunded liability to personal income (%)
Alabama (3) 31,201,904 46,398,986 15,197,083 67 8
Alaska (5) 11,666,853 20,120,324 8,453,471 58 21
Arizona (4) 39,391,578 57,015,808 17,624,230 69 7
Arkansas (6) 22,025,015 28,198,371 6,173,356 78 6
California (8) 530,349,106 700,053,815 169,704,709 75 9
Colorado (6) 41,148,421 66,336,829 25,188,408 62 10
Connecticut (5) 28,605,093 54,782,135 26,177,041 52 11
Delaware (7) 8,810,870 9,531,960 721,089 92 2
Florida (1) 138,600,000 160,100,000 21,500,000 87 3
Georgia (7) 72,830,190 91,381,449 18,551,259 80 5
Hawaii (2) 13,641,755 22,220,098 8,578,342 61 13
Idaho (3) 14,261,404 15,324,090 1,062,686 93 2
Illinois (6) 101,725,235 220,643,654 118,918,419 46 19
Indiana (8) 29,393,271 43,689,185 14,295,914 67 5
Iowa (4) 29,017,936 35,312,554 6,294,618 82 5
Kansas (3) 15,662,010 25,130,467 9,468,457 62 7
Kentucky (4) 27,709,086 56,707,141 28,998,055 49 18
Louisiana (10) 36,122,179 58,002,330 21,880,151 59 11
Maine (4) 12,419,559 14,991,882 2,572,323 83 5
Maryland (8) 42,996,957 62,610,194 19,613,237 100 6
Massachusetts (2) 44,521,329 71,421,295 26,899,966 62 7
Michigan (6) 57,204,300 91,431,000 34,226,700 63 8
Minnesota (9) 53,578,226 70,447,374 16,869,148 76 6
Mississippi (4) 23,038,107 37,821,735 14,783,628 61 14
Missouri (7) 54,538,080 67,813,552 13,275,472 79 5
Montana (9) 9,214,256 13,014,543 3,800,286 71 9
Nebraska (5) 10,705,030 12,531,066 1,826,035 85 2
Nevada (1) 31,465,600 43,997,100 12,531,500 72 11
New Hampshire (2) 6,741,690 11,125,887 4,384,196 61 6
New Jersey (7) 86,318,527 141,058,023 54,739,495 61 11
New Mexico (6) 24,401,932 35,003,785 10,601,853 70 14
New York (3) 254,430,400 278,365,900 23,935,500 91 2
North Carolina (7) 84,912,602 88,494,410 3,581,808 96 1
North Dakota (4) 3,969,074 6,197,801 2,228,727 64 5

MERCATUS CENTER AT GEORGE MASON UNIVERSIT Y
48
State (number of plans)
Assets ($ thousands)
Liabilities ($ thousands)
Unfunded liability
($ thousands) Funded ratio (%)
Unfunded liability to personal income (%)
Ohio (4) 164,467,373 219,486,528 55,019,155 75 11
Oklahoma (6) 25,301,720 34,934,521 9,632,801 72 6
Oregon (2) 60,134,700 62,539,000 2,404,300 96 1
Pennsylvania (3) 85,901,122 139,220,892 53,319,770 62 9
Puerto Rico (3) n/a n/a 43,638,249 n/a 68
Rhode Island (5) 7,690,952 12,303,608 4,612,656 63 9
South Carolina (5) 31,230,562 49,196,349 17,965,787 63 10
South Dakota (1) 9,887,095 9,887,095 0 100 0
Tennessee (1) 39,249,300 41,913,400 2,664,100 94 1
Texas (8) 155,200,227 195,059,860 39,859,633 80 3
Utah (8) 25,473,901 30,025,458 4,551,557 85 4
Vermont (3) 3,676,919 5,278,111 1,601,192 68 6
Virginia (6) 59,270,874 85,540,753 26,269,879 69 6
Washington (11) 68,783,000 78,638,600 9,855,600 87 3
West Virginia (8) 11,397,709 16,949,245 5,551,536 67 8
Wisconsin (1) 89,360,400 89,392,100 31,700 100 0
Wyoming (9) 7,609,783 9,510,161 1,900,378 80 6
TOTAL 2,837,253,214 3,837,150,422 1,043,535,457
Source: “Accounting for Pensions by State and Local Governmental Employees” (Statement No. 27, Governmental Accounting Standards Board, November, 1994).
Note: n/a = not available. For Puerto Rico, the net pension liability is reported instead of the unfunded actuarial accrued liability.

MERCATUS CENTER AT GEORGE MASON UNIVERSIT Y
49
TABLE A8. PENSION LIABILITIES DISCOUNTED USING RISK-FREE DISCOUNT RATE
State (number of plans)
Market value of liability
($ thousands)
Market value of unfunded liability
($ thousands)Funded ratio
(%)
Unfunded liability to personal income
(%)
Alabama (3) 91,630,098 60,428,195 34 33
Alaska (5) 39,706,571 28,039,718 29 70
Arizona (4) 111,551,862 72,160,284 35 28
Arkansas (6) 54,443,446 32,418,431 40 29
California (8) 1,287,021,006 756,671,900 41 39
Colorado (6) 122,195,440 81,047,019 34 31
Connecticut (5) 111,918,432 83,313,338 26 36
Delaware (7) 16,837,488 8,026,618 52 18
Florida (1) 301,144,665 162,544,665 46 19
Georgia (7) 168,125,379 95,295,189 43 24
Hawaii (2) 42,381,710 28,739,954 32 44
Idaho (3) 28,227,667 13,966,263 51 23
Illinois (6) 399,778,234 298,053,000 25 49
Indiana (8) 72,454,527 43,061,257 41 16
Iowa (4) 65,115,821 36,097,885 45 26
Kansas (3) 49,628,393 33,966,384 32 26
Kentucky (4) 106,036,761 78,327,674 26 47
Louisiana (10) 109,383,184 73,261,004 33 37
Maine (4) 26,667,912 14,248,353 47 26
Maryland (8) 117,768,431 74,771,474 37 23
Massachusetts (2) 138,974,932 94,453,603 32 24
Michigan (6) 180,514,235 123,309,935 32 31
Minnesota (9) 140,858,798 87,446,358 38 33
Mississippi (4) 74,691,487 51,653,380 31 50
Missouri (7) 132,648,553 78,110,473 41 31
Montana (9) 24,823,409 15,609,153 37 38
Nebraska (5) 24,642,330 13,937,300 43 16
Nevada (1) 86,886,782 55,421,182 36 48
New Hampshire (2) 21,221,064 14,479,373 32 21
New Jersey (7) 274,713,835 188,395,308 31 37
New Mexico (6) 66,764,795 42,362,862 37 55
New York (3) 525,012,073 270,581,673 48 25
North Carolina (7) 157,407,778 72,495,176 54 19
North Dakota (4) 12,239,601 8,270,528 32 20

MERCATUS CENTER AT GEORGE MASON UNIVERSIT Y
50
State (number of plans)
Market value of liability
($ thousands)
Market value of unfunded liability
($ thousands)Funded ratio
(%)
Unfunded liability to personal income
(%)
Ohio (4) 426,937,628 262,470,255 39 54
Oklahoma (6) 66,950,298 41,648,578 38 25
Oregon (2) 119,284,343 59,149,643 50 36
Pennsylvania (3) 255,544,381 169,643,259 34 28
Puerto Rico (3) n/a n/a n/a 0
Rhode Island (5) 22,663,803 14,972,851 34 29
South Carolina (5) 90,621,901 59,391,339 34 34
South Dakota (1) 17,587,397 7,700,302 56 20
Tennessee (1) 77,206,379 37,957,079 51 14
Texas (8) 384,916,467 229,716,240 40 19
Utah (8) 55,308,252 29,834,351 46 27
Vermont (3) 8,158,043 4,481,123 45 15
Virginia (6) 146,927,491 87,656,617 40 21
Washington (11) 150,318,411 81,535,411 46 23
West Virginia (8) 31,221,276 19,823,567 37 30
Wisconsin (1) 124,239,405 34,879,005 72 14
Wyoming (9) 18,139,294 10,529,511 42 33
TOTAL 7,179,441,468 4,342,354,041
Note: n/a = not available. For Puerto Rico, the net pension liability is reported instead of the unfunded actuarial accrued liability.

MERCATUS CENTER AT GEORGE MASON UNIVERSIT Y
51
TABLE A9. OTHER POSTEMPLOYMENT BENEFITS: RETIREE HEALTH BENEFITS
State
Total unfunded OPEB liability ($ thousands)
Funded ratio
OPEB to personal income State
Total unfunded OPEB liability ($ thousands)
Funded ratio
OPEB to personal income
Alabama 11,638,490 10 6 Nebraska n/a n/a n/a
Alaska 3,623,032 1 9 Nevada 1,270,691 0 1
Arizona 78,997 96 0 New Hampshire 1,865,714 0 3
Arkansas 1,780,101 0 2 New Jersey 66,804,600 0 13
California 29,047,000 8 1 New Mexico 3,363,280 100 4
Colorado 1,237,084 19 0 New York 78,727,000 0 7
Connecticut 19,532,514 1 8 North Carolina 25,639,930 5 7
Delaware 5,656,000 5 13 North Dakota 72,500 52 0
Florida 15,215,163 0 2 Ohio 15,457,584 52 3
Georgia 11,136,282 9 3 Oklahoma 4,760 0 0
Hawaii 11,181,509 3 17 Oregon 176,300 67 0
Idaho 106,709 21 0 Pennsylvania 17,380,460 1 3
Illinois 34,488,085 0 6 Puerto Rico 1,988,220 0 3
Indiana 289,922 24 0 Rhode Island 714,139 8 2
Iowa 233,200 0 0 South Carolina 9,403,955 7 6
Kansas 261,298 0 0 South Dakota 0 0 0
Kentucky 4,346,596 30 3 Tennessee 1,225,112 0 0
Louisiana 5,482,256 0 3 Texas 66,950,557 1 5
Maine 94,600 49 0 Utah 267,715 38 0
Maryland 8,714,176 3 3 Vermont 1,840,599 1 6
Massachusetts 15,377,400 3 4 Virginia 5,194,000 21 2
Michigan 20,595,000 12 5 Washington 3,707,000 0 1
Minnesota 651,890 0 0 West Virginia 2,734,642 20 5
Mississippi 762,358 0 1 Wisconsin 892,844 0 0
Missouri 2,469,280 4 1 Wyoming 243,728 0 1
Montana 466,986 0 1
Note: n/a = not available; OPEB = other postemployment benefits.

MERCATUS CENTER AT GEORGE MASON UNIVERSIT Y
52
TABLE A10. PENSION PLANS
State Plan
AlabamaEmployees’ Retirement System of AlabamaTeachers’ Retirement System of Alabama
Judicial Retirement Fund
Alaska
Public Employees’ Retirement System (closed)Teachers’ Retirement System (closed)
Judicial Retirement SystemNational Guard and Naval Militia Retirement System
Elected Public Officers Retirement System
Arizona
Arizona State Retirement SystemPublic Safety Personnel Retirement Systems
Corrections Officer Retirement PlanElected Officials’ Retirement Plan
Arkansas
Arkansas Public Employees Retirement SystemArkansas District Judges Retirement System
Arkansas Teacher Retirement SystemArkansas State Police Retirement System
Arkansas Judicial Retirement SystemArkansas State Highway Employees Retirement System
California
Public Employees’ Retirement FundLegislators Retirement Fund
Judges’ Retirement FundJudges’ Retirement Fund II
California State Teachers’ Retirement System—DB PlanCalifornia State Teachers’ Retirement System—Cash Balance Plan
California State Teachers’ Retirement System—DB SupplementUniversity of California Retirement Plan
Colorado
Fire and Police Pension Association Fire and Police Pension Association—Hybrid Plan
State Division Trust FundSchool Division Trust Fund
Local Government Division Trust FundJudicial Division Trust Fund
Connecticut
State Employees’ Retirement SystemTeachers’ Retirement System
Judges, Family Support Magistrates and Compensation Commissioners Retirement System
Municipal Employees Retirement SystemProbate Judges and Employees Retirement System
Delaware
State Employees’ PlanNew State Police PlanRevised Judicial Plan
Diamond State Port Corporation PlansVolunteer Firemen’s Pension Plans
County and Municipal Plan—GeneralCounty and Municipal Plan—Police and Firefighters
Florida Florida Retirement System
Georgia
Employees’ Retirement System of GeorgiaPublic School Employees Retirement System
Legislative Retirement SystemGeorgia Judicial Retirement System
Georgia Military Pension FundTeachers Retirement SystemFirefighters’ Pension Fund
Hawaii Employees’ Retirement System of Hawaii

MERCATUS CENTER AT GEORGE MASON UNIVERSIT Y
53
State Plan
IdahoPublic Employee Retirement System of Idaho
Firefighters’ Retirement FundJudges’ Retirement Fund
Illinois
State Employees’ Retirement SystemJudges’ Retirement System
General Assembly Retirement SystemTeachers’ Retirement System
State Universities Retirement SystemIllinois Municipal Retirement System
Indiana
Public Employees’ Retirement FundTeachers’ Retirement Fund
1977 Police Officers’ and Firefighters’ Pension and Disability Fund Judges Retirement System
State Excise Police, Gaming Agent, Gaming Control Officer, and Conservation Enforcement Officers’ Retirement Plan
Prosecuting Attorneys’ Retirement FundLegislators’ Retirement System
Iowa
Iowa Public Employees’ Retirement SystemJudicial Retirement Fund
Peace Officers’ Retirement, Accident and Disability SystemMunicipal Fire and Police Retirement System
KansasKansas Public Employees Retirement System
Kansas Police and Firemen’s Retirement SystemKansas Retirement System for Judges
Kentucky
Kentucky Employees Retirement SystemTeachers’ Retirement System
Judicial Retirement PlanLegislative Retirement Plan
Louisiana
Firefighters’ Retirement SystemLouisiana State Employees’ Retirement System
Teachers Retirement System of LouisianaLouisiana School Employees’ Retirement System
Louisiana State Police Retirement SystemLouisiana Municipal Employees Plan ALouisiana Municipal Employees Plan B
Registrar of Voters Employees’ Retirement SystemParochial Employees’ Retirement System
Municipal Police Employees’ Retirement System
Maine
Maine Public Employees Retirement SystemMaine Judicial Retirement Program
Maine Legislative Retirement ProgramMaine Public Employees Retirement System Consolidated Plan for Participating Local
Districts
Maryland
Teachers’ Retirement SystemEmployees’ Retirement SystemState Police Retirement System
Judges’ Retirement SystemLaw Enforcement Officers’ Pension System
Correctional Officers Retirement SystemEmployees Retirement System—Municipal
Law Enforcement Officers’ Pension System—Municipal
MassachusettsState Employees’ Retirement System
Massachusetts Teachers Retirement System

MERCATUS CENTER AT GEORGE MASON UNIVERSIT Y
54
State Plan
Michigan
Legislative Retirement SystemState Police Retirement System
State Employees’ Retirement System (closed)Public School Employees’ Retirement System
Judges’ Retirement SystemMunicipal Employees’ Retirement System of Michigan
Minnesota
State Employees Retirement FundState Patrol Retirement Fund
Correctional Employees Retirement FundStatewide “Specialty” retirement plans (judges, elected officials, and legislators)
General Employees Retirement FundPublic Employees Police and Fire FundPublic Employees Correctional Fund
Municipal Employees Retirement FundTeachers Retirement Association
Mississippi
Public Employees’ Retirement SystemMississippi Highway Safety Patrol Retirement System
Municipal Retirement SystemSupplemental Legislative Retirement System
Missouri
Missouri State Employees’ PlanJudicial Plan
Missouri Department of Transportation and Highway Patrol Employees’ Retirement System
University of Missouri Retirement PlanPublic School Retirement System
Public Education Employee Retirement SystemMissouri Local Government Pension
Montana
Public Employees’ Retirement SystemFirefighters’ United Retirement System
Sheriffs’ Retirement SystemHighway Patrol Officers’ Retirement System
Game Wardens’ and Peace Officers’ Retirement SystemJudges Retirement System
Montana Municipal Police Officers’ Retirement SystemVolunteer Firefighters’ Compensation System
Teachers’ Retirement System
Nebraska
Nebraska School Employees’ Retirement SystemNebraska Judges’ Retirement System
Nebraska State Patrol Retirement SystemState Employees Retirement Benefit Fund
County Employees’ Retirement System
Nevada Public Employees Retirement System
New HampshireNew Hampshire Retirement System
Judicial Retirement Plan
New Jersey
Public Employees’ Retirement SystemTeachers’ Pension and Annuity Fund
State Police Retirement SystemJudicial Retirement System
Police and Firemen’s Retirement SystemConsolidated Police and Fire Fund (closed)
Prison Officers Fund (closed)
New Mexico
Public Employees Retirement FundLegislative Retirement Fund
Judicial Retirement FundMagistrates Retirement Fund
Volunteer Firefighters Retirement FundEducational Retirement Board

MERCATUS CENTER AT GEORGE MASON UNIVERSIT Y
55
State Plan
New YorkEmployees’ Retirement System
Police and Fire Retirement SystemTeachers’ Retirement System
North Carolina
Teachers’ and State Employees’ Retirement SystemConsolidated Judicial Retirement System
Legislative Retirement SystemLocal Government Employees’ Retirement System
Firefighters’ and Rescue Squad Workers’ Pension FundRegisters of Deeds’ Supplemental Pension Fund
National Guard Pension Fund
North Dakota
Public Employees Retirement SystemHighway Patrolmen’s Retirement System
Retirement Plan for Employees of Job Service North DakotaTeachers’ Fund for Retirement
Ohio
Ohio Public Employee Retirement SystemSchool Employees Retirement System
State Teachers Retirement SystemPolice and Fire Pension Fund
Oklahoma
Oklahoma Public Employees Retirement System (closed)Teachers Retirement System of Oklahoma
Uniform Retirement System for Justices and JudgesOklahoma Firefighters Pension and Retirement System
Oklahoma Police Pension and Retirement SystemOklahoma Law Enforcement Retirement System
OregonPublic Employees Retirement System
Public Service Retirement Plan
PennsylvaniaState Employees’ Retirement System
Public School Employees’ Retirement SystemMunicipal Retirement System
Puerto RicoGovernment Employees Retirement System
Teachers Retirement SystemJudiciary Retirement System
Rhode Island
Employees’ Retirement System of Rhode IslandTeachers’ Retirement System
Municipal Employees’ Retirement SystemJudicial Retirement Board Trust
State Police Retirement Board Trust
South Carolina
South Carolina Retirement SystemPolice Officers Retirement System
General Assembly Retirement SystemJudges and Solicitors Retirement System
National Guard Retirement System
South Dakota South Dakota Retirement System
Tennessee Tennessee Consolidated Retirement System
Texas
Employees Retirement SystemLaw Enforcement and Custodial Officer Supplemental Retirement Fund
Judicial Retirement System I (closed)Judicial Retirement System IITeacher Retirement System
Municipal Retirement SystemCounty and District Retirement SystemEmergency Services Retirement System

MERCATUS CENTER AT GEORGE MASON UNIVERSIT Y
56
State Plan
Utah
Noncontributory Retirement System (closed)Contributory Retirement System (closed)Public Safety Retirement System (closed)Firefighters Retirement System (closed)
Judges Retirement SystemUtah Governors and Legislators Retirement Plan
Tier 2 Public Employees Retirement System (Tier 2 PERS)Tier 2 Public Safety and Firefighters Retirement System (Tier 2 PSFRS)
VermontState Employees’ Retirement System
State Teachers Retirement SystemMunicipal Employees’ Retirement System
Virginia
Virginia Retirement SystemState Police Officers’ Retirement SystemVirginia Law Officers’ Retirement System
Judicial Retirement System
Washington
Public Employees’ Retirement System Plan 1Public Employees’ Retirement System Plan 2/3
Teachers’ Retirement System Plan 1Teachers’ Retirement System Plan 2/3School Employees’ Retirement System
Law Enforcement Officers’ and Fire Fighters’ Retirement Plan 1Law Enforcement Officers’ and Fire Fighters’ Retirement Plan 2
Washington State Patrol Retirement SystemPublic Safety Employees’ Retirement System
Judicial Retirement SystemJudges’ Retirement Fund
West Virginia
Public Employees’ Retirement SystemDeputy Sheriff Retirement System
Emergency Medical Services Retirement SystemMunicipal Police Officers and Firefighters Retirement System
Teachers’ Retirement SystemPublic Safety Death, Disability, and Retirement Fund
State Police Retirement SystemJudges’ Retirement System
Wisconsin Wisconsin Retirement System
Wyoming
Public Employees Pension PlanState Patrol, Game and Fish Warden and Criminal Investigator Plan
Volunteer Fireman’s Pension PlanPaid Firemen’s Pension Plan APaid Firemen’s Pension Plan B
Judicial Pension PlanLaw Enforcement Pension Plan
Volunteer Emergency Medical Technician Pension PlanAir Guard Firefighters Pension Plan
Note: DB = defined benefit.

MERCATUS CENTER AT GEORGE MASON UNIVERSIT Y
57
APPENDIX B: METHODOLOGY
This study calculates 14 financial metrics, as described in table 2, to create five dimensions of solvency: (1) cash, (2) budget, (3) long run, (4) service level, and (5) trust fund. The individual metrics are grouped and summed according to which dimension of solvency they contribute. For some metrics, a higher value indicates a higher degree of solvency. Those metrics include (1) the cash ratio, (2) the quick ratio, (3) the current ratio, (4) the operating ratio, (5) the surplus or deficit per capita, and (6) the net asset ratio. For several metrics, a lower value indicates higher solvency.
To construct a ranking that is intuitive to interpret, the following met-rics are transformed by taking their inverse: (1) the long-term liability ratio, (2) the long-term liability per capita, (3) taxes to income, (4) revenue to income, (5) expenses to income, (6) the pension affordability ratio, (7) the other post-employment benefits affordability ratio, and (8) the debt affordability ratio. To illustrate how a ranking is calculated from the individual indicators, table B1 uses Alabama’s financials to calculate the cash solvency index score for that state.
The financial data are expressed in thousands.
cash solvency index score = σ (z-scores for cash ratio, quick ratio, current ratio).
1. Calculate Each Ratio
cash ratio = (cash + cash equivalents + investments)/current liabilitiesAlabama cash ratio = $7,223,833/$2,016,901Alabama cash ratio = 3.58Interpretation: Alabama has 3.58 times enough cash to cover its current liabili-ties. “Cash” includes the most liquid items, such as petty cash and deposits, and excludes items that may take longer to convert to cash. Cash is all the money available to pay bills immediately.
TABLE B1. ALABAMA’S FIVE INDEX SCORES AND CALCULATION OF OVERALL SOLVENCY
State
Cash solvency
score (0.35)
Budget solvency
score (0.35)
Long-run solvency
score (0.10)
Service-level solvency
score (0.10)
Trust fund solvency
score (0.10)
Overall solvency
(sum of five rankings)
Alabama 1.08 −0.55 0.28 1.53 −0.88 1.46
Score multiplied by weight
0.38 −0.19 0.03 0.15 −0.09 0.28

MERCATUS CENTER AT GEORGE MASON UNIVERSIT Y
58
quick ratio = (cash + cash equivalents + investments + receivables)/current liabilitiesAlabama quick ratio = $8,367,578/$2,016,901Alabama quick ratio = 4.15Interpretation: Alabama has 4.15 times the amount of cash it needs to cover current liabilities. This ratio also includes less liquid forms of cash, such as investments that expire in one year and receivables or obligations owed to the government.
current ratio = current assets/current liabilitiesAlabama current ratio = $9,928,345/$2,016,901Alabama current ratio = 4.92Interpretation: The current ratio includes all the elements of the cash and cur-rent ratios plus internal balances and government-wide inventories. Alabama has 4.92 times the level of assets it needs to cover current liabilities.
These three metrics form the components of the cash solvency index score. Owing to wide variations in the size of individual states’ financials, each of these metrics is put on the same scale so that fiscal performance across states and Puerto Rico may be meaningfully compared. To do so, the z-score of each indicator is calculated. The z-score, also known as a standard score, measures how far away the value for one state’s indicator is from that indicator’s mean value for all 50 states and Puerto Rico. The z-score is calculated by subtracting the mean of the population from the value of the indicator and dividing by the standard deviation of the population:
Z =
Table B2 indicates what various z-score values represent.
TABLE B2. MEANING OF Z-SCORE VALUES
Z-score Interpretation
0 Value is equal to the mean
< 0 Value is less than the mean
> 0 Value is greater than the mean
1 Value is 1 standard deviation greater than the mean
−1 Value is 1 standard deviation less than the mean
2 Value is 2 standard deviations greater than the mean
−2 Value is 2 standard deviations less than the mean
X – μσ

MERCATUS CENTER AT GEORGE MASON UNIVERSIT Y
59
The z-scores for each indicator are grouped and summed according to the dimension of solvency being measured.
Continuing with the example, we calculate Alabama’s cash solvency index score by standardizing each of the previous indicators (cash ratio, quick ratio, and current ratio) based on the mean and standard deviation for the 50 states and Puerto Rico for those ratios.
2. Calculate the Z-Score for the Cash Ratio, Given the Following
mean value for the cash ratio for the 50 states and Puerto Rico = 2.40standard deviation for the cash ratio for the 50 states and Puerto Rico = 3.23Alabama cash ratio = 3.58
Z cash ratio =
Z cash ratio =
Z cash ratio = 0.365.
3. Calculate the Z-Score for the Quick Ratio, Given the Following
mean value for the quick ratio for the 50 states and Puerto Rico = 3.18standard deviation for the quick ratio for the 50 states and Puerto Rico = 3.27Alabama quick ratio = 4.15
Z cash ratio =
Z cash ratio =
Z cash ratio = 0.297.
4. Calculate the Z-Score for the Current Ratio, Given the Following
mean value for the current ratio for the 50 states and Puerto Rico = 3.54standard deviation for the current ratio for the 50 states = 3.34
X – μσ
X – μσ
3.58 – 2.403.23
4.15 – 3.183.27

MERCATUS CENTER AT GEORGE MASON UNIVERSIT Y
60
Alabama current ratio = 4.92
Z cash ratio =
Z cash ratio =
Z cash ratio = 0.413.
5. Calculate the Cash Solvency Score or Rank
∑ (Z cash ratio, Z quick ratio, Z current ratio) = ∑ (0.365, 0.297, 0.0.413)
= 1.08.
Alabama’s cash solvency score is one standard deviation above the mean value for the 50 states and Puerto Rico. Alabama is ranked 11th among the states for cash solvency.
The other four dimensions of solvency are computed accordingly:
budget solvency index = sum of z-scores of (operating ratio + surplus/deficit per capita)long-run solvency index = sum of z-scores of (net asset ratio + inverse of long-term liability ratio + inverse of long-term liability per capita)service-level solvency index = sum of z-scores of (inverse of tax income ratio + inverse of revenue income ratio + inverse of expenses income ratio)trust fund solvency index = sum of z-scores of (inverse of pension income ratio + inverse of OPEB income ratio + inverse of debt income ratio)
To arrive at an overall final ranking that aggregates each dimension of solvency, the ranking for each dimension of solvency is assigned a weight. Cash solvency and budget solvency are each assigned a weight of 35 percent. Long-run solvency, service-level solvency, and trust fund solvency are each assigned a weight of 10 percent.
These weights are selected based on the budgetary immediacy of each dimension. Changing the weights would change the ranking of the states. This study gives more weight to the short term and medium term than to the long
X – μσ
4.92 – 3.543.34

MERCATUS CENTER AT GEORGE MASON UNIVERSIT Y
61
term, which includes total pension and healthcare obligations. States’ abil-ity to meet these obligations depends on unknowns, such as future budgets and legal, fiscal, and economic circumstances. After applying these weights, the final overall solvency score is assigned to each state. As table B1 shows for Alabama, summing each individual solvency score and multiplying it by the assigned weight yields a final overall solvency score of 0.28, meaning Alabama’s overall solvency is slightly above the mean for the population of states. Alabama is ranked 15th for overall fiscal solvency.

ABOUT THE AUTHORS
Eileen Norcross is a senior research fellow at the Mercatus Center at George Mason University. As director for the Mercatus Center’s State and Local Policy Project, she focuses on questions of public finance and how economic institu-tions support or hamper economic resilience and civil society. She specializes in fiscal federalism and institutions, state and local governments and finance, pensions, public administration, and economic development. Her work has been cited in various media outlets, and her op-eds have appeared in the Wall Street Journal, the New York Post, the Christian Science Monitor, US News & World Report, and Forbes.
Norcross has testified before Congress on state and local pension under-funding, municipal bankruptcy, and the use of technology to monitor stimulus funding. She has also testified on fiscal and budgetary policies in Pennsylvania, Florida, New Hampshire, and Montana. Her academic publications include articles in the Maryland Journal and a book chapter in The Political Economy of Hurricane Katrina and Community Rebound, edited by Emily Chamlee-Wright and Virgil Henry Storr.
Previously, Norcross was a Warren T. Brookes Journalism Fellow at the Competitive Enterprise Institute in Washington, DC; a consultant at KPMG’s transfer-pricing division; and a research analyst with Thompson Financial Securities Data. She received her MA in economics from Rutgers University.
Olivia Gonzalez is a research assistant for the Mercatus Center’s State and Local Policy Project. Her research focuses on state budgets, taxes, and eco-nomic development. Her writing has appeared in US News & World Report and Real Clear Policy. She earned her BS in economics from George Mason Univer-sity, where she is currently a PhD student. Gonzalez received her AS in business administration from Northern Virginia Community College.

ABOUT THE MERCATUS CENTER AT GEORGE MASON UNIVERSITY
The Mercatus Center at George Mason University is the world’s premier university source for market-oriented ideas—bridging the gap between aca-demic ideas and real-world problems.
A university-based research center, Mercatus advances knowledge about how markets work to improve people’s lives by training graduate students, con-ducting research, and applying economics to offer solutions to society’s most pressing problems.
Our mission is to generate knowledge and understanding of the institu-tions that affect the freedom to prosper and to find sustainable solutions that overcome the barriers preventing individuals from living free, prosperous, and peaceful lives.
Founded in 1980, the Mercatus Center is located on George Mason Uni-versity’s Arlington and Fairfax campuses.


ATTACHMENTS: STATE PROFILES
The following profiles summarize key information for each state and Puerto Rico, providing a closer look at the underlying data that make up the final fiscal ranking. Each profile is able to act as a standalone source for understanding each state’s fiscal condition. These data include information on both short- and long-term fiscal health. All data are compared to the national average, including Puerto Rico’s data.
Short-term measures include how much cash is available to cover short-term liabilities, how revenues compare to expenses, and whether the state is producing a surplus or a deficit. Long-term measures include the extent of net assets, liabilities, and unfunded obligations for pensions and other postemploy-ment benefits (OPEB).
To provide an even closer look at each state’s long-term obligations, each profile includes additional tables on state debt, pension liabilities, and OPEB lia-bilities. Each state’s unfunded pension liabilities as stated in its actuarial report are compared to market valuations to demonstrate how a range of discount rate assumptions can alter the size and funded ratio of pension obligations.
The constructed indices on cash, budget, long-run, service-level, and trust fund solvency help provide a picture of how each state performs relative to other states, but the underlying data in these profiles help cultivate a deeper understanding of each state’s absolute performance.


ALABAMArank 1. Alaska
2. Nebraska3. Wyoming4. North Dakota5. South Dakota6. Florida 7. Utah8. Oklahoma9. Tennessee10. Montana11. Ohio12. Idaho13. Nevada14. Missouri15. Alabama16. Texas17. Indiana18. South Carolina19. Virginia20. New Hampshire21. North Carolina22. Colorado23. Georgia24. Washington25. Iowa26. Minnesota27. Kansas28. Arkansas29. Wisconsin30. Oregon31. Arizona32. Mississippi33. Louisiana34. New Mexico35. Michigan36. Vermont37. Rhode Island38. Delaware39. Pennsylvania40. West Virginia41. Maryland42. New York43. Maine44. California45. Hawaii46. Kentucky47. Illinois48. New Jersey49. Massachusetts50. Connecticut51. Puerto Rico
SUMMARY
On the basis of its fiscal solvency in five separate categories, Alabama ranks 15th among the US states and Puerto Rico for its fiscal health. On a cash basis, Alabama’s fiscal condition is strong. The state has between 3.58 to 4.92 times the cash needed to cover short-term liabilities. On a budget-ary basis, Alabama’s revenues exceed expenses by 2 percent, producing a small surplus of $96 per capita. On a long-run basis, net assets are 9 per-cent of total assets, and total liabilities are 20 percent of the state’s total assets. Alabama’s total debt is $5.02 billion. When valued as guaranteed to be paid, unfunded pension liabilities amount to $60.43 billion, and other postemployment benefits (OPEB) total $11.64 billion. These three long-term liabilities are equal to 42 percent of total state personal income.
2014 TOTAL LONG-TERM OBLIGATIONSSTATE DEBT
General obligation
bonds
Total primary government
debtState personal
income
Ratio of debt to state personal
incomeTotal primary
debt per capita
Alabama $0.68 billion $5.02 billion $181.91 billion 2.8% $1,036
National average $6.60 billion $13.76 billion $288.25 billion 6.0% $2,144
PENSION LIABILITY
Unfunded pension liability Funded ratio
Market value of unfunded liability
Market value of funded ratio
Alabama $15.20 billion 67% $60.43 billion 34%
National average $20.46 billion 74% $86.85 billion 40%
OTHER POSTEMPLOYMENT BENEFITS (OPEB)
Total unfunded OPEB Funded ratio
Alabama $11.64 billion 10%
National average $10.21 billion 13%

For a complete explanation of the methodology used to calculate Alabama’s fiscal health rankings, see Eileen Norcross and Olivia Gonzalez, “Ranking the States by Fiscal Condition,” 2016 ed. (Mercatus Research, Mercatus Center at George Mason University, Arlington, VA, June 2016).
2
UNDERLYING RATIOS
Cash ratio Quick ratioCurrent
ratioOperating
ratio
Surplus (or deficit) per capita
Net asset ratio
Long-term liability
ratio
Long-term liability
per capita
Alabama 3.58 4.15 4.92 1.02 $96 0.09 0.20 $1,321
National average
2.40 3.18 3.54 1.06 $448 −0.03 0.47 $3,069
Tax-to-income ratio
Revenue-to-income ratio
Expenses-to-income ratio
Pension-to-income ratio
OPEB-to-income ratio
Primary debt-to-income ratio
Alabama 0.04 0.12 0.11 0.33 0.06 0.03
National average
0.06 0.14 0.13 0.31 0.03 0.06
KEY TERMS
• Cash solvency measures whether a state has enough cash to cover its short-term bills, which include accounts payable, vouchers, warrants, and short-term debt. (Alabama ranks 11th.)
• Budget solvency measures whether a state can cover its fiscal year spend-ing out of current revenues. Did it run a shortfall during the year? (Ala-bama ranks 33rd.)
• Long-run solvency measures whether a state has a hedge against large long-term liabilities. Are enough assets available to cushion the state from potential shocks or long-term fiscal risks? (Alabama ranks 19th.)
• Service-level solvency measures how high taxes, revenues, and spending are when compared to state personal income. Do states have enough “fis-cal slack”? If spending commitments demand more revenues, are states in a good position to increase taxes without harming the economy? Is spend-ing high or low relative to the tax base? (Alabama ranks 14th.)
• Trust fund solvency measures how much debt a state has. How large are unfunded pension liabilities, OPEB liabilities, and state debt compared to the state personal income? (Alabama ranks 36th.)
33rdbudget
solvency
36thtrust fundsolvency
19thlong-runsolvency
14thservice-level
solvency
11thcash
solvency
–3.0
–2.0
–1.0
US average
1.0
2.0
3.0
2.0
–1.0
era
1.0
2.0
3
3
distance fromUS average
(in standard deviations)

ALASKArank 1. Alaska
2. Nebraska3. Wyoming4. North Dakota5. South Dakota6. Florida 7. Utah8. Oklahoma9. Tennessee10. Montana11. Ohio12. Idaho13. Nevada14. Missouri15. Alabama16. Texas17. Indiana18. South Carolina19. Virginia20. New Hampshire21. North Carolina22. Colorado23. Georgia24. Washington25. Iowa26. Minnesota27. Kansas28. Arkansas29. Wisconsin30. Oregon31. Arizona32. Mississippi33. Louisiana34. New Mexico35. Michigan36. Vermont37. Rhode Island38. Delaware39. Pennsylvania40. West Virginia41. Maryland42. New York43. Maine44. California45. Hawaii46. Kentucky47. Illinois48. New Jersey49. Massachusetts50. Connecticut51. Puerto Rico
SUMMARY
On the basis of its fiscal solvency in five separate categories, Alaska ranks first among the US states and Puerto Rico for its fiscal health. Given Alaska’s reliance on oil revenues, the state has between 22.46 and 23.44 times the cash needed to cover short-term liabilities. Revenues exceed expenses by 55 percent, producing a surplus of $8,296 per capita. On a long-run basis, net assets represent 85 percent of total assets, and liabilities are 3 percent of total assets. Dependency on oil revenues shows that Alaska’s revenues and spend-ing account for 43 percent and 28 percent of total resident income, respec-tively. This highlights the risk that, given a decline in oil prices, the state is spending beyond the capacity of residents to pay for current service levels.
2014 TOTAL LONG-TERM OBLIGATIONSSTATE DEBT
General obligation
bonds
Total primary government
debt
State personal income
Ratio of debt to state personal
income
Total primary debt per capita
Alaska $0.69 billion $1.93 billion $39.79 billion 4.8% $2,619
National average $6.60 billion $13.76 billion $288.25 billion 6.0% $2,144
PENSION LIABILITY
Unfunded pension liability
Funded ratio Market value of unfunded liability
Market value of funded liability ratio
Alaska $8.45 billion 58% $28.04 billion 29%
National average $20.46 billion 74% $86.85 billion 40%
OTHER POSTEMPLOYMENT BENEFITS (OPEB)
Total unfunded OPEB Funded ratio
Alaska $3.62 billion 1%
National average $10.21 billion 13%

2
For a complete explanation of the methodology used to calculate Alaska’s fiscal health rankings, see Eileen Norcross and Olivia Gonzalez, “Ranking the States by Fiscal Condition,” 2016 ed. (Mercatus Research, Mercatus Center at George Mason University, Arlington, VA, June 2016).
1stbudget
solvency
50thtrust fundsolvency
2ndlong-runsolvency
50thservice-level
solvency
1stcash
solvency
–3.0
–2.0
–1.0
US average
1.0
2.0
3.0
2.0
–1.0
rag
1.0
2.0
3
3
distance fromUS average
(in standard deviations)
UNDERLYING RATIOS
Cash ratio Quick ratioCurrent
ratioOperating
ratio
Surplus (or deficit) per
capitaNet asset
ratio
Long-term liability
ratio
Long-term liability
per capita
Alaska 22.46 22.81 23.44 1.55 $8,296 0.85 0.03 $3,626
National average
2.40 3.18 3.54 1.06 $448 −0.03 0.47 $3,069
Tax-to-income ratio
Revenue-to-income ratio
Expenses-to-income ratio
Pension-to-income ratio
OPEB-to-income ratio
Primary debt-to-income ratio
Alaska 0.07 0.43 0.28 0.70 0.09 0.05
National average
0.06 0.14 0.13 0.31 0.03 0.06
KEY TERMS
• Cash solvency measures whether a state has enough cash to cover its short-term bills, which include accounts payable, vouchers, warrants, and short-term debt. (Alaska ranks 1st.)
• Budget solvency measures whether a state can cover its fiscal year spend-ing using current revenues. Did it run a shortfall during the year? (Alaska ranks 1st.)
• Long-run solvency measures whether a state has a hedge against large long-term liabilities. Are enough assets available to cushion the state from potential shocks or long-term fiscal risks? (Alaska ranks 2nd.)
• Service-level solvency measures how high taxes, revenues, and spending are when compared to state personal income. Do states have enough “fis-cal slack”? If spending commitments demand more revenues, are states in a good position to increase taxes without harming the economy? Is spend-ing high or low relative to the tax base? (Alaska ranks 50th.)
• Trust fund solvency measures how much debt a state has. How large are unfunded pension liabilities, OPEB liabilities, and state debt compared to the state personal income? (Alaska ranks 50th.)

rank
SUMMARY
On the basis of its fiscal solvency in five separate categories, Arizona ranks 31st among the US states and Puerto Rico for its fiscal health. On a short-run basis, Arizona’s performance is mixed. The state has low levels of cash, or between 0.84 and 1.33 times the cash needed to cover short-term liabilities. Revenues exceed expenses by 5 percent, with a small surplus of $231 per capita. On a long-run basis, net assets are 15 percent of total assets, and total liabilities account for 26 percent of total assets. Arizona has $10.07 billion in total debt, with unfunded pension liabilities valued at $72.16 billion on a guaranteed-to-be-paid basis.
2014 TOTAL LONG-TERM OBLIGATIONSSTATE DEBT
General obligation
bonds
Total primary government
debtState personal
income
Ratio of debt to state personal
incomeTotal primary
debt per capita
Arizona $0.00 billion $10.07 billion $255.09 billion 3.9% $1,496
National average $6.60 billion $13.76 billion $288.25 billion 6.0% $2,144
PENSION LIABILITY
Unfunded pension liability Funded ratio
Market value of unfunded liability
Market value of funded liability ratio
Arizona $17.62 billion 69% $72.16 billion 35%
National average $20.46 billion 74% $86.85 billion 40%
OTHER POSTEMPLOYMENT BENEFITS (OPEB)
Total unfunded OPEB Funded ratio
Arizona $0.08 billion 96%
National average $10.21 billion 13%
1. Alaska2. Nebraska3. Wyoming4. North Dakota5. South Dakota6. Florida 7. Utah8. Oklahoma9. Tennessee10. Montana11. Ohio12. Idaho13. Nevada14. Missouri15. Alabama16. Texas17. Indiana18. South Carolina19. Virginia20. New Hampshire21. North Carolina22. Colorado23. Georgia24. Washington25. Iowa26. Minnesota27. Kansas28. Arkansas29. Wisconsin30. Oregon31. Arizona32. Mississippi33. Louisiana34. New Mexico35. Michigan36. Vermont37. Rhode Island38. Delaware39. Pennsylvania40. West Virginia41. Maryland42. New York43. Maine44. California45. Hawaii46. Kentucky47. Illinois48. New Jersey49. Massachusetts50. Connecticut51. Puerto Rico
ARIZONA

2
For a complete explanation of the methodology used to calculate Arizona’s fiscal health rankings, see Eileen Norcross and Olivia Gonzalez, “Ranking the States by Fiscal Condition,” 2016 ed. (Mercatus Research, Mercatus Center at George Mason University, Arlington, VA, June 2016).
21stbudget
solvency
17thtrust fundsolvency
22ndlong-runsolvency
19thservice-level
solvency
45thcash
solvency
–3.0
–2.0
–1.0
US average
1.0
2.0
3.0
2.0
–1.0
av
1.0
2.0
3
3
22nd
distance fromUS average
(in standard deviations)
UNDERLYING RATIOS
Cash ratio Quick ratioCurrent
ratioOperating
ratio
Surplus (or deficit) per
capitaNet asset
ratio
Long-term liability
ratio
Long-term liability
per capita
Arizona 0.84 1.10 1.33 1.05 $231 0.15 0.26 $1,582
National average
2.40 3.18 3.54 1.06 $448 −0.03 0.47 $3,069
Tax-to-income ratio
Revenue-to-income ratio
Expenses-to-income ratio
Pension-to-income ratio
OPEB-to-income ratio
Primary debt-to-income
ratio
Arizona 0.05 0.12 0.12 0.28 0.00 0.04
National average
0.06 0.14 0.13 0.31 0.03 0.06
KEY TERMS
• Cash solvency measures whether a state has enough cash to cover its short-term bills, which include accounts payable, vouchers, warrants, and short-term debt. (Arizona ranks 45th.)
• Budget solvency measures whether a state can cover its fiscal year spend-ing using current revenues. Did it run a shortfall during the year? (Arizona ranks 21st.)
• Long-run solvency measures whether a state has a hedge against large long-term liabilities. Are enough assets available to cushion the state from potential shocks or long-term fiscal risks? (Arizona ranks 22nd.)
• Service-level solvency measures how high taxes, revenues, and spending are when compared to state personal income. Do states have enough “fis-cal slack”? If spending commitments demand more revenues, are states in a good position to increase taxes without harming the economy? Is spend-ing high or low relative to the tax base? (Arizona ranks 19th.)
• Trust fund solvency measures how much debt a state has. How large are unfunded pension liabilities, OPEB liabilities, and state debt compared to the state personal income? (Arizona ranks 17th.)

rank 1. Alaska2. Nebraska3. Wyoming4. North Dakota5. South Dakota6. Florida 7. Utah8. Oklahoma9. Tennessee10. Montana11. Ohio12. Idaho13. Nevada14. Missouri15. Alabama16. Texas17. Indiana18. South Carolina19. Virginia20. New Hampshire21. North Carolina22. Colorado23. Georgia24. Washington25. Iowa26. Minnesota27. Kansas28. Arkansas29. Wisconsin30. Oregon31. Arizona32. Mississippi33. Louisiana34. New Mexico35. Michigan36. Vermont37. Rhode Island38. Delaware39. Pennsylvania40. West Virginia41. Maryland42. New York43. Maine44. California45. Hawaii46. Kentucky47. Illinois48. New Jersey49. Massachusetts50. Connecticut51. Puerto Rico
ARKANSAS
SUMMARY
On the basis of its fiscal solvency in five separate categories, Arkansas ranks 28th among the US states and Puerto Rico for its fiscal health. Arkansas’s short-term position is strong. The state has between 2.65 and 3.47 times the cash needed to cover short-term liabilities. Revenues exceed expenses by 2 percent, producing a small surplus of $114 per capita. On a long-run basis, net assets represent 17 percent of total assets, and total liabilities are 28 percent of total assets. Total debt in Arkansas is $3.83 billion, and unfunded pensions are valued at $32.42 billion on a guaranteed-to-be-paid basis. Other postemployment benefits (OPEB) add $1.78 billion in total unfunded liabilities.
2014 TOTAL LONG-TERM OBLIGATIONSSTATE DEBT
General obligation
bonds
Total primary government
debtState personal
income
Ratio of debt to state personal
incomeTotal primary
debt per capita
Arkansas $1.37 billion $3.83 billion $112.08 billion 3.4% $1,290
National average $6.60 billion $13.76 billion $288.25 billion 6.0% $2,144
PENSION LIABILITY
Unfunded pension liability Funded ratio
Market value of unfunded liability
Market value of funded liability ratio
Arkansas $6.17 billion 78% $32.42 billion 40%
National average $20.46 billion 74% $86.85 billion 40%
OTHER POSTEMPLOYMENT BENEFITS (OPEB)
Total unfunded OPEB Funded ratio
Arkansas $1.78 billion 0%
National average $10.21 billion 13%

2
For a complete explanation of the methodology used to calculate Arkansas’s fiscal health rankings, see Eileen Norcross and Olivia Gonzalez, “Ranking the States by Fiscal Condition,” 2016 ed. (Mercatus Research, Mercatus Center at George Mason University, Arlington, VA, June 2016).
35thbudget
solvency
28thtrust fundsolvency
27thlong-runsolvency
42ndservice-level
solvency
15thcash
solvency
–3.0
–2.0
–1.0
US average
1.0
2.0
3.0
2.0
–1.0
av
1.0
2.0
3
3
solvency
distance fromUS average
(in standard deviations)
UNDERLYING RATIOS
Cash ratio Quick ratioCurrent
ratioOperating
ratio
Surplus (or deficit) per
capitaNet asset
ratio
Long-term liability
ratio
Long-term liability
per capita
Arkansas 2.65 3.28 3.47 1.02 $114 0.17 0.28 $2,217
National average
2.40 3.18 3.54 1.06 $448 −0.03 0.47 $3,069
Tax-to-income ratio
Revenue-to-income ratio
Expenses-to-income ratio
Pension-to-income ratio
OPEB-to-income ratio
Primary debt-to-income ratio
Arkansas 0.07 0.17 0.17 0.29 0.02 0.03
National average
0.06 0.14 0.13 0.31 0.03 0.06
KEY TERMS
• Cash solvency measures whether a state has enough cash to cover its short-term bills, which include accounts payable, vouchers, warrants, and short-term debt. (Arkansas ranks 15th.)
• Budget solvency measures whether a state can cover its fiscal year spend-ing using current revenues. Did it run a shortfall during the year? (Arkan-sas ranks 35th.)
• Long-run solvency measures whether a state has a hedge against large long-term liabilities. Are enough assets available to cushion the state from potential shocks or long-term fiscal risks? (Arkansas ranks 27th.)
• Service-level solvency measures how high taxes, revenues, and spending are when compared to state personal income. Do states have enough “fis-cal slack”? If spending commitments demand more revenues, are states in a good position to increase taxes without harming the economy? Is spend-ing high or low relative to the tax base? (Arkansas ranks 42nd.)
• Trust fund solvency measures how much debt a state has. How large are unfunded pension liabilities, OPEB liabilities, and state debt compared to the state personal income? (Arkansas ranks 28th.)

rank
SUMMARY
On the basis of its fiscal solvency in five separate categories, California ranks 44th among the US states and Puerto Rico for its fiscal health. Cali-fornia’s fiscal performance is weak across several categories. The state has between 0.67 and 1.44 times the cash needed to cover short-term liabilities. Revenues exceed expenses by 4 percent, producing a surplus of $250 per capita, but on a long-run basis California is heavily reliant on debt, with a negative net asset ratio of −0.40 and total liabilities amounting to 73 per-cent of total assets. Total debt is $118.17 billion. When valued on a guaran-teed-to-be-paid basis, total unfunded pension liabilities are $756.67 billion, and other postemployment benefits (OPEB) are $29.05 billion. These three liabilities are equal to 46 percent of total state personal income.
2014 TOTAL LONG-TERM OBLIGATIONSSTATE DEBT
General obligation
bonds
Total primary government
debtState personal
income
Ratio of debt to state personal
incomeTotal primary
debt per capita
California $83.95 billion $118.17 billion $1,939.53 billion 6.1% $3,045
National average $6.60 billion $13.76 billion $288.25 billion 6.0% $2,144
PENSION LIABILITY
Unfunded pension liability Funded ratio
Market value of unfunded liability
Market value of funded liability ratio
California $169.70 billion 75% $756.67 billion 41%
National average $20.46 billion 74% $86.85 billion 40%
OTHER POSTEMPLOYMENT BENEFITS (OPEB)
Total unfunded OPEB Funded ratio
California $29.05 billion 8%
National average $10.21 billion 13%
1. Alaska2. Nebraska3. Wyoming4. North Dakota5. South Dakota6. Florida 7. Utah8. Oklahoma9. Tennessee10. Montana11. Ohio12. Idaho13. Nevada14. Missouri15. Alabama16. Texas17. Indiana18. South Carolina19. Virginia20. New Hampshire21. North Carolina22. Colorado23. Georgia24. Washington25. Iowa26. Minnesota27. Kansas28. Arkansas29. Wisconsin30. Oregon31. Arizona32. Mississippi33. Louisiana34. New Mexico35. Michigan36. Vermont37. Rhode Island38. Delaware39. Pennsylvania40. West Virginia41. Maryland42. New York43. Maine44. California45. Hawaii46. Kentucky47. Illinois48. New Jersey49. Massachusetts50. Connecticut51. Puerto Rico
CALIFORNIA

2
For a complete explanation of the methodology used to calculate California’s fiscal health rankings, see Eileen Norcross and Olivia Gonzalez, “Ranking the States by Fiscal Condition,” 2016 ed. (Mercatus Research, Mercatus Center at George Mason University, Arlington, VA, June 2016).
23rdbudget
solvency
42ndtrust fundsolvency
46thlong-runsolvency
28thservice-level
solvency
47thcash
solvency
–3.0
–2.0
–1.0
US average
1.0
2.0
3.0
2.0
–1.0
av
1.0
2.0
3
3
23rd
distance fromUS average
(in standard deviations)
UNDERLYING RATIOS
Cash ratio Quick ratioCurrent
ratioOperating
ratio
Surplus (or deficit) per
capitaNet asset
ratio
Long-term liability
ratio
Long-term liability
per capita
California 0.67 1.03 1.44 1.04 $250 −0.40 0.73 $4,150
National average
2.40 3.18 3.54 1.06 $448 −0.03 0.47 $3,069
Tax-to-income ratio
Revenue-to-income ratio
Expenses-to-income ratio
Pension-to-income ratio
OPEB-to-income ratio
Primary debt-to-
income ratio
California 0.06 0.13 0.12 0.39 0.01 0.06
National average
0.06 0.14 0.13 0.31 0.03 0.06
KEY TERMS
• Cash solvency measures whether a state has enough cash to cover its short-term bills, which include accounts payable, vouchers, warrants, and short-term debt. (California ranks 47th.)
• Budget solvency measures whether a state can cover its fiscal year spend-ing using current revenues. Did it run a shortfall during the year? (Califor-nia ranks 23rd.)
• Long-run solvency measures whether a state has a hedge against large long-term liabilities. Are enough assets available to cushion the state from potential shocks or long-term fiscal risks? (California ranks 46th.)
• Service-level solvency measures how high taxes, revenues, and spending are when compared to state personal income. Do states have enough “fis-cal slack”? If spending commitments demand more revenues, are states in a good position to increase taxes without harming the economy? Is spend-ing high or low relative to the tax base? (California ranks 28th.)
• Trust fund solvency measures how much debt a state has. How large are unfunded pension liabilities, OPEB liabilities, and state debt compared to the state personal income? (California ranks 42nd.)

rank 1. Alaska2. Nebraska3. Wyoming4. North Dakota5. South Dakota6. Florida 7. Utah8. Oklahoma9. Tennessee10. Montana11. Ohio12. Idaho13. Nevada14. Missouri15. Alabama16. Texas17. Indiana18. South Carolina19. Virginia20. New Hampshire21. North Carolina22. Colorado23. Georgia24. Washington25. Iowa26. Minnesota27. Kansas28. Arkansas29. Wisconsin30. Oregon31. Arizona32. Mississippi33. Louisiana34. New Mexico35. Michigan36. Vermont37. Rhode Island38. Delaware39. Pennsylvania40. West Virginia41. Maryland42. New York43. Maine44. California45. Hawaii46. Kentucky47. Illinois48. New Jersey49. Massachusetts50. Connecticut51. Puerto Rico
COLORADO
SUMMARY
On the basis of its fiscal solvency in five separate categories, Colorado ranks 22nd among the US states and Puerto Rico for its fiscal health. On a cash basis, Colorado has between 1.25 and 2.01 times the cash needed to cover short-term liabilities. Revenues exceed expenses by 5 percent, producing a surplus of $250 per capita. Colorado’s long-term position is strong. Net assets are 27 percent of total assets, and total liabilities are 21 percent of total assets. Total debt is $6.32 billion, and unfunded pension liabilities are $81.05 billion on a guaranteed-to-be-paid basis, with other postemployment benefits (OPEB) adding a further $1.24 billion to total unfunded liabilities. Together, these three liabilities are equal to 33 percent of total state personal income.
2014 TOTAL LONG-TERM OBLIGATIONSSTATE DEBT
General obligation
bonds
Total primary government
debtState personal
income
Ratio of debt to state personal
incomeTotal primary
debt per capita
Colorado $0.00 billion $6.32 billion $261.74 billion 2.4% $1,180
National average $6.60 billion $13.76 billion $288.25 billion 6.0% $2,144
PENSION LIABILITY
Unfunded pension liability Funded ratio
Market value of unfunded liability
Market value of funded liability ratio
Colorado $25.19 billion 62% $81.05 billion 34%
National average $20.46 billion 74% $86.85 billion 40%
OTHER POSTEMPLOYMENT BENEFITS (OPEB)
Total unfunded OPEB Funded ratio
Colorado $1.24 billion 19%
National average $10.21 billion 13%

2
For a complete explanation of the methodology used to calculate Colorado’s fiscal health rankings, see Eileen Norcross and Olivia Gonzalez, “Ranking the States by Fiscal Condition,” 2016 ed. (Mercatus Research, Mercatus Center at George Mason University, Arlington, VA, June 2016).
19thbudget
solvency
33rdtrust fundsolvency
14thlong-runsolvency
8thservice-level
solvency
35thcash
solvency
–3.0
–2.0
–1.0
US average
1.0
2.0
3.0
2.0
–1.0
ra
1.0
2.0
3
3
distance fromUS average
(in standard deviations)
UNDERLYING RATIOS
Cash ratio Quick ratioCurrent
ratioOperating
ratio
Surplus (or deficit) per
capitaNet asset
ratio
Long-term liability
ratio
Long-term liability
per capita
Colorado 1.25 1.76 2.01 1.05 $250 0.27 0.21 $1,351
National average
2.40 3.18 3.54 1.06 $448 −0.03 0.47 $3,069
Tax-to-income ratio
Revenue-to-income ratio
Expenses-to -income ratio
Pension-to-income ratio
OPEB-to-income ratio
Primary debt-to-income ratio
Colorado 0.04 0.11 0.10 0.31 0.00 0.02
National average
0.06 0.14 0.13 0.31 0.03 0.06
KEY TERMS
• Cash solvency measures whether a state has enough cash to cover its short-term bills, which include accounts payable, vouchers, warrants, and short-term debt. (Colorado ranks 35th.)
• Budget solvency measures whether a state can cover its fiscal year spend-ing using current revenues. Did it run a shortfall during the year? (Colo-rado ranks 19th.)
• Long-run solvency measures whether a state has a hedge against large long-term liabilities. Are enough assets available to cushion the state from potential shocks or long-term fiscal risks? (Colorado ranks 14th.)
• Service-level solvency measures how high taxes, revenues, and spending are when compared to state personal income. Do states have enough “fis-cal slack”? If spending commitments demand more revenues, are states in a good position to increase taxes without harming the economy? Is spend-ing high or low relative to the tax base? (Colorado ranks 8th.)
• Trust fund solvency measures how much debt a state has. How large are unfunded pension liabilities, OPEB liabilities, and state debt compared to the state personal income? (Colorado ranks 33rd.)

rank 1. Alaska2. Nebraska3. Wyoming4. North Dakota5. South Dakota6. Florida 7. Utah8. Oklahoma9. Tennessee10. Montana11. Ohio12. Idaho13. Nevada14. Missouri15. Alabama16. Texas17. Indiana18. South Carolina19. Virginia20. New Hampshire21. North Carolina22. Colorado23. Georgia24. Washington25. Iowa26. Minnesota27. Kansas28. Arkansas29. Wisconsin30. Oregon31. Arizona32. Mississippi33. Louisiana34. New Mexico35. Michigan36. Vermont37. Rhode Island38. Delaware39. Pennsylvania40. West Virginia41. Maryland42. New York43. Maine44. California45. Hawaii46. Kentucky47. Illinois48. New Jersey49. Massachusetts50. Connecticut51. Puerto Rico
CONNECTICUT
SUMMARY
On the basis of its fiscal solvency in five separate categories, Connecti-cut ranks 50th among the US states and Puerto Rico for its fiscal health. Connecticut’s fiscal position is poor across all categories. With between only 0.46 and 1.19 times the cash needed to cover short-term liabilities, Connecticut’s revenues matched only 94 percent of expenses, producing a deficit of $505 per capita. The state is heavily reliant on debt to finance its spending. With a negative net asset ratio of −0.88 and liabilities exceeding assets by 34 percent, per capita debt is $9,077. Total debt is $20.88 billion. Unfunded pensions are $83.31 billion on a guaranteed-to-be-paid basis, and other postemployment benefits (OPEB) are $19.53 billion. Total liabili-ties are equal to 53 percent of total state personal income.
2014 TOTAL LONG-TERM OBLIGATIONSSTATE DEBT
General obligation
bonds
Total primary government
debtState personal
income
Ratio of debt to state personal
incomeTotal primary
debt per capita
Connecticut $15.28 billion $20.88 billion $233.29 billion 9.0% $5,807
National average $6.60 billion $13.76 billion $288.25 billion 6.0% $2,144
PENSION LIABILITY
Unfunded pension liability Funded ratio
Market value of unfunded liability
Market value of funded liability ratio
Connecticut $26.18 billion 52% $83.31 billion 26%
National average $20.46 billion 74% $86.85 billion 40%
OTHER POSTEMPLOYMENT BENEFITS (OPEB)
Total unfunded OPEB Funded ratio
Connecticut $19.53 billion 1%
National average $10.21 billion 13%

2
For a complete explanation of the methodology used to calculate Connecticut’s fiscal health rankings, see Eileen Norcross and Olivia Gonzalez, “Ranking the States by Fiscal Condition,” 2016 ed. (Mercatus Research, Mercatus Center at George Mason University, Arlington, VA, June 2016).
50thbudget
solvency
39thtrust fundsolvency
47thlong-runsolvency
27thservice-level
solvency
49thcash
solvency
–3.0
–2.0
–1.0
US average
1.0
2.0
3.0
2.0
–1.0
rag
1.0
2.0
3
3distance fromUS average
(in standard deviations)
UNDERLYING RATIOS
Cash ratio Quick ratioCurrent
ratioOperating
ratio
Surplus (or deficit) per
capitaNet asset
ratio
Long-term liability
ratio
Long-term liability
per capita
Connecticut 0.46 1.11 1.19 0.94 −$505 −0.88 1.34 $9,077
National average
2.40 3.18 3.54 1.06 $448 −0.03 0.47 $3,069
Tax-to-income ratio
Revenue-to-income ratio
Expenses-to-income ratio
Pension-to-income ratio
OPEB-to-income ratio
Primary debt-to-income ratio
Connecticut 0.06 0.12 0.13 0.36 0.08 0.09
National average
0.06 0.14 0.13 0.31 0.03 0.06
KEY TERMS
• Cash solvency measures whether a state has enough cash to cover its short-term bills, which include accounts payable, vouchers, warrants, and short-term debt. (Connecticut ranks 49th.)
• Budget solvency measures whether a state can cover its fiscal year spend-ing using current revenues. Did it run a shortfall during the year? (Con-necticut ranks 50th.)
• Long-run solvency measures whether a state has a hedge against large long-term liabilities. Are enough assets available to cushion the state from potential shocks or long-term fiscal risks? (Connecticut ranks 47th.)
• Service-level solvency measures how high taxes, revenues, and spending are when compared to state personal income. Do states have enough “fis-cal slack”? If spending commitments demand more revenues, are states in a good position to increase taxes without harming the economy? Is spend-ing high or low relative to the tax base? (Connecticut ranks 27th.)
• Trust fund solvency measures how much debt a state has. How large are unfunded pension liabilities, OPEB liabilities, and state debt compared to the state personal income? (Connecticut ranks 39th.)

rank 1. Alaska2. Nebraska3. Wyoming4. North Dakota5. South Dakota6. Florida 7. Utah8. Oklahoma9. Tennessee10. Montana11. Ohio12. Idaho13. Nevada14. Missouri15. Alabama16. Texas17. Indiana18. South Carolina19. Virginia20. New Hampshire21. North Carolina22. Colorado23. Georgia24. Washington25. Iowa26. Minnesota27. Kansas28. Arkansas29. Wisconsin30. Oregon31. Arizona32. Mississippi33. Louisiana34. New Mexico35. Michigan36. Vermont37. Rhode Island38. Delaware39. Pennsylvania40. West Virginia41. Maryland42. New York43. Maine44. California45. Hawaii46. Kentucky47. Illinois48. New Jersey49. Massachusetts50. Connecticut51. Puerto Rico
DELAWARE
SUMMARY
On the basis of its fiscal solvency in five separate categories, Delaware ranks 38th among the US states and Puerto Rico for its fiscal health. On a short-term basis, Delaware has between 1.90 and 3.23 times the cash needed to cover short-term liabilities. Revenues cover 98 percent of expenses, producing an operating deficit of $195 per capita. On a long-run basis, Delaware has a negative net asset ratio of −0.03, and long-term lia-bilities account for 51 percent of total assets. Debt totals $3.02 billion. On a guaranteed-to-be-paid basis, unfunded pension liabilities are $8.03 billion, and other postemployment benefits (OPEB) add a further $5.66 billion in unfunded obligations.
2014 TOTAL LONG-TERM OBLIGATIONSSTATE DEBT
General obligation
bonds
Total primary government
debtState personal
income
Ratio of debt to state personal
incomeTotal primary
debt per capita
Delaware $2.00 billion $3.02 billion $43.39 billion 7.0% $3,230
National average $6.60 billion $13.76 billion $288.25 billion 6.0% $2,144
PENSION LIABILITY
Unfunded pension liability Funded ratio
Market value of unfunded liability
Market value of funded liability ratio
Delaware $0.72 billion 92% $8.03 billion 52%
National average $20.46 billion 74% $86.85 billion 40%
OTHER POSTEMPLOYMENT BENEFITS (OPEB)
Total unfunded OPEB Funded ratio
Delaware $5.66 billion 5%
National average $10.21 billion 13%

2
For a complete explanation of the methodology used to calculate Delaware’s fiscal health rankings, see Eileen Norcross and Olivia Gonzalez, “Ranking the States by Fiscal Condition,” 2016 ed. (Mercatus Research, Mercatus Center at George Mason University, Arlington, VA, June 2016).
46thbudget
solvency
10thtrust fundsolvency
40thlong-runsolvency
46thservice-level
solvency
20thcash
solvency
–3.0
–2.0
–1.0
US average
1.0
2.0
3.0
2.0
–1.0
rag
1.0
2.0
3
3distance fromUS average
(in standard deviations)
UNDERLYING RATIOS
Cash ratio Quick ratioCurrent
ratioOperating
ratio
Surplus (or deficit) per
capitaNet asset
ratio
Long-term liability
ratio
Long-term liability
per capita
Delaware 1.90 2.89 3.23 0.98 −$195 −0.03 0.51 $6,226
National average
2.40 3.18 3.54 1.06 $448 −0.03 0.47 $3,069
Tax-to-income ratio
Revenue-to-income ratio
Expenses-to-income ratio
Pension-to-income ratio
OPEB-to-income ratio
Primary debt-to-income ratio
Delaware 0.09 0.18 0.19 0.18 0.13 0.07
National average
0.06 0.14 0.13 0.31 0.03 0.06
KEY TERMS
• Cash solvency measures whether a state has enough cash to cover its short-term bills, which include accounts payable, vouchers, warrants, and short-term debt. (Delaware ranks 20th.)
• Budget solvency measures whether a state can cover its fiscal year spend-ing using current revenues. Did it run a shortfall during the year? (Dela-ware ranks 46th.)
• Long-run solvency measures whether a state has a hedge against large long-term liabilities. Are enough assets available to cushion the state from potential shocks or long-term fiscal risks? (Delaware ranks 40th.)
• Service-level solvency measures how high taxes, revenues, and spending are when compared to state personal income. Do states have enough “fis-cal slack”? If spending commitments demand more revenues, are states in a good position to increase taxes without harming the economy? Is spend-ing high or low relative to the tax base? (Delaware ranks 46th.)
• Trust fund solvency measures how much debt a state has. How large are unfunded pension liabilities, OPEB liabilities, and state debt compared to the state personal income? (Delaware ranks 10th.)

rank 1. Alaska2. Nebraska3. Wyoming4. North Dakota5. South Dakota6. Florida 7. Utah8. Oklahoma9. Tennessee10. Montana11. Ohio12. Idaho13. Nevada14. Missouri15. Alabama16. Texas17. Indiana18. South Carolina19. Virginia20. New Hampshire21. North Carolina22. Colorado23. Georgia24. Washington25. Iowa26. Minnesota27. Kansas28. Arkansas29. Wisconsin30. Oregon31. Arizona32. Mississippi33. Louisiana34. New Mexico35. Michigan36. Vermont37. Rhode Island38. Delaware39. Pennsylvania40. West Virginia41. Maryland42. New York43. Maine44. California45. Hawaii46. Kentucky47. Illinois48. New Jersey49. Massachusetts50. Connecticut51. Puerto Rico
FLORIDA
SUMMARY
On the basis of its fiscal solvency in five separate categories, Florida ranks sixth among the US states and Puerto Rico for its fiscal health. Florida’s fiscal condition is strong. On a cash basis, the state has between 6.53 and 7.52 times the cash needed to cover short-term liabilities. Revenues exceed expenses by 12 percent, producing a surplus of $440 per capita. Net assets are 11 percent of total assets, and long-term liabilities are 34 percent of total assets. Total debt is $27.16 billion. Unfunded pension liabilities amount to $162.54 billion on a guaranteed-to-be-paid basis, and other postemploy-ment benefits (OPEB) add $15.22 billion in unfunded liabilities. In total, these three liabilities are equal to 24 percent of total state personal income.
2014 TOTAL LONG-TERM OBLIGATIONSSTATE DEBT
General obligation
bonds
Total primary government
debtState personal
income
Ratio of debt to state personal
incomeTotal primary
debt per capita
Florida $11.82 billion $27.16 billion $850.18 billion 3.2% $1,365
National average $6.60 billion $13.76 billion $288.25 billion 6.0% $2,144
PENSION LIABILITY
Unfunded pension liability Funded ratio
Market value of unfunded liability
Market value of funded liability ratio
Florida $21.50 billion 87% $162.54 billion 46%
National average $20.46 billion 74% $86.85 billion 40%
OTHER POSTEMPLOYMENT BENEFITS (OPEB)
Total unfunded OPEB Funded ratio
Florida $15.22 billion 0%
National average $10.21 billion 13%

2
For a complete explanation of the methodology used to calculate Florida’s fiscal health rankings, see Eileen Norcross and Olivia Gonzalez, “Ranking the States by Fiscal Condition,” 2016 ed. (Mercatus Research, Mercatus Center at George Mason University, Arlington, VA, June 2016).
7thbudget
solvency
12thtrust fundsolvency
31stlong-runsolvency
3rdservice-level
solvency
3rdcash
solvency
–3.0
–2.0
–1.0
US average
1.0
2.0
3.0
2.0
–1.0
er
1.0
2.0
3
3
distance fromUS average
(in standard deviations)
UNDERLYING RATIOS
Cash ratio Quick ratioCurrent
ratioOperating
ratio
Surplus (or deficit) per
capitaNet asset
ratio
Long-term liability
ratio
Long-term liability
per capita
Florida 6.53 7.50 7.52 1.12 $440 0.11 0.34 $2,350
National average
2.40 3.18 3.54 1.06 $448 −0.03 0.47 $3,069
Tax-to-income ratio
Revenue-to-income ratio
Expenses-to-income ratio
Pension-to-income ratio
OPEB-to-income ratio
Primary debt-to-income ratio
Florida 0.04 0.10 0.09 0.19 0.02 0.03
National average
0.06 0.14 0.13 0.31 0.03 0.06
KEY TERMS
• Cash solvency measures whether a state has enough cash to cover its short-term bills, which include accounts payable, vouchers, warrants, and short-term debt. (Florida ranks 3rd.)
• Budget solvency measures whether a state can cover its fiscal year spend-ing using current revenues. Did it run a shortfall during the year? (Florida ranks 7th.)
• Long-run solvency measures whether a state has a hedge against large long-term liabilities. Are enough assets available to cushion the state from potential shocks or long-term fiscal risks? (Florida ranks 31st.)
• Service-level solvency measures how high taxes, revenues, and spending are when compared to state personal income. Do states have enough “fis-cal slack”? If spending commitments demand more revenues, are states in a good position to increase taxes without harming the economy? Is spend-ing high or low relative to the tax base? (Florida ranks 3rd.)
• Trust fund solvency measures how much debt a state has. How large are unfunded pension liabilities, OPEB liabilities, and state debt compared to the state personal income? (Florida ranks 12th.)

rank 1. Alaska2. Nebraska3. Wyoming4. North Dakota5. South Dakota6. Florida 7. Utah8. Oklahoma9. Tennessee10. Montana11. Ohio12. Idaho13. Nevada14. Missouri15. Alabama16. Texas17. Indiana18. South Carolina19. Virginia20. New Hampshire21. North Carolina22. Colorado23. Georgia24. Washington25. Iowa26. Minnesota27. Kansas28. Arkansas29. Wisconsin30. Oregon31. Arizona32. Mississippi33. Louisiana34. New Mexico35. Michigan36. Vermont37. Rhode Island38. Delaware39. Pennsylvania40. West Virginia41. Maryland42. New York43. Maine44. California45. Hawaii46. Kentucky47. Illinois48. New Jersey49. Massachusetts50. Connecticut51. Puerto Rico
GEORGIA
SUMMARY
On the basis of its fiscal solvency in five separate categories, Georgia ranks 23rd among the US states and Puerto Rico for its fiscal health. On a cash basis, Georgia has between 1.64 and 2.52 times the cash to cover short-term liabilities. Revenues exceed expenses by 3 percent, producing a per capita surplus of $150. Net assets are 6 percent of total assets, and total liabilities account for 38 percent of total assets. Total debt is $14.62 billion. Unfunded pension liabilities are $95.30 billion on a guaranteed-to-be-paid basis, and other postemployment benefits (OPEB) add $11.14 billion to unfunded lia-bilities. These three liabilities are equal to 31 percent of total state personal income.
2014 TOTAL LONG-TERM OBLIGATIONSSTATE DEBT
General obligation
bonds
Total primary government
debtState personal
income
Ratio of debt to state personal
incomeTotal primary
debt per capita
Georgia $9.44 billion $14.62 billion $393.59 billion 3.7% $1,448
National average $6.60 billion $13.76 billion $288.25 billion 6.0% $2,144
PENSION LIABILITY
Unfunded pension liability Funded ratio
Market value of unfunded liability
Market value of funded liability ratio
Georgia $18.55 billion 80% $95.30 billion 43%
National average $20.46 billion 74% $86.85 billion 40%
OTHER POSTEMPLOYMENT BENEFITS (OPEB)
Total unfunded OPEB Funded ratio
Georgia $11.14 billion 9%
National average $10.21 billion 13%

2
For a complete explanation of the methodology used to calculate Georgia’s fiscal health rankings, see Eileen Norcross and Olivia Gonzalez, “Ranking the States by Fiscal Condition,” 2016 ed. (Mercatus Research, Mercatus Center at George Mason University, Arlington, VA, June 2016).
30thbudget
solvency
21sttrust fundsolvency
30thlong-runsolvency
13thservice-level
solvency
26thcash
solvency
–3.0
–2.0
–1.0
US average
1.0
2.0
3.0
2.0
–1.0
av
1.0
2.0
3
3distance fromUS average
(in standard deviations)
UNDERLYING RATIOS
Cash ratio Quick ratioCurrent
ratioOperating
ratio
Surplus (or deficit) per
capitaNet asset
ratio
Long-term liability
ratio
Long-term liability
per capita
Georgia 1.64 2.44 2.52 1.03 $150 0.06 0.38 $1,690
National average
2.40 3.18 3.54 1.06 $448 −0.03 0.47 $3,069
Tax-to-income ratio
Revenue-to-income ratio
Expenses-to-income ratio
Pension-to-income ratio
OPEB-to-income ratio
Primary debt-to-income ratio
Georgia 0.04 0.12 0.11 0.24 0.03 0.04
National average
0.06 0.14 0.13 0.31 0.03 0.06
KEY TERMS
• Cash solvency measures whether a state has enough cash to cover its short-term bills, which include accounts payable, vouchers, warrants, and short-term debt. (Georgia ranks 26th.)
• Budget solvency measures whether a state can cover its fiscal year spend-ing using current revenues. Did it run a shortfall during the year? (Georgia ranks 30th.)
• Long-run solvency measures whether a state has a hedge against large long-term liabilities. Are enough assets available to cushion the state from potential shocks or long-term fiscal risks? (Georgia ranks 30th.)
• Service-level solvency measures how high taxes, revenues, and spending are when compared to state personal income. Do states have enough “fis-cal slack”? If spending commitments demand more revenues, are states in a good position to increase taxes without harming the economy? Is spend-ing high or low relative to the tax base? (Georgia ranks 13th.)
• Trust fund solvency measures how much debt a state has. How large are unfunded pension liabilities, OPEB liabilities, and state debt compared to the state personal income? (Georgia ranks 21st.)

rank 1. Alaska2. Nebraska3. Wyoming4. North Dakota5. South Dakota6. Florida 7. Utah8. Oklahoma9. Tennessee10. Montana11. Ohio12. Idaho13. Nevada14. Missouri15. Alabama16. Texas17. Indiana18. South Carolina19. Virginia20. New Hampshire21. North Carolina22. Colorado23. Georgia24. Washington25. Iowa26. Minnesota27. Kansas28. Arkansas29. Wisconsin30. Oregon31. Arizona32. Mississippi33. Louisiana34. New Mexico35. Michigan36. Vermont37. Rhode Island38. Delaware39. Pennsylvania40. West Virginia41. Maryland42. New York43. Maine44. California45. Hawaii46. Kentucky47. Illinois48. New Jersey49. Massachusetts50. Connecticut51. Puerto Rico
HAWAII
SUMMARY
On the basis of its fiscal solvency in five separate categories, Hawaii ranks 45th among the US states and Puerto Rico for its fiscal health. Hawaii has between 1.93 and 2.73 times the cash needed to cover short-term liabili-ties. Revenues cover 99 percent of expenses, producing a deficit of $83 per capita. Net assets are 1 percent of total assets, and total liabilities account for 64 percent of total assets, resulting in a long-term liability per cap-ita of $8,180. Total debt is $7.78 billion. Unfunded pension liabilities are $28.74 billion on a guaranteed-to-be-paid basis, and other postemploy-ment benefits (OPEB) add $11.18 billion in unfunded liabilities. These three liabilities are equal to 73 percent of total state personal income.
2014 TOTAL LONG-TERM OBLIGATIONSSTATE DEBT
General obligation
bonds
Total primary government
debtState personal
income
Ratio of debt to state personal
incomeTotal primary
debt per capita
Hawaii $5.82 billion $7.78 billion $65.35 billion 11.9% $5,482
National average $6.60 billion $13.76 billion $288.25 billion 6.0% $2,144
PENSION LIABILITY
Unfunded pension liability Funded ratio
Market value of unfunded liability
Market value of funded liability ratio
Hawaii $8.58 billion 61% $28.74 billion 32%
National average $20.46 billion 74% $86.85 billion 40%
OTHER POSTEMPLOYMENT BENEFITS (OPEB)
Total unfunded OPEB Funded ratio
Hawaii $11.18 billion 3%
National average $10.21 billion 13%

2
For a complete explanation of the methodology used to calculate Hawaii’s fiscal health rankings, see Eileen Norcross and Olivia Gonzalez, “Ranking the States by Fiscal Condition,” 2016 ed. (Mercatus Research, Mercatus Center at George Mason University, Arlington, VA, June 2016).
43rdbudget
solvency
43rdtrust fundsolvency
42ndlong-runsolvency
43rdservice-level
solvency
23rdcash
solvency
–3.0
–2.0
–1.0
US average
1.0
2.0
3.0
2.0
–1.0
era
1.0
2.0
3
3distance fromUS average
(in standard deviations)
UNDERLYING RATIOS
Cash ratio Quick ratioCurrent
ratioOperating
ratio
Surplus (or deficit) per
capitaNet asset
ratio
Long-term liability
ratio
Long-term liability
per capita
Hawaii 1.93 2.59 2.73 0.99 −$83 0.01 0.64 $8,180
National average
2.40 3.18 3.54 1.06 $448 −0.03 0.47 $3,069
Tax-to-income ratio
Revenue-to-income ratio
Expenses-to-income ratio
Pension-to-income ratio
OPEB-to-income ratio
Primary debt-to-income ratio
Hawaii 0.09 0.16 0.16 0.44 0.17 0.12
National average
0.06 0.14 0.13 0.31 0.03 0.06
KEY TERMS
• Cash solvency measures whether a state has enough cash to cover its short-term bills, which include accounts payable, vouchers, warrants, and short-term debt. (Hawaii ranks 23rd.)
• Budget solvency measures whether a state can cover its fiscal year spend-ing using current revenues. Did it run a shortfall during the year? (Hawaii ranks 43rd.)
• Long-run solvency measures whether a state has a hedge against large long-term liabilities. Are enough assets available to cushion the state from potential shocks or long-term fiscal risks? (Hawaii ranks 42nd.)
• Service-level solvency measures how high taxes, revenues, and spending are when compared to state personal income. Do states have enough “fis-cal slack”? If spending commitments demand more revenues, are states in a good position to increase taxes without harming the economy? Is spend-ing high or low relative to the tax base? (Hawaii ranks 43rd.)
• Trust fund solvency measures how much debt a state has. How large are unfunded pension liabilities, OPEB liabilities, and state debt compared to the state personal income? (Hawaii ranks 43rd.)

rank
SUMMARY
On the basis of its fiscal solvency in five separate categories, Idaho ranks 12th among the US states and Puerto Rico for its fiscal health. Idaho’s fis-cal position is strong. The state has between 2.68 and 4.08 times the cash needed to cover short-term liabilities. Revenues exceed expenses by 13 percent, producing a per capita surplus of $597. Net assets are 35 percent of total assets, and total liabilities account for 11 percent of total assets. Debt totals $1.34 billion. Unfunded pension liabilities are $13.97 billion, and other postemployment benefits (OPEB) are $107 million. These three items are equal to 25 percent of total state personal income.
2014 TOTAL LONG-TERM OBLIGATIONSSTATE DEBT
General obligation
bonds
Total primary government
debtState personal
income
Ratio of debt to state personal
incomeTotal primary
debt per capita
Idaho $0.00 billion $1.34 billion $60.04 billion 2.2% $823
National average $6.60 billion $13.76 billion $288.25 billion 6.0% $2,144
PENSION LIABILITY
Unfunded pension liability Funded ratio
Market value of unfunded liability
Market value of funded liability ratio
Idaho $1.06 billion 93% $13.97 billion 51%
National average $20.46 billion 74% $86.85 billion 40%
OTHER POSTEMPLOYMENT BENEFITS (OPEB)
Total unfunded OPEB Funded ratio
Idaho $0.11 billion 21%
National average $10.21 billion 13%
1. Alaska2. Nebraska3. Wyoming4. North Dakota5. South Dakota6. Florida 7. Utah8. Oklahoma9. Tennessee10. Montana11. Ohio12. Idaho13. Nevada14. Missouri15. Alabama16. Texas17. Indiana18. South Carolina19. Virginia20. New Hampshire21. North Carolina22. Colorado23. Georgia24. Washington25. Iowa26. Minnesota27. Kansas28. Arkansas29. Wisconsin30. Oregon31. Arizona32. Mississippi33. Louisiana34. New Mexico35. Michigan36. Vermont37. Rhode Island38. Delaware39. Pennsylvania40. West Virginia41. Maryland42. New York43. Maine44. California45. Hawaii46. Kentucky47. Illinois48. New Jersey49. Massachusetts50. Connecticut51. Puerto Rico
IDAHO

2
For a complete explanation of the methodology used to calculate Idaho’s fiscal health rankings, see Eileen Norcross and Olivia Gonzalez, “Ranking the States by Fiscal Condition,” 2016 ed. (Mercatus Research, Mercatus Center at George Mason University, Arlington, VA, June 2016).
6thbudget
solvency
16thtrust fundsolvency
9thlong-runsolvency
33rdservice-level
solvency
14thcash
solvency
–3.0
–2.0
–1.0
US average
1.0
2.0
3.0
2.0
–1.0
av
1.0
2.0
3
3
trust fund
distance fromUS average
(in standard deviations)
UNDERLYING RATIOS
Cash ratio Quick ratioCurrent
ratioOperating
ratio
Surplus (or deficit) per
capitaNet asset
ratio
Long-term liability
ratio
Long-term liability
per capita
Idaho 2.68 3.23 4.08 1.13 $597 0.35 0.11 $957
National average
2.40 3.18 3.54 1.06 $448 −0.03 0.47 $3,069
Tax-to-income ratio
Revenue-to-income ratio
Expenses-to-income ratio
Pension-to-income ratio
OPEB-to-income ratio
Primary debt-to-income ratio
Idaho 0.06 0.15 0.13 0.23 0.00 0.02
National average
0.06 0.14 0.13 0.31 0.03 0.06
KEY TERMS
• Cash solvency measures whether a state has enough cash to cover its short-term bills, which include accounts payable, vouchers, warrants, and short-term debt. (Idaho ranks 14th.)
• Budget solvency measures whether a state can cover its fiscal year spend-ing using current revenues. Did it run a shortfall during the year? (Idaho ranks 6th.)
• Long-run solvency measures whether a state has a hedge against large long-term liabilities. Are enough assets available to cushion the state from potential shocks or long-term fiscal risks? (Idaho ranks 9th.)
• Service-level solvency measures how high taxes, revenues, and spending are when compared to state personal income. Do states have enough “fis-cal slack”? If spending commitments demand more revenues, are states in a good position to increase taxes without harming the economy? Is spend-ing high or low relative to the tax base? (Idaho ranks 33rd.)
• Trust fund solvency measures how much debt a state has. How large are unfunded pension liabilities, OPEB liabilities, and state debt compared to the state personal income? (Idaho ranks 16th.)

rank 1. Alaska2. Nebraska3. Wyoming4. North Dakota5. South Dakota6. Florida 7. Utah8. Oklahoma9. Tennessee10. Montana11. Ohio12. Idaho13. Nevada14. Missouri15. Alabama16. Texas17. Indiana18. South Carolina19. Virginia20. New Hampshire21. North Carolina22. Colorado23. Georgia24. Washington25. Iowa26. Minnesota27. Kansas28. Arkansas29. Wisconsin30. Oregon31. Arizona32. Mississippi33. Louisiana34. New Mexico35. Michigan36. Vermont37. Rhode Island38. Delaware39. Pennsylvania40. West Virginia41. Maryland42. New York43. Maine44. California45. Hawaii46. Kentucky47. Illinois48. New Jersey49. Massachusetts50. Connecticut51. Puerto Rico
ILLINOIS
SUMMARY
On the basis of its fiscal solvency in five separate categories, Illinois ranks 47th among the US states and Puerto Rico for its fiscal health. On a cash basis, Illinois has between 0.63 and 1.39 times the cash needed to cover short-term liabilities. Revenues cover 99 percent of expenses, producing a deficit of $40 per capita. On a long-run basis, a net asset ratio of −1.14 indicates that Illinois is reliant on debt financing to cover spending. Lia-bilities exceed assets by 48 percent, producing a long-term liability per capita of $6,067. Total debt is $35.55 billion. Unfunded pension liabilities are $298.05 billion on a guaranteed-to-be-paid basis, and other postem-ployment benefits (OPEB) are $34.49 billion. These three liabilities are equal to 61 percent of total state personal income.
2014 TOTAL LONG-TERM OBLIGATIONSSTATE DEBT
General obligation
bonds
Total primary government
debtState personal
income
Ratio of debt to state personal
incomeTotal primary
debt per capita
Illinois $27.06 billion $35.55 billion $613.67 billion 5.8% $2,760
National average $6.60 billion $13.76 billion $288.25 billion 6.0% $2,144
PENSION LIABILITY
Unfunded pension liability Funded ratio
Market value of unfunded liability
Market value of funded liability ratio
Illinois $118.92 billion 46% $298.05 billion 25%
National average $20.46 billion 74% $86.85 billion 40%
OTHER POSTEMPLOYMENT BENEFITS (OPEB)
Total unfunded OPEB Funded ratio
Illinois $34.49 billion 0%
National average $10.21 billion 13%

2
For a complete explanation of the methodology used to calculate Illinois’s fiscal health rankings, see Eileen Norcross and Olivia Gonzalez, “Ranking the States by Fiscal Condition,” 2016 ed. (Mercatus Research, Mercatus Center at George Mason University, Arlington, VA, June 2016).
41stbudget
solvency
46thtrust fundsolvency
49thlong-runsolvency
25thservice-level
solvency
48thcash
solvency
–3.0
–2.0
–1.0
US average
1.0
2.0
3.0
2.0
–1.0
era
1.0
2.0
3
3distance fromUS average
(in standard deviations)
UNDERLYING RATIOS
Cash ratio Quick ratioCurrent
ratioOperating
ratio
Surplus (or deficit) per
capitaNet asset
ratio
Long-term liability
ratio
Long-term liability
per capita
Illinois 0.63 0.98 1.39 0.99 −$40 −1.14 1.48 $6,067
National average
2.40 3.18 3.54 1.06 $448 −0.03 0.47 $3,069
Tax-to-income ratio
Revenue-to-income ratio
Expenses-to-income ratio
Pension-to-income ratio
OPEB-to-income ratio
Primary debt-to-income ratio
Illinois 0.06 0.12 0.12 0.49 0.06 0.06
National average
0.06 0.14 0.13 0.31 0.03 0.06
KEY TERMS
• Cash solvency measures whether a state has enough cash to cover its short-term bills, which include accounts payable, vouchers, warrants, and short-term debt. (Illinois ranks 48th.)
• Budget solvency measures whether a state can cover its fiscal year spend-ing using current revenues. Did it run a shortfall during the year? (Illinois ranks 41st.)
• Long-run solvency measures whether a state has a hedge against large long-term liabilities. Are enough assets available to cushion the state from potential shocks or long-term fiscal risks? (Illinois ranks 49th.)
• Service-level solvency measures how high taxes, revenues, and spending are when compared to state personal income. Do states have enough “fis-cal slack”? If spending commitments demand more revenues, are states in a good position to increase taxes without harming the economy? Is spend-ing high or low relative to the tax base? (Illinois ranks 25th.)
• Trust fund solvency measures how much debt a state has. How large are unfunded pension liabilities, OPEB liabilities, and state debt compared to the state personal income? (Illinois ranks 46th.)

rank 1. Alaska2. Nebraska3. Wyoming4. North Dakota5. South Dakota6. Florida 7. Utah8. Oklahoma9. Tennessee10. Montana11. Ohio12. Idaho13. Nevada14. Missouri15. Alabama16. Texas17. Indiana18. South Carolina19. Virginia20. New Hampshire21. North Carolina22. Colorado23. Georgia24. Washington25. Iowa26. Minnesota27. Kansas28. Arkansas29. Wisconsin30. Oregon31. Arizona32. Mississippi33. Louisiana34. New Mexico35. Michigan36. Vermont37. Rhode Island38. Delaware39. Pennsylvania40. West Virginia41. Maryland42. New York43. Maine44. California45. Hawaii46. Kentucky47. Illinois48. New Jersey49. Massachusetts50. Connecticut51. Puerto Rico
INDIANA
SUMMARY
On the basis of its fiscal solvency in five separate categories, Indiana ranks 17th among the US states and Puerto Rico for its fiscal health. Indiana has between 1.41 and 2.56 times the cash needed to cover short-term liabili-ties. Revenues exceed expenses by 4 percent, producing a surplus of $180 per capita. Net assets are 22 percent of total assets, and total liabilities are 10 percent of total assets. Total debt is $1.11 billion. Unfunded pension liabilities are $43.06 billion on a guaranteed-to-be-paid basis, and other postemployment benefits (OPEB) are $289 million. These three items are equal to 16 percent of total state personal income.
2014 TOTAL LONG-TERM OBLIGATIONSSTATE DEBT
General obligation
bonds
Total primary government
debtState personal
income
Ratio of debt to state personal
incomeTotal primary
debt per capita
Indiana $0.00 billion $1.11 billion $261.09 billion 0.4% $169
National average $6.60 billion $13.76 billion $288.25 billion 6.0% $2,144
PENSION LIABILITY
Unfunded pension liability Funded ratio
Market value of unfunded liability
Market value of funded liability ratio
Indiana $14.30 billion 67% $43.06 billion 41%
National average $20.46 billion 74% $86.85 billion 40%
OTHER POSTEMPLOYMENT BENEFITS (OPEB)
Total unfunded OPEB Funded ratio
Indiana $0.29 billion 24%
National average $10.21 billion 13%

2
For a complete explanation of the methodology used to calculate Indiana’s fiscal health rankings, see Eileen Norcross and Olivia Gonzalez, “Ranking the States by Fiscal Condition,” 2016 ed. (Mercatus Research, Mercatus Center at George Mason University, Arlington, VA, June 2016).
26thbudget
solvency
5thtrust fundsolvency
3rdlong-runsolvency
23rdservice-level
solvency
29thcash
solvency
–3.0
–2.0
–1.0
US average
1.0
2.0
3.0
2.0
–1.0
era
1.0
2.0
3
3
distance fromUS average
(in standard deviations)
UNDERLYING RATIOS
Cash ratio Quick ratioCurrent
ratioOperating
ratio
Surplus (or deficit) per
capitaNet asset
ratio
Long-term liability
ratio
Long-term liability
per capita
Indiana 1.41 2.09 2.56 1.04 $180 0.22 0.10 $406
National average
2.40 3.18 3.54 1.06 $448 −0.03 0.47 $3,069
Tax-to-income ratio
Revenue-to-income ratio
Expenses-to-income ratio
Pension-to-income ratio
OPEB-to-income ratio
Primary debt-to-income ratio
Indiana 0.06 0.12 0.11 0.16 0.00 0.00
National average
0.06 0.14 0.13 0.31 0.03 0.06
KEY TERMS
• Cash solvency measures whether a state has enough cash to cover its short-term bills, which include accounts payable, vouchers, warrants, and short-term debt. (Indiana ranks 29th.)
• Budget solvency measures whether a state can cover its fiscal year spend-ing using current revenues. Did it run a shortfall during the year? (Indiana ranks 26th.)
• Long-run solvency measures whether a state has a hedge against large long-term liabilities. Are enough assets available to cushion the state from potential shocks or long-term fiscal risks? (Indiana ranks 3rd.)
• Service-level solvency measures how high taxes, revenues, and spending are when compared to state personal income. Do states have enough “fis-cal slack”? If spending commitments demand more revenues, are states in a good position to increase taxes without harming the economy? Is spend-ing high or low relative to the tax base? (Indiana ranks 23rd.)
• Trust fund solvency measures how much debt a state has. How large are unfunded pension liabilities, OPEB liabilities, and state debt compared to the state personal income? (Indiana ranks 5th.)

rank 1. Alaska2. Nebraska3. Wyoming4. North Dakota5. South Dakota6. Florida 7. Utah8. Oklahoma9. Tennessee10. Montana11. Ohio12. Idaho13. Nevada14. Missouri15. Alabama16. Texas17. Indiana18. South Carolina19. Virginia20. New Hampshire21. North Carolina22. Colorado23. Georgia24. Washington25. Iowa26. Minnesota27. Kansas28. Arkansas29. Wisconsin30. Oregon31. Arizona32. Mississippi33. Louisiana34. New Mexico35. Michigan36. Vermont37. Rhode Island38. Delaware39. Pennsylvania40. West Virginia41. Maryland42. New York43. Maine44. California45. Hawaii46. Kentucky47. Illinois48. New Jersey49. Massachusetts50. Connecticut51. Puerto Rico
IOWA
SUMMARY
On the basis of its fiscal solvency in five separate categories, Iowa ranks 25th among the US states and Puerto Rico for its fiscal health. On a cash basis, Iowa has between 1.57 and 2.51 times the cash needed to cover short-term liabilities. Revenues exceed expenses by 4 percent, producing a sur-plus of $250 per capita. Net assets are 22 percent of total assets, and total liabilities are 18 percent of total assets. Total debt is $3.68 billion. Unfunded pension liabilities are $36.10 billion on a guaranteed-to-be-paid basis, and other postemployment benefits (OPEB) add $233 million in unfunded liabilities. These three liabilities are equal to 29 percent of state personal income.
2014 TOTAL LONG-TERM OBLIGATIONSSTATE DEBT
General obligation
bonds
Total primary government
debtState personal
income
Ratio of debt to state personal
incomeTotal primary
debt per capita
Iowa $0.00 billion $3.68 billion $139.62 billion 2.6% $1,184
National average $6.60 billion $13.76 billion $288.25 billion 6.0% $2,144
PENSION LIABILITY
Unfunded pension liability Funded ratio
Market value of unfunded liability
Market value of funded liability ratio
Iowa $6.29 billion 82% $36.10 billion 45%
National average $20.46 billion 74% $86.85 billion 40%
OTHER POSTEMPLOYMENT BENEFITS (OPEB)
Total unfunded OPEB Funded ratio
Iowa $0.23 billion 0%
National average $10.21 billion 13%

2
For a complete explanation of the methodology used to calculate Iowa’s fiscal health rankings, see Eileen Norcross and Olivia Gonzalez, “Ranking the States by Fiscal Condition,” 2016 ed. (Mercatus Research, Mercatus Center at George Mason University, Arlington, VA, June 2016).
24thbudget
solvency
22ndtrust fundsolvency
13thlong-runsolvency
29thservice-level
solvency
27thcash
solvency
–3.0
–2.0
–1.0
US average
1.0
2.0
3.0
2.0
–1.0
av
1.0
2.0
3
3
y
distance fromUS average
(in standard deviations)
UNDERLYING RATIOS
Cash ratio Quick ratioCurrent
ratioOperating
ratio
Surplus (or deficit) per
capitaNet asset
ratio
Long-term liability
ratio
Long-term liability
per capita
Iowa 1.57 2.41 2.51 1.04 $250 0.22 0.18 $1,339
National average
2.40 3.18 3.54 1.06 $448 −0.03 0.47 $3,069
Tax-to-income ratio
Revenue-to-income ratio
Expenses-to-income ratio
Pension-to-income ratio
OPEB-to-income ratio
Primary debt-to-income ratio
Iowa 0.05 0.14 0.14 0.26 0.00 0.03
National average
0.06 0.14 0.13 0.31 0.03 0.06
KEY TERMS
• Cash solvency measures whether a state has enough cash to cover its short-term bills, which include accounts payable, vouchers, warrants, and short-term debt. (Iowa ranks 27th.)
• Budget solvency measures whether a state can cover its fiscal year spend-ing using current revenues. Did it run a shortfall during the year? (Iowa ranks 24th.)
• Long-run solvency measures whether a state has a hedge against large long-term liabilities. Are enough assets available to cushion the state from potential shocks or long-term fiscal risks? (Iowa ranks 13th.)
• Service-level solvency measures how high taxes, revenues, and spending are when compared to state personal income. Do states have enough “fis-cal slack”? If spending commitments demand more revenues, are states in a good position to increase taxes without harming the economy? Is spend-ing high or low relative to the tax base? (Iowa ranks 29th.)
• Trust fund solvency measures how much debt a state has. How large are unfunded pension liabilities, OPEB liabilities, and state debt compared to the state personal income? (Iowa ranks 22nd.)
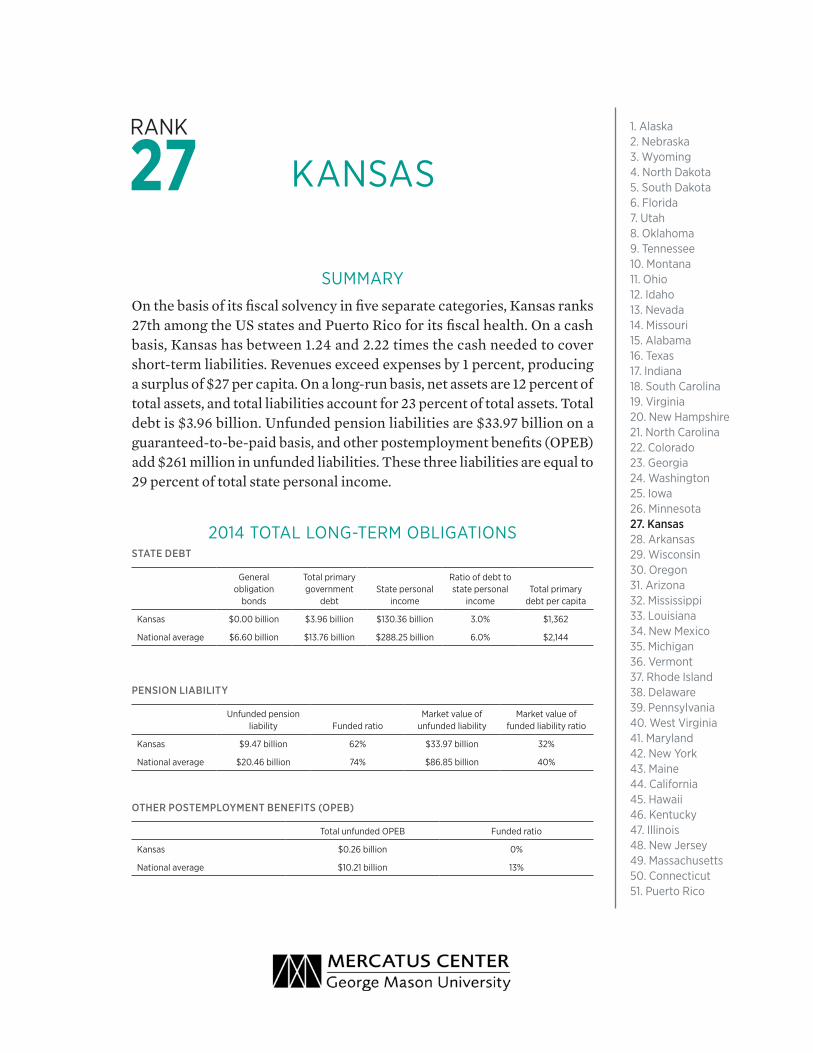
rank 1. Alaska2. Nebraska3. Wyoming4. North Dakota5. South Dakota6. Florida 7. Utah8. Oklahoma9. Tennessee10. Montana11. Ohio12. Idaho13. Nevada14. Missouri15. Alabama16. Texas17. Indiana18. South Carolina19. Virginia20. New Hampshire21. North Carolina22. Colorado23. Georgia24. Washington25. Iowa26. Minnesota27. Kansas28. Arkansas29. Wisconsin30. Oregon31. Arizona32. Mississippi33. Louisiana34. New Mexico35. Michigan36. Vermont37. Rhode Island38. Delaware39. Pennsylvania40. West Virginia41. Maryland42. New York43. Maine44. California45. Hawaii46. Kentucky47. Illinois48. New Jersey49. Massachusetts50. Connecticut51. Puerto Rico
KANSAS
SUMMARY
On the basis of its fiscal solvency in five separate categories, Kansas ranks 27th among the US states and Puerto Rico for its fiscal health. On a cash basis, Kansas has between 1.24 and 2.22 times the cash needed to cover short-term liabilities. Revenues exceed expenses by 1 percent, producing a surplus of $27 per capita. On a long-run basis, net assets are 12 percent of total assets, and total liabilities account for 23 percent of total assets. Total debt is $3.96 billion. Unfunded pension liabilities are $33.97 billion on a guaranteed-to-be-paid basis, and other postemployment benefits (OPEB) add $261 million in unfunded liabilities. These three liabilities are equal to 29 percent of total state personal income.
2014 TOTAL LONG-TERM OBLIGATIONSSTATE DEBT
General obligation
bonds
Total primary government
debtState personal
income
Ratio of debt to state personal
incomeTotal primary
debt per capita
Kansas $0.00 billion $3.96 billion $130.36 billion 3.0% $1,362
National average $6.60 billion $13.76 billion $288.25 billion 6.0% $2,144
PENSION LIABILITY
Unfunded pension liability Funded ratio
Market value of unfunded liability
Market value of funded liability ratio
Kansas $9.47 billion 62% $33.97 billion 32%
National average $20.46 billion 74% $86.85 billion 40%
OTHER POSTEMPLOYMENT BENEFITS (OPEB)
Total unfunded OPEB Funded ratio
Kansas $0.26 billion 0%
National average $10.21 billion 13%

2
For a complete explanation of the methodology used to calculate Kansas’s fiscal health rankings, see Eileen Norcross and Olivia Gonzalez, “Ranking the States by Fiscal Condition,” 2016 ed. (Mercatus Research, Mercatus Center at George Mason University, Arlington, VA, June 2016).
38thbudget
solvency
25thtrust fundsolvency
21stlong-runsolvency
11thservice-level
solvency
31stcash
solvency
–3.0
–2.0
–1.0
US average
1.0
2.0
3.0
2.0
–1.0
era
1.0
2.0
3
3distance fromUS average
(in standard deviations)
UNDERLYING RATIOS
Cash ratio Quick ratioCurrent
ratioOperating
ratio
Surplus (or deficit) per
capitaNet asset
ratio
Long-term liability
ratio
Long-term liability
per capita
Kansas 1.24 2.20 2.22 1.01 $27 0.12 0.23 $1,362
National average
2.40 3.18 3.54 1.06 $448 −0.03 0.47 $3,069
Tax-to-income ratio
Revenue-to-income ratio
Expenses-to-income ratio
Pension-to-income ratio
OPEB-to-income ratio
Primary debt-to-income ratio
Kansas 0.05 0.10 0.10 0.26 0.00 0.03
National average
0.06 0.14 0.13 0.31 0.03 0.06
KEY TERMS
• Cash solvency measures whether a state has enough cash to cover its short-term bills, which include accounts payable, vouchers, warrants, and short-term debt. (Kansas ranks 31st.)
• Budget solvency measures whether a state can cover its fiscal year spend-ing using current revenues. Did it run a shortfall during the year? (Kansas ranks 38th.)
• Long-run solvency measures whether a state has a hedge against large long-term liabilities. Are enough assets available to cushion the state from potential shocks or long-term fiscal risks? (Kansas ranks 21st.)
• Service-level solvency measures how high taxes, revenues, and spending are when compared to state personal income. Do states have enough “fis-cal slack”? If spending commitments demand more revenues, are states in a good position to increase taxes without harming the economy? Is spend-ing high or low relative to the tax base? (Kansas ranks 11th.)
• Trust fund solvency measures how much debt a state has. How large are unfunded pension liabilities, OPEB liabilities, and state debt compared to the state personal income? (Kansas ranks 25th.)

rank 1. Alaska2. Nebraska3. Wyoming4. North Dakota5. South Dakota6. Florida 7. Utah8. Oklahoma9. Tennessee10. Montana11. Ohio12. Idaho13. Nevada14. Missouri15. Alabama16. Texas17. Indiana18. South Carolina19. Virginia20. New Hampshire21. North Carolina22. Colorado23. Georgia24. Washington25. Iowa26. Minnesota27. Kansas28. Arkansas29. Wisconsin30. Oregon31. Arizona32. Mississippi33. Louisiana34. New Mexico35. Michigan36. Vermont37. Rhode Island38. Delaware39. Pennsylvania40. West Virginia41. Maryland42. New York43. Maine44. California45. Hawaii46. Kentucky47. Illinois48. New Jersey49. Massachusetts50. Connecticut51. Puerto Rico
KENTUCKY
SUMMARY
On the basis of its fiscal solvency in five separate categories, Kentucky ranks 46th among the US states and Puerto Rico for its fiscal health. On a cash basis, the state has between 0.75 and 2.08 times the cash needed to cover short-term liabilities. Revenues cover 98 percent of expenses, pro-ducing a deficit of $100 per capita. On a long-run basis, a negative net asset ratio of −0.36 and total liabilities accounting for 56 percent of total assets produce a long-term deficit per capita of $3,933. Total debt is $8.23 billion. Unfunded pensions are $78.33 billion on a guaranteed-to-be-paid basis, and other postemployment benefits (OPEB) add $4.35 billion in unfunded liabilities. These three liabilities are equal to 55 percent of total state per-sonal income.
2014 TOTAL LONG-TERM OBLIGATIONSSTATE DEBT
General obligation
bonds
Total primary government
debtState personal
income
Ratio of debt to state personal
incomeTotal primary
debt per capita
Kentucky $0.00 billion $8.23 billion $165.04 billion 5.0% $1,864
National average $6.60 billion $13.76 billion $288.25 billion 6.0% $2,144
PENSION LIABILITY
Unfunded pension liability Funded ratio
Market value of unfunded liability
Market value of funded liability ratio
Kentucky $29.00 billion 49% $78.33 billion 26%
National average $20.46 billion 74% $86.85 billion 40%
OTHER POSTEMPLOYMENT BENEFITS (OPEB)
Total unfunded OPEB Funded ratio
Kentucky $4.35 billion 30%
National average $10.21 billion 13%

2
For a complete explanation of the methodology used to calculate Kentucky’s fiscal health rankings, see Eileen Norcross and Olivia Gonzalez, “Ranking the States by Fiscal Condition,” 2016 ed. (Mercatus Research, Mercatus Center at George Mason University, Arlington, VA, June 2016).
44thbudget
solvency
45thtrust fundsolvency
45thlong-runsolvency
40thservice-level
solvency
40thcash
solvency
–3.0
–2.0
–1.0
US average
1.0
2.0
3.0
2.0
–1.0
era
1.0
2.0
3
3distance fromUS average
(in standard deviations)
UNDERLYING RATIOS
Cash ratio Quick ratioCurrent
ratioOperating
ratio
Surplus (or deficit) per
capitaNet asset
ratio
Long-term liability
ratio
Long-term liability
per capita
Kentucky 0.75 1.59 2.08 0.98 −$100 −0.36 0.56 $3,933
National average
2.40 3.18 3.54 1.06 $448 −0.03 0.47 $3,069
Tax-to-income ratio
Revenue-to-income ratio
Expenses-to-income ratio
Pension-to-income ratio
OPEB-to-income ratio
Primary debt-to-income ratio
Kentucky 0.07 0.15 0.15 0.47 0.03 0.05
National average
0.06 0.14 0.13 0.31 0.03 0.06
KEY TERMS
• Cash solvency measures whether a state has enough cash to cover its short-term bills, which include accounts payable, vouchers, warrants, and short-term debt. (Kentucky ranks 40th.)
• Budget solvency measures whether a state can cover its fiscal year spend-ing using current revenues. Did it run a shortfall during the year? (Ken-tucky ranks 44th.)
• Long-run solvency measures whether a state has a hedge against large long-term liabilities. Are enough assets available to cushion the state from potential shocks or long-term fiscal risks? (Kentucky ranks 45th.)
• Service-level solvency measures how high taxes, revenues, and spending are when compared to state personal income. Do states have enough “fis-cal slack”? If spending commitments demand more revenues, are states in a good position to increase taxes without harming the economy? Is spend-ing high or low relative to the tax base? (Kentucky ranks 40th.)
• Trust fund solvency measures how much debt a state has. How large are unfunded pension liabilities, OPEB liabilities, and state debt compared to the state personal income? (Kentucky ranks 45th.)

rank 1. Alaska2. Nebraska3. Wyoming4. North Dakota5. South Dakota6. Florida 7. Utah8. Oklahoma9. Tennessee10. Montana11. Ohio12. Idaho13. Nevada14. Missouri15. Alabama16. Texas17. Indiana18. South Carolina19. Virginia20. New Hampshire21. North Carolina22. Colorado23. Georgia24. Washington25. Iowa26. Minnesota27. Kansas28. Arkansas29. Wisconsin30. Oregon31. Arizona32. Mississippi33. Louisiana34. New Mexico35. Michigan36. Vermont37. Rhode Island38. Delaware39. Pennsylvania40. West Virginia41. Maryland42. New York43. Maine44. California45. Hawaii46. Kentucky47. Illinois48. New Jersey49. Massachusetts50. Connecticut51. Puerto Rico
LOUISIANA
SUMMARY
On the basis of its fiscal solvency in five separate categories, Louisiana ranks 33rd among the US states and Puerto Rico for its fiscal health. Loui-siana has between 1.99 and 3.26 times the cash needed to cover short-term liabilities. Revenues cover 96 percent of expenses, producing a deficit of $216 per capita. On a long-run basis, net assets are 4 percent of total assets, and total liabilities are 44 percent of total assets. Total debt is $12.31 bil-lion. Unfunded pension liabilities are $73.26 billion on a guaranteed-to-be-paid basis, and other postemployment benefits (OPEB) add $5.48 billion to unfunded liabilities. Together these three liabilities are equal to 46 percent of total state personal income.
2014 TOTAL LONG-TERM OBLIGATIONSSTATE DEBT
General obligation
bonds
Total primary government
debtState personal
income
Ratio of debt to state personal
incomeTotal primary
debt per capita
Louisiana $3.14 billion $12.31 billion $195.43 billion 6.3% $2,647
National average $6.60 billion $13.76 billion $288.25 billion 6.0% $2,144
PENSION LIABILITY
Unfunded pension liability Funded ratio
Market value of unfunded liability
Market value of funded liability ratio
Louisiana $21.88 billion 59% $73.26 billion 33%
National average $20.46 billion 74% $86.85 billion 40%
OTHER POSTEMPLOYMENT BENEFITS (OPEB)
Total unfunded OPEB Funded ratio
Louisiana $5.48 billion 0%
National average $10.21 billion 13%

2
For a complete explanation of the methodology used to calculate Louisiana’s fiscal health rankings, see Eileen Norcross and Olivia Gonzalez, “Ranking the States by Fiscal Condition,” 2016 ed. (Mercatus Research, Mercatus Center at George Mason University, Arlington, VA, June 2016).
47thbudget
solvency
41sttrust fundsolvency
36thlong-runsolvency
22ndservice-level
solvency
21stcash
solvency
–3.0
–2.0
–1.0
US average
1.0
2.0
3.0
2.0
–1.0
era
1.0
2.0
3
3distance fromUS average
(in standard deviations)
UNDERLYING RATIOS
Cash ratio Quick ratioCurrent
ratioOperating
ratio
Surplus (or deficit) per
capitaNet asset
ratio
Long-term liability
ratio
Long-term liability
per capita
Louisiana 1.99 2.48 3.26 0.96 −$216 0.04 0.44 $2,883
National average
2.40 3.18 3.54 1.06 $448 −0.03 0.47 $3,069
Tax-to-income ratio
Revenue-to-income ratio
Expenses-to-income ratio
Pension-to-income ratio
OPEB-to-income ratio
Primary debt-to-income ratio
Louisiana 0.04 0.13 0.13 0.37 0.03 0.06
National average
0.06 0.14 0.13 0.31 0.03 0.06
KEY TERMS
• Cash solvency measures whether a state has enough cash to cover its short-term bills, which include accounts payable, vouchers, warrants, and short-term debt. (Louisiana ranks 21st.)
• Budget solvency measures whether a state can cover its fiscal year spend-ing using current revenues. Did it run a shortfall during the year? (Loui-siana ranks 47th.)
• Long-run solvency measures whether a state has a hedge against large long-term liabilities. Are enough assets available to cushion the state from potential shocks or long-term fiscal risks? (Louisiana ranks 36th.)
• Service-level solvency measures how high taxes, revenues, and spending are when compared to state personal income. Do states have enough “fis-cal slack”? If spending commitments demand more revenues, are states in a good position to increase taxes without harming the economy? Is spend-ing high or low relative to the tax base? (Louisiana ranks 22nd.)
• Trust fund solvency measures how much debt a state has. How large are unfunded pension liabilities, OPEB liabilities, and state debt compared to the state personal income? (Louisiana ranks 41st.)

rank 1. Alaska2. Nebraska3. Wyoming4. North Dakota5. South Dakota6. Florida 7. Utah8. Oklahoma9. Tennessee10. Montana11. Ohio12. Idaho13. Nevada14. Missouri15. Alabama16. Texas17. Indiana18. South Carolina19. Virginia20. New Hampshire21. North Carolina22. Colorado23. Georgia24. Washington25. Iowa26. Minnesota27. Kansas28. Arkansas29. Wisconsin30. Oregon31. Arizona32. Mississippi33. Louisiana34. New Mexico35. Michigan36. Vermont37. Rhode Island38. Delaware39. Pennsylvania40. West Virginia41. Maryland42. New York43. Maine44. California45. Hawaii46. Kentucky47. Illinois48. New Jersey49. Massachusetts50. Connecticut51. Puerto Rico
MAINE
SUMMARY
On the basis of its fiscal solvency in five separate categories, Maine ranks 43rd among the US states and Puerto Rico for its fiscal health. On a cash basis, Maine has between 0.46 and 1.74 times the cash needed to cover short-term liabilities. Revenues cover nearly 100 percent of expenses, pro-ducing a deficit of $20 per capita. On a long-run basis, net assets are 3 per-cent of total assets, and total liabilities are 24 percent of total assets. Total debt is $1.20 billion. Unfunded pension liabilities are $14.25 billion on a guaranteed-to-be-paid basis, and other postemployment benefits (OPEB) add $95 million to total unfunded liabilities. These three liabilities are equal to 28 percent of total state personal income.
2014 TOTAL LONG-TERM OBLIGATIONSSTATE DEBT
General obligation
bonds
Total primary government
debtState personal
income
Ratio of debt to state personal
incomeTotal primary
debt per capita
Maine $0.40 billion $1.20 billion $54.20 billion 2.2% $903
National average $6.60 billion $13.76 billion $288.25 billion 6.0% $2,144
PENSION LIABILITY
Unfunded pension liability Funded ratio
Market value of unfunded liability
Market value of funded liability ratio
Maine $2.57 billion 83% $14.25 billion 47%
National average $20.46 billion 74% $86.85 billion 40%
OTHER POSTEMPLOYMENT BENEFITS (OPEB)
Total unfunded OPEB Funded ratio
Maine $0.09 billion 49%
National average $10.21 billion 13%

2
For a complete explanation of the methodology used to calculate Maine’s fiscal health rankings, see Eileen Norcross and Olivia Gonzalez, “Ranking the States by Fiscal Condition,” 2016 ed. (Mercatus Research, Mercatus Center at George Mason University, Arlington, VA, June 2016).
40thbudget
solvency
24thtrust fundsolvency
20thlong-runsolvency
36thservice-level
solvency
44thcash
solvency
–3.0
–2.0
–1.0
US average
1.0
2.0
3.0
2.0
–1.0
ave
1.0
2.0
3
3
24th
distance fromUS average
(in standard deviations)
UNDERLYING RATIOS
Cash ratio Quick ratioCurrent
ratioOperating
ratio
Surplus (or deficit) per
capitaNet asset
ratio
Long-term liability
ratio
Long-term liability
per capita
Maine 0.46 1.10 1.74 1.00 −$20 0.03 0.24 $1,115
National average
2.40 3.18 3.54 1.06 $448 −0.03 0.47 $3,069
Tax-to-income ratio
Revenue-to-income ratio
Expenses-to-income ratio
Pension-to-income ratio
OPEB-to-income ratio
Primary debt-to-income ratio
Maine 0.07 0.14 0.14 0.26 0.00 0.02
National average
0.06 0.14 0.13 0.31 0.03 0.06
KEY TERMS
• Cash solvency measures whether a state has enough cash to cover its short-term bills, which include accounts payable, vouchers, warrants, and short-term debt. (Maine ranks 44th.)
• Budget solvency measures whether a state can cover its fiscal year spend-ing using current revenues. Did it run a shortfall during the year? (Maine ranks 40th.)
• Long-run solvency measures whether a state has a hedge against large long-term liabilities. Are enough assets available to cushion the state from potential shocks or long-term fiscal risks? (Maine ranks 20th.)
• Service-level solvency measures how high taxes, revenues, and spending are when compared to state personal income. Do states have enough “fis-cal slack”? If spending commitments demand more revenues, are states in a good position to increase taxes without harming the economy? Is spend-ing high or low relative to the tax base? (Maine ranks 36th.)
• Trust fund solvency measures how much debt a state has. How large are unfunded pension liabilities, OPEB liabilities, and state debt compared to the state personal income? (Maine ranks 24th.)

rank 1. Alaska2. Nebraska3. Wyoming4. North Dakota5. South Dakota6. Florida 7. Utah8. Oklahoma9. Tennessee10. Montana11. Ohio12. Idaho13. Nevada14. Missouri15. Alabama16. Texas17. Indiana18. South Carolina19. Virginia20. New Hampshire21. North Carolina22. Colorado23. Georgia24. Washington25. Iowa26. Minnesota27. Kansas28. Arkansas29. Wisconsin30. Oregon31. Arizona32. Mississippi33. Louisiana34. New Mexico35. Michigan36. Vermont37. Rhode Island38. Delaware39. Pennsylvania40. West Virginia41. Maryland42. New York43. Maine44. California45. Hawaii46. Kentucky47. Illinois48. New Jersey49. Massachusetts50. Connecticut51. Puerto Rico
MARYLAND
SUMMARY
On the basis of its fiscal solvency in five separate categories, Maryland ranks 41st among the US states and Puerto Rico for its fiscal health. On a cash basis, Maryland has between 0.51 and 1.52 times the cash needed to cover short-term liabilities. Revenues cover 98 percent of expenses, producing an operating deficit of $122 per capita. On a long-run basis, Maryland has a negative net asset ratio of −0.19, pointing to the use of debt financing. Total liabilities are 63 percent of total assets, resulting in a per capita long-term liability of $4,266. Total debt is $17.21 billion. Unfunded pension liabilities are $74.77 billion on a guaranteed-to-be-paid basis, and other postemployment benefits (OPEB) add $8.71 billion. These three lia-bilities are equal to 31 percent of total state personal income.
2014 TOTAL LONG-TERM OBLIGATIONSSTATE DEBT
General obligation
bonds
Total primary government
debtState personal
income
Ratio of debt to state personal
incomeTotal primary
debt per capita
Maryland $8.36 billion $17.21 billion $323.78 billion 5.3% $2,880
National average $6.60 billion $13.76 billion $288.25 billion 6.0% $2,144
PENSION LIABILITY
Unfunded pension liability Funded ratio
Market value of unfunded liability
Market value of funded liability ratio
Maryland $19.61 billion 100% $74.77 billion 37%
National average $20.46 billion 74% $86.85 billion 40%
OTHER POSTEMPLOYMENT BENEFITS (OPEB)
Total unfunded OPEB Funded ratio
Maryland $8.71 billion 3%
National average $10.21 billion 13%

2
For a complete explanation of the methodology used to calculate Maryland’s fiscal health rankings, see Eileen Norcross and Olivia Gonzalez, “Ranking the States by Fiscal Condition,” 2016 ed. (Mercatus Research, Mercatus Center at George Mason University, Arlington, VA, June 2016).
45thbudget
solvency
18thtrust fundsolvency
43rdlong-runsolvency
16thservice-level
solvency
43rdcash
solvency
–3.0
–2.0
–1.0
US average
1.0
2.0
3.0
2.0
–1.0
a
1.0
2.0
3
3
trust fund
distance fromUS average
(in standard deviations)
UNDERLYING RATIOS
Cash ratio Quick ratioCurrent
ratioOperating
ratio
Surplus (or deficit) per
capitaNet asset
ratio
Long-term liability
ratio
Long-term liability
per capita
Maryland 0.51 1.29 1.52 0.98 −$122 −0.19 0.63 $4,266
National average
2.40 3.18 3.54 1.06 $448 −0.03 0.47 $3,069
Tax-to-income ratio
Revenue-to-income ratio
Expenses-to-income ratio
Pension-to-income ratio
OPEB-to-income ratio
Primary debt-to-income ratio
Maryland 0.05 0.11 0.11 0.23 0.03 0.05
National average
0.06 0.14 0.13 0.31 0.03 0.06
KEY TERMS
• Cash solvency measures whether a state has enough cash to cover its short-term bills, which include accounts payable, vouchers, warrants, and short-term debt. (Maryland ranks 43rd.)
• Budget solvency measures whether a state can cover its fiscal year spend-ing using current revenues. Did it run a shortfall during the year? (Mary-land ranks 45th.)
• Long-run solvency measures whether a state has a hedge against large long-term liabilities. Are enough assets available to cushion the state from potential shocks or long-term fiscal risks? (Maryland ranks 43rd.)
• Service-level solvency measures how high taxes, revenues, and spending are when compared to state personal income. Do states have enough “fis-cal slack”? If spending commitments demand more revenues, are states in a good position to increase taxes without harming the economy? Is spend-ing high or low relative to the tax base? (Maryland ranks 16th.)
• Trust fund solvency measures how much debt a state has. How large are unfunded pension liabilities, OPEB liabilities, and state debt compared to the state personal income? (Maryland ranks 18th.)

rank 1. Alaska2. Nebraska3. Wyoming4. North Dakota5. South Dakota6. Florida 7. Utah8. Oklahoma9. Tennessee10. Montana11. Ohio12. Idaho13. Nevada14. Missouri15. Alabama16. Texas17. Indiana18. South Carolina19. Virginia20. New Hampshire21. North Carolina22. Colorado23. Georgia24. Washington25. Iowa26. Minnesota27. Kansas28. Arkansas29. Wisconsin30. Oregon31. Arizona32. Mississippi33. Louisiana34. New Mexico35. Michigan36. Vermont37. Rhode Island38. Delaware39. Pennsylvania40. West Virginia41. Maryland42. New York43. Maine44. California45. Hawaii46. Kentucky47. Illinois48. New Jersey49. Massachusetts50. Connecticut51. Puerto Rico
MASSACHUSETTS
SUMMARY
On the basis of its fiscal solvency in five separate categories, Massachusetts ranks 49th among the US states and Puerto Rico for its fiscal health. On a cash basis, Massachusetts has between 0.39 and 1.12 times the cash needed to cover short-term liabilities. Revenues cover 96 percent of expenses, pro-ducing a deficit of $342 per capita. The state is reliant on debt financing, with a negative net asset ratio of −0.94 and long-term liability per capita of $6,237. Total liabilities exceed assets by 53 percent. Total debt is $26.73 bil-lion. Unfunded pension liabilities are $94.45 billion on a guaranteed-to-be-paid basis, and other postemployment benefits (OPEB) add $15.38 billion.
2014 TOTAL LONG-TERM OBLIGATIONSSTATE DEBT
General obligation
bonds
Total primary government
debtState personal
income
Ratio of debt to state personal
incomeTotal primary
debt per capita
Massachusetts $19.60 billion $26.73 billion $396.21 billion 6.7% $3,963
National average $6.60 billion $13.76 billion $288.25 billion 6.0% $2,144
PENSION LIABILITY
Unfunded pension liability Funded ratio
Market value of unfunded liability
Market value of funded liability ratio
Massachusetts $26.90 billion 62% $94.45 billion 32%
National average $20.46 billion 74% $86.85 billion 40%
OTHER POSTEMPLOYMENT BENEFITS (OPEB)
Total unfunded OPEB Funded ratio
Massachusetts $15.38 billion 3%
National average $10.21 billion 13%

2
For a complete explanation of the methodology used to calculate Massachusetts’s fiscal health rank-ings, see Eileen Norcross and Olivia Gonzalez, “Ranking the States by Fiscal Condition,” 2016 ed. (Mercatus Research, Mercatus Center at George Mason University, Arlington, VA, June 2016).
48thbudget
solvency
20thtrust fundsolvency
48thlong-runsolvency
31stservice-level
solvency
50thcash
solvency
–3.0
–2.0
–1.0
US average
1.0
2.0
3.0
2.0
–1.0
av
1.0
2.0
3
3
20th
distance fromUS average
(in standard deviations)
UNDERLYING RATIOS
Cash ratio
Quick ratio
Current ratio
Operating ratio
Surplus (or deficit) per
capitaNet asset
ratio
Long-term liability
ratio
Long-term liability
per capita
Massachusetts 0.39 1.08 1.12 0.96 −$342 −0.94 1.53 $6,237
National average 2.40 3.18 3.54 1.06 $448 −0.03 0.47 $3,069
Tax-to-income ratio
Revenue-to-income ratio
Expenses-to-income ratio
Pension-to-income ratio
OPEB-to-income ratio
Primary debt-to-income
ratio
Massachusetts 0.06 0.13 0.14 0.24 0.04 0.07
National average 0.06 0.14 0.13 0.31 0.03 0.06
KEY TERMS
• Cash solvency measures whether a state has enough cash to cover its short-term bills, which include accounts payable, vouchers, warrants, and short-term debt. (Massachusetts ranks 50th.)
• Budget solvency measures whether a state can cover its fiscal year spend-ing using current revenues. Did it run a shortfall during the year? (Mas-sachusetts ranks 48th.)
• Long-run solvency measures whether a state has a hedge against large long-term liabilities. Are enough assets available to cushion the state from potential shocks or long-term fiscal risks? (Massachusetts ranks 48th.)
• Service-level solvency measures how high taxes, revenues, and spending are when compared to state personal income. Do states have enough “fis-cal slack”? If spending commitments demand more revenues, are states in a good position to increase taxes without harming the economy? Is spend-ing high or low relative to the tax base? (Massachusetts ranks 31st.)
• Trust fund solvency measures how much debt a state has. How large are unfunded pension liabilities, OPEB liabilities, and state debt compared to the state personal income? (Massachusetts ranks 20th.)

rank 1. Alaska2. Nebraska3. Wyoming4. North Dakota5. South Dakota6. Florida 7. Utah8. Oklahoma9. Tennessee10. Montana11. Ohio12. Idaho13. Nevada14. Missouri15. Alabama16. Texas17. Indiana18. South Carolina19. Virginia20. New Hampshire21. North Carolina22. Colorado23. Georgia24. Washington25. Iowa26. Minnesota27. Kansas28. Arkansas29. Wisconsin30. Oregon31. Arizona32. Mississippi33. Louisiana34. New Mexico35. Michigan36. Vermont37. Rhode Island38. Delaware39. Pennsylvania40. West Virginia41. Maryland42. New York43. Maine44. California45. Hawaii46. Kentucky47. Illinois48. New Jersey49. Massachusetts50. Connecticut51. Puerto Rico
MICHIGAN
SUMMARY
On the basis of its fiscal solvency in five separate categories, Michigan ranks 35th among the US states and Puerto Rico for its fiscal health. On a cash basis, Michigan has between 1.04 and 2.26 times the cash needed to cover short-term bills. Revenues exceed expenses by 1 percent, producing a surplus of $64 per capita. On a long-run basis, net assets are 1 percent of total assets, and total liabilities are 33 percent of total assets. Total debt is $7.41 billion. Unfunded pension liabilities are $123.31 billion, and other postemployment benefits (OPEB) add $20.60 billion in unfunded liabili-ties. These three liabilities are equal to 38 percent of total state personal income.
2014 TOTAL LONG-TERM OBLIGATIONSSTATE DEBT
General obligation
bonds
Total primary government
debtState personal
income
Ratio of debt to state personal
incomeTotal primary
debt per capita
Michigan $4.31 billion $7.41 billion $403.73 billion 1.8% $748
National average $6.60 billion $13.76 billion $288.25 billion 6.0% $2,144
PENSION LIABILITY
Unfunded pension liability Funded ratio
Market value of unfunded liability
Market value of funded liability ratio
Michigan $34.23 billion 63% $123.31 billion 32%
National average $20.46 billion 74% $86.85 billion 40%
OTHER POSTEMPLOYMENT BENEFITS (OPEB)
Total unfunded OPEB Funded ratio
Michigan $20.60 billion 12%
National average $10.21 billion 13%

2
For a complete explanation of the methodology used to calculate Michigan’s fiscal health rankings, see Eileen Norcross and Olivia Gonzalez, “Ranking the States by Fiscal Condition,” 2016 ed. (Mercatus Research, Mercatus Center at George Mason University, Arlington, VA, June 2016).
37thbudget
solvency
32ndtrust fundsolvency
24thlong-runsolvency
30thservice-level
solvency
34thcash
solvency
–3.0
–2.0
–1.0
US average
1.0
2.0
3.0
2.0
–1.0
av
1.0
2.0
3
3
ong-run
distance fromUS average
(in standard deviations)
UNDERLYING RATIOS
Cash ratio Quick ratioCurrent
ratioOperating
ratio
Surplus (or deficit) per
capitaNet asset
ratio
Long-term liability
ratio
Long-term liability
per capita
Michigan 1.04 1.77 2.26 1.01 $64 0.01 0.33 $1,313
National average
2.40 3.18 3.54 1.06 $448 −0.03 0.47 $3,069
Tax-to-income ratio
Revenue-to-income ratio
Expenses-to-income ratio
Pension-to-income ratio
OPEB-to-income ratio
Primary debt-to-income ratio
Michigan 0.06 0.13 0.13 0.31 0.05 0.02
National average
0.06 0.14 0.13 0.31 0.03 0.06
KEY TERMS
• Cash solvency measures whether a state has enough cash to cover its short-term bills, which include accounts payable, vouchers, warrants, and short-term debt. (Michigan ranks 34th.)
• Budget solvency measures whether a state can cover its fiscal year spend-ing using current revenues. Did it run a shortfall during the year? (Michi-gan ranks 37th.)
• Long-run solvency measures whether a state has a hedge against large long-term liabilities. Are enough assets available to cushion the state from potential shocks or long-term fiscal risks? (Michigan ranks 24th.)
• Service-level solvency measures how high taxes, revenues, and spending are when compared to state personal income. Do states have enough “fis-cal slack”? If spending commitments demand more revenues, are states in a good position to increase taxes without harming the economy? Is spend-ing high or low relative to the tax base? (Michigan ranks 30th.)
• Trust fund solvency measures how much debt a state has. How large are unfunded pension liabilities, OPEB liabilities, and state debt compared to the state personal income? (Michigan ranks 32nd.)

rank 1. Alaska2. Nebraska3. Wyoming4. North Dakota5. South Dakota6. Florida 7. Utah8. Oklahoma9. Tennessee10. Montana11. Ohio12. Idaho13. Nevada14. Missouri15. Alabama16. Texas17. Indiana18. South Carolina19. Virginia20. New Hampshire21. North Carolina22. Colorado23. Georgia24. Washington25. Iowa26. Minnesota27. Kansas28. Arkansas29. Wisconsin30. Oregon31. Arizona32. Mississippi33. Louisiana34. New Mexico35. Michigan36. Vermont37. Rhode Island38. Delaware39. Pennsylvania40. West Virginia41. Maryland42. New York43. Maine44. California45. Hawaii46. Kentucky47. Illinois48. New Jersey49. Massachusetts50. Connecticut51. Puerto Rico
MINNESOTA
SUMMARY
On the basis of its fiscal solvency in five separate categories, Minnesota ranks 26th among the US states and Puerto Rico for its fiscal health. On a cash basis, Minnesota has between 2.04 and 2.78 times the cash needed to cover short-term liabilities. Revenues exceed expenses by 6 percent, producing a surplus of $377 per capita. On a long-run basis, net assets are 16 percent of total assets, and total liabilities are 28 percent of total assets. Total debt is $8.84 billion. Unfunded pension liabilities are $87.45 billion on a guaranteed-to-be-paid basis, and other postemployment benefits (OPEB) are $651 million. These three liabilities are equal to 36 percent of total state personal income.
2014 TOTAL LONG-TERM OBLIGATIONSSTATE DEBT
General obligation
bonds
Total primary government
debtState personal
income
Ratio of debt to state personal
incomeTotal primary
debt per capita
Minnesota $6.91 billion $8.84 billion $267.39 billion 3.3% $1,620
National average $6.60 billion $13.76 billion $288.25 billion 6.0% $2,144
PENSION LIABILITY
Unfunded pension liability Funded ratio
Market value of unfunded liability
Market value of funded liability ratio
Minnesota $16.87 billion 76% $87.45 billion 38%
National average $20.46 billion 74% $86.85 billion 40%
OTHER POSTEMPLOYMENT BENEFITS (OPEB)
Total unfunded OPEB Funded ratio
Minnesota $0.65 billion 0%
National average $10.21 billion 13%

2
For a complete explanation of the methodology used to calculate Minnesota’s fiscal health rankings, see Eileen Norcross and Olivia Gonzalez, “Ranking the States by Fiscal Condition,” 2016 ed. (Mercatus Research, Mercatus Center at George Mason University, Arlington, VA, June 2016).
15thbudget
solvency
34thtrust fundsolvency
23rdlong-runsolvency
38thservice-level
solvency
22ndcash
solvency
–3.0
–2.0
–1.0
US average
1.0
2.0
3.0
2.0
–1.0
a
1.0
2.0
3
3
solvency
distance fromUS average
(in standard deviations)
UNDERLYING RATIOSCash ratio Quick ratio Current
ratioOperating
ratioSurplus (or deficit) per
capita
Net asset ratio
Long-term liability
ratio
Long-term liability
per capita
Minnesota 2.04 2.53 2.78 1.06 $377 0.16 0.28 $1,756
National average
2.40 3.18 3.54 1.06 $448 −0.03 0.47 $3,069
Tax-to-income ratio
Revenue-to-income ratio
Expenses-to-income ratio
Pension-to- income ratio
OPEB-to-income ratio
Primary debt-to-income ratio
Minnesota 0.08 0.14 0.13 0.33 0.00 0.03
National average
0.06 0.14 0.13 0.31 0.03 0.06
KEY TERMS
• Cash solvency measures whether a state has enough cash to cover its short-term bills, which include accounts payable, vouchers, warrants, and short-term debt. (Minnesota ranks 22nd.)
• Budget solvency measures whether a state can cover its fiscal year spend-ing using current revenues. Did it run a shortfall during the year? (Min-nesota ranks 15th.)
• Long-run solvency measures whether a state has a hedge against large long-term liabilities. Are enough assets available to cushion the state from potential shocks or long-term fiscal risks? (Minnesota ranks 23rd.)
• Service-level solvency measures how high taxes, revenues, and spending are when compared to state personal income. Do states have enough “fis-cal slack”? If spending commitments demand more revenues, are states in a good position to increase taxes without harming the economy? Is spend-ing high or low relative to the tax base? (Minnesota ranks 38th.)
• Trust fund solvency measures how much debt a state has. How large are unfunded pension liabilities, OPEB liabilities, and state debt compared to the state personal income? (Minnesota ranks 34th.)

rank 1. Alaska2. Nebraska3. Wyoming4. North Dakota5. South Dakota6. Florida 7. Utah8. Oklahoma9. Tennessee10. Montana11. Ohio12. Idaho13. Nevada14. Missouri15. Alabama16. Texas17. Indiana18. South Carolina19. Virginia20. New Hampshire21. North Carolina22. Colorado23. Georgia24. Washington25. Iowa26. Minnesota27. Kansas28. Arkansas29. Wisconsin30. Oregon31. Arizona32. Mississippi33. Louisiana34. New Mexico35. Michigan36. Vermont37. Rhode Island38. Delaware39. Pennsylvania40. West Virginia41. Maryland42. New York43. Maine44. California45. Hawaii46. Kentucky47. Illinois48. New Jersey49. Massachusetts50. Connecticut51. Puerto Rico
MISSISSIPPI
SUMMARY
On the basis of its fiscal solvency in five separate categories, Mississippi ranks 32nd among the US states and Puerto Rico for its fiscal health. On a cash basis, Mississippi has between 2.37 and 3.04 times the cash needed to cover short-term liabilities. Revenues exceed expenses by 3 percent, producing a surplus of $174 per capita. On a long-run basis, net assets are 6 percent of total assets, and total liabilities account for 26 percent of total assets. Total debt is $5.42 billion. Unfunded pension liabilities are $51.65 billion on a guaranteed-to-be-paid basis. Other postemployment benefits (OPEB) add $762 million in unfunded liabilities. These three liabilities are equal to 56 percent of total state personal income.
2014 TOTAL LONG-TERM OBLIGATIONSSTATE DEBT
General obligation
bonds
Total primary government
debtState personal
income
Ratio of debt to state personal
incomeTotal primary
debt per capita
Mississippi $4.31 billion $5.42 billion $103.09 billion 5.3% $1,809
National average $6.60 billion $13.76 billion $288.25 billion 6.0% $2,144
PENSION LIABILITY
Unfunded pension liability Funded ratio
Market value of unfunded liability
Market value of funded liability ratio
Mississippi $14.78 billion 61% $51.65 billion 31%
National average $20.46 billion 74% $86.85 billion 40%
OTHER POSTEMPLOYMENT BENEFITS (OPEB)
Total unfunded OPEB Funded ratio
Mississippi $0.76 billion 0%
National average $10.21 billion 13%

2
For a complete explanation of the methodology used to calculate Mississippi’s fiscal health rankings, see Eileen Norcross and Olivia Gonzalez, “Ranking the States by Fiscal Condition,” 2016 ed. (Mercatus Research, Mercatus Center at George Mason University, Arlington, VA, June 2016).
29thbudget
solvency
47thtrust fundsolvency
29thlong-runsolvency
41stservice-level
solvency
19thcash
solvency
–3.0
–2.0
–1.0
US average
1.0
2.0
3.0
2.0
–1.0
S a
1.0
2.0
3
3distance fromUS average
(in standard deviations)
UNDERLYING RATIOS
Cash ratio Quick ratioCurrent
ratioOperating
ratio
Surplus (or deficit) per
capitaNet asset
ratio
Long-term liability
ratio
Long-term liability
per capita
Mississippi 2.37 2.72 3.04 1.03 $174 0.06 0.26 $1,974
National average
2.40 3.18 3.54 1.06 $448 −0.03 0.47 $3,069
Tax-to-income ratio
Revenue-to-income ratio
Expenses-to-income ratio
Pension-to-income ratio
OPEB-to-income ratio
Primary debt-to-income ratio
Mississippi 0.07 0.16 0.16 0.50 0.01 0.05
National average
0.06 0.14 0.13 0.31 0.03 0.06
KEY TERMS
• Cash solvency measures whether a state has enough cash to cover its short-term bills, which include accounts payable, vouchers, warrants, and short-term debt. (Mississippi ranks 19th.)
• Budget solvency measures whether a state can cover its fiscal year spend-ing using current revenues. Did it run a shortfall during the year? (Missis-sippi ranks 29th.)
• Long-run solvency measures whether a state has a hedge against large long-term liabilities. Are enough assets available to cushion the state from potential shocks or long-term fiscal risks? (Mississippi ranks 29th.)
• Service-level solvency measures how high taxes, revenues, and spending are when compared to state personal income. Do states have enough “fis-cal slack”? If spending commitments demand more revenues, are states in a good position to increase taxes without harming the economy? Is spend-ing high or low relative to the tax base? (Mississippi ranks 41st.)
• Trust fund solvency measures how much debt a state has. How large are unfunded pension liabilities, OPEB liabilities, and state debt compared to the state personal income? (Mississippi ranks 47th.)

rank 1. Alaska2. Nebraska3. Wyoming4. North Dakota5. South Dakota6. Florida 7. Utah8. Oklahoma9. Tennessee10. Montana11. Ohio12. Idaho13. Nevada14. Missouri15. Alabama16. Texas17. Indiana18. South Carolina19. Virginia20. New Hampshire21. North Carolina22. Colorado23. Georgia24. Washington25. Iowa26. Minnesota27. Kansas28. Arkansas29. Wisconsin30. Oregon31. Arizona32. Mississippi33. Louisiana34. New Mexico35. Michigan36. Vermont37. Rhode Island38. Delaware39. Pennsylvania40. West Virginia41. Maryland42. New York43. Maine44. California45. Hawaii46. Kentucky47. Illinois48. New Jersey49. Massachusetts50. Connecticut51. Puerto Rico
MISSOURI
SUMMARY
On the basis of its fiscal solvency in five separate categories, Missouri ranks 14th among the US states and Puerto Rico for its fiscal health. On a cash basis, Missouri has between 2.26 and 4.49 times the cash needed to cover short-term liabilities. Revenues exceed expenses by 2 percent, producing a surplus of $98 per capita. On a long-run basis, net assets are 7 percent of total assets, and total liabilities are 18 percent of total assets. Total debt is $3.79 billion. Unfunded pension liabilities are $78.11 billion, and other postemployment benefits (OPEB) are $2.47 billion. These three liabilities are equal to 34 percent of total state personal income.
2014 TOTAL LONG-TERM OBLIGATIONSSTATE DEBT
General obligation
bonds
Total primary government
debtState personal
income
Ratio of debt to state personal
incomeTotal primary
debt per capita
Missouri $0.32 billion $3.79 billion $252.48 billion 1.5% $625
National average $6.60 billion $13.76 billion $288.25 billion 6.0% $2,144
PENSION LIABILITY
Unfunded pension liability Funded ratio
Market value of unfunded liability
Market value of funded liability ratio
Missouri $13.28 billion 79% $78.11 billion 41%
National average $20.46 billion 74% $86.85 billion 40%
OTHER POSTEMPLOYMENT BENEFITS (OPEB)
Total unfunded OPEB Funded ratio
Missouri $2.47 billion 4%
National average $10.21 billion 13%

2
For a complete explanation of the methodology used to calculate Missouri’s fiscal health rankings, see Eileen Norcross and Olivia Gonzalez, “Ranking the States by Fiscal Condition,” 2016 ed. (Mercatus Research, Mercatus Center at George Mason University, Arlington, VA, June 2016).
31stbudget
solvency
31sttrust fundsolvency
15thlong-runsolvency
6thservice-level
solvency
12thcash
solvency
–3.0
–2.0
–1.0
US average
1.0
2.0
3.0
2.0
–1.0
era
1.0
2.0
3
3
distance fromUS average
(in standard deviations)
UNDERLYING RATIOS
Cash ratio Quick ratioCurrent
ratioOperating
ratio
Surplus (or deficit) per
capitaNet asset
ratio
Long-term liability
ratio
Long-term liability
per capita
Missouri 2.26 4.36 4.49 1.02 $98 0.07 0.18 $1,194
National average
2.40 3.18 3.54 1.06 $448 −0.03 0.47 $3,069
Tax-to-income ratio
Revenue-to-income ratio
Expenses-to-income ratio
Pension-to-income ratio
OPEB-to-income ratio
Primary debt-to-income ratio
Missouri 0.04 0.10 0.10 0.31 0.01 0.02
National average
0.06 0.14 0.13 0.31 0.03 0.06
KEY TERMS
• Cash solvency measures whether a state has enough cash to cover its short-term bills, which include accounts payable, vouchers, warrants, and short-term debt. (Missouri ranks 12th.)
• Budget solvency measures whether a state can cover its fiscal year spend-ing using current revenues. Did it run a shortfall during the year? (Mis-souri ranks 31st.)
• Long-run solvency measures whether a state has a hedge against large long-term liabilities. Are enough assets available to cushion the state from potential shocks or long-term fiscal risks? (Missouri ranks 15th.)
• Service-level solvency measures how high taxes, revenues, and spending are when compared to state personal income. Do states have enough “fis-cal slack”? If spending commitments demand more revenues, are states in a good position to increase taxes without harming the economy? Is spend-ing high or low relative to the tax base? (Missouri ranks 6th.)
• Trust fund solvency measures how much debt a state has. How large are unfunded pension liabilities, OPEB liabilities, and state debt compared to the state personal income? (Missouri ranks 31st.)

rank 1. Alaska2. Nebraska3. Wyoming4. North Dakota5. South Dakota6. Florida 7. Utah8. Oklahoma9. Tennessee10. Montana11. Ohio12. Idaho13. Nevada14. Missouri15. Alabama16. Texas17. Indiana18. South Carolina19. Virginia20. New Hampshire21. North Carolina22. Colorado23. Georgia24. Washington25. Iowa26. Minnesota27. Kansas28. Arkansas29. Wisconsin30. Oregon31. Arizona32. Mississippi33. Louisiana34. New Mexico35. Michigan36. Vermont37. Rhode Island38. Delaware39. Pennsylvania40. West Virginia41. Maryland42. New York43. Maine44. California45. Hawaii46. Kentucky47. Illinois48. New Jersey49. Massachusetts50. Connecticut51. Puerto Rico
MONTANA
SUMMARY
On the basis of its fiscal solvency in five separate categories, Montana ranks 10th among the US states and Puerto Rico for its fiscal health. On a cash basis, Montana has between 4.31 and 5.67 times the cash needed to cover short-term liabilities. Revenues exceed expenses by 8 percent, producing a surplus of $409 per capita. On a long-run basis, net assets are 36 percent of total assets, and total liabilities are 9 percent of total assets. Total debt is $266 million. Unfunded pension liabilities are $15.61 billion on a guaranteed-to-be-paid basis, and other postemployment benefits (OPEB) add $466 million. These three liabilities are equal to 40 percent of total state personal income.
2014 TOTAL LONG-TERM OBLIGATIONSSTATE DEBT
General obligation
bonds
Total primary government
debtState personal
income
Ratio of debt to state personal
incomeTotal primary
debt per capita
Montana $0.13 billion $0.27 billion $40.84 billion 0.7% $260
National average $6.60 billion $13.76 billion $288.25 billion 6.0% $2,144
PENSION LIABILITY
Unfunded pension liability Funded ratio
Market value of unfunded liability
Market value of funded liability ratio
Montana $3.80 billion 71% $15.61 billion 37%
National average $20.46 billion 74% $86.85 billion 40%
OTHER POSTEMPLOYMENT BENEFITS (OPEB)
Total unfunded OPEB Funded ratio
Montana $0.47 billion 0%
National average $10.21 billion 13%

2
For a complete explanation of the methodology used to calculate Montana’s fiscal health rankings, see Eileen Norcross and Olivia Gonzalez, “Ranking the States by Fiscal Condition,” 2016 ed. (Mercatus Research, Mercatus Center at George Mason University, Arlington, VA, June 2016).
10thbudget
solvency
38thtrust fundsolvency
8thlong-runsolvency
32ndservice-level
solvency
7thcash
solvency
–3.0
–2.0
–1.0
US average
1.0
2.0
3.0
2.0
–1.0
er
1.0
2.0
3
3distance fromUS average
(in standard deviations)
UNDERLYING RATIOS
Cash ratio Quick ratioCurrent
ratioOperating
ratio
Surplus (or deficit) per
capitaNet asset
ratio
Long-term liability
ratio
Long-term liability
per capita
Montana 4.31 4.76 5.67 1.08 $409 0.36 0.09 $927
National average
2.40 3.18 3.54 1.06 $448 −0.03 0.47 $3,069
Tax-to-income ratio
Revenue-to-income ratio
Expenses-to-income ratio
Pension-to-income ratio
OPEB-to-income ratio
Primary debt-to-income ratio
Montana 0.06 0.14 0.13 0.38 0.01 0.01
National average
0.06 0.14 0.13 0.31 0.03 0.06
KEY TERMS
• Cash solvency measures whether a state has enough cash to cover its short-term bills, which include accounts payable, vouchers, warrants, and short-term debt. (Montana ranks 7th.)
• Budget solvency measures whether a state can cover its fiscal year spend-ing using current revenues. Did it run a shortfall during the year? (Mon-tana ranks 10th.)
• Long-run solvency measures whether a state has a hedge against large long-term liabilities. Are enough assets available to cushion the state from potential shocks or long-term fiscal risks? (Montana ranks 8th.)
• Service-level solvency measures how high taxes, revenues, and spending are when compared to state personal income. Do states have enough “fis-cal slack”? If spending commitments demand more revenues, are states in a good position to increase taxes without harming the economy? Is spend-ing high or low relative to the tax base? (Montana ranks 32nd.)
• Trust fund solvency measures how much debt a state has. How large are unfunded pension liabilities, OPEB liabilities, and state debt compared to the state personal income? (Montana ranks 38th.)

rank 1. Alaska2. Nebraska3. Wyoming4. North Dakota5. South Dakota6. Florida 7. Utah8. Oklahoma9. Tennessee10. Montana11. Ohio12. Idaho13. Nevada14. Missouri15. Alabama16. Texas17. Indiana18. South Carolina19. Virginia20. New Hampshire21. North Carolina22. Colorado23. Georgia24. Washington25. Iowa26. Minnesota27. Kansas28. Arkansas29. Wisconsin30. Oregon31. Arizona32. Mississippi33. Louisiana34. New Mexico35. Michigan36. Vermont37. Rhode Island38. Delaware39. Pennsylvania40. West Virginia41. Maryland42. New York43. Maine44. California45. Hawaii46. Kentucky47. Illinois48. New Jersey49. Massachusetts50. Connecticut51. Puerto Rico
NEBRASKA
SUMMARY
On the basis of its fiscal solvency in five separate categories, Nebraska ranks second among the US states and Puerto Rico for its fiscal health. Nebraska exhibits strong fiscal health across all categories. On a cash basis, Nebraska has between 3.81 and 5.02 times the cash needed to cover short-term liabilities. Revenues exceed expenses by 7 percent, producing a sur-plus of $294 per capita. On a long-run basis, net assets are 30 percent of total assets, and total liabilities are 3 percent of total assets. Total debt is $23 million. Unfunded pension liabilities are $13.94 billion on a guaran-teed-to-be paid basis. Total debt and unfunded liabilities are equal to 16 percent of state personal income.
2014 TOTAL LONG-TERM OBLIGATIONSSTATE DEBT
General obligation
bonds
Total primary government
debtState personal
income
Ratio of debt to state personal
incomeTotal primary
debt per capita
Nebraska $0.00 billion $0.02 billion $89.48 billion 0.0% $13
National average $6.60 billion $13.76 billion $288.25 billion 6.0% $2,144
PENSION LIABILITY
Unfunded pension liability Funded ratio
Market value of unfunded liability
Market value of funded liability ratio
Nebraska $1.83 billion 85% $13.94 billion 43%
National average $20.46 billion 74% $86.85 billion 40%
OTHER POSTEMPLOYMENT BENEFITS (OPEB)
Total unfunded OPEB Funded ratio
Nebraska n/a n/a
National average $10.21 billion 13%
Note: n/a = not applicable.

2
For a complete explanation of the methodology used to calculate Nebraska’s fiscal health rankings, see Eileen Norcross and Olivia Gonzalez, “Ranking the States by Fiscal Condition,” 2016 ed. (Mercatus Research, Mercatus Center at George Mason University, Arlington, VA, June 2016).
14thbudget
solvency
1sttrust fundsolvency
1stlong-runsolvency
7thservice-level
solvency
9thcash
solvency
–3.0
–2.0
–1.0
US average
1.0
2.0
3.0
2.0
–1.0
a
1.0
2.0
3
3
14th
distance fromUS average
(in standard deviations)
UNDERLYING RATIOS
Cash ratio Quick ratioCurrent
ratioOperating
ratio
Surplus (or deficit) per
capitaNet asset
ratio
Long-term liability
ratio
Long-term liability
per capita
Nebraska 3.81 4.82 5.02 1.07 $294 0.30 0.03 $229
National average
2.40 3.18 3.54 1.06 $448 −0.03 0.47 $3,069
Tax-to-income ratio
Revenue-to-income ratio
Expenses-to-income ratio
Pension-to-income ratio
OPEB-to-income ratio
Primary debt-to-income ratio
Nebraska 0.05 0.10 0.09 0.16 n/a 0.00
National average
0.06 0.14 0.13 0.31 0.03 0.06
Note: n/a = not applicable.
KEY TERMS
• Cash solvency measures whether a state has enough cash to cover its short-term bills, which include accounts payable, vouchers, warrants, and short-term debt. (Nebraska ranks 9th.)
• Budget solvency measures whether a state can cover its fiscal year spending using current revenues. Did it run a shortfall during the year? (Nebraska ranks 14th.)
• Long-run solvency measures whether a state has a hedge against large long-term liabilities. Are enough assets available to cushion the state from potential shocks or long-term fiscal risks? (Nebraska ranks 1st.)
• Service-level solvency measures how high taxes, revenues, and spending are when compared to state personal income. Do states have enough “fis-cal slack”? If spending commitments demand more revenues, are states in a good position to increase taxes without harming the economy? Is spend-ing high or low relative to the tax base? (Nebraska ranks 7th.)
• Trust fund solvency measures how much debt a state has. How large are unfunded pension liabilities, OPEB liabilities, and state debt compared to the state personal income? (Nebraska ranks 1st.)

rank 1. Alaska2. Nebraska3. Wyoming4. North Dakota5. South Dakota6. Florida 7. Utah8. Oklahoma9. Tennessee10. Montana11. Ohio12. Idaho13. Nevada14. Missouri15. Alabama16. Texas17. Indiana18. South Carolina19. Virginia20. New Hampshire21. North Carolina22. Colorado23. Georgia24. Washington25. Iowa26. Minnesota27. Kansas28. Arkansas29. Wisconsin30. Oregon31. Arizona32. Mississippi33. Louisiana34. New Mexico35. Michigan36. Vermont37. Rhode Island38. Delaware39. Pennsylvania40. West Virginia41. Maryland42. New York43. Maine44. California45. Hawaii46. Kentucky47. Illinois48. New Jersey49. Massachusetts50. Connecticut51. Puerto Rico
NEVADA
SUMMARY
On the basis of its fiscal solvency in five separate categories, Nevada ranks 13th among the US states and Puerto Rico for its fiscal health. On a cash basis, Nebraska has between 2.07 and 3.43 times the cash needed to cover short-term liabilities. Revenues exceed expenses by 6 percent, producing a surplus of $174 per capita. On a long-run basis, net assets are 10 percent of total assets, and total liabilities are 36 percent of total assets. Total debt is $3.59 billion. Unfunded pension liabilities are $55.42 billion on a guar-anteed-to-be-paid basis, and other postemployment benefits (OPEB) are $1.27 billion. These three liabilities are equal to 52 percent of state personal income.
2014 TOTAL LONG-TERM OBLIGATIONSSTATE DEBT
General obligation
bonds
Total primary government
debtState personal
income
Ratio of debt to state personal
incomeTotal primary
debt per capita
Nevada $1.79 billion $3.59 billion $115.67 billion 3.1% $1,266
National average $6.60 billion $13.76 billion $288.25 billion 6.0% $2,144
PENSION LIABILITY
Unfunded pension liability Funded ratio
Market value of unfunded liability
Market value of funded liability ratio
Nevada $12.53 billion 72% $55.42 billion 36%
National average $20.46 billion 74% $86.85 billion 40%
OTHER POSTEMPLOYMENT BENEFITS (OPEB)
Total unfunded OPEB Funded ratio
Nevada $1.27 billion 0%
National average $10.21 billion 13%

2
For a complete explanation of the methodology used to calculate Nevada’s fiscal health rankings, see Eileen Norcross and Olivia Gonzalez, “Ranking the States by Fiscal Condition,” 2016 ed. (Mercatus Research, Mercatus Center at George Mason University, Arlington, VA, June 2016).
20thbudget
solvency
44thtrust fundsolvency
25thlong-runsolvency
2ndservice-level
solvency
16thcash
solvency
–3.0
–2.0
–1.0
US average
1.0
2.0
3.0
2.0
–1.0
a
1.0
2.0
3
3
distance fromUS average
(in standard deviations)
UNDERLYING RATIOS
Cash ratio Quick ratioCurrent
ratioOperating
ratio
Surplus (or deficit) per
capitaNet asset
ratio
Long-term liability
ratio
Long-term liability
per capita
Nevada 2.07 3.39 3.43 1.06 $174 0.10 0.36 $1,477
National average
2.40 3.18 3.54 1.06 $448 −0.03 0.47 $3,069
Tax-to-income ratio
Revenue-to-income ratio
Expenses-to-income ratio
Pension-to-income ratio
OPEB-to-income ratio
Primary debt-to-income ratio
Nevada 0.04 0.08 0.07 0.48 0.01 0.03
National average
0.06 0.14 0.13 0.31 0.03 0.06
KEY TERMS
• Cash solvency measures whether a state has enough cash to cover its short-term bills, which include accounts payable, vouchers, warrants, and short-term debt. (Nevada ranks 16th.)
• Budget solvency measures whether a state can cover its fiscal year spend-ing using current revenues. Did it run a shortfall during the year? (Nevada ranks 20th.)
• Long-run solvency measures whether a state has a hedge against large long-term liabilities. Are enough assets available to cushion the state from potential shocks or long-term fiscal risks? (Nevada ranks 25th.)
• Service-level solvency measures how high taxes, revenues, and spending are when compared to state personal income. Do states have enough “fis-cal slack”? If spending commitments demand more revenues, are states in a good position to increase taxes without harming the economy? Is spend-ing high or low relative to the tax base? (Nevada ranks 2nd.)
• Trust fund solvency measures how much debt a state has. How large are unfunded pension liabilities, OPEB liabilities, and state debt compared to the state personal income? (Nevada ranks 44th.)

rank 1. Alaska2. Nebraska3. Wyoming4. North Dakota5. South Dakota6. Florida 7. Utah8. Oklahoma9. Tennessee10. Montana11. Ohio12. Idaho13. Nevada14. Missouri15. Alabama16. Texas17. Indiana18. South Carolina19. Virginia20. New Hampshire21. North Carolina22. Colorado23. Georgia24. Washington25. Iowa26. Minnesota27. Kansas28. Arkansas29. Wisconsin30. Oregon31. Arizona32. Mississippi33. Louisiana34. New Mexico35. Michigan36. Vermont37. Rhode Island38. Delaware39. Pennsylvania40. West Virginia41. Maryland42. New York43. Maine44. California45. Hawaii46. Kentucky47. Illinois48. New Jersey49. Massachusetts50. Connecticut51. Puerto Rico
NEW HAMPSHIRE
SUMMARY
On the basis of its fiscal solvency in five separate categories, New Hamp-shire ranks 20th among the US states and Puerto Rico for its fiscal health. On cash basis, New Hampshire has between 0.64 and 2.47 times the cash needed to cover short-term liabilities. Revenues match expenses, produc-ing a surplus of $18 per capita. On a long-run basis, net assets are 5 percent of total assets, and total liabilities are 41 percent of total assets. Total debt is $1.62 billion. Unfunded pension liabilities are $14.48 billion on a guaran-teed-to-be-paid basis, with other postemployment benefits (OPEB) adding $1.87 billion to the total. These three liabilities are equal to 26 percent of state personal income.
2014 TOTAL LONG-TERM OBLIGATIONSSTATE DEBT
General obligation
bonds
Total primary government
debtState personal
income
Ratio of debt to state personal
incomeTotal primary
debt per capita
New Hampshire $1.62 billion $1.62 billion $70.02 billion 2.3% $1,224
National average $6.60 billion $13.76 billion $288.25 billion 6.0% $2,144
PENSION LIABILITY
Unfunded pension liability Funded ratio
Market value of unfunded liability
Market value of funded liability ratio
New Hampshire $4.38 billion 61% $14.48 billion 32%
National average $20.46 billion 74% $86.85 billion 40%
OTHER POSTEMPLOYMENT BENEFITS (OPEB)
Total unfunded OPEB Funded ratio
New Hampshire $1.87 billion 0%
National average $10.21 billion 13%

2
For a complete explanation of the methodology used to calculate New Hampshire’s fiscal health rankings, see Eileen Norcross and Olivia Gonzalez, “Ranking the States by Fiscal Condition,” 2016 ed. (Mercatus Research, Mercatus Center at George Mason University, Arlington, VA, June 2016).
39thbudget
solvency
15thtrust fundsolvency
32ndlong-runsolvency
1stservice-level
solvency
39thcash
solvency
–3.0
–2.0
–1.0
US average
1.0
2.0
3.0
2.0
–1.0
rag
1.0
2.0
3
3
distance fromUS average
(in standard deviations)
UNDERLYING RATIOS
Cash ratio Quick ratioCurrent
ratioOperating
ratio
Surplus (or deficit) per
capitaNet asset
ratio
Long-term liability
ratio
Long-term liability
per capita
New Hampshire
0.64 1.38 2.47 1.00 $18 0.05 0.41 $1,866
National average
2.40 3.18 3.54 1.06 $448 −0.03 0.47 $3,069
Tax-to-income ratio
Revenue-to-income ratio
Expenses-to-income ratio
Pension-to-income ratio
OPEB-to-income ratio
Primary debt-to-income ratio
New Hampshire
0.03 0.09 0.09 0.21 0.03 0.02
National average
0.06 0.14 0.13 0.31 0.03 0.06
KEY TERMS
• Cash solvency measures whether a state has enough cash to cover its short-term bills, which include accounts payable, vouchers, warrants, and short-term debt. (New Hampshire ranks 39th.)
• Budget solvency measures whether a state can cover its fiscal year spend-ing using current revenues. Did it run a shortfall during the year? (New Hampshire ranks 39th.)
• Long-run solvency measures whether a state has a hedge against large long-term liabilities. Are enough assets available to cushion the state from potential shocks or long-term fiscal risks? (New Hampshire ranks 32nd.)
• Service-level solvency measures how high taxes, revenues, and spending are when compared to state personal income. Do states have enough “fis-cal slack”? If spending commitments demand more revenues, are states in a good position to increase taxes without harming the economy? Is spend-ing high or low relative to the tax base? (New Hampshire ranks 1st.)
• Trust fund solvency measures how much debt a state has. How large are unfunded pension liabilities, OPEB liabilities, and state debt compared to the state personal income? (New Hampshire ranks 15th.)

rank 1. Alaska2. Nebraska3. Wyoming4. North Dakota5. South Dakota6. Florida 7. Utah8. Oklahoma9. Tennessee10. Montana11. Ohio12. Idaho13. Nevada14. Missouri15. Alabama16. Texas17. Indiana18. South Carolina19. Virginia20. New Hampshire21. North Carolina22. Colorado23. Georgia24. Washington25. Iowa26. Minnesota27. Kansas28. Arkansas29. Wisconsin30. Oregon31. Arizona32. Mississippi33. Louisiana34. New Mexico35. Michigan36. Vermont37. Rhode Island38. Delaware39. Pennsylvania40. West Virginia41. Maryland42. New York43. Maine44. California45. Hawaii46. Kentucky47. Illinois48. New Jersey49. Massachusetts50. Connecticut51. Puerto Rico
NEW JERSEY
SUMMARY
On the basis of its fiscal solvency in five separate categories, New Jersey ranks 48th among the US states and Puerto Rico for its fiscal health. On a cash basis, New Jersey has between 0.63 and 2.00 times the cash needed to cover short-term liabilities. Revenues cover 94 percent of expenses, for a deficit of $396 per capita. New Jersey is reliant on debt financing, with a net asset ratio of −1.46. Liabilities are 2.1 times the size of total assets, result-ing in a long-term liability per capita of $9,285. Total debt is $41.84 billion. Unfunded pension liabilities are $188.40 billion on a guaranteed-to-be-paid basis, and other postemployment benefits (OPEB) are $66.80 billion. These three liabilities are equal to 58 percent of total state personal income.
2014 TOTAL LONG-TERM OBLIGATIONSSTATE DEBT
General obligation
bonds
Total primary government
debtState personal
income
Ratio of debt to state personal
incomeTotal primary
debt per capita
New Jersey $2.16 billion $41.84 billion $515.02 billion 8.1% $4,681
National average $6.60 billion $13.76 billion $288.25 billion 6.0% $2,144
PENSION LIABILITY
Unfunded pension liability Funded ratio
Market value of unfunded liability
Market value of funded liability ratio
New Jersey $54.74 billion 61% $188.40 billion 31%
National average $20.46 billion 74% $86.85 billion 40%
OTHER POSTEMPLOYMENT BENEFITS (OPEB)
Total unfunded OPEB Funded ratio
New Jersey $66.80 billion 0%
National average $10.21 billion 13%

2
For a complete explanation of the methodology used to calculate New Jersey’s fiscal health rankings, see Eileen Norcross and Olivia Gonzalez, “Ranking the States by Fiscal Condition,” 2016 ed. (Mercatus Research, Mercatus Center at George Mason University, Arlington, VA, June 2016).
49thbudget
solvency
40thtrust fundsolvency
50thlong-runsolvency
20thservice-level
solvency
38thcash
solvency
–3.0
–2.0
–1.0
US average
1.0
2.0
3.0
2.0
–1.0
era
1.0
2.0
3
3distance fromUS average
(in standard deviations)
UNDERLYING RATIOS
Cash ratio Quick ratioCurrent
ratioOperating
ratio
Surplus (or deficit) per
capitaNet asset
ratio
Long-term liability
ratio
Long-term liability
per capita
New Jersey
0.63 1.99 2.00 0.94 −$396 −1.46 2.10 $9,285
National average
2.40 3.18 3.54 1.06 $448 −0.03 0.47 $3,069
Tax-to-income ratio
Revenue-to-income ratio
Expenses-to-income ratio
Pension-to-income ratio
OPEB-to-income ratio
Primary debt-to-income ratio
New Jersey
0.06 0.11 0.12 0.37 0.13 0.08
National average
0.06 0.14 0.13 0.31 0.03 0.06
KEY TERMS
• Cash solvency measures whether a state has enough cash to cover its short-term bills, which include accounts payable, vouchers, warrants, and short-term debt. (New Jersey ranks 38th.)
• Budget solvency measures whether a state can cover its fiscal year spend-ing using current revenues. Did it run a shortfall during the year? (New Jersey ranks 49th.)
• Long-run solvency measures whether a state has a hedge against large long-term liabilities. Are enough assets available to cushion the state from potential shocks or long-term fiscal risks? (New Jersey ranks 50th.)
• Service-level solvency measures how high taxes, revenues, and spending are when compared to state personal income. Do states have enough “fis-cal slack”? If spending commitments demand more revenues, are states in a good position to increase taxes without harming the economy? Is spend-ing high or low relative to the tax base? (New Jersey ranks 20th.)
• Trust fund solvency measures how much debt a state has. How large are unfunded pension liabilities, OPEB liabilities, and state debt compared to the state personal income? (New Jersey ranks 40th.)

rank 1. Alaska2. Nebraska3. Wyoming4. North Dakota5. South Dakota6. Florida 7. Utah8. Oklahoma9. Tennessee10. Montana11. Ohio12. Idaho13. Nevada14. Missouri15. Alabama16. Texas17. Indiana18. South Carolina19. Virginia20. New Hampshire21. North Carolina22. Colorado23. Georgia24. Washington25. Iowa26. Minnesota27. Kansas28. Arkansas29. Wisconsin30. Oregon31. Arizona32. Mississippi33. Louisiana34. New Mexico35. Michigan36. Vermont37. Rhode Island38. Delaware39. Pennsylvania40. West Virginia41. Maryland42. New York43. Maine44. California45. Hawaii46. Kentucky47. Illinois48. New Jersey49. Massachusetts50. Connecticut51. Puerto Rico
NEW MEXICO
SUMMARY
On the basis of its fiscal solvency in five separate categories, New Mexico ranks 34th among the US states and Puerto Rico for its fiscal health. On a cash basis, New Mexico has between 1.57 and 3.01 times the cash needed to cover short-term liabilities. Revenues exceed expenses by 6 percent, produc-ing a surplus of $493 per capita. Net assets are 47 percent of total liabilities, and total liabilities are 18 percent of total assets. Total debt is $3.40 billion. Unfunded pension liabilities are $42.36 billion on a guaranteed-to-be-paid basis, and other postemployment benefits (OPEB) add another $3.36 billion to total unfunded liabilities. These three liabilities are equal to 63 percent of state personal income.
2014 TOTAL LONG-TERM OBLIGATIONSSTATE DEBT
General obligation
bonds
Total primary government
debtState personal
income
Ratio of debt to state personal
incomeTotal primary
debt per capita
New Mexico $0.31 billion $3.40 billion $77.36 billion 4.4% $1,631
National average $6.60 billion $13.76 billion $288.25 billion 6.0% $2,144
PENSION LIABILITY
Unfunded pension liability Funded ratio
Market value of unfunded liability
Market value of funded liability ratio
New Mexico $10.60 billion 70% $42.36 billion 37%
National average $20.46 billion 74% $86.85 billion 40%
OTHER POSTEMPLOYMENT BENEFITS (OPEB)
Total unfunded OPEB Funded ratio
New Mexico $3.36 billion 100%
National average $10.21 billion 13%

2
For a complete explanation of the methodology used to calculate New Mexico’s fiscal health rankings, see Eileen Norcross and Olivia Gonzalez, “Ranking the States by Fiscal Condition,” 2016 ed. (Mercatus Research, Mercatus Center at George Mason University, Arlington, VA, June 2016).
11thbudget
solvency
49thtrust fundsolvency
12thlong-runsolvency
48thservice-level
solvency
25thcash
solvency
–3.0
–2.0
–1.0
US average
1.0
2.0
3.0
2.0
–1.0
a
1.0
2.0
3
3
g
distance fromUS average
(in standard deviations)
UNDERLYING RATIOS
Cash ratio Quick ratioCurrent
ratioOperating
ratio
Surplus (or deficit) per
capitaNet asset
ratio
Long-term liability
ratio
Long-term liability
per capita
New Mexico
1.57 2.13 3.01 1.06 $493 0.47 0.18 $2,113
National average
2.40 3.18 3.54 1.06 $448 −0.03 0.47 $3,069
Tax-to-income ratio
Revenue-to-income ratio
Expenses-to-income ratio
Pension-to-income ratio
OPEB-to-income ratio
Primary debt-to-income ratio
New Mexico
0.07 0.23 0.21 0.55 0.04 0.04
National average
0.06 0.14 0.13 0.31 0.03 0.06
KEY TERMS
• Cash solvency measures whether a state has enough cash to cover its short-term bills, which include accounts payable, vouchers, warrants, and short-term debt. (New Mexico ranks 25th.)
• Budget solvency measures whether a state can cover its fiscal year spend-ing using current revenues. Did it run a shortfall during the year? (New Mexico ranks 11th.)
• Long-run solvency measures whether a state has a hedge against large long-term liabilities. Are enough assets available to cushion the state from potential shocks or long-term fiscal risks? (New Mexico ranks 12th.)
• Service-level solvency measures how high taxes, revenues, and spending are when compared to state personal income. Do states have enough “fis-cal slack”? If spending commitments demand more revenues, are states in a good position to increase taxes without harming the economy? Is spend-ing high or low relative to the tax base? (New Mexico ranks 48th.)
• Trust fund solvency measures how much debt a state has. How large are unfunded pension liabilities, OPEB liabilities, and state debt compared to the state personal income? (New Mexico ranks 49th.)

rank 1. Alaska2. Nebraska3. Wyoming4. North Dakota5. South Dakota6. Florida 7. Utah8. Oklahoma9. Tennessee10. Montana11. Ohio12. Idaho13. Nevada14. Missouri15. Alabama16. Texas17. Indiana18. South Carolina19. Virginia20. New Hampshire21. North Carolina22. Colorado23. Georgia24. Washington25. Iowa26. Minnesota27. Kansas28. Arkansas29. Wisconsin30. Oregon31. Arizona32. Mississippi33. Louisiana34. New Mexico35. Michigan36. Vermont37. Rhode Island38. Delaware39. Pennsylvania40. West Virginia41. Maryland42. New York43. Maine44. California45. Hawaii46. Kentucky47. Illinois48. New Jersey49. Massachusetts50. Connecticut51. Puerto Rico
NEW YORK
SUMMARY
On the basis of its fiscal solvency in five separate categories, New York ranks 42nd among the US states and Puerto Rico for its fiscal health. On a cash basis, New York has between 0.69 and 1.70 times the cash to cover short-term liabilities. Revenues exceed expenses by 2 percent, produc-ing a surplus of $125 per capita. On a long-run basis, a negative net asset ratio of −0.29 and a total-liabilities-to-total-assets ratio of 0.62 point to the state’s use of debt financing. Total debt is $58.32 billion. Unfunded pension liabilities are $270.58 billion on a guaranteed-to-be-paid basis, and other postemployment benefits (OPEB) are $78.73 billion. These three liabilities are equal to 37 percent of state personal income.
2014 TOTAL LONG-TERM OBLIGATIONSSTATE DEBT
General obligation
bonds
Total primary government
debtState personal
income
Ratio of debt to state personal
incomeTotal primary
debt per capita
New York $3.35 billion $58.32 billion $1,098.10 billion 5.3% $2,954
National average $6.60 billion $13.76 billion $288.25 billion 6.0% $2,144
PENSION LIABILITY
Unfunded pension liability Funded ratio
Market value of unfunded liability
Market value of funded liability ratio
New York $23.94 billion 91% $270.58 billion 48%
National average $20.46 billion 74% $86.85 billion 40%
OTHER POSTEMPLOYMENT BENEFITS (OPEB)
Total unfunded OPEB Funded ratio
New York $78.73 billion 0%
National average $10.21 billion 13%

2
For a complete explanation of the methodology used to calculate New York’s fiscal health rankings, see Eileen Norcross and Olivia Gonzalez, “Ranking the States by Fiscal Condition,” 2016 ed. (Mercatus Research, Mercatus Center at George Mason University, Arlington, VA, June 2016).
34thbudget
solvency
23rdtrust fundsolvency
44thlong-runsolvency
35thservice-level
solvency
42ndcash
solvency
–3.0
–2.0
–1.0
US average
1.0
2.0
3.0
2.0
–1.0
a
1.0
2.0
3
3
23rd
distance fromUS average
(in standard deviations)
UNDERLYING RATIOS
Cash ratio Quick ratioCurrent
ratioOperating
ratio
Surplus (or deficit) per
capitaNet asset
ratio
Long-term liability
ratio
Long-term liability
per capita
New York 0.69 1.67 1.70 1.02 $125 −0.29 0.62 $4,663
National average
2.40 3.18 3.54 1.06 $448 −0.03 0.47 $3,069
Tax-to-income ratio
Revenue-to-income ratio
Expenses-to-income ratio
Pension-to-income ratio
OPEB-to-income ratio
Primary debt-to-income ratio
New York 0.06 0.14 0.14 0.25 0.07 0.05
National average
0.06 0.14 0.13 0.31 0.03 0.06
KEY TERMS
• Cash solvency measures whether a state has enough cash to cover its short-term bills, which include accounts payable, vouchers, warrants, and short-term debt. (New York ranks 42nd.)
• Budget solvency measures whether a state can cover its fiscal year spend-ing using current revenues. Did it run a shortfall during the year? (New York ranks 34th.)
• Long-run solvency measures whether a state has a hedge against large long-term liabilities. Are enough assets available to cushion the state from potential shocks or long-term fiscal risks? (New York ranks 44th.)
• Service-level solvency measures how high taxes, revenues, and spending are when compared to state personal income. Do states have enough “fis-cal slack”? If spending commitments demand more revenues, are states in a good position to increase taxes without harming the economy? Is spend-ing high or low relative to the tax base? (New York ranks 35th.)
• Trust fund solvency measures how much debt a state has. How large are unfunded pension liabilities, OPEB liabilities, and state debt compared to the state personal income? (New York ranks 23rd.)

rank 1. Alaska2. Nebraska3. Wyoming4. North Dakota5. South Dakota6. Florida 7. Utah8. Oklahoma9. Tennessee10. Montana11. Ohio12. Idaho13. Nevada14. Missouri15. Alabama16. Texas17. Indiana18. South Carolina19. Virginia20. New Hampshire21. North Carolina22. Colorado23. Georgia24. Washington25. Iowa26. Minnesota27. Kansas28. Arkansas29. Wisconsin30. Oregon31. Arizona32. Mississippi33. Louisiana34. New Mexico35. Michigan36. Vermont37. Rhode Island38. Delaware39. Pennsylvania40. West Virginia41. Maryland42. New York43. Maine44. California45. Hawaii46. Kentucky47. Illinois48. New Jersey49. Massachusetts50. Connecticut51. Puerto Rico
NORTH CAROLINA
SUMMARY
On the basis of its fiscal solvency in five separate categories, North Caro-lina ranks 21st among the US states and Puerto Rico for its fiscal health. On a cash basis, North Carolina has between 0.93 and 2.09 times the cash needed to cover short-term liabilities. Revenues exceed expenses by 10 percent, producing a surplus of $401 per capita. On a long-run basis, North Carolina has no assets remaining after paying for debts. It also has a low long-term liability ratio, with total liabilities accounting for 19 percent of total assets. Total debt is $8.59 billion. Unfunded pension liabilities are $72.50 billion on a guaranteed-to-be-paid basis, and other postemploy-ment benefits (OPEB) are $25.64 billion. These three liabilities are equal to 28 percent of state personal income.
2014 TOTAL LONG-TERM OBLIGATIONSSTATE DEBT
General obligation
bonds
Total primary government
debtState personal
income
Ratio of debt to state personal
incomeTotal primary
debt per capita
North Carolina $3.61 billion $8.59 billion $389.51 billion 2.2% $864
National average $6.60 billion $13.76 billion $288.25 billion 6.0% $2,144
PENSION LIABILITY
Unfunded pension liability Funded ratio
Market value of unfunded liability
Market value of funded liability ratio
North Carolina $3.58 billion 96% $72.50 billion 54%
National average $20.46 billion 74% $86.85 billion 40%
OTHER POSTEMPLOYMENT BENEFITS (OPEB)
Total unfunded OPEB Funded ratio
North Carolina $25.64 billion 5%
National average $10.21 billion 13%

2
For a complete explanation of the methodology used to calculate North Carolina’s fiscal health rank-ings, see Eileen Norcross and Olivia Gonzalez, “Ranking the States by Fiscal Condition,” 2016 ed. (Mercatus Research, Mercatus Center at George Mason University, Arlington, VA, June 2016).
8thbudget
solvency
8thtrust fundsolvency
17thlong-runsolvency
18thservice-level
solvency
37thcash
solvency
–3.0
–2.0
–1.0
US average
1.0
2.0
3.0
2.0
–1.0
a
1.0
2.0
3
3distance fromUS average
(in standard deviations)
UNDERLYING RATIOS
Cash ratio Quick ratioCurrent
ratioOperating
ratio
Surplus (or deficit) per
capitaNet asset
ratio
Long-term liability
ratio
Long-term liability
per capita
North Carolina
0.93 1.65 2.09 1.10 $401 0.00 0.19 $1,105
National average
2.40 3.18 3.54 1.06 $448 −0.03 0.47 $3,069
Tax-to-income ratio
Revenue-to-income ratio
Expenses-to-income ratio
Pension-to-income ratio
OPEB-to-income ratio
Primary debt-to-income ratio
North Carolina
0.06 0.12 0.11 0.19 0.07 0.02
National average
0.06 0.14 0.13 0.31 0.03 0.06
KEY TERMS
• Cash solvency measures whether a state has enough cash to cover its short-term bills, which include accounts payable, vouchers, warrants, and short-term debt. (North Carolina ranks 37th.)
• Budget solvency measures whether a state can cover its fiscal year spend-ing using current revenues. Did it run a shortfall during the year? (North Carolina ranks 8th.)
• Long-run solvency measures whether a state has a hedge against large long-term liabilities. Are enough assets available to cushion the state from potential shocks or long-term fiscal risks? (North Carolina ranks 17th.)
• Service-level solvency measures how high taxes, revenues, and spending are when compared to state personal income. Do states have enough “fis-cal slack”? If spending commitments demand more revenues, are states in a good position to increase taxes without harming the economy? Is spend-ing high or low relative to the tax base? (North Carolina ranks 18th.)
• Trust fund solvency measures how much debt a state has. How large are unfunded pension liabilities, OPEB liabilities, and state debt compared to the state personal income? (North Carolina ranks 8th.)

rank 1. Alaska2. Nebraska3. Wyoming4. North Dakota5. South Dakota6. Florida 7. Utah8. Oklahoma9. Tennessee10. Montana11. Ohio12. Idaho13. Nevada14. Missouri15. Alabama16. Texas17. Indiana18. South Carolina19. Virginia20. New Hampshire21. North Carolina22. Colorado23. Georgia24. Washington25. Iowa26. Minnesota27. Kansas28. Arkansas29. Wisconsin30. Oregon31. Arizona32. Mississippi33. Louisiana34. New Mexico35. Michigan36. Vermont37. Rhode Island38. Delaware39. Pennsylvania40. West Virginia41. Maryland42. New York43. Maine44. California45. Hawaii46. Kentucky47. Illinois48. New Jersey49. Massachusetts50. Connecticut51. Puerto Rico
NORTH DAKOTA
SUMMARY
On the basis of its fiscal solvency in five separate categories, North Dakota ranks fourth among the US states and Puerto Rico for its fiscal health. On a cash basis, North Dakota has between 4.97 and 7.17 times the cash needed to cover short-term liabilities. Revenues exceed expenses by 42 percent, producing a surplus of $4,295 per capita. On a long-run basis, net assets are 62 percent of total assets, and total liabilities are 12 percent of total assets. Total debt is $1.60 billion. Unfunded pension liabilities are $8.27 bil-lion on a guaranteed-to-be-paid basis, and other postemployment benefits (OPEB) are $72 million. These three liabilities are equal to 24 percent of total state personal income.
2014 TOTAL LONG-TERM OBLIGATIONSSTATE DEBT
General obligation
bonds
Total primary government
debtState personal
income
Ratio of debt to state personal
incomeTotal primary
debt per capita
North Dakota $0.00 billion $1.60 billion $41.26 billion 3.9% $2,163
National average $6.60 billion $13.76 billion $288.25 billion 6.0% $2,144
PENSION LIABILITY
Unfunded pension liability Funded ratio
Market value of unfunded liability
Market value of funded liability ratio
North Dakota $2.23 billion 64% $8.27 billion 32%
National average $20.46 billion 74% $86.85 billion 40%
OTHER POSTEMPLOYMENT BENEFITS (OPEB)
Total unfunded OPEB Funded ratio
North Dakota $0.07 billion 52%
National average $10.21 billion 13%

2
For a complete explanation of the methodology used to calculate North Dakota’s fiscal health rankings, see Eileen Norcross and Olivia Gonzalez, “Ranking the States by Fiscal Condition,” 2016 ed. (Mercatus Research, Mercatus Center at George Mason University, Arlington, VA, June 2016).
3rdbudget
solvency
13thtrust fundsolvency
10thlong-runsolvency
49thservice-level
solvency
4thcash
solvency
–3.0
–2.0
–1.0
US average
1.0
2.0
3.0
2.0
–1.0
ver
1.0
2.0
3
3
distance fromUS average
(in standard deviations)
UNDERLYING RATIOS
Cash ratio Quick ratioCurrent
ratioOperating
ratio
Surplus (or deficit) per
capitaNet asset
ratio
Long-term liability
ratio
Long-term liability
per capita
North Dakota
4.97 5.65 7.17 1.42 $4,295 0.62 0.12 $3,824
National average
2.40 3.18 3.54 1.06 $448 −0.03 0.47 $3,069
Tax-to-income ratio
Revenue-to-income ratio
Expenses-to-income ratio
Pension-to-income ratio
OPEB-to-income ratio
Primary debt-to-income ratio
North Dakota
0.14 0.26 0.18 0.20 0.00 0.04
National average
0.06 0.14 0.13 0.31 0.03 0.06
KEY TERMS
• Cash solvency measures whether a state has enough cash to cover its short-term bills, which include accounts payable, vouchers, warrants, and short-term debt. (North Dakota ranks 4th.)
• Budget solvency measures whether a state can cover its fiscal year spend-ing using current revenues. Did it run a shortfall during the year? (North Dakota ranks 3rd.)
• Long-run solvency measures whether a state has a hedge against large long-term liabilities. Are enough assets available to cushion the state from potential shocks or long-term fiscal risks? (North Dakota ranks 10th.)
• Service-level solvency measures how high taxes, revenues, and spending are when compared to state personal income. Do states have enough “fis-cal slack”? If spending commitments demand more revenues, are states in a good position to increase taxes without harming the economy? Is spend-ing high or low relative to the tax base? (North Dakota ranks 49th.)
• Trust fund solvency measures how much debt a state has. How large are unfunded pension liabilities, OPEB liabilities, and state debt compared to the state personal income? (North Dakota ranks 13th.)

1. Alaska2. Nebraska3. Wyoming4. North Dakota5. South Dakota6. Florida 7. Utah8. Oklahoma9. Tennessee10. Montana11. Ohio12. Idaho13. Nevada14. Missouri15. Alabama16. Texas17. Indiana18. South Carolina19. Virginia20. New Hampshire21. North Carolina22. Colorado23. Georgia24. Washington25. Iowa26. Minnesota27. Kansas28. Arkansas29. Wisconsin30. Oregon31. Arizona32. Mississippi33. Louisiana34. New Mexico35. Michigan36. Vermont37. Rhode Island38. Delaware39. Pennsylvania40. West Virginia41. Maryland42. New York43. Maine44. California45. Hawaii46. Kentucky47. Illinois48. New Jersey49. Massachusetts50. Connecticut51. Puerto Rico
OHIOrank
SUMMARY
On the basis of its fiscal solvency in five separate categories, Ohio ranks 11th among the US states and Puerto Rico for its fiscal health. On a cash basis, Ohio has between 4.64 and 6.22 times the cash needed to cover short-term liabilities. Revenues exceed expenses by 5 percent, producing a surplus of $278 per capita. Net assets are 10 percent of total assets, and total liabilities are 54 percent of total assets, for a total liability per capita of $3,579. Total debt is $17.75 billion. Unfunded liabilities are $262.47 billion, and other postemployment benefits (OPEB) are $15.46 billion. Total liabilities are equal to 61 percent of state personal income.
2014 TOTAL LONG-TERM OBLIGATIONSSTATE DEBT
General obligation
bonds
Total primary government
debtState personal
income
Ratio of debt to state personal
incomeTotal primary
debt per capita
Ohio $9.37 billion $17.75 billion $489.69 billion 3.6% $1,531
National average $6.60 billion $13.76 billion $288.25 billion 6.0% $2,144
PENSION LIABILITY
Unfunded pension liability Funded ratio
Market value of unfunded liability
Market value of funded liability ratio
Ohio $55.02 billion 75% $262.47 billion 39%
National average $20.46 billion 74% $86.85 billion 40%
OTHER POSTEMPLOYMENT BENEFITS (OPEB)
Total unfunded OPEB Funded ratio
Ohio $15.46 billion 52%
National average $10.21 billion 13%

2
For a complete explanation of the methodology used to calculate Ohio’s fiscal health rankings, see Eileen Norcross and Olivia Gonzalez, “Ranking the States by Fiscal Condition,” 2016 ed. (Mercatus Research, Mercatus Center at George Mason University, Arlington, VA, June 2016).
18thbudget
solvency
48thtrust fundsolvency
38thlong-runsolvency
21stservice-level
solvency
5thcash
solvency
–3.0
–2.0
–1.0
US average
1.0
2.0
3.0
2.0
–1.0
ve
1.0
2.0
3
3distance fromUS average
(in standard deviations)
UNDERLYING RATIOS
Cash ratio Quick ratioCurrent
ratioOperating
ratio
Surplus (or deficit) per
capitaNet asset
ratio
Long-term liability
ratio
Long-term liability
per capita
Ohio 4.64 5.80 6.22 1.05 $278 0.10 0.54 $3,579
National average
2.40 3.18 3.54 1.06 $448 −0.03 0.47 $3,069
Tax-to-income ratio
Revenue-to-income ratio
Expenses-to-income ratio
Pension-to-income ratio
OPEB-to-income ratio
Primary debt-to-income ratio
Ohio 0.05 0.13 0.12 0.54 0.03 0.04
National average
0.06 0.14 0.13 0.31 0.03 0.06
KEY TERMS
• Cash solvency measures whether a state has enough cash to cover its short-term bills, which include accounts payable, vouchers, warrants, and short-term debt. (Ohio ranks 5th.)
• Budget solvency measures whether a state can cover its fiscal year spend-ing using current revenues. Did it run a shortfall during the year? (Ohio ranks 18th.)
• Long-run solvency measures whether a state has a hedge against large long-term liabilities. Are enough assets available to cushion the state from potential shocks or long-term fiscal risks? (Ohio ranks 38th.)
• Service-level solvency measures how high taxes, revenues, and spending are when compared to state personal income. Do states have enough “fis-cal slack”? If spending commitments demand more revenues, are states in a good position to increase taxes without harming the economy? Is spend-ing high or low relative to the tax base? (Ohio ranks 21st.)
• Trust fund solvency measures how much debt a state has. How large are unfunded pension liabilities, OPEB liabilities, and state debt compared to the state personal income? (Ohio ranks 48th.)

rank 1. Alaska2. Nebraska3. Wyoming4. North Dakota5. South Dakota6. Florida 7. Utah8. Oklahoma9. Tennessee10. Montana11. Ohio12. Idaho13. Nevada14. Missouri15. Alabama16. Texas17. Indiana18. South Carolina19. Virginia20. New Hampshire21. North Carolina22. Colorado23. Georgia24. Washington25. Iowa26. Minnesota27. Kansas28. Arkansas29. Wisconsin30. Oregon31. Arizona32. Mississippi33. Louisiana34. New Mexico35. Michigan36. Vermont37. Rhode Island38. Delaware39. Pennsylvania40. West Virginia41. Maryland42. New York43. Maine44. California45. Hawaii46. Kentucky47. Illinois48. New Jersey49. Massachusetts50. Connecticut51. Puerto Rico
OKLAHOMA
SUMMARY
On the basis of its fiscal solvency in five separate categories, Oklahoma ranks eighth among the US states and Puerto Rico for its fiscal health. On a cash basis, Oklahoma has between 3.09 and 3.79 times the cash needed to cover short-term liabilities. Revenues exceed expenses by 5 percent, pro-ducing a surplus of $260 per capita. Net assets are 37 percent of total assets, and total liabilities are 11 percent of total assets. Total debt is $2.37 billion. Unfunded liabilities are $41.65 billion on a guaranteed-to-be paid basis. Together, debt and unfunded pension liabilities are equal to 26 percent of state personal income.
2014 TOTAL LONG-TERM OBLIGATIONSSTATE DEBT
General obligation
bonds
Total primary government
debtState personal
income
Ratio of debt to state personal
incomeTotal primary
debt per capita
Oklahoma $0.13 billion $2.37 billion $169.23 billion 1.4% $611
National average $6.60 billion $13.76 billion $288.25 billion 6.0% $2,144
PENSION LIABILITY
Unfunded pension liability Funded ratio
Market value of unfunded liability
Market value of funded liability ratio
Oklahoma $9.63 billion 72% $41.65 billion 38%
National average $20.46 billion 74% $86.85 billion 40%
OTHER POSTEMPLOYMENT BENEFITS (OPEB)
Total unfunded OPEB Funded ratio
Oklahoma $0.00 billion 0%
National average $10.21 billion 13%

2
For a complete explanation of the methodology used to calculate Oklahoma’s fiscal health rankings, see Eileen Norcross and Olivia Gonzalez, “Ranking the States by Fiscal Condition,” 2016 ed. (Mercatus Research, Mercatus Center at George Mason University, Arlington, VA, June 2016).
16thbudget
solvency
2ndtrust fundsolvency
5thlong-runsolvency
15thservice-level
solvency
13thcash
solvency
–3.0
–2.0
–1.0
US average
1.0
2.0
3.0
2.0
–1.0
ver
1.0
2.0
3
3
distance fromUS average
(in standard deviations)
UNDERLYING RATIOS
Cash ratio Quick ratioCurrent
ratioOperating
ratio
Surplus (or deficit) per
capitaNet asset
ratio
Long-term liability
ratio
Long-term liability
per capita
Oklahoma 3.09 3.74 3.79 1.05 $260 0.37 0.11 $637
National average
2.40 3.18 3.54 1.06 $448 −0.03 0.47 $3,069
Tax-to-income ratio
Revenue-to-income ratio
Expenses-to-income ratio
Pension-to-income ratio
OPEB-to-income ratio
Primary debt-to-income ratio
Oklahoma 0.05 0.11 0.11 0.25 0.00 0.01
National average
0.06 0.14 0.13 0.31 0.03 0.06
KEY TERMS
• Cash solvency measures whether a state has enough cash to cover its short-term bills, which include accounts payable, vouchers, warrants, and short-term debt. (Oklahoma ranks 13th.)
• Budget solvency measures whether a state can cover its fiscal year spend-ing using current revenues. Did it run a shortfall during the year? (Okla-homa ranks 16th.)
• Long-run solvency measures whether a state has a hedge against large long-term liabilities. Are enough assets available to cushion the state from potential shocks or long-term fiscal risks? (Oklahoma ranks 5th.)
• Service-level solvency measures how high taxes, revenues, and spending are when compared to state personal income. Do states have enough “fis-cal slack”? If spending commitments demand more revenues, are states in a good position to increase taxes without harming the economy? Is spend-ing high or low relative to the tax base? (Oklahoma ranks 15th.)
• Trust fund solvency measures how much debt a state has. How large are unfunded pension liabilities, OPEB liabilities, and state debt compared to the state personal income? (Oklahoma ranks 2nd.)
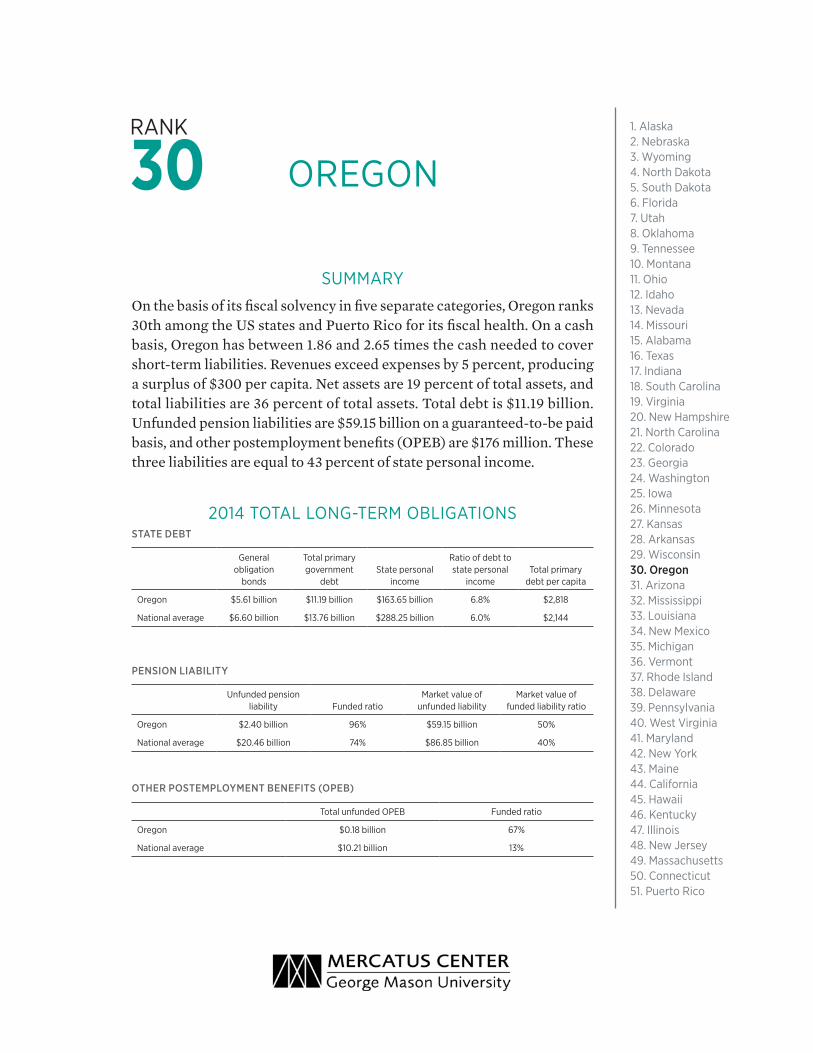
rank 1. Alaska2. Nebraska3. Wyoming4. North Dakota5. South Dakota6. Florida 7. Utah8. Oklahoma9. Tennessee10. Montana11. Ohio12. Idaho13. Nevada14. Missouri15. Alabama16. Texas17. Indiana18. South Carolina19. Virginia20. New Hampshire21. North Carolina22. Colorado23. Georgia24. Washington25. Iowa26. Minnesota27. Kansas28. Arkansas29. Wisconsin30. Oregon31. Arizona32. Mississippi33. Louisiana34. New Mexico35. Michigan36. Vermont37. Rhode Island38. Delaware39. Pennsylvania40. West Virginia41. Maryland42. New York43. Maine44. California45. Hawaii46. Kentucky47. Illinois48. New Jersey49. Massachusetts50. Connecticut51. Puerto Rico
OREGON
SUMMARY
On the basis of its fiscal solvency in five separate categories, Oregon ranks 30th among the US states and Puerto Rico for its fiscal health. On a cash basis, Oregon has between 1.86 and 2.65 times the cash needed to cover short-term liabilities. Revenues exceed expenses by 5 percent, producing a surplus of $300 per capita. Net assets are 19 percent of total assets, and total liabilities are 36 percent of total assets. Total debt is $11.19 billion. Unfunded pension liabilities are $59.15 billion on a guaranteed-to-be paid basis, and other postemployment benefits (OPEB) are $176 million. These three liabilities are equal to 43 percent of state personal income.
2014 TOTAL LONG-TERM OBLIGATIONSSTATE DEBT
General obligation
bonds
Total primary government
debtState personal
income
Ratio of debt to state personal
incomeTotal primary
debt per capita
Oregon $5.61 billion $11.19 billion $163.65 billion 6.8% $2,818
National average $6.60 billion $13.76 billion $288.25 billion 6.0% $2,144
PENSION LIABILITY
Unfunded pension liability Funded ratio
Market value of unfunded liability
Market value of funded liability ratio
Oregon $2.40 billion 96% $59.15 billion 50%
National average $20.46 billion 74% $86.85 billion 40%
OTHER POSTEMPLOYMENT BENEFITS (OPEB)
Total unfunded OPEB Funded ratio
Oregon $0.18 billion 67%
National average $10.21 billion 13%

2
For a complete explanation of the methodology used to calculate Oregon’s fiscal health rankings, see Eileen Norcross and Olivia Gonzalez, “Ranking the States by Fiscal Condition,” 2016 ed. (Mercatus Research, Mercatus Center at George Mason University, Arlington, VA, June 2016).
17thbudget
solvency
37thtrust fundsolvency
33rdlong-runsolvency
37thservice-level
solvency
24thcash
solvency
–3.0
–2.0
–1.0
US average
1.0
2.0
3.0
2.0
–1.0
a
1.0
2.0
3
3
17th
distance fromUS average
(in standard deviations)
UNDERLYING RATIOS
Cash ratio Quick ratioCurrent
ratioOperating
ratio
Surplus (or deficit) per
capitaNet asset
ratio
Long-term liability
ratio
Long-term liability
per capita
Oregon 1.86 2.46 2.65 1.05 $300 0.19 0.36 $3,175
National average
2.40 3.18 3.54 1.06 $448 −0.03 0.47 $3,069
Tax-to-income ratio
Revenue-to-income ratio
Expenses-to-income ratio
Pension-to-income ratio
OPEB-to-income ratio
Primary debt-to-income ratio
Oregon 0.06 0.16 0.15 0.36 0.00 0.07
National average
0.06 0.14 0.13 0.31 0.03 0.06
KEY TERMS
• Cash solvency measures whether a state has enough cash to cover its short-term bills, which include accounts payable, vouchers, warrants, and short-term debt. (Oregon ranks 24th.)
• Budget solvency measures whether a state can cover its fiscal year spend-ing using current revenues. Did it run a shortfall during the year? (Oregon ranks 17th.)
• Long-run solvency measures whether a state has a hedge against large long-term liabilities. Are enough assets available to cushion the state from potential shocks or long-term fiscal risks? (Oregon ranks 33rd.)
• Service-level solvency measures how high taxes, revenues, and spending are when compared to state personal income. Do states have enough “fis-cal slack”? If spending commitments demand more revenues, are states in a good position to increase taxes without harming the economy? Is spend-ing high or low relative to the tax base? (Oregon ranks 37th.)
• Trust fund solvency measures how much debt a state has. How large are unfunded pension liabilities, OPEB liabilities, and state debt compared to the state personal income? (Oregon ranks 37th.)

rank 1. Alaska2. Nebraska3. Wyoming4. North Dakota5. South Dakota6. Florida 7. Utah8. Oklahoma9. Tennessee10. Montana11. Ohio12. Idaho13. Nevada14. Missouri15. Alabama16. Texas17. Indiana18. South Carolina19. Virginia20. New Hampshire21. North Carolina22. Colorado23. Georgia24. Washington25. Iowa26. Minnesota27. Kansas28. Arkansas29. Wisconsin30. Oregon31. Arizona32. Mississippi33. Louisiana34. New Mexico35. Michigan36. Vermont37. Rhode Island38. Delaware39. Pennsylvania40. West Virginia41. Maryland42. New York43. Maine44. California45. Hawaii46. Kentucky47. Illinois48. New Jersey49. Massachusetts50. Connecticut51. Puerto Rico
PENNSYLVANIA
SUMMARY
On the basis of its fiscal solvency in five separate categories, Pennsylvania ranks 39th among the US states and Puerto Rico for its fiscal health. On a cash basis, Pennsylvania has between 0.75 and 1.38 times the cash needed to cover short-term liabilities. Revenues cover 99 percent of expenses, for a deficit of $56 per capita. On a long-run basis, a negative net asset ratio of −0.11 points to the use of debt financing. Total liabilities are 42 percent of total assets. Total debt is $17.66 billion. Unfunded pension liabilities are $169.64 billion on a guarantee-to-be-paid basis, and other postemployment benefits (OPEB) are $17.38 billion. These three liabilities are equal to 34 percent of state personal income.
2014 TOTAL LONG-TERM OBLIGATIONSSTATE DEBT
General obligation
bonds
Total primary government
debtState personal
income
Ratio of debt to state personal
incomeTotal primary
debt per capita
Pennsylvania $12.67 billion $17.66 billion $609.68 billion 2.9% $1,381
National average $6.60 billion $13.76 billion $288.25 billion 6.0% $2,144
PENSION LIABILITY
Unfunded pension liability Funded ratio
Market value of unfunded liability
Market value of funded liability ratio
Pennsylvania $53.32 billion 62% $169.64 billion 34%
National average $20.46 billion 74% $86.85 billion 40%
OTHER POSTEMPLOYMENT BENEFITS (OPEB)
Total unfunded OPEB Funded ratio
Pennsylvania $17.38 billion 1%
National average $10.21 billion 13%

2
For a complete explanation of the methodology used to calculate Pennsylvania’s fiscal health rankings, see Eileen Norcross and Olivia Gonzalez, “Ranking the States by Fiscal Condition,” 2016 ed. (Mercatus Research, Mercatus Center at George Mason University, Arlington, VA, June 2016).
42ndbudget
solvency
27thtrust fundsolvency
35thlong-runsolvency
17thservice-level
solvency
46thcash
solvency
–3.0
–2.0
–1.0
US average
1.0
2.0
3.0
2.0
–1.0
era
1.0
2.0
3
3distance fromUS average
(in standard deviations)
UNDERLYING RATIOS
Cash ratioQuick ratio
Current ratio
Operating ratio
Surplus (or deficit) per capita
Net asset ratio
Long-term liability
ratio
Long-term liability
per capita
Pennsylvania 0.75 1.11 1.38 0.99 −$56 −0.11 0.42 $1,956
National average
2.40 3.18 3.54 1.06 $448 −0.03 0.47 $3,069
Tax-to-income ratio
Revenue-to-income ratio
Expenses-to-income ratio
Pension-to-income ratio
OPEB-to-income ratio
Primary debt-to-income
ratio
Pennsylvania 0.05 0.11 0.12 0.28 0.03 0.03
National average
0.06 0.14 0.13 0.31 0.03 0.06
KEY TERMS
• Cash solvency measures whether a state has enough cash to cover its short-term bills, which include accounts payable, vouchers, warrants, and short-term debt. (Pennsylvania ranks 46th.)
• Budget solvency measures whether a state can cover its fiscal year spend-ing using current revenues. Did it run a shortfall during the year? (Penn-sylvania ranks 42nd.)
• Long-run solvency measures whether a state has a hedge against large long-term liabilities. Are enough assets available to cushion the state from potential shocks or long-term fiscal risks? (Pennsylvania ranks 35th.)
• Service-level solvency measures how high taxes, revenues, and spending are when compared to state personal income. Do states have enough “fis-cal slack”? If spending commitments demand more revenues, are states in a good position to increase taxes without harming the economy? Is spend-ing high or low relative to the tax base? (Pennsylvania ranks 17th.)
• Trust fund solvency measures how much debt a state has. How large are unfunded pension liabilities, OPEB liabilities, and state debt compared to the state personal income? (Pennsylvania ranks 27th.)

rank 1. Alaska2. Nebraska3. Wyoming4. North Dakota5. South Dakota6. Florida 7. Utah8. Oklahoma9. Tennessee10. Montana11. Ohio12. Idaho13. Nevada14. Missouri15. Alabama16. Texas17. Indiana18. South Carolina19. Virginia20. New Hampshire21. North Carolina22. Colorado23. Georgia24. Washington25. Iowa26. Minnesota27. Kansas28. Arkansas29. Wisconsin30. Oregon31. Arizona32. Mississippi33. Louisiana34. New Mexico35. Michigan36. Vermont37. Rhode Island38. Delaware39. Pennsylvania40. West Virginia41. Maryland42. New York43. Maine44. California45. Hawaii46. Kentucky47. Illinois48. New Jersey49. Massachusetts50. Connecticut51. Puerto Rico
PUERTO RICO
SUMMARY
On the basis of its fiscal solvency in five separate categories, Puerto Rico ranks 51st among the US states and Puerto Rico for its fiscal health. On a cash basis, Puerto Rico has between 0.32 and 0.77 times the cash needed to cover short-term liabilities. Revenues cover 88 percent of expenses, for a deficit of $715 per capita. A negative net asset ratio of −3.32 and total liabilities that are 3.71 times the size of assets point to Puerto Rico’s heavy reliance on debt financing. Long-term liabilities are $16,646 per capita. Total debt is $72.27 billion. According to Puerto Rico’s financial reports, unfunded pension liabilities are $43.64 billion, and other postemployment benefits (OPEB) are $1.99 billion. These three liabilities are 1.85 times the size of Puerto Rico’s total personal income.
2014 TOTAL LONG-TERM OBLIGATIONSSTATE DEBT
General obligation
bonds
Total primary government
debtState personal
income
Ratio of debt to state personal
incomeTotal primary
debt per capita
Puerto Rico $38.48 billion $72.27 billion $63.78 billion 113.3% $20,366
National average $6.60 billion $13.76 billion $288.25 billion 6.0% $2,144
PENSION LIABILITY
Unfunded pension liability Funded ratio
Market value of unfunded liability
Market value of funded liability ratio
Puerto Rico $43.64 billion n/a n/a n/a
National average $20.46 billion 74% $86.85 billion 40%
Note: n/a = not available.
OTHER POSTEMPLOYMENT BENEFITS (OPEB)
Total unfunded OPEB Funded ratio
Puerto Rico $1.99 billion 0%
National average $10.21 billion 13%

2
For a complete explanation of the methodology used to calculate Puerto Rico’s fiscal health rankings, see Eileen Norcross and Olivia Gonzalez, “Ranking the States by Fiscal Condition,” 2016 ed. (Mercatus Research, Mercatus Center at George Mason University, Arlington, VA, June 2016).
51stbudget
solvency
51sttrust fundsolvency
51stlong-runsolvency
51stservice-level
solvency
51stcash
solvency
–3.0
–2.0
–1.0
US average
1.0
2.0
3.0
2.0
–1.0
era
1.0
2.0
3
3distance fromUS average
(in standard deviations)
UNDERLYING RATIOS
Cash ratio Quick ratioCurrent
ratioOperating
ratio
Surplus (or deficit) per
capitaNet asset
ratio
Long-term liability
ratio
Long-term liability
per capita
Puerto Rico
0.32 0.74 0.77 0.88 −$715 −3.32 3.71 $16,646
National average
2.40 3.18 3.54 1.06 $448 −0.03 0.47 $3,069
Tax-to-income ratio
Revenue-to-income ratio
Expenses-to-income ratio
Pension-to-income ratio
OPEB-to-income ratio
Primary debt-to-income ratio
Puerto Rico
0.16 0.30 0.34 0.68 0.03 1.13
National average
0.06 0.14 0.13 0.31 0.03 0.06
KEY TERMS
• Cash solvency measures whether a state has enough cash to cover its short-term bills, which include accounts payable, vouchers, warrants, and short-term debt. (Puerto Rico ranks 51st.)
• Budget solvency measures whether a state can cover its fiscal year spend-ing using current revenues. Did it run a shortfall during the year? (Puerto Rico ranks 51st.)
• Long-run solvency measures whether a state has a hedge against large long-term liabilities. Are enough assets available to cushion the state from potential shocks or long-term fiscal risks? (Puerto Rico ranks 51st.)
• Service-level solvency measures how high taxes, revenues, and spending are when compared to state personal income. Do states have enough “fis-cal slack”? If spending commitments demand more revenues, are states in a good position to increase taxes without harming the economy? Is spend-ing high or low relative to the tax base? (Puerto Rico ranks 51st.)
• Trust fund solvency measures how much debt a state has. How large are unfunded pension liabilities, OPEB liabilities, and state debt compared to the state personal income? (Puerto Rico ranks 51st.)

rank 1. Alaska2. Nebraska3. Wyoming4. North Dakota5. South Dakota6. Florida 7. Utah8. Oklahoma9. Tennessee10. Montana11. Ohio12. Idaho13. Nevada14. Missouri15. Alabama16. Texas17. Indiana18. South Carolina19. Virginia20. New Hampshire21. North Carolina22. Colorado23. Georgia24. Washington25. Iowa26. Minnesota27. Kansas28. Arkansas29. Wisconsin30. Oregon31. Arizona32. Mississippi33. Louisiana34. New Mexico35. Michigan36. Vermont37. Rhode Island38. Delaware39. Pennsylvania40. West Virginia41. Maryland42. New York43. Maine44. California45. Hawaii46. Kentucky47. Illinois48. New Jersey49. Massachusetts50. Connecticut51. Puerto Rico
RHODE ISLAND
SUMMARY
On the basis of its fiscal solvency in five separate categories, Rhode Island ranks 37th among the US states and Puerto Rico for its fiscal health. On a cash basis, Rhode Island has between 0.86 and 1.73 times the cash needed to cover short-term liabilities. Revenues exceed expenses by 4 percent, for a surplus of $276 per capita. Rhode Island has a negative asset ratio of –0.11, and total liabilities are 48 percent of total assets. Total debt is $2.67 billion. Unfunded pension liabilities are $14.97 billion on a guaranteed-to-be paid basis, and other postemployment benefits (OPEB) are $714 million. These three liabilities are equal to 35 percent of state personal income.
2014 TOTAL LONG-TERM OBLIGATIONSSTATE DEBT
General obligation
bonds
Total primary government
debtState personal
income
Ratio of debt to state personal
incomeTotal primary
debt per capita
Rhode Island $1.07 billion $2.67 billion $51.03 billion 5.2% $2,530
National average $6.60 billion $13.76 billion $288.25 billion 6.0% $2,144
PENSION LIABILITY
Unfunded pension liability Funded ratio
Market value of unfunded liability
Market value of funded liability ratio
Rhode Island $4.61 billion 63% $14.97 billion 34%
National average $20.46 billion 74% $86.85 billion 40%
OTHER POSTEMPLOYMENT BENEFITS (OPEB)
Total unfunded OPEB Funded ratio
Rhode Island $0.71 billion 8%
National average $10.21 billion 13%

2
For a complete explanation of the methodology used to calculate Rhode Island’s fiscal health rankings, see Eileen Norcross and Olivia Gonzalez, “Ranking the States by Fiscal Condition,” 2016 ed. (Mercatus Research, Mercatus Center at George Mason University, Arlington, VA, June 2016).
22ndbudget
solvency
29thtrust fundsolvency
39thlong-runsolvency
34thservice-level
solvency
41stcash
solvency
–3.0
–2.0
–1.0
US average
1.0
2.0
3.0
2.0
–1.0
ver
1.0
2.0
3
3
22nd
distance fromUS average
(in standard deviations)
UNDERLYING RATIOS
Cash ratio Quick ratioCurrent
ratioOperating
ratio
Surplus (or deficit) per
capitaNet asset
ratio
Long-term liability
ratio
Long-term liability
per capita
Rhode Island
0.86 1.49 1.73 1.04 $276 −0.11 0.48 $2,659
National average
2.40 3.18 3.54 1.06 $448 −0.03 0.47 $3,069
Tax-to-income ratio
Revenue-to-income ratio
Expenses-to-income ratio
Pension-to-income ratio
OPEB-to-income ratio
Primary debt-to-income ratio
Rhode Island
0.06 0.15 0.14 0.29 0.01 0.05
National average
0.06 0.14 0.13 0.31 0.03 0.06
KEY TERMS
• Cash solvency measures whether a state has enough cash to cover its short-term bills, which include accounts payable, vouchers, warrants, and short-term debt. (Rhode Island ranks 41st.)
• Budget solvency measures whether a state can cover its fiscal year spend-ing using current revenues. Did it run a shortfall during the year? (Rhode Island ranks 22nd.)
• Long-run solvency measures whether a state has a hedge against large long-term liabilities. Are enough assets available to cushion the state from potential shocks or long-term fiscal risks? (Rhode Island ranks 39th.)
• Service-level solvency measures how high taxes, revenues, and spending are when compared to state personal income. Do states have enough “fis-cal slack”? If spending commitments demand more revenues, are states in a good position to increase taxes without harming the economy? Is spend-ing high or low relative to the tax base? (Rhode Island ranks 34th.)
• Trust fund solvency measures how much debt a state has. How large are unfunded pension liabilities, OPEB liabilities, and state debt compared to the state personal income? (Rhode Island ranks 29th.)

rank 1. Alaska2. Nebraska3. Wyoming4. North Dakota5. South Dakota6. Florida 7. Utah8. Oklahoma9. Tennessee10. Montana11. Ohio12. Idaho13. Nevada14. Missouri15. Alabama16. Texas17. Indiana18. South Carolina19. Virginia20. New Hampshire21. North Carolina22. Colorado23. Georgia24. Washington25. Iowa26. Minnesota27. Kansas28. Arkansas29. Wisconsin30. Oregon31. Arizona32. Mississippi33. Louisiana34. New Mexico35. Michigan36. Vermont37. Rhode Island38. Delaware39. Pennsylvania40. West Virginia41. Maryland42. New York43. Maine44. California45. Hawaii46. Kentucky47. Illinois48. New Jersey49. Massachusetts50. Connecticut51. Puerto Rico
SOUTH CAROLINA
SUMMARY
On the basis of its fiscal solvency in five separate categories, South Carolina ranks 18th among the US states and Puerto Rico for its fiscal health. On a cash basis, South Carolina has between 2.19 and 3.57 times the cash needed to cover short-term liabilities. Revenues exceed expenses by 7 percent, for a surplus of $304 per capita. Net assets are 23 percent of total assets, and total liabilities are 20 percent of total assets. Total debt is $3.39 billion. Unfunded pension liabilities are $59.39 billion on a guaranteed-to-be-paid basis, and other postemployment benefits (OPEB) are $9.40 billion. These three liabilities are equal to 41 percent of total state personal income.
2014 TOTAL LONG-TERM OBLIGATIONSSTATE DEBT
General obligation
bonds
Total primary government
debtState personal
income
Ratio of debt to state personal
incomeTotal primary
debt per capita
South Carolina $1.32 billion $3.39 billion $177.24 billion 1.9% $701
National average $6.60 billion $13.76 billion $288.25 billion 6.0% $2,144
PENSION LIABILITY
Unfunded pension liability Funded ratio
Market value of unfunded liability
Market value of funded liability ratio
South Carolina $17.97 billion 63% $59.39 billion 34%
National average $20.46 billion 74% $86.85 billion 40%
OTHER POSTEMPLOYMENT BENEFITS (OPEB)
Total unfunded OPEB Funded ratio
South Carolina $9.40 billion 7%
National average $10.21 billion 13%

2
For a complete explanation of the methodology used to calculate South Carolina’s fiscal health rank-ings, see Eileen Norcross and Olivia Gonzalez, “Ranking the States by Fiscal Condition,” 2016 ed. (Mercatus Research, Mercatus Center at George Mason University, Arlington, VA, June 2016).
13thbudget
solvency
35thtrust fundsolvency
11thlong-runsolvency
24thservice-level
solvency
17thcash
solvency
–3.0
–2.0
–1.0
US average
1.0
2.0
3.0
2.0
–1.0
a
1.0
2.0
3
3
budget
distance fromUS average
(in standard deviations)
UNDERLYING RATIOS
Cash ratio Quick ratioCurrent
ratioOperating
ratio
Surplus (or deficit) per
capitaNet asset
ratio
Long-term liability
ratio
Long-term liability
per capita
South Carolina
2.19 2.91 3.57 1.07 $304 0.23 0.20 $1,061
National average
2.40 3.18 3.54 1.06 $448 −0.03 0.47 $3,069
Tax-to-income ratio
Revenue-to-income ratio
Expenses-to-income ratio
Pension-to-income ratio
OPEB-to-income ratio
Primary debt-to-income ratio
South Carolina
0.05 0.13 0.12 0.34 0.05 0.02
National average
0.06 0.14 0.13 0.31 0.03 0.06
KEY TERMS
• Cash solvency measures whether a state has enough cash to cover its short-term bills, which include accounts payable, vouchers, warrants, and short-term debt. (South Carolina ranks 17th.)
• Budget solvency measures whether a state can cover its fiscal year spend-ing using current revenues. Did it run a shortfall during the year? (South Carolina ranks 13th.)
• Long-run solvency measures whether a state has a hedge against large long-term liabilities. Are enough assets available to cushion the state from potential shocks or long-term fiscal risks? (South Carolina ranks 11th.)
• Service-level solvency measures how high taxes, revenues, and spending are when compared to state personal income. Do states have enough “fis-cal slack”? If spending commitments demand more revenues, are states in a good position to increase taxes without harming the economy? Is spend-ing high or low relative to the tax base? (South Carolina ranks 24th.)
• Trust fund solvency measures how much debt a state has. How large are unfunded pension liabilities, OPEB liabilities, and state debt compared to the state personal income? (South Carolina ranks 35th.)

rank 1. Alaska2. Nebraska3. Wyoming4. North Dakota5. South Dakota6. Florida 7. Utah8. Oklahoma9. Tennessee10. Montana11. Ohio12. Idaho13. Nevada14. Missouri15. Alabama16. Texas17. Indiana18. South Carolina19. Virginia20. New Hampshire21. North Carolina22. Colorado23. Georgia24. Washington25. Iowa26. Minnesota27. Kansas28. Arkansas29. Wisconsin30. Oregon31. Arizona32. Mississippi33. Louisiana34. New Mexico35. Michigan36. Vermont37. Rhode Island38. Delaware39. Pennsylvania40. West Virginia41. Maryland42. New York43. Maine44. California45. Hawaii46. Kentucky47. Illinois48. New Jersey49. Massachusetts50. Connecticut51. Puerto Rico
SOUTH DAKOTA
SUMMARY
On the basis of its fiscal solvency in five separate categories, South Dakota ranks fifth among the US states and Puerto Rico for its fiscal health. On a cash basis, South Dakota has between 5.82 and 8.19 times the cash needed to cover short-term liabilities. Revenues exceed expenses by 9 percent, for a surplus of $408 per capita. Net assets are 32 percent of total assets, and total liabilities are 9 percent of total assets. Total debt is $486 mil-lion. Unfunded pension liabilities are $7.70 billion. These two liabilities are equal to 21 percent of total state personal income.
2014 TOTAL LONG-TERM OBLIGATIONSSTATE DEBT
General obligation
bonds
Total primary government
debtState personal
income
Ratio of debt to state personal
incomeTotal primary
debt per capita
South Dakota $0.00 billion $0.49 billion $38.63 billion 1.3% $570
National average $6.60 billion $13.76 billion $288.25 billion 6.0% $2,144
PENSION LIABILITY
Unfunded pension liability Funded ratio
Market value of unfunded liability
Market value of funded liability ratio
South Dakota $0.00 billion 100% $7.70 billion 56%
National average $20.46 billion 74% $86.85 billion 40%
OTHER POSTEMPLOYMENT BENEFITS (OPEB)
Total unfunded OPEB Funded ratio
South Dakota $0.00 billion 0%
National average $10.21 billion 13%

2
For a complete explanation of the methodology used to calculate South Dakota’s fiscal health rankings, see Eileen Norcross and Olivia Gonzalez, “Ranking the States by Fiscal Condition,” 2016 ed. (Mercatus Research, Mercatus Center at George Mason University, Arlington, VA, June 2016).
9thbudget
solvency
9thtrust fundsolvency
6thlong-runsolvency
4thservice-level
solvency
2ndcash
solvency
–3.0
–2.0
–1.0
US average
1.0
2.0
3.0
2.0
–1.0
era
1.0
2.0
3
3
distance fromUS average
(in standard deviations)
UNDERLYING RATIOS
Cash ratio Quick ratioCurrent
ratioOperating
ratio
Surplus (or deficit) per
capitaNet asset
ratio
Long-term liability
ratio
Long-term liability
per capita
South Dakota
5.82 8.05 8.19 1.09 $408 0.32 0.09 $718
National average
2.40 3.18 3.54 1.06 $448 −0.03 0.47 $3,069
Tax-to-income ratio
Revenue-to-income ratio
Expenses-to-income ratio
Pension-to-income ratio
OPEB-to-income ratio
Primary debt-to-income ratio
South Dakota
0.04 0.10 0.09 0.20 n/a 0.01
National average
0.06 0.14 0.13 0.31 0.03 0.06
Note: n/a = not applicable.
KEY TERMS
• Cash solvency measures whether a state has enough cash to cover its short-term bills, which include accounts payable, vouchers, warrants, and short-term debt. (South Dakota ranks 2nd.)
• Budget solvency measures whether a state can cover its fiscal year spend-ing using current revenues. Did it run a shortfall during the year? (South Dakota ranks 9th.)
• Long-run solvency measures whether a state has a hedge against large long-term liabilities. Are enough assets available to cushion the state from potential shocks or long-term fiscal risks? (South Dakota ranks 6th.)
• Service-level solvency measures how high taxes, revenues, and spending are when compared to state personal income. Do states have enough “fis-cal slack”? If spending commitments demand more revenues, are states in a good position to increase taxes without harming the economy? Is spend-ing high or low relative to the tax base? (South Dakota ranks 4th.)
• Trust fund solvency measures how much debt a state has. How large are unfunded pension liabilities, OPEB liabilities, and state debt compared to the state personal income? (South Dakota ranks 9th.)

rank 1. Alaska2. Nebraska3. Wyoming4. North Dakota5. South Dakota6. Florida 7. Utah8. Oklahoma9. Tennessee10. Montana11. Ohio12. Idaho13. Nevada14. Missouri15. Alabama16. Texas17. Indiana18. South Carolina19. Virginia20. New Hampshire21. North Carolina22. Colorado23. Georgia24. Washington25. Iowa26. Minnesota27. Kansas28. Arkansas29. Wisconsin30. Oregon31. Arizona32. Mississippi33. Louisiana34. New Mexico35. Michigan36. Vermont37. Rhode Island38. Delaware39. Pennsylvania40. West Virginia41. Maryland42. New York43. Maine44. California45. Hawaii46. Kentucky47. Illinois48. New Jersey49. Massachusetts50. Connecticut51. Puerto Rico
TENNESSEE
SUMMARY
On the basis of its fiscal solvency in five separate categories, Tennessee ranks ninth among the US states and Puerto Rico for its fiscal health. On a cash basis, Tennessee has between 3.42 and 4.89 times the cash needed to cover short-term liabilities. Revenues exceed expenses by 2 percent, for a surplus of $81 per capita. Net assets are 13 percent of total assets, and total liabilities are 10 percent of total assets. Total debt is $2.34 billion. Unfunded pension liabilities are $37.96 billion on a guaranteed-to-be-paid basis, and other postemployment benefits (OPEB) are $1.23 billion. These three liabilities are equal to 15 percent of total state personal income.
2014 TOTAL LONG-TERM OBLIGATIONSSTATE DEBT
General obligation
bonds
Total primary government
debtState personal
income
Ratio of debt to state personal
incomeTotal primary
debt per capita
Tennessee $2.00 billion $2.34 billion $264.97 billion 0.9% $358
National average $6.60 billion $13.76 billion $288.25 billion 6.0% $2,144
PENSION LIABILITY
Unfunded pension liability Funded ratio
Market value of unfunded liability
Market value of funded liability ratio
Tennessee $2.66 billion 94% $37.96 billion 51%
National average $20.46 billion 74% $86.85 billion 40%
OTHER POSTEMPLOYMENT BENEFITS (OPEB)
Total unfunded OPEB Funded ratio
Tennessee $1.23 billion 0%
National average $10.21 billion 13%

2
For a complete explanation of the methodology used to calculate Tennessee’s fiscal health rankings, see Eileen Norcross and Olivia Gonzalez, “Ranking the States by Fiscal Condition,” 2016 ed. (Mercatus Research, Mercatus Center at George Mason University, Arlington, VA, June 2016).
36thbudget
solvency
4thtrust fundsolvency
4thlong-runsolvency
10thservice-level
solvency
10thcash
solvency
–3.0
–2.0
–1.0
US average
1.0
2.0
3.0
2.0
–1.0
era
1.0
2.0
3
3
distance fromUS average
(in standard deviations)
UNDERLYING RATIOS
Cash ratio Quick ratioCurrent
ratioOperating
ratio
Surplus (or deficit) per
capitaNet asset
ratio
Long-term liability
ratio
Long-term liability
per capita
Tennessee 3.42 4.54 4.89 1.02 $81 0.13 0.10 $541
National average
2.40 3.18 3.54 1.06 $448 −0.03 0.47 $3,069
Tax-to-income ratio
Revenue-to-income ratio
Expenses-to-income ratio
Pension-to-income ratio
OPEB-to-income ratio
Primary debt-to-income ratio
Tennessee 0.05 0.11 0.10 0.14 0.00 0.01
National average
0.06 0.14 0.13 0.31 0.03 0.06
KEY TERMS
• Cash solvency measures whether a state has enough cash to cover its short-term bills, which include accounts payable, vouchers, warrants, and short-term debt. (Tennessee ranks 10th.)
• Budget solvency measures whether a state can cover its fiscal year spend-ing using current revenues. Did it run a shortfall during the year? (Tennes-see ranks 36th.)
• Long-run solvency measures whether a state has a hedge against large long-term liabilities. Are enough assets available to cushion the state from potential shocks or long-term fiscal risks? (Tennessee ranks 4th.)
• Service-level solvency measures how high taxes, revenues, and spending are when compared to state personal income. Do states have enough “fis-cal slack”? If spending commitments demand more revenues, are states in a good position to increase taxes without harming the economy? Is spend-ing high or low relative to the tax base? (Tennessee ranks 10th.)
• Trust fund solvency measures how much debt a state has. How large are unfunded pension liabilities, OPEB liabilities, and state debt compared to the state personal income? (Tennessee ranks 4th.)

rank 1. Alaska2. Nebraska3. Wyoming4. North Dakota5. South Dakota6. Florida 7. Utah8. Oklahoma9. Tennessee10. Montana11. Ohio12. Idaho13. Nevada14. Missouri15. Alabama16. Texas17. Indiana18. South Carolina19. Virginia20. New Hampshire21. North Carolina22. Colorado23. Georgia24. Washington25. Iowa26. Minnesota27. Kansas28. Arkansas29. Wisconsin30. Oregon31. Arizona32. Mississippi33. Louisiana34. New Mexico35. Michigan36. Vermont37. Rhode Island38. Delaware39. Pennsylvania40. West Virginia41. Maryland42. New York43. Maine44. California45. Hawaii46. Kentucky47. Illinois48. New Jersey49. Massachusetts50. Connecticut51. Puerto Rico
TEXAS
SUMMARY
On the basis of its fiscal solvency in five separate categories, Texas ranks 16th among the US states and Puerto Rico for its fiscal health. On a cash basis, Texas has between 1.29 and 2.15 times the cash needed to cover short-term liabilities. Revenues exceed expenses by 13 percent, for a surplus of $635 per capita. Net assets are 37 percent of total assets, and total liabili-ties are 21 percent of total assets. Total debt is $44.37 billion. Unfunded pension liabilities are $229.72 billion, and other postemployment benefits (OPEB) are $66.95 billion. These three liabilities are equal to 28 percent of total state personal income.
2014 TOTAL LONG-TERM OBLIGATIONSSTATE DEBT
General obligation
bonds
Total primary government
debtState personal
income
Ratio of debt to state personal
incomeTotal primary
debt per capita
Texas $15.82 billion $44.37 billion $1,231.08 billion 3.6% $1,646
National average $6.60 billion $13.76 billion $288.25 billion 6.0% $2,144
PENSION LIABILITY
Unfunded pension liability Funded ratio
Market value of unfunded liability
Market value of funded liability ratio
Texas $39.86 billion 80% $229.72 billion 40%
National average $20.46 billion 74% $86.85 billion 40%
OTHER POSTEMPLOYMENT BENEFITS (OPEB)
Total unfunded OPEB Funded ratio
Texas $66.95 billion 1%
National average $10.21 billion 13%

2
For a complete explanation of the methodology used to calculate Texas’s fiscal health rankings, see Eileen Norcross and Olivia Gonzalez, “Ranking the States by Fiscal Condition,” 2016 ed. (Mercatus Research, Mercatus Center at George Mason University, Arlington, VA, June 2016).
4thbudget
solvency
11thtrust fundsolvency
18thlong-runsolvency
9thservice-level
solvency
33rdcash
solvency
–3.0
–2.0
–1.0
US average
1.0
2.0
3.0
2.0
–1.0
ver
1.0
2.0
3
3
y
distance fromUS average
(in standard deviations)
UNDERLYING RATIOS
Cash ratio Quick ratioCurrent
ratioOperating
ratio
Surplus (or deficit) per
capitaNet asset
ratio
Long-term liability
ratio
Long-term liability
per capita
Texas 1.29 1.78 2.15 1.13 $635 0.37 0.21 $2,072
National average
2.40 3.18 3.54 1.06 $448 −0.03 0.47 $3,069
Tax-to-income ratio
Revenue-to-income ratio
Expenses-to-income ratio
Pension-to-income ratio
OPEB-to-income ratio
Primary debt-to-income ratio
Texas 0.04 0.12 0.10 0.19 0.05 0.04
National average
0.06 0.14 0.13 0.31 0.03 0.06
KEY TERMS
• Cash solvency measures whether a state has enough cash to cover its short-term bills, which include accounts payable, vouchers, warrants, and short-term debt. (Texas ranks 33rd.)
• Budget solvency measures whether a state can cover its fiscal year spend-ing using current revenues. Did it run a shortfall during the year? (Texas ranks 4th.)
• Long-run solvency measures whether a state has a hedge against large long-term liabilities. Are enough assets available to cushion the state from potential shocks or long-term fiscal risks? (Texas ranks 18th.)
• Service-level solvency measures how high taxes, revenues, and spending are when compared to state personal income. Do states have enough “fis-cal slack”? If spending commitments demand more revenues, are states in a good position to increase taxes without harming the economy? Is spend-ing high or low relative to the tax base? (Texas ranks 9th.)
• Trust fund solvency measures how much debt a state has. How large are unfunded pension liabilities, OPEB liabilities, and state debt compared to the state personal income? (Texas ranks 11th.)

rank 1. Alaska2. Nebraska3. Wyoming4. North Dakota5. South Dakota6. Florida 7. Utah8. Oklahoma9. Tennessee10. Montana11. Ohio12. Idaho13. Nevada14. Missouri15. Alabama16. Texas17. Indiana18. South Carolina19. Virginia20. New Hampshire21. North Carolina22. Colorado23. Georgia24. Washington25. Iowa26. Minnesota27. Kansas28. Arkansas29. Wisconsin30. Oregon31. Arizona32. Mississippi33. Louisiana34. New Mexico35. Michigan36. Vermont37. Rhode Island38. Delaware39. Pennsylvania40. West Virginia41. Maryland42. New York43. Maine44. California45. Hawaii46. Kentucky47. Illinois48. New Jersey49. Massachusetts50. Connecticut51. Puerto Rico
UTAH
SUMMARY
On the basis of its fiscal solvency in five separate categories, Utah ranks seventh among the US states and Puerto Rico for its fiscal health. On a cash basis, Utah has between 4.17 and 6.25 times the cash needed to cover short-term liabilities. Revenues exceed expenses by 14 percent, for a surplus of $500 per capita. Net assets are 29 percent of total assets, and total liabilities are 18 percent of total assets. Total debt is $4.90 billion. Unfunded pension liabilities are $29.83 billion on a guaranteed-to-be-paid basis, and other postemployment benefits (OPEB) are $267 million. These three liabilities are equal to 31 percent of total state personal income.
2014 TOTAL LONG-TERM OBLIGATIONSSTATE DEBT
General obligation
bonds
Total primary government
debtState personal
income
Ratio of debt to state personal
incomeTotal primary
debt per capita
Utah $3.27 billion $4.90 billion $110.84 billion 4.4% $1,666
National average $6.60 billion $13.76 billion $288.25 billion 6.0% $2,144
PENSION LIABILITY
Unfunded pension liability Funded ratio
Market value of unfunded liability
Market value of funded liability ratio
Utah $4.55 billion 85% $29.83 billion 46%
National average $20.46 billion 74% $86.85 billion 40%
OTHER POSTEMPLOYMENT BENEFITS (OPEB)
Total unfunded OPEB Funded ratio
Utah $0.27 billion 38%
National average $10.21 billion 13%

2
For a complete explanation of the methodology used to calculate Utah’s fiscal health rankings, see Eileen Norcross and Olivia Gonzalez, “Ranking the States by Fiscal Condition,” 2016 ed. (Mercatus Research, Mercatus Center at George Mason University, Arlington, VA, June 2016).
5thbudget
solvency
26thtrust fundsolvency
16thlong-runsolvency
12thservice-level
solvency
6thcash
solvency
–3.0
–2.0
–1.0
US average
1.0
2.0
3.0
2.0
–1.0
era
1.0
2.0
3
3distance fromUS average
(in standard deviations)
UNDERLYING RATIOS
Cash ratio Quick ratioCurrent
ratioOperating
ratio
Surplus (or deficit) per
capitaNet asset
ratio
Long-term liability
ratio
Long-term liability
per capita
Utah 4.17 5.98 6.25 1.14 $500 0.29 0.18 $1,754
National average
2.40 3.18 3.54 1.06 $448 −0.03 0.47 $3,069
Tax-to-income ratio
Revenue-to-income ratio
Expenses-to-income ratio
Pension-to-income ratio
OPEB-to-income ratio
Primary debt-to-income ratio
Utah 0.06 0.11 0.10 0.27 0.00 0.04
National average
0.06 0.14 0.13 0.31 0.03 0.06
KEY TERMS
• Cash solvency measures whether a state has enough cash to cover its short-term bills, which include accounts payable, vouchers, warrants, and short-term debt. (Utah ranks 6th.)
• Budget solvency measures whether a state can cover its fiscal year spend-ing using current revenues. Did it run a shortfall during the year? (Utah ranks 5th.)
• Long-run solvency measures whether a state has a hedge against large long-term liabilities. Are enough assets available to cushion the state from potential shocks or long-term fiscal risks? (Utah ranks 16th.)
• Service-level solvency measures how high taxes, revenues, and spending are when compared to state personal income. Do states have enough “fis-cal slack”? If spending commitments demand more revenues, are states in a good position to increase taxes without harming the economy? Is spend-ing high or low relative to the tax base? (Utah ranks 12th.)
• Trust fund solvency measures how much debt a state has. How large are unfunded pension liabilities, OPEB liabilities, and state debt compared to the state personal income? (Utah ranks 26th.)

rank 1. Alaska2. Nebraska3. Wyoming4. North Dakota5. South Dakota6. Florida 7. Utah8. Oklahoma9. Tennessee10. Montana11. Ohio12. Idaho13. Nevada14. Missouri15. Alabama16. Texas17. Indiana18. South Carolina19. Virginia20. New Hampshire21. North Carolina22. Colorado23. Georgia24. Washington25. Iowa26. Minnesota27. Kansas28. Arkansas29. Wisconsin30. Oregon31. Arizona32. Mississippi33. Louisiana34. New Mexico35. Michigan36. Vermont37. Rhode Island38. Delaware39. Pennsylvania40. West Virginia41. Maryland42. New York43. Maine44. California45. Hawaii46. Kentucky47. Illinois48. New Jersey49. Massachusetts50. Connecticut51. Puerto Rico
VERMONT
SUMMARY
On the basis of its fiscal solvency in five separate categories, Vermont ranks 36th among the US states and Puerto Rico for its fiscal health. On a cash basis, Vermont has between 1.28 and 2.23 times the cash needed to cover short-term liabilities. Revenues exceed expenses by 3 percent, for a sur-plus of $269 per capita. On a long-run basis, Vermont has a negative net asset ratio of −0.03, and total liabilities are 38 percent of total assets. Total debt is $595 million. Unfunded pension liabilities are $4.48 billion on a guaranteed-to-be-paid basis, and other postemployment benefits (OPEB) are $1.84 billion. These three liabilities are equal to 23 percent of total state personal income.
2014 TOTAL LONG-TERM OBLIGATIONSSTATE DEBT
General obligation
bonds
Total primary government
debtState personal
income
Ratio of debt to state personal
incomeTotal primary
debt per capita
Vermont $0.56 billion $0.60 billion $29.09 billion 2.0% $950
National average $6.60 billion $13.76 billion $288.25 billion 6.0% $2,144
PENSION LIABILITY
Unfunded pension liability Funded ratio
Market value of unfunded liability
Market value of funded liability ratio
Vermont $1.60 billion 68% $4.48 billion 45%
National average $20.46 billion 74% $86.85 billion 40%
OTHER POSTEMPLOYMENT BENEFITS (OPEB)
Total unfunded OPEB Funded ratio
Vermont $1.84 billion 1%
National average $10.21 billion 13%

2
For a complete explanation of the methodology used to calculate Vermont’s fiscal health rankings, see Eileen Norcross and Olivia Gonzalez, “Ranking the States by Fiscal Condition,” 2016 ed. (Mercatus Research, Mercatus Center at George Mason University, Arlington, VA, June 2016).
27thbudget
solvency
6thtrust fundsolvency
34thlong-runsolvency
47thservice-level
solvency
30thcash
solvency
–3.0
–2.0
–1.0
US average
1.0
2.0
3.0
2.0
–1.0
era
1.0
2.0
3
3distance fromUS average
(in standard deviations)
UNDERLYING RATIOS
Cash ratio Quick ratioCurrent
ratioOperating
ratio
Surplus (or deficit) per
capitaNet asset
ratio
Long-term liability
ratio
Long-term liability
per capita
Vermont 1.28 2.19 2.23 1.03 $269 −0.03 0.38 $2,335
National average
2.40 3.18 3.54 1.06 $448 −0.03 0.47 $3,069
Tax-to-income ratio
Revenue-to-income ratio
Expenses-to-income ratio
Pension-to-income ratio
OPEB-to-income ratio
Primary debt-to-income ratio
Vermont 0.10 0.19 0.19 0.15 0.06 0.02
National average
0.06 0.14 0.13 0.31 0.03 0.06
KEY TERMS
• Cash solvency measures whether a state has enough cash to cover its short-term bills, which include accounts payable, vouchers, warrants, and short-term debt. (Vermont ranks 30th.)
• Budget solvency measures whether a state can cover its fiscal year spend-ing using current revenues. Did it run a shortfall during the year? (Ver-mont ranks 27th.)
• Long-run solvency measures whether a state has a hedge against large long-term liabilities. Are enough assets available to cushion the state from potential shocks or long-term fiscal risks? (Vermont ranks 34th.)
• Service-level solvency measures how high taxes, revenues, and spending are when compared to state personal income. Do states have enough “fis-cal slack”? If spending commitments demand more revenues, are states in a good position to increase taxes without harming the economy? Is spend-ing high or low relative to the tax base? (Vermont ranks 47th.)
• Trust fund solvency measures how much debt a state has. How large are unfunded pension liabilities, OPEB liabilities, and state debt compared to the state personal income? (Vermont ranks 6th.)

rank 1. Alaska2. Nebraska3. Wyoming4. North Dakota5. South Dakota6. Florida 7. Utah8. Oklahoma9. Tennessee10. Montana11. Ohio12. Idaho13. Nevada14. Missouri15. Alabama16. Texas17. Indiana18. South Carolina19. Virginia20. New Hampshire21. North Carolina22. Colorado23. Georgia24. Washington25. Iowa26. Minnesota27. Kansas28. Arkansas29. Wisconsin30. Oregon31. Arizona32. Mississippi33. Louisiana34. New Mexico35. Michigan36. Vermont37. Rhode Island38. Delaware39. Pennsylvania40. West Virginia41. Maryland42. New York43. Maine44. California45. Hawaii46. Kentucky47. Illinois48. New Jersey49. Massachusetts50. Connecticut51. Puerto Rico
VIRGINIA
SUMMARY
On the basis of its fiscal solvency in five separate categories, Virginia ranks 19th among the US states and Puerto Rico for its fiscal health. On a cash basis, Virginia has between 1.63 and 2.40 times the cash needed to cover short-term liabilities. Revenues exceed expenses by 3 percent, for a sur-plus of $151 per capita. Virginia’s net asset ratio of −0.005 indicates that the state has no assets remaining after meeting its debts. Total liabilities are 30 percent of total assets. Total debt is $6.86 billion. Unfunded pension liabilities are $87.66 billion, and other postemployment benefits (OPEB) are $5.19 billion. These three liabilities are equal to 24 percent of total state personal income.
2014 TOTAL LONG-TERM OBLIGATIONSSTATE DEBT
General obligation
bonds
Total primary government
debtState personal
income
Ratio of debt to state personal
incomeTotal primary
debt per capita
Virginia $0.74 billion $6.86 billion $419.18 billion 1.6% $823
National average $6.60 billion $13.76 billion $288.25 billion 6.0% $2,144
PENSION LIABILITY
Unfunded pension liability Funded ratio
Market value of unfunded liability
Market value of funded liability ratio
Virginia $26.27 billion 69% $87.66 billion 40%
National average $20.46 billion 74% $86.85 billion 40%
OTHER POSTEMPLOYMENT BENEFITS (OPEB)
Total unfunded OPEB Funded ratio
Virginia $5.19 billion 21%
National average $10.21 billion 13%

2
For a complete explanation of the methodology used to calculate Virginia’s fiscal health rankings, see Eileen Norcross and Olivia Gonzalez, “Ranking the States by Fiscal Condition,” 2016 ed. (Mercatus Research, Mercatus Center at George Mason University, Arlington, VA, June 2016).
28thbudget
solvency
14thtrust fundsolvency
26thlong-runsolvency
5thservice-level
solvency
28thcash
solvency
–3.0
–2.0
–1.0
US average
1.0
2.0
3.0
2.0
–1.0
ver
1.0
2.0
3
3
26th
distance fromUS average
(in standard deviations)
UNDERLYING RATIOS
Cash ratio Quick ratioCurrent
ratioOperating
ratio
Surplus (or deficit) per
capitaNet asset
ratio
Long-term liability
ratio
Long-term liability
per capita
Virginia 1.63 2.33 2.40 1.03 $151 −0.005 0.30 $1,476
National average
2.40 3.18 3.54 1.06 $448 −0.03 0.47 $3,069
Tax-to-income ratio
Revenue-to-income ratio
Expenses-to-income ratio
Pension-to-income ratio
OPEB-to-income ratio
Primary debt-to-income ratio
Virginia 0.05 0.09 0.09 0.21 0.01 0.02
National average
0.06 0.14 0.13 0.31 0.03 0.06
KEY TERMS
• Cash solvency measures whether a state has enough cash to cover its short-term bills, which include accounts payable, vouchers, warrants, and short-term debt. (Virginia ranks 28th.)
• Budget solvency measures whether a state can cover its fiscal year spend-ing using current revenues. Did it run a shortfall during the year? (Virginia ranks 28th.)
• Long-run solvency measures whether a state has a hedge against large long-term liabilities. Are enough assets available to cushion the state from potential shocks or long-term fiscal risks? (Virginia ranks 26th.)
• Service-level solvency measures how high taxes, revenues, and spending are when compared to state personal income. Do states have enough “fis-cal slack”? If spending commitments demand more revenues, are states in a good position to increase taxes without harming the economy? Is spend-ing high or low relative to the tax base? (Virginia ranks 5th.)
• Trust fund solvency measures how much debt a state has. How large are unfunded pension liabilities, OPEB liabilities, and state debt compared to the state personal income? (Virginia ranks 14th.)

rank 1. Alaska2. Nebraska3. Wyoming4. North Dakota5. South Dakota6. Florida 7. Utah8. Oklahoma9. Tennessee10. Montana11. Ohio12. Idaho13. Nevada14. Missouri15. Alabama16. Texas17. Indiana18. South Carolina19. Virginia20. New Hampshire21. North Carolina22. Colorado23. Georgia24. Washington25. Iowa26. Minnesota27. Kansas28. Arkansas29. Wisconsin30. Oregon31. Arizona32. Mississippi33. Louisiana34. New Mexico35. Michigan36. Vermont37. Rhode Island38. Delaware39. Pennsylvania40. West Virginia41. Maryland42. New York43. Maine44. California45. Hawaii46. Kentucky47. Illinois48. New Jersey49. Massachusetts50. Connecticut51. Puerto Rico
WASHINGTON
SUMMARY
On the basis of its fiscal solvency in five separate categories, Washington ranks 24th among the US states and Puerto Rico for its fiscal health. On a cash basis, Washington has between 1.74 and 3.65 times the cash needed to cover short-term liabilities. Revenues exceed expenses by 4 percent, for a surplus of $258 per capita. On a long-run basis, net assets are 3 percent of total assets, and total liabilities are 66 percent of total assets, for a long-term liability per capita of $7,922. Total debt is $24.14 billion. Unfunded pension liabilities are $81.54 billion on a guaranteed-to-be-paid basis, and other postemployment benefits (OPEB) are $3.71 billion. These liabilities are equal to 31 percent of total state personal income.
2014 TOTAL LONG-TERM OBLIGATIONSSTATE DEBT
General obligation
bonds
Total primary government
debtState personal
income
Ratio of debt to state personal
incomeTotal primary
debt per capita
Washington $19.38 billion $24.14 billion $350.32 billion 6.9% $3,419
National average $6.60 billion $13.76 billion $288.25 billion 6.0% $2,144
PENSION LIABILITY
Unfunded pension liability Funded ratio
Market value of unfunded liability
Market value of funded liability ratio
Washington $9.86 billion 87% $81.54 billion 46%
National average $20.46 billion 74% $86.85 billion 40%
OTHER POSTEMPLOYMENT BENEFITS (OPEB)
Total unfunded OPEB Funded ratio
Washington $3.71 billion 0%
National average $10.21 billion 13%

2
For a complete explanation of the methodology used to calculate Washington’s fiscal health rankings, see Eileen Norcross and Olivia Gonzalez, “Ranking the States by Fiscal Condition,” 2016 ed. (Mercatus Research, Mercatus Center at George Mason University, Arlington, VA, June 2016).
25thbudget
solvency
19thtrust fundsolvency
41stlong-runsolvency
26thservice-level
solvency
18thcash
solvency
–3.0
–2.0
–1.0
US average
1.0
2.0
3.0
2.0
–1.0
av
1.0
2.0
3
3
trust fund
distance fromUS average
(in standard deviations)
UNDERLYING RATIOS
Cash ratio Quick ratioCurrent
ratioOperating
ratio
Surplus (or deficit) per
capitaNet asset
ratio
Long-term liability
ratio
Long-term liability
per capita
Washington 1.74 2.89 3.65 1.04 $258 0.03 0.66 $7,922
National average
2.40 3.18 3.54 1.06 $448 −0.03 0.47 $3,069
Tax-to-income ratio
Revenue-to-income ratio
Expenses-to-income ratio
Pension-to-income ratio
OPEB-to-income ratio
Primary debt-to-income ratio
Washington 0.05 0.13 0.13 0.23 0.01 0.07
National average
0.06 0.14 0.13 0.31 0.03 0.06
KEY TERMS
• Cash solvency measures whether a state has enough cash to cover its short-term bills, which include accounts payable, vouchers, warrants, and short-term debt. (Washington ranks 18th.)
• Budget solvency measures whether a state can cover its fiscal year spend-ing using current revenues. Did it run a shortfall during the year? (Wash-ington ranks 25th.)
• Long-run solvency measures whether a state has a hedge against large long-term liabilities. Are enough assets available to cushion the state from potential shocks or long-term fiscal risks? (Washington ranks 41st.)
• Service-level solvency measures how high taxes, revenues, and spending are when compared to state personal income. Do states have enough “fis-cal slack”? If spending commitments demand more revenues, are states in a good position to increase taxes without harming the economy? Is spend-ing high or low relative to the tax base? (Washington ranks 26th.)
• Trust fund solvency measures how much debt a state has. How large are unfunded pension liabilities, OPEB liabilities, and state debt compared to the state personal income? (Washington ranks 19th.)

rank 1. Alaska2. Nebraska3. Wyoming4. North Dakota5. South Dakota6. Florida 7. Utah8. Oklahoma9. Tennessee10. Montana11. Ohio12. Idaho13. Nevada14. Missouri15. Alabama16. Texas17. Indiana18. South Carolina19. Virginia20. New Hampshire21. North Carolina22. Colorado23. Georgia24. Washington25. Iowa26. Minnesota27. Kansas28. Arkansas29. Wisconsin30. Oregon31. Arizona32. Mississippi33. Louisiana34. New Mexico35. Michigan36. Vermont37. Rhode Island38. Delaware39. Pennsylvania40. West Virginia41. Maryland42. New York43. Maine44. California45. Hawaii46. Kentucky47. Illinois48. New Jersey49. Massachusetts50. Connecticut51. Puerto Rico
WEST VIRGINIA
SUMMARY
On the basis of its fiscal solvency in five separate categories, West Virginia ranks 40th among the US states and Puerto Rico for its fiscal health. On a cash basis, West Virginia has between 1.50 and 2.02 times the cash needed to cover short-term liabilities. Revenues exceed expenses by 2 percent, for a surplus of $131 per capita. Net assets are 12 percent of total assets, and total liabilities are 23 percent of total assets. Total debt is $2.07 billion. Unfunded pension liabilities are $19.82 billion on a guaranteed-to-be-paid basis, and other postemployment benefits (OPEB) are $2.73 billion. These three liabilities are equal to 37 percent of total state personal income.
2014 TOTAL LONG-TERM OBLIGATIONSSTATE DEBT
General obligation
bonds
Total primary government
debtState personal
income
Ratio of debt to state personal
incomeTotal primary
debt per capita
West Virginia $0.46 billion $2.07 billion $66.86 billion 3.1% $1,119
National average $6.60 billion $13.76 billion $288.25 billion 6.0% $2,144
PENSION LIABILITY
Unfunded pension liability Funded ratio
Market value of unfunded liability
Market value of funded liability ratio
West Virginia $5.55 billion 67% $19.82 billion 37%
National average $20.46 billion 74% $86.85 billion 40%
OTHER POSTEMPLOYMENT BENEFITS (OPEB)
Total unfunded OPEB Funded ratio
West Virginia $2.73 billion 20%
National average $10.21 billion 13%

2
For a complete explanation of the methodology used to calculate West Virginia’s fiscal health rankings, see Eileen Norcross and Olivia Gonzalez, “Ranking the States by Fiscal Condition,” 2016 ed. (Mercatus Research, Mercatus Center at George Mason University, Arlington, VA, June 2016).
32ndbudget
solvency
30thtrust fundsolvency
28thlong-runsolvency
45thservice-level
solvency
32ndcash
solvency
–3.0
–2.0
–1.0
US average
1.0
2.0
3.0
2.0
–1.0
av
1.0
2.0
3
3
28th
distance fromUS average
(in standard deviations)
UNDERLYING RATIOS
Cash ratio Quick ratioCurrent
ratioOperating
ratio
Surplus (or deficit) per
capitaNet asset
ratio
Long-term liability
ratio
Long-term liability
per capita
West Virginia
1.50 1.79 2.02 1.02 $131 0.12 0.23 $2,348
National average
2.40 3.18 3.54 1.06 $448 −0.03 0.47 $3,069
Tax-to-income ratio
Revenue-to-income ratio
Expenses-to-income ratio
Pension-to-income ratio
OPEB-to-income ratio
Primary debt-to-income ratio
West Virginia
0.08 0.18 0.18 0.30 0.04 0.03
National average
0.06 0.14 0.13 0.31 0.03 0.06
KEY TERMS
• Cash solvency measures whether a state has enough cash to cover its short-term bills, which include accounts payable, vouchers, warrants, and short-term debt. (West Virginia ranks 32nd.)
• Budget solvency measures whether a state can cover its fiscal year spend-ing using current revenues. Did it run a shortfall during the year? (West Virginia ranks 32nd.)
• Long-run solvency measures whether a state has a hedge against large long-term liabilities. Are enough assets available to cushion the state from potential shocks or long-term fiscal risks? (West Virginia ranks 28th.)
• Service-level solvency measures how high taxes, revenues, and spending are when compared to state personal income. Do states have enough “fis-cal slack”? If spending commitments demand more revenues, are states in a good position to increase taxes without harming the economy? Is spend-ing high or low relative to the tax base? (West Virginia ranks 45th.)
• Trust fund solvency measures how much debt a state has. How large are unfunded pension liabilities, OPEB liabilities, and state debt compared to the state personal income? (West Virginia ranks 30th.)

rank 1. Alaska2. Nebraska3. Wyoming4. North Dakota5. South Dakota6. Florida 7. Utah8. Oklahoma9. Tennessee10. Montana11. Ohio12. Idaho13. Nevada14. Missouri15. Alabama16. Texas17. Indiana18. South Carolina19. Virginia20. New Hampshire21. North Carolina22. Colorado23. Georgia24. Washington25. Iowa26. Minnesota27. Kansas28. Arkansas29. Wisconsin30. Oregon31. Arizona32. Mississippi33. Louisiana34. New Mexico35. Michigan36. Vermont37. Rhode Island38. Delaware39. Pennsylvania40. West Virginia41. Maryland42. New York43. Maine44. California45. Hawaii46. Kentucky47. Illinois48. New Jersey49. Massachusetts50. Connecticut51. Puerto Rico
WISCONSIN
SUMMARY
On the basis of its fiscal solvency in five separate categories, Wisconsin ranks 29th among the US states and Puerto Rico for its fiscal health. Wis-consin has between 0.94 and 1.95 times the cash needed to cover short-term liabilities. Revenues exceed expenses by 6 percent, for a surplus of $374 per capita. On a long-run basis, Wisconsin has a negative net asset ratio of −0.06, indicating the use of debt financing. Total liabilities are 37 percent of total assets. Total debt is $13.65 billion. Unfunded pension liabilities are $34.88 billion on a guaranteed-to-be-paid basis, and other postemployment benefits (OPEB) are $892 million. These three liabilities are equal to 19 percent of total state personal income.
2014 TOTAL LONG-TERM OBLIGATIONSSTATE DEBT
General obligation
bonds
Total primary government
debtState personal
income
Ratio of debt to state personal
incomeTotal primary
debt per capita
Wisconsin $7.26 billion $13.65 billion $254.40 billion 5.4% $2,371
National average $6.60 billion $13.76 billion $288.25 billion 6.0% $2,144
PENSION LIABILITY
Unfunded pension liability Funded ratio
Market value of unfunded liability
Market value of funded liability ratio
Wisconsin $0.03 billion 100% $34.88 billion 72%
National average $20.46 billion 74% $86.85 billion 40%
OTHER POSTEMPLOYMENT BENEFITS (OPEB)
Total unfunded OPEB Funded ratio
Wisconsin $0.89 billion 0%
National average $10.21 billion 13%

2
For a complete explanation of the methodology used to calculate Wisconsin’s fiscal health rankings, see Eileen Norcross and Olivia Gonzalez, “Ranking the States by Fiscal Condition,” 2016 ed. (Mercatus Research, Mercatus Center at George Mason University, Arlington, VA, June 2016).
12thbudget
solvency
3rdtrust fundsolvency
37thlong-runsolvency
39thservice-level
solvency
36thcash
solvency
–3.0
–2.0
–1.0
US average
1.0
2.0
3.0
2.0
–1.0
av
1.0
2.0
3
3
budget
distance fromUS average
(in standard deviations)
UNDERLYING RATIOS
Cash ratio Quick ratioCurrent
ratioOperating
ratio
Surplus (or deficit) per
capitaNet asset
ratio
Long-term liability
ratio
Long-term liability
per capita
Wisconsin 0.94 1.89 1.95 1.06 $374 −0.06 0.37 $2,701
National average
2.40 3.18 3.54 1.06 $448 −0.03 0.47 $3,069
Tax-to-income ratio
Revenue-to-income ratio
Expenses-to-income ratio
Pension-to-income ratio
OPEB-to-income ratio
Primary debt-to-income ratio
Wisconsin 0.09 0.14 0.13 0.14 0.00 0.05
National average
0.06 0.14 0.13 0.31 0.03 0.06
KEY TERMS
• Cash solvency measures whether a state has enough cash to cover its short-term bills, which include accounts payable, vouchers, warrants, and short-term debt. (Wisconsin ranks 36th.)
• Budget solvency measures whether a state can cover its fiscal year spend-ing using current revenues. Did it run a shortfall during the year? (Wiscon-sin ranks 12th.)
• Long-run solvency measures whether a state has a hedge against large long-term liabilities. Are enough assets available to cushion the state from potential shocks or long-term fiscal risks? (Wisconsin ranks 37th.)
• Service-level solvency measures how high taxes, revenues, and spending are when compared to state personal income. Do states have enough “fis-cal slack”? If spending commitments demand more revenues, are states in a good position to increase taxes without harming the economy? Is spend-ing high or low relative to the tax base? (Wisconsin ranks 39th.)
• Trust fund solvency measures how much debt a state has. How large are unfunded pension liabilities, OPEB liabilities, and state debt compared to the state personal income? (Wisconsin ranks 3rd.)

rank 1. Alaska2. Nebraska3. Wyoming4. North Dakota5. South Dakota6. Florida 7. Utah8. Oklahoma9. Tennessee10. Montana11. Ohio12. Idaho13. Nevada14. Missouri15. Alabama16. Texas17. Indiana18. South Carolina19. Virginia20. New Hampshire21. North Carolina22. Colorado23. Georgia24. Washington25. Iowa26. Minnesota27. Kansas28. Arkansas29. Wisconsin30. Oregon31. Arizona32. Mississippi33. Louisiana34. New Mexico35. Michigan36. Vermont37. Rhode Island38. Delaware39. Pennsylvania40. West Virginia41. Maryland42. New York43. Maine44. California45. Hawaii46. Kentucky47. Illinois48. New Jersey49. Massachusetts50. Connecticut51. Puerto Rico
WYOMING
SUMMARY
On the basis of its fiscal solvency in five separate categories, Wyoming ranks third among the US states and Puerto Rico for its fiscal health. Wyo-ming has between 4.17 and 5.32 times the cash needed to cover short-term liabilities. Revenues exceed expenses by 48 percent, producing a surplus $3,625 per capita. Net assets are 71 percent of total assets, and total lia-bilities are 7 percent of total assets. Total debt is $29 million. Unfunded pension liabilities are $10.53 billion on a guaranteed-to-be-paid basis, and other postemployment benefits (OPEB) are $244 million. These three lia-bilities are equal to 34 percent of total state personal income.
2014 TOTAL LONG-TERM OBLIGATIONSSTATE DEBT
General obligation
bonds
Total primary government
debtState personal
income
Ratio of debt to state personal
incomeTotal primary
debt per capita
Wyoming $0.00 billion $0.03 billion $31.89 billion 0.1% $50
National average $6.60 billion $13.76 billion $288.25 billion 6.0% $2,144
PENSION LIABILITY
Unfunded pension liability Funded ratio
Market value of unfunded liability
Market value of funded liability ratio
Wyoming $1.90 billion 80% $10.53 billion 42%
National average $20.46 billion 74% $86.85 billion 40%
OTHER POSTEMPLOYMENT BENEFITS (OPEB)
Total unfunded OPEB Funded ratio
Wyoming $0.24 billion 0%
National average $10.21 billion 13%

2
For a complete explanation of the methodology used to calculate Wyoming’s fiscal health rankings, see Eileen Norcross and Olivia Gonzalez, “Ranking the States by Fiscal Condition,” 2016 ed. (Mercatus Research, Mercatus Center at George Mason University, Arlington, VA, June 2016).
2ndbudget
solvency
7thtrust fundsolvency
7thlong-runsolvency
44thservice-level
solvency
8thcash
solvency
–3.0
–2.0
–1.0
US average
1.0
2.0
3.0
2.0
–1.0
ra
1.0
2.0
3
3
distance fromUS average
(in standard deviations)
UNDERLYING RATIOS
Cash ratio Quick ratioCurrent
ratioOperating
ratio
Surplus (or deficit) per
capitaNet asset
ratio
Long-term liability
ratio
Long-term liability
per capita
Wyoming 4.17 4.44 5.32 1.48 $3,625 0.71 0.07 $2,865
National average
2.40 3.18 3.54 1.06 $448 −0.03 0.47 $3,069
Tax-to-income ratio
Revenue-to-income ratio
Expenses-to-income ratio
Pension-to-income ratio
OPEB-to-income ratio
Primary debt-to-income ratio
Wyoming 0.09 0.20 0.14 0.33 0.01 0.00
National average
0.06 0.14 0.13 0.31 0.03 0.06
KEY TERMS
• Cash solvency measures whether a state has enough cash to cover its short-term bills, which include accounts payable, vouchers, warrants, and short-term debt. (Wyoming ranks 8th.)
• Budget solvency measures whether a state can cover its fiscal year spend-ing using current revenues. Did it run a shortfall during the year? (Wyo-ming ranks 2nd.)
• Long-run solvency measures whether a state has a hedge against large long-term liabilities. Are enough assets available to cushion the state from potential shocks or long-term fiscal risks? (Wyoming ranks 7th.)
• Service-level solvency measures how high taxes, revenues, and spending are when compared to state personal income. Do states have enough “fis-cal slack”? If spending commitments demand more revenues, are states in a good position to increase taxes without harming the economy? Is spend-ing high or low relative to the tax base? (Wyoming ranks 44th.)
• Trust fund solvency measures how much debt a state has. How large are unfunded pension liabilities, OPEB liabilities, and state debt compared to the state personal income? (Wyoming ranks 7th.)