Ranking of Brazilian multinationals finds internationalization steadily...
12
Page 1 of 12 Ranking of Brazilian multinationals finds internationalization steadily increasing SOBEET, Valor and VCC release the 2009 ranking of Brazilian outward investors. Report dated October 29, 2009 EMBARGO: The contents of this report must not be quoted or summarized in the print, broadcast or electronic media before October 29, 2009, 8 a.m. São Paulo; 6 a.m. New York; and 10 a.m. GMT. São Paulo and New York: Sociedade Brasileira de Estudos e Empresas Transnacionais e da Globalização Econômica (SOBEET), a Brazilian think tank dedicated to research into the internationalization of the Brazilian economy; Valor Econômico, Brazil’s premier business newspaper; and the Vale Columbia Center on Sustainable International Investment, a joint undertaking of the Columbia Law School and The Earth Institute at Columbia University in New York, are releasing the results of a survey of outward investors from Brazil today. The survey, conducted in 2009, covers the period 2006-2008. It focussed on companies that a) had their head office in Brazil, b) exercised management control over at least one foreign affiliate in another country, and c) held outward foreign direct investment (OFDI) stock of at least USD 10 million. The purpose of the survey was to broaden our understanding of the internationalization of Brazilian companies, and to trace the evolution of this process over the last few years. This report thus includes a ranking of Brazilian multinationals based on their internationalization index, as well as one based on their foreign assets. The internationalization index represents the arithmetical average of three ratios: foreign to total assets, foreign to total sales, and foreign to total employees. Note that foreign sales in this report do not include exports. Questionnaires were sent to nearly 200 Brazilian multinationals. 1 The final ranking presented here includes 57 companies. Apart from the information needed to calculate the internationalization index, qualitative information regarding the motivations and characteristics of, and barriers to, the internationalization process of Brazilian companies was also sought, as was information about the OFDI intentions of the companies. 1 In the case of companies that appeared among the top 20 in the Valor ranking published in 2008 but did not respond to the present survey, the rankings in this year’s list are based on the companies’ financial statements for fiscal 2008.
Transcript of Ranking of Brazilian multinationals finds internationalization steadily...

Page 1 of 12
Ranking of Brazilian multinationals finds internationalization steadily increasing
SOBEET, Valor and VCC release the 2009 ranking of Brazilian outward investors.
Report dated October 29, 2009
EMBARGO: The contents of this report must not be quoted or summarized in the
print, broadcast or electronic media before October 29, 2009, 8 a.m. São Paulo; 6 a.m. New York; and 10 a.m. GMT.
São Paulo and New York: Sociedade Brasileira de Estudos e Empresas Transnacionais e da Globalização
Econômica (SOBEET), a Brazilian think tank dedicated to research into the internationalization of the Brazilian economy; Valor Econômico, Brazil’s premier business newspaper; and the Vale Columbia Center on Sustainable International Investment, a joint undertaking of the Columbia Law School and The Earth Institute at Columbia University in New York, are releasing the results of a survey of outward investors from Brazil today. The survey, conducted in 2009, covers the period 2006-2008. It focussed on companies that a) had their head office in Brazil, b) exercised management control over at least one foreign affiliate in another country, and c) held outward foreign direct investment (OFDI) stock of at least USD 10 million. The purpose of the survey was to broaden our understanding of the internationalization of Brazilian companies, and to trace the evolution of this process over the last few years. This report thus includes a ranking of Brazilian multinationals based on their internationalization index, as well as one based on their foreign assets. The internationalization index represents the arithmetical average of three ratios: foreign to total assets, foreign to total sales, and foreign to total employees. Note that foreign sales in this report do not include exports. Questionnaires were sent to nearly 200 Brazilian multinationals.1 The final ranking presented here includes 57 companies. Apart from the information needed to calculate the internationalization index, qualitative information regarding the motivations and characteristics of, and barriers to, the internationalization process of Brazilian companies was also sought, as was information about the OFDI intentions of the companies.
1 In the case of companies that appeared among the top 20 in the Valor ranking published in 2008 but did not
respond to the present survey, the rankings in this year’s list are based on the companies’ financial statements for fiscal 2008.

Page 2 of 12
SOME KEY FINDINGS
The 57 listed Brazilian MNEs together had about USD 21 billion in foreign assets, just over USD 40 billion in foreign sales, and nearly 158,500 foreign employees in 2008.
JBS Friboi came first in the ranking by the internationalization index and sixth in the ranking by foreign assets, with 56% of its assets held abroad. Gerdau (Grupo) was first in the ranking by foreign assets, with 61% of its assets held abroad, and third in the ranking by the internationalization index. (Table 1)
The average internationalization index for the listed companies rose from 14,9 in 2006 to 16.7 in 2007 and to 17,4 in 2008.
The internationalization of Brazilian companies is dominated by the private sector, although state-owned enterprises also play a role. Just one company in our list of 57, Petrobras, is from the public sector.
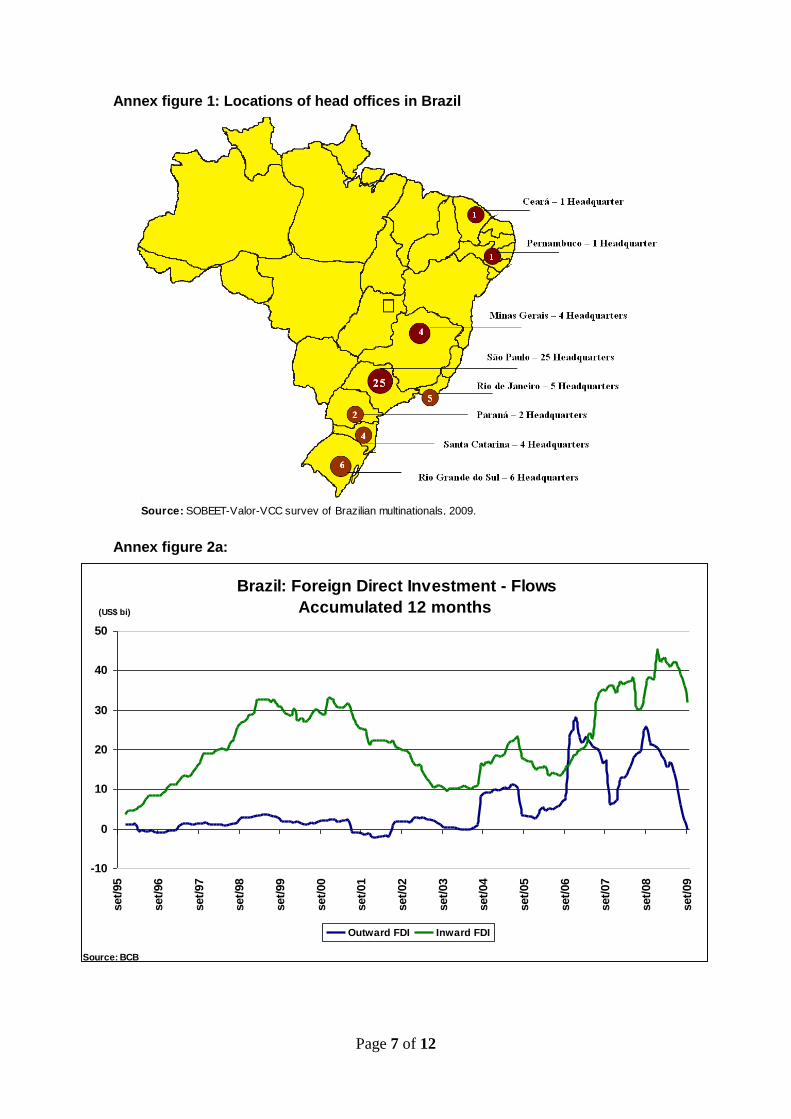
The global economic crisis has had a major impact on Brazilian OFDI flows (annex figures 2a and 2b). On the other hand, investment intentions remain strongly positive, with nearly 75% of companies planning either an increase in OFDI next year [39%] or no change (35%) – see annex figure 11.
Table 1. Ranking of Brazilian multinationals investing abroad, 2008
Name Industry Ranking by Foreign
assets
/ total
assets
Foreign
assets
Internation-
alization index
JBS Friboi Crop and animal production 6 1 55.9
Odebrecht Construction of buildings - 2 55.9
Gerdau (Grupo) Manufacture of basic metals 1 3 60.9
Metalfrio Manufacture of machinery and equipment 25 4 68.7
Coteminas (Springs Global)
Manufacture of textiles 17 5 19.5
Ibope Information service activities - 6 33.0
Sabó Manufacture of other transport
equipment
18 7 38.5
Magnesita Manufacture of other non-metallic mineral products
12 8 64.2
Marfrig Crop and animal production 7 9 26.2
AmBev Manufacture of beverages 4 10 12.0
Vale do Rio
Doce
Mining of metal ores 2 11 38.9
Artecola Holding 27 12 30.6
Marcopolo Manufacture of other transport equipment
16 13 16.3
WEG Manufacture of electrical equipment 11 14 17.6
Gol Air transport 9 15 58.8
Embraer Other manufacturing 10 16 39.4
Duratex Specialized construction activities 22 17 4.1
Itautec Manufacture of computer, electronic and optical products
19 18 19.7
Camargo
Corrêa (Grupo)
Conglomerate 8 19 16.2

Page 3 of 12
Stefanini Computer programming, consultancy and related activities
34 20 18.3
Votorantim
(Grupo)
Conglomerate 3 21 22.2
Construtora
Andrade
Gutierrez
Construction of buildings 14 22 11.4
Tupy Manufacture of fabricated metal products,
except machinery and equipment
15 23 19.8
CI&T Computer programming, consultancy and related activities
40 24 16.6
TAM Air transport - 25 0.0
Bertin Manufacture of food products 13 26 7.0
All América Warehousing and support activities for
transportation
- 27 0.0
Petrobras Extraction of crude petroleum and natural gas
31 28 11.3
Natura Manufacture of chemicals and chemical
products
28 29 2.5
CSN Mining of metal ores 5 30 12.9
G Brasil Holding 33 31 7.3
Perdigão Manufacture of food products 44 32 11.0
Acumuladores
Moura
Manufacture of electrical equipment 30 33 8.6
Indústrias Romi Manufacture of machinery and equipment 32 34 2.0
Agrale Manufacture of motor vehicles, trailers
and semi-trailers
42 35 14.0
Alusa Civil engineering - 36 0.0
Aracruz Manufacture of paper and paper products 20 37 16.9
Portobelo Manufacture of other non-metallic mineral
products
36 38 3.4
Banco Itaú Financial and insurance activities - 39 10.4
Totvs Computer programming, consultancy and related activities
39 40 1.7
Bematech Manufacture of electrical equipment 38 41 1.5
Braskem Manufacture of chemicals and chemical
products
24 42 1.0
DHB Manufacture of other transport equipment
41 43 4.6
Módulo Security
Solutions
Computer programming, consultancy and
related activities
45 44 3.6
Altus Manufacture of electrical equipment 43 45 3.5
Inplac Manufacture of rubber and plastics products
- 46 0.0
Iochpe Maxion Manufacture of other transport equipment
26 47 0.1
Minerva Manufacture of food products 35 48 0.8
M. Dias Branco Manufacture of food products 23 49 5.1
Marisol Manufacture of textiles 37 50 2.6
Suzano Manufacture of paper and paper products - 51 0.0
Klabin Manufacture of paper and paper products - 52 0.0
Sadia Manufacture os food products 21 53 1.2
Romagnole Manufacture of electrical equipment 46 54 0.4
Banco do Brasil Financial and insurance activities - 55 0.0
Telemar Telecommunications 47 56 0.2
Cemig Electricity, gas, steam and air conditioning supply
29 57 0.1
Source: SOBEET-Valor-VCC survey of Brazilian multinationals, 2009.

Page 4 of 12
OTHER FINDINGS Distribution by industry - The 57 companies on our list are from 28 different industries: in manufacturing, the manufacture of transport equipment, food products, basic metals, chemicals products, textiles, and electrical equipment; in services, computer programming and consultancy; in the primary sector, crop and animal production, and petroleum and natural gas extraction; among other activities (see table 1 above). Note, however, that the pattern of industry distribution in our list may not necessarily be the pattern of distribution of Brazil’s OFDI. Central Bank data show current Brazilian OFDI as concentrated in the service sector. Caution is in order about these figures, though, as it is difficult in Brazilian outflows to separate authentic FDI from purely financial investment under the guise of FDI.2 Moreover, since much of Brazil’s OFDI goes into tax havens in the first instance, it is also not easy to know where and in what activity this investment ultimately ends up.
Localization. The head offices of 25 of the companies on the list selected are located in the state of São Paulo, while the rest are based in the states of Rio Grande do Sul (6), Rio de Janeiro (5), Santa Catarina (4) Minas Gerais (4), Paraná (2), Ceará (1) and Pernambuco (1) (see annex figure 1.) Impact of the crisis on Brazilian OFDI. There is no doubt that Brazilian multinationals are being severely hit by the international crisis. This explains why Brazilian OFDI flows is being reduced during 2009 (see annex figure 2). According to our survey, less than 2% of the companies have not been affected by the crisis. The majority, 54%, are facing lower demand for their products, besides lower prices and less credit for their international operations. About 5% of the companies see the crisis bringing new opportunities in their business (see annex figure 3). It is also interesting to note that, despite the crisis, only 1,8% of the companies are planning to sell all their assets abroad. Most are planning to reduce costs (47%) or temporarily reduce investment (22%) (see annex figure 4).
Motivations to internationalize - The reason most mentioned, the company’s international competitive position, received 26% of the responses. The second most mentioned option with 16% of the responses was following clients into international markets. Other motivations include growing world demand, fiscal incentives, and the desire to reduce dependence on the domestic market (see annex figure 5). Functions carried out by the overseas units - The answers indicate that most of these units (45%) consist of offices for exporting goods manufactured in Brazil. The second most frequent response was the manufacture of goods and the provision of services overseas (29%). It is interesting to note how other functions, such as logistics services and R&D, already figure among the overseas activities carried out by respondent companies (see annex figure 6). Most important factors for companies locating overseas –41% of the responses mentioned access to international or regional markets, while 36% mentioned market size (see annex figure 7).
2 See "The growth of Brazil’s direct investment abroad and the challenges it faces," by Luís Afonso Lima and Octavio de Barros, Columbia FDI Perspective No. 13, August 17, 2009, http://www.vcc.columbia.edu/pubs/documents/BrazilOFDI-Final.pdf, for further discussion.

Page 5 of 12
Principal sources of financing – This question showed the greatest concentration of responses. 71% of respondents indicated their own capital as the main source of funding. It is interesting to note that the answers do not mention domestic bank loans. Access to BNDES funds were mentioned by 5% of the respondents (see annex figure 8). Internal barriers to internationalization - A diverse range of factors was mentioned as barriers. 24% of respondents cited currency fluctuation. Among other internal barriers frequently mentioned were high taxes, high logistics costs, and the cost of credit (see annex figure 9).
External barriers to internationalization - Tough competition in mature markets was the main barrier outside Brazil, with 32% of the responses. In second place, with 17% of responses, came taxation issues, like double taxation and tax charged on foreign exchange. Other factors mentioned were the regulatory environment of host countries, credit terms and risk on overseas buyers (see annex figure 10).
Outward investment intentions in 2009–2010, compared to 2008. Despite the crisis, 39% of respondents declared their intention to increase OFDI. Among these, the majority intend to increase OFDI by less than 30%. Another 35% of respondents planned to maintain OFDI at current levels, while 27% intend to reduce their investments (see annex figure 11). It is interesting to note that the United States and Argentina still remain the preferred destinations for OFDI from Brazil. Other destinations cited were China, South Africa and India.
BRAZILIAN OFDI: THE BROAD PICTURE3 In 2008, Brazil was the 6th largest outward investor among emerging markets in terms of FDI stock, with USD 162 billion. In terms of outward FDI flows, Brazil was the 5th largest, with nearly USD 21 billion. The internationalization of Brazilian companies is a relatively recent phenomenon. From 2000 to 2003, OFDI averaged less than USD 1billion a year. Over the four-year
period 2004−2008, this average jumped to nearly USD 14 billion. In 2008, when
global FDI inflows were estimated to have fallen by 15%, OFDI from Brazil almost tripled, increasing from just over USD 7 billion in 2007 to nearly USD 21 billion in 2008. UNCTAD data put the current stock of Brazilian OFDI at USD 162 billion in 2008, an increase of 96% over 2003. According to the most recent data, 887 Brazilian companies have invested abroad.
Despite its relative novelty, the internationalization of Brazilian companies has achieved a wide geographic spread. Brazilian OFDI can today be found in 78 countries. Admittedly, some destinations matter more than others. Putting aside investment in tax havens, which accounts for 67% of the total, according to the most recent data, half the stock of OFDI from Brazil had gone to Denmark, the United States and Spain, with developed economies together accounting for 75%. Among emerging markets, Argentina leads, followed by Uruguay.
CONCLUSION The internationalization of Brazilian companies is a much more widely disseminated phenomenon than one might conclude from the few cases always mentioned by the
3 See the article mentioned in fn. 2 above.

Page 6 of 12
media as examples of overseas success. This survey of internationalized Brazilian companies seeks to contribute not only to identifying opportunities and overcoming the difficulties companies face, but also to understanding this phenomenon, and defining national strategies regarding it. To do this, the survey focussed on obtaining a representative sample of companies. The conclusion of this survey is that the internationalization of Brazilian companies is not a limited or short-term phenomenon. As with other emerging market OFDI, Brazil’s internationalization movement is only just beginning. The results of the survey also suggest some issues public policies might usefully focus on. These include taxes, logistics, currency fluctuations, and investors’ unfamiliarity with potential markets. One issue that stands out is the low participation of Brazilian banks, both private and BNDES, as sources of funds for internationalization. Greater access to credit could make a major contribution to increasing the overseas presence of Brazilian companies. For further information, please contact: At SOBEET, Luís Afonso Lima, President, 55-11-3549-7275, [email protected] At Valor Econômico, Antônio Félix, Editor, 55-11-3767-1391, [email protected] At VCC, Vishwas P. Govitrikar, Global Coordinator, Emerging Market Global Players project, 1-347-350-6935, [email protected]
Page 7 of 12
Annex figure 1: Locations of head offices in Brazil
Annex figure 2a:
Source: SOBEET-Valor-VCC survey of Brazilian multinationals, 2009.
Brazil: Foreign Direct Investment - Flows
Accumulated 12 months
-10
0
10
20
30
40
50
set/
95
set/
96
set/
97
set/
98
set/
99
set/
00
set/
01
set/
02
set/
03
set/
04
set/
05
set/
06
set/
07
set/
08
set/
09
Outward FDI Inward FDI
(US$ bi)
Source: BCB

Page 8 of 12
Annex figure 2b:
Outward Foreign Direct Investment (US$ bi)
4,54,1
6,8
5,0
-0,4
-1,4
-3,4
-5
-3
-1
1
3
5
7
1Q2008 2Q2008 3Q2008 4Q2008 1Q2009 2Q2009 3Q2009
Source: BCB
Annex figure 3:
How does international crisis in 2009 affect your activity abroad ? (%)
16,1
7,1
21,4
8,9
3,61,8
3,6
7,1 1,81,8 1,8 1,8
1,81,81,8 1,8
16,1
0
10
20
30
40
50
60
Lower demand Lower prices Less credit New
opportunities to
my business
Higher
delinquency
among my clients
Fluctuation of the
real affects my
competitiveness
Others The international
scenario does
not affect my
business abroad
Services
Intermediate Goods
Consumer Goods
Source: SOBEET-Valor-VCC survey of Brazilian multinationals, 2009.
53,6
19,6
8,9
5,43,6 3,6 3,6 1,8

Page 9 of 12
Annex figure 4
Annex figure 5:
Facing international crisis, which measures have been taken ? (%)
9,1
3,6 3,6 3,6 5,51,8 1,8
25,5
7,33,6 1,8
12,7
10,9
3,63,6
1,80
10
20
30
40
50
Cost reduction Investment
reduction
Despite
international
crisis, no
measures have
been taken
Mix of the
products sold
abroad has been
changed
Elected
countries to do
business have
been changed
Partial sale of
assets abroad
Total sale of
assets abroad
Others
Services
Intermediate Goods
Consumer Goods
Source: SOBEET-Valor-VCC survey of Brazilian multinationals, 2009.
47,3
21,8
10,9 9,1
5,51,8 1,8 1,8
What are the main reasons that led your company to internationalize? (%)
3,5 1,8
7,0
1,85,3 3,5 1,8 1,8 1,8
17,5
8,8
3,5
1,8 3,5
1,81,8
5,3
5,3
7,0 8,81,8 1,8
3,5
0
10
20
30
40
50
Company’s
international
competitive
position
To accompany
clients in
international
markets
World demand Intention to
reduce
dependence on
the domestic
market
To establish
export
platforms in
other countries
The search for
economies of
scale
Others Saturation of
Brazilian
domestic
market
To accompany
the competition
in international
markets
Fiscal
incentives
Services
Intermediate Goods
Consumer Goods
Source: SOBEET-Valor-VCC survey of Brazilian multinationals, 2009.
26,3
15,814,0 14,0
8,8 8,8
5,3 3,51,8 1,8

Page 10 of 12
Annex figure 6:
Annex figure 7:
What functions does (do) your company’s overseas unit(s) carry out? (%)
16,1
3,65,4
1,8 1,8
17,9
14,3
5,4
10,7
10,7
7,1 3,6
1,80
10
20
30
40
50
Sales / distribution
office
Production of goods
and services
Others Logistics / support
services
Research and
development
Finance
Services
Intermediate Goods
Consumer Goods
Source: SOBEET-Valor-VCC survey of Brazilian multinationals, 2009.
44,6
28,6
12,510,7
1,8 1,8
Which factors most influenced the location of your company
overseas? (%)
19,6
5,4 3,6
10,7
21,4
3,61,8
10,7
8,9
5,4
7,1 1,8
0
10
20
30
40
50
Access to
international and/or
regional markets
Market size Others Stable investment
environment
Local market growth Availability of labor
Services
Intermediate Goods
Consumer Goods
Source: SOBEET-Valor-VCC survey of Brazilian multinationals, 2009.
41,1
35,7
8,97,1
3,6 3,6

Page 11 of 12
Annex figure 8:
Annex figure 9:
What are the principal means of financing your company’s overseas
activities? (%)
21,8
1,8 1,8 3,6
25,5
7,3
3,6
23,6
3,63,6 3,6
0
10
20
30
40
50
60
70
80
Own capital BNDES Overseas debt Overseas banks Others
Services
Intermediate Goods
Consumer Goods
Source: SOBEET-Valor-VCC survey of Brazilian multinationals, 2009.
70,9
5,5 9,1 7,3 7,3
What are the principal internal barriers for your company to
internationalize? (%)
9,1
3,6 1,8 3,6 3,6 1,8 1,8 1,8 1,8
10,9
3,63,6
3,6 5,5
1,8
7,3
3,6
5,55,5 3,6
5,55,5
1,81,8
1,8
0
10
20
30
40
50
Fluctuation of
the currency
Others High tax burden High credit
costs
High logistics
costs
Competition
with projects in
Brazil
Difficulty in
accessing
distribution
channels to
international
markets
Lack of skilled
human
resources
Low economies
of scale, making
production
costs high in
relation to
international
competitors
Lack of
knowledge
about potencial
markets
Services
Intermediate Goods
Consumer Goods
Source: SOBEET-Valor-VCC survey of Brazilian multinationals, 2009.
23,6
12,7 10,9 10,99,1 9,1 9,1
7,3 5,5
1,8

Page 12 of 12
Annex figure 10:
Annex figure 11: --
What are the principal external barriers for your company to
internationalize? (%)
11,15,6 5,6
1,9 1,9 1,9
9,3
13,0 3,7 5,6
3,7 1,9
11,1
3,77,4 3,7
1,9
1,9 1,91,9
1,9
0
10
2 0
3 0
4 0
50
Tough
competition in
mature markets
Taxation (double
taxation of
overseas
profits, taxes
charged on the
results from
foreign
exchange
variation)
Others Regulatory
environment
Barriers
imposed by local
industry
Difficulties in
raising funds on
competitive
terms on the
domestic
market
Credit terms Difficulties in
raising funds on
the overseas
market on
competitive
terms
Difficulties in
obtaining the
guarantees
required for the
financing
Patents
legislation
Services
Intermediate Goods
Consumer Goods
Source: SOBEET-Valor-VCC survey of Brazilian multinationals, 2009.
16,7
1,9
31,5
16,7
14,87,4 5,6
3,7 1,9
What is your intention regarding outward investment in
2009 - 2010, compared to 2008? (%)
8,2 10,2
2,0 4,1
14,3 10,2
6,1
8,2
2,0
12,2
8,2
6,1
8,2
0
10
20
30
40
50
Remain the same Increase of less than
30%
Reduction of over 30% Reduction of less than
30%
Increase of over 30%
Services
Intermediate Goods
Consumer Goods
Source: SOBEET-Valor-VCC survey of Brazilian multinationals, 2009.
34,7
28,6
14,312,2
10,2