CWTS Leiden Ranking: An advanced bibliometric approach to university ranking

International Journal of Economics, Commerce and Management United Kingdom Vol. III, Issue 10, October 2015
Licensed under Creative Common Page 439
http://ijecm.co.uk/ ISSN 2348 0386
RANKING FACTORS AFFECTING
SUPPLY CHAIN MANAGEMENT IN INDUSTRIES
A CASE STUDY OF SHOKOOHIYEH INDUSTRIAL TOWN, IRAN
Soheila Azadeh
M.A. Student at Farabi Institute of Higher Education, Tehran, Iran
Alireza Rabi
Associate Professor at Farabi Institute of Higher Education, Tehran, Iran
Alireza Khazaee
Faculty at Farabi Institute of Higher Education, Tehran, Iran
Abstract
This study aims to put forth solutions that can boost the production of industrial organizations by
improving the performance of supply chains. By identifying and prioritizing the effective factors
in the chain, the importance of each can be assessed. Consequently, by standardizing and
improving internal processes, time-efficiency will increase and the quality of products will
improve. The study takes a practical approach in categorizing the effective factors in supply
chain management of industries. The statistical population for the research comprises of 283
randomly selected managers and employees from five different factories in Shokouhieh
Industrial Town, Iran. Two separate questionnaires were used for data collection-one on the
Likert scale and the other using Paired Comparison Analysis. Exploratory factor analysis and
confirmatory factor analysis of the data (factors affecting the performance of the supply chain)
was carried out using SPSS and Smart-PLS and the results were categorized. The study
answered two questions: what factors affect the performance of the supply chain and how
important each factor is? The results indicated that factors affecting the supply chain include:
satisfaction, time, supply and process flexibility. Using these results, the analysis of hierarchical
fuzzy triangular Chang in Microsoft Excel to rank these factors in order to improve the supply

© Soheila, Alireza & Alireza
Licensed under Creative Common Page 440
chain and increase competitiveness was discussed. The outcome indicated that, in terms of
importance, factors affecting the supply chain performance are: satisfaction, process flexibility,
security and time. The results of this study can be used to enhance nonstop monitoring, boost
production, and to create and sustain competitiveness in industries.
Keywords: Supply Chain, Supply Chain Management, Performance assessment, Fuzzy Analytic
Hierarchy Process
INTRODUCTION
In the age of information, organizations become dynamic and insecure day by day and control
of these organizations requires novel organizational and management creativities (Daneshyan
et al., 2014). The supply chain is a network of customers and suppliers (Heydari et al., 2007).
The main goal of every supply chain is to maximize the total produced value (Choprs, Mindle,
2001). Analysis of factors influencing the supply chain of organizations in the industrial
environment is one of the primary and major prerequisites for developing improvement
programs. On the other hand, business enterprises have realized in the current competitive
environment that they cannot manage to handle everything on their own. Supply chain
management as one of the common issues of the last decades has caused major changes in
the production sector of industrial countries (Daneshyan et al., 2014). Supply chain
management is known as one of the infrastructural bases of business implementation in the
world. Customers’ demand for high quality and rapid services has led to the emergence of
pressures that did not exist before. In the existing competitive market, economic enterprises and
manufacturing companies find themselves in need of management and supervision of resources
and pillars outside their organizations. Accordingly, activities such as product manufacturing and
planning, inventory control, distribution, delivery, and serving customers are transferred to the
supply chain level (Shahbandarzadeh, Peykam, 2012).
Supply chain management is a systematic analysis that covers the coordination and
synchronization of the flow of resources in the network of suppliers, production facilities,
distribution centers and customers. The components of this network play different roles in the
supply chain. Hey receive raw materials from suppliers, turn the materials into end products in
the manufacturing facilities and distribute the end product through distribution centers among
customers (Alinezhad et al., 2014). Supply chain management aims to run the aforementioned
process in a way that customers are enabled to receive reliable services or products at the
lowest cost and quickly. Supply chain management is responsible for integration of
International Journal of Economics, Commerce and Management, United Kingdom
Licensed under Creative Common Page 441
organizational units throughout the supply chain and coordination of the flows of materials,
information and finances so as to meet the end customer’s demand and improve supply chain
competitiveness (Shahbandarzadeh, Peykam, 2012). With scientific and rational management
of the chain of suppliers, as the important elements of strategic management, it is possible to
obtain competitive advantage. In recent years, the emergence of new technologies and massive
evolutions in the global markets has added to the necessity of supply chain management. As a
result, different organizations have to use supply chain management to achieve and establish
their competitive status. In this research it was tried to answer the following two questions: What
factors influence supply chain performance? How significant are these factors? Considering the
importance of supply chain management, in this research, which was based on the experiences
in an industrial development, it was tried to understand the effect of supply chain management
on management performance and rank the influencing factors.
THEORETICAL BACKGROUND
Supply Chain
The 1980s was the period of changes in the attitudes toward the role of purchase in
organizational strategies. However, in the 1990s the researchers were focused on the
integration and methods of recognizing purchase as a more important factor influencing
organizational performance (Ellram, Carr, 1994). Porter (2002) in his great work on forces
shaping industrial competition, introduces purchasers and suppliers as two of the force vital
forces. According to Porter’s model, when there are fewer purchasers in the business market
the bargaining power of purchasers decreases. Therefore, suppliers shall increase quality and
reduce costs. On the other hand, when there are fewer suppliers, the bargaining power of
suppliers grows and they can determine the quality and price of products (Akdogan, Dwmirtas,
2014).
In this regard, every enterprise in the market competes with suppliers and purchasers for
a higher profit margin. Bowersax et al. (2002) define a integrated supply chain as a multi-
enterprise relationship management within the framework of capacity limitations, information,
major competences, capital and human resources. In such circumstances, the supply chain
structure and strategy lead to attempts to establish an operational link between the organization
and its customers as well as between the organization and supply/distribution networks. These
attempts are aimed at achievement of competitive advantage. Therefore, the entire
organizational operation (from the purchase of raw materials to the delivery of products and
services to the end customers) is integrated (Akdogan, Dwmirtas, 2014).
© Soheila, Alireza & Alireza
Licensed under Creative Common Page 442
Supply chain is a chain that contains all of the activities associated with the flow of goods and
conversion of raw materials (from the early preparation phase to the delivery of the end product
to the consumer) (Javadian et al., 2012). The transmission not only includes the flow of
materials but also covers the flow of information and finances (Houshmandi Maher et al., 2012).
The ultimate goal of supply chain is to present products and services to the end customer by
establishing connections and collaborations between different businesses. In this regard,
capital, information, raw material, intermediate goods, and such determine the form of the
collaboration between the businesses (Tabibi, Mazlumi, 2009). In other words, it could be stated
that effectiveness and efficiency of every organization are the products of the management
performance and structure of the supply chain of that organization (Rahmani Seresht, 2008).
Supply Chain Management
Traditionally, supply chain management (SCM) was the integrated and coordinated guidance of
all of the supply chain members with an aim to improve the performance and increase the
organization’s profitability and interests. Supply chain managers also desired rapid delivery of
goods and services, reduced costs and increased quality. However, this approach does not
include the improvement of the green supply chain concept and the significance of social costs
and environmental damages (Ansari, Sadeqi Moqadam, 2014). In the past two decades, supply
chain management has been considered one of the key factors of competition and success of
organizations and has drawn the attention of many researchers and experts at production and
operation management (Choprs, Mindle, 2001). Supply chain management is focused on the
integration of supply chain activities and information flows related to those activities by
improving the chain relations. The ultimate goal of supply chain management is to achieve
reliable and long-lasting competitive advantage. Hence, supply chain management is the
process of integrating supply chain and the related information flows by improving and
coordinating the production and distribution of products in the supply chain (Vaezi, Shahraki,
2011). Other definitions of supply chain are presented in the following.
- Supply chain management is the process of planning, implementing and controlling the
supply chain operation and it is an effective method (which minimizes the costs)
(Alinezhad et al., 2014).
- Cox (1999) defines supply chain as follows: First of all, it consists of processes that
connect the customer to the supplier from the input of raw materials to the production of
the end product. Secondly, it is a collection of tasks inside and outside the organization
that activates the value chain for production and delivery of services to customers (Faraji
Khorshidi, Hadadi, 2008).

International Journal of Economics, Commerce and Management, United Kingdom
Licensed under Creative Common Page 443
- By quoting Hubner (2007), Estedler defiens supply chain as follows: Supply chain is a
collection of organizations that are classified as upstream and downstream sectors.
These sectors seek to create value for the end customer by providing a product or
service and by running different activities and processes.
- By quoting Estedler, Hilletofth (2007) also defines supply chain as a collection of
viewpoints that search for integration and effective collaborations between materials,
information, and financial flows throughout the supply chain. As a result of the
integration, the product is delivered to the required location timely, properly and at the
lowest cost and thus the customer’s need is met.
- It is an external chain of the entire chain of exchanges (including the source of raw
materials to different companies) which is involved in the extraction and processing of
raw materials, manufacturing, assembly, distribution and finally sales of the end product
to the customer (Saunders, 1995).
- Supply chain is a network of distribution facilities and options and is responsible for
preparing materials, converting the materials into intermediate and end products and
delivering the end products to the customers. That is to say, it is a network of
organizations involved in different processes and activities that create value for the end
consumer through a set of products and services (Akdogan, Demirtas, 2014).
Supply Chain Performance Assessment
Performance assessment is an essential management tool which helps improve performance to
increase supply chain efficiency. Although supply chain management is commonly practiced in
the industries and numerous articles have been published about supply chain actions and
theories, not much attention has been given to supply chain management (Chan et al., 2003).
Performance assessment is vital to the success of every organization because it facilitates
understanding behaviors, shaped behavior and improves competitiveness (Manian et al., 2010).
Performance assessment can reveal important feedback information that enables managers to
monitor the performance, expose progress levels, increase motives, improve communications,
and identify problems (Waggoner et al., 1999). Performance assessment is an integral part of
effective planning, control and decision making (Manian et al., 2010). Chan et al. (2003)
identified six key processes (i.e. supplier, internal logistics, production, external logistics,
marketing and sales, and final customers) and introduced inclusion, exclusion and mixed
(combined) criteria for each process. They classified performance criteria into the groups of
quantitative and qualitative criteria. Some of the examples of qualitative criteria include
© Soheila, Alireza & Alireza
Licensed under Creative Common Page 444
customer satisfaction, flexibility, information flow integration, effective risk management, and
supplier performance. Some of the quantitative criteria also include the following (Chan et al.,
2003):
1) Cost-based criteria such as cost minimization, minimization investment in inventories,
maximization of profit, and maximization of return on investment (ROI)
2) Customer-based criteria such as maximization of percentage of orders fulfillment (supply
rate), minimization of product delivery delays, minimization of customer waiting time,
minimization of LT (lead time: the interval between the reception and delivery of the
order), and minimization of rework
3) Efficiency-based criteria such as maximization of utilization of capacity and harvest of
resources
The goal of supply chain management is to improve supply chain process so as to deliver the
product properly, timely and at lowest cost to the customer. The belief that supply chain
management can improve responsiveness to customers and increase profits has drawn the
attention of many managers to the notion of supply chain management (Husseini et al., 2010).
Factors leading organizations toward supply chain management include the following: the need
for improvement activities; increased outsourcing; increased transportation cost; increased
competitive stress; increased globalization; significance of global commerce; supply chain
complexity; and the need for inventory management (Ketchen, Giunipero, 2004).
Determining the Key Factors for Supply Chain Success
The objective of supply chain management is to ensure the product is delivered at the proper
time and place as a result of optimization of the existing inventories (Heizer,Render, 2014; Slack
et al, 2013). Inventory management (including raw materials, work in progress, and end
products) can considerably influence the overall supply chain performance (Ballard, 1996;
McCormack et al, 2012). Supply chain performance can be assessed based on a combination
of factors using the Supply Chain Operations Reference model (SCOR) which is focused on
internal values, customers and shareholders (Bolstorff,Rosenbaum, 2007). The SCOR model
considers the general supply chain factors but it can be developed depending on the need for
assessment (Guritno, 2013).
The key success factors are all of the tasks that when accomplished desirably assure a
manager, an organization, and a supply chain of success. These factors represent that category
of SCM (supply chain management) that call for special and continuous attention to improve
performance. The studies of industries suggest that the key factors of success vary depending

International Journal of Economics, Commerce and Management, United Kingdom
Licensed under Creative Common Page 445
on the industry (i.e. they vary from one level of the supply chain to other levels) (Muhammadi
Zanjirani, 2007).
EMPIRICAL BACKGROUND
One of the new models of network economy is supply chain management which is a collection
of methods for management and coordination of an entire chain (from suppliers to customers)
(Gowen, William, 2003). From 1960 to 1970, companies had to improve the details of their
marketing strategies which were based on the creation, capture and preservation of customers.
They also had to participate in the management of a network of all of the preceding companies,
who prepared the inputs (either directly or indirectly) and all of the subsequent companies (who
were responsible for the delivery of products and after sales services). Hence, the notion of
“supply chain” emerged (Soleymani Shiri, 2009).
In a study by Kazzazi et al. (2012) a new technique called “a method for measuring
competitiveness (serving capacity) of supply chains” was proposed. This technique was
designed on the basis of the teachings and indicators of the SCOR model. The six phases of
this technique include the following: identification of factors influencing the competitiveness of
supply chains using the fuzzy screening method; determining the relative importance (weight) of
indicators selected in the first step using the fuzzy analytical hierarchy process; determining the
fuzzy value of each of the indicators selected in the first step for the supply chains of the
industry of concern; ranking supply chains of concern using the fuzzy TOPSIS method; finalizing
the fuzzy values for the four main components of competitiveness; and drawing the measured
competitiveness of each supply chain on a tetrahedron diagram (Kazzazi et al., 2012).
In 2011, Jafari et al. assessed the supply chain performance using the fuzzy analytical
hierarchy method. They used the fuzzy decision-making method to prioritize the criteria and
determine the significance of each criterion for the overall performance of the supply chain.
They used five indicators (namely planning, supply of resources, production, delivery and
performance) as the major criteria and finally a proper model and method was proposed for
decision making and assessing the performance of an entire supply chain (Daneshyan et al.,
2014). Aqajani and Dargahi (2012) carried out a study to assess and select suppliers for
preparing a protective part for Iran Khodro Company. They localized the selected indicators and
classified as 12 factors or assessment criteria. Next, using the analytical hierarchy process
(AHP) they weighted the indicators and finally using the Vikor technique ranked the suppliers
(Aqajani & Dargahi, 2012).
© Soheila, Alireza & Alireza
Licensed under Creative Common Page 446
In their research, Ismaelian and Rabiyi (2007) introduced a fuzzy decision-making process for
problems of selecting suppliers in supply chains. They considered the identification of the most
suitable supplier to be a strategic factor in supply chains. They also considered many qualitative
and quantitative performance criteria (such as quality, price, flexibility, and delivery time) to
determine the most suitable supplier. The also used the Multi-Criteria Decision Making (MCDM)
method in the fuzzy environment for selecting the suitable supplier. They used three methods
for weight calculation and ranking of options with the fuzzy TOPSIS technique (Ismaelian,
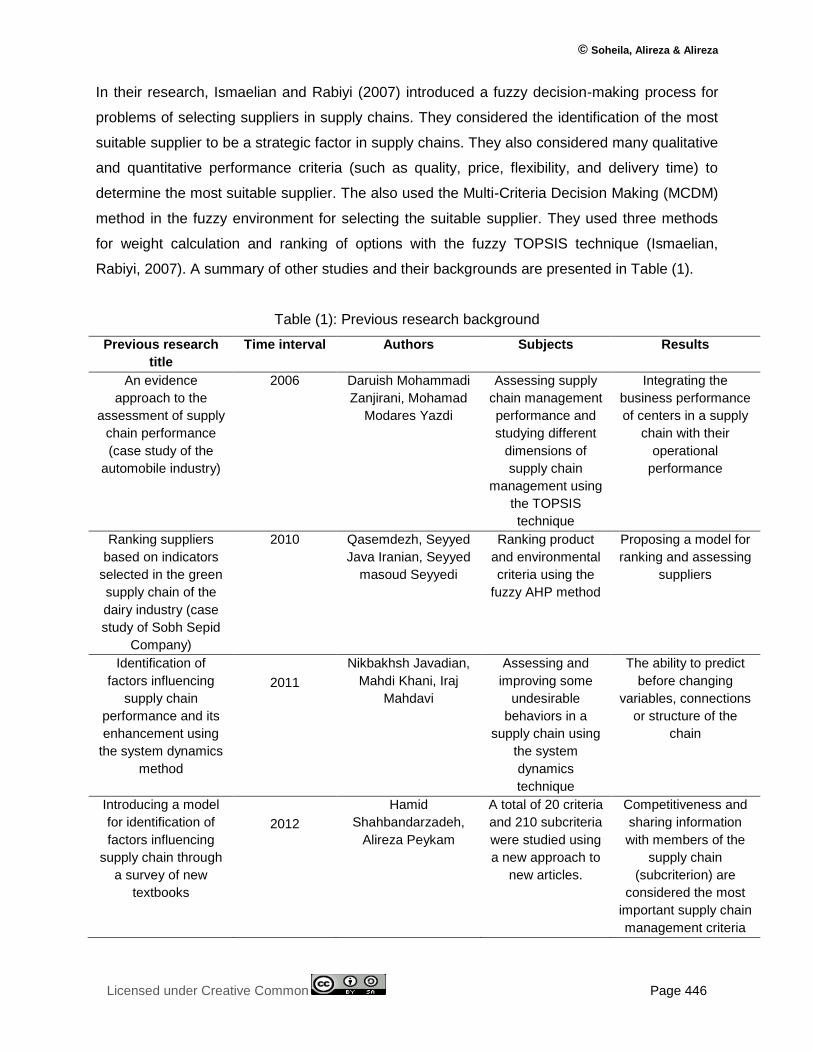
Rabiyi, 2007). A summary of other studies and their backgrounds are presented in Table (1).
Table (1): Previous research background
Previous research
title
Time interval Authors Subjects Results
An evidence
approach to the
assessment of supply
chain performance
(case study of the
automobile industry)
2006
Daruish Mohammadi
Zanjirani, Mohamad
Modares Yazdi
Assessing supply
chain management
performance and
studying different
dimensions of
supply chain
management using
the TOPSIS
technique
Integrating the
business performance
of centers in a supply
chain with their
operational
performance
Ranking suppliers
based on indicators
selected in the green
supply chain of the
dairy industry (case
study of Sobh Sepid
Company)
2010 Qasemdezh, Seyyed
Java Iranian, Seyyed
masoud Seyyedi
Ranking product
and environmental
criteria using the
fuzzy AHP method
Proposing a model for
ranking and assessing
suppliers
Identification of
factors influencing
supply chain
performance and its
enhancement using
the system dynamics
method
2011
Nikbakhsh Javadian,
Mahdi Khani, Iraj
Mahdavi
Assessing and
improving some
undesirable
behaviors in a
supply chain using
the system
dynamics
technique
The ability to predict
before changing
variables, connections
or structure of the
chain
Introducing a model
for identification of
factors influencing
supply chain through
a survey of new
textbooks
2012
Hamid
Shahbandarzadeh,
Alireza Peykam
A total of 20 criteria
and 210 subcriteria
were studied using
a new approach to
new articles.
Competitiveness and
sharing information
with members of the
supply chain
(subcriterion) are
considered the most
important supply chain
management criteria

International Journal of Economics, Commerce and Management, United Kingdom
Licensed under Creative Common Page 447
Identifying and
ranking factors
influencing supply
chain management
using the multi-criteria
decision making
techniques
2012
Rahim Qasemieh,
Shahla Yousefi Deh
Bidi, Meysam
Dastranj
Identifying factors
influencing the
improvement of
supply chain and
its refinement
using the multi-
criteria decision
making method
Production, marketing,
strategic relations and
financial flows are the
four factors having the
highest effect on
supply chain.
Ranking factors
influencing sharing of
information in the
supply chain using
the fuzzy multi-criteria
decision making
technique in the
refinery and
distribution of
petroleum products
industry of Iran
2014
Laya Olfat and Sima
Sadiqi Gariz
Identifying factors
influencing
information sharing
in supply chain
using Excel, SPSS,
and Matlab as well
as the fuzzy ANP
technique
Of the factors
influencing sharing of
information in the
supply chain the
responsiveness and
commitment factors
have the highest
priority while interests
of the supply chain
members have the
lowest priority.
Source: Author’s compilation
In their research, Tseng and Chiu (2010) selected 18 criteria, including the following, for their
study: environmental factors, environment management system, supplier efficiency, and close
relationships with supplier. They used the fuzzy theory to turn linguistic criteria to final numbers
(Tseng, Chiu, 2010).
Elbaz (2011) used a model for assessment of supply chain performance to study the
effects of qualitative and quantitative factors on company performances. He used a combination
of fuzzy theories and AHP in his research and successfully applied it to a production company.
Chen et al. (2006) used the fuzzy TOPSIS approach to select a supplier from a supply
chain (Chen, 2006). In a study in 2010 by Chen Lee et al., the TOPSIS method was used to
rank a suitable strategy. In this research, the analytical network process (ANP) was used to
calculate the input weights (Karbasian et al., 2012). Leen et al. used an enterprise resource
planning (ERP) to conduct a case study of the electronics industry. In this integrated model, the
ANP and Topsis techniques were employed to calculate and rank the suppliers. The model for
minimization of lead time (LT) effectively allocates an order volume to each seller (Sailin, 2011).
Peter Turkman et al. (2010) examined the relationship of the design analytical potentials,
resources, production and delivery in the supply chain with performance of the decision support
systems. The structural equation of the model was used for a sample containing 310 companies
operating in different industries in America, Europe, Canada, Brazil and China. The findings
revealed an evident relationship between analysis potentials and performance.
© Soheila, Alireza & Alireza
Licensed under Creative Common Page 448
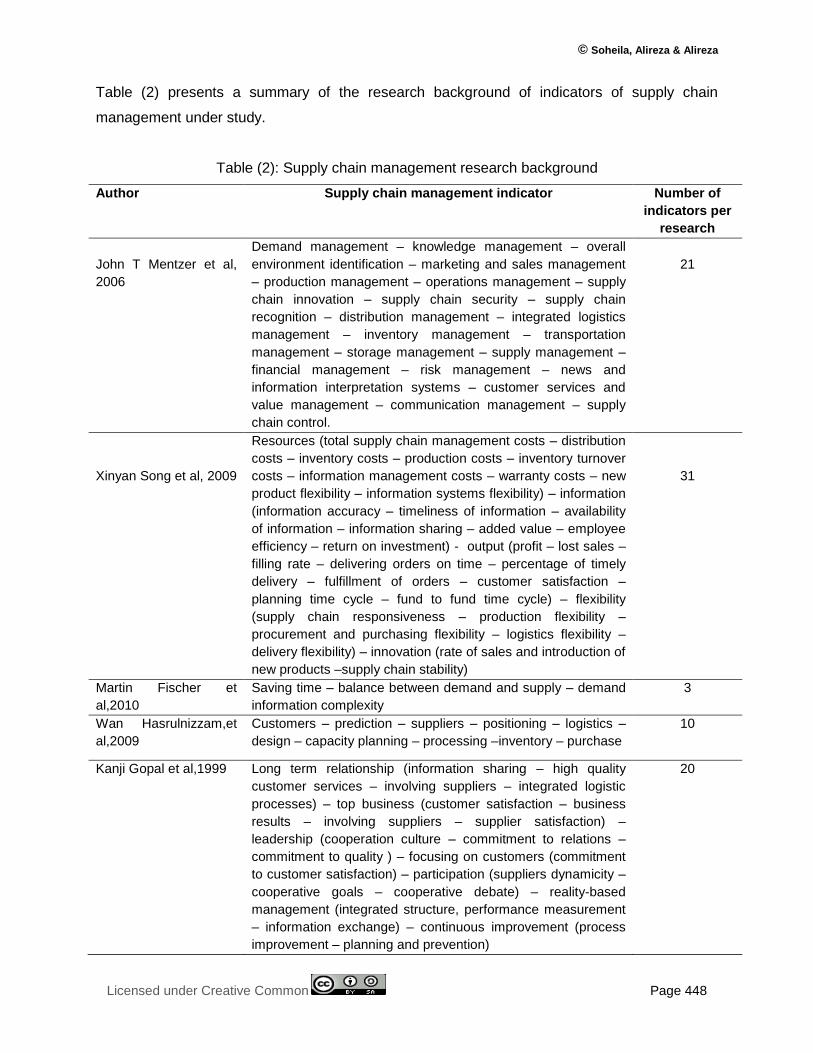
Table (2) presents a summary of the research background of indicators of supply chain
management under study.
Table (2): Supply chain management research background
Author Supply chain management indicator Number of
indicators per
research
John T Mentzer et al,
2006
Demand management – knowledge management – overall
environment identification – marketing and sales management
– production management – operations management – supply
chain innovation – supply chain security – supply chain
recognition – distribution management – integrated logistics
management – inventory management – transportation
management – storage management – supply management –
financial management – risk management – news and
information interpretation systems – customer services and
value management – communication management – supply
chain control.
21
Xinyan Song et al, 2009
Resources (total supply chain management costs – distribution
costs – inventory costs – production costs – inventory turnover
costs – information management costs – warranty costs – new
product flexibility – information systems flexibility) – information
(information accuracy – timeliness of information – availability
of information – information sharing – added value – employee
efficiency – return on investment) - output (profit – lost sales –
filling rate – delivering orders on time – percentage of timely
delivery – fulfillment of orders – customer satisfaction –
planning time cycle – fund to fund time cycle) – flexibility
(supply chain responsiveness – production flexibility –
procurement and purchasing flexibility – logistics flexibility –
delivery flexibility) – innovation (rate of sales and introduction of
new products –supply chain stability)
31
Martin Fischer et
al,2010
Saving time – balance between demand and supply – demand
information complexity
3
Wan Hasrulnizzam,et
al,2009
Customers – prediction – suppliers – positioning – logistics –
design – capacity planning – processing –inventory – purchase
10
Kanji Gopal et al,1999
Long term relationship (information sharing – high quality
customer services – involving suppliers – integrated logistic
processes) – top business (customer satisfaction – business
results – involving suppliers – supplier satisfaction) –
leadership (cooperation culture – commitment to relations –
commitment to quality ) – focusing on customers (commitment
to customer satisfaction) – participation (suppliers dynamicity –
cooperative goals – cooperative debate) – reality-based
management (integrated structure, performance measurement
– information exchange) – continuous improvement (process
improvement – planning and prevention)
20

International Journal of Economics, Commerce and Management, United Kingdom
Licensed under Creative Common Page 449
Kurd & Golshahi (2013)
Management and organization (establishing a system for
managing the salaries and efficiency of employees –
commitment of the management and organization – training
expert human forces- effectiveness of the organizational chart
– aligning with organization goals – organization’s culture
development) – ordering and delivery (developing mechanisms
for the reception of orders and delivery of products –
addressing obstacles in the customer communication channels
for ordering and delivery – internet sales) – cost and price
(flotation of prices based on the final cost – government
limitations – access to supply resources at lower costs –
enabling cost and profit analysis – solutions for final price of
products) – market share (proper interactions with customers –
mechanisms for identification of domestic and foreign markets-
product diversity strategy – studying and recognizing rivals and
their shares – aligning with different market tastes –
mechanized marketing) – responsiveness (developing
mechanisms for the feedback system – establishing
responsiveness reinforcement systems – training the personnel
to improve their competency) – outsourcing (developing the
outsourcing culture – identification and classification of
activities – access to appropriate contracting companies –
estimating costs and interests resulted from outsourcing –
contractors assessment mechanisms) – information technology
(feasibility study of the company for using IT in different areas –
creating a customer portal – upgrading network equipment –
teaching the use of IT – developing information technology
platforms)
35
Khan Rai Waqas Azfar
et al, 2014
Operational performance (inventory level – quality- time-
customer satisfaction) – economic performance (cost –
environmental costs – cash cycle) – environmental
performance (business wastes)
6
Shahbandarzadeh &
Peykam (2012)
Competitiveness – supplier – partners – organization –
coordination – purchase and order – logistics – financial
management – planning – information technology (IT) –
production and implementation - customer
12
Source: Author’s compilation
Generally, the philosophy of supply chain management is that the overall performance of a
collection of supply chains is increased when the performance of all of the organizations
associated with the process is optimized in relation to the performance of each individual
organization. Supply and demand planning and management, preparation of raw materials and
schedules for products or services, warehousing, inventory control, distribution, delivery, and
serving customers are among the components arranged through supply chain management.
The objective of this coordination and arrangement is to enable customers to obtain high-quality
© Soheila, Alireza & Alireza
Licensed under Creative Common Page 450
products and reliable services at lowest costs. These achievements can, in turn, create
competitive advantage for the company (Breen, Crawford, 2005).
The notion of supply chain has been explored by many researchers so far. Some
researchers consider it to be a synonym for notions such as logistics, operation management,
supplies, or a combination of the three notions (Kazzazi & Sohrabi, 2010). However, it is
possible to rely on the following inclusive definition which was presented by the global supply
chain association: “supply chain management is the integration of key business processes from
the final user to the main supplier, who is responsible for supplying products, services, and
information that create added value for the customers and stakeholders of the organization.”
In recent years, many organizations have accepted the Supply Chain Operations
Reference (SCOR) as a powerful and inclusive instrument for analysis and improvement of
supply chains. This model is based on the major supply chain processes such as sourcing,
manufacturing and distribution (Kazzazi, Sohrabi, 2010).
CONCEPTUAL MODEL
A review of the research literature was carried out to be able to assess the indicators with more
precision. Moreover, in response to the first research question about the factors and indicators
influencing supply chain management, the research conceptual model is depicted using 5
criteria and 27 indicators in Figure (1). Next, based on the opinions of 12 experts and using
methods explained in the relevant section, the weight of each factor was determined in
accordance with the pair-wise comparison questionnaires using Chang’s triangular fuzzy
analytical hierarchy process.

International Journal of Economics, Commerce and Management, United Kingdom
Licensed under Creative Common Page 451
Figure (1): Research conceptual model
Indicators influencing
supply chain
management
Satisfaction
Process
- Innovations in cost saving
- Return rate (returns)
- Use of resources
- Documentation
- Responsiveness to urgent orders
- Quality of end products
- Diversity of products and
services
- Bill delivery speed
- Level of cooperation among
suppliers
- Accuracy of prediction methods
- Ordering methods
- Level of information sharing
- Help of suppliers in technical
problems
- Qualitative capability of suppliers
- Production efficiency
- Ordering time cycle
- Flexibility in meeting customer
needs
- Delivery of flawless products
- Delivery quality and method
- Customer's understanding of the
product value
Flexibility
Time
- Master production schedule
- Product delivery delay
- Product development cycle
- Customer's understanding of the
product value
Supplier
- Production cycle duration
- Schedule effectiveness
- Probability of shortage of stock and
failure to fulfill customer's order
© Soheila, Alireza & Alireza
Licensed under Creative Common Page 452
RESEARCH METHODOLOGY
This study was carried out to find a solution to increase production of industrial organizations by
improving the supply chain performance. The present research is an applied study regarding its
objective and is a descriptive-survey study regarding its data collection method. This study was
an attempt to identify factors influencing supply chain management and to rank the results
factors. In this research, it was tried to identify factors influencing the supply chain performance
of industries (in Shokouhieh industrial development, Iran) and to rank the factors based on their
influence.
The structural equations analysis for this research was carried out using the Smart-PLS
statistical analysis software and SPSS. The second study population was composed of the
experts from the first population. Members of the second population were selected using the
snowball sampling method. The members of this population were graduates of disciplines
related to industrial management and supply chain. They also had the knowledge and
experience of supply chains. A total of 12 participants, who completed the second (pair-wise
comparison) questionnaire, were selected using the mentioned sampling method. This
questionnaire includes linguistic words and fuzzy values. The data was analyzed using Chang’s
triangular fuzzy analytical hierarchy process in Excel.
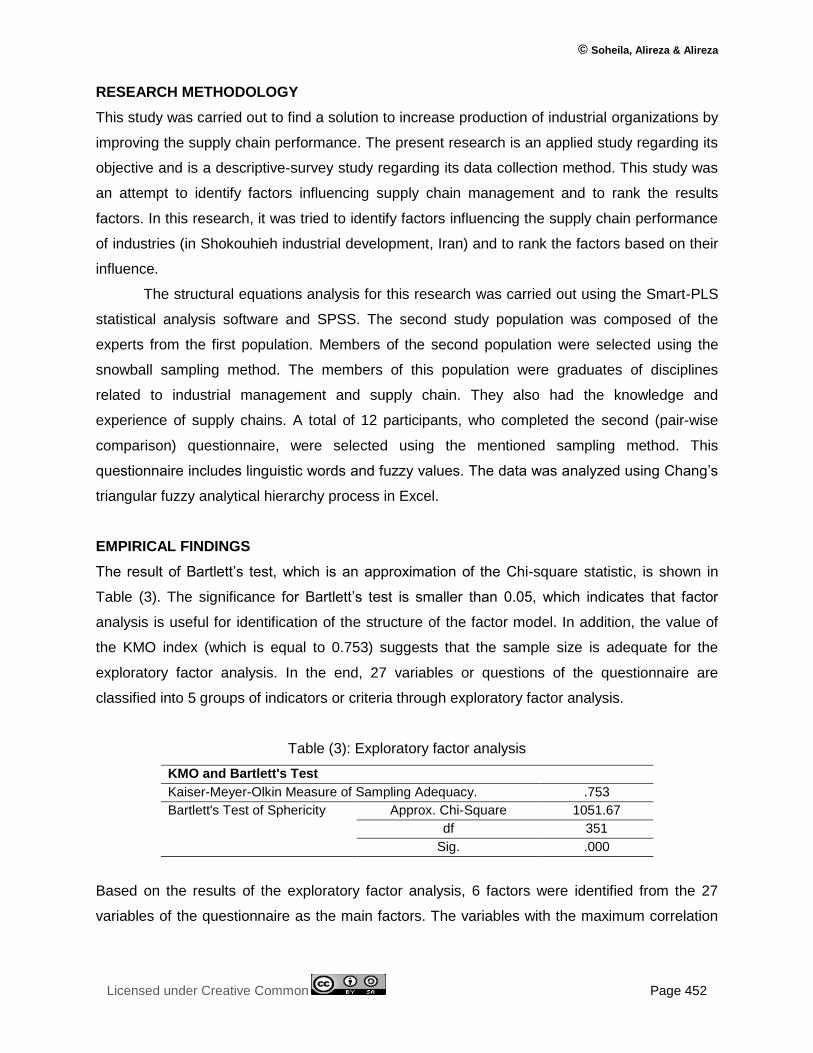
EMPIRICAL FINDINGS
The result of Bartlett’s test, which is an approximation of the Chi-square statistic, is shown in
Table (3). The significance for Bartlett’s test is smaller than 0.05, which indicates that factor
analysis is useful for identification of the structure of the factor model. In addition, the value of
the KMO index (which is equal to 0.753) suggests that the sample size is adequate for the
exploratory factor analysis. In the end, 27 variables or questions of the questionnaire are
classified into 5 groups of indicators or criteria through exploratory factor analysis.
Table (3): Exploratory factor analysis
KMO and Bartlett's Test
Kaiser-Meyer-Olkin Measure of Sampling Adequacy. .753
Bartlett's Test of Sphericity Approx. Chi-Square 1051.67
df 351
Sig. .000
Based on the results of the exploratory factor analysis, 6 factors were identified from the 27
variables of the questionnaire as the main factors. The variables with the maximum correlation

International Journal of Economics, Commerce and Management, United Kingdom
Licensed under Creative Common Page 453
with each factor are classified in the group of that factor. Hence, 27 research variables were
classified and the sixth factor was omitted due to the existence of one question.
Confirmatory Factor Analysis
It is a comprehensive method used for selecting the type of the measuring models in the
research conceptual model. In the confirmatory factor analysis, the standardized coefficients
and significance coefficients (t-Student test) for the questionnaire were obtained for each factor
(Table 4).
Table (4): A summary of the results of the confirmatory factor analysis
Factor Component Factor load Significance coefficient
Satisfaction
A1
Bill delivery speed 0.819 16.687
Level of cooperation between suppliers 0.807 16.058
Accuracy of the prediction methods 0.634 4.921
Ordering methods 0.786 14.293
Level of shared information 0.768 15.687
Help of suppliers in technical problems 0.810 17.679
Qualitative competence of the supplier 0.860 25.042
Production efficiency 0.724 12.206
Process
A2
Innovations in cost saving 0.677 17.180
Return rate (returns) 0.657 26.206
Documentation 0.806 21.657
Use of resources 0.865 11.909
Responsiveness to urgent orders 0.830 7.290
Quality of the end product 0.781 8.205
Diversity of products and services 0.710 6.891
Flexibility
A3
Duration of ordering cycle 0.622 16.087
Flexibility in meeting customer needs 0.844 24.864
Rate of delivery of flawless products 0.862 15.726
Delivery quality and method 0.833 12.378
Customer’s understanding of the product value 0.766 6.619
Time
A4
Master production schedule 0.774 12.243
Delay in product delivery 0.759 9.566
Product development cycle duration 0.724 9.919
Delay in minimizing the lead time 0.844 23.789

© Soheila, Alireza & Alireza
Licensed under Creative Common Page 454
Supplier
A5
End product cycle duration 0.822 13.135
Effectiveness of product distribution timing 0.792 7.015
Costs incurred by lack of stock 0.692 15.878
Table (5) shows the Cronbach’s alpha and composite reliability of the research variables. For
each 5 variables, the Cronbach’s alpha is higher than 0.7 which reflects the proper reliability of
the model.
Table (5): Reliability
Composite reliability Cronbach’s alpha
A1 0.924 0.906
A2 0.907 0.879
A3 0.891 0.846
A4 0.858 0.783
A5 0.813 0.764
Prioritizing the Factors Using the Fuzzy Analytical Hierarchy Process
Since the number of experts in this method is 12, there are 12 different matrixes for each factor.
In the fuzzy analytical hierarchy process first the 12 matrixes are transformed into one matrix.
One of the best ways to combine the tables for pair-wise comparisons of all of the respondents
is to use the geometric mean method. Assuming that ��𝑖𝑗𝑘 is the element associated with the K-th
respondent in the comparison between the i and j criteria, the geometric mean for the
corresponding elements is calculated using the following relation:
(1) ��𝑖𝑗 = (∏ ��𝑖𝑗𝑘𝑛
𝑘=1 )1
𝑛
(2) aij = (��𝑖𝑗1 ⊗ ��𝑖𝑗
2 ⊗…⊗ ��𝑖𝑗12)
1
12
Based on the result of the exploratory factor analysis, 6 factors are identified as the major
factors for 27 variables of the questionnaire. Using formula 2, the pair-wise comparison matrixes
for the 12 experts is transformed into five matrixes for the sub-factors and one pair-wise
comparison matrix for the factors. Table (6) presents the geometric means for the expert
opinions on factors influencing supply chain. Using this table and Chang’s method, the final
weights of factors influencing the supply chain are calculated.

International Journal of Economics, Commerce and Management, United Kingdom
Licensed under Creative Common Page 455
Table (6): Fuzzy matrix for the pair-wise comparisons between factors influencing supply chain
Satisfaction (1) Process (2) Flexibility (3) Time (4) Supplier (5)
Satisfaction 1.000 1.000 1.000 1.687 1.780 1.857 2.485 2.675 2.787 2.687 2.875 2.932 2.595 2.711 2.864
Process 0.539 0.562 0.593 1.000 1.000 1.000 1.589 1.654 1.723 2.323 2.430 2.501 1.432 1.434 1.504
Flexibility 0.359 0.374 0.402 0.580 0.605 0.629 1.000 1.000 1.000 0.612 0.875 0.912 1.386 1.453 1.499
Time 0.341 0.348 0.372 0.400 0.412 0.430 1.096 1.143 1.634 1.000 1.000 1.000 0.612 0.854 0.907
Supplier 0.349 0.369 0.385 0.665 0.697 0.698 0.667 0.688 0.722 1.103 1.171 1.634 1.000 1.000 1.000
Based on the expert opinions on the significance of factors influencing the supply chain, the final
normal and non-normal weights of each factor were calculated (Table 7).
Table (7): Final weight of factors influencing supply chain
Factors influencing
supply chain
Non-normal weight Normal weight
Satisfaction 1 0.24001
Process 0.86843723 0.208434
Flexibility 0.77632571 0.186326
Time 0.75805131 0.18194
Supplier 0.76367103 0.183289
Sum 4.16648529 1
Based on the resulting weights, the priority of factors influencing supply chain is as follows:
satisfaction, process, flexibility, supplier and time. In the following, the table for the geometric
means of expert opinions on the sub-components of every factor influencing the supply chain is
shown along with the table for the final weight of each component.

International Journal of Economics, Commerce and Management United Kingdom Vol. III, Issue 10, October 2015
Licensed under Creative Common Page 456
Table (8): The fuzzy matrix for the pair-wise comparisons of the sub-components of satisfaction
First component: satisfaction
Bill delivery speed (11)
Level of cooperation of suppliers (12)
Accuracy of prediction
method (13)
Ordering methods (14)
Level of shared information (15)
The help of suppliers in
solving technical problems (16)
Supplier’s qualitative
competence (17)
Production efficiency (18)
Bill delivery speed
1.000 1.000 1.000 0.610 0.700 0.750 0.720 0.760 0.800 1.410 1.460 1.520 0.480 0.510 0.530 1.960 2.050 2.140 0.710 0.920 1.140 0.456 0.471 0.495
Level of suppliers
cooperation
1.333 1.429 1.639 1.000 1.000 1.000 1.220 1.280 1.340 1.590 1.670 1.690 0.740 0.790 0.840 2.410 2.470 2.530 1.310 1.490 1.690 1.326 1.366 1.447
Accuracy of prediction methods
1.250 1.316 1.389 0.746 0.781 0.820 1.000 1.000 1.000 2.010 2.100 2.130 0.560 0.620 0.700 2.560 2.630 2.710 1.220 1.430 1.520 0.418 0.431 0.450
Ordering methods
0.658 0.685 0.709 0.592 0.599 0.629 0.469 0.476 0.498 1.000 1.000 1.000 0.420 0.510 0.600 0.980 1.030 1.120 0.620 0.660 0.770 0.451 0.494 0.536
Level of shared
information
1.887 1.961 2.083 1.190 1.266 1.351 1.429 1.613 1.786 1.667 1.961 2.381 1.000 1.000 1.000 2.370 2.420 2.490 1.600 1.780 1.980 0.402 0.431 0.450
The help of suppliers in
solving technical problems
0.467 0.488 0.510 0.395 0.405 0.415 0.369 0.380 0.391 0.893 0.971 1.020 0.402 0.413 0.422 1.000 1.000 1.000 0.520 0.570 0.650 0.596 0.648 0.695
Supplier’s qualitative
competence
0.877 1.087 1.408 0.592 0.671 0.763 0.658 0.699 0.820 1.299 1.515 1.613 0.505 0.562 0.625 1.538 1.754 1.923 1.000 1.000 1.000 0.715 0.810 0.898
Production efficiency
2.020 2.124 2.194 0.691 0.732 0.754 2.221 2.321 2.394 1.867 2.023 2.218 2.223 2.321 2.485 1.439 1.543 1.679 1.113 1.234 1.399 1.000 1.000 1.000

International Journal of Economics, Commerce and Management United Kingdom Vol. III, Issue 10, October 2015
Licensed under Creative Common Page 457
Table (9): Final weight of sub-components of satisfaction
Satisfaction sub-components Non-normal weight Normal weight
Bill delivery speed 0.92649167 0.122567
Suppliers cooperation level 0.975575172 0.12906
Accuracy of prediction methods 0.959500568 0.126933
Ordering methods 0.893760548 0.118237
Level of shared information 0.988258901 0.130738
The help of suppliers in solving technical
problems
0.885916096 0.117199
Supplier’s qualitative competence 0.92958382 0.122976
Production efficiency 1 0.132291
Sum 7.559086776 1
International Journal of Economics, Commerce and Management United Kingdom Vol. III, Issue 10, October 2015
Licensed under Creative Common Page 458
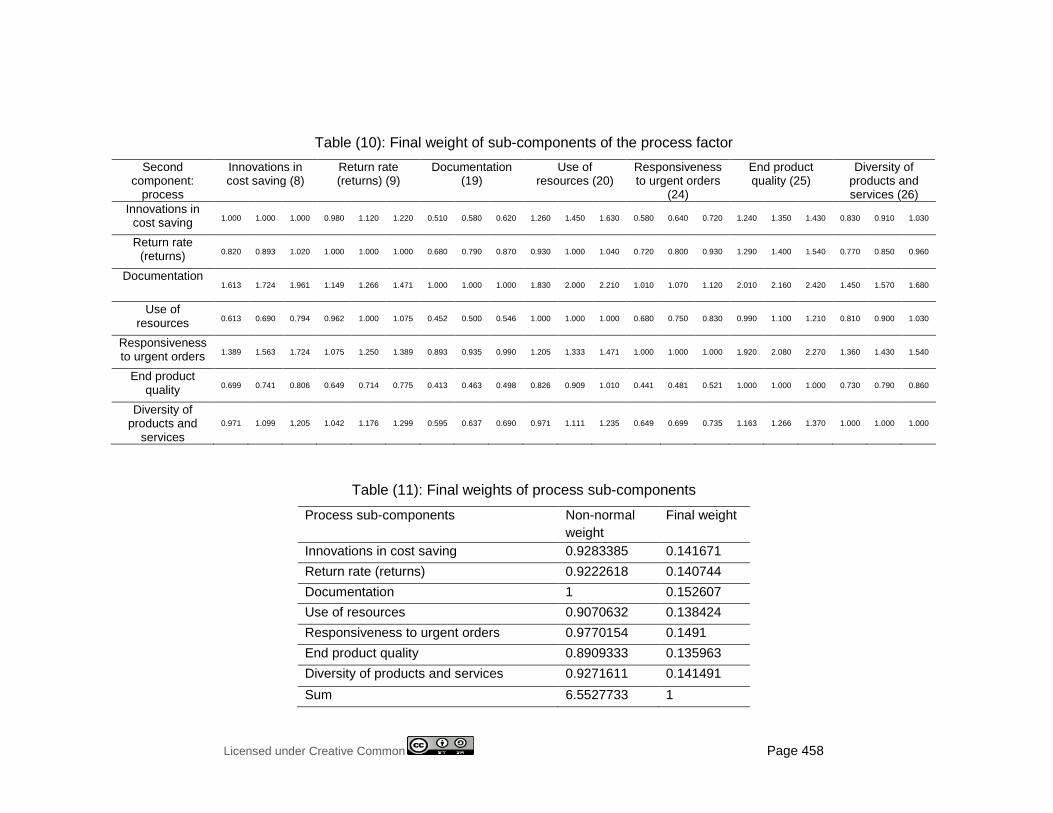
Table (10): Final weight of sub-components of the process factor
Second component:
process
Innovations in cost saving (8)
Return rate (returns) (9)
Documentation (19)
Use of resources (20)
Responsiveness to urgent orders
(24)
End product quality (25)
Diversity of products and services (26)
Innovations in cost saving
1.000 1.000 1.000 0.980 1.120 1.220 0.510 0.580 0.620 1.260 1.450 1.630 0.580 0.640 0.720 1.240 1.350 1.430 0.830 0.910 1.030
Return rate (returns)
0.820 0.893 1.020 1.000 1.000 1.000 0.680 0.790 0.870 0.930 1.000 1.040 0.720 0.800 0.930 1.290 1.400 1.540 0.770 0.850 0.960
Documentation 1.613 1.724 1.961 1.149 1.266 1.471 1.000 1.000 1.000 1.830 2.000 2.210 1.010 1.070 1.120 2.010 2.160 2.420 1.450 1.570 1.680
Use of resources
0.613 0.690 0.794 0.962 1.000 1.075 0.452 0.500 0.546 1.000 1.000 1.000 0.680 0.750 0.830 0.990 1.100 1.210 0.810 0.900 1.030
Responsiveness to urgent orders
1.389 1.563 1.724 1.075 1.250 1.389 0.893 0.935 0.990 1.205 1.333 1.471 1.000 1.000 1.000 1.920 2.080 2.270 1.360 1.430 1.540
End product quality
0.699 0.741 0.806 0.649 0.714 0.775 0.413 0.463 0.498 0.826 0.909 1.010 0.441 0.481 0.521 1.000 1.000 1.000 0.730 0.790 0.860
Diversity of products and
services
0.971 1.099 1.205 1.042 1.176 1.299 0.595 0.637 0.690 0.971 1.111 1.235 0.649 0.699 0.735 1.163 1.266 1.370 1.000 1.000 1.000
Table (11): Final weights of process sub-components
Process sub-components Non-normal
weight
Final weight
Innovations in cost saving 0.9283385 0.141671
Return rate (returns) 0.9222618 0.140744
Documentation 1 0.152607
Use of resources 0.9070632 0.138424
Responsiveness to urgent orders 0.9770154 0.1491
End product quality 0.8909333 0.135963
Diversity of products and services 0.9271611 0.141491
Sum 6.5527733 1
International Journal of Economics, Commerce and Management, United Kingdom
Licensed under Creative Common Page 459
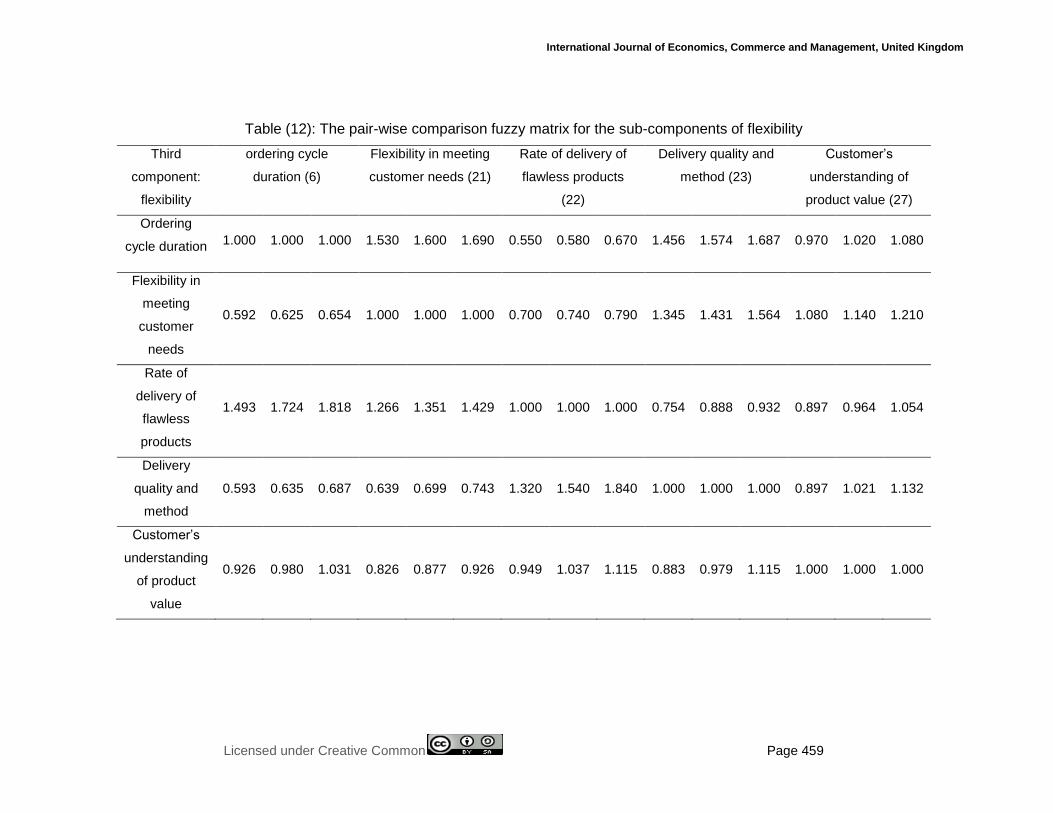
Table (12): The pair-wise comparison fuzzy matrix for the sub-components of flexibility
Third
component:
flexibility
ordering cycle
duration (6)
Flexibility in meeting
customer needs (21)
Rate of delivery of
flawless products
(22)
Delivery quality and
method (23)
Customer’s
understanding of
product value (27)
Ordering
cycle duration 1.000 1.000 1.000 1.530 1.600 1.690 0.550 0.580 0.670 1.456 1.574 1.687 0.970 1.020 1.080
Flexibility in
meeting
customer
needs
0.592 0.625 0.654 1.000 1.000 1.000 0.700 0.740 0.790 1.345 1.431 1.564 1.080 1.140 1.210
Rate of
delivery of
flawless
products
1.493 1.724 1.818 1.266 1.351 1.429 1.000 1.000 1.000 0.754 0.888 0.932 0.897 0.964 1.054
Delivery
quality and
method
0.593 0.635 0.687 0.639 0.699 0.743 1.320 1.540 1.840 1.000 1.000 1.000 0.897 1.021 1.132
Customer’s
understanding
of product
value
0.926 0.980 1.031 0.826 0.877 0.926 0.949 1.037 1.115 0.883 0.979 1.115 1.000 1.000 1.000
© Soheila, Alireza & Alireza
Licensed under Creative Common Page 460
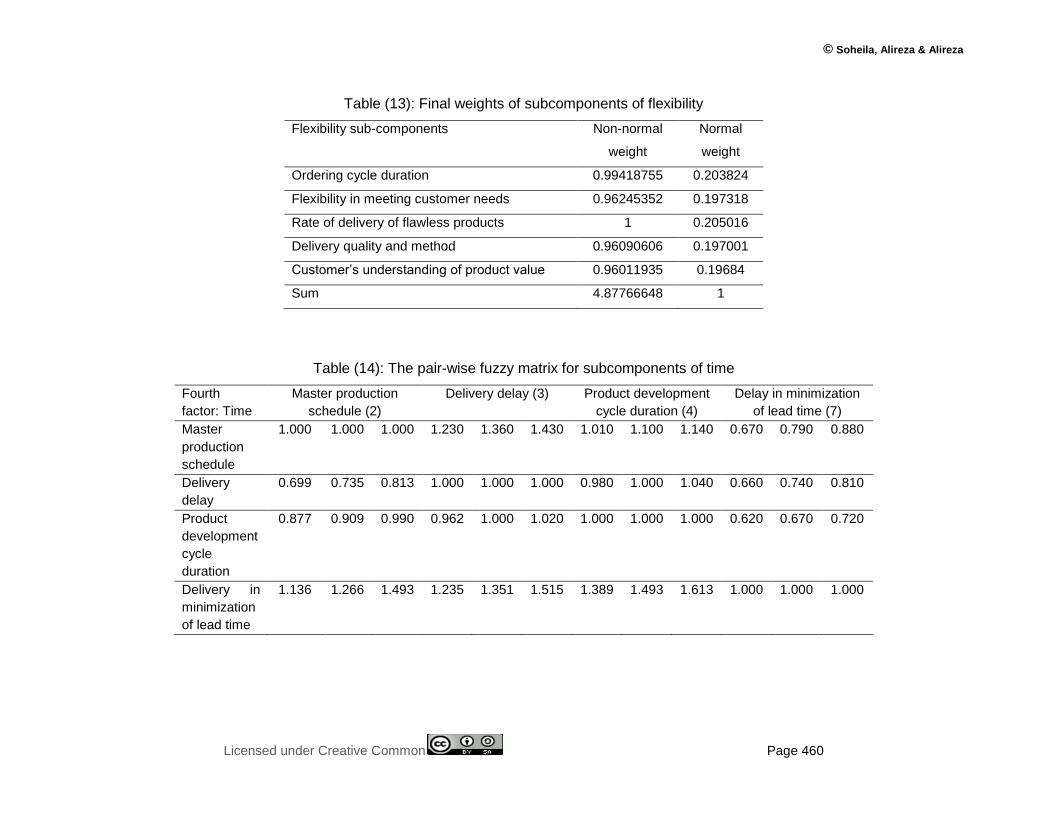
Table (13): Final weights of subcomponents of flexibility
Flexibility sub-components Non-normal
weight
Normal
weight
Ordering cycle duration 0.99418755 0.203824
Flexibility in meeting customer needs 0.96245352 0.197318
Rate of delivery of flawless products 1 0.205016
Delivery quality and method 0.96090606 0.197001
Customer’s understanding of product value 0.96011935 0.19684
Sum 4.87766648 1
Table (14): The pair-wise fuzzy matrix for subcomponents of time
Fourth
factor: Time
Master production
schedule (2)
Delivery delay (3) Product development
cycle duration (4)
Delay in minimization
of lead time (7)
Master
production
schedule
1.000 1.000 1.000 1.230 1.360 1.430 1.010 1.100 1.140 0.670 0.790 0.880
Delivery
delay
0.699 0.735 0.813 1.000 1.000 1.000 0.980 1.000 1.040 0.660 0.740 0.810
Product
development
cycle
duration
0.877 0.909 0.990 0.962 1.000 1.020 1.000 1.000 1.000 0.620 0.670 0.720
Delivery in
minimization
of lead time
1.136 1.266 1.493 1.235 1.351 1.515 1.389 1.493 1.613 1.000 1.000 1.000
International Journal of Economics, Commerce and Management, United Kingdom
Licensed under Creative Common Page 461
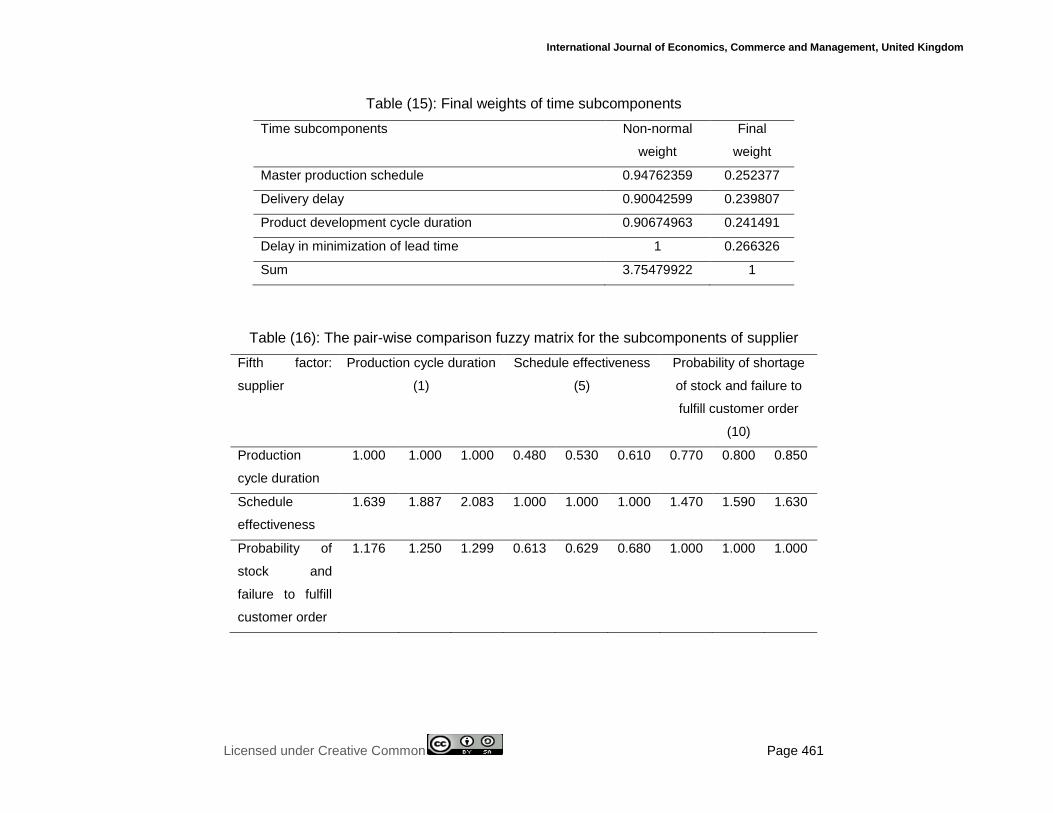
Table (15): Final weights of time subcomponents
Time subcomponents Non-normal
weight
Final
weight
Master production schedule 0.94762359 0.252377
Delivery delay 0.90042599 0.239807
Product development cycle duration 0.90674963 0.241491
Delay in minimization of lead time 1 0.266326
Sum 3.75479922 1
Table (16): The pair-wise comparison fuzzy matrix for the subcomponents of supplier
Fifth factor:
supplier
Production cycle duration
(1)
Schedule effectiveness
(5)
Probability of shortage
of stock and failure to
fulfill customer order
(10)
Production
cycle duration
1.000 1.000 1.000 0.480 0.530 0.610 0.770 0.800 0.850
Schedule
effectiveness
1.639 1.887 2.083 1.000 1.000 1.000 1.470 1.590 1.630
Probability of
stock and
failure to fulfill
customer order
1.176 1.250 1.299 0.613 0.629 0.680 1.000 1.000 1.000

International Journal of Economics, Commerce and Management United Kingdom Vol. III, Issue 10, October 2015
Licensed under Creative Common Page 462
Table (17): Final weights of the subcomponents of supplier
Supplier subcomponents Non-normal
weight
Final
weight
Production cycle duration 0.77835497 0.297834
Schedule effectiveness 1 0.382646
Probability of shortage of stock and
failure to fulfill customer order
0.83502919 0.31952
Sum 2.61338415 1
The following table shows the weights of all of the components influencing the supply chain as
well as the priority of each component in relation to others. The weights are obtained by
multiplying the weight of each component by the weight of its corresponding factor. As seen in
Table (18), the following components are the most important components influencing the supply
chain and thus shall be valued more: schedule effectiveness, probability of shortage of stock
and failure to fulfill customer order, production cycle duration, delay in minimization of lead time,
and master production schedule. However, among all of the factors influencing the supply chain
include satisfaction and process, which call for more attention. Therefore, the answer to the
second research question is shown in the following table.
Table (18): Weights of all of the components influencing the supply chain
Component number
Components Factor Total weight Priority
1 Production cycle duration (0.297834) Supplier (0.1383289) 0.054589696 3
2 Master production schedule (0.252377)
Time (0.18194) 0.045917471 5
3 Delay in product delivery (0.239807) Time (0.18194) 0.043630486 7
4 Product development cycle duration (0.241491)
Time (0.18194) 0.043936873 6
5 Schedule effectiveness (0.382646) Supplier(0.1383289) 0.070134803 1
6 Ordering cycle duration (0.203824) Flexibility (0.186326) 0.037977711 9
7 Delay in minimization of lead time (0.266326)
Time (0.18194) 0.048455352 4
8 Innovations in cost saving (0.141671)
Process (0.208434) 0.029529053 19
9 Return rate (returns) (0.140744) Process(0.208434) 0.029335835 23
10 Probability of shortage of stock and failure to fulfill customer order
(0.31952)
Supplier(0.1383289) 0.058564501 2
11 Bill delivery speed (0.122567) Satisfaction(0.24001) 0.029417306 22
12 Level of suppliers cooperation (0.12906)
Satisfaction (0.24001)
0.030975691 17
13 Accuracy of prediction methods (0.126933)
Satisfaction(0.24001) 0.030465189 18

International Journal of Economics, Commerce and Management, United Kingdom
Licensed under Creative Common Page 463
14 Ordering methods (0.118237) Satisfaction(0.24001) 0.028378062 25
15 Level of shared information (0.130738)
Satisfaction(0.24001) 0.031378427 15
16 The help of suppliers in technical problems (0.117199)
Satisfaction(0.24001) 0.028128932 27
17 Supplier’s qualitative competence (0.122976)
Satisfaction(0.24001) 0.02951547 20
18 Production efficiency (0.132291) Satisfaction(0.24001) 0.031751163 14
19 Documentation (0.152607) Process (0.208434) 0.031808487 13
20 Use of resources (0.138424) Process(0.208434) 0.028852268 24
21 Flexibility in meeting customer needs(0.197318)
Flexibility(0.186326) 0.036765474 10
22 Rate of delivery of flawless products (0.205016)
Flexibility(0.186326) 0.038199811 8
23 Delivery quality and method (0.197001)
Flexibility(0.186326) 0.036706408 11
24 Responsiveness to urgent orders (0.1491)
Process(0.208434) 0.031077509 16
25 End product quality (0.135963) Process (0.208434) 0.028339312 26
26 Diversity of products and services(0.141491)
Process(0.208434) 0.029491535 21
27 Customer’s understanding of product value (0.19684)
Flexibility (0.186326) 0.03667641 12
INTERPRETATION OF RESULTS AND CONCLUSION
The requisite for the success of any business is effective supply chain management. The
requisite for effective supply chain management is also to identify factors influencing the chain
and prioritize the factors to achieve continuous improvement. Based on the numerous previous
studies in scientific fields as well as the practical experiences with supply chain management,
identification of factors influencing supply chain performance has been addressed from different
viewpoints using various models. Proper supply chain performance plays a significant role in the
success of every organization that is seeking to increase its production. Identification and
ranking of factors influencing the supply chain contributes to the identification of the significance
of each indicator. The final goal of this process is to provide a product with higher quality and
lower price by standardizing and improving the internal processes.
Answer to the first question: “What factors influence the performance of supply chains?”
In this study, by identifying factors influencing supply chain management using the Chan et al.
model and opinions of experts working in Shokouhieh industrial development (which were
selected randomly from 5 companies), the following 27 indicators and identified and extracted:
bill delivery speed; level of suppliers’ cooperation; accuracy of prediction methods; ordering
method; level of shared information; the suppliers’ help in solving technical problems; supplier’s
© Soheila, Alireza & Alireza
Licensed under Creative Common Page 464
qualitative competence; production efficiency; innovations in cost saving; return rate; use of
resources; documentation; responsiveness to urgent orders; end product quality; diversity of
products and services; order cycle duration; flexibility in meeting customer needs; rate of
delivery of flawless products; delivery quality and method; customer’s understanding of product
value; master production schedule; delay in delivery; product development cycle duration;
customer’s understanding of product value; production cycle duration; schedule effectiveness;
probability of shortage of stock or failure to fulfill customer orders.
Based on the exploratory factor analysis model, the above 27 indicators were classified
into 5 criterion groups. Next, results of the exploratory factor analysis were confirmed through a
confirmatory factor analysis. The 5 criteria included flexibility, process, satisfaction, time and
supplier.
Answer to the second question: “How significant are the factors influencing the supply chain?”
Using the pair-wise comparison matrixes, the geometric means of opinions on different factors
influencing the supply chain were calculated. The matrix was used using Chang’s method to
obtain the final weights of factors influencing the supply chain. According to the resulting
weights, the factors influencing the supply chain are prioritized in the following order:
satisfaction, process, flexibility, supplier, and time. Moreover, the weight of each subcomponent
of the factors influencing the supply chain was also calculated.
In the end, the weights of all of the components influencing the supply chain along with
the priority of the components were determined. The weights were calculated by multiplying the
weight of each component by the weight of its corresponding factor. The most important
components influencing the supply chain included schedule effectiveness, probability of
shortage of stock and failure to fulfill customer’s order, production cycle duration, delay in
minimization of lead time, and master production schedule. Therefore, these components
required more attention. However, among all of the factors influencing the supply chain,
satisfaction and process were the most important and require more attention. Hence, by
identifying and prioritizing supply chain indicators it is possible to improve supply chain
performance and increase production in industrial organizations.
Therefore, among the other factors the following factors are specifically significant: the
supply chain’s ability to win the satisfaction and loyalty of customers regarding prediction
methods, ordering methods, qualitative competence and efficiency (satisfaction criterion); and
the function and flow of activities along the supply chain (including turnover, materials and
information as the criteria of process) regarding cost-saving innovations, diversity of products
and services, responsiveness, etc. In sum, it can be concluded that the study of factors

International Journal of Economics, Commerce and Management, United Kingdom
Licensed under Creative Common Page 465
influencing the supply chain is necessary in every industry. This is because it not only leads to
the identification of the strengths of the contributing factors and indicators (i.e. which have top
priorities), but also provides for the identification of weaknesses or factors and indicators that
are less significant in supply chains. The results of this process can ultimately contribute to the
continuous supervision, increased production, coordination, and development and preservation
of companies’ competitive advantage.
RESEARCH LIMITATIONS
Research limitations those factors standing in the way of data collection and hampers the
desired results .They are always limited in its investigation that some are even beginning to
show itself .
Of the main pillars of research is access to statistics and data. In this context, there are
problems that made research services such as access to books, magazines, statistics,
databases, etc. in the country simply is not possible. Part of the problem stems from the lack of
a culture of research services above and the other wrong, because these cases are considered
private and therefore their findings to other individuals and institutions refuse to kind of transfer.
The unwanted variables that may be the result of special projects and methods that are used in
research, often in different species, jeopardize the reliability of internal and external research.
Should be aware that in the Behavioral Sciences Research, control or total elimination of these
factors is impossible. However, researchers have found that these factors as much as possible
to anticipate, identify and apply all possible precautions to reduce them.
REFERENCES
Akdogan ,A.Asuman,Demirtas,(2014),"Managerial Role in Strategic Supply Chain Management ",Procedia- Social ang Behavioral Science 150,PP.1020-1029.
Alinezhad, Alireza, Shahriyari, Zahra, & Rahmati, Seyyed Habibullah (2014). Multi-facility positioning in a supply chain under fuzzy conditions. Industrial Management, no. 35, pp. 151-178.
Ansari, Iman, Sadeqi Muqadam, Muhammadreza (2014). Identifying, determining the relationships and prioritizing green supply chain management motives using the structural interpretive modeling approach. Industrial Management, no. 35, pp. 123-150.
Aqajani, Hassanali & Dargahi, Hadi (2012). Assessing supply chain suppliers using a combined approach resulted from multi-criteria decision making techniques in the fuzzy environment. Third national conference of industrial and systems engineering.
Ballard, R.L. (1996). Methods of Inventory Monitoring and Measurement. Journal of Logistics Information Management Vol. 9 No. 3, pp. 11-18.
Bimal Nepal, Om P. Yadav, Alper Murat (2010) “A fuzzy-AHP approach to prioritization of CS attributes in target planning for automotive product development” , Expert Systems with Applications, 37(10),PP. 6775-6786.

© Soheila, Alireza & Alireza
Licensed under Creative Common Page 466
Bolstorff, P. and R. Rosenbaum.) 2007(. Supply Chain Excellence: A Handbook for Dramatic Improvement Using the SCOR Model. Amacom : NewYork.
Breen, L. and Crawford, H. (2005). Improving the pharmaceutical supply chain. International Journal of Quality & Reliability Management, Vol. 22, No. 6, pp.572-591.
Chan, T. S. Qi, H. J. Chan, H. K, Lau. C. W, & Li, W. L. (2003). A conceptual model of performance measurement for supply chains. Management Decision,pp. 635-642.
Chen C-T, Lin C-T, Huang S-F. (2006). A fuzzy approach for supplier evaluation and selection in supply chain management, “International Journal of Production Economic”, 102, pp. 289–301.
Chopra, S., Meindl P. (2001). Supply Chain Management: Strategy, Planning, and Operations, 3rd Edition, Prentice-Hall, Inc.Hall,Upper Saddle River,New Jersey.
DeBoer, L. Labro E; Morlacchi P.,(2001),"A review of methods supporting supplier selection",European Journal oF Purchasing & Supply Management;Vol.7.
Dehqani Kazemi, Vahed, Jafari, Hamidreza Salehi, Ismail, & Yeganehkia, Zeynab (2012). Application of multi-criteria decision making techniques and fuzzy logic to the selection of the optimal method for disposal of Tehran City wastes. Second conference on planning and environment management.
Elbaz.M (2011)."Fuzzy performance measurement of supply chain in manufacturing companies, Expert Systems with Applications", Expert Systems with Applications, Vol 38, Issue 6, June 2011, PP.6681-6688.
Ellram, L.M. and Carr, A. (1994), “Strategic purchasing: A history and review of the literature”, International Journal of Purchasing and Material Management, 30, 2, 10-18.
Faraji Khorshidi, Hujjat Haddadi, Seyyed Mustafa (2008). Assessing the supply chain of pharmaceutical air rings in Iran: case study of Social Security Organization. Management Thoughts, no. 1, pp. 75-102.
Fischer, M., Law, K& Lee, H,.(2010). Real-Time Supply Chain Management (SCM) using Virtual Design and Construction (VDC) and Lean., s.l. : CIFE, Stanford University.
Ganesh, K., Narendran, T.T. and Anbuudayasankar, S.P, (2014) “Evolving cost-effective routing of vehicles for blood bank logistics”, International Journal of Logistics Systems and Management, Vol. 17, No. 4, pp. 381-415.
Gopal, K., & Wong, A.(1999), Business Excellence model for supply chain management. , s.l. : Total Quality Management, Vol. 10,PP.1147-1168.
Gowen, Charles R. Tallon, and William J. (2003). Enhancing supply chain practices through human resource management, Journal of Management Development, Vol. 22 No. 1, pp. 32-44.
Guritno, A.D. (2013). Development of supply chain risk management of fresh vegetables. Proceeding of Food Innovation Asia Conference 2013: Empowering SMEs through science and technology. Bangkok, Thailand.
Hasrulnizzam. W., Mahmood. W., & Muhamad. M.,s.l.(2009) , Supply Chain Management:After Business Process Re-Engineering.: World Academy of Science, Engineering and Technology,pp.53.
Heizer, J, and B. Render. (2014). Operations Management. John Wiley and Sons. Singapore.
Heydari, Jafar, Kazemzadeh brothers, and Chaharsouqi, Kamal (2007). Analyzing the effects of variations of delivery times on supply chain performance. fifth international conference on industrial engineering, Iran University of Science and Technology.
Houshmand, Maher, Majid, Amiri, Maqsud, Olfat, La’aya (2012). Integrated model of supplier selection in supply chains: Information technology potentials approach. Industrial management perspective, no. 8, pp. 91-115.
Hubner, R. (2007). "Strategic supply chain management in process industry". notes in economics and mathematical systems.
Husseini, Seyyed Mahmoud, Muhammadi, Amirsalar, & Pishvayi, Mirsaman (2010). The supply chain strategy and selection of production organization. Strategic management studies, no. 2, pp. 89-112.

International Journal of Economics, Commerce and Management, United Kingdom
Licensed under Creative Common Page 467
Ismaelian, Majid and Rabiyeh Masoud (2007). Assessment and selection of suppliers using fuzzy TOPSIS and fractional planning. Fifth national conference on industrial engineering.
Jafari, Morteza (2013). Applying the fuzzy TOPSIS method to the identification and ranking of factors influencing the performance of steel production companies. M.A. thesis, Islamic Azad University, Central Tehran Branch.
Javadian, Nikbakhsh, Khani, Mahdi, and Mahdavi, Iraj (2012). Identifying factors influencing supply chain management and its improvement using the system dynamics method. Management research in Iran, no. 3.
Karbasian, Mahdi, Javanmardi, Muhammad, Khaboushani, Azam & Zanjirchi, Seyyed Mahmoud (2011). Designing a composite approach using Interpretive Structural Modelling (ISM), TOPSIS and fuzzy AHP for selection and ranking of agile suppliers. Production and Operation Management Journal, no. 1, pp. 107-134.
Kazzazi, Abulfazl, Adel & Zangouyinezhad, Abudar (2012). Measuring the competitiveness of supply chains using the fuzzy approach. Roshd University Quarterly, no. 2, pp. 55-72.
Kazzazi,Abulfazl & Ruhollah Sohrabi (2010). Introducing the components and indicators of assessing supply chain agility in the National Iranian Oil Company (case study of National Iranian South Oil Company), evolution management bulletin, p. 144.
Ketchen, D.J. & Giunipero, L. C. (2004). "The intersection of strategic management and supply chain management". Industrial marketing management, 33, 51-56.
Khan Rai Waqas Azfar,Nawar, K., Hamza Farooq G.,(2014).” Performance Management: A Conceptual Framwork for Supply Chain Practices”, 10th International Strategic C onference, V.150,PP.803-812.
Khorshad, Iman (2014). The effective relationship of supply chain partners as the most important supply success factor in the automobile industry. no. 183, pp. 6-15.
Kiani-mavi, Reza, Rangriz, Hassan, and Ostad Ali Akbar, Arman (2011). Determining the status of productions of Godakhtar industrial group in the supply chain for improving its performance using the fuzzy TOPSIS AHP. Supply chain management quarterly, no. 34, pp. 38-47
Lee E.K. Ha S. Kim S.K. (2000)."Supplier selection and management system considering relationships in supply chain management"; IEEE transactions on Engineering Management, Vol. 48, No. 39.
Loudon,K,Laudon,J. (2001),Management Information system, PREN TICE-HALL,2002.
Ma’navi Zadeh, Neda., Masoud Rabbani, Kamran Rezayi, & Jafar Razmi (2006). Measuring supply chain performance in four key guilds in Iran. Industrial Engineering Department, Tehran University Technical College, www.sid.ir.
Mahnaz Daneshyan, Hassan Dehqan Dehnavi & Mahmoud Moein al-Din (2014). Ranking factors influencing supply chain performance management. International conference on management in the 21st century.
Manian, Amir, Dehqan Nayyeri, Mahmoud and Akhavan Anvari, Muhammadreza (2010). Identifying factors influencing supply chain performance. Iranian management sciences quarterly, no. 17, pp. 67-87.
McCormack, K.P, Johnson, W.C., and W.T. Walker. (2012). Supply Chain Networks and Business Process Orientation: Advanced Strategies and Best Practices. CRC Press LLC. Boca Raton Florida.
Mentzer, John T, Stank, Theodore P. and Matthew, B.(2006), Why Global Supply Chain Management?
Muhammadi Zanjirani, Duruish & Muhammad Modarres Yazdi (2007). An evident approach to measuring the performance of supply chain: introducing an instrument for the design and development of top supply chains in Iranian industries. Third national conference on performance management, p. 7.
Qaseni, Seyyed Ali, Danesh, Shahnaz (2012). Application of the fuzzy analytical hierarchy method for determining the optimal option for desalination of salty waters. Water and Soil Publication, no. 26, pp. 999-1009.

© Soheila, Alireza & Alireza
Licensed under Creative Common Page 468
Qazanfari, Mahdi, Riazi, Afshin, and Kazemi, Masoud (2001). Supply chain management. Tadbir, no. 117, pp. 20-27.
Rahman Seresht, Hussein, Rahman Seresht, Amir and Afsar (2008). The effect of information sharing on competitive strategies and supply chain management. Information and technology management journal, no. 1, pp. 37-48.
Sailin ,chin-T.,., chin-Beinchen.Ying-chan Ting, (2011),“An ERP model for supplier selection in electronic industry”, Expert system with application,No.38,pp.1760-1765.
Salimi, Meqdad, Afshar Najafi, Behrouz and Vahdani, Behnam (2014). An adaptive decision making model based on TOPSIS for nonlinear large-scale multi-objective planning problems with angular block structures under uncertainty conditions. Industrial Management Quarterly, no. 35, pp. 83-121.
Saunders, M.J. (1995). «Chains, Pipelines, networks and value stream: the role, nature and value of such metaphors in forming perceptions of the task of purchasing and supplymanagement», FirstWorldwide.
Schnetzler, M.J. Sennheiser, A. & Schonsleben, P. (2007). "A decomposition-based approach for the development of a supply chain strategy". International Journal of Production Economics, 105, 21-42.
Shahbandarzadeh, Hamid & Alireza Peykam (2012). Introducing a model for identification of factors influencing supply chain management using the survey of new studies. Third national conference on industrial and systems engineering.
Shekari, Amir & Khosrowjerdi, AmirHussein (2006). Introducing a supply chain performance assessment system based on the EFQM excellence model. Second conference on logistics and supply chain, Tehran, Iran’s Logistics Association.
Slack, N., S. Chamber, and R. Johnston,( 2013), Operations Management, Pearson Ed.
Soleymani, Shiri, Q. (2009). Supply chain with a fusion of analytical hierarchy process and idealistic planning (case study of automobile industries). Management Quarterly, no. 15.
Srvulaki, E. & Davis, M. (2010). "Aligningproduct with supply chain processes and strategy". The international journal of logistic management, 21, 127-151.
Tabibi, Muhammadreza & Mazlumi, Nader (2009). Introducing a model for the analysis of selection and application of business supply chain strategies. Management Sciences Quarterly, no. 16, 139-154.
Taranoush Jafari & Mohsen Fathi (2011). Supply chain assessment using the Data Envelopment Analysis (DEA) method. third national conference on DEA.
Terkman, Peter, McCormack, b Kevin and valadares, Marcos paulo. s.l.,(2010), The impact of business analytics on supply chain performance : Decision Support Systems, , Vol. 49. 318-327.
Tseng, m. l. and chiu, s. f. (2010). "Evaluating firm’s green supply chain management in linguistic preferences", “Journal of Cleaner Production”, 22 (3), 265-289.
Vaezi, Fereshteh and Shahraki, Alireza (2011).The role and obligations of knowledge-based management in the success of supply chain management. Forouq Tadbir, no. 18.
Waggoner, D. B. Neely, A. D. & Kennerley, M. P. (1999). The forces that shape organizational performance measurement system: An interdisciplinary review. International Journal of Production Economics, 60, 53-63.
Xinyan, Z., Song, H., & George,H Q. (2009), Tourism supply chain management: A new research agenda., s.l. : Tourism Management, Vol. 30,PP.345-358.