Ranger Funds Investment Trust · Ranger Funds Investment Trust ... 9,790 Cogent Communications...
36
Ranger Funds Investment Trust Ranger Small Cap Fund Institutional Class (RFISX) Ranger Quest for Income and Growth Fund Institutional Class (RFIDX) Investor Class (RFTDX) SEMI-ANNUAL REPORT JANUARY 31, 2017 (UNAUDITED)
-
Upload
hoangnguyet -
Category
Documents
-
view
218 -
download
2
Transcript of Ranger Funds Investment Trust · Ranger Funds Investment Trust ... 9,790 Cogent Communications...

Ranger Funds Investment Trust
Ranger Small Cap Fund
Institutional Class (RFISX)
Ranger Quest for Income and Growth Fund
Institutional Class (RFIDX) Investor Class (RFTDX)
SEMI-ANNUAL REPORT
JANUARY 31, 2017
(UNAUDITED)

RANGER FUNDS INVESTMENT TRUST RANGER SMALL CAP FUND
PORTFOLIO ANALYSIS JANUARY 31, 2017 (UNAUDITED)
The following chart gives a visual breakdown of the Fund by the industry sub-sectors that the underlying securities represent, as a percentage of net assets.
Medical Services 2.08%
Medical & Dental Instruments &
Supplies 5.50%
Health Care Services 3.73%
Auto Parts 1.94%
Banks: Diversified 9.31%
Utilit ies: Telecommunications
1.87%
Money Market Fund 3.50%
Agriculture Fishing & Ranching
2.66%
Back Office Support HR &
Consulting 7.24%
Liabilities Less Other Assets
(0.17)%
Office Supplies Equipment
1.90%
Oil: Crude Producers 5.06%
Restaurants 5.17%
Textiles Apparel & Shoes 3.75%
Truckers 2.78%
Recreational Vehicles & Boats
2.00%
Semiconductors & Components
5.08%
Specialty Retail 1.69%
Chemicals: Diversified 0.87%
Biotechnology 6.68%
Banks: Savings/Thrifts &
Mortgage Lending 1.02%
Foods 3.04%
Cosmetics 1.50%
Computer Services Software &
Systems 14.63%
Pharmaceuticals 7.17%
Per the fee table in the December 1, 2016 prospectus, the Fund's total annual operating expense ratio was 1.38% for Institutional Class shares. The total annual operating expense ratio after fee waiver and/or reimbursement was 1.10%. Please refer to the financial highlights for updated information regarding the Fund’s expense ratio. Portfolio composition is subject to change.

RANGER FUNDS INVESTMENT TRUST RANGER QUEST FOR INCOME & GROWTH FUND
PORTFOLIO ANALYSIS JANUARY 31, 2017 (UNAUDITED)
The following chart gives a visual breakdown of the Fund by the industry sub-sectors that the underlying securities represent, as a percentage of net assets.
Chemicals 6.12%
Commercial Banks 7.73%
Real Estate Investment Trusts
13.50%
Media 2.02%
Machinery 3.51%
IT Services 1.70%
Insurance 3.35%
Pharmaceut icals 3.28%
Software 2.99%
Transportation Infrastructure
0.40%
Money Market Fund 1.15%
Other Assets Less Liabilities
3.03%
Capital Markets 4.38%
Beverages 1.68%
Biotechnology 1.28%
Food Products 5.46%
Hotels, Restaurants & Leisure
2.53%
Airlines 2.44%
Semiconductors &
Semiconductor Equipment
4.11%
Oil, Gas & Consumable Fuels
4.16%
Independent Power Producers
& Energy Traders 1.52%
Computer Communications
Equipment 2.79%
Const ruction & Engineering
0.81%
Diversified Telecommunication
Services 5.77%
Automobiles 5.62%
Aerospace & Defense 2.81%
Master Limited Partnerships &
Publicly Traded Partnerships
5.86%
Per the fee table in the December 1, 2016 prospectus, the Fund's total annual operating expense ratio was 2.25% for Investor Class shares and 1.85% for Institutional Class shares. The total annual operating expense ratio after fee waiver and/or reimbursement was 1.56% for Investor Class shares, and 1.31% for Institutional Class shares. Please refer to the financial highlights for updated information regarding the Fund’s expense ratio. Portfolio Composition is subject to change.

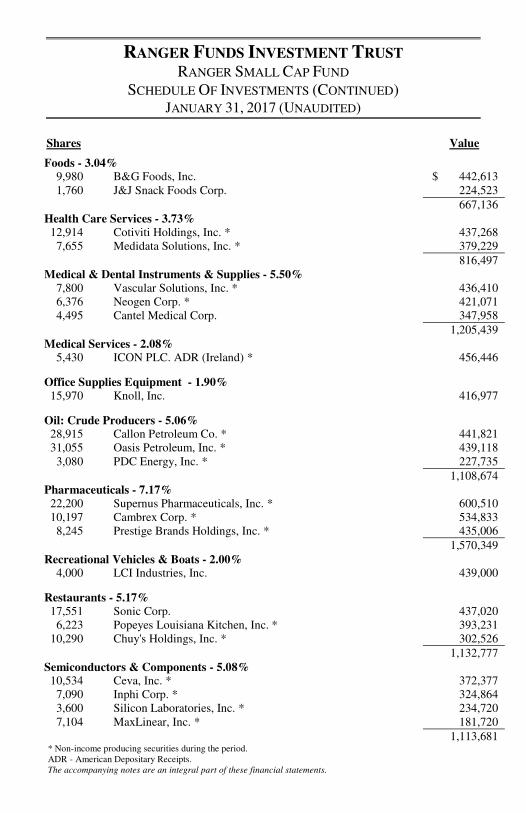
RANGER FUNDS INVESTMENT TRUST RANGER SMALL CAP FUND
SCHEDULE OF INVESTMENTS JANUARY 31, 2017 (UNAUDITED)
Shares Value
COMMON STOCKS - 96.67%
Agriculture Fishing & Ranching - 1.31% 5,201 Calavo Growers, Inc. $ 287,615 Auto Parts - 1.94% 6,170 Dorman Products, Inc. * 425,853 Back Office Support HR & Consulting - 7.24% 8,540 WageWorks, Inc. * 616,161 6,470 CEB, Inc. 494,631 8,630 Maximus, Inc. 475,858
1,586,650 Banks: Diversified - 9.31% 7,340 South State Corp. 656,196 6,580 Pinnacle Financial Partners, Inc. 439,873 6,310 PrivateBancorp, Inc. 344,905 3,830 Texas Capital Bancshares, Inc. * 315,975 11,570 Centerstate Banks, Inc. 282,192
2,039,141 Banks: Savings/Thrifts & Mortgage Lending - 1.02% 5,400 Legacy Texas Financial Group, Inc. 223,128 Biotechnology - 6.68% 11,740 PRA Health Sciences, Inc. * 687,847 15,290 Repligen Corp. * 459,312 4,560 Eagle Pharmaceuticals, Inc. * 315,598
1,462,757 Chemicals: Diversified - 0.87% 9,995 Aceto Corp. 190,805 Computer Services Software & Systems - 14.63% 16,709 Pegasystems, Inc. 648,309 5,970 LogMeln, Inc. 645,357 11,410 Broadsoft, Inc. * 479,220 5,440 Ellie Mae, Inc. * 450,106 11,025 Qualys, Inc. * 395,797 5,220 SPS Commerce, Inc. * 360,180 12,295 Callidus Software, Inc. * 226,843
3,205,812 Cosmetics - 1.50% 9,610 Inter Parfums, Inc. 327,701
* Non-income producing securities during the period. The accompanying notes are an integral part of these financial statements.
RANGER FUNDS INVESTMENT TRUST RANGER SMALL CAP FUND
SCHEDULE OF INVESTMENTS (CONTINUED) JANUARY 31, 2017 (UNAUDITED)
Shares Value
Foods - 3.04% 9,980 B&G Foods, Inc. $ 442,613 1,760 J&J Snack Foods Corp. 224,523
667,136 Health Care Services - 3.73% 12,914 Cotiviti Holdings, Inc. * 437,268 7,655 Medidata Solutions, Inc. * 379,229
816,497 Medical & Dental Instruments & Supplies - 5.50% 7,800 Vascular Solutions, Inc. * 436,410 6,376 Neogen Corp. * 421,071 4,495 Cantel Medical Corp. 347,958
1,205,439 Medical Services - 2.08% 5,430 ICON PLC. ADR (Ireland) * 456,446
Office Supplies Equipment - 1.90% 15,970 Knoll, Inc. 416,977
Oil: Crude Producers - 5.06% 28,915 Callon Petroleum Co. * 441,821 31,055 Oasis Petroleum, Inc. * 439,118 3,080 PDC Energy, Inc. * 227,735
1,108,674 Pharmaceuticals - 7.17% 22,200 Supernus Pharmaceuticals, Inc. * 600,510 10,197 Cambrex Corp. * 534,833 8,245 Prestige Brands Holdings, Inc. * 435,006
1,570,349 Recreational Vehicles & Boats - 2.00% 4,000 LCI Industries, Inc. 439,000
Restaurants - 5.17% 17,551 Sonic Corp. 437,020 6,223 Popeyes Louisiana Kitchen, Inc. * 393,231 10,290 Chuy's Holdings, Inc. * 302,526
1,132,777 Semiconductors & Components - 5.08% 10,534 Ceva, Inc. * 372,377 7,090 Inphi Corp. * 324,864 3,600 Silicon Laboratories, Inc. * 234,720 7,104 MaxLinear, Inc. * 181,720
1,113,681 * Non-income producing securities during the period. ADR - American Depositary Receipts. The accompanying notes are an integral part of these financial statements.
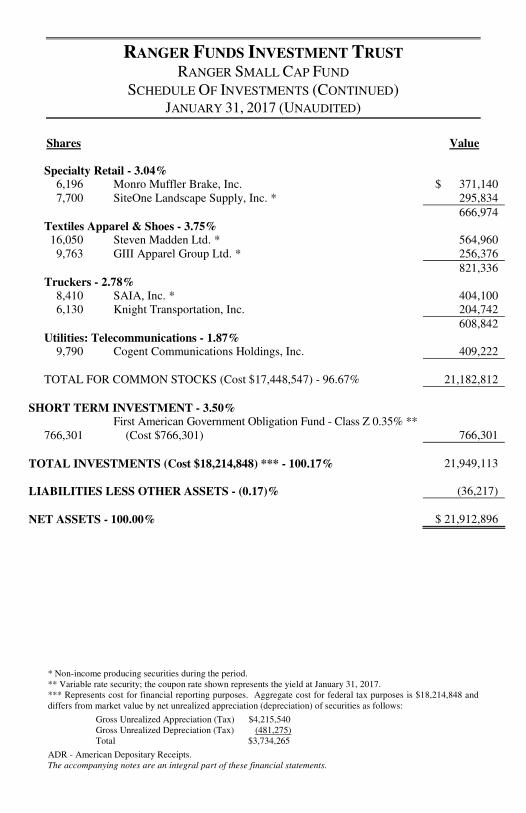
RANGER FUNDS INVESTMENT TRUST RANGER SMALL CAP FUND
SCHEDULE OF INVESTMENTS (CONTINUED) JANUARY 31, 2017 (UNAUDITED)
Shares Value Specialty Retail - 3.04% 6,196 Monro Muffler Brake, Inc. $ 371,140
7,700 SiteOne Landscape Supply, Inc. * 295,834
666,974 Textiles Apparel & Shoes - 3.75% 16,050 Steven Madden Ltd. * 564,960 9,763 GIII Apparel Group Ltd. * 256,376
821,336 Truckers - 2.78% 8,410 SAIA, Inc. * 404,100 6,130 Knight Transportation, Inc. 204,742
608,842 Utilities: Telecommunications - 1.87% 9,790 Cogent Communications Holdings, Inc. 409,222
TOTAL FOR COMMON STOCKS (Cost $17,448,547) - 96.67% 21,182,812
SHORT TERM INVESTMENT - 3.50%
766,301
First American Government Obligation Fund - Class Z 0.35% ** (Cost $766,301) 766,301
TOTAL INVESTMENTS (Cost $18,214,848) *** - 100.17% 21,949,113
LIABILITIES LESS OTHER ASSETS - (0.17)% (36,217)
NET ASSETS - 100.00% $ 21,912,896
* Non-income producing securities during the period. ** Variable rate security; the coupon rate shown represents the yield at January 31, 2017. *** Represents cost for financial reporting purposes. Aggregate cost for federal tax purposes is $18,214,848 and differs from market value by net unrealized appreciation (depreciation) of securities as follows:
Gross Unrealized Appreciation (Tax) $4,215,540 Gross Unrealized Depreciation (Tax) (481,275) Total $3,734,265
ADR - American Depositary Receipts. The accompanying notes are an integral part of these financial statements.
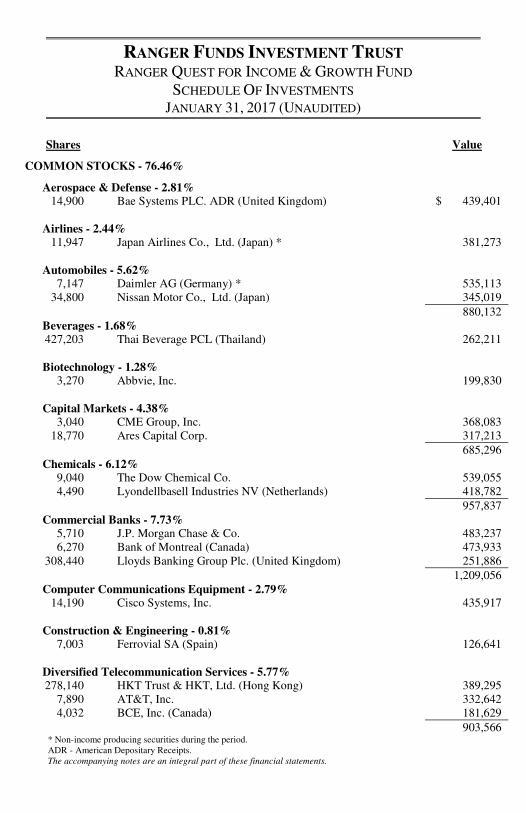
RANGER FUNDS INVESTMENT TRUST RANGER QUEST FOR INCOME & GROWTH FUND
SCHEDULE OF INVESTMENTS JANUARY 31, 2017 (UNAUDITED)
Shares Value
COMMON STOCKS - 76.46%
Aerospace & Defense - 2.81% 14,900 Bae Systems PLC. ADR (United Kingdom) $ 439,401 Airlines - 2.44% 11,947 Japan Airlines Co., Ltd. (Japan) * 381,273 Automobiles - 5.62% 7,147 Daimler AG (Germany) * 535,113 34,800 Nissan Motor Co., Ltd. (Japan) 345,019
880,132 Beverages - 1.68% 427,203 Thai Beverage PCL (Thailand) 262,211 Biotechnology - 1.28% 3,270 Abbvie, Inc. 199,830 Capital Markets - 4.38% 3,040 CME Group, Inc. 368,083 18,770 Ares Capital Corp. 317,213
685,296 Chemicals - 6.12% 9,040 The Dow Chemical Co. 539,055 4,490 Lyondellbasell Industries NV (Netherlands) 418,782
957,837 Commercial Banks - 7.73% 5,710 J.P. Morgan Chase & Co. 483,237 6,270 Bank of Montreal (Canada) 473,933 308,440 Lloyds Banking Group Plc. (United Kingdom) 251,886
1,209,056 Computer Communications Equipment - 2.79% 14,190 Cisco Systems, Inc. 435,917 Construction & Engineering - 0.81% 7,003 Ferrovial SA (Spain) 126,641 Diversified Telecommunication Services - 5.77% 278,140 HKT Trust & HKT, Ltd. (Hong Kong) 389,295 7,890 AT&T, Inc. 332,642 4,032 BCE, Inc. (Canada) 181,629
903,566 * Non-income producing securities during the period. ADR - American Depositary Receipts. The accompanying notes are an integral part of these financial statements.
RANGER FUNDS INVESTMENT TRUST RANGER QUEST FOR INCOME & GROWTH FUND
SCHEDULE OF INVESTMENTS (CONTINUED) JANUARY 31, 2017 (UNAUDITED)
Shares Value
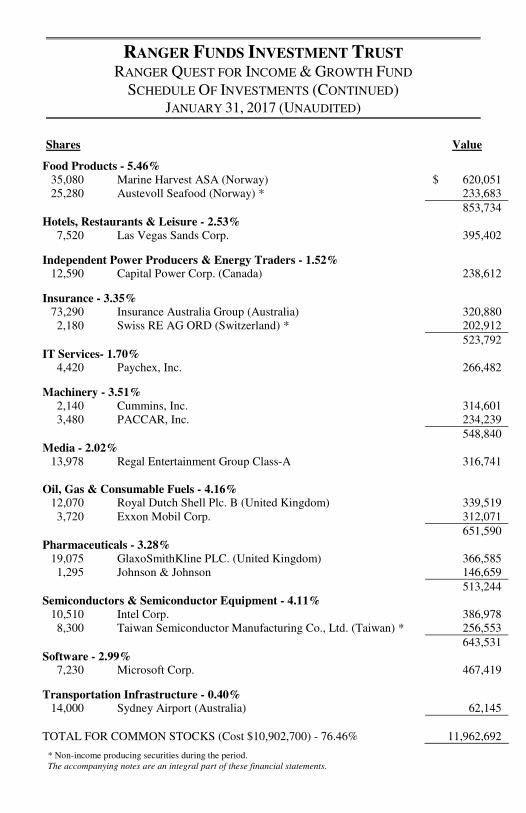
Food Products - 5.46% 35,080 Marine Harvest ASA (Norway) $ 620,051 25,280 Austevoll Seafood (Norway) * 233,683
853,734 Hotels, Restaurants & Leisure - 2.53% 7,520 Las Vegas Sands Corp. 395,402
Independent Power Producers & Energy Traders - 1.52% 12,590 Capital Power Corp. (Canada) 238,612
Insurance - 3.35% 73,290 Insurance Australia Group (Australia) 320,880 2,180 Swiss RE AG ORD (Switzerland) * 202,912
523,792 IT Services- 1.70% 4,420 Paychex, Inc. 266,482
Machinery - 3.51% 2,140 Cummins, Inc. 314,601 3,480 PACCAR, Inc. 234,239
548,840 Media - 2.02% 13,978 Regal Entertainment Group Class-A 316,741 Oil, Gas & Consumable Fuels - 4.16% 12,070 Royal Dutch Shell Plc. B (United Kingdom) 339,519 3,720 Exxon Mobil Corp. 312,071
651,590 Pharmaceuticals - 3.28% 19,075 GlaxoSmithKline PLC. (United Kingdom) 366,585 1,295 Johnson & Johnson 146,659
513,244 Semiconductors & Semiconductor Equipment - 4.11% 10,510 Intel Corp. 386,978 8,300 Taiwan Semiconductor Manufacturing Co., Ltd. (Taiwan) * 256,553
643,531 Software - 2.99% 7,230 Microsoft Corp. 467,419
Transportation Infrastructure - 0.40% 14,000 Sydney Airport (Australia) 62,145
TOTAL FOR COMMON STOCKS (Cost $10,902,700) - 76.46% 11,962,692
* Non-income producing securities during the period. The accompanying notes are an integral part of these financial statements.
RANGER FUNDS INVESTMENT TRUST RANGER QUEST FOR INCOME & GROWTH FUND
SCHEDULE OF INVESTMENTS (CONTINUED) JANUARY 31, 2017 (UNAUDITED)
Shares Value
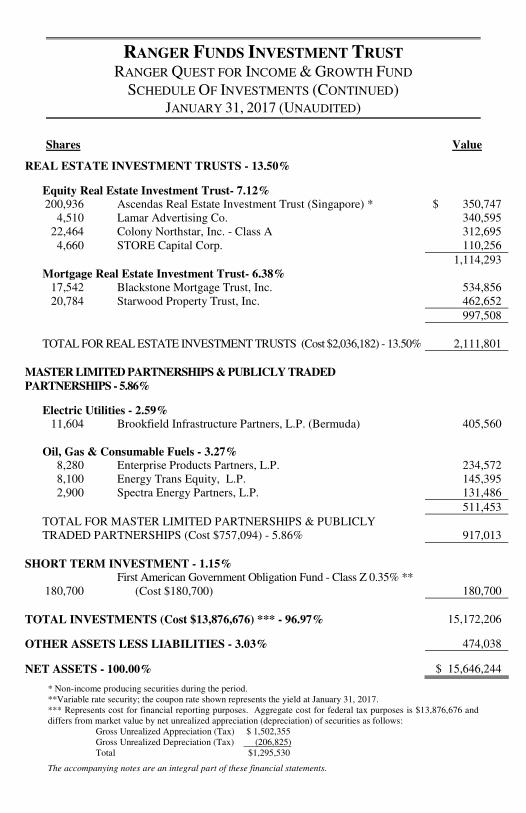
REAL ESTATE INVESTMENT TRUSTS - 13.50%
Equity Real Estate Investment Trust- 7.12% 200,936 Ascendas Real Estate Investment Trust (Singapore) * $ 350,747 4,510 Lamar Advertising Co. 340,595 22,464 Colony Northstar, Inc. - Class A 312,695 4,660 STORE Capital Corp. 110,256
1,114,293 Mortgage Real Estate Investment Trust- 6.38% 17,542 Blackstone Mortgage Trust, Inc. 534,856 20,784 Starwood Property Trust, Inc. 462,652
997,508
TOTAL FOR REAL ESTATE INVESTMENT TRUSTS (Cost $2,036,182) - 13.50% 2,111,801
MASTER LIMITED PARTNERSHIPS & PUBLICLY TRADED PARTNERSHIPS - 5.86%
Electric Utilities - 2.59% 11,604 Brookfield Infrastructure Partners, L.P. (Bermuda) 405,560 Oil, Gas & Consumable Fuels - 3.27% 8,280 Enterprise Products Partners, L.P. 234,572 8,100 Energy Trans Equity, L.P. 145,395 2,900 Spectra Energy Partners, L.P. 131,486
511,453
TOTAL FOR MASTER LIMITED PARTNERSHIPS & PUBLICLY TRADED PARTNERSHIPS (Cost $757,094) - 5.86% 917,013
SHORT TERM INVESTMENT - 1.15%
180,700 First American Government Obligation Fund - Class Z 0.35% ** (Cost $180,700) 180,700
TOTAL INVESTMENTS (Cost $13,876,676) *** - 96.97% 15,172,206
OTHER ASSETS LESS LIABILITIES - 3.03% 474,038
NET ASSETS - 100.00% $ 15,646,244
* Non-income producing securities during the period. **Variable rate security; the coupon rate shown represents the yield at January 31, 2017. *** Represents cost for financial reporting purposes. Aggregate cost for federal tax purposes is $13,876,676 and differs from market value by net unrealized appreciation (depreciation) of securities as follows:
Gross Unrealized Appreciation (Tax) $ 1,502,355 Gross Unrealized Depreciation (Tax) (206,825) Total $1,295,530
The accompanying notes are an integral part of these financial statements.
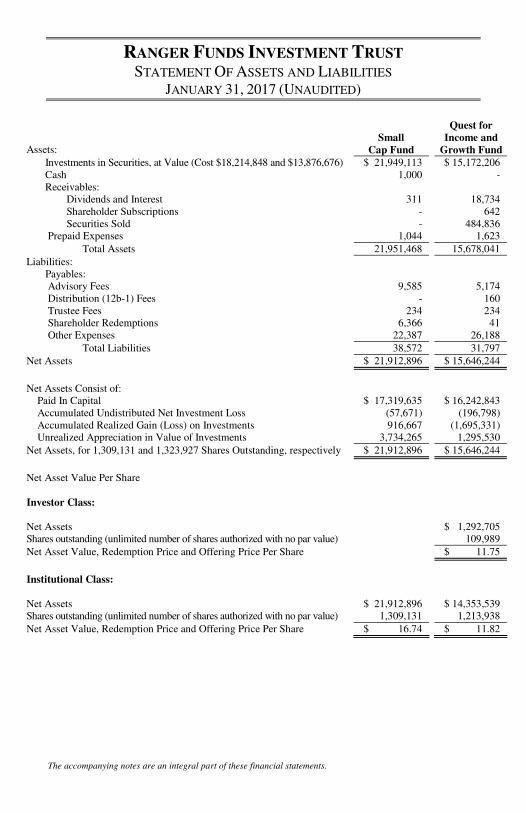
RANGER FUNDS INVESTMENT TRUST STATEMENT OF ASSETS AND LIABILITIES
JANUARY 31, 2017 (UNAUDITED)
Assets: Small
Cap Fund
Quest for Income and
Growth Fund Investments in Securities, at Value (Cost $18,214,848 and $13,876,676) $ 21,949,113 $ 15,172,206 Cash 1,000 - Receivables: Dividends and Interest 311 18,734 Shareholder Subscriptions - 642 Securities Sold - 484,836 Prepaid Expenses 1,044 1,623
Total Assets 21,951,468 15,678,041
Liabilities: Payables: Advisory Fees 9,585 5,174 Distribution (12b-1) Fees - 160 Trustee Fees 234 234 Shareholder Redemptions 6,366 41 Other Expenses 22,387 26,188
Total Liabilities 38,572 31,797
Net Assets $ 21,912,896 $ 15,646,244
Net Assets Consist of: Paid In Capital $ 17,319,635 $ 16,242,843 Accumulated Undistributed Net Investment Loss (57,671) (196,798) Accumulated Realized Gain (Loss) on Investments 916,667 (1,695,331) Unrealized Appreciation in Value of Investments 3,734,265 1,295,530
Net Assets, for 1,309,131 and 1,323,927 Shares Outstanding, respectively $ 21,912,896 $ 15,646,244
Net Asset Value Per Share Investor Class: Net Assets $ 1,292,705 Shares outstanding (unlimited number of shares authorized with no par value) 109,989
Net Asset Value, Redemption Price and Offering Price Per Share $ 11.75
Institutional Class: Net Assets $ 21,912,896 $ 14,353,539 Shares outstanding (unlimited number of shares authorized with no par value) 1,309,131 1,213,938
Net Asset Value, Redemption Price and Offering Price Per Share $ 16.74 $ 11.82
The accompanying notes are an integral part of these financial statements.
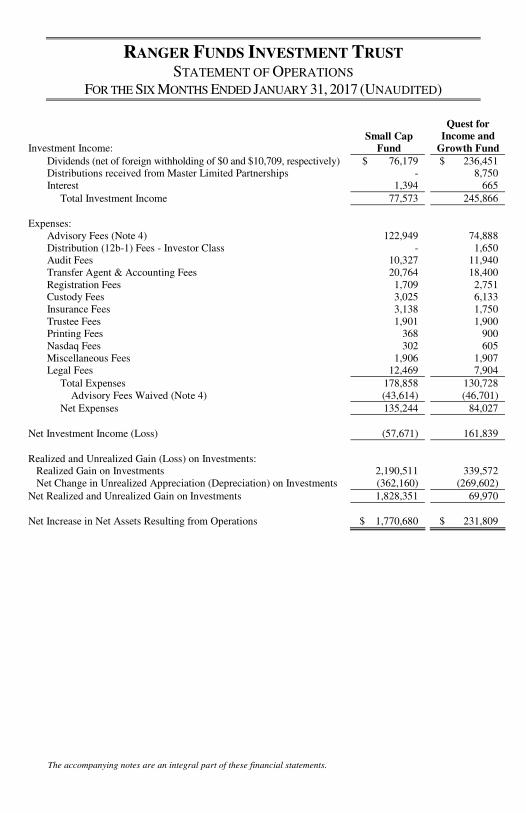
RANGER FUNDS INVESTMENT TRUST STATEMENT OF OPERATIONS
FOR THE SIX MONTHS ENDED JANUARY 31, 2017 (UNAUDITED)
Investment Income: Small Cap
Fund
Quest for Income and
Growth Fund Dividends (net of foreign withholding of $0 and $10,709, respectively) $ 76,179 $ 236,451 Distributions received from Master Limited Partnerships - 8,750 Interest 1,394 665
Total Investment Income 77,573 245,866
Expenses: Advisory Fees (Note 4) 122,949 74,888 Distribution (12b-1) Fees - Investor Class - 1,650 Audit Fees 10,327 11,940 Transfer Agent & Accounting Fees 20,764 18,400 Registration Fees 1,709 2,751 Custody Fees 3,025 6,133 Insurance Fees 3,138 1,750 Trustee Fees 1,901 1,900 Printing Fees 368 900 Nasdaq Fees 302 605 Miscellaneous Fees 1,906 1,907 Legal Fees 12,469 7,904
Total Expenses 178,858 130,728 Advisory Fees Waived (Note 4) (43,614) (46,701)
Net Expenses 135,244 84,027
Net Investment Income (Loss) (57,671) 161,839
Realized and Unrealized Gain (Loss) on Investments: Realized Gain on Investments 2,190,511 339,572 Net Change in Unrealized Appreciation (Depreciation) on Investments (362,160) (269,602)
Net Realized and Unrealized Gain on Investments 1,828,351 69,970
Net Increase in Net Assets Resulting from Operations $ 1,770,680 $ 231,809
The accompanying notes are an integral part of these financial statements.

RANGER FUNDS INVESTMENT TRUST RANGER SMALL CAP FUND
STATEMENTS OF CHANGES IN NET ASSETS
(Unaudited) Six Months Ended Year Ended 1/31/2017 7/31/2016 Increase (Decrease) in Net Assets From Operations: Net Investment Loss $ (57,671) $ (156,444) Net Realized Gain on Investments 2,190,511 1,135,740 Net Change in Unrealized Appreciation (Depreciation) on Investments (362,160) (460,604)
Net Increase in Net Assets Resulting from Operations 1,770,680 518,692 Distributions to Shareholders: Realized Gains (1,897,049) (1,549,408)
Total Distributions Paid to Shareholders (1,897,049) (1,549,408) Capital Share Transactions (Note 5) (5,086,780) 2,715,295
Total Increase (Decrease) in Net Assets (5,213,149) 1,684,579 Net Assets: Beginning of Period 27,126,045 25,441,466
End of Period (Including Undistributed Net Investment Loss
of $57,671 and $0, respectively) $ 21,912,896 $ 27,126,045
The accompanying notes are an integral part of these financial statements.
RANGER FUNDS INVESTMENT TRUST RANGER QUEST FOR INCOME & GROWTH FUND
STATEMENTS OF CHANGES IN NET ASSETS
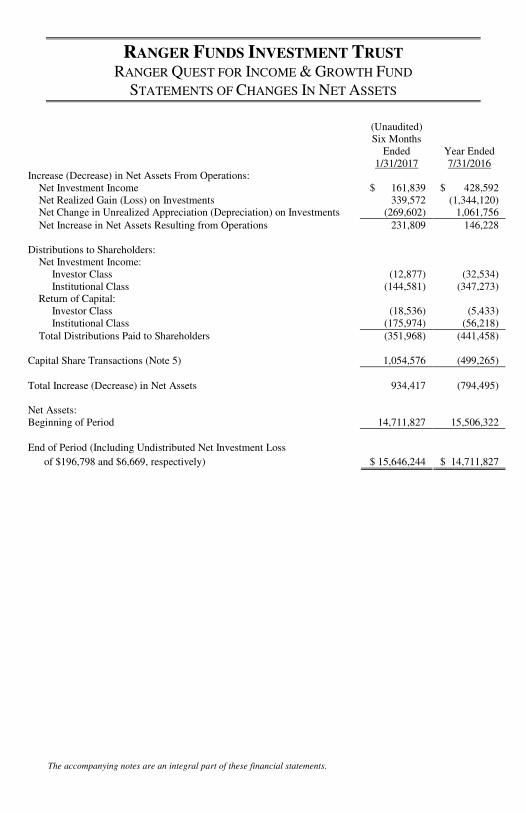
(Unaudited) Six Months Ended Year Ended 1/31/2017 7/31/2016 Increase (Decrease) in Net Assets From Operations: Net Investment Income $ 161,839 $ 428,592 Net Realized Gain (Loss) on Investments 339,572 (1,344,120) Net Change in Unrealized Appreciation (Depreciation) on Investments (269,602) 1,061,756
Net Increase in Net Assets Resulting from Operations 231,809 146,228 Distributions to Shareholders: Net Investment Income: Investor Class (12,877) (32,534) Institutional Class (144,581) (347,273) Return of Capital: Investor Class (18,536) (5,433) Institutional Class (175,974) (56,218)
Total Distributions Paid to Shareholders (351,968) (441,458) Capital Share Transactions (Note 5) 1,054,576 (499,265)
Total Increase (Decrease) in Net Assets 934,417 (794,495) Net Assets: Beginning of Period 14,711,827 15,506,322
End of Period (Including Undistributed Net Investment Loss
of $196,798 and $6,669, respectively) $ 15,646,244 $ 14,711,827
The accompanying notes are an integral part of these financial statements.

RANGER FUNDS INVESTMENT TRUST RANGER SMALL CAP FUND
FINANCIAL HIGHLIGHTS SELECTED DATA FOR AN INSTITUTIONAL CLASS SHARE OUTSTANDING THROUGHOUT THE PERIOD.
Years Ended
(Unaudited) Six Months
Ended 1/31/2017 7/31/2016 7/31/2015 7/31/2014 7/31/2013
Period Ended*
7/31/2012 Net Asset Value, at Beginning of Period $ 16.72 $ 17.69 $ 15.86 $ 15.33 $ 12.90 $ 10.00
Income (Loss) From Investment Operations: Net Investment Loss ** (0.04) (0.10) (0.06) (0.13) (0.08) (0.10) Net Gain (Loss) on Securities (Realized and Unrealized) 1.61 0.17 3.29 0.77 2.73 3.01
Total from Investment Operations 1.57 0.07 3.23 0.64 2.65 2.91 Distributions: Realized Gains (1.55) (1.04) (1.40) (0.11) (0.22) (0.01)
Total from Distributions (1.55) (1.04) (1.40) (0.11) (0.22) (0.01) Net Asset Value, at End of Period $ 16.74 $ 16.72 $ 17.69 $ 15.86 $ 15.33 $ 12.90
Total Return *** 9.41% (b) 0.87% 21.40% 4.17% 21.01% 29.15% (b) Ratios/Supplemental Data: Net Assets at End of Period (Thousands) $ 21,913 $27,126 $25,441 $18,719 $15,841 $ 8,811 Before Waivers Ratio of Expenses to Average Net Assets 1.46% (a) 1.38% 1.39% 1.49% 1.69% 2.29% (a) Ratio of Net Investment Loss to Average Net Assets (0.82)% (a) (0.93)% (0.63)% (1.16)% (1.15)% (2.00)% (a) After Waivers Ratio of Expenses to Average Net Assets 1.10% (a) 1.10% 1.10% 1.10% 1.13% 1.25% (a) Ratio of Net Investment Loss to Average Net Assets (0.47)% (a) (0.65)% (0.33)% (0.78)% (0.59)% (0.95)% (a) Portfolio Turnover 30.10% (b) 51.76% 68.50% 79.29% 86.85% 92.21% (b)
* For the period September 29, 2011 (commencement of investment operations) through July 31, 2012. ** Per share net investment income (loss) has been determined on the basis of average shares outstanding during the period. *** Assumes reinvestment of dividends. (a) Annualized. (b) Not annualized. The accompanying notes are an integral part of these financial statements.

RANGER FUNDS INVESTMENT TRUST RANGER QUEST FOR INCOME & GROWTH FUND
INVESTOR CLASS FINANCIAL HIGHLIGHTS
SELECTED DATA FOR AN INVESTOR CLASS SHARE OUTSTANDING THROUGHOUT THE PERIOD.
Years Ended
(Unaudited) Six Months
Ended 1/31/2017 7/31/2016 7/31/2015 7/31/2014
Period Ended *
7/31/2013 Net Asset Value, at Beginning of Period $ 11.87 $ 12.06 $ 12.98 $ 12.65 $ 12.70
Income From Investment Operations: Net Investment Income ** 0.12 0.32 0.38 0.71 0.05 Net Gain (Loss) on Securities (Realized and Unrealized) 0.03 (0.16) (0.84) 0.48 (0.05)
Total from Investment Operations 0.15 0.16 (0.46) 1.19 0.00 Distributions: Net Investment Income (0.11) (0.30) (0.46) (0.76) (0.05) Realized Gains - - - (0.10) - Return of Capital (0.16) (0.05) - - -
Total from Distributions (0.27) (0.35) (0.46) (0.86) (0.05) Net Asset Value, at End of Period $ 11.75 $ 11.87 $ 12.06 $ 12.98 $ 12.65
Total Return *** 1.34% (b) 1.47% (3.68)% 9.49% (0.02)% (b) Ratios/Supplemental Data: Net Assets at End of Period (Thousands) $ 1,293 $ 1,310 $ 1,356 $ 1,718 $ 2,731 Before Waivers Ratio of Expenses to Average Net Assets 1.97% (a) 2.04% 2.14% 2.24% 2.17% (a) Ratio of Net Investment Income to Average Net Assets 1.34% (a) 2.13% 2.22% 4.57% 1.81% (a) After Waivers Ratio of Expenses to Average Net Assets 1.35% (a) 1.35% 1.35% 1.35% 1.35% (a) Ratio of Net Investment Income to Average Net Assets 1.97% (a) 2.82% 3.01% 5.45% 2.63%(a) Portfolio Turnover 48.37%(b) 90.56% 36.85% 38.63% 46.45%(b)
* For the period June 4, 2013 (launch of share class) through July 31, 2013. ** Per share net investment income has been determined on the basis of average shares outstanding during the period. *** Assumes reinvestment of dividends. (a) Annualized (b) Not annualized The accompanying notes are an integral part of these financial statements.
RANGER FUNDS INVESTMENT TRUST RANGER QUEST FOR INCOME & GROWTH FUND
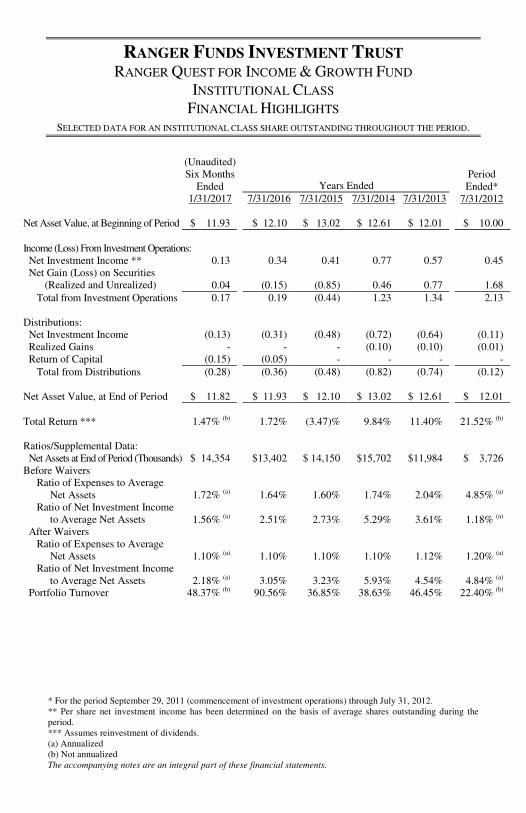
INSTITUTIONAL CLASS FINANCIAL HIGHLIGHTS
SELECTED DATA FOR AN INSTITUTIONAL CLASS SHARE OUTSTANDING THROUGHOUT THE PERIOD.
Years Ended
(Unaudited) Six Months
Ended 1/31/2017 7/31/2016 7/31/2015 7/31/2014 7/31/2013
Period Ended*
7/31/2012 Net Asset Value, at Beginning of Period $ 11.93 $ 12.10 $ 13.02 $ 12.61 $ 12.01 $ 10.00
Income (Loss) From Investment Operations: Net Investment Income ** 0.13 0.34 0.41 0.77 0.57 0.45 Net Gain (Loss) on Securities (Realized and Unrealized) 0.04 (0.15) (0.85) 0.46 0.77 1.68
Total from Investment Operations 0.17 0.19 (0.44) 1.23 1.34 2.13 Distributions: Net Investment Income (0.13) (0.31) (0.48) (0.72) (0.64) (0.11) Realized Gains - - - (0.10) (0.10) (0.01) Return of Capital (0.15) (0.05) - - - -
Total from Distributions (0.28) (0.36) (0.48) (0.82) (0.74) (0.12) Net Asset Value, at End of Period $ 11.82 $ 11.93 $ 12.10 $ 13.02 $ 12.61 $ 12.01
Total Return *** 1.47% (b) 1.72% (3.47)% 9.84% 11.40% 21.52% (b) Ratios/Supplemental Data: Net Assets at End of Period (Thousands) $ 14,354 $13,402 $ 14,150 $15,702 $11,984 $ 3,726 Before Waivers Ratio of Expenses to Average Net Assets 1.72% (a) 1.64% 1.60% 1.74% 2.04% 4.85% (a) Ratio of Net Investment Income to Average Net Assets 1.56% (a) 2.51% 2.73% 5.29% 3.61% 1.18% (a) After Waivers Ratio of Expenses to Average Net Assets 1.10% (a) 1.10% 1.10% 1.10% 1.12% 1.20% (a) Ratio of Net Investment Income to Average Net Assets 2.18% (a) 3.05% 3.23% 5.93% 4.54% 4.84% (a) Portfolio Turnover 48.37% (b) 90.56% 36.85% 38.63% 46.45% 22.40% (b)
* For the period September 29, 2011 (commencement of investment operations) through July 31, 2012. ** Per share net investment income has been determined on the basis of average shares outstanding during the period. *** Assumes reinvestment of dividends. (a) Annualized (b) Not annualized The accompanying notes are an integral part of these financial statements.
RANGER FUNDS INVESTMENT TRUST RANGER SMALL CAP FUND
RANGER QUEST FOR INCOME & GROWTH FUND NOTES TO FINANCIAL STATEMENTS
JANUARY 31, 2017 (UNAUDITED)
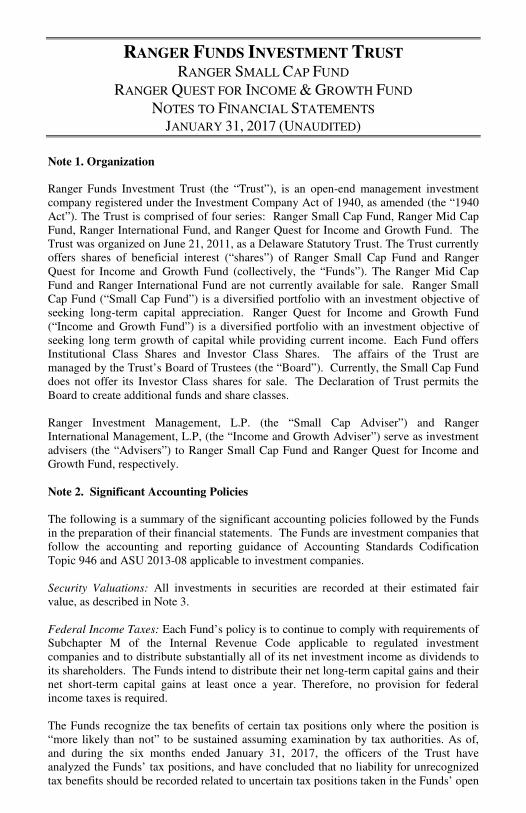
Note 1. Organization Ranger Funds Investment Trust (the “Trust”), is an open-end management investment company registered under the Investment Company Act of 1940, as amended (the “1940 Act”). The Trust is comprised of four series: Ranger Small Cap Fund, Ranger Mid Cap Fund, Ranger International Fund, and Ranger Quest for Income and Growth Fund. The Trust was organized on June 21, 2011, as a Delaware Statutory Trust. The Trust currently offers shares of beneficial interest (“shares”) of Ranger Small Cap Fund and Ranger Quest for Income and Growth Fund (collectively, the “Funds”). The Ranger Mid Cap Fund and Ranger International Fund are not currently available for sale. Ranger Small Cap Fund (“Small Cap Fund”) is a diversified portfolio with an investment objective of seeking long-term capital appreciation. Ranger Quest for Income and Growth Fund (“Income and Growth Fund”) is a diversified portfolio with an investment objective of seeking long term growth of capital while providing current income. Each Fund offers Institutional Class Shares and Investor Class Shares. The affairs of the Trust are managed by the Trust’s Board of Trustees (the “Board”). Currently, the Small Cap Fund does not offer its Investor Class shares for sale. The Declaration of Trust permits the Board to create additional funds and share classes. Ranger Investment Management, L.P. (the “Small Cap Adviser”) and Ranger International Management, L.P, (the “Income and Growth Adviser”) serve as investment advisers (the “Advisers”) to Ranger Small Cap Fund and Ranger Quest for Income and Growth Fund, respectively. Note 2. Significant Accounting Policies The following is a summary of the significant accounting policies followed by the Funds in the preparation of their financial statements. The Funds are investment companies that follow the accounting and reporting guidance of Accounting Standards Codification Topic 946 and ASU 2013-08 applicable to investment companies. Security Valuations: All investments in securities are recorded at their estimated fair value, as described in Note 3. Federal Income Taxes: Each Fund’s policy is to continue to comply with requirements of Subchapter M of the Internal Revenue Code applicable to regulated investment companies and to distribute substantially all of its net investment income as dividends to its shareholders. The Funds intend to distribute their net long-term capital gains and their net short-term capital gains at least once a year. Therefore, no provision for federal income taxes is required. The Funds recognize the tax benefits of certain tax positions only where the position is “more likely than not” to be sustained assuming examination by tax authorities. As of, and during the six months ended January 31, 2017, the officers of the Trust have analyzed the Funds’ tax positions, and have concluded that no liability for unrecognized tax benefits should be recorded related to uncertain tax positions taken in the Funds’ open

RANGER FUNDS INVESTMENT TRUST RANGER SMALL CAP FUND
RANGER QUEST FOR INCOME & GROWTH FUND NOTES TO FINANCIAL STATEMENTS (CONTINUED)
JANUARY 31, 2017 (UNAUDITED)
tax years or expected to be taken in the Funds’ 2017 tax returns. The Funds identify their major tax jurisdictions as U.S. Federal and certain State tax authorities; however, the Funds are not aware of any tax positions for which it is reasonably possible that the total amounts of unrecognized tax benefits will change materially in the next twelve months. The Funds recognize interest and penalties, if any, related to unrecognized tax benefits as income tax expense in the statement of operations. As of, and during the six months ended January 31, 2017, the Funds did not incur any interest or penalties. Distributions to Shareholders: Distributions to shareholders, which are determined in accordance with income tax regulations, are recorded on the ex-dividend date. The treatment for financial reporting purposes of distributions made to shareholders during the year from net investment income or net realized capital gains may differ from their ultimate treatment for federal income tax purposes. These differences are caused primarily by differences in the timing of the recognition of certain components of income, expense or realized capital gains for federal income tax purposes. Where such differences are permanent in nature, they are reclassified in the components of the net assets based on their ultimate characterization for federal income tax purposes. Any such reclassifications will have no effect on net assets, results of operations or net asset value per share of the Funds.
Use of Estimates: The preparation of financial statements in conformity with accounting principles generally accepted in the United States (“GAAP”) requires management to make estimates and assumptions that affect the reported amounts of assets and liabilities and disclosure of contingent assets and liabilities at the date of the financial statements and the reported amounts of increases and decreases in net assets from operations during the reporting period. Actual results could differ from those estimates. Small and Medium Capitalization Risk: Small or medium capitalization companies may be more at risk than large capitalization companies because, among other things, they may have limited product lines, operating history, market or financial resources, or because they may depend on a limited management group. The prices of securities of small and medium capitalization companies generally are more volatile than those of large capitalization companies and are more likely to be adversely affected by changes in earnings results and investor expectations or poor economic or market conditions than large capitalization companies. Securities of small and medium capitalization companies may underperform large capitalization companies, may be harder to sell at times and at prices the portfolio managers believe appropriate, and may offer greater potential for losses. Foreign Exchange Rate Risk: Foreign exchange rate risk relates to fluctuations in the value of an asset or liability due to changes in the currency exchange rates. Equity Risk: Equity risk relates to the change in value of equity securities as they relate to increases or decreases in the general market.

RANGER FUNDS INVESTMENT TRUST RANGER SMALL CAP FUND
RANGER QUEST FOR INCOME & GROWTH FUND NOTES TO FINANCIAL STATEMENTS (CONTINUED)
JANUARY 31, 2017 (UNAUDITED)
Investment transactions and related investment income: The Funds record security transactions on the trade date. The first-in first-out method is used for determining gains or losses for financial statement and income tax purposes. Dividend income is recognized on the ex-dividend date. Interest income is recognized on an accrual basis. Share valuation: The net asset value per share of each class of shares for Small Cap and Income and Growth are calculated daily by dividing the total value of a Fund’s assets attributable to that class, less liabilities attributable to that class, by the number of shares of that class outstanding. The offering price and redemption price per share of each class of Small Cap and Income and Growth is equal to the net asset value per share. Share Class Accounting: Investment income, common expenses and realized/unrealized gains (losses) on investments are allocated to each respective share class of the respective Fund on the basis of the daily net assets of each class. Fees relating to a specific class are charged directly to that share class. Each class of shares has equal rights as to assets of the respective Funds, and the classes are identical except for ongoing distribution fees. Investor Class shares are subject to distribution fees. All classes have equal voting privileges, except where otherwise required by law or when the Trustees determine that the matter to be voted on affects only the interests of the shareholders of a particular class. Translation of Foreign Currency: Assets and liabilities denominated in foreign currencies are translated into United States dollar amounts at the daily exchange rates. Transactions denominated in foreign currencies, including purchases and sales of investments, and income and expenses, are translated into United States dollar amounts on the transaction date. Adjustments arising from foreign currency transactions are reflected in the statement of operations. The Fund does not isolate that portion of the results of operations arising from the effect of changes in foreign exchange rates on investments from fluctuations arising from changes in market prices of investments held. Such fluctuations are included in net realized and unrealized gain on investments in the statement of operations. Guarantees and Indemnifications: In the normal course of business, the Funds enter into contracts with service providers that contain general indemnification clauses. The Funds’ maximum exposure under these arrangements is unknown and would involve future claims against the Funds’ that have not yet occurred. Based on experience, the Funds would expect the risk of loss to be remote. Transfer Agent Agreement and Accounting Services Agreement: Mutual Shareholder Services, LLC (“MSS”) serves as Transfer Agent to each Fund, pursuant to a Transfer Agency and Service Agreement with the Trust. Under the Transfer Agency and Service Agreement, MSS will provide all of the customary services of a transfer agent and dividend disbursing agent.

RANGER FUNDS INVESTMENT TRUST RANGER SMALL CAP FUND
RANGER QUEST FOR INCOME & GROWTH FUND NOTES TO FINANCIAL STATEMENTS (CONTINUED)
JANUARY 31, 2017 (UNAUDITED)
In addition, MSS provides accounting services to the Funds pursuant to a Fund Accounting Services Agreement with the Trust. As such, MSS provides all necessary administration, bookkeeping and pricing services to each Fund. For the services rendered to the Funds pursuant to the Transfer Agent Agreement and Accounting Services Agreement, each Fund pays MSS an annual fee based on the average value of the Fund. Each Fund receives a discount depending on the net assets of the Fund. For the six months ended January 31, 2017, the Small Cap Fund and the Income and Growth Fund incurred $20,764 and $18,400 in Transfer Agent and Accounting fees, respectively. At January 31, 2017, the Small Cap Fund and the Income and Growth Fund owed $5,097 and $2,989 in Transfer Agent and Accounting fees, respectively.
12b-1 Plan and Distribution Agreement: The Trust, on behalf of the Funds, has adopted a plan pursuant to Rule 12b-1 under the 1940 Act (the “Plan”). The Plan permits Investor Class shares of each Fund to pay for certain distribution and promotion expenses related to marketing shares of the Fund. The amount payable annually by each Fund’s Investor Class is 0.25% of its respective average daily net assets. Institutional Class shares of the Funds are not subject to a 12b-1 fee, and do not have a Rule 12b-1 plan. Under the Plan, the Trust may engage in any activities related to the distribution of Fund shares. Rafferty Capital Markets, LLC (the "Distributor") serves as the principal underwriter and national distributor for the shares of the Trust pursuant to a distribution agreement with the Trust (the "Distribution Agreement"). The Distribution Agreement provides that the Distributor, as agent in connection with the distribution of Fund shares, will use its best efforts to distribute the Funds' shares. The Trust and the Advisers are not affiliated with the Distributor. For the six months ended January 31, 2017, the Income and Growth Fund, Investor Class shares, accrued $1,650 in distribution fees. At January 31, 2017, the Income and Growth Fund, Investor Class shares, owed $160 in distribution fees.
Note 3. Security Valuations As described in Note 2, all investments in securities are recorded at their estimated fair value. The Funds utilize various methods to measure the fair value of most of their investments on a recurring basis. GAAP establishes a hierarchy that prioritizes inputs to valuation methods. The three levels of inputs are: Level 1 - Unadjusted quoted prices in active markets for identical assets or liabilities that the Funds have the ability to access. Level 2 - Observable inputs other than quoted prices included in Level 1 that are observable for the asset or liability, either directly or indirectly. These inputs may include quoted prices for the identical instrument in an inactive market, prices for similar

RANGER FUNDS INVESTMENT TRUST RANGER SMALL CAP FUND
RANGER QUEST FOR INCOME & GROWTH FUND NOTES TO FINANCIAL STATEMENTS (CONTINUED)
JANUARY 31, 2017 (UNAUDITED)
instruments, interest rates, prepayment speeds, credit risk, yield curves, default rates and similar data. Level 3 - Unobservable inputs for the asset or liability, to the extent relevant observable inputs are not available, representing the Funds’ own assumptions about the assumptions a market participant would use in valuating the asset or liability, and would be based on the best information available. The availability of observable inputs can vary from security to security and is affected by a wide variety of factors, including, for example, the type of security, whether the security is new and not yet established in the marketplace, the liquidity of markets, and other characteristics particular to the security. To the extent that valuation is based on models or inputs that are less observable or unobservable in the market, the determination of fair value requires more judgment. Accordingly, the degree of judgment exercised in determining fair value is greatest for instruments categorized in Level 3. The inputs used to measure fair value may fall into different levels of the fair value hierarchy. In such cases, for disclosure purposes, the level in the fair value hierarchy within which the fair value measurement falls in its entirety, is determined based on the lowest level input that is significant to the fair value measurement in its entirety. Fair Value Measurements: A description of the valuation techniques applied to the Funds’ major categories of assets and liabilities measured at fair value on a recurring basis follows. Equity securities (common stock including ADRs, closed end mutual funds, and real estate investment trusts) - Equity securities are valued by using market quotations furnished by a pricing service when the Advisers believe such prices accurately reflect the fair market value of such securities. Securities that are traded on any stock exchange are valued by the pricing service at the last quoted sale price. Lacking a last sale price, an exchange traded security is valued by the pricing service at its last bid price. Securities traded in the NASDAQ over-the-counter market are valued by the pricing service at the NASDAQ Official Closing Price. Generally, if the security is traded in an active market and is valued at the last sale price, the security is categorized as a Level 1 security. When the security position is not considered to be part of an active market or when the security is valued at the bid price, the position is generally categorized as a Level 2 security. When market quotations are not readily available, when the Advisers determine that the market quotation or the price provided by the pricing service does not accurately reflect the current market value or when restricted or illiquid securities are being valued, such securities are valued at fair value as determined by the Adviser in good faith, in accordance with guidelines adopted by and subject to review of the Board and are categorized as Level 3. The Income and Growth Fund may invest in publicly traded partnership interests (“PTPs”) and master limited partnership interests (“MLPs”), a subset of PTPs. PTPs are limited partnerships, the interests in which are known as “units”. PTP units typically

RANGER FUNDS INVESTMENT TRUST RANGER SMALL CAP FUND
RANGER QUEST FOR INCOME & GROWTH FUND NOTES TO FINANCIAL STATEMENTS (CONTINUED)
JANUARY 31, 2017 (UNAUDITED)
trade publically, like stocks, and thus may provide the investor more liquidity than ordinary limited partnerships. Generally, these securities will be classified as Level 1 of value hierarchy. Money market mutual funds are generally priced at the ending NAV provided by service agent of the Funds. These securities will be classified as Level 1 of the value hierarchy. Short term investments in fixed income securities with maturities of less than 60 days when acquired, or which subsequently are within 60 days of maturity, are valued by using amortized cost which approximates fair value and would be categorized as Level 2. The following table presents information about the Small Cap Fund’s investments measured at fair value as of January 31, 2017: Assets Level 1 Level 2 Level 3 Total
Common Stocks $21,182,812 $ - $ - $21,182,812 Short Term Investment 766,301 - - 766,301
Total $21,949,113 $ - $ - $21,949,113
The following table presents information about the Income and Growth Fund’s investments measured at fair value as of January 31, 2017: Assets Level 1 Level 2 Level 3 Total
Common Stocks $ 11,962,692 $ - $ - $ 11,962,692 Real Estate Investment Trusts 2,111,801 - - 2,111,801 Master Limited Partnerships & Publicly Traded Partnerships 917,013 - - 917,013 Short Term Investment 180,700 - - 180,700
Total $15,172,206 $ - $ - $15,172,206
Neither Fund held any Level 2 or Level 3 assets during the six months ended January 31, 2017. Therefore a reconciliation of assets in which significant unobservable inputs were used in determining fair value is not applicable. For more detail on the investments, please refer to the Schedules of Investments. Neither Fund had transfers into or out of Level 1, Level 2 or Level 3 during the six months ended January 31, 2017. The Funds consider transfers into and out of Level 1 and Level 2 as of the end of the reporting period. The Funds did not hold any derivative instruments at any time during the six months ended January 31, 2017. Note 4. Investment Advisory Fee and Other Transactions with Affiliates Pursuant to the Investment Management Agreements (“Advisory Agreements”) between the applicable Adviser and the Trust, the Small Cap Adviser and the Income and Growth Adviser, respectively, are entitled to investment advisory fees, computed daily and payable monthly of 1.0% per annum of the average daily net assets of Ranger Small Cap Fund and Ranger Quest for Income and Growth Fund, respectively. For the six months

RANGER FUNDS INVESTMENT TRUST RANGER SMALL CAP FUND
RANGER QUEST FOR INCOME & GROWTH FUND NOTES TO FINANCIAL STATEMENTS (CONTINUED)
JANUARY 31, 2017 (UNAUDITED)
ended January 31, 2017, the Advisers earned $122,949 and $74,888 from the Small Cap Fund and Income and Growth Fund, respectively. For the six months ended January 31, 2017, the Advisers waived $43,614 and $46,701 in expenses from the Small Cap Fund and Income and Growth Fund, respectively. At January 31, 2017, the Advisers were owed $9,585 and $5,174 from the Small Cap Fund and Income and Growth Fund, respectively. The Small Cap Adviser and the Income and Growth Adviser have each entered into an Expense Limitation Agreement with the Trust (the “Expense Limitation Agreements”), whereby they have agreed to reduce its fees and reimburse expenses with respect to each of the Funds so that the Net Annual Operating Expenses (exclusive of any Rule 12b-1 fees, acquired fund fees and expenses, distribution or shareholder servicing fees, brokerage commissions, interest, taxes and extraordinary expenses) of Ranger Small Cap Fund and Ranger Quest for Income and Growth Fund will not exceed 1.10% and 1.10%, respectively, until November 30, 2017. The Small Cap Adviser and the Income and Growth Adviser may recoup any waived amount from each respective Fund pursuant to these Expense Limitation Agreements if such reimbursement does not cause the respective Fund to exceed existing expense limitations and the reimbursement is made within three years after the year in which the respective adviser incurred the expenses. As of July 31, 2016, the Adviser is able to recapture $198,864 in expenses pursuant to the Expense Limitation Agreement for the Small Cap Fund. As of July 31, 2016, the Adviser is entitled to recapture $279,719 in expenses pursuant to the Expense Limitation Agreement for the Income and Growth Fund.
Fiscal Year Ended
Recoverable Through
Small Cap Fund
Income and Growth Fund
July 31, 2014 July 31, 2017 $68,990 $112,088
July 31, 2015 July 31, 2018 $64,004 $ 89,806
July 31, 2016 July 31, 2019 $65,870 $ 77,825 Each Trustee who is not affiliated with the Trust and/or the Advisers will receive an annual fee of $2,500, as well as reimbursement for any reasonable expenses incurred attending the meetings. The “interested person” who serves as Trustee of the Trust receives no compensation for his services as a Trustee. None of the executive officers receive compensation from the Trust. Note 5. Capital Share Transactions At January 31, 2017, there were unlimited shares authorized at no par value for the Ranger Funds Investment Trust (which includes the Small Cap Fund and the Income and Growth Fund). Paid in capital for the six months ended January 31, 2017 amounted to $17,319,635 and $16,242,843 for the Small Cap Fund and Income and Growth Fund, respectively. The following table summarizes transactions in capital for the six months ended January 31, 2017, and the year ended July 31, 2016:

RANGER FUNDS INVESTMENT TRUST RANGER SMALL CAP FUND
RANGER QUEST FOR INCOME & GROWTH FUND NOTES TO FINANCIAL STATEMENTS (CONTINUED)
JANUARY 31, 2017 (UNAUDITED)
Small Cap Fund – Institutional Class
Six Months Ended January 31, 2017
Year Ended July 31, 2016
Shares Amount Shares Amount Shares sold 111,371 $ 1,891,998 325,164 $ 4,888,213 Shares reinvested 58,467 974,649 59,276 918,777 Shares redeemed (482,918) (7,953,427) (200,571) (3,091,695)
Net increase (decrease) (313,080) $(5,086,780) 183,869 $2,715,295
Income and Growth Fund – Investor Class
Six Months Ended January 31, 2017
Year Ended July 31, 2016
Shares Amount Shares Amount Shares sold 7,870 $ 92,112 22,067 $ 237,537 Shares reinvested 2,712 31,413 4,559 52,505 Shares redeemed (10,999) (127,281) (28,731) (321,116)
Net decrease (417) $ (3,756) (2,105) $ (31,074)
Income and Growth Fund – Institutional Class
Six Months Ended January 31, 2017
Year Ended July 31, 2016
Shares Amount Shares Amount Shares sold 115,649 $1,351,187 116,833 $1,321,466 Shares reinvested 26,794 312,148 46,818 541,370 Shares redeemed (51,958) (605,003) (210,018) (2,331,027)
Net increase (decrease) 90,485 $1,058,332 (46,367) $ (468,191)
The Small Cap Fund has not issued Investor Class shares. Note 6. Investments Small Cap Fund
For the six months ended January 31, 2017, the cost of purchases and the proceeds from sales, other than U.S. Government securities and short-term securities, aggregated $6,952,735 and $13,809,100, respectively. For federal income tax purposes, as of January 31, 2017, the gross unrealized appreciation for all securities totaled $4,215,540 and the gross unrealized depreciation for all securities totaled $481,275, for a net unrealized appreciation of $3,734,265. The aggregate cost of securities for federal income tax purposes at January 31, 2017, was $18,214,848. Income and Growth Fund
For the six months ended January 31, 2017, the cost of purchases and the proceeds from sales, other than U.S. Government securities and short-term securities, aggregated $7,586,538 and $6,990,188, respectively. For federal income tax purposes, as of January 31, 2017, the gross unrealized appreciation for all securities totaled $1,502,355 and the gross unrealized depreciation for all securities totaled $206,825, for a net unrealized appreciation of $1,295,530. The aggregate cost of securities for federal income tax purposes at January 31, 2017, was $13,876,676.
RANGER FUNDS INVESTMENT TRUST RANGER SMALL CAP FUND
RANGER QUEST FOR INCOME & GROWTH FUND NOTES TO FINANCIAL STATEMENTS (CONTINUED)
JANUARY 31, 2017 (UNAUDITED)
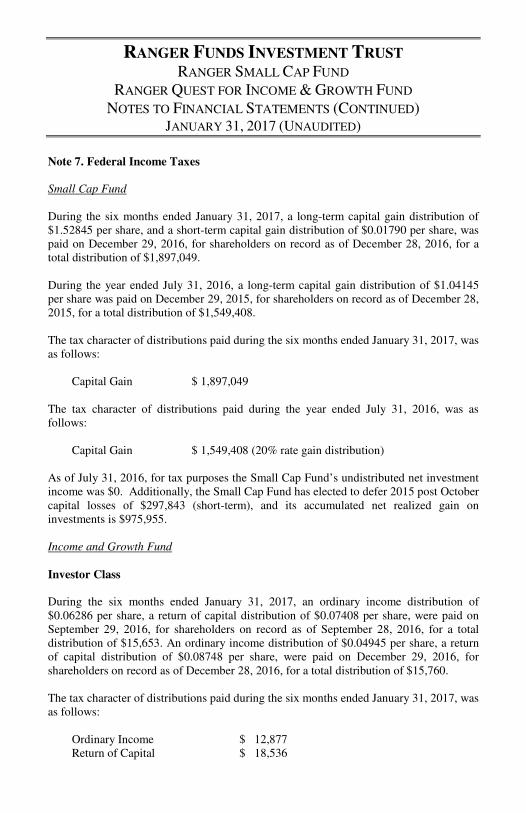
Note 7. Federal Income Taxes Small Cap Fund During the six months ended January 31, 2017, a long-term capital gain distribution of $1.52845 per share, and a short-term capital gain distribution of $0.01790 per share, was paid on December 29, 2016, for shareholders on record as of December 28, 2016, for a total distribution of $1,897,049. During the year ended July 31, 2016, a long-term capital gain distribution of $1.04145 per share was paid on December 29, 2015, for shareholders on record as of December 28, 2015, for a total distribution of $1,549,408. The tax character of distributions paid during the six months ended January 31, 2017, was as follows: Capital Gain $ 1,897,049 The tax character of distributions paid during the year ended July 31, 2016, was as follows: Capital Gain $ 1,549,408 (20% rate gain distribution) As of July 31, 2016, for tax purposes the Small Cap Fund’s undistributed net investment income was $0. Additionally, the Small Cap Fund has elected to defer 2015 post October capital losses of $297,843 (short-term), and its accumulated net realized gain on investments is $975,955. Income and Growth Fund
Investor Class During the six months ended January 31, 2017, an ordinary income distribution of $0.06286 per share, a return of capital distribution of $0.07408 per share, were paid on September 29, 2016, for shareholders on record as of September 28, 2016, for a total distribution of $15,653. An ordinary income distribution of $0.04945 per share, a return of capital distribution of $0.08748 per share, were paid on December 29, 2016, for shareholders on record as of December 28, 2016, for a total distribution of $15,760. The tax character of distributions paid during the six months ended January 31, 2017, was as follows: Ordinary Income $ 12,877 Return of Capital $ 18,536
RANGER FUNDS INVESTMENT TRUST RANGER SMALL CAP FUND
RANGER QUEST FOR INCOME & GROWTH FUND NOTES TO FINANCIAL STATEMENTS (CONTINUED)
JANUARY 31, 2017 (UNAUDITED)
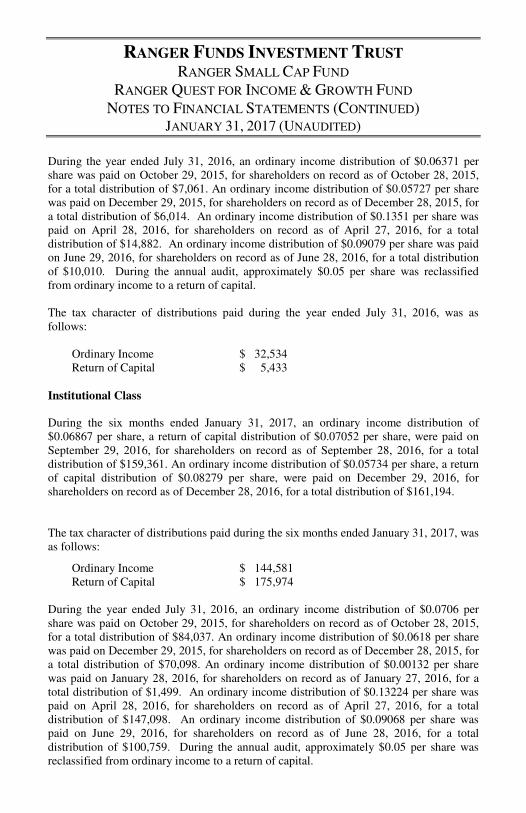
During the year ended July 31, 2016, an ordinary income distribution of $0.06371 per share was paid on October 29, 2015, for shareholders on record as of October 28, 2015, for a total distribution of $7,061. An ordinary income distribution of $0.05727 per share was paid on December 29, 2015, for shareholders on record as of December 28, 2015, for a total distribution of $6,014. An ordinary income distribution of $0.1351 per share was paid on April 28, 2016, for shareholders on record as of April 27, 2016, for a total distribution of $14,882. An ordinary income distribution of $0.09079 per share was paid on June 29, 2016, for shareholders on record as of June 28, 2016, for a total distribution of $10,010. During the annual audit, approximately $0.05 per share was reclassified from ordinary income to a return of capital. The tax character of distributions paid during the year ended July 31, 2016, was as follows: Ordinary Income $ 32,534 Return of Capital $ 5,433
Institutional Class During the six months ended January 31, 2017, an ordinary income distribution of $0.06867 per share, a return of capital distribution of $0.07052 per share, were paid on September 29, 2016, for shareholders on record as of September 28, 2016, for a total distribution of $159,361. An ordinary income distribution of $0.05734 per share, a return of capital distribution of $0.08279 per share, were paid on December 29, 2016, for shareholders on record as of December 28, 2016, for a total distribution of $161,194. The tax character of distributions paid during the six months ended January 31, 2017, was as follows:
Ordinary Income $ 144,581 Return of Capital $ 175,974 During the year ended July 31, 2016, an ordinary income distribution of $0.0706 per share was paid on October 29, 2015, for shareholders on record as of October 28, 2015, for a total distribution of $84,037. An ordinary income distribution of $0.0618 per share was paid on December 29, 2015, for shareholders on record as of December 28, 2015, for a total distribution of $70,098. An ordinary income distribution of $0.00132 per share was paid on January 28, 2016, for shareholders on record as of January 27, 2016, for a total distribution of $1,499. An ordinary income distribution of $0.13224 per share was paid on April 28, 2016, for shareholders on record as of April 27, 2016, for a total distribution of $147,098. An ordinary income distribution of $0.09068 per share was paid on June 29, 2016, for shareholders on record as of June 28, 2016, for a total distribution of $100,759. During the annual audit, approximately $0.05 per share was reclassified from ordinary income to a return of capital.
RANGER FUNDS INVESTMENT TRUST RANGER SMALL CAP FUND
RANGER QUEST FOR INCOME & GROWTH FUND NOTES TO FINANCIAL STATEMENTS (CONTINUED)
JANUARY 31, 2017 (UNAUDITED)
The tax character of distributions paid during the year ended July 31, 2016, was as follows:
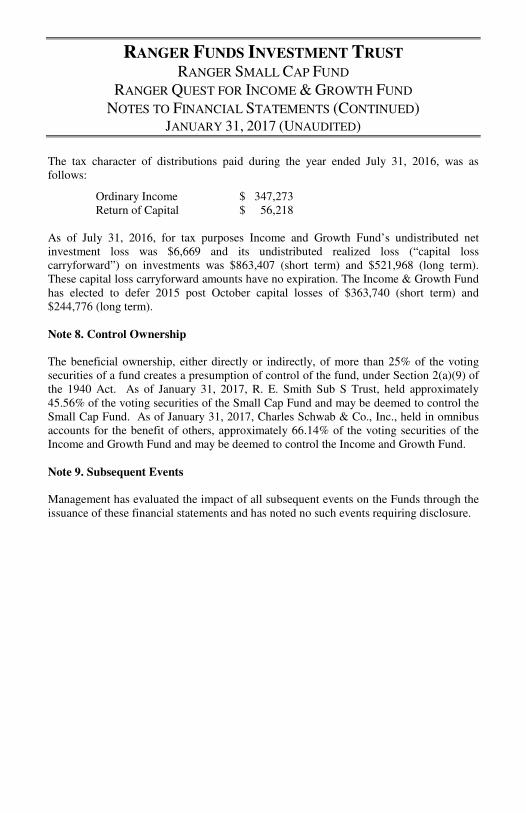
Ordinary Income $ 347,273 Return of Capital $ 56,218 As of July 31, 2016, for tax purposes Income and Growth Fund’s undistributed net investment loss was $6,669 and its undistributed realized loss (“capital loss carryforward”) on investments was $863,407 (short term) and $521,968 (long term). These capital loss carryforward amounts have no expiration. The Income & Growth Fund has elected to defer 2015 post October capital losses of $363,740 (short term) and $244,776 (long term). Note 8. Control Ownership The beneficial ownership, either directly or indirectly, of more than 25% of the voting securities of a fund creates a presumption of control of the fund, under Section 2(a)(9) of the 1940 Act. As of January 31, 2017, R. E. Smith Sub S Trust, held approximately 45.56% of the voting securities of the Small Cap Fund and may be deemed to control the Small Cap Fund. As of January 31, 2017, Charles Schwab & Co., Inc., held in omnibus accounts for the benefit of others, approximately 66.14% of the voting securities of the Income and Growth Fund and may be deemed to control the Income and Growth Fund. Note 9. Subsequent Events Management has evaluated the impact of all subsequent events on the Funds through the issuance of these financial statements and has noted no such events requiring disclosure.

RANGER FUNDS INVESTMENT TRUST RANGER SMALL CAP FUND
RANGER QUEST FOR INCOME & GROWTH FUND EXPENSE ILLUSTRATION
JANUARY 31, 2017 (UNAUDITED)
Expense Example
As a shareholder of the Funds, you incur ongoing costs which typically consist of management fees, 12b-1 fees, and other Fund expenses. This Example is intended to help you understand your ongoing costs (in dollars) of investing in the Funds and to compare these costs with the ongoing costs of investing in other mutual funds. The Example is based on an investment of $1,000 invested at the beginning of the period and held for the entire six month period, August 1, 2016 through January 31, 2017.
Actual Expenses
The first line of the table below provides information about actual account values and actual expenses. You may use the information in this line, together with the amount you invested, to estimate the expenses that you paid over the period. Simply divide your account value by $1,000 (for example, an $8,600 account value divided by $1,000 = 8.6), then multiply the result by the number in the first line under the heading entitled "Expenses Paid During the Period" to estimate the expenses you paid on your account during this period.
Hypothetical Example for Comparison Purposes
The second line of the table below provides information about hypothetical account values and hypothetical expenses based on each Fund’s actual expense ratio and an assumed rate of return of 5% per year before expenses, which is not the Fund’s actual return. The hypothetical account values and expenses may not be used to estimate the actual ending account balance or expenses you paid for the period. You may use this information to compare the ongoing costs of investing in these funds and other funds. To do so, compare this 5% hypothetical example with the 5% hypothetical examples that appear in the shareholder reports of the other funds.
Ranger Small Cap Fund
Beginning
Account Value Ending
Account Value Expenses Paid
During the Period*
August 1, 2016 January 31, 2017 August 1, 2016 to January 31, 2017
Actual $1,000.00 $1,094.07 $5.81 Hypothetical (5% Annual Return before expenses) $1,000.00 $1,019.66 $5.60 * Expenses are equal to the Fund's annualized expense ratio of 1.10%, multiplied by the average account value over the period, multiplied by 184/365 (to reflect the one-half year period).
RANGER FUNDS INVESTMENT TRUST RANGER SMALL CAP FUND
RANGER QUEST FOR INCOME & GROWTH FUND EXPENSE ILLUSTRATION (CONTINUED)
JANUARY 31, 2017 (UNAUDITED)
Ranger Quest for Income and Growth Fund - Investor Class
Beginning
Account Value Ending
Account Value Expenses Paid
During the Period*
August 1, 2016 January 31, 2017 August 1, 2016 to January 31, 2017
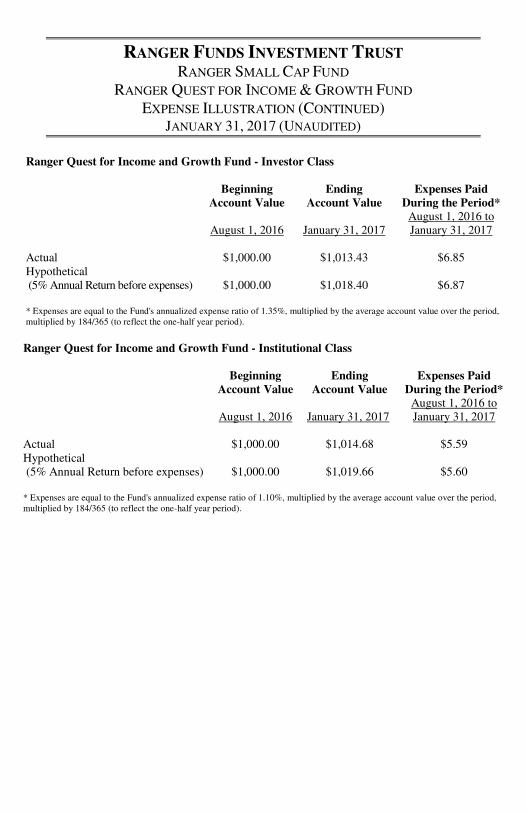
Actual $1,000.00 $1,013.43 $6.85 Hypothetical (5% Annual Return before expenses) $1,000.00 $1,018.40 $6.87 * Expenses are equal to the Fund's annualized expense ratio of 1.35%, multiplied by the average account value over the period, multiplied by 184/365 (to reflect the one-half year period).
Ranger Quest for Income and Growth Fund - Institutional Class
Beginning
Account Value Ending
Account Value Expenses Paid
During the Period*
August 1, 2016 January 31, 2017 August 1, 2016 to January 31, 2017
Actual $1,000.00 $1,014.68 $5.59 Hypothetical (5% Annual Return before expenses) $1,000.00 $1,019.66 $5.60 * Expenses are equal to the Fund's annualized expense ratio of 1.10%, multiplied by the average account value over the period, multiplied by 184/365 (to reflect the one-half year period).
RANGER FUNDS INVESTMENT TRUST RANGER SMALL CAP FUND
RANGER QUEST FOR INCOME & GROWTH FUND TRUSTEES & OFFICERS
JANUARY 31, 2017 (UNAUDITED)
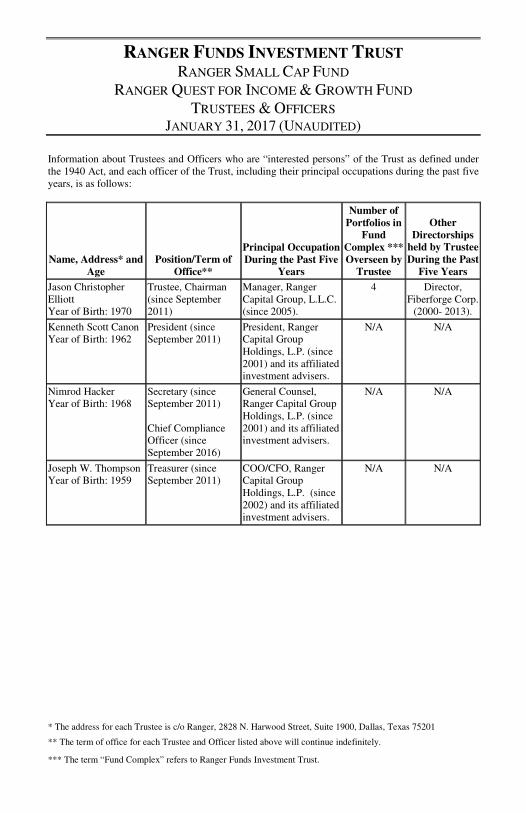
Information about Trustees and Officers who are “interested persons” of the Trust as defined under the 1940 Act, and each officer of the Trust, including their principal occupations during the past five years, is as follows:
Name, Address* and Age
Position/Term of Office**
Principal Occupation During the Past Five
Years
Number of Portfolios in
Fund Complex *** Overseen by
Trustee
Other Directorships
held by Trustee During the Past
Five Years
Jason Christopher Elliott Year of Birth: 1970
Trustee, Chairman (since September 2011)
Manager, Ranger Capital Group, L.L.C. (since 2005).
4 Director, Fiberforge Corp.
(2000- 2013).
Kenneth Scott Canon Year of Birth: 1962
President (since September 2011)
President, Ranger Capital Group Holdings, L.P. (since 2001) and its affiliated investment advisers.
N/A N/A
Nimrod Hacker Year of Birth: 1968
Secretary (since September 2011) Chief Compliance Officer (since September 2016)
General Counsel, Ranger Capital Group Holdings, L.P. (since 2001) and its affiliated investment advisers.
N/A N/A
Joseph W. Thompson Year of Birth: 1959
Treasurer (since September 2011)
COO/CFO, Ranger Capital Group Holdings, L.P. (since 2002) and its affiliated investment advisers.
N/A N/A
* The address for each Trustee is c/o Ranger, 2828 N. Harwood Street, Suite 1900, Dallas, Texas 75201
** The term of office for each Trustee and Officer listed above will continue indefinitely.
*** The term “Fund Complex” refers to Ranger Funds Investment Trust.

RANGER FUNDS INVESTMENT TRUST RANGER SMALL CAP FUND
RANGER QUEST FOR INCOME & GROWTH FUND TRUSTEES & OFFICERS (CONTINUED)
JANUARY 31, 2017 (UNAUDITED)
Information about Trustees who are not “interested persons” of the Trust as defined under the 1940 Act, including their principal occupations during the past five years, is as follows:
Name, Address* and Age
Position/Term of Office**
Principal Occupation During the Past Five
Years
Number of Portfolios in
Fund Complex*** Overseen by
Trustee
Other Directorships
held by Trustee During the
Past Five Years
James F. McCain Year of Birth: 1951
Independent Trustee (since September 2011)
Retired (since 8/2014); Chief Compliance Officer, SteelPath Capital Management LLC and SteelPath Fund Advisors, LLC; Chief Compliance Officer, SteelPath MLP Funds Trust (2010 – 8/2014); Chief Compliance Officer, Brazos Capital Management.
4 None
Curtis A. Hite Year of Birth: 1969
Independent Trustee (since September 2011)
CEO, Improving Holdings (since 2007) (technology consulting).
4 None
Benjamin C. Bell, Jr. Year of Birth: 1959
Independent Trustee (since March 2014)
Managing Member, William K. Woodruff & Co, LLC (since 2009) (investment advisory firm).
4 None
* The address for each Trustee is c/o Ranger, 2828 N. Harwood Street, Suite 1900, Dallas, Texas 75201
** The term of office for each Trustee and Officer listed above will continue indefinitely.
** *The term “Fund Complex” refers to Ranger Funds Investment Trust.
RANGER FUNDS INVESTMENT TRUST RANGER SMALL CAP FUND
RANGER QUEST FOR INCOME & GROWTH FUND ADDITIONAL INFORMATION
JANUARY 31, 2017 (UNAUDITED)
Information Regarding Proxy Voting
A description of the policies and procedures that the Funds use to determine how to vote proxies relating to portfolio securities and information regarding how the Funds voted proxies during the most recent 12-month period ended June 30, are available without charge upon request by (1) calling the Funds at (866) 458-4744 and (2) from Fund documents filed with the Securities and Exchange Commission ("SEC") on the SEC's website at www.sec.gov.
Information Regarding Portfolio Holdings
The Funds file a complete schedule of investments with the SEC for the first and third quarter of each fiscal year on Form N-Q. The Funds’ first and third fiscal quarters end on April 30 and October 31. The Funds’ Form N-Q’s are available on the SEC’s website at http://sec.gov, or they may be reviewed and copied at the SEC’s Public Reference Room in Washington, DC (call 1-800-732-0330 for information on the operation of the Public Reference Room). You may also obtain copies by calling the Funds at 1-866-458-4744.
Information Regarding Statement of Additional Information
The Statement of Additional Information includes additional information about the Trustees and is available without charge upon request, by calling toll free at 1-866-458-4744.
Renewal of Management Agreements The Board of Trustees (the "Board" or "Trustees") considered the renewal of a management agreement with Ranger International Management, LP, the Ranger Quest for Income and Growth Fund's investment adviser; and the renewal of a management agreement with Ranger Investment Management, LP, the Ranger Small Cap Fund's investment adviser, at an in person meeting held September 27, 2016. The Trustees review included, but was not limited to the following factors: (i) the investment performance of a fund and its adviser; (ii) the nature, extent and quality of the services provided by the adviser to a fund; (iii) the cost of the services to be provided and the profits to be realized by the adviser and its affiliates from the relationship with a fund; (iv) the extent to which economies of scale will be realized as a fund grows; and (v) whether the fee levels reflect these economies of scale to the benefit of fund shareholders. The conclusions reached by the Trustees were based on a comprehensive evaluation of all of the information provided and were not the result of any one factor. Moreover, each Trustee may have afforded different weight to the various factors in reaching his conclusions with respect to the advisory agreements.
Quest for Income & Growth Fund - Agreement with Ranger International Management, LP
Nature, Extent and Quality of Services. The Trustees reviewed the organizational structure of the Advisor and its investment philosophy, portfolio construction process, assets under management, and brokerage policies. The Board further reviewed the Advisor’s experience and the capabilities of its personnel, as well as the quality of the
RANGER FUNDS INVESTMENT TRUST RANGER SMALL CAP FUND
RANGER QUEST FOR INCOME & GROWTH FUND ADDITIONAL INFORMATION (CONTINUED)
JANUARY 31, 2017 (UNAUDITED)
reports and other materials provided to the Board. They noted that the Advisor also manages mutual funds not sponsored by the Trust or its affiliates. The Trustees acknowledged the Advisor’s continued commitment to compliance and risk management. They considered that the securities held in the portfolio are continually monitored with tools designed to identify potential and actual violations of internal guidelines, and the portfolio manager has ultimate responsibility for risk management, although risk is monitored by the entire investment team on a daily basis. They noted that the Advisor focused on risk management to the benefit of shareholders. They noted that the Advisor monitors the Fund’s NAV, reconciling with MSS and the custodian, as part of its high level of service provider oversight. They discussed recent personnel changes at the adviser, including the hiring of a new Compliance Associate and recent change in Chief Compliance Officer. Taking into account the personnel involved in servicing the Fund, as well as the materials and services described above, the Board expressed satisfaction with the quality of the services provided.
Performance. The Trustees noted that the Fund’s recent performance had been particularly strong and exhibits a good trend. They noted that for the month ending June 30, 2016, the period from May 1, 2016 to June 30, 2016 and the year to date, Income & Growth has out-performed both the MSCI ACWI Index and the Morningstar World Stock category. The Board was pleased with the overall performance of the Fund. The Board discussed the Advisor’s investment approach. The Advisor remains confident in its approach and does not plan to make any adjustments to its strategy or investment process, and the Fund will continue to base the investment approach upon a demographic group facing retirement during periods of low yield, making investments in quality, income-oriented securities. They noted that the Advisor seeks to invest in companies exhibiting specific characteristics which historically outperform over the longer term especially in down markets. The Board also noted that the Advisor does not utilize sub-advisors. The Board considered that the peer group funds selected are managed for total return derived from investments in global dividend income and growth shares.
Fees and Expenses. The Trustees noted that the Advisor’s management fee is 1.00%, and that the Advisor has contractually agreed to limit the Fund’s total operating expenses to 1.10%. They compared the advisory fee to that of a peer group of funds noting that the Fund’s fee is lower than the peer group average and among the lowest in the group. With respect to total operating expenses, the Trustees noted that although the Fund’s total expenses are higher than the peer group average of 0.80%, it is well within the range of peer group funds (0.55% to 1.24%). They further considered that the Advisor waived a significant portion of its advisory fees during the prior year pursuant to the expense limitation agreement in place. After further discussion, the Trustees concluded that the advisory fee is reasonable.
Profitability. The Trustees reviewed the profitability analysis provided by the Advisor and noted that there was a very modest profit in connection with its relationship with the Fund, but agreed that the level of profit was not unreasonable in terms of actual dollars. After discussion, the Trustees concluded that excessive profitability was not a concern at this time.
RANGER FUNDS INVESTMENT TRUST RANGER SMALL CAP FUND
RANGER QUEST FOR INCOME & GROWTH FUND ADDITIONAL INFORMATION (CONTINUED)
JANUARY 31, 2017 (UNAUDITED)
Economies of Scale. The Trustees noted the absence of breakpoints, but considered, given the size of the Fund, breakpoints are not realistic at this time. They further noted that the Advisor indicated it does not anticipate, based on current and projected asset levels, realizing breakpoints during the next 12 months. The Trustees concluded to monitor the Fund asset levels annually and revisit breakpoints in the future as economies are realized.
Conclusion. Having requested and received such information from the Advisor as the Board believed to be reasonably necessary to evaluate the terms of the Advisory Agreement, and as assisted by the advice of counsel, the Board concluded that the advisory fee structure is reasonable and that renewal of the Advisory Agreement is in the best interests of the Trust and shareholders of the Fund.
Small Cap Fund – Advisory Agreement with Ranger Investment Management, LP
Nature, Extent and Quality of Services. The Trustees reviewed the organizational structure of the Advisor and its investment philosophy, portfolio construction process, assets under management, and brokerage policies. The Board further reviewed the Advisor’s experience and the capabilities of its personnel, as well as the quality of the reports and other materials provided to the Board. They considered the Advisor’s culture of compliance noting that the Advisor had not reported compliance or regulatory issues or litigation since inception. The Board inquired as to the financial health of the Advisor, to which a representative of the Advisor confirmed that there were no issues to bring to the attention of the Board. The Board expressed satisfaction with the quality of the services provided.
Performance. The Trustees noted that the Fund returned 0.87% for the one year period ended July 31, 2016, and 15.33% since inception, outperforming the Morningstar Small Cap category over both periods (-6.41% and 13.67%, respectively) and the Russell 2000 Growth Index for the one year period ended July 31, 2016 (-5.30%). A representative of the Advisor provided data on the Fund’s recent outperformance in June, July, and August 2016, attributing the outperformance to the market’s appreciation of quality stocks. The Trustees discussed the Advisor’s peer group criteria, noting that the peer group consists of comparable institutional funds that are managed with an earnings bias that leans toward quality growth when compared to the Russell 2000 Growth. After further discussion, the Trustees were very pleased with the Fund’s performance.
Fees and Expenses. The Trustees noted that the Advisor’s management fee is 1.00%, and that the Advisor has contractually agreed to limit the Fund’s total operating expenses to 1.10%. They compared the advisory fee to that of a peer group of funds noting that the Fund’s advisory is lower than the peer group average of 1.285%. With respect to total operating expenses, the Trustees noted that the Fund’s total expenses are higher than the peer group average of 0.794% and is outside the range of peer group funds (0.40 to 1.00). They further considered that the Advisor waived a significant portion of its advisory fees

RANGER FUNDS INVESTMENT TRUST RANGER SMALL CAP FUND
RANGER QUEST FOR INCOME & GROWTH FUND ADDITIONAL INFORMATION (CONTINUED)
JANUARY 31, 2017 (UNAUDITED)
during the prior year pursuant to the expense limitation agreement in place. After further discussion, the Trustees concluded that the advisory fee was not unreasonable.
Profitability. The Trustees reviewed the profitability analysis provided by the Advisor and noted that net profits were low on an absolute basis in relation to the level and quality of resources provided to the Fund. After discussion, the Trustees concluded that excessive profitability was not a concern at this time.
Economies of Scale. The Trustees noted the absence of breakpoints, but considered, given the size of the Fund, breakpoints are not realistic at this time. They further noted that the Advisor indicated it does not anticipate, based on current and projected asset levels, realizing breakpoints during the next 12 months. The Trustees concluded to monitor the Fund asset levels annually and revisit breakpoints in the future as economies are realized.
Conclusion. Having requested and received such information from the Advisor as the Board believed to be reasonably necessary to evaluate the terms of the Advisory Agreement, and as assisted by the advice of counsel, the Board concluded that the advisory fee structure is reasonable and that renewal of the Advisory Agreement is in the best interests of the Trust and shareholders of the Fund.