
Range-Through Chart and Diversity Curve Lab Dr. Kate Bulinski Bellarmine University.
21
Range-Through Chart and Diversity Curve Lab Dr. Kate Bulinski Bellarmine University
-
Upload
lawrence-dalton -
Category
Documents
-
view
217 -
download
0
Transcript of Range-Through Chart and Diversity Curve Lab Dr. Kate Bulinski Bellarmine University.
Range-Through Chart and Diversity Curve Lab
Dr. Kate BulinskiBellarmine University

Geology for Non-Science Majors
• Meets for 2 hours twice a week• First hour lecture, second hour lab• Lab reinforces concepts introduced in lecture• Limited to 20 students• Students work in groups of 3-4
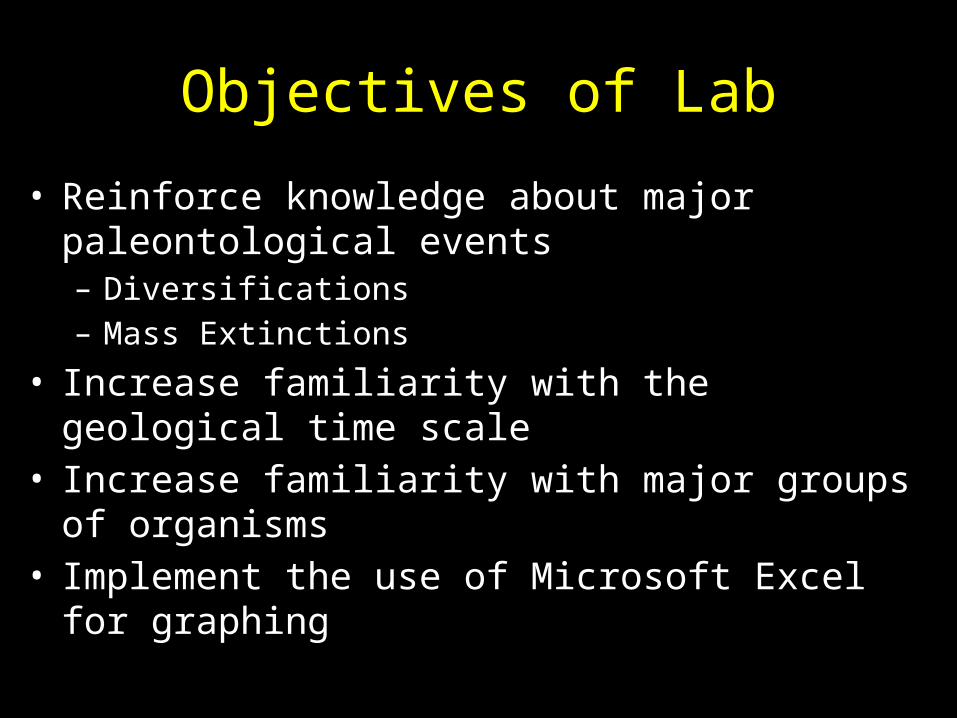
Objectives of Lab
• Reinforce knowledge about major paleontological events– Diversifications– Mass Extinctions
• Increase familiarity with the geological time scale• Increase familiarity with major groups of organisms• Implement the use of Microsoft Excel for graphing

Next:Sample Lecture Slides
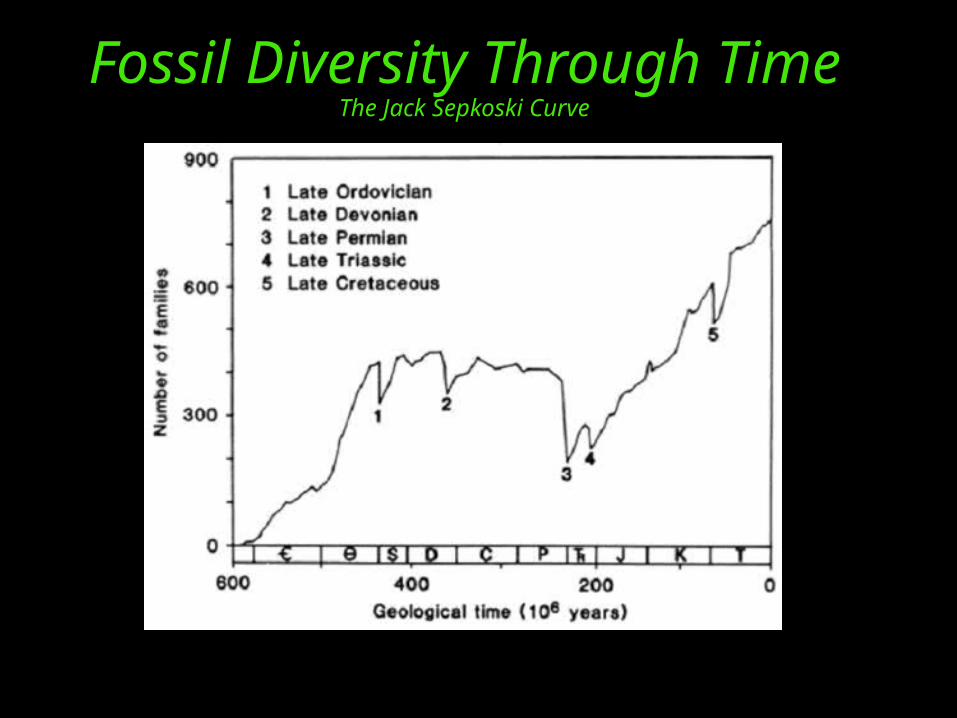
Fossil Diversity Through TimeThe Jack Sepkoski Curve
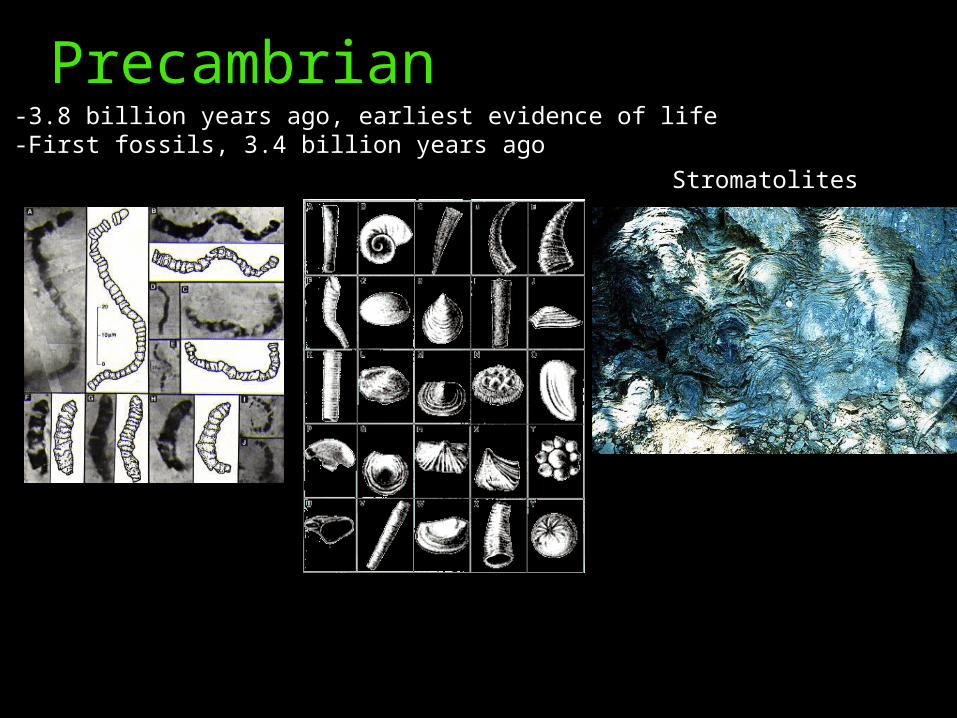
Precambrian-3.8 billion years ago, earliest evidence of life-First fossils, 3.4 billion years ago
Stromatolites
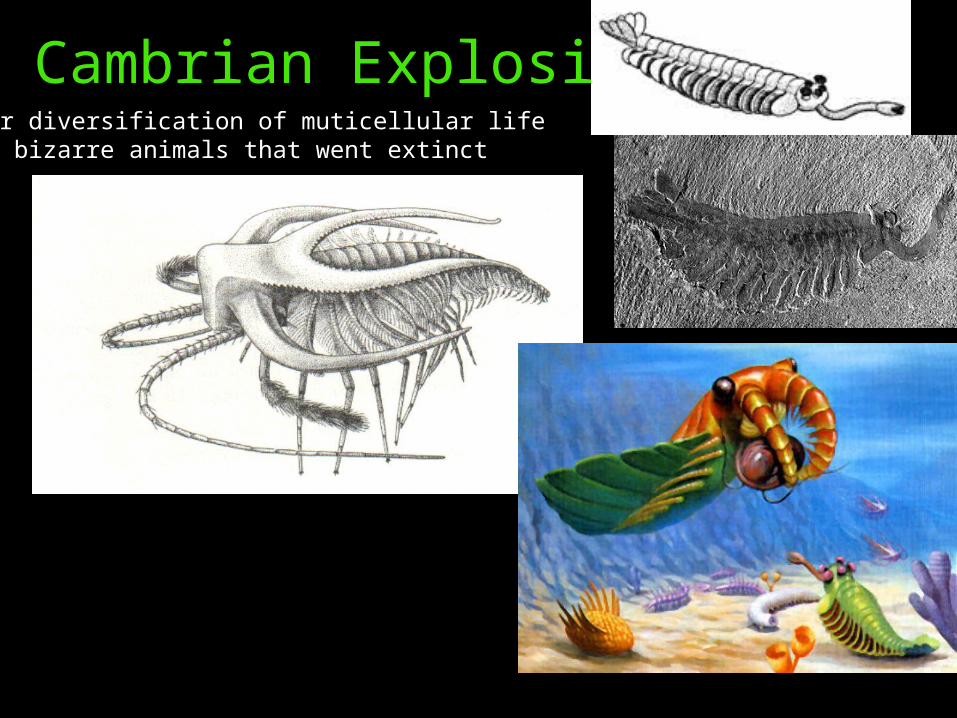
Cambrian Explosion-Major diversification of muticellular life-Many bizarre animals that went extinct
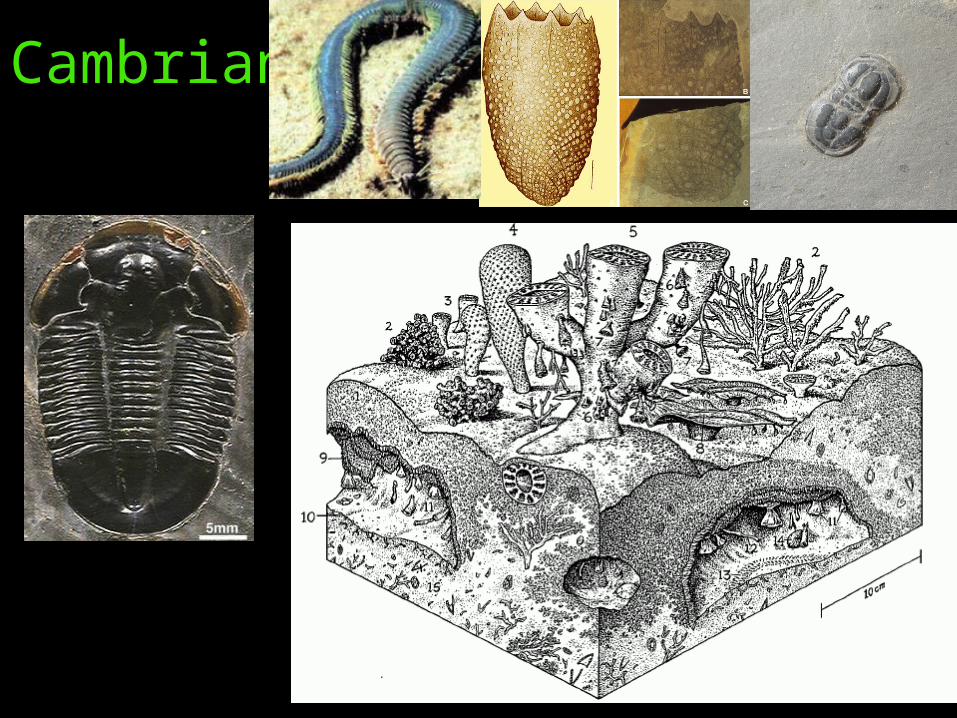
Cambrian
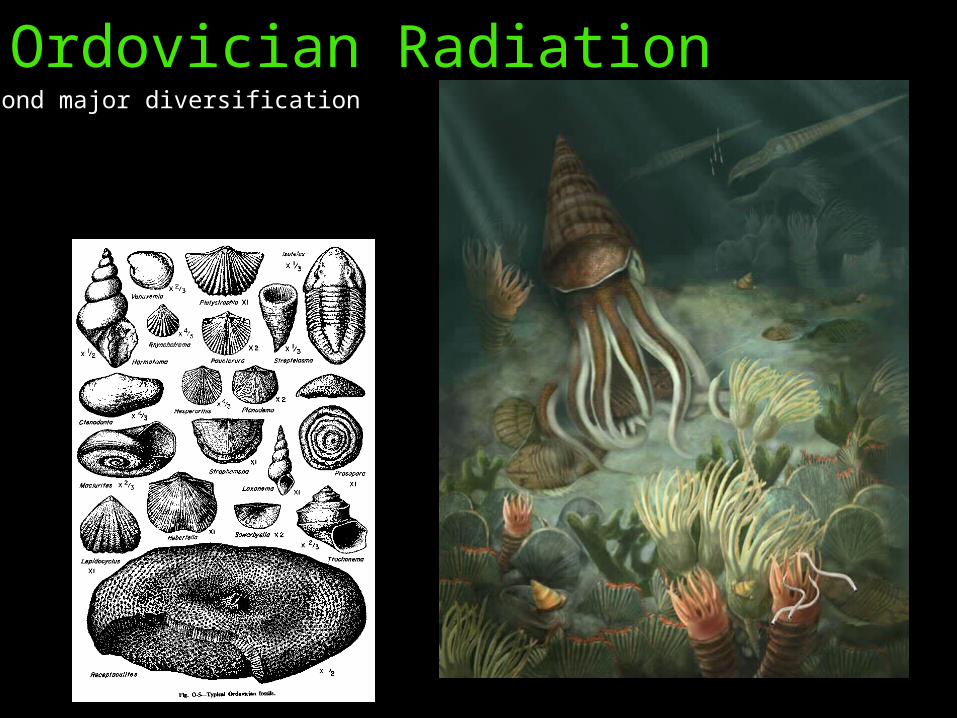
Ordovician Radiation-Second major diversification
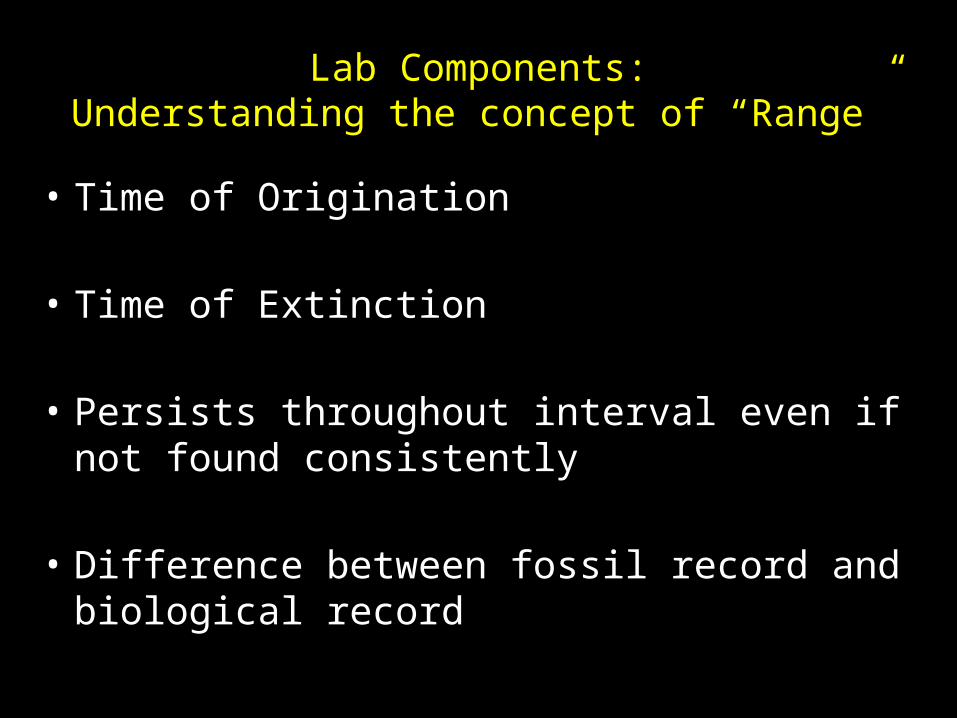
Lab Components:Understanding the concept of “Range”
• Time of Origination
• Time of Extinction
• Persists throughout interval even if not found consistently
• Difference between fossil record and biological record

Linking Names to Fossils• Previous knowledge obtained from
systematics lab can be reinforced here:– Students must correctly identify hand specimens
to pair times of origination and extinction with names of fossil groups

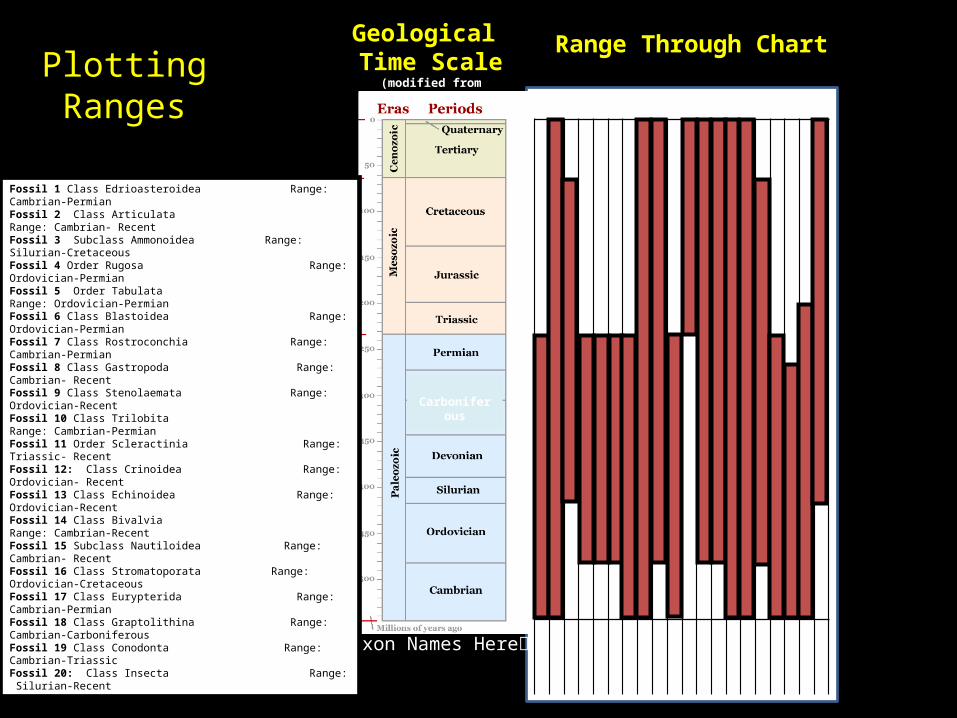
Plotting Ranges
Carboniferous
Geological Time Scale
(modified from geology.com)
Write Taxon Names Here
Range Through Chart

Plotting Ranges
Carboniferous
Geological Time Scale
(modified from geology.com)
Write Taxon Names Here
Range Through Chart
Fossil 1 Class Edrioasteroidea Range: Cambrian-PermianFossil 2 Class Articulata Range: Cambrian- RecentFossil 3 Subclass Ammonoidea Range: Silurian-CretaceousFossil 4 Order Rugosa Range: Ordovician-PermianFossil 5 Order Tabulata Range: Ordovician-PermianFossil 6 Class Blastoidea Range: Ordovician-PermianFossil 7 Class Rostroconchia Range: Cambrian-PermianFossil 8 Class Gastropoda Range: Cambrian- RecentFossil 9 Class Stenolaemata Range: Ordovician-RecentFossil 10 Class Trilobita Range: Cambrian-PermianFossil 11 Order Scleractinia Range: Triassic- RecentFossil 12: Class Crinoidea Range: Ordovician- RecentFossil 13 Class Echinoidea Range: Ordovician-RecentFossil 14 Class Bivalvia Range: Cambrian-RecentFossil 15 Subclass Nautiloidea Range: Cambrian- RecentFossil 16 Class Stromatoporata Range: Ordovician-CretaceousFossil 17 Class Eurypterida Range: Cambrian-PermianFossil 18 Class Graptolithina Range: Cambrian-CarboniferousFossil 19 Class Conodonta Range: Cambrian-TriassicFossil 20: Class Insecta Range: Silurian-Recent
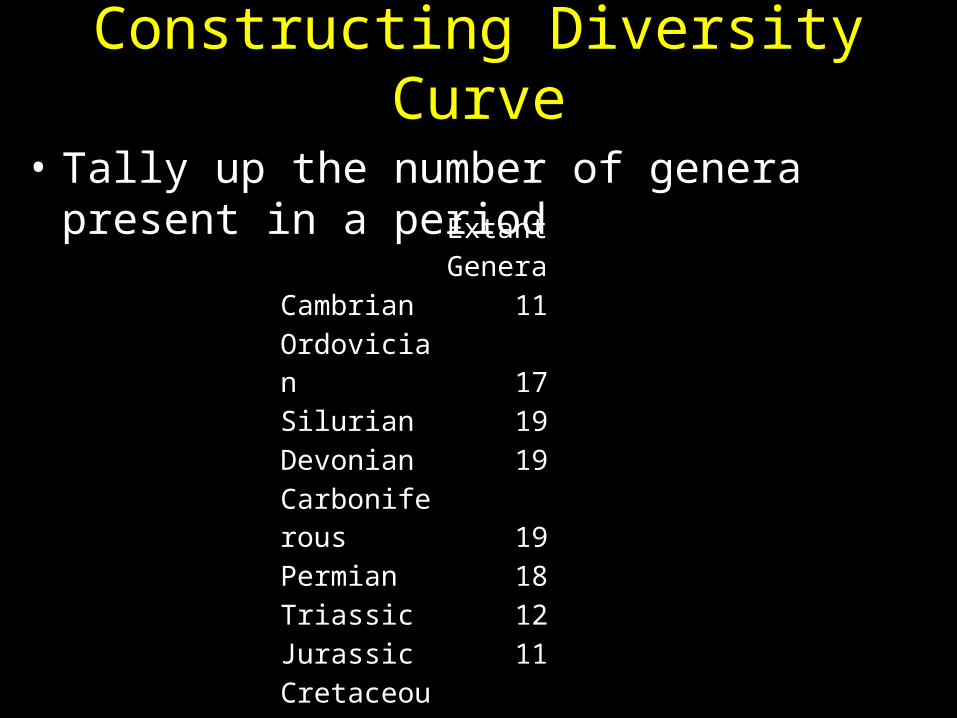
Constructing Diversity Curve
Extant GeneraCambrian 11Ordovician 17Silurian 19Devonian 19Carboniferous 19Permian 18Triassic 12Jurassic 11Cretaceous 11Cenozoic 9Recent 9
• Tally up the number of genera present in a period

Cambrian
Ordovician
Silurian
Devonian
Carboniferous
Permian
Triassic
Jurassic
Cretaceous
Cenozoic
Recent
0
2
4
6
8
10
12
14
16
18
20
Num
ber
of T
axa
Extant Genera
Cambrian 11
Ordovician 17
Silurian 19
Devonian 19
Carboniferous 19
Permian 18
Triassic 12
Jurassic 11
Cretaceous 11
Cenozoic 9
Recent 9
Geologic Time Labled at Ends of Periods
Diversity Curve
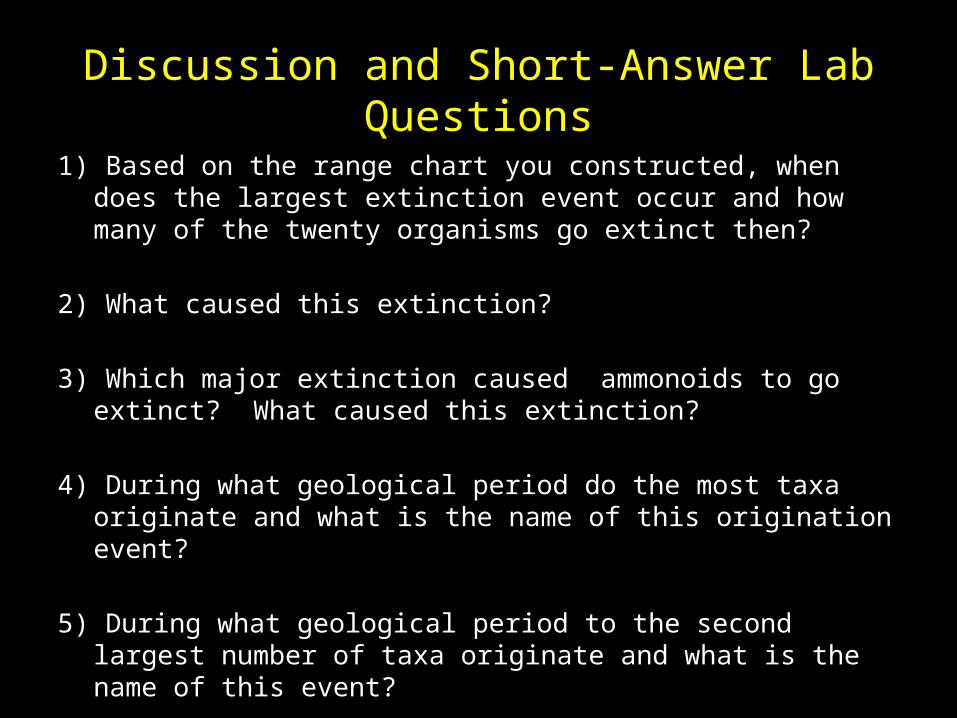
Discussion and Short-Answer Lab Questions
1) Based on the range chart you constructed, when does the largest extinction event occur and how many of the twenty organisms go extinct then?
2) What caused this extinction? 3) Which major extinction caused ammonoids to go extinct? What caused
this extinction? 4) During what geological period do the most taxa originate and what is the
name of this origination event? 5) During what geological period to the second largest number of taxa
originate and what is the name of this event?
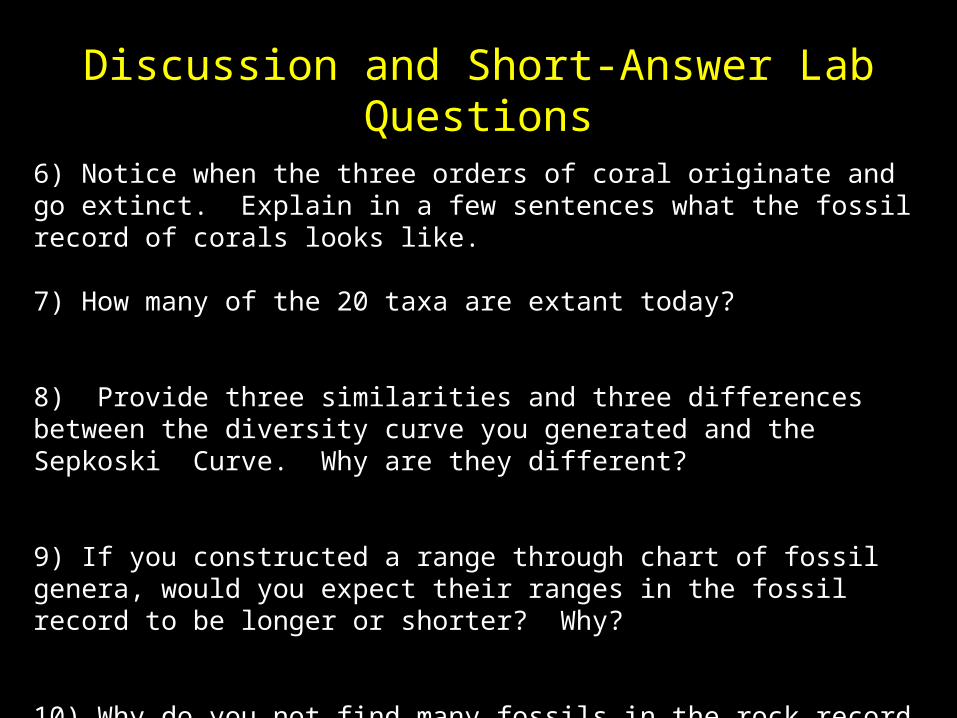
Discussion and Short-Answer Lab Questions
6) Notice when the three orders of coral originate and go extinct. Explain in a few sentences what the fossil record of corals looks like. 7) How many of the 20 taxa are extant today?
8) Provide three similarities and three differences between the diversity curve you generated and the Sepkoski Curve. Why are they different?
9) If you constructed a range through chart of fossil genera, would you expect their ranges in the fossil record to be longer or shorter? Why?
10) Why do you not find many fossils in the rock record before the Cambrian?

Potential ModificationsFor intro-level students:
• Use specific taxonomic group to construct a diversity curve – (e.g., genera within Class Bivalvia)
• Genera of fossils found within a given rock interval
• Index fossils vs. non-index fossils

Potential ModificationsFor upper-level students:
-each group or individual is assigned a class of organisms and must construct a genus-level diversity curve for comparison with other groups
-students will determine genus ranges using the Paleobiology Database (www.paleodb.org)
-provide guidelines for:-number of genera to include-resolution of the geological time scale (i.e., epochs vs. periods vs. PaleoDB 10my time bins)

Questions?


