
Random Forest Classification of Acute Coronary...
72
Random Forest Classification of Acute Coronary Syndrome By Jacob Paul VanHouten Thesis Submitted to the Faculty of the Graduate School of Vanderbilt University in partial fulfillment of the requirements for the degree of MASTER OF SCIENCE in Biomedical Informatics December, 2013 Nashville TN Approved: Thomas A. Lasko, MD, PhD John M. Starmer, MD Nancy M. Lorenzi, PhD David J. Maron, MD
Transcript of Random Forest Classification of Acute Coronary...

Random Forest Classification of Acute Coronary Syndrome
By
Jacob Paul VanHouten
Thesis
Submitted to the Faculty of the
Graduate School of Vanderbilt University
in partial fulfillment of the requirements
for the degree of
MASTER OF SCIENCE
in
Biomedical Informatics
December, 2013
Nashville TN
Approved:
Thomas A. Lasko, MD, PhD John M. Starmer, MD
Nancy M. Lorenzi, PhD David J. Maron, MD

ii
TABLE OF CONTENTS
Page
LIST OF TABLES............................................................................................................. iii
LIST OF FIGURES………………………………………………………………………………………………………… iii
I. INTRODUCTION……………………………………………………………………………………………… 1
II. BACKGROUND………………………………………………………………………………………………… 6
Early Methods………………………………………………………………………………………………6
ACI-TIPI……………………………………………………………………………………………………….. 8
Goldman Score……………………………………………………………………………………………. 12
TIMI Risk Score……………………………………………………………………………………………. 14
PURSUIT Score…………………………………………………………………………………………….. 15
GRACE Score……………………………………………………………………………………………….. 16
Studies Comparing TIMI, PURSUIT and GRACE scores…………………………………. 17
Modern Risk Scores…………………………………………………………………………………….. 21
Vancouver Rule/Vancouver Diagnostic Algorithm……………………………………….. 21
HEART Score……………………………………………………………………………………………….. 23
North American Chest Pain Rule…………………………………………………………………. 24
Accelerated Diagnostic Protocols………………………………………………………………… 25
Computational Models………………………………………………………………………………… 25
Limitations of Prior Scoring Methods……………………………………………………………29
III. METHODS………………………………........................................................................... 32
Data……………………………………………………………………………………………………………….. 32
Machine Learning…………………………………………………………………………………………… 43
IV. RESULTS…………………………………………………………………………………………………………. 46
V. DISCUSSION……………………………………………………………………………………………………. 57
REFERENCES………………………………………………………………………………………………………………. 61

iii
LIST OF TABLES
Table Page
1. ACS-related codes……………………………………………………………………………………………………………. 34
2. Features included for model creation……………………………………………………………………………… 38
3. Performance of compared algorithms……………………………………………………………………………… 46
4. Counts of features used in the random forest for the validation set………………………………… 48
LIST OF FIGURES
Figure Page
1. Receiver operating characteristic curves of compared algorithms on the test data…………. 47
2. Variable importance plot for features from the random forest model…………………………….. 51
3. ROC curves for full random forest model, model with only most important variables,
and model without most important variables……………………………………………………………….. 52
4. Performance of random forest on the validation set of data…………………………………………… 54
5. Calibration curve for the validation set of random forest predictions……………………………… 55
6. Calibration curve for validation set after calibration procedure………………………………………. 56

1
CHAPTER I
INTRODUCTION
Coronary heart disease is the single leading cause of death worldwide, accounting for 7.0
million deaths, or 11.2% of all deaths annually(“WHO | The top 10 causes of death,” n.d.). It is
also the most common cause of death in the United States. There are many negative sequelae
of coronary artery disease, including acute coronary syndrome (ACS). Each year, coronary
artery disease affects more than 16 million Americans, from which there are between 6 and 10
million visits to US emergency departments for suspected ACS, of which only 1.36 million
hospitalizations are for true ACS cases. While the most conservative estimates suggest that the
United States spends 3 to 5 billion dollars per year for the cost of effectively managing the
patients who present with symptoms of ACS but ultimately received a different diagnosis,
others purport that the true number may be 10 to 15 billion dollars. This is in addition to the
165 billion dollars of direct and indirect costs due to true cases of ACS (Limkakeng & Gibler,
2001; Marcoon, Chang, Lee, Salhi, & Hollander, 2013).
ACS includes unstable angina (UA), non-ST-segment elevation myocardial infarction (NSTEMI)
and ST-segment elevation myocardial infarction (STEMI). These three acute manifestations of
coronary artery disease share a common pathophysiology related to atherosclerosis, or plaque
formation in medium- and large-sized blood vessels, and cause symptoms through a disparity
between cardiac supply and demand of oxygen. They are classified on the basis of their severity
and duration of symptoms. UA is typically neither severe nor prolonged, but occurs at rest. It is
differentiated from myocardial infarction (MI) on the basis of elevated cardiac markers, as well

2
as a typically longer duration of symptoms for myocardial infarction. In turn, myocardial
infarction is differentiated between ST-segment elevated myocardial infarction and non-ST-
segment on the basis of electrocardiogram (ECG) findings.
The disease process begins with damage to the endothelial layer of the vessels, which results in
vascular hemostasis, increased expression of adhesion molecules, and increased
thrombogenicity of the blood. Once the endothelium of the vessels is damaged, inflammation is
the primary mechanism for the development of a plaque. Inflammatory cells, especially
monocytes, invade into the subendothelial space. There, they differentiate into macrophages.
These macrophages, which are typically thought of as “cleanup cells” of the immune system,
start to digest the low density lipoprotein, otherwise known as “bad cholesterol”, and develop
into foam cells. This transformation causes the development of fatty streaks along the walls of
the blood vessels, a process that has been shown to begin as early as the first decade of life.
Through the macrophage release of chemoattractants and cytokines, this inflammatory process
continues to build on itself(Kumar & Cannon, 2009).
The stability of these plaques is highly variable. However, when plaques are disturbed, they can
rupture or erode. In either case, the subendothelial matrix that has been secreted by the
macrophages is exposed, leading to platelet adhesion, platelet activation, and aggregation, and
then to the development of a thrombus, or clot. Autopsy studies have shown that plaque
rupture causes 75% of fatal myocardial infarctions, while the remaining 25% results from
superficial erosion to the subendothelial matrix. It is of note that not all atherosclerotic plaques
rupture, and that not all ruptured plaques cause clinically visible ACS. The Framingham study

3
was the first to show that 99% of all ruptures are clinically silent, and often never noticed by the
patients. Progression of these plaques, including their potential to cause ACS, is variable, non-
linear, and unpredictable.
Once the subendothelium has been exposed, two types of clots can form. A platelet rich
“white” clot can form, more often at areas of high shear stress, while “red” fibrin clots form
where there is activation of the clotting cascade. Often, a red clot will form superimposed on a
white clot. At least one study has shown a differential clotting type among ACS, with white
clots found more often in UA/NSTEMI cases and red clots more often in STEMI events.
Just as there is variability in the stability plaques that progress into cases of ACS, there are
many different ways in which a patient may present to physician when they do experience an
ACS event. Many patients present to the emergency department of hospitals, which may be
the only place they are guaranteed of receiving medical attention, and chest pain is the second
most common presenting complaint in the emergency department. The variability of
presentation includes often atypical presentations, and there is a large overlap between the
presenting symptoms of a patient with ACS and patients with diseases of non-cardiac etiology
(Scirica, 2010). To appropriately diagnose ACS, physicians rely on many different testing
modalities. Cardiac markers, electrocardiographic readings, stress tests and coronary
angiography are all employed to rule in or out the presence of ACS. However, these tests are
all individually less than ideal for this purpose. As a result, between 2 and 5% of patients with
true ACS are examined in the emergency room, reported to have non-specific findings not
indicative of cardiac disease, and mistakenly discharged from the emergency room. This error

4
confers nearly twice the risk of 30-day mortality (Pope, Aufderheide, & Ruthazer, 2000).
Furthermore, a missed diagnosis of ACS can be costly for a physician or hospital. Data from the
Physician Insurers Association of America shows that 26% of all malpractice claims in
emergency departments from 1985 to 2003 were for patients evaluated for chest pain, and
other estimates put the amount of money for such claims at greater than 25% of all medical
malpractice dollars paid to plaintiffs (Rusnak, Stair, Hansen, & Fastow, 1989; Strehlow, 2011).
In response to the uncertain variability of patient presentation, and often in fear of life-
endangering medical errors and malpractice litigation, emergency room doctors are often left
with the only option of performing a full gamut of tests on every patient who presents to the
emergency room with chest pain. Of patients worked up for and admitted to the hospital for
ACS, only 30% are determined to have a cardiac origin for their symptoms. The workup of
patients with suspected ACS who turn out not to have ACS is the main driver for the 3 to 15
billion dollars spent annually to accurately diagnose patients with unclear chest pain symptoms.
In an ideal world, all patients with ACS would be admitted and all patients without ACS would
be discharged promptly or treated for the true reason for their emergency visit.
One approach to reducing unnecessary expenditure in the treatment of patients with suspected
ACS is the use of risk stratification. Predicting the probability of a major adverse event for
patients who present with chest pain is recommended in guidelines published by the American
College of Cardiology and American Heart Association. It is also largely accomplished by the
same tests used in making a diagnosis of ACS(Anderson et al., 2011).

5
To further assist physicians in evaluating patients with potential ACS, a multitude of prognostic
algorithms, indices and tools have been developed which combine the individual results of tests
to predict the likelihood of a negative outcome for a patient, and can help to give structure to
the often unstructured process of diagnosis. In the following chapter, this tradition of risk
stratification for the purposes of determining which patients are safe for discharge and which
patients will require more intensive therapies is presented in some depth.

6
CHAPTER II
BACKGROUND
A fully exhaustive cataloging of the attempts to stratify patients with potential acute coronary
syndrome on the basis of their underlying risk, and the performances of these various
approaches, is well beyond the scope of this document. A useful (though also not
comprehensive) reference can be found in (Than, Flaws, Cullen, & Deely, 2013). However, it is
instructive to describe in some detail several of the tools, algorithms and prognostic indices
that have been developed over the past fifty years, examine their successes and shortcomings,
and show how the lessons learned from prior work influenced this current research. Many of
these threads of research took place simultaneously, but for the purpose of this writing, will be
presented in terms of continuous work on individual research lines.
Many of the algorithms described here will focus solely on MI because the combining of UA and
MI into the clinical entity of ACS is a rather recent development. As such, many of the
algorithms described here will focus solely on myocardial infarction. Current clinical practice
treats these two diseases as gradations along one spectrum of pathophysiology.
Early Methods
In 1962, Peel et al. proposed potentially the first numeric prognostic index for grading the
severity of myocardial infarctions. While their initial scoring methodology was based on purely
clinical experience, they did revisit the data, weighting the individual factors appropriately
based on likelihood ratios determined from one set of 260 patients (Peel, Semple, Wang,

7
Lancaster, & Dall, 1962). The variables included in their model were age, sex, previous history,
presence and degree shock and heart failure, cardiac rhythm, and cardiographic signs. While
this index was designed and used for grading confirmed (not suspected) myocardial infarction,
it set the precedent for the inclusion of ‘clinically meaningful’ factors, and, in many ways, the
methodology for how these factors should be approached mathematically. They may have also
set a precedent for considering the output of prognostic indices as “binned”, as their table of
output for the validation and derivation series show explicit divisions in the index that they
deemed clinically meaningful.
In 1968, Pipberger et al. presented the results of a pilot study to use new computer technology
to quantitatively examine signs, symptoms and laboratory tests of patients and determine if a
computer could perform a simplified differential diagnosis and correctly classify patients with
coronary artery disease versus patients with pneumonia. Their data set consisted of 1238
patients admitted with a chief complaint of chest pain, each with 429 binary “yes-no” variables
and 69 numeric variables. They included only those variables that appeared in at least 25% of
cases for the disease groups they were interested in, and then further limited the number of
potential variables by means of univariate chi squared testing. This serial reduction yielded a
final 26 variables, most of which were related to current symptoms, which they utilized for
linear discriminant analysis, a technique closely related to logistic regression. Their method
resulted in correct classification for 77% of the patients with coronary artery disease, and 79%
of the patients with pneumonia. Their success was likely due to the high quality of the histories
collected on these patients (Pipberger, Klingeman, & Cosma, 1968).

8
ACI-TIPI
The work that led to the development of the acute cardiac ischemia time-insensitive predictive
instrument (ACI-TIPI) began in the late 1970s. As previously mentioned, one major concern in
dealing with patients having suspected acute coronary syndrome is the concern of
overutilization of healthcare resources, which can lead to overcrowding of emergency
departments and observational units, increased costs of care, and iatrogenic conditions
experienced by the patients. In 1977, Pozen et al. demonstrated that classification schema from
that time (e.g. Hutter/Sidel and Killip classifications) were insufficient for risk stratification.
While they performed well in predicting mortality, they fell short in predicting morbidity of
patients with myocardial infarctions, and as such were deemed unsuitable for risk stratification
of patients. The authors developed a prognostic algorithm by performing linear discriminant
analysis on four variables (age, prior history of myocardial infarction, location of myocardial
infarction, and peak creatine phosphokinase), and found that their new method correctly
identified 74% of patients as either complicated or uncomplicated. Their conclusion was that
this performance “…on this small sample size suggest(s) that there probably exists a set of new
and as yet unframed criteria which represents a ‘best possible solution’ with respect to
subsequent mortality and morbidity…” (Pozen, Stechmiller, & Voigt, 1977).
In 1980 the authors demonstrated a mathematical instrument to supplement clinical acumen
and reduce inappropriate admissions to the coronary care units. This instrument was tested on
401 patients over a 10-month alternating month randomized trial design, and was based on the
nine clinical variables of history of prior myocardial infarction, inversion of T-waves, dyspnea,

9
abnormal versus normal ST segments, chest pain located in lower or midsternum, chest pain as
primary symptom, prior history of angina, ST segment elevation or depression greater than
1mm, and abnormal versus normal T waves, During experimental months, physicians were
provided with the probabilistic output of the mathematical tool, but were free to either
incorporate or ignore it when making admission decisions. Comparison of experiment versus
control months showed increased overall diagnostic accuracy (91% vs. 83%), decrease in
inappropriate admission (33% vs. 51%), and overall decrease in admission rate to coronary care
unit (14% vs. 26%), while maintaining the same low rate of inappropriate discharge (3%) (Pozen
et al., 1980). This methodology used to create this instrument was further explored in a larger
multicenter trial, where the same process yielded a model with seven included variables
(chest/left arm pain, patient report of chest pressure, pain or discomfort as primary symptom,
prior history of myocardial infarction, history of nitroglycerine use for chest pain,
electrocardiographic ST segment elevation or depression of 1mm or more, ST segment
straightening, and T wave peaking or inversion). This eleven month trial with two different
randomization schemes demonstrated a consistent thirty percent decrease in the number of
coronary care unit admissions, a decline in inappropriate admissions from 44% to 33%, and no
increase in missed diagnoses of acute ischemic heart disease (Pozen & D’Agostino, 1984). Of
their new predictive instrument, the authors said “The ‘art of clinical diagnosis’ has remained
until recently the sole domain of the master clinician or physicians’ ‘physician’. The instrument
in essence attempts to quantify the physicians’ qualitative assessments and, by so doing,
improve their diagnostic accuracy and admission decisions. By complementing the standard
process of clinical reasoning, the instrument may be more acceptable to physicians than are

10
algorithms that reduce the diagnostic process to a finite series of decision points. In addition,
the instrument is preferable to ordinal scales that counterintuitively dichotomize patients into
‘intervention’ versus ‘nonintervention’ at preset ‘cutoff’ points.”(Pozen et al., 1980)
Over the next years, this particular model would be modified and continually studied by Selker
et al. (Selker, D’Agostino, & Laks, 1988). In 1988, this model was extended into a handheld
calculator and trialed prospectively in 2320 patients seen during an 11-month trial period. Due
to the design of the experiment, 1288 patients were seen during experimental time periods and
1032 were seen during control time periods. During experimental times, as in prior work by
Pozen, there was a 30% reduction in admission rates to the coronary care unit, with no
decrease in the rate of correct admissions for patients with coronary ischemia. One final aspect
of this study was the incorporation of the model into the electrocardiogram Of note, some
of the variables that were previously included were deemed to be too dependent on
clarification for use with an ECG (history of myocardial infarction, nitroglycerin use, and ST-
segment straightening), which were replaced with factors for age, sex, Q-waves, and greater
detail in ST-segment changes. ]. Based on area under the receiver operating characteristic
curve (AUC) measurements, these new modifications were essentially the same in
discriminating between true and false cases of cardiac ischemia [Selker 1986].
Perhaps due to their choice of publication journal, Selker et al. again presented results of the
time-insensitive predictive instrument (TIPI) for acute cardiac ischemia (ACI) in 1991 (Selker,
Griffith, & D’Agostino, 1991). In 1992, Cairns et al. validated this ECG-incorporated tool in a
convenience sample of 101 patients, comparing it to unassisted physician assessment. While

11
specificity remained essentially the same between physician triage decision and the TIPI score,
sensitivity rose from 77% to 93%, and the AUC increased for the prediction of acute myocardial
infarction from 0.64 for physician assessment to 0.85 for the TIPI score (Cairns, Niemann,
Selker, & Laks, 1992). In 1998, another large controlled trial across 10 hospitals across the
United States demonstrated the ability of this automatically generated score to affect change
in admission patterns, accounting for a 50% decrease in admissions to the coronary care units,
a 10% increase in discharges to home, and, where telemetry units were common, a reduction
in telemetry unit admissions of 14%, while still not reducing the rate of appropriate admission
from that achieved by the physician without assistance. (Selker et al., 1998)At least five other
prospective clinical trials have validated, to some extent, the performance of the ACI-TIPI
[Seyal, Miller, Mitchell, Kellett](Ilgen et al., 2011). A projection of potential impact on care and
malpractice claims by the ACI –TIPI was performed in 2002, suggesting that use of the
instrument as a means of defensive medicine could potentially save the United States over $12
billion in malpractice costs, though there are obvious caveats to this interpretation (Selker et
al., 2002). One study in particular, however, determined the ACI-TIPI to have lower
discriminatory power than previously reported (AUC=0.69), but still suggested that there may
be used in referring to the score, as patients with a score over 20 contained all instances of ACS,
leading the authors to believe that a score of less than 20 may denote a subset of the
population that is safe for early discharge (Ilgen et al., 2011). This assumption remains to be
tested. Finally, at least one study of ACI-TIPI use by Emergency Medical Service (EMS) providers
has demonstrated that use of the tool improves performance of paramedics to identify ACS and
increases the proportion of patients who receive percutaneous coronary intervention.

12
However, to achieve these results, the authors suggest that the output of the ACI-TIPI may
need to be translated into a cutoff value, directly opposing some of the early views about the
value of full probabilistic representation of the score. (Selker et al., 2011)
Goldman Score
At the same time as much of the work that would become the ACI-TIPI, Goldman and
colleagues also set out to develop a model to aid in the diagnosis of patients with acute chest
pain in the emergency department. The rule was designed to classify patients as either having
acute myocardial infarction or not, and used recursive partitioning techniques to reach a
conclusion. It was originally derived on a cohort of 482 patients who presented with non-
traumatic chest pain and were at least 30 years of age, and the clinical variables determined to
be of importance were age, length of symptoms, primary location of pain, diaphoresis, previous
history of angina and if this pain was worse than previous times, reproducibility of the pain by
local pressure, the presence of ST-segment elevation or Q waves not known to be old, and the
presence of other ST-segment or T-wave changes suggestive of ischemia not known to be old.
Of note, the Goldman rule included no laboratory results for biomarkers. On the derivation set,
the Goldman rule achieved 100% sensitivity for acute infarction and a specificity of 80%. In a
separate prospective validation set from the initial publication, the performance of this model
integrated with physician decisions achieved an increase in specificity for non-infarction (77%
vs. 67% without model) and increased overall accuracy (79% vs. 71% without model) while not
losing much in the way of sensitivity (Goldman et al., 1982).

13
The Goldman rule was further adapted in a set of 1379 patients from two different hospitals,
and prospectively validated on a population of 4770 patients from these same two hospitals. In
the validation set, this rule performed similarly to how it had during the derivation phase.
Further, the authors of this study suggested that previous work by Pozen (Pozen et al., 1980)
had succeeded in modifying the clinical practice of physicians but paid no attention to the
accuracy of their predictions, while this study’s authors were more concerned with the
predictive capabilities of their instrument. In turn, concerns raised about the Goldman rule
included the validity of comparing physician admission decisions to decisions made by the
computer rule (real world vs. idealized world), the concern that the rule may only be used in
practice on patients for which the decision is less clear (spectrum bias) and the inherent
acceptability of the rule to disagree with physician assessment. One opponent of the rule
suggested “Asking a physician to use the Goldman protocol for any given case is analogous to
requesting that he or she consult a colleague who has approximately equal skill, answers with
only one word or a numerical probability, and disagrees (with them) 21 percent of the time.”
(“Computer-derived protocol to predict myocardial infarction in patients with chest pain.,”
1988). Despite these concerns, the Goldman protocol has still been studied as a potential
means to predict risk of emergency room patients with chest pain. Grijseels et al. compared
several algorithms for use in pre-hospital triaging, including the Pozen model form 1984 and the
Goldman model from 1988. These authors determined that neither these models nor the other
model examined were suitable for predicting acute cardiac pathology in pre-admission patients
(Grijseels et al., 1995). In 2011, Limkakeng et al. showed that the Goldman score, in

14
combination with troponin measurements, could not identify a subgroup of patients with a
sufficiently low risk of major events suitable for early discharge (Limkakeng & Gibler, 2001).
TIMI Risk Score
Perhaps the most widely known, used and studied of the prognostic indices, the Thrombolysis
in Myocardial Infarction (TIMI) risk score for unstable angina and non-ST elevation myocardial
infarction was first published in 2000 by Antman et al. and derived from a cohort of patients
from the TIMI 11B trial (Antman & Cohen, 2000). It was designed to be clinically meaningful in
predicting mortality or major complications over 14 days as well as very simple to calculate;
while multivariable logistic regression with backward elimination was used to build a
mathematical representation, the risk score was designed to contain only the seven clinical
variables with significant effects on outcome, each of which contributing a maximum of one
point to the overall seven point score. The variables included in the score are age greater than
65 years, at least three risk factors for coronary artery disease, significant priory coronary
stenosis, ST deviation on ECG, severe anginal symptoms (2 events occurring in the past day),
the use of aspirin in the past 7 days, and elevated serum cardiac markers. Even in the original
publication, the reported performance of the score on the validation set of 1957 patients was
less than ideal (AUC =0.74 for all-cause mortality, AUC=0.63 for mortality/myocardial
infarction). That said, the TIMI score has been praised for its simplicity, and continues to be
studied as a means of guiding admission and treatment decisions for patients with suspected
ACS. Work by Pollack et al. suggested that the TIMI risk score could be applied to an unselected
cohort of chest pain patients (Pollack, Sites, Shofer, Sease, & Hollander, 2006). Many

15
prospective validation studies have taken to modifying the original TIMI score to include newer
and readily available biomarkers, or to allow a more inclusive definition of ischemic changes on
ECG (Body, Carley, McDowell, Ferguson, & Mackway-Jones, 2009; Chase et al., 2006; Hess et al.,
2010; Jarai et al., 2007).
A discussion of comparisons between the TIMI risk score and other prognostic indices is
presented later in this chapter.
PURSUIT Score
Also in 2000, Boersma et al. presented a risk score derived from baseline characteristics of 9461
patients with acute coronary syndromes without ST-segment elevation derived from
enrollment in the Platelet glycoprotein IIb/IIIa in Unstable angina: Receptor Suppression Using
Integrilin (eptifibatide) Therapy (PURSUIT) trial (Boersma et al., 2000). The score was derived
via multiple logistic regression with backwards stepwise selection, but unlike the TIMI score,
allowed for graded responses for the different clinical variables. For example, the feature of
age can contribute between 0 and 6 points to the 18-point score for predicting mortality,
depending on the decade of the life in which the patient presents. The variables included in
this score are age, sex, the Canadian Cardiovascular Society class based on heart failure
symptoms, heart rate, systolic blood pressure, the presence of rales on examination, and the
presence of ST-depression on ECG. The PURSUIT score performed reasonably in predicting
mortality (AUC=0.804 on bootstrapped sample), though not as well on predicting a composite
endpoint of death or MI (AUC=0.669 on bootstrapped sample). While the PURSUIT score is well-
known, it is seldom used in guiding triage or treatment decisions in the emergency department.

16
A discussion of comparisons between the PURSUIT risk score and other prognostic indices is
presented later in this chapter.
GRACE Score
The Global Registry of Acute Coronary Events (GRACE) score was published in 2003 (Granger et
al., 2003). Unlike TIMI and PURSUIT scores, which were developed on cohorts from clinical
trials, the GRACE score is derived from patients in a registry, where no experimental treatment
was explored. However, patients in this registry were required to have received a final diagnosis
of ACS, and patients were included in the registry only if they had ECG changes suggesting ACS,
serial increase in cardiac enzymes, or documented coronary artery disease. Like TIMI and
PURSUIT, the underlying model for the GRACE score was a multivariable logistic regression
feature selection performed by backwards elimination, and then a more intelligible score was
produced from this model. However, the GRACE score allowed for even more gradation of each
individual predictor than the PURSUIT score, and one critique against the GRACE score is that its
calculation is too complex to be performed without a computer. Included variables were the
Killip class of heart failure, systolic blood pressure, heart rate, age, creatinine, and presence or
absence of cardiac arrest at admission, ST-segment deviation, and elevated cardiac enzyme
levels. The score was developed in 11389 patients, and subsequently validated on cohorts of
3972 and 12142 patients. The performance in these validation cohorts were respectable
(AUC=0.84 and 0.79, respectively). While the original GRACE model was developed for
predicting in-hospital mortality, additional GRACE-derived models to predict mortality and
myocardial infarction over longer durations following discharge have also been developed

17
(Eagle et al., 2004; Fox et al., 2006). Like TIMI, some validation models have sought to improve
the predictive performance of the GRACE model by including additional biomarkers of cardiac
ischemia severity (Meune et al., 2011).
Studies Comparing TIMI, PURSUIT and GRACE scores
Several studies have been undertaken to compare the three previous risk models in terms of
their ability to predict mortality, final diagnosis of ACS, or complications of unselected patients.
While some have shown that the risk indices in question may have some value in guiding
decisions about triage and treatment, many have also highlighted areas where none of the
scores perform adequately.
In 2004, Yan et al. demonstrated similar discrimination power between the GRACE and PURSUIT
risk models in 4627 patient in an observational registry of patients with ACS. While both had
high discriminatory capacity (AUC = 0.84 for GRACE, 0.83 for PURSUIT), the GRACE model
significantly outperformed PURSUIT in terms of calibration, with PURSUIT consistently
overestimating risks (Yan et al., 2004), leading the authors to suggest that risk models derived
from clinical trials may perform less favorably in real world studies than risk models derived
from the more general populations of registries.
de Aruajo Goncalves et al. compared the performance of the GRACE, TIMI and PURSUIT risk
scores for predicting a combined endpoint of death or myocardial infarction at 1 year, well
beyond the timeframe for which these risk scores were developed. They studied 460
consecutive chest pain patients who were referred to a coronary care unit. Their findings
suggested that these models may still have some predictive ability out to the further time

18
horizon of one year, with GRACE outperforming both PURSUIT and TIMI (AUC = 0.715, 0.630,
and 0.585, respectively). Their conclusions were that these indices could be used to identify a
high-risk population that would benefit the most from early intensive interventions (de Araújo
Gonçalves, Ferreira, Aguiar, & Seabra-Gomes, 2005).
Ramsay et al. compared the TIMI and GRACE scores against physician assessment for predicting
death, non-fatal myocardial infarction and emergency vascularization within 30 days in 347
patients with unselected chest pain. The GRACE score outperformed the TIMI score, while both
outperformed unstructured physician assessment (AUC= 0.82, 0.74, and 0.55, respectively),
concluding that evaluation based solely on ECG and cardiac biomarker findings at presentation
were insufficient for predicting risk for chest pain patients (Ramsay, Podogrodzka, McClure, &
Fox, 2007).
In 2007, Yan and colleagues compared the performance of the TIMI, PURSUIT and GRACE scores
in predicting in-hospital and one-year mortality in a prospective multi-center registry trial. For
both in-hospital and one-year mortality, GRACE outperformed PURSUIT, which in turn
outperformed TIMI (AUC = 0.81, 0.80 and 0.68 for in-hospital death, respectively; AUC=0.79,
0.77. 0.69 for one-year death, respectively). The authors posit that the improved performance
of GRACE and PURSUIT over TIMI may be due to the inclusion of highly significant independent
variables for hemodynamic stability and renal function, but that this exclusion has also
rendered the calculations for the TIMI score significantly simpler to perform (Yan et al., 2007).
Extending the exploration of the relationship between simplicity and performance, Aragam and
colleagues compared the performance of GRACE and TIMI scores in predicting in-hospital and

19
one-year mortality in an unselected ACS population who were admitted to their study hospital.
They found similar performance by both GRACE and TIMI scores among the patients with STEMI
for in-hospital (AUC = 0.84 and 0.83, respectively) and one-year (AUC = 0.72 and 0.71,
respectively) death. However, among patients who had experienced a UA/NSTEMI, the GRACE
score significantly outperformed the TIMI score for both in-hospital (AUC = 0.85 vs. 0.54) and
one-year (AUC= 0.79 vs. 0.56) mortality. They attributed this deficiency in discrimination of the
TIMI score to the omission of key variables for heart failure and hemodynamic stability, and
when these variables were added into the model, the performance of the TIMI model in
UA/NSTEMI patients was markedly improved (Aragam et al., 2009).
Manini and colleagues demonstrated a major weakness of some of the previously mentioned
risk models. They compared the TIMI score, Goldman rule, and another model by Sanchis (J
Sanchis et al., 2005; Juan Sanchis et al., 2005) for their performance in 148 consecutive patients
with chest pain, a non-diagnostic ECG, and negative initial cardiac biomarkers. In this study, the
performance of all models was poor, with low sensitivity (35%-53%) and not insignificant rates
of acute coronary events in the low-risk populations as determined by the models, ranging from
8-9% for the various scores (Manini et al., 2009).
In a group of 931 unselected patients, Filipiak et al. demonstrated high predictive value of the
GRACE score (AUC = 0.84) over the TIMI score (AUC = 0.63) for predicting one-year mortality.
Interestingly, another TIMI-derived score developed for patients with STEMI performed as well
as the GRACE model (Filipiak et al., 2011).

20
Using a method of “re-binning” the scores from GRACE and PURSUIT to match the 7 point scale
of the TIMI score, Lee et al. found in a secondary analysis of 4743 patients with suspected ACS
that the TIMI score outperformed both the GRACE and PURSUIT scores (AUC= 0.757, 0.728 and
0.691, respectively) in predicting a composite outcome of death, nonfatal myocardial infarction,
or revascularization (Lee, Chang, Matsuura, Marcoon, & Hollander, 2011). Though the authors
do not mention it, it seems that the re-scaling of the GRACE and PURSUIT scores may have
caused a loss of information, leading to the apparent superiority of the TIMI score.
A systematic review and meta-analysis of scoring metrics used for the diagnosis of ACS in 2012
showed that the GRACE score performed best out of the examined scores, with pooled AUC =
0.82 for short term and AUC = 0.84 for long term follow up. This same analysis revealed pooled
AUCs for the TIMI score for UA/NSTEMI of 0.54 and 0.67, respectively (D’Ascenzo et al., 2012).
However, Goodacre and colleagues showed in 2012 in a retrospective analysis of 2263 patients
who presented to the emergency department with suspected acute coronary syndromes from
the Randomized Assessment of Point-of-care Assay of Cardiac markers (RATPAC) trial that the
scores’ ability to predict composite endpoint of death, myocardial infarction, life-threatening
arrhythmia, emergency revascularization or hospitalization for acute coronary syndrome
yielded AUCs for the GRACE and TIMI scores of 0.717 and 0.682 at 30 days, respectively, and
0.726 and 0.693 at 90 days, respectively. The corresponding AUCs for age alone were 0.656 at
30 days and 0.689 at 90 days, suggesting little additional information gain from either score
(Goodacre, Bradburn, Mohamed, & Gray, 2012).

21
Modern Risk Scores
The following three diagnostic algorithms (Vancouver protocol, HEART score and North
American Chest Pain Rule) are considered by many in the field of emergency cardiology to be
state of the art in practical and useful tools to help assess chest pain in the emergency
department.
Vancouver Rule/Vancouver Diagnostic Algorithm
In 2006, Christensen et al. presented a rule for determining the appropriateness of early
discharge in emergency room patients deemed to be at low risk for acute coronary syndromes.
From their own data, they identified that 5.4% of patients with acute coronary syndrome were
erroneously sent some, while less than 30% of patients without acute coronary syndrome were
discharged less than three hours after admission, which they saw as a great waste of resources
(Christenson et al., 2004). As a result, the goal of the study was to develop a clinical prediction
rule to allow the identification of a subset of chest pain patients suitable for discharge within 2
to 3 hours what would miss fewer than 2% of acute coronary syndrome cases, while still
allowing at least 30% of patients to be discharged by the rule. Interestingly, this one of the first
clinical decision protocols specifically designed for rule-out purposes for patients with
suspected acute coronary syndrome (Christenson et al., 2006).
The rule developed from this study relied on a recursive partitioning model to determine which
of the potential 123 risk variables or combinations of variables could be used to safely discharge
patients from the emergency department. Of note, the author’s pre-selected only the variables
that had a univariate association with the outcome variable (p<0.2). The approach used by the

22
authors also assigned a 10-fold higher penalty to a false negative, or incorrectly discharging a
patient with acute coronary syndrome, than they did to a false positive, or wrongfully admitting
a patient without acute coronary syndrome. The final model considered patients to be low-risk
if they were less than 40 years of age and had normal initial ECG and no history of prior
ischemic chest pain, or if they were over 40 years of age with normal ECG results, no history of
previous ischemic chest pain, did not have radiating pain or pain that increased with breathing
or palpitation, and a normal initial CK-MB level or an unchanged CK-MB level at 2 hours. The
resulting model was highly sensitive, identifying all but 2 of the 165 definitively-diagnosed cases
of acute coronary syndrome. It was subsequently prospectively validated on a cohort of 593
patients presenting to an emergency department with a chief complaint of acute chest pain,
where nearly half (292/593) of the patients would have been eligible for early discharge, and
the rate of ACS events in those who would have been discharged was 1.4% (4/292 patients)
(Jalili, Hejripour, Honarmand, & Pourtabatabaei, 2012).
Though not explicitly linked to the Vancouver rule, the Vancouver Chest Pain Diagnostic
Algorithm (Scheuermeyer et al., 2012) almost certainly built on previous work done at many of
the same institutions. This diagnostic algorithm was designed to determine which low-risk chest
pain patients could be managed as outpatients after only 2 to 6 hours of emergency evaluation,
and patients were considered low-risk by this approach if they did not have the following high
risk variables: pain similar to prior acute coronary syndrome event, pain at rest for greater than
20 minutes, continued pain in the emergency department, typical crescendo angina, change in
an existing anginal pattern, new cardiac murmur, evidence of heart failure, new hemodynamic
instability, ECG results suggestive of ischemia, or an elevated cardiac troponin. By this

23
algorithm, 845 of the 1140 enrolled patients could be discharged within six hours of
presentation, with 266 of these patients advised to return for follow up within 48 hours. Among
the total 845 patients, there were no cases of patients discharged from the emergency
department with non-ACS diagnoses without 48-hour follow up who were proved to have acute
coronary syndrome or an adverse event at 30 days. While this study was tested on one cohort
at one center, the excellent performance of the protocol suggests that there may not only be a
subset of variables which designate patients with ACS from those without, but that determining
the most appropriate way to manage the care of patients with suspected ACS may be just as or
more successful at impacting resource use and overcrowding.
HEART Score
In 2008, Six, Backus and Kelder presented their new scoring index for predicting risk of major
events for patients presenting to the emergency department with chest pain. Interestingly,
their method was not focused on mathematical associations between findings and outcomes,
but solely on clinical knowledge. Their score consists of points for five different categories
which form the acronym of the score’s name: History, ECG results, Age, Risk Factors and
Troponin. More than many other prognostic indices, this score relies heavily on subjective
interpretation of findings by the physician. For instance, points are added to the sub-score for
history based on whether the patient’s presentation is “highly suspicious, moderately
suspicious, or slightly suspicious” for acute coronary syndrome. Similarly, one or two points are
also added to each other sub-score based on the interpretation of findings. In the derivation

24
cohort, the HEART score performed well, differentiating reasonably well between high- and
low-risk patients (Six, Backus, & Kelder, 2008)
Despite its apparent lack of mathematical backing, prospective validation demonstrated that
the score at least performed well in identifying a population that may be appropriate for early
discharge; among patients with a HEART score of 0 to 3, less than 1% experienced the
combined outcome of myocardial infarction, revascularization or death within 6 weeks of
presentation. This is in contrast to patients with a HEART score of 7 to 10, where the outcome
rate was 65.2% (Backus et al., 2010). Furthermore, in direct comparison to the TIMI and GRACE
scores, the HEART score outperformed the other metrics in terms of discrimination, with an
overall AUC of 0.83 vs. 0.75 for TIMI and 0.70 for GRACE(Backus et al., 2013) .
North American Chest Pain Rule
The North American Chest Pain Rule (NACPR) was proposed by Hess et al. (Hess et al., 2012).
Like the Goldman rule, the NACPR was based mathematically on recursive partitioning, and
yielded a prediction rule that labeled patients as low-risk if they lacked five clinical variables:
suspected new ischemic changes on ECG, previous history of coronary artery disease, pain
typical for acute coronary syndromes, initial or 6-hour troponin greater than the 99th percentile
of normal, and age greater than 50 years. This rule was validated by internal bootstrap
validation, and produced a rule that was in the derivation set 100% sensitive for major cardiac
event at 30 days.
25
Accelerated Diagnostic Protocols
While not risk stratification indices of themselves, an approach that is gaining popularity is the
accelerated diagnostic protocols (ADPs). These protocols are designed to allow for rapid rule-
out of patients who present with chest pain or other symptoms raising suspicion of ACS but
who ultimately are determined to have a non-cardiac etiology for their complaints, while still
maintaining a high degree of sensitivity for true ACS cases. These protocols typically involve
combinations of risk stratification scores, electrocardiographic interpretation and cardiac
marker analysis, and take place over 6 to 12 hours after the patient presents to the emergency
department, with the hope being that treating the patient via the pathway will help make it
clear which patients can reasonably be discharged home sooner. (Than et al., 2011, 2012).
While accelerated diagnostic protocols represent one of the cutting edges in emergency
department healthcare delivery research, it should be mentioned that some respected
cardiologists are hesitant to accept them as superior other risk stratification tools or
unstructured risk estimates. It cannot be argued, however, that while many prognostic models
focusing solely on risk prediction may be useful in the hands of a trained provider, accelerated
diagnostic protocols are explicit in their proscriptions for managing patients with varying risk
profiles, removing much of guesswork and reducing variation between physicians of various
levels of training.
Computational Models
Although not entirely self-contained as a line of research, the higher-complexity computational
models are being presented as a unit to demonstrate the similarities in their derivation. By

26
computationally complex, we mean models that rely on more complex mathematics and
modeling than logistic regression. In the arena of diagnosing patients with potential acute
coronary syndrome, this has most often been the artificial neural network (ANN), a complex
non-linear model based on the concept of animal neural circuitry. Just as in neuroscience, the
nodes of theses network, analogous to neurons, receive signals from other neurons, and, if the
total input is sufficient to pass along a signal, fire a message to the next neuron in line. This
model is different from logistic regression in that it can model complex interactions between
variables, but it is often difficult to interpret the output of the model or the importance of any
individual variable in isolation.
In 1990, Baxt first published on what would become a repeated pattern in his research career:
the utilization of an artificial neural network for the diagnosis of acute cardiac events in one
way or another. The model from this first paper was designed to distinguished patients who
had experienced acute myocardial infarction from those who had not in a high-risk, coronary
care unit population from which significant data had been obtained. The data was obtained
from a retrospective chart review, and the many variables collected related to the four main
categories of history of present illness/demographics, past history, physical examination, and
electrocardiographic findings. From this chart review, these findings were translated into
binary variables, where 1 signified that the finding was present, and 0 signified that the finding
was not present. The ANN was trained on 178 binary-coded patient records, and tested on a
separate set of 178 patient records, of which it correctly identified 92% of patients with acute
myocardial infarction, 96% of patients without, and still maintained an accuracy of 80% when
all ECG data was removed (Baxt, 1990). To prospectively validate this model, Baxt retrained the

27
model on the entire data set from the retrospective study and prospectively testing the
performance on a new cohort of 331 individuals presenting to the emergency department with
anterior chest pain, on which the network performed with higher sensitivity (97.2% vs. 77.7%)
and specificity (96.2% vs. 84.7%) compared to physician assessments in predicting presence of
acute myocardial infarction(Baxt, 1991). He also explored parallelized network analysis, using
the output of one network to decide the initial input of a subsequent network (Baxt, 1992a). In
1996 and 2002, this network technique was prospectively validated, both for the identification
of patients with myocardial infarction (Baxt, Shofer, Sites, & Hollander, 2002a; Baxt & Skora,
1996) and more generally, acute coronary syndromes (Baxt, Shofer, Sites, & Hollander, 2002b).
Baxt’s research also demonstrated interest in the mechanisms behind the networks. In 1992,
his continued work on the ANN described above demonstrated that the trained network
seemed to placing significance on variables that were different than the ones considered to be
predictive of risk by experienced clinicians(Baxt, 1992b). Continued work in this vein
demonstrated that one plausible reason for this deviation from recognized clinically-important
data was that the non-linear network was identifying relationships between the unexpected
variables and the other variables present for an individual patient, which he described as the
“context” for the variables. In this way, unexpected interactions between multiple variables
seemed to improve the performance of the model based on unanticipated relationships among
all of the variables, not just the ones deemed clinically relevant by expert opinion (Baxt, 1994).
At the same time much of this work was being done, a research team led by Kennedy and
Harrison were also exploring ANNs for the purpose of diagnosing acute myocardial infarction

28
and acute coronary syndromes, while also exploring whether simpler models could perform
nearly as well. Their conclusions, from a long period of research, were that any model would
not be able to perform perfectly “because the available data are not perfectly predictive for
myocardial infarction and because there is a considerable overlap in clinical and ECG features of
patients with myocardial infarction and those with acute coronary syndromes without
myocardial infarction.” (Harrison & Kennedy, 2005). Interestingly, they also found that, in their
experience, a logistic regression model could perform nearly as well or as well as a more
computationally-demanding ANN (Kennedy & Harrison, 2006). This was in contradiction to
findings by Green and colleagues near the same time (Green, Björk, & Forberg, 2006).
Two other methods of computational model building used at least once in the diagnosis of ACS
that are worth mention are the genetic algorithm for variable selection published by Vinterbo
(Vinterbo & Ohno-Machado, 1999) and the averaged one-dependence estimator known as the
AMIS model published by Kurz (Kurz et al., 2009). In short, the method described by Vinterbo
demonstrated different methods of feature selection for logistic regression. This study
compared forward, backward and bidirectional stepwise elimination with a genetic algorithm
for determining the most appropriate variables for logistic regression models s for predicting
the presence of myocardial infarction in emergency room patients with chest pain.
Interestingly, there were many variables that were selected by the genetic algorithm that were
not selected by any of the stepwise elimination methods, and several variables which were
selected by all stepwise methods but not by the genetic algorithm. The regression model built
with variables determined by genetic algorithm outperformed all other regression models on
an independent test set (Vinterbo & Ohno-Machado, 1999). The other study mentioned above

29
presents an averaged one-dependence estimator (AODE) model, which is a simplified version of
a Bayesian network in which the probability that any given symptom is dependent only on the
probability that the patient has the disease in question. Like the GRACE score, this model was
developed to be a risk model that would apply to patients with all levels of ACS by including all
levels of presentation in the risk model and not limiting to the more common UA/NSTEMI vs.
STEMI methods. The derivation cohort contained 7520 patients from the AMIS (Acute
Myocardial Infarction in Sweden) registry, which was expanded in 2001 to include patients with
any subtype of ACS. The AMIS score included the seven variables age, Killip class of heart
failure, systolic blood pressure, heart rate, pre-hospital cardiopulmonary resuscitation, history
of heart failure, and history of cerebrovascular disease, and did not include any laboratory or
electrocardiographic results. On the derivation cohort of 7520 patients, the AUC achieved was
0.875. This result was validated in a separate AMIS cohort (n=2854, AUC=0.868) and a cohort
from the Krakow-Region ACS Registry (n=2635, AUC=0.842). This is notable for the fact that the
AODE algorithm is highly efficient, and like traditional logistic regression, achieves its prediction
without including interaction terms for relationships between variables.
Limitations of Prior Scoring Methods
Previous models developed for risk prediction have several inherent limitations. As mentioned
previously, predictive models developed using data from clinical trials or registries may be not
representative of a general emergency department patient population. This is largely due to
strict inclusion and exclusion criteria used in clinical trials, which causes older and multi-morbid
patients to be underrepresented. Registries are also less representative, as requirement for

30
inclusion in many registries is dependent on final diagnosis, making the development of tools to
screen for disease difficult due to lack of negative examples.
In addition to the sources of data, the methods of model development are also subject to
limitations. Almost all previous model creation has included a feature selection step, where
many of the available data points have been removed from the model, often because of
insignificant univariate relationship to the outcome. Recursive partitioning produces models
that are not robust to perturbations in the training data, and the ability to predict outcomes is
often not generalizable outside the derivation population. This may also be a problem with
stepwise selection in logistic regression models, and may account for discrepancies in included
variables between different models. While so called “black box” models such as ANNs may
provide superb discrimination between positive and negative examples, they are also subject to
poor calibration, meaning the predicted probability of outcome often does not correspond with
the observed probability.
While there are many available machine learning approaches available, two stand out as
excellent choices for this task because of the ease with which they can include many variables
without feature selection, resist overfitting, and provide generalizable performance. The first is
the elastic net algorithm, which is regularized logistic regression which combines two penalties
(L1 and L2) to avoid overfitting while also including a sparsity-inducing penalty, yielding a final
model which maintains some percentage of the original coefficients, with each coefficient
decreased in absolute size (Zou & Hastie, 2005). The other is the random forest algorithm,
which creates an ensemble of decision trees built using different subsets of the variables

31
available for training, and voting the outcome to achieve generalizability of the model to future
predictions (Breiman, 2001).

32
CHAPTER III
METHODS
This section begins with an overview of the data used and is followed by the selected machine
learning methods applied in this research.
Data
We used data derived from electronic medical records for our research. This allowed for two
points of interest to be explored simultaneously. First, we sought to improve risk stratification
techniques of patients with potential ACS, by means of identifying as yet unknown predictive
markers and through the application of different sophisticated machine learning algorithms
than had previously been used. Second, we hoped that using real patient data might overcome
the apparent performance problems that limit the utility of previous models, which had been
largely produced from clinical trial or registry data.
We obtained the data for this study from Vanderbilt’s Synthetic Derivative (SD) database, which
is a deidentified copy of the main hospital record databases created for research purposes. The
deidentificaton of SD records is achieved through the application of an electronic computer
program, which removes HIPAA identifiers, as well as shifts dates by a random amount of time
that is unique for each individual’s record. This study was approved by the Vanderbilt
University Medical Center Institutional Review Board.
From this large dataset, we selected 575,642 records of patients who had presented to the
emergency department between the shifted dates of January 1, 2007 and May 31, 2012.

33
Inclusion criteria were that the patient was at least 18 years of age at the time of presentation
and that they had a troponin measurement taken within 30 hours of their admit time stamp in
the transactional table of encounters. We had planned to capture all patients who presented
to the emergency department who received a troponin within two or four hours of their
admission time. However, due to a peculiarity of the recording system, this was not possible.
On admission, patient encounter data is generated with the time of admission noted to the
nearest minute, but that data is overwritten before it is included in the SD, and we resorted to
the ED admission event that was recorded in a transaction table that only records events with a
resolution of one day.
As a result, we selected a study population who had presented to the emergency department,
as indicated by the transaction table, but who also had an encounter event recorded within the
consecutive 24 hours following the timestamp for admission. We then selected further to only
include patients who had received a troponin within 30 hours of the admission timestamp,
allowing us to capture all patients who had at least one troponin measurement drawn on the
same day, or within six hours if they presented close to midnight on any particular day. This
selection schema is similar to an approach adopted by (Vaidya, Shapiro, Lovett, & Kuperman,
2010), who demonstrated their approach in identifying an ACS cohort, and our method yielded
similar results on our data set as theirs. As a result, we believe that we captured many, though
likely not all, of the suspected ACS cases to present to the emergency department during this
time period. In total, 23,576 patients were included in this data analysis. No records were
excluded for missing data.

34
We defined our gold standard label identifying the presence or absence of ACS in our
population of patients using billing codes found in the patient record. We used the collection of
codes proposed by one of the value-based care teams for Vanderbilt University. They define a
patient with ACS as one who visited the emergency department for chest pain and who
received any ICD-9 code listed as an ACS diagnostic code, or any procedure code (ICD-9 or CPT)
for percutaneous coronary intervention (PCI) or coronary artery bypass graft (CABG) over the
thirty days following the admission date. If a patient was admitted twice within a short amount
of time, and within thirty days of both visits received a code consistent with ACS, both
admission instances were considered positive for an ACS event (Table 1).
Table 1: ACS-related codes
DX DIAGNOSIS_CODE_DESC
410 ACUTE MYOCARDIAL INFARCT
410 AMI ANTEROLATERAL WALL
410 AMI ANTEROLATRL WALL NOS
410.01 ANTEROLAT AMI-INIT EPISD
410.02 ANTEROLAT AMI-LATR EPISD
410.1 AMI ANTERIOR WALL NEC
410.1 ANTER AMI NEC-EPISOD NOS
410.11 ANTER AMI NEC-INIT EPISD
410.12 ANTER AMI NEC-LATR EPISD
410.2 AMI INFEROLATERAL WALL
410.2 INFEROLAT AMI-EPISOD NOS
410.21 INFEROLAT AMI-INIT EPISD
410.22 INFEROLAT AMI-LATR EPISD
410.3 AMI INFEROPOSTERIOR

35
WALL
410.3 INFEROPOS AMI-EPISOD NOS
410.31 INFEROPOS AMI-INIT EPISD
410.32 INFEROPOS AMI-LATR EPISD
410.4 AMI INFERIOR WALL NEC
410.4 INFER AMI NEC-EPISOD NOS
410.41 INFER AMI NEC-INIT EPISD
410.42 INFER AMI NEC-LATR EPISD
410.5 AMI LATERAL WALL NEC
410.5 LATRL AMI NEC-EPISOD NOS
410.51 LATRL AMI NEC-INIT EPISD
410.52 LATRL AMI NEC-LATR EPISD
410.6 TRUE POSTERIOR INFARCT
410.6 POSTERIOR AMI-EPISOD NOS
410.61 POSTERIOR AMI-INIT EPISD
410.62 POSTERIOR AMI-LATR EPISD
410.7 SUBENDOCARDIAL INFARCT
410.7 SUBENDO INFRC-EPISOD NOS
410.71 SUBENDO INFRC-INIT EPISD
410.72 SUBENDO INFRC-LATR EPISD
410.8 MYOCARDIAL INFARCT NEC
410.8 AMI NEC-EPISODE NOS
410.81 AMI NEC-INITIAL EPISODE
410.82 AMI NEC-SUBSEQUENT EPISD
410.9 MYOCARDIAL INFARCT NOS
410.9 AMI NOS - EPISODE NOS
410.91 AMI NOS-INITIAL EPISODE
410.92 AMI NOS-SUBSEQUENT EPISD
411 OTH AC ISCHEMIC HRT DIS
411.1 INTERMED CORONARY SYND
411.8 AC ISCHEMIC HRT DIS NEC
411.81 CORONARY OCCLUS'N-ACUTE
411.89 AC ISCHEMIC HRT DIS NEC

36
413 ANGINA PECTORIS
413 ANGINA DECUBITUS
413.1 PRINZMETAL ANGINA
413.9 ANGINA PECTORIS NEC/NOS
414 OTH CHR ISCHEMIC HRT DIS
414 CORONARY ATHEROSCLEROSIS
414 CORNARY ATHERO-VESL NOS
414.01 CORNARY ATHERO-NATV VESL
414.02 CORNRY ATHER-AUT BYP GFT
414.03 COR ATHER-NONAUT BYP GFT
414.04 COR ATHER-ARTERY BYP GFT
414.05 COR ATHER-UNSPEC BYP GFT
414.2 CHR TOT OCCL CORONAR ART
414.3 COR ARTHEROSCL D/T LIPID
414.8 CHR ISCHEMIC HRT DIS NEC
414.9 CHR ISCHEMIC HRT DIS NOS
We follow the machine learning precedent of using the terms feature and variable
interchangeably. Variables to be used in the model were included based on the structure of the
data, the frequency with which they occurred, and finally on whether they had been proven as
predictors in previous models. No records were missing patient age. By structure of the data, I
mean we specifically selected features that were unambiguous in their interpretation and
collected in a structured (numeric or positive/negative) form rather than an unstructured
(subjective) form. As such, many predictors that had previously been shown as highly
predictive, such as quality of pain, length of pain symptoms, and even qualitative interpretation
of ECG readings, were not available to our model. We collected many known risk factors for

37
ACS, including age, sex, race, height and weight, blood pressure, etc. We also collected many
laboratory values, some of which have been shown to be associated with ACS, and some of
which have not previously been identified as predictors. We included any laboratory finding
that was recorded within at least 2000 of our population subjects, and for all laboratory
findings we included only the first instance of that finding within their medical encounter. We
included troponin I and ECG measurements, and where possible, the first two measurements
for each and the change in troponin level from first to second reading. We also included history
of certain past medical histories or drug use, such as previous heart disease, hyperlipidemia,
diabetes, aspirin use or smoking status, which we represented as a binary feature denoting if
the feature was present prior to this encounter. Finally, any laboratory values that we had not
included due to low frequency but for which there could be a strong case for inclusion based on
literature were also included in the model. While we performed little data quality assurance,
we did modify the heights and weights found in these files to be reasonable, according to the
most recent anthropometric data from the Centers for Disease Control (Ogden, Ph, & Flegal,
2008). All other data, regardless of the potential severity of misrepresentation or nonsense,
was not assessed or modified. The list of 88 included features can be found in Table 2.
These features, a label for final diagnosis of ACS, and a compound identifier of synthetic patient
medical record number and shifted date of admission were structured into feature vectors,
with each row of the data table representing one instance of an emergency room encounter for
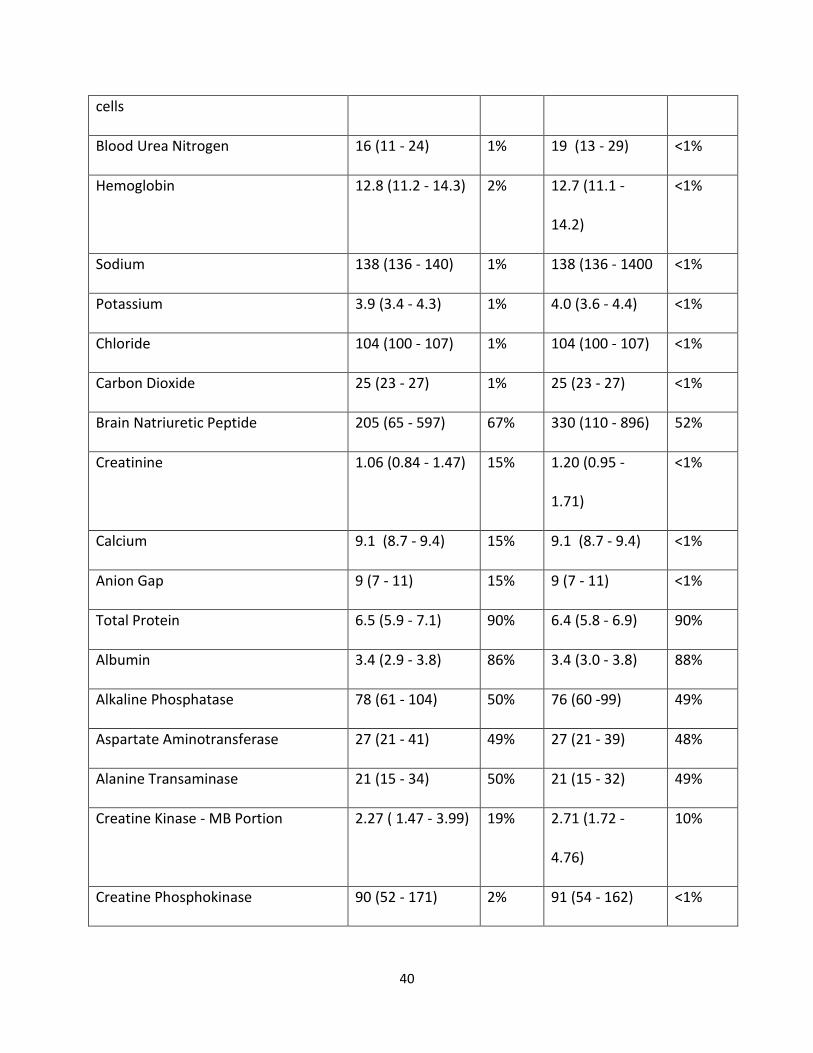
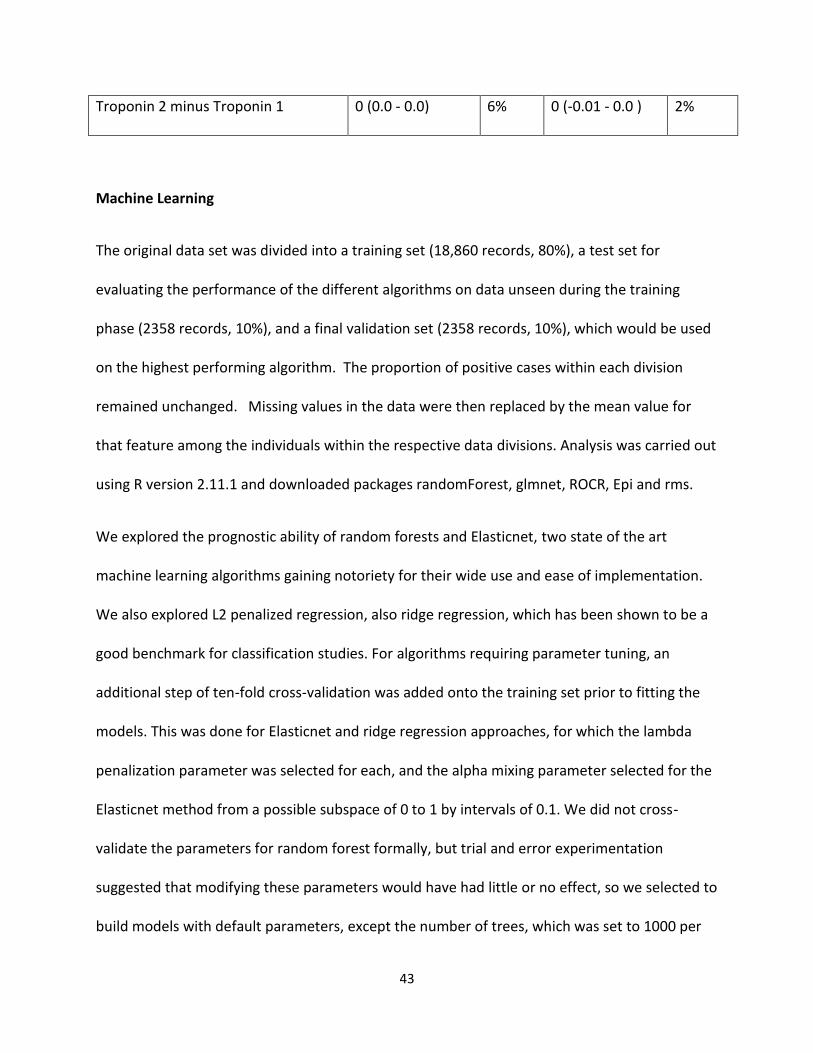
suspected ACS. We found variable missingness in the data, ranging from less than one percent
missing for glucose measurement to greater than 90 percent missing for total protein (Table 2).

38
Table 2: Features included for model creation
Feature Label Negative Label Positive
Non Missing Missing Non Missing Missing
Age 59 (47-72) NA 66 (56-76) NA
Gender 47% Male 1.30% 61% Male <1%
Race 67%White <1% 77% White <1 %
Height (cm) 170 ( 162 - 178) 78% 172 (165-180) 59%
Weight 79.7 (66.9 - 95.9) 78% 82.9 (69.8 -
98.7)
59%
Glucose 113 (97 - 146) <1% 121 (101-163) <1%
Systolic BP 129 (112 - 148) 31% 130 (113- 148) 10%
Diastolic BP 71 (60 - 83) 31% 70 (59 - 80) 10%
Pulse 85 (73 - 100) 84% 80 (73 - 95) 82%
Respiratory Rate 18 (16 - 20) 82% 18 (16 - 20) 82%
White Blood Cells 8.5 (6.5 - 11.6) 2% 8.5 (6.7 - 11.2) <1%
Packed Cell Volume 39 (34 - 43) 2% 39 (34 - 42) <1%
Platelet Count 228 (79 - 286) 2% 220 (175 - 274) <1 %
Red Blood Cells 4.4 (3.8 - 4.8) 2% 4.3 (3.8 - 4.7) < 1%

39
Mean Corpuscular Volume 89 (85 - 93) 2% 90 (86 - 94) <1%
Mean Corpuscular Hemoglobin 29.8 (28.2 - 31.2) 2% 29.9 (28.3 -
31.3)
<1%
Mean Corpuscular Hemoglobin
Concentration
33.2 (32.2 - 34.2) 2% 33.1 (32.0 -
34.0)
<1%
Red Cell Distribution Width 14.2 (13.3 - 15.6) 2% 14.1 (13.3 -
15.6)
<1%
Standard Deviation of Red Cell
Distribution Width
46.4 (43.2 - 51.3) 31% 46.9 (43.7 -
51.8)
30%
Absolute Neutrophils 5.7 (3.8 - 8.5) 12% 5.7 (4.2 - 8.2) 9%
Percent Neutrophils 69 (5.9 - 79) 12% 69 (60 - 78) 9%
Absolute Lymphocytes 1.6 (1.1 - 2.3) 12% 1.6 (1.1 - 2.2) 9%
Percent Lymphocytes 20 (12 - 30) 12% 19 (12 - 27) 9%
Absolute Monocytes .63 (.46 - .88) 12% .67 (.50 - .89) 9%
Percent Monocytes 7.6 (5.9 - 9.5) 12% 7.9 (6.2 - 9.8) 9%
Absolute Eosinophils .10 (.04 - .20 12% .13 (.06 - .23) 9%
Percent Eosinophils 1.3 (0.5 - 2.6) 14% 1.6 (0.7 - 2.9) 11%
Absolute Basophils .03 (.02 - .04) 14% .03 (.02 - .04) 11%
Percent Basophils .3 (.2 - .5) 14% .3 (.2 - .5) 11%
Nucleated Red Blood Cells 0 (0 - 0) 32% 0 (0 - 0) 30%
Nucleated Red Blood Cells per 1000 0 (0 - 0) 32% 0 (0 - 0) 30%
40
cells
Blood Urea Nitrogen 16 (11 - 24) 1% 19 (13 - 29) <1%
Hemoglobin 12.8 (11.2 - 14.3) 2% 12.7 (11.1 -
14.2)
<1%
Sodium 138 (136 - 140) 1% 138 (136 - 1400 <1%
Potassium 3.9 (3.4 - 4.3) 1% 4.0 (3.6 - 4.4) <1%
Chloride 104 (100 - 107) 1% 104 (100 - 107) <1%
Carbon Dioxide 25 (23 - 27) 1% 25 (23 - 27) <1%
Brain Natriuretic Peptide 205 (65 - 597) 67% 330 (110 - 896) 52%
Creatinine 1.06 (0.84 - 1.47) 15% 1.20 (0.95 -
1.71)
<1%
Calcium 9.1 (8.7 - 9.4) 15% 9.1 (8.7 - 9.4) <1%
Anion Gap 9 (7 - 11) 15% 9 (7 - 11) <1%
Total Protein 6.5 (5.9 - 7.1) 90% 6.4 (5.8 - 6.9) 90%
Albumin 3.4 (2.9 - 3.8) 86% 3.4 (3.0 - 3.8) 88%
Alkaline Phosphatase 78 (61 - 104) 50% 76 (60 -99) 49%
Aspartate Aminotransferase 27 (21 - 41) 49% 27 (21 - 39) 48%
Alanine Transaminase 21 (15 - 34) 50% 21 (15 - 32) 49%
Creatine Kinase - MB Portion 2.27 ( 1.47 - 3.99) 19% 2.71 (1.72 -
4.76)
10%
Creatine Phosphokinase 90 (52 - 171) 2% 91 (54 - 162) <1%

41
Lipase 25 (19 - 36) 78% 26 (19 -37) 80%
MB – Ratio 2.2 (1.3 - 3.5) 21% 2.8 (1.8 - 4.6) 12%
International Normalized Ratio 1.2 (1.0 - 1.6) 59% 1.2 (1.0 - 1.8) 52%
Urine Specific Gravity 1.015 (1.01 -
1.02)
49% 1.014 (1.01 -
1.02)
53%
Thyroid Stimulating Hormone 1.79 (1.02 - 3.21) 76% 1.76 (0.97 -
2.99)
77%
Estimated Glomerular Filtration Rate 69.5 (46.8 - 90.2) 2% 59.6 (39.4 -
79.5)
2%
ECG 1 - Heart Rate 84 (71 - 99) 42% 79 (68 - 94) 37%
ECG 1 - PR Interval 156 (138 - 176) 42% 160 (140 - 184) 37%
ECG 1 - QRS Duration 92 (82 - 106) 42% 96 (86 - 114) 37%
ECG 1 - QT Interval 452 (431 - 476) 42% 458 (434 - 486) 37%
ECG 1 - P Wave 48 (17 - 65) 42% 43 (0 - 620 37%
ECG 1 - Initial 40 ms 29 (6 - 50) 42% 19 (-4 -47) 37%
ECG 1 - Mean QRS 21 (-11 - 54) 42% 14 (-22 - 51) 37%
ECG 1 - Terminal 40 ms 29 (-24 - 54) 42% 28 (-32 - 93) 37%
ECG 1 - ST Segment 73 (28 - 146) 42% 114 (52 - 175) 37%
ECG 2 - Heart Rate 82 (70 - 100) 77% 79 (66 - 94) 63%
ECG 2 - PR Interval 156 (136 - 176) 77% 161 (140 - 184) 63%
ECG 2 - QRS Duration 92 (84 - 104) 77% 96 (86 - 112) 63%

42
ECG 1 - QT Interval 454 (432 - 478) 77% 460 (433 - 478) 63%
ECG 2 - P Wave 45 (11-64) 77% 43 (0 - 62) 63%
ECG 2 - Initial 40 ms 28 (5 - 50) 77% 18 (-5 - 45) 63%
ECG 2 - Mean QRS 19 (-14 - 52) 77% 13 (-21 - 50) 63%
ECG 2 - Terminal 40 ms 26 (-26 – 88) 77% 24 (-31 - 89) 63%
ECG 2 - ST Segment 73 (26 - 152) 77% 111 (51 - 175) 63%
Smoking History 21% NA 33% NA
History of Diabetes 28% NA 41% NA
History of Hyperlipidemia 36% NA 65% NA
History of Hypertension 55% NA 73% NA
History of CABG 1% NA 9% NA
History of PCI 3% NA 27% NA
History of MI 26% NA 68% NA
History of CAD 26% NA 68% NA
History of Stroke 18% NA 30% NA
History of Heart Failure 23% NA 44% NA
History of Aspirin Use 49% NA 76% NA
History of Metoprolol Use 49% NA 76% NA
History of Nitroglycerin Use 25% NA 56% NA
Troponin 1 .02 (.01 - .04) NA .04 (.02 - 10) NA
Troponin 2 .02 (.01 - .05) 6% .04 (.02 - .13) 2%
43
Troponin 2 minus Troponin 1 0 (0.0 - 0.0) 6% 0 (-0.01 - 0.0 ) 2%
Machine Learning
The original data set was divided into a training set (18,860 records, 80%), a test set for
evaluating the performance of the different algorithms on data unseen during the training
phase (2358 records, 10%), and a final validation set (2358 records, 10%), which would be used
on the highest performing algorithm. The proportion of positive cases within each division
remained unchanged. Missing values in the data were then replaced by the mean value for
that feature among the individuals within the respective data divisions. Analysis was carried out
using R version 2.11.1 and downloaded packages randomForest, glmnet, ROCR, Epi and rms.
We explored the prognostic ability of random forests and Elasticnet, two state of the art
machine learning algorithms gaining notoriety for their wide use and ease of implementation.
We also explored L2 penalized regression, also ridge regression, which has been shown to be a
good benchmark for classification studies. For algorithms requiring parameter tuning, an
additional step of ten-fold cross-validation was added onto the training set prior to fitting the
models. This was done for Elasticnet and ridge regression approaches, for which the lambda
penalization parameter was selected for each, and the alpha mixing parameter selected for the
Elasticnet method from a possible subspace of 0 to 1 by intervals of 0.1. We did not cross-
validate the parameters for random forest formally, but trial and error experimentation
suggested that modifying these parameters would have had little or no effect, so we selected to
build models with default parameters, except the number of trees, which was set to 1000 per

44
forest. One hundred bootstrap replicates were performed to fully describe the distribution of
performance of the algorithms, and we compared the performance o f random forests,
Elasticnet penalized regression, and L2 ridge regression models built with training data on their
ability to discriminate between previously unseen positive and negative instances in the test
data set. Comparisons were made on the basis of AUC and by visual inspection of ROC plots.
We also sought to compare the performance of these algorithms against two established
prognostic indices, the TIMI and GRACE scores . A prior study demonstrated a method for
imputing missing features for these scores, though their study dealt with data having
significantly fewer missing values (Goodacre et al., 2012). For both the TIMI and GRACE scores,
features that were available in our data set were included and appropriately transformed to the
scale of these scores. In accordance with the methods of Goodacre et al, data that was
completely missing was either replaced by a reasonable surrogate, such as any history of aspirin
past aspirin use replacing aspirin use within the past seven days for the TIMI score, or replaced
with the most common, most logical replacement, such as all records being considered
negative for cardiac arrest on admission. As a result, the maximum possible TIMI score available
in this series is 5 points, and the maximum possible GRACE score is 246 points. These scores
were also compared to the other algorithms by calculation of AUC and visual comparison of
ROC plots for their performance on the test data set.
After determining a model that clearly outperformed the other models, we examined the
performance of this model on one final validation set of data, to determine a reliable measure
of the generalizable error for this approach. Also, as this model is intended for potential use in

45
predicting the risk of patients presenting to the clinic, the accuracy of the predictions is
potentially just as important as the ability for the risk score to differentiate between positive
and negative cases. As a final metric of fit, we evaluated the model calibration by means of a
calibration curve and Brier score, which are established methods of measuring calibration
(Brier, 1950).

46
CHAPTER IV
RESULTS
Over all 100 bootstrap replicates, random forests outperformed all other methods, including
the TIMI and GRACE scores (Table 3, Figure 1).
Table 3. Performance of compared algorithms
Performance of Models in Current Study
Model AUC
TIMI 0.750
GRACE 0.625
L2 Regression 0.809
Elastic Net 0.814
Random Forest 0.885

47
Figure 1. Receiver operating characteristic curves of compared algorithms on the test data.
The elastic net did not significantly reduce the complexity of the model, maintaining 85 of the
95 coefficients in the full regression model with non-zero coefficients (expansion of categorical
into binary variables resulted in 95 features for this regression).
We further explored which features were being selected by the random forest algorithm. We
present this data in two ways. In Table 4, we show the number of times each feature was used
in a tree. As demonstrated by the number of occurrences per feature, any individual feature

48
could be used more than once in any given tree, allowing for more potential split points than
previous models like TIMI would have allowed. Dividing the number of times each feature was
used by the number of trees in the forest (1000) yields an average of the number of times each
feature was used in a tree. This value ranges from 2.73 times per tree for the laboratory finding
of nucleated red blood cells to 45.79 times per tree for different split points of age. The number
of times a feature is used is can be considered a proxy for its importance, though this
relationship is not perfect. Features that have fewer values, such as binary features, tend to be
chosen as features to split on less, simply because they have only one potential split point
available. As a result, this is a less than perfect measure of the importance of a feature, but
some trends, such as age being included very often, fulfill our expectations.
Table 4. Counts of features used in the random forest for the validation data set
Feature Counts
Age 45790
Gender 8770
Race 12346
Height (cm) 21305
Weight 24982
Glucose 43080
Systolic BP 43239
Diastolic BP 40981
Pulse 13786
Respiratory Rate 13055
White Blood Cells 39775
Packed Cell Volume 33313
Platelet Count 42226
Red Blood Cells 40963
Mean Corpuscular Volume 34401
Mean Corpuscular Hemoglobin 39778
Mean Corpuscular Hemoglobin Concentration 39349
Red Cell Distribution Width 38891
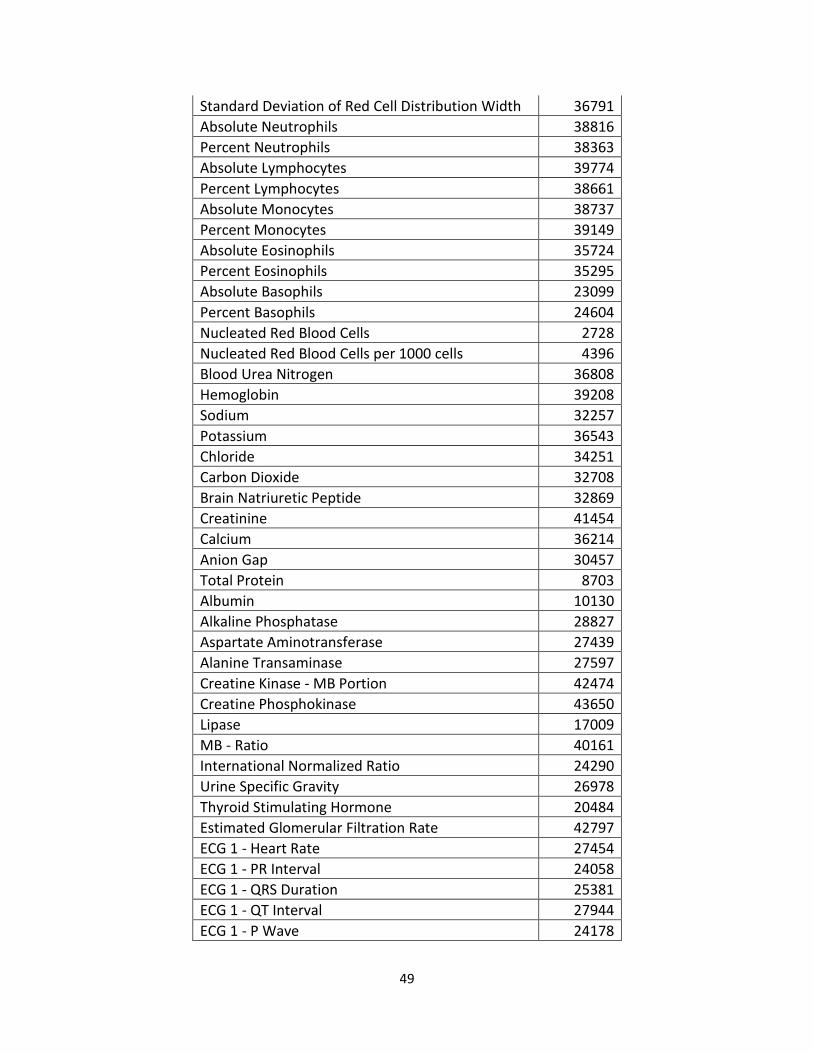
49
Standard Deviation of Red Cell Distribution Width 36791
Absolute Neutrophils 38816
Percent Neutrophils 38363
Absolute Lymphocytes 39774
Percent Lymphocytes 38661
Absolute Monocytes 38737
Percent Monocytes 39149
Absolute Eosinophils 35724
Percent Eosinophils 35295
Absolute Basophils 23099
Percent Basophils 24604
Nucleated Red Blood Cells 2728
Nucleated Red Blood Cells per 1000 cells 4396
Blood Urea Nitrogen 36808
Hemoglobin 39208
Sodium 32257
Potassium 36543
Chloride 34251
Carbon Dioxide 32708
Brain Natriuretic Peptide 32869
Creatinine 41454
Calcium 36214
Anion Gap 30457
Total Protein 8703
Albumin 10130
Alkaline Phosphatase 28827
Aspartate Aminotransferase 27439
Alanine Transaminase 27597
Creatine Kinase - MB Portion 42474
Creatine Phosphokinase 43650
Lipase 17009
MB - Ratio 40161
International Normalized Ratio 24290
Urine Specific Gravity 26978
Thyroid Stimulating Hormone 20484
Estimated Glomerular Filtration Rate 42797
ECG 1 - Heart Rate 27454
ECG 1 - PR Interval 24058
ECG 1 - QRS Duration 25381
ECG 1 - QT Interval 27944
ECG 1 - P Wave 24178

50
ECG 1 - Initial 40 ms 29018
ECG 1 - Mean QRS 27291
ECG 1 - Terminal 40 ms 26880
ECG 1 - ST Segment 30671
ECG 2 - Heart Rate 14523
ECG 2 - PR Interval 12928
ECG 2 - QRS Duration 13186
ECG 1 - QT Interval 15263
ECG 2 - P Wave 13634
ECG 2 - Initial 40 ms 15527
ECG 2 - Mean QRS 14047
ECG 2 - Terminal 40 ms 14261
ECG 2 - ST Segment 15725
Smoking History 5507
History of Diabetes 5457
History of Hyperlipidemia 5917
History of Hypertension 5281
History of CABG 3784
History of PCI 6715
History of MI 4967
History of CAD 4592
History of Stroke 5069
History of Heart Failure 4799
History of Aspirin Use 3998
History of Metoprolol Use 3980
History of Nitroglycerin Use 4950
Troponin 1 32689
Troponin 2 33641
Troponin 2 minus Troponin 1 28632
We also present a variable importance plot, a built-in function of the randomForest package
which plots the importance of individual variables determined by permutation analysis. This
works by calculating the error rate for the classification task on the out of bag trees, then
permuting each predictor variable successively and measuring the error rate, and comparing
the permuted and non-permuted error rates across all the trees in the forest. This difference is

51
then normalized by the standard deviation of the differences, and the result is plotted. Figure 2
shows the importance of each variable in the model, given by the mean decrease in Gini index
observed when permuting the given feature.
Figure 2. Variable importance plot for features from the random forest model
Under permutation analysis, seven features stand out as the useful core (previous history of
myocardial infarction, previous history of coronary artery disease, previous history of PCI, first
troponin, second troponin, change in troponin between first and second measurement, and
age), but with a long tail of others that are less prominent but still important. In an attempt to
further understand this finding, we built a random forest model with only the top seven

52
predictors, and also a model with every feature except the top seven predictors. We found that
the AUC for the model with the seven predictors removed retained a high discriminative
capacity (AUC= 0.851), while the model with only the top seven predictors also maintained
high performance (AUC = 0.815) (Figure 3).
Figure 3. ROC Curves for full random forest model, model with only most important variables,
and model without most important variables.

53
For an unbiased estimate of the generalized error of the algorithm, we ran the previously
developed random forest model on a final validation set. We report the AUC for the random
forest model to be 0.88092, and illustrate the ROC for this model on the validation set (Figure
4).
To assess the calibration of the estimates for the random forest algorithm on this data set, we
created a calibration curve for the performance on the validation set (Figure 5). This result is
good, but shows room for improvement. In an attempt to improve the calibration of the output
of the random forest, we used a novel technique proposed by Bostrom (Boström, 2008), in
which the output probabilities (probability of positive case and of negative case) for each
instance was scaled dependent on which probability was larger. By utilizing this approach, we
were able to improve the Brier score from 0.138 to 0.132 (Figure 6). While this is not a large
improvement in calibration, it shows that there are methods for improving the calibration of
random forest output in an attempt to make the predictions more accurate and clinically
meaningful.

54
Figure 4. Performance of random forest on the validation set of data. AUC = 0.881

55
Figure 5. Calibration curve for the validation set of random forest predictions

56
Figure 6. Calibration curve for validation set after calibration procedure

57
CHAPTER V
DISCUSSION
We developed a model using the random forest algorithm utilizing a novel clinical database that
improved upon existing ACS prediction tools. Over the past six decades, many prognostic
indices have been developed to aid physicians in the evaluation of patients with suspected ACS.
Some have been created out of purely clinical expertise, while others have focused on strict
mathematical approaches for defining a scoring metric. Some have been derived from clinical
trials data, and others have used registries of patient encounters. This work represents the first
attempt that we know of to use a data from real patient encounters in the uncontrolled
environment of a non-trial, non-registry emergency department for the development of such a
model. These data more fairly represents the heterogeneous patient population that
comprises the cohort of suspected acute coronary syndrome cases nationwide. Without
inclusion and exclusion criteria to skew the distribution toward generally healthier, younger
individuals, we have captured a broader range of age and pre-existing morbidity other studies
in this area have been able to do.
We have also demonstrated that computationally advanced models can potentially outperform
standard statistical methods. Our random forests, elastic net penalized regression, and even L2
ridge penalized regression outperformed previous models developed by stepwise multivariable
logistic regression.
One key limitation to this study is the availability of data in the system with which we worked.
Many of the timestamp entries, in addition to being shifted by the through the de-identification
process used in creating the Synthetic Derivative, have also had their seconds, minutes, and

58
even hours truncated. While temporal specificity down to the minute is not important in some
studies, such as genome-wide association studies or phenome-wide association studies,
knowing the correct relationship between event times in a complex history of a patient with
suspected acute coronary syndromes is critical.
Another limitation of this study is in the definition of positive events in our cohort. The
definition used relies heavily on work done by one of the value-based care organization at
Vanderbilt University Medical Center. If the purpose of the models we build is to identify
patients who actually have acute coronary syndromes on a biological basis, the WHO accepted
universal definition of myocardial infarction would likely be a better place to begin, with
additional considerations made for unstable angina. However, if the purpose is to predict risk of
major outcomes, such as death or revascularization, which track tightly with a final diagnosis of
ACS, this approach is likely sufficient, and alternative methods of identifying ACS-positive
records would have required significant manual chart review.
Additionally, we were unable to capture the major outcome of death from the current version
of the Synthetic Derivative database, but future incarnations will almost certainly contain de-
identified copies of the Social Security death index, which will allow another method of
identifying a major adverse coronary event. Even without this information, however, our
methods proved successful, and prior work by other authors have shown that predicting the
risk of non-fatal events such as non-fatal arrhythmias or revascularization is a more difficult
task than predicting the risk of death. Finally, an inability to determine which patients were
discharged from Vanderbilt but presented again within 30 days to an outside hospital means

59
we may have underestimated the total number of positive events. Use of identified data in the
future would allow us to consider patients whose ACS event might be unobservable in the
current research paradigm.
While the random forest automatically explores complex interactions between variables, these
interactions must be manually specified in regression-type approaches, no matter how complex
they are. As it was not clear apriori which interactions were important, and it would be
intractable to include all possible interactions, we elected not to include interaction terms in
our models for elastic net and ridge regression. While this may account for some of the
apparent outperformance of the regression methods by the random forest, we do not think this
is an egregious scientific decision, as the majority of previously developed models built with
stepwise-selected multivariable logistic regression also did not include interaction terms.
However, it remains a possibility that a form of penalized regression with select interaction
terms could yield a better performing or more intelligible model than a random forest.
Random forest models, through their complex representation of interactions between
variables, can very accurately discriminate between positive and negative examples. However,
determining which individual variables are most important for driving the decision can be
difficult, because each is not considered independently as in many regression cases. Rather,
every variable interacts with every other variable. In our specific example, removing the top
seven predictive variables did not strongly impact the AUC of the model, but using those top
seven variables alone also did not obliterate the model’s discrimination
60
In this application, calibration is important. Information used to make important medical
decisions is required to be correct. . In previous evaluations of ANNs, another connectionist
model like random forests, discrimination was superior to other metrics, while calibration
suffered (Selker et al., 1997). Continued research into ways to calibrate the output of black box
models to reflect the true probabilities associated with the events they predict will remain
important in models for use in medical practice.
While the AUC metric is largely used by the medical and machine learning communities as a
measure of predictive power, it is by no means the only method. The ability of one model to
reclassify examples incorrectly labeled by the other approach can provide significantly
improved performance, even though their AUCs may be virtually identical. Newer statistical
tests, such as net reclassification improvement and integrated discrimination improvement,
may be the next in an ever expanding toolkit of ways to compare accuracy between models
(Pencina, D’Agostino, D’Agostino Jr, & Vasan, 2008). One important future direction of this
current study and studies like it should be to fully characterize the performance differences
between metrics, determine which metric is most appropriate for the goal in mind, and make
certain to judge their performance on that metric as well as any others as appropriate.
If confirmed, this tool could ultimately improve the quality of care by reduction unnecessary
admissions and discharges of patients with acute chest pain, and help shift the cost curve for
healthcare that has so heavily weighed on the medical system by addressing one extreme case
of resource overutilization. Further work is needed to improve methods of model creation,
validation, calibration, and the development of appropriate decision support implementation.

61
REFERENCES
Anderson, J. L., Adams, C. D., Antman, E. M., Bridges, C. R., Califf, R. M., Casey, D. E., … Wright, R. S. (2011). 2011 ACCF/AHA Focused Update Incorporated Into the ACC/AHA 2007 Guidelines for the Management of Patients With Unstable Angina/Non-ST-Elevation Myocardial Infarction: A Report of the American College of Cardiology Foundation/American Heart Association Tas. Circulation, 410–528. doi:10.1161/CIR.0b013e318212bb8b
Antman, E. M., & Cohen, M. (2000). The TIMI risk score for unstable angina/non–ST elevation MI. JAMA: The Journal of the American Medical Association, 284(7), 835–842. Retrieved from http://jama.ama-assn.org/content/284/7/835.short
Aragam, K. G., Tamhane, U. U., Kline-Rogers, E., Li, J., Fox, K. a a, Goodman, S. G., … Gurm, H. S. (2009). Does simplicity compromise accuracy in ACS risk prediction? A retrospective analysis of the TIMI and GRACE risk scores. PloS one, 4(11), e7947. doi:10.1371/journal.pone.0007947
Backus, B. E., Six, a J., Kelder, J. C., Bosschaert, M. a R., Mast, E. G., Mosterd, a, … Doevendans, P. a. (2013). A prospective validation of the HEART score for chest pain patients at the emergency department. International journal of cardiology, 1–6. doi:10.1016/j.ijcard.2013.01.255
Backus, B. E., Six, a J., Kelder, J. C., Mast, T. P., van den Akker, F., Mast, E. G., … Doevendans, P. a F. M. (2010). Chest pain in the emergency room: a multicenter validation of the HEART Score. Critical pathways in cardiology, 9(3), 164–9. doi:10.1097/HPC.0b013e3181ec36d8
Baxt, W. G. (1990). Use of an Artificial Neural Network for Data Analysis in Clinical Decision-Making: The Diagnosis of Acute Coronary Occlusion. Neural Computation, 2(4), 480–489. doi:10.1162/neco.1990.2.4.480
Baxt, W. G. (1991). Use of an artificial neural network for the diagnosis of myocardial infarction. Annals of internal medicine, 115(11), 843–8. Retrieved from http://www.ncbi.nlm.nih.gov/pubmed/1952470
Baxt, W. G. (1992a). Improving the Accuracy of an Artificial Neural Network Using Multiple Differently Trained Networks. Neural Computation, 4(5), 772–780. doi:10.1162/neco.1992.4.5.772
Baxt, W. G. (1992b). Analysis of the clinical variables driving decision in an artificial neural network trained to identify the presence of myocardial infarction. Annals of emergency

62
medicine, 21(12), 1439–44. Retrieved from http://www.ncbi.nlm.nih.gov/pubmed/1443838
Baxt, W. G. (1994). A Neural Network Trained to Identify the Presence of Myocardial Infarction Bases Some Decisions on Clinical Associations That Differ from Accepted Clinical Teaching. Medical Decision Making, 14(3), 217–222. doi:10.1177/0272989X9401400303
Baxt, W. G., Shofer, F. S., Sites, F. D., & Hollander, J. E. (2002a). A neural computational aid to the diagnosis of acute myocardial infarction. Annals of Emergency Medicine, 39(4), 366–373. doi:10.1067/mem.2002.122705
Baxt, W. G., Shofer, F. S., Sites, F. D., & Hollander, J. E. (2002b). A neural network aid for the early diagnosis of cardiac ischemia in patients presenting to the emergency department with chest pain. Annals of Emergency Medicine, 40(6), 575–583. doi:10.1067/mem.2002.129171
Baxt, W. G., & Skora, J. (1996). Prospective validation of artificial neural network trained to identify acute myocardial infarction. Lancet, 347(8993), 12–5. Retrieved from http://www.ncbi.nlm.nih.gov/pubmed/8531540
Body, R., Carley, S., McDowell, G., Ferguson, J., & Mackway-Jones, K. (2009). Can a modified thrombolysis in myocardial infarction risk score outperform the original for risk stratifying emergency department patients with chest pain? Emergency medicine journal : EMJ, 26(2), 95–9. doi:10.1136/emj.2008.058495
Boersma, E., Pieper, K. S., Steyerberg, E. W., Wilcox, R. G., Chang, W.-C., Lee, K. L., … Simoons, M. L. (2000). Predictors of Outcome in Patients With Acute Coronary Syndromes Without Persistent ST-Segment Elevation : Results From an International Trial of 9461 Patients. Circulation, 101(22), 2557–2567. doi:10.1161/01.CIR.101.22.2557
Boström, H. (2008). Calibrating Random Forests. Machine Learning and Applications, 2008. ICMLA’ …. Retrieved from http://ieeexplore.ieee.org/xpls/abs_all.jsp?arnumber=4724964
Breiman, L. (2001). Random forests. Machine learning, 45(1), 5–32. doi:10.1016/j.compbiomed.2011.03.001
Cairns, C. B., Niemann, J. T., Selker, H. P., & Laks, M. M. (1992). Computerized version of the time-insensitive predictive instrument. Use of the Q wave, ST-segment, T wave, and patient history in the diagnosis of acute myocardial infarction by the computerized ECG. Journal of electrocardiology, 24 Suppl, 46–9. Retrieved from http://www.ncbi.nlm.nih.gov/pubmed/1552267
Chase, M., Robey, J. L., Zogby, K. E., Sease, K. L., Shofer, F. S., & Hollander, J. E. (2006). Prospective validation of the Thrombolysis in Myocardial Infarction Risk Score in the

63
emergency department chest pain population. Annals of emergency medicine, 48(3), 252–9. doi:10.1016/j.annemergmed.2006.01.032
Christenson, J., Innes, G., McKnight, D., Boychuk, B., Grafstein, E., Thompson, C. R., … Singer, J. (2004). Safety and efficiency of emergency department assessment of chest discomfort. CMAJ : Canadian Medical Association journal = journal de l’Association medicale canadienne, 170(12), 1803–7. Retrieved from http://www.ecmaj.ca/content/170/12/1803.short
Christenson, J., Innes, G., McKnight, D., Thompson, C. R., Wong, H., Yu, E., … Singer, J. (2006). A clinical prediction rule for early discharge of patients with chest pain. Annals of emergency medicine, 47(1), 1–10. doi:10.1016/j.annemergmed.2005.08.007
Computer-derived protocol to predict myocardial infarction in patients with chest pain. (1988). The New England journal of medicine, 319(12), 790–2. doi:10.1056/NEJM198809223191212
D’Ascenzo, F., Biondi-Zoccai, G., Moretti, C., Bollati, M., Omedè, P., Sciuto, F., … Gaita, F. (2012). TIMI, GRACE and alternative risk scores in Acute Coronary Syndromes: a meta-analysis of 40 derivation studies on 216,552 patients and of 42 validation studies on 31,625 patients. Contemporary clinical trials, 33(3), 507–14. doi:10.1016/j.cct.2012.01.001
De Araújo Gonçalves, P., Ferreira, J., Aguiar, C., & Seabra-Gomes, R. (2005). TIMI, PURSUIT, and GRACE risk scores: sustained prognostic value and interaction with revascularization in NSTE-ACS. European heart journal, 26(9), 865–72. doi:10.1093/eurheartj/ehi187
Eagle, K. A., Lim, M. J., Dabbous, O. H., Pieper, K. S., Goldberg, R. J., Goodman, S. G., … Fox, K. A. A. (2004). A validated prediction model for all forms of acute coronary syndrome. JAMA: the journal of …, 291(22), 2727–2733. Retrieved from http://jama.ama-assn.org/content/291/22/2727.short
Filipiak, K. J., Koltowski, L., Grabowski, M., Karpinski, G., Glowczynska, R., Huczek, Z., … Opolski, G. (2011). Prospective Comparison of the 5 Most Popular Risk Scores in Clinical Use for Unselected Patients With Acute Coronary Syndrome. Circulation Journal, 75(1), 167–173. doi:10.1253/circj.CJ-10-0037
Fox, K. a a, Dabbous, O. H., Goldberg, R. J., Pieper, K. S., Eagle, K. a, Van de Werf, F., … Granger, C. B. (2006). Prediction of risk of death and myocardial infarction in the six months after presentation with acute coronary syndrome: prospective multinational observational study (GRACE). BMJ (Clinical research ed.), 333(7578), 1091. doi:10.1136/bmj.38985.646481.55
Goldman, L., Weinberg, M., Weisberg, M., Olshen, R., Cook, E. F., Sargent, R. K., … Stiratelli, R. (1982). A computer-derived protocol to aid in the diagnosis of emergency room patients

64
with acute chest pain. New England journal, 307(10), 588–596. Retrieved from http://www.nejm.org/doi/full/10.1056/NEJM198209023071004
Goodacre, S. W., Bradburn, M., Mohamed, A., & Gray, A. (2012). Evaluation of Global Registry of Acute Cardiac Events and Thrombolysis in Myocardial Infarction scores in patients with suspected acute coronary syndrome. The American journal of emergency medicine, 30(1), 37–44. doi:10.1016/j.ajem.2010.09.013
Granger, C. B., Goldberg, R. J., Dabbous, O., Pieper, K. S., Eagle, K. a, Cannon, C. P., … Fox, K. a a. (2003). Predictors of hospital mortality in the global registry of acute coronary events. Archives of internal medicine, 163(19), 2345–53. doi:10.1001/archinte.163.19.2345
Green, M., Björk, J., & Forberg, J. (2006). Comparison between neural networks and multiple logistic regression to predict acute coronary syndrome in the emergency room. Artificial Intelligence in …, 38(3), 305–18. doi:10.1016/j.artmed.2006.07.006
Grijseels, E. W., Deckers, J. W., Hoes, a W., Hartman, J. a, Van der Does, E., Van Loenen, E., & Simoons, M. L. (1995). Pre-hospital triage of patients with suspected myocardial infarction. Evaluation of previously developed algorithms and new proposals. European heart journal, 16(3), 325–32. Retrieved from http://www.ncbi.nlm.nih.gov/pubmed/7789374
Harrison, R. F., & Kennedy, R. L. (2005). Artificial neural network models for prediction of acute coronary syndromes using clinical data from the time of presentation. Annals of emergency medicine, 46(5), 431–9. doi:10.1016/j.annemergmed.2004.09.012
Hess, E. P., Agarwal, D., Chandra, S., Murad, M. H., Erwin, P. J., Hollander, J. E., … Stiell, I. G. (2010). Diagnostic accuracy of the TIMI risk score in patients with chest pain in the emergency department: a meta-analysis. CMAJ : Canadian Medical Association journal = journal de l’Association medicale canadienne, 182(10), 1039–44. doi:10.1503/cmaj.092119
Hess, E. P., Brison, R. J., Perry, J. J., Calder, L. a, Thiruganasambandamoorthy, V., Agarwal, D., … Stiell, I. G. (2012). Development of a clinical prediction rule for 30-day cardiac events in emergency department patients with chest pain and possible acute coronary syndrome. Annals of emergency medicine, 59(2), 115–25.e1. doi:10.1016/j.annemergmed.2011.07.026
Ilgen, J. S., Manini, A. F., Hoffmann, U., Noble, V. E., Giraldez, E., Nualpring, S., & Bohan, J. S. (2011). Prognostic utility of the acute cardiac ischemia time-insensitive predictive instrument (ACI-TIPI). International journal of emergency medicine, 4(1), 49. doi:10.1186/1865-1380-4-49
Jalili, M., Hejripour, Z., Honarmand, A. R., & Pourtabatabaei, N. (2012). Validation of the Vancouver Chest Pain Rule: a prospective cohort study. Academic emergency medicine :
65
official journal of the Society for Academic Emergency Medicine, 19(7), 837–42. doi:10.1111/j.1553-2712.2012.01399.x
Jarai, R., Iordanova, N., Jarai, R., Jarai, F., Raffetseder, A., Woloszczuk, W., … Huber, K. (2007). Prediction of clinical outcome in patients with non-ST-elevation acute coronary syndrome (NSTE-ACS) using the TIMI risk score extended by N-terminal pro-brain natriuretic peptide levels. Wiener klinische Wochenschrift, 119(21-22), 626–32. doi:10.1007/s00508-007-0892-2
Kennedy, R. L., & Harrison, R. F. (2006). Identification of patients with evolving coronary syndromes by using statistical models with data from the time of presentation. Heart (British Cardiac Society), 92(2), 183–9. doi:10.1136/hrt.2004.055293
Kumar, A., & Cannon, C. P. (2009). Acute coronary syndromes: diagnosis and management, part I. Mayo Clinic Proceedings, 84(11), 1021–36. doi:10.4065/84.11.1021
Kurz, D. J., Bernstein, a, Hunt, K., Radovanovic, D., Erne, P., Siudak, Z., & Bertel, O. (2009). Simple point-of-care risk stratification in acute coronary syndromes: the AMIS model. Heart (British Cardiac Society), 95(8), 662–8. doi:10.1136/hrt.2008.145904
Lee, B., Chang, A. M., Matsuura, A. C., Marcoon, S., & Hollander, J. E. (2011). Comparison of Cardiac Risk Scores in ED Patients With Potential Acute Coronary Syndrome. Critical pathways in cardiology, 10(2), 64–8. doi:10.1097/HPC.0b013e31821c79bd
Limkakeng, A., & Gibler, W. (2001). Combination of Goldman risk and initial cardiac troponin I for emergency department chest pain patient risk stratification. … Emergency …, 696–702. Retrieved from http://onlinelibrary.wiley.com/doi/10.1111/j.1553-2712.2001.tb00187.x/abstract
Manini, A. F., Dannemann, N., Brown, D. F., Butler, J., Bamberg, F., Nagurney, J. T., … Hoffmann, U. (2009). Limitations of risk score models in patients with acute chest pain. The American journal of emergency medicine, 27(1), 43–8. doi:10.1016/j.ajem.2008.01.022
Marcoon, S., Chang, A. M., Lee, B., Salhi, R., & Hollander, J. E. (2013). HEART score to further risk stratify patients with low TIMI scores. Critical pathways in cardiology, 12(1), 1–5. doi:10.1097/HPC.0b013e31827377e1
Meune, C., Drexler, B., Haaf, P., Reichlin, T., Reiter, M., Meissner, J., … Mueller, C. (2011). The GRACE score’s performance in predicting in-hospital and 1-year outcome in the era of high-sensitivity cardiac troponin assays and B-type natriuretic peptide. Heart (British Cardiac Society), 1479–1484. doi:10.1136/hrt.2010.220988
Ogden, C. L., Ph, D., & Flegal, K. M. (2008). Anthropometric Reference Data for Children and Adults : United States , 2003 – 2006, (10), 2003–2006.
66
Peel, A. A., Semple, T., Wang, I., Lancaster, W. M., & Dall, J. L. (1962). A CORONARY PROGNOSTIC INDEX FOR GRADING THE SEVERITY OF INFARCTION. British heart journal, 24(6), 745–60. Retrieved from http://www.pubmedcentral.nih.gov/articlerender.fcgi?artid=1017945&tool=pmcentrez&rendertype=abstract
Pencina, M. J., D’Agostino, R. B., D’Agostino Jr, R. B., & Vasan, R. S. (2008). Evaluating the added predictive ability of a new marker: from area under the ROC curve to reclassification and beyond. Statistics in medicine, 27(2), 157–172. doi:10.1002/sim
Pipberger, H. V, Klingeman, J. D., & Cosma, J. (1968). Computer evaluation of statistical properties of clinical information in the differential diagnosis of chest pain. Methods of information in medicine, 7(2), 79–92. Retrieved from http://www.ncbi.nlm.nih.gov/pubmed/5731506
Pollack, C. V, Sites, F. D., Shofer, F. S., Sease, K. L., & Hollander, J. E. (2006). Application of the TIMI risk score for unstable angina and non-ST elevation acute coronary syndrome to an unselected emergency department chest pain population. Academic emergency medicine : official journal of the Society for Academic Emergency Medicine, 13(1), 13–8. doi:10.1197/j.aem.2005.06.031
Pope, J., Aufderheide, T. P., & Ruthazer, R. (2000). Missed diagnoses of acute cardiac ischemia in the emergency department. England Journal of, 342(16), 1163–1170. Retrieved from http://www.nejm.org/doi/full/10.1056/NEJM200004203421603
Pozen, M. W., & D’Agostino, R. B. (1984). A predictive instrument to improve coronary-care-unit admission practices in acute ischemic heart disease. … England Journal of …. Retrieved from http://www.nejm.org/doi/pdf/10.1056/NEJM198405173102001
Pozen, M. W., D’Agostino, R. B., Mitchell, J. B., Rosenfeld, D. M., Guglielmino, J. T., Schwartz, M. L., … Hood, W. B. (1980). The usefulness of a predictive instrument to reduce inappropriate admissions to the coronary care unit. Annals of internal medicine, 92(2 Pt 1), 238–42. Retrieved from http://www.ncbi.nlm.nih.gov/pubmed/6986111
Pozen, M. W., Stechmiller, J. K., & Voigt, G. C. (1977). Prognostic efficacy of early clinical categorization of myocardial infarction patients. Circulation, 56(5), 816–819. doi:10.1161/01.CIR.56.5.816
Ramsay, G., Podogrodzka, M., McClure, C., & Fox, K. a a. (2007). Risk prediction in patients presenting with suspected cardiac pain: the GRACE and TIMI risk scores versus clinical evaluation. QJM : monthly journal of the Association of Physicians, 100(1), 11–8. doi:10.1093/qjmed/hcl133

67
Rusnak, R. A., Stair, T. O., Hansen, K., & Fastow, J. S. (1989). Litigation against the emergency physician: common features in cases of missed myocardial infarction. Annals of emergency medicine, 18(10), 1029–34. Retrieved from http://www.annemergmed.com/article/S0196-0644(89)80924-2/abstract
Sanchis, J, Bodí, V., Llácer, a, Núñez, J., Consuegra, L., Bosch, M. J., … Chorro, F. J. (2005). Risk stratification of patients with acute chest pain and normal troponin concentrations. Heart (British Cardiac Society), 91(8), 1013–8. doi:10.1136/hrt.2004.041673
Sanchis, Juan, Bodí, V., Núñez, J., Bertomeu-Gonzalez, V., Gómez, C., Bosch, M. J., … Llàcer, A. (2005). New risk score for patients with acute chest pain, non-ST-segment deviation, and normal troponin concentrations: a comparison with the TIMI risk score. Journal of the American College of Cardiology, 46(3), 443–9. doi:10.1016/j.jacc.2005.04.037
Scheuermeyer, F. X., Innes, G., Grafstein, E., Kiess, M., Boychuk, B., Yu, E., … Christenson, J. (2012). Safety and efficiency of a chest pain diagnostic algorithm with selective outpatient stress testing for emergency department patients with potential ischemic chest pain. Annals of emergency medicine, 59(4), 256–264.e3. doi:10.1016/j.annemergmed.2011.10.016
Scirica, B. (2010). Acute coronary syndrome: emerging tools for diagnosis and risk assessment. Journal of the American College of Cardiology, 55(14), 1403–15. doi:10.1016/j.jacc.2009.09.071
Selker, H. P., Beshansky, J. R., Griffith, J. L., Aufderheide, T. P., Ballin, D. S., Bernard, S. A., … Woolard, R. H. (1998). Use of the acute cardiac ischemia time-insensitive predictive instrument (ACI-TIPI) to assist with triage of patients with chest pain or other symptoms suggestive of acute cardiac ischemia. Annals of internal …, 129(11), 845–855. Retrieved from http://annals.org/article.aspx?articleid=712350
Selker, H. P., Beshansky, J. R., Pozen, J. D., Kilduff, R. L., Kirle, L., Keenan, M., … Mondor, M. (2002). Electrocardiograph-based emergency department risk management tool based on the ACI-TIPI: potential impact on care and malpractice claims. Journal of healthcare risk management : the journal of the American Society for Healthcare Risk Management, 22(1), 11–7. doi:10.1002/jhrm.5600220105
Selker, H. P., Beshansky, J. R., Ruthazer, R., Sheehan, P. R., Sayah, A. J., Atkins, J. M., … Griffith, J. L. (2011). Emergency medical service predictive instrument-aided diagnosis and treatment of acute coronary syndromes and ST-segment elevation myocardial infarction in the IMMEDIATE trial. Prehospital emergency care : official journal of the National Association of EMS Physicians and the National Association of State EMS Directors, 15(2), 139–48. doi:10.3109/10903127.2010.545478

68
Selker, H. P., D’Agostino, R. B., & Laks, M. (1988). A predictive instrument for acute ischemic heart disease to improve coronary care unit admission practices: a potential on-line tool in a computerized electrocardiograph. Journal of Electrocardiology. Retrieved from http://www.sciencedirect.com/science/article/pii/0022073688900477
Selker, H. P., Griffith, J. L., & D’Agostino, R. B. (1991). A time-insensitive predictive instrument for acute myocardial infarction mortality: a multicenter study. Medical care, 29(12), 1196–211. Retrieved from http://www.ncbi.nlm.nih.gov/pubmed/1745078
Selker, H. P., Zalenski, R. J., Antman, E. M., Aufderheide, T. P., Bernard, S. a, Bonow, R. O., … Weaver, W. D. (1997). An evaluation of technologies for identifying acute cardiac ischemia in the emergency department: executive summary of a National Heart Attack Alert Program Working Group Report. Annals of emergency medicine, 29(1), 1–12. Retrieved from http://www.ncbi.nlm.nih.gov/pubmed/8998085
Six, a J., Backus, B. E., & Kelder, J. C. (2008). Chest pain in the emergency room: value of the HEART score. Netherlands heart journal : monthly journal of the Netherlands Society of Cardiology and the Netherlands Heart Foundation, 16(6), 191–6. Retrieved from http://www.pubmedcentral.nih.gov/articlerender.fcgi?artid=2442661&tool=pmcentrez&rendertype=abstract
Strehlow, M. (2011). Chest Pain : Observation & Rapid Rule Outs.
Than, M., Cullen, L., Aldous, S., Parsonage, W. a, Reid, C. M., Greenslade, J., … Richards, a M. (2012). 2-Hour Accelerated Diagnostic Protocol to Assess Patients With Chest Pain Symptoms Using Contemporary Troponins as the Only Biomarker: The ADAPT Trial. Journal of the American College of Cardiology, 59(23), 2091–8. doi:10.1016/j.jacc.2012.02.035
Than, M., Cullen, L., Reid, C. M., Lim, S. H., Aldous, S., Ardagh, M. W., … Richards, A. M. (2011). A 2-h diagnostic protocol to assess patients with chest pain symptoms in the Asia-Pacific region (ASPECT): a prospective observational validation study. Lancet, 377(9771), 1077–84. doi:10.1016/S0140-6736(11)60310-3
Than, M., Flaws, D. F., Cullen, L., & Deely, J. M. (2013). Cardiac Risk Stratification Scoring Systems for Suspected Acute Coronary Syndromes in the Emergency Department. Current Emergency and Hospital Medicine Reports, 1(1), 53–63. doi:10.1007/s40138-012-0004-0
Vaidya, S. R., Shapiro, J. S., Lovett, P. B., & Kuperman, G. J. (2010). Acute coronary syndrome cohort definition: troponin versus ICD-9-CM codes. Future cardiology, 6(5), 725–31. doi:10.2217/fca.10.81
Vinterbo, S., & Ohno-Machado, L. (1999). A genetic algorithm to select variables in logistic regression: example in the domain of myocardial infarction. Proceedings / AMIA ... Annual Symposium. AMIA Symposium, 984–8. Retrieved from

69
http://www.pubmedcentral.nih.gov/articlerender.fcgi?artid=2232877&tool=pmcentrez&rendertype=abstract
WHO | The top 10 causes of death. (n.d.). Retrieved from http://who.int/mediacentre/factsheets/fs310/en/
Yan, A. T., Jong, P., Yan, R. T., Tan, M., Fitchett, D., Chow, C.-M., … Goodman, S. G. (2004). Clinical trial--derived risk model may not generalize to real-world patients with acute coronary syndrome. American heart journal, 148(6), 1020–7. doi:10.1016/j.ahj.2004.02.014
Yan, A. T., Yan, R. T., Tan, M., Casanova, A., Labinaz, M., Sridhar, K., … Goodman, S. G. (2007). Risk scores for risk stratification in acute coronary syndromes: useful but simpler is not necessarily better. European heart journal, 28(9), 1072–8. doi:10.1093/eurheartj/ehm004
Zou, H., & Hastie, T. (2005). Regularization and variable selection via the elastic net. Journal of the Royal Statistical Society: Series B (Statistical Methodology), 67(2), 301–320. doi:10.1111/j.1467-9868.2005.00503.x