Ranbaxy Laboratories Limited
18
Privileged and Confidential Post Results Conference Call 05 Feb 2014 Ranbaxy Laboratories Limited FINANCIAL RESULTS: October – December 2013 (Q4) YTD December 31, 2013 (YTD Dec) ARUN SAWHNEY CEO & MD
Transcript of Ranbaxy Laboratories Limited

Privileged and Confidential
Dept. Name Post Results Conference Call 05 Feb 2014
Ranbaxy Laboratories Limited
FINANCIAL RESULTS: October – December 2013 (Q4)
YTD December 31, 2013 (YTD Dec)
ARUN SAWHNEY
CEO & MD
Privileged and Confidential
Except for the historical information contained herein, statements in this presentation and the
subsequent discussions, which include words or phrases such as “will”, “aim”, “will likely result”, “would”,
“believe”, “may”, “expect”, “will continue”, “anticipate”, “estimate”, “intend”, “plan”, “contemplate”, “seek
to”, “future”, “objective”, “goal”, “likely”, “project”, “should”, “potential”, “will pursue” and similar
expressions or variations of such expressions may constitute "forward-looking statements". These
forward-looking statements involve a number of risks, uncertainties and other factors that could cause
actual results to differ materially from those suggested by the forward-looking statements. These risks
and uncertainties include, but are not limited to our ability to successfully implement our strategy, our
growth and expansion plans, obtain regulatory approvals, our provisioning policies, technological
changes, investment and business income, cash flow projections, our exposure to market risks as well as
other risks. Ranbaxy does not undertake any obligation to update forward-looking statements to reflect
events or circumstances after the date thereof.
Safe Harbor
2

Privileged and Confidential 3
Toansa manufacturing plant was issued a Form 483 with certain observations and was subsequently included under certain provisions of the Consent Decree by the US FDA
The Company will work with the US FDA to resolve the concerns Strict action to be taken upon completion of internal investigation
Regulatory Development at Toansa

Privileged and Confidential
Key Achievements for Quarter 4, FY14
2%
9%
Q4 2012 Q4 FY14
Perc
ent
EBITDA/ Sales %
Financial
Base business sales continued to grow over the corresponding quarter
Margin improvement continued during the quarter
1/2
26,708 28,590
Q4 2012 Q4 FY14
Rs. M
n
Sales
Growth calculated on Constant Forex
4
Privileged and Confidential
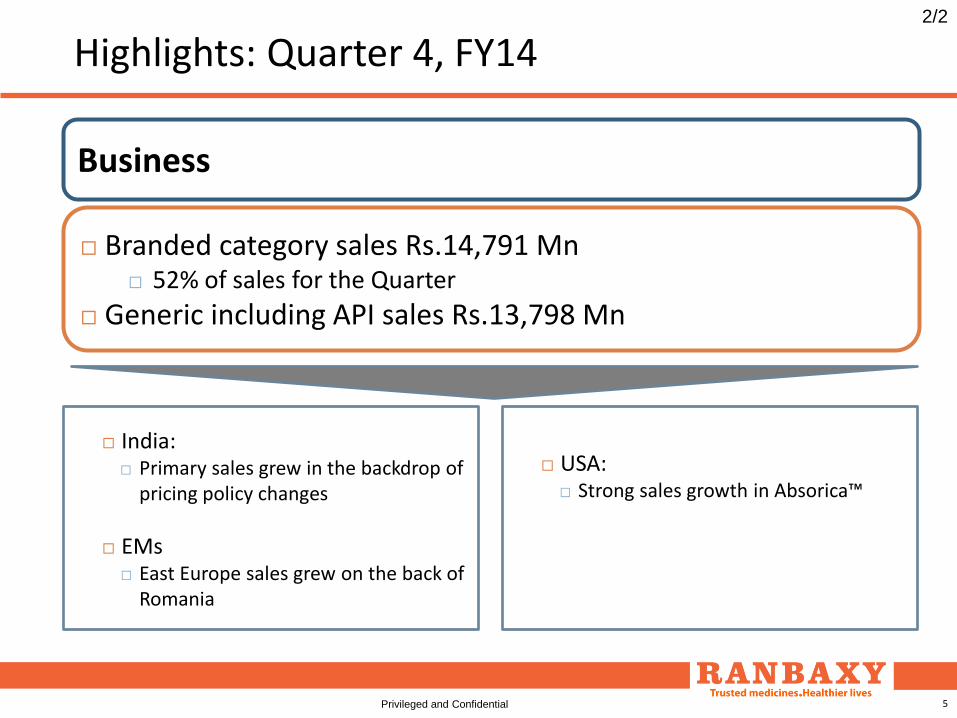
Business
Branded category sales Rs.14,791 Mn 52% of sales for the Quarter
Generic including API sales Rs.13,798 Mn
India: Primary sales grew in the backdrop of
pricing policy changes
EMs East Europe sales grew on the back of
Romania
USA: Strong sales growth in Absorica™
2/2
Highlights: Quarter 4, FY14
5

Privileged and Confidential
Functional Performance
Manufacturing and Regulatory
Toansa manufacturing plant was issued a Form 483 with certain observations and was subsequently included under certain provisions of the Consent Decree by the US FDA
The Company will work with the US FDA to resolve the concerns Strict action to be taken upon completion of internal investigation
Dewas, Paonta Sahib and Mohali Consent Decree progress is per plan
6

Privileged and Confidential
Other Areas
Derivatives Position
Exposure down to ~$665 Mn as on 31 Dec 2013 from ~$763 Mn in Q3 2013. Maturity: ~$33 Mn/month
Research & Development
Regulatory Filings and approvals DF filings: 63; DF approvals: 34 3 ANDA filed in USA; YTD Dec 2013: 10 ANDA filings
Debt
Debt $980 Mn; Cash & Bank $222 Mn Net Debt $758 Mn
7

Privileged and Confidential
Dept. Name
Financial Performance
Ranbaxy Laboratories Limited
FINANCIAL RESULTS: October – December 2013 (Q4 FY14)
YTD December 31, 2013 (YTD Dec)

Privileged and Confidential
YTD Dec 12 YTD Dec 13
26,708
28,590
Q4 2012 Q4 FY14
Rs. Mn Sales Performance
Base business sales grew over the corresponding quarter
Consolidated Sales YTD Dec 2013
Consolidated Sales Q4 FY14
9 Growth calculated on Constant Forex
122, 529
106, 042

Privileged and Confidential
53,336
33,569
YTD Dec 12 YTD Dec 13
8,510 10,187
Q4 2012 Q4 FY14
5%
Rs. Mn
(43%)
North America
Robust base business growth
Strong sales growth in Absorica™ continued
10
-USA
-Canada
Major markets
Growth calculated on Constant Forex

Privileged and Confidential
21,346 22,395
YTD Dec 12 YTD Dec 13
5,342 5,794
Q4 2012 Q4 FY14
8%
Rs. Mn
5%
India
Primary sales grew over the corresponding quarter
Continued strong performance in the OTC part of the business
11 Growth calculated on Constant Forex
Privileged and Confidential
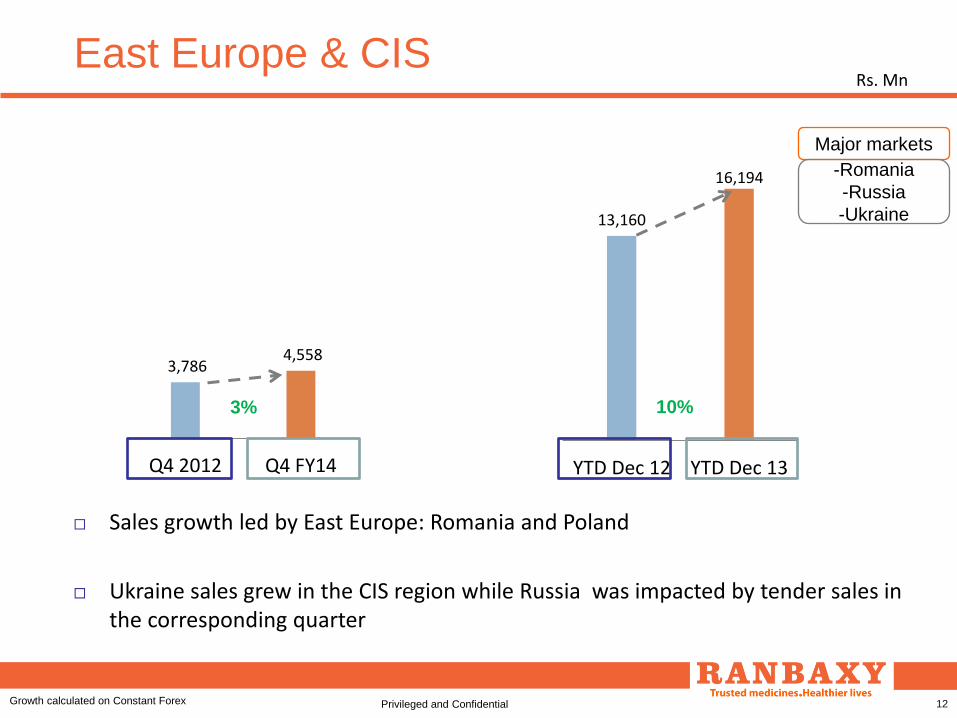
13,160
16,194
YTD Dec 12 YTD Dec 13
3,786 4,558
Q4 2012 Q4 FY14
3%
Rs. Mn
10%
East Europe & CIS
Sales growth led by East Europe: Romania and Poland
Ukraine sales grew in the CIS region while Russia was impacted by tender sales in the corresponding quarter
12
Major markets
-Romania
-Russia
-Ukraine
Growth calculated on Constant Forex

Privileged and Confidential
9,720
8,346
YTD Dec 12 YTD Dec 13
2,248 2,348
Q4 2012 Q4 FY14
(13%)
Rs. Mn
(24%)
West Europe
Regional focus on profitability continued
13
Major markets
-France
-Germany
-UK
Growth calculated on Constant Forex

Privileged and Confidential
7,469 7,694
YTD Dec 12 YTD Dec 13
1,838 1,678
Q4 2012 Q4 FY14
(16%)
Rs. Mn
(2%)
Asia Pacific & Latin America
Change in business model in Thailand
Sales grew in Australia, the largest market in the APAC region (ex Japan)
14
Major markets
-ANZ
-Malaysia
-Brazil
Growth calculated on Constant Forex

Privileged and Confidential
10,188
10,917
YTD Dec 12 YTD Dec 13
2,838 2,648
Q4 2012 Q4 FY14
(14%)
Rs. Mn
5%
Africa & Middle East
Sales seem lower impacted by tender sales in the corresponding period
15
Major markets
-South Africa
-Nigeria
Growth calculated on Constant Forex

Privileged and Confidential
7,309 6,927
YTD Dec 12 YTD Dec 13
2,146
1,376
Q4 2012 Q4 FY14
(43%)
Rs. Mn
(12%)
API & Others
Sales impacted by lower demand
16 Growth calculated on Constant Forex

Privileged and Confidential
Financials Q4 FY14: INR
17
Q4 2012 YTD Dec 12 Particulars Q4 FY14 YTD Dec 13 5,477 22,008 -Within India 5,909 22,992
21,231 100,521 -Outside India 22,681 83,050 26,708 122,529 Sales 28,590 106,042
404 2,068 Other operating income 350 1,975 27,112 124,597 Total Operating Income 28,940 108,017 11,545 40,601 Total Material Consumption 10,459 39,033 4,933 19,284 Employee cost 5,493 20,803 546 11,795 Claims and contractual payments 11 529
9,278 33,538 Other Operating expenses 10,375 38,581 282 1,152 Exchange loss/ (gain) others, net (101) 830
26,584 106,370 Total expenditure 26,236 99,776 528 18,227 EBITDA 2,703 8,240 2% 15% % Sales 9% 8%
805 3,202 Depreciation, amortization and Impairment 915 3,809 (277) 15,025 Profit/(loss) from operations before other income and interest 1,788 4,432 -1% 12% % Sales 6% 4%
767 2,732 Interest and other income 352 1,591 490 17,757 Profit/ (loss) from ordinary activities before finance cost and exceptional items 2,141 6,023 537 1,796 Interest expense 543 2,046 820 1,240 Foreign exchange (gain)/ loss on loans 662 2,391
(867) 14,721 Profit/(loss) from ordinary activities before tax 935 1,586 (1,860) (1,860) Goodwill Impairment/ Settlement/ Product Recall (2,574) (4,461) 1,799 412 Foreign exchange loss/(gain) on foreign currency option derivatives 1,036 (4,839)
(4,525) 12,449 Profit/(loss) after exceptional items before tax (603) (7,714) 340 2,939 Tax expense/ (benefit) -current period 981 2,216
(4,866) 9,510 Net profit/ (loss) from ordinary activities after tax (1,585) (9,930) 25 186 -Share in loss/ (profit) of associates, net 37 149 34 96 -Minority interest (33) 37
(4,924) 9,228 Net profit/ (loss) (1,589) (10,116)

Privileged and Confidential
Dept. Name
Questions &
Answers