Rambus First Quarter 2018 Financial...
16
Rambus First Quarter 2018 Financial Results May 7, 2018
Transcript of Rambus First Quarter 2018 Financial...

Rambus First Quarter 2018 Financial Results
May 7, 2018

2
Safe Harbor for Forward-Looking Statements
This presentation contains forward-looking statements under the Private Securities Litigation Reform Act of 1995 including those relating to our expectations regarding financial guidance for the second quarter of 2018, including revenue, operating costs and expenses, earnings per share and estimated, fixed, long-term projected tax rates, and full year 2018. Such forward-looking statements are based on current expectations, estimates and projections, management’s beliefs and certain assumptions made by Rambus’ management. Actual results may differ materially. Our business is subject to a number of risks which are described more fully in our periodic reports filed with the Securities and Exchange Commission. Rambus undertakes no obligation to update forward-looking statements to reflect events or circumstances after the date hereof.
Effective January 1, 2018, the Company adopted Accounting Standards Update No. 2014-09, Revenue from Contracts with Customers in ASC 606. The adoption of ASC 606 materially impacted the timing of revenue recognition for the Company's fixed-fee intellectual property licensing arrangements. The adoption of ASC 606 did not have a material impact on the Company's other revenue streams, net cash provided by operating activities, or its underlying financial position.
The Company has provided financial results for the first quarter ended March 31, 2018 and its second quarter outlook under ASC 606 and ASC 605 in order to provide additional transparency. The Company believes that providing this additional disclosure in the short term will help its investors and analysts understand the impact of the change in revenue recognition standards, especially given the material difference in the timing of revenue recognition for its fixed-fee licensing arrangements as mentioned above. Note that the presentation under ASC 605 is not a substitute for the new ASC 606 revenue recognition rules under current GAAP.
This presentation contains non-GAAP financial measures, including operating costs and expenses, operating margin, operating income (loss), adjusted EBITDA and net income (loss). In computing these non-GAAP financial measures, stock-based compensation expenses, acquisition-related transaction costs and retention bonus expense, amortization expenses, non-cash interest expense and certain other one-time adjustments were considered. The non-GAAP financial measures should not be considered a substitute for, or superior to, financial measures calculated in accordance with GAAP, and the financial results calculated in accordance with GAAP and reconciliations from these results should be carefully evaluated. Management believes the non-GAAP financial measures are appropriate for both its own assessment of, and to show investors, how the Company’s performance compares to other periods. Reconciliation from GAAP to non-GAAP results are made available and more fully described on our website as well as the back of this deck and in the earnings release.
3
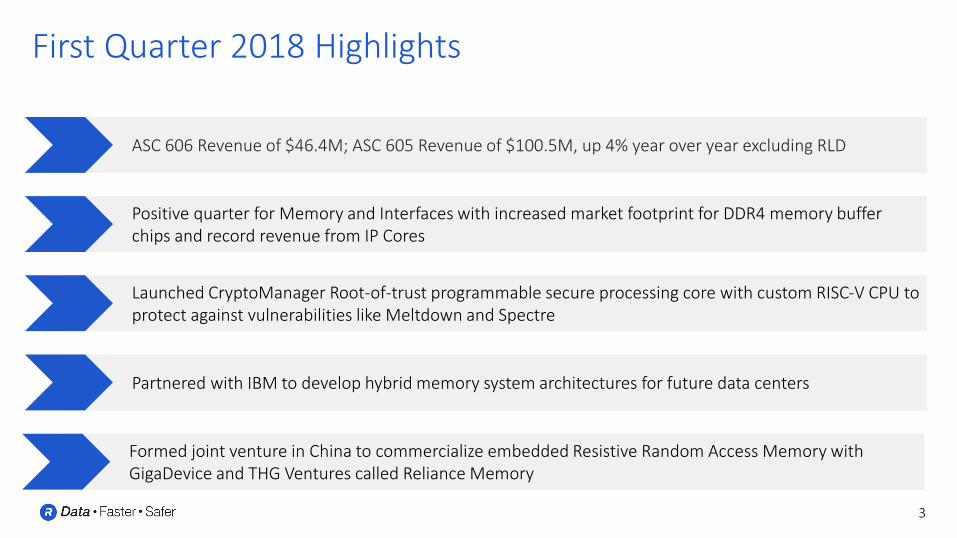
First Quarter 2018 Highlights
ASC 606 Revenue of $46.4M; ASC 605 Revenue of $100.5M, up 4% year over year excluding RLD
Positive quarter for Memory and Interfaces with increased market footprint for DDR4 memory buffer chips and record revenue from IP Cores
Launched CryptoManager Root-of-trust programmable secure processing core with custom RISC-V CPU to protect against vulnerabilities like Meltdown and Spectre
Partnered with IBM to develop hybrid memory system architectures for future data centers
Formed joint venture in China to commercialize embedded Resistive Random Access Memory with GigaDevice and THG Ventures called Reliance Memory

4
FinancialsProfitable growth

5
Under ASC 606: Revenue of $46.4M, non-GAAP EPS of ($0.10) Under ASC 605: Revenue of $100.5M, non-GAAP EPS of $0.21
Financial Highlights
Delivered solid results in line with revenue and EPS expectations
Delivered Adjusted EBITDA of $34.7M and Cash from Operations of $16.5M in Q1’18
Growth through licensing and execution on strategic initiatives

6
34.0
70.6 67.4 68.8 73.9 78.010.0
23.223.4 26.3
23.8 19.9
2.4
3.6 4.04.0 4.2 2.5
46.4
97.4 94.799.1 101.9 100.5
0
20
40
60
80
100
120
Q1'18 (ASC606) Q1'17 Q2'17 Q3'17 Q4'17 Q1'18 (ASC605)
MID RSD RLD
Growing Revenue BaseLarge portion of our revenue is fixed & predictable
• Year-over-year revenue growth under ASC 605
• Continue to leverage our high margin historic businesses to fuel growth in adjacent areasR
eve
nu
e ($
M)
Q1’18 Q1’18
ASC 606 ASC 605

7
Non-GAAP Income Statement
¹Please refer to reconciliations of non-GAAP financial measures included in this presentation and in our earnings release
In MillionsASC 606Q1 2018
ASC 605Q1 2017
ASC 605Q2 2017
ASC 605Q3 2017
ASC 605Q4 2017
ASC 605Q1 2018
Revenue $46.4 $97.4 $94.7 $99.1 $101.9 $100.5Growth from product revenue, royalties and incremental licensing agreements
Total Operating Expenses1 $68.7 $66.8 $69.3 $64.6 $68.4 $68.7Actively manage expenses through effective cost management
Operating Income consistently in line with expectations
Operating Margin expansion
Operating Income (Loss)1 ($22.3) $30.6 $25.4 $34.5 $33.5 $31.7
Operating Margin1 (48)% 31% 27% 35% 33% 32%
Diluted Earnings (Loss)Per Share1 ($0.10) $0.17 $0.14 $0.19 $0.19 $0.21 Delivering profitable growth
8
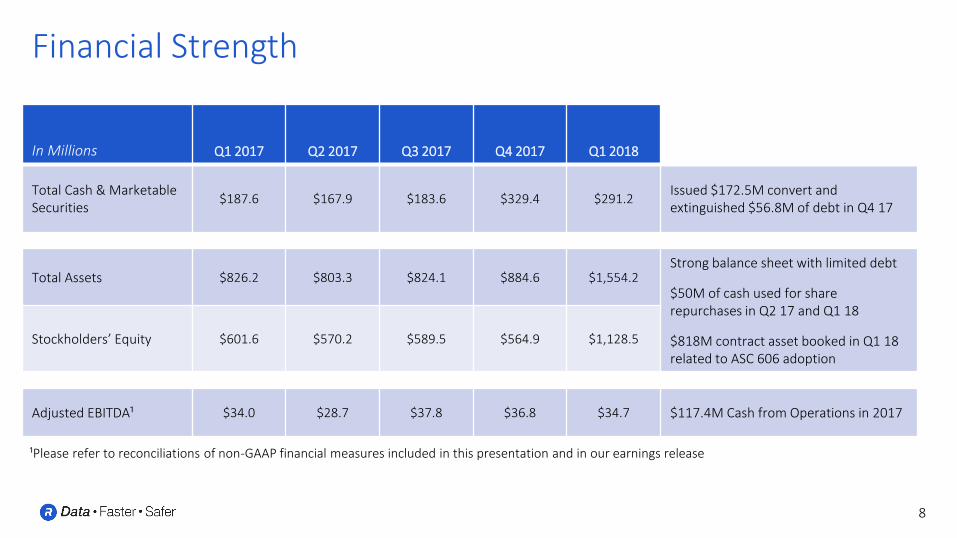
Financial Strength
¹Please refer to reconciliations of non-GAAP financial measures included in this presentation and in our earnings release
In Millions Q1 2017 Q2 2017 Q3 2017 Q4 2017 Q1 2018
Total Cash & MarketableSecurities
$187.6 $167.9 $183.6 $329.4 $291.2Issued $172.5M convert and extinguished $56.8M of debt in Q4 17
Total Assets $826.2 $803.3 $824.1 $884.6 $1,554.2Strong balance sheet with limited debt
$50M of cash used for share repurchases in Q2 17 and Q1 18
$818M contract asset booked in Q1 18 related to ASC 606 adoption
Stockholders’ Equity $601.6 $570.2 $589.5 $564.9 $1,128.5
Adjusted EBITDA¹ $34.0 $28.7 $37.8 $36.8 $34.7 $117.4M Cash from Operations in 2017

9
Q2 2018 Guidance
Guidance (ASC 606) Guidance (ASC 605)(1)
Revenue $42 - $48M $94 - $100M
Operating Expenses (2) $68 - $64M $68 - $64M
Operating (Loss) / Income (2) ($26) - ($16M) $26 - $36M
EPS (2) ($0.20) – ($0.13) $0.17 - $0.23
(1) The Company has provided its second quarter outlook under both ASC 606 and ASC 605 in order to provide additional transparency. The Company believes that providing this additional disclosure in the short term will help investors and analysts understand the impact of the change in revenue recognition standards, especially given the material difference expected in the timing of revenue recognition for fixed-fee licensing arrangements as between ASC 606 and ASC 605. Note that the presentation under ASC 605 is not a substitute for the new ASC 606 revenue recognition standard under GAAP applicable for the second quarter of 2018.
(2) Assumes a non-GAAP interest income and other income and expense of $1.7M, tax rate of 24% and share count of 107M (ASC 606) and 111M (ASC 605). Excludes stock-based compensation expense ($7.5M), amortization expense ($11M), and non-cash interest expense of ($2.7M). Please refer to reconciliations of non-GAAP financial measures included below, in our earnings release and on our investor website.

10
Investment Summary
Focused on key technology areas in the Data Center & Mobile Edge
Accelerating our growth through strategic acquisitions & execution of key programs
Large portion of our cash flows are predictable and committed long-term
Strong balance sheet to support strategic initiatives

Thank you

12
Certain amounts may be off $1M due to rounding.
Reconciliation of Non-GAAP Financial MeasuresNet Income (Loss) in Millions Q1 2018 (ASC 606) Q1 2017 (ASC 605) Q2 2017 (ASC 605) Q3 2017 (ASC 605) Q4 2017 (ASC 605) Q1 2018 (ASC 605)
GAAP Net Income (Loss) ($39) $3 $3 $8 ($32) $6
Adjustments:
Stock-based compensation $8 $7 $7 $7 $7 $8
Acquisition-related transaction costs & retention bonus $0 $0 $0 $0 $0 $0
Amortization $11 $10 $10 $11 $11 $11
Restructuring charges $3 $0 $0 $0 $0 $3
Non-cash interest expense / Loss on extinguishment of debt $3 $2 $2 $2 $3 $3
Provision for (benefit from) income taxes $4 ($3) ($6) ($6) $32 ($6)
Non-GAAP Net Income (Loss) ($11) $19 $16 $22 $21 $24
Operating Income (Loss) in Millions Q1 2018 (ASC 606) Q1 2017 (ASC 605) Q2 2017 (ASC 605) Q3 2017 (ASC 605) Q4 2017 (ASC 605) Q1 2018 (ASC 605)
GAAP Operating Income (Loss) ($44) $13 $8 $17 $16 $11
Adjustments:
Stock-based compensation $8 $7 $7 $7 $7 $8
Acquisition-related transaction costs & retention bonus $0 $0 $0 $0 $0 $0
Amortization $11 $10 $10 $11 $11 $11
Restructuring charges $3 $0 $0 $0 $0 $3
Non-GAAP Operating Income (Loss) ($22) $31 $25 $35 $34 $32
Depreciation $3 $3 $3 $3 $3 $3
Adjusted EBITDA ($19) $34 $29 $38 $37 $35

13
GAAP & Non-GAAP P&L
Certain amounts may be off $0.1M due to rounding.
ASC 606 GAAP Non-GAAP Delta ASC 605 GAAP Non-GAAP Delta
In Millions Actual to In Millions Actual to
Q1'18 Q1'18 GAAP Q1'18 Q1'18 GAAP
Revenue $46.4 $46.4 $0.0 Revenue $100.5 $100.5 $0.0
Cost of revenue $16.5 $7.7 ($8.8) Cost of revenue $16.5 $7.7 ($8.8)
Research and development $40.1 $36.9 ($3.2) Research and development $40.1 $36.9 ($3.2)
Sales, general and administrative $30.2 $24.1 ($6.1) Sales, general and administrative $30.2 $24.1 ($6.1)
Restructuring charges $3.2 ($3.2) Restructuring charges $3.2 ($3.2)
Total operating costs and expenses $90.0 $68.7 ($21.3) Total operating costs and expenses $90.0 $68.7 ($21.3)
Operating Income (Loss) ($43.6) ($22.3) $21.3 Operating Income $10.5 $31.7 $21.3
Interest and other income (expense), net $4.7 $7.4 $2.7 Interest and other income (expense), net ($2.8) ($0.1) $2.7
Income (Loss) before income taxes ($38.9) ($14.9) $24.0 Income before income taxes $7.6 $31.6 $24.0
Income tax Benefit 0.0 ($3.6) ($3.6) Income tax provision $1.5 $7.6 $6.1
Net Income (Loss) ($38.9) ($11.3) $27.6 Net Income $6.1 $24.0 $17.9
Revenue 46.4 46.4 0.0 Revenue 100.5 100.5 0.0
Cost of revenue 16.5 7.7 -8.8 Cost of revenue 16.5 7.7 -8.8
Research and development 40.1 36.9 -3.2 Research and development 40.1 36.9 -3.2

14
Non-GAAP Provision for (Benefit from) Income Taxes
(1) For purposes of internal forecasting, planning and analyzing future periods that assume net income from operations, the Company estimates a fixed, long-term projected tax rate of approximately 35 percent for 2017 and 24 percent for 2018, which consists of estimated U.S. federal and state tax rates, and excludes tax rates associated with certain items such as withholding tax, tax credits, deferred tax asset valuation allowance and the release of any deferred tax asset valuation allowance. Accordingly, the Company has applied these tax rates to its non-GAAP financial results for all periods in the relevant year to assist the Company's planning. Certain amounts may be off by $0.1M due to rounding.
ASC 606 Actual
In $ Millions Q1'18
Provision for income taxes (GAAP) -
Adjustment to GAAP provision for income taxes (3.6)
Pro forma Benefit from income taxes (3.6)
Supplemental Reconciliation of GAAP to Non-GAAP Effective Tax Rate (1)
Actual
Q1'18
GAAP effective tax rate -
Adjustment to GAAP effective tax rate 24%
Pro forma effective tax rate 24%
ASC 605 Actual Actual Variance Actual Variance
In $ Millions Q1'18 Q4'17 QoQ Q1'17 YoY
Provision for income taxes (GAAP) 1.4 43.3 7.4
Adjustment to GAAP provision for income taxes 6.2 (31.9) 2.9
Pro forma provision for income taxes 7.6 11.4 3.8 10.3 2.7
Supplemental Reconciliation of GAAP to Non-GAAP Effective Tax Rate (1)
Actual Actual Variance Actual Variance
Q1'18 Q4'17 QoQ Q1'17 YoY
GAAP effective tax rate 20% 375% 71%
Adjustment to GAAP effective tax rate 4% -340% -36%
Pro forma effective tax rate 24% 35% 11% 35% 11%

15
ASC 606 ASC 605 ASC 605 ASC 605 ASC 605 ASC 605 ASC 605
Rambus Q1'18 Q1'17 Q2'17 Q3'17 Q4'17 FY 2017 Q1'18
Royalty Revenue $21.4 $69.0 $70.0 $72.8 $77.9 $289.6 $77.2
Product Revenue $7.3 $10.9 $8.4 $8.7 $8.5 $36.5 $7.6
Contract and Other Revenue $17.7 $17.6 $16.3 $17.7 $15.5 $67.0 $15.7
Total $46.4 $97.4 $94.7 $99.1 $101.9 $393.1 $100.5
MID Q1'18 Q1'17 Q2'17 Q3'17 Q4'17 FY 2017 Q1'18
Royalty Revenue $19.5 $56.6 $54.9 $56.6 $61.0 $229.1 $64.3
Product Revenue $6.3 $4.8 $5.3 $5.1 $5.2 $20.3 $6.3
Contract and Other Revenue $8.2 $9.3 $7.2 $7.1 $7.8 $31.3 $7.4
Total $34.0 $70.6 $67.4 $68.8 $73.9 $280.7 $78.0
RSD Q1'18 Q1'17 Q2'17 Q3'17 Q4'17 FY 2017 Q1'18
Royalty Revenue $1.5 $12.3 $14.4 $15.5 $16.2 $58.5 $12.3
Product Revenue $0.1 $3.5 $0.6 $0.9 $0.6 $5.6 $0.3
Contract and Other Revenue $8.5 $7.4 $8.4 $9.9 $7.0 $32.6 $7.2
Total $10.0 $23.2 $23.4 $26.3 $23.8 $96.7 $19.9
RLD Q1'18 Q1'17 Q2'17 Q3'17 Q4'17 FY 2017 Q1'18
Royalty Revenue $0.4 $0.1 $0.6 $0.6 $0.7 $1.9 $0.5
Product Revenue $0.9 $2.6 $2.5 $2.7 $2.8 $10.6 $0.9
Contract and Other Revenue $1.1 $0.9 $0.8 $0.8 $0.7 $3.2 $1.1
Total $2.4 $3.6 $4.0 $4.0 $4.2 $15.7 $2.5
Revenue BreakdownIn Millions

16
Revenue and Licensing Billings
¹ Licensing billings is an operational metric that reflects amounts invoiced to our patent and technology licensing customers during the period, as adjusted for certain differences.
In Thousands
ASC 606 ASC 605 ASC 605 ASC 605 ASC 605 ASC 605 ASC 605
Rambus Q1'18 Q1'17 Q2'17 Q3'17 Q4'17 FY 2017 Q1'18
Royalty Revenue $21,374 $68,956 $69,990 $72,787 $77,861 $289,594 $77,174
Product Revenue $7,313 $10,904 $8,401 $8,661 $8,543 $36,509 $7,556
Contract and Other Revenue $17,739 $17,491 $16,329 $17,686 $15,487 $66,993 $15,729
Total $46,426 $97,351 $94,720 $99,134 $101,891 $393,096 $100,459
Rambus Q1'18 Q1'17 Q2'17 Q3'17 Q4'17 FY 2017 Q1'18
Royalty Revenue $21,374 $68,956 $69,990 $72,787 $77,861 $289,594 $77,174
Licensing Billings1$75,924 $68,556 $72,890 $71,537 $76,611 $289,594 $75,924
Variance $54,550 ($400) $2,900 ($1,250) ($1,250) - ($1,250)


![3012[1] Rambus Brief on Trial Procedures](https://static.fdocuments.in/doc/165x107/577dacef1a28ab223f8e8b0b/30121-rambus-brief-on-trial-procedures.jpg)