RAMADAN FASTING AND AGRICULTURAL OUTPUT
54
RAMADAN FASTING AND AGRICULTURAL OUTPUT * Heather Schofield † November 2020 Abstract Religion is an important force in many individuals’ lives, with approximately 85 percent of the world’s population expressing some religious belief. Yet, the literature on religion’s impact on economic outcomes remains relatively sparse, driven in part by challenges around identifica- tion. This paper explores one aspect of religion’s impact on economic outcomes by examining the impact of the observance of Ramadan on the economic output of farmers in India. The analysis leverages heterogeneity in cropping cycles between and within districts as well as the fact that Ramadan cycles throughout the calendar year to generate three sources of variation in the overlap between Ramadan and the labor-intensive portions of the cropping cycle. Using a difference-in-differences-in-differences approach, I find that overlap between Ramadan and the labor-intensive portions of cropping cycles results in declines in production which correspond to approximately one percent of agricultural GDP in India annually and a 20 to 40 percent decrease in productivity per fasting individual. These changes appear to be driven by changes in labor productivity and are not substantially compensated for via other potential margins of adjust- ment such as increased draft labor. Additional analyses suggest that productivity declines are likely to be driven primarily by reduced caloric intake rather than by other behavioral changes during Ramadan. JEL Codes: O12, Z12 * I am grateful for helpful feedback and advice on this paper from Sendhil Mullainathan, Michael Kremer, Larry Katz, David Cutler, Rob Jensen, David Yanagizawa-Drott, Asim Khwaja, Rohini Pande, Joana Naritomi, Ian Tomb, Supreet Kaur, Dan Bjorkegren, Harsha Thirumurthy, Jessica Goldberg, Manisha Shah, Ellen McCullough, Sarojini Hirshleifer, and Lauren Falcao Bergquist. I also thank the seminar audiences at The Center for Global Development, Carnegie Mellon University, George Mason University, Cornell University, Harvard, Ideas42, IFPRI, LSE, Northeastern University, NYU, Stanford, Tufts, The University of Chicago, The University of Illinois, Urbana-Champaign, The University of Pennsylvania, The University of Toronto, The World Bank, The University of California, Berkeley, The University of California, Davis, The University of California, San Diego, The University of California, Santa Cruz, and the University of Zurich as well as the conference audiences at the Barcelona GSE summer forum, BEAM, MEER, NEUDC, SJDM, and The World Bank/IZA Conference on Employment and Development. All errors here are my own. † University of Pennsylvania, Perelman School of Medicine and The Wharton School. Address: Blockley Hall 1106, 423 Guardian Drive, Philadelphia Pa 19104. Phone: +1-617-233-4775. Email: [email protected]. 1
Transcript of RAMADAN FASTING AND AGRICULTURAL OUTPUT

RAMADAN FASTING AND
AGRICULTURAL OUTPUT∗
Heather Schofield†
November 2020
Abstract
Religion is an important force in many individuals’ lives, with approximately 85 percent ofthe world’s population expressing some religious belief. Yet, the literature on religion’s impacton economic outcomes remains relatively sparse, driven in part by challenges around identifica-tion. This paper explores one aspect of religion’s impact on economic outcomes by examiningthe impact of the observance of Ramadan on the economic output of farmers in India. Theanalysis leverages heterogeneity in cropping cycles between and within districts as well as thefact that Ramadan cycles throughout the calendar year to generate three sources of variation inthe overlap between Ramadan and the labor-intensive portions of the cropping cycle. Using adifference-in-differences-in-differences approach, I find that overlap between Ramadan and thelabor-intensive portions of cropping cycles results in declines in production which correspond toapproximately one percent of agricultural GDP in India annually and a 20 to 40 percent decreasein productivity per fasting individual. These changes appear to be driven by changes in laborproductivity and are not substantially compensated for via other potential margins of adjust-ment such as increased draft labor. Additional analyses suggest that productivity declines arelikely to be driven primarily by reduced caloric intake rather than by other behavioral changesduring Ramadan.
JEL Codes: O12, Z12
∗I am grateful for helpful feedback and advice on this paper from Sendhil Mullainathan, Michael Kremer, LarryKatz, David Cutler, Rob Jensen, David Yanagizawa-Drott, Asim Khwaja, Rohini Pande, Joana Naritomi, Ian Tomb,Supreet Kaur, Dan Bjorkegren, Harsha Thirumurthy, Jessica Goldberg, Manisha Shah, Ellen McCullough, SarojiniHirshleifer, and Lauren Falcao Bergquist. I also thank the seminar audiences at The Center for Global Development,Carnegie Mellon University, George Mason University, Cornell University, Harvard, Ideas42, IFPRI, LSE, NortheasternUniversity, NYU, Stanford, Tufts, The University of Chicago, The University of Illinois, Urbana-Champaign, TheUniversity of Pennsylvania, The University of Toronto, The World Bank, The University of California, Berkeley, TheUniversity of California, Davis, The University of California, San Diego, The University of California, Santa Cruz, andthe University of Zurich as well as the conference audiences at the Barcelona GSE summer forum, BEAM, MEER,NEUDC, SJDM, and The World Bank/IZA Conference on Employment and Development. All errors here are myown.†University of Pennsylvania, Perelman School of Medicine and The Wharton School. Address: Blockley Hall 1106,
423 Guardian Drive, Philadelphia Pa 19104. Phone: +1-617-233-4775. Email: [email protected].
1

1 Introduction
Religion is an important force in the lives of the majority of the world’s population. Roughly85 percent of the world’s population expresses some religious belief, 54 percent state religion is veryimportant in their lives, and nearly half of the global adult population spends time on religiousactivities daily (Pew Research Center, 2017, 2018). These religious beliefs have the potential forwide-ranging influences on important economic outcomes such as GDP growth, credit supply, de-mand, and repayment, taxation, human capital accumulation, beliefs, and norms and institutionsinfluencing exchange and public goods (Iannaccone, 1998; Kuran, 2018; Campante and Yanagizawa-Drott, 2015; Benjamin et al., 2016; Clingingsmith et al., 2009; Beatton et al., 2019). The macroeco-nomic literature has also studied the relationship between religiosity and growth, typically findinga negative correlation between growth and various measures of religiosity (Barro and McCleary,2003; McCleary and Barro, 2006). However, the directionality of this relationship is unclear; poorgrowth could lead to increased religious influence or religion could lead to lower growth. As Iyer(2016) notes, "it is often difficult to evaluate the effects of religion on growth separately from theeffect of other factors, notably geography, other institutions, and ethnic fractionalization, whichare also important growth determinants." And more broadly, despite the prevalence of religiousbelief and its diverse and potentially important influences, the literature on religion’s impact oneconomic outcomes remains relatively sparse, driven in part by significant challenges around causalidentification.
This paper explores one aspect of religion’s impact on economic outcomes – as well as potentialchannels through which these effects may operate – by utilizing a natural experiment to examinethe impact of the observance of Ramadan on agricultural output in India. Ramadan, a month-long religious observance centered on daylight fasting, is observed by many of the world’s nearlytwo billion Muslims every year, including the 172 million Muslims in India (Directorate of CensusOperations, 2011). The cyclical nature of the holiday, which is based on a lunar calendar combinedwith variation in the timing of cropping cycles, generates a natural experiment. This analysis usesa differences-in-differences-in-differences approach that leverages heterogeneity in cropping cycleswithin and between districts as well as the fact that Ramadan cycles throughout the calendar yearto generate three sources of variation in the overlap between fasting and the labor-intensive portionsof cropping cycles (sowing and harvesting). The first source of variation, generated by the fact thatRamadan cycles throughout the calendar year, is variation for a given crop-district combination overtime. The second, variation among crops within a district-year, is the result of natural variationin cropping cycles for different plants. Finally, different climatic patterns across space generatevariation in cropping cycles between districts, resulting in spatial variation for a given crop within ayear. This identification at the level of the crop-district-year reduces many of the potential concernsaround bias by controlling for time, location, or crop specific confounders that change deferentially
2

across another dimension.This analysis finds that overlap between Ramadan and the labor-intensive portions of the crop-
ping cycle, sowing and harvesting, leads to economically meaningful declines in total agriculturalproduction, both in weight and in value. A back of the envelope calculation suggests that in a typicalyear between 1956 and 1987, observation of Ramadan resulted in a loss of roughly one percent ofagricultural GDP in India. As agricultural output represented nearly half of the Indian economyduring this period, these effects are economically meaningful, accounting for a loss of 0.5 percentof overall GDP annually. Notably, despite the decline in production, two different sources of datasuggest consistent labor supply among both Muslim and non-Muslims during the holiday, suggest-ing the holiday results in declines in labor productivity rather than labor supply. In the absence ofspillovers from Muslims to non-Muslims, these estimates imply a substantial decrease in productivityof approximately 20 to 40 percent per Muslim individual during the month-long holiday.1
Building on these average estimates, the paper next examines heterogeneity in Ramadan’s impactand demonstrates that the production declines are driven by districts with a larger concentrationof Muslims. This heterogeneous effect – with little or no decline among districts with few Muslimsand large declines in heavily Muslim districts – supports the conclusion that Ramadan, rather thanother spurious factors, drives the production declines.
One natural question which arises in light of these estimates is whether individuals are aware of,and change behaviors in reaction to, the Ramadan fast in order to mitigate its effects. On the onehand, the substantial changes in individual productivity suggest that if individuals largely providelabor on their own farms, losses may be large for those individuals. On the other hand, if labor isdispersed across farms and Muslims and non-Muslims work on each other’s farms, the effects wouldbe correspondingly more dispersed and potentially difficult to detect. This challenge is also likely tobe exacerbated by the substantial natural variation in production from year to year in agriculture.
Fine-grained data combined with the natural experiment generated by Ramadan’s movementthrough the calendar year allow me to assess whether individuals are able to anticipate and adjust toreduced productivity driven by Ramadan. Specifically, I examine changes in other agricultural inputssuch as fertilizer and draft labor (bullocks) as well as other potential margins of adjustment suchas shifting to non-Muslim farm labor or fallowing land. Although it is difficult to fully rule out thepossibility of small adjustments, there is no evidence of substantial changes in inputs or productionprocesses beyond a small increase in fertilizer use when Ramadan overlaps with the sowing period.
1Although these declines are large, it is possible there are compensating changes in behavior and well-being whichwould mitigate the welfare losses. For example, increased religiosity may provide other economically productive bene-fits such as increased "grit" throughout the remainder of the year (Bryan et al., 2018). In addition, the microeconomicliterature and related papers in psychology and sociology have typically found that religiosity is associated with avariety of positive social outcomes such as charitable giving and lower rates of youth crime, as well as greater happinessand well-being (Hoverd and Sibley, 2013; Gruber and Mullainathan, 2006; Ellison, 1991; Schulenberg et al., 1999; Hulland Bold, 1995; Lipford et al., 1993; Evans et al., 1995; Freeman and Holzer, eds, 1986). Although such changes areof economic interest, they are beyond the scope of the current paper.
3

This lack of adjustment does not conclusively imply that individuals are unaware of the reductions inproductivity; potential adjustments such as fallowing land may be more costly than the alternativeof simply accepting the period of reduced productivity and liquidity constraints or missing marketsmay make some adjustments infeasible or costly. However, the lack of significant changes in otherinputs does suggest that the estimated changes in production reflect underlying changes in laborproductivity and are not substantially ameliorated by other adjustments in agricultural inputs orproduction decisions.
Finally, the granular data used in this study allow me to assess whether these effects are likelyto generalize to other contexts as well as speak to the broader literature on religion and economicactivity by assessing potential behavioral changes during the holiday as possible channels for pro-duction declines. This line of inquiry begins by outlining four potential drivers of such declines:time spent on religious or social obligations, low caloric intake, sleep deprivation, and dehydration.I begin by assessing available direct evidence for these channels, examining changes in labor supplyand caloric intake, and find no change in labor supply but notable declines in caloric intake. Next, Idraw on evidence from relevant literatures and additional empirical tests utilizing both agriculturalproduction data and additional data sources to assess the potential role of dehydration and sleepdeprivation. Although the evidence regarding these channels is less direct, I do not find evidence ofmeaningful impacts. Finally, as a test comparing the potential role of caloric intake versus the threeother potential channels collectively, I examine whether overlap between sowing/harvesting and theperiod following Ramadan also generates declines in production. Given the slow recovery from re-duced caloric intake but rapid recovery from dehydration and sleep deprivation, the persistence ofthe effects observed in this test simultaneously provides evidence in favor of nutrition driving thedeclines and against these three other forces playing key roles (Keys et al., 1950; Schofield, 2018;Jéquier and Constant, 2010; Van Dongen et al., 2003). In short, while it is difficult to fully ruleout all possible alternative channels in any natural experiment, these analyses provide suggestiveevidence that caloric decline is likely to be the predominant driver of productivity declines duringRamadan in this context. These results also relate to an extensive literature examining the relation-ship between nutrition and economic productivity and provide additional evidence that nutritionmay be an important driver of economic productivity (Dasgupta and Ray, 1987; Stiglitz, 1976; De-olalikar, 1988; Immink and Viteri, 1981a; Strauss, 1986; Wolgemuth et al., 1982; Banerjee et al.,2011; Schofield, 2018).
The potential importance of a nutrition-based mechanism also links this work to other economicanalyses of Ramadan including Almond and Mazumder (2011), Van Ewijk (2011), and Majid (2015).However, these studies focus on the long run impact of maternal Ramadan fasting while the fetusis in-utero on human capital accumulation and economic outcomes rather than a contemporaneouseffect among adults.
Finally, this paper also relates to work by Campante and Yanagizawa-Drott studying the impact
4

of increasing the duration of the Ramadan fast on economic growth and subjective well-being atthe country level (2015). The authors find that longer fasts have a negative impact on growthbut a positive impact of subjective well-being, and relate this finding to the “club good” model ofcostly religious practices in Iannaccone (1998). While both papers focus on the economic effects ofRamadan, there are a number of key differences between them. First, in contrast to both Campanteand Yanagizawa-Drott (2015) and many previous studies, I examine a context in which the holidayis observed only by a small fraction of the population, allowing for a cleaner analysis of potentialchannels by limiting potential spillovers. Second, the additional variation among crops and districtsin my more detailed data provide for strong identification and allow me to estimate the average overalleffect of Ramadan observance (i.e. the extensive margin of observing the holiday on average) ratherthan intensive margin adjustments around fasting duration. Finally, the substantial differences inincome between India and many heavily Muslim countries (e.g. Saudi Arabia, Turkey, etc) suggestthat, despite similarly negative economic impacts, the paths driving those outcomes and potentialwelfare effects could be quite different. While macro approaches typically preclude a well-identifiedanalysis of these channels, I am able to study potential margins of adjustment and to offer insightsabout the relative roles of caloric changes, sleep, dehydration, and social/religious practices in causingthe observed changes in output.
In short, this paper builds on an existing macroeconomics literature examining the relationshipbetween religious practice and economic output. Although identification of the causal relationshipfrom religious practice to economic outcomes is challenging, I provide a clear well-identified estimateof the relationship between Ramadan and economic output for a large and economically importantmarket by utilizing large scale but fine-grained data and a natural experiment which leveragesmultiple sources of variation simultaneously. In addition, although this paper focuses on a singlecase of religious observance – Ramadan – in order to provide identification, the example is onethat is common to many religions. For example, periods of fasting with a focus on prayer andcommunity are common practice in many other global religions including Buddhism, Hinduism, andChristianity. Finally, additional analyses allow examination of potential margins of adjustment –finding surprisingly little change in anticipation of the holiday – and potential channels throughwhich the effects operate – shedding light on the situations in which religious practices may be moreor less economically costly.
The remainder of this paper is divided into five parts. Section 2 provides information on Ra-madan, the setting of the study, and the data and estimation strategy used in the main analysis.Section 3 details the triple-difference approach examining the impact of Ramadan on agriculturalproduction as well as heterogeneity in those responses. Potential changes in the production processand margins of adjustment in agricultural production in response to Ramadan are explored in Sec-tion 4. Section 5 investigates channels through which changes in productivity may occur, includingnutrition, sleep, dehydration, and reduced labor supply in response to religious or social obligations.
5

Section 6 concludes.
2 Background
2.1 Ramadan
Ramadan is a month-long Muslim holiday observed primarily through fasting during daylighthours. Fasting includes abstinence from both food and liquids and is typically considered obligatoryfor practicing Muslims with the exception of children, the elderly, individuals who are ill, infirm, ortraveling, and women who are pregnant or breast feeding. Muslims are also expected to abstain fromsmoking, sexual relations, and swearing during daylight hours throughout the holiday. In addition,there is an added emphasis on prayer, reading the Koran, and charity during this time (Blackwell,2009; Ahmad et al., 2012). The holiday is lunar, shifting by roughly eleven days per year, andcycling through the calendar year approximately once every 30 years. Ramadan is followed by Eid,a holiday marking the end of Ramadan. During Eid, Muslims are not allowed to fast, and typicallyengage in a special prayer in a communal area, visit family and friends, and sometimes exchangegifts. Eid is a minimum of one day but can last up to three days (Blackwell, 2009).
2.2 Agriculture in India
Agriculture is a critical sector in the Indian economy. Although the share of GDP generatedfrom agriculture has declined from 43 percent in 1960 to 17 percent in the last decade, agriculturestill accounts for nearly half of employment in India (National Academy of Agricultural Sciences,2013; World Bank, 2019). Driven in part by technology improvements during the Green Revolution,growth in this sector has been relatively rapid with a four-fold increase in real value over the sameperiod (Food and Agricultural Organization , FAO; Evenson, 2003). India’s primary crops are foodgrains such as rice, wheat, and millet as well as cash crops such as sugarcane, oilseeds, and peanuts.Additional details about the agricultural data used in this analysis are provided below.
2.3 Data
In order to examine the impact of Ramadan fasting on agricultural production this analysisdraws on four main sources of data. First, data on agricultural production was obtained from theWorld Bank India Agriculture and Climate dataset compiled by Apurva Sanghi, Kavi Kumar, andJames McKinsey. This dataset contains production and price information for 20 crops between1956 and 1987 in 271 Indian districts covering 85 percent of the land area of India and all of themajor agricultural areas, with the exception of Kerala and Assam.2 Second, data on agricultural
2Additional information about this dataset is available online:https://ipl.econ.duke.edu/dthomas/dev_data/datafiles/india_agric_climate.htm
6

production cycles was generously provided by Dave Donaldson who compiled it from the 1967 IndianCrop Calendar published by the Indian Directorate of Economics and Statistics (Donaldson, 2018).This dataset includes the typical sowing and harvesting periods for 18 of the crops included in theagricultural production data at the district level. Table A.II provides additional information aboutthe 18 crops and their cropping cycles. Third, data on the fraction of individuals in each districtwho are Muslim was gathered from the 1961 Indian census.3 Finally, rainfall and temperature datawere obtained from the University of Delaware monthly rainfall and temperature series (Universityof Delaware, 2013). Additional data sources for the supplementary analyses of channels are alsooutlined in Table A.I.
2.4 Empirical Strategy
In order to assess the impact of Ramadan on economic output it is necessary to measure output asrelated to “exposure” to the holiday that is independent of spatial or temporal confounds. In addition,in order to increase external validity, this variation should occur in an economically importantindustry in which production is well measured at the same “level” as the variation in the exposureto holiday.
Agricultural production offers a number of advantages in this respect. Although many industriesare relatively stable across the year (i.e. manufacturing), agricultural production has significantseasonality, both for given crops and in different locations. Specifically, crops are produced atdifferent times of the year in different locations. For example, rice may be grown in February in onedistrict and in June in another. Given the geographic spread of India, this variation is significant,with an average standard deviation of approximately 1.5 months in the timing of agricultural cyclesfor any given crop (Table A.II). In addition, different crops are produced at different times in thesame location. For example, a district may grow rice in May and wheat in December. A typicaldistrict has a standard deviation of approximately 2.5 months and a range of roughly 9 monthsfor the timing of crop cycles within the district (See Table A.III). This seasonality provides usefulvariation in “exposure” to Ramadan fasting both within and between districts. In addition to thevariation related to heterogeneous cropping cycles, the fact that Ramadan is a lunar holiday andcycles throughout the calendar year can be exploited to provide temporal variation in exposure toRamadan fasting for each crop-district combination.
In short, the overlap between Ramadan and the labor-intensive portions of the crop cycle variesacross districts, crops, and years. These sources of variation allow a differences-in-differences-in-differences (DIDID) approach to identifying the impact of Ramadan on agricultural output at thedistrict (N = 271), crop (N = 18), year (N = 32) level.
3Data are taken from the 1961 census only in order to match the geographic units of the agricultural data whichwere reconciled to 271 consistent units over the three decades of data.
7

I begin by estimating Equation 1 regressing the production of crop c produced in year t in districtd (qcdt) on the fraction of Ramadan covered by each of the labor-intensive portions of the agriculturalcycle for that crop-district-year Scdt to indicate overlap with sowing and Hcdt to indicate overlapwith harvest, as well as district-crop (θcd), district-year (γdt), crop-year (αct), crop (κc), district(ζd), and year (τt) fixed effects and a vector of time varying controls for rainfall and temperaturerelative to the cropping cycle (Xcdt). Further information on the time-varying controls for rainfalland temperature can be found in Section B.3. Details of the calculation of the fraction of Ramadancovered by sowing and harvesting are included in Section B.2 and example calculations are providedin Figure I. The extent of the “overlap” between Ramadan and the sowing (harvesting) seasons ismeasured as a fraction of Ramadan to provide a constant denominator and clearer interpretationof the coefficients of interest. Specifically, β1(β2) multiplied by 100 corresponds to the percentagedecline in total production for complete overlap between Ramadan and sowing (harvesting). TableA.IV displays the distribution of overlap between Ramadan and sowing and harvesting.
qcdt = β0 + β1Scdt + β2Hcdt + θcd + γdt + αct + κc + ζd + τt + βnXcdt + εctd. (1)
3 Results
3.1 Agricultural Production During Ramadan
As can be seen in Table I, Column (1), total agricultural production and the value of thatproduction decline with increased overlap between Ramadan and sowing or harvesting. Althoughthe estimated coefficients are relatively small, they correspond to meaningful production declines.Specifically, complete overlap between Ramadan and a sowing (harvest) period would result inan overall decline in production of 2 (2.9) percent, though the sowing decline is only marginallystatistically significant. The declines in value are both statistically significant, and appear to beeven more substantial in economic magnitude at 3.4 percent and 4.7 percent, respectively. Notably,because only 10 percent of the population is Muslim, these overall declines in output correspond toa decline in productivity in the range of 20 to 45 percent per fasting individual when the sowing(harvesting) season fully overlaps the holiday.
In addition to examining the impact of overlap on net production by weight across all crops,Table I displays estimates of changes in the quantity and value of production of rice – the primarystaple grain and the crop of greatest total economic value in India – in Columns (3) and (4). Theseestimates are the same order of magnitude as the percentage declines in production for all crops,indicating that the declines are observed among economically meaningful crops and are not simplydriven by marginal ones.
One potential confound in this estimation strategy is that it is possible to substitute between
8

crops. If this occurred in response to overlap with Ramadan, the estimation would pick up not onlydeclines in the crops with overlap but increases in other crops without overlap, biasing the coefficients.Although the declines are relatively small on net, making it unlikely that farmers would substitutebetween crops due to overlap with the holiday, I confirm that declines are robust to aggregation atthe district-year level, which would address such a substitution strategy. These results are presentedin Table II. The point estimates for aggregate declines are statistically indistinguishable from thedeclines estimated using the crop level data. These results suggest that substitution between cropsis unlikely to be driving the observed effects and biasing the crop-district-year level estimates.4
Further, as shown in Table A.VI, the estimated changes are also robust to omission of controlsfor the weather (temperature and rainfall) and to examining changes in levels rather than logs.5
3.2 Heterogenity in Production Declines
Despite the relatively low overall fraction of Muslims in India’s population, there is substantialheterogeneity in the fraction of Muslims in each district, ranging from less than 0.1 percent to over40 percent Muslim (Figures II and III and Table A.V provide distributional information on thefraction of the rural population that is Muslim. The sample is restricted to those districts includedin the agricultural dataset). Although the geographic distribution of Muslims is non-random, thevariation provides a useful heterogeneity test to confirm that the decline in production is drivenby Ramadan rather than other unobserved factors. If the declines are indeed driven by Ramadan,then they should only be observed in areas in which individuals observe the holiday, or in otherwords, areas in which a reasonably large portion of the population is Muslim. Equation 2 teststhis prediction by augmenting the previous regression with interaction terms between the overlapvariables and variable(s) for the fraction of Muslims in a district Md.6
qcdt = β0+β1Scdt+β2Hcdt+β3Scdt∗Md+β4Hcdt∗Md+β5Md+θcd+γdt+αct+κc+ζd+τt+βnXcdt+εctd.
(2)In the non-parametric specification in Columns (1) and (2), as expected, there is no significant
impact of overlap on production in below median fraction Muslim districts. However, there is astrongly negative and statistically significant impact of overlap in above median fraction Muslimdistricts (Table III). In Columns (3) and (4) I also estimate the net decline in production as a
4Another potential concern regarding anticipation of Ramadan is that individuals could shift the timing of theirlabor inputs in response to anticipated changes in productivity. However, given that the timing of agricultural laborfor sowing and harvest is time-sensitive, this approach is likely to be infeasible or of limited efficacy. In addition, suchchanges would simply under-estimate the impact of the holiday, generating a lower-bound effect.
5Although not all crops are grown in all districts, it is relatively rare for districts to shift into or out of productionof a crop. In addition, those districts which do shift in and out of production tend to have very low levels of productionof that crop; the median production in these districts is just 7 percent of the median overall production.
6In the quadratic specification, the main effects for the fraction of Muslims term and this term squared are droppedfrom the estimating equation due to co-linearity with the district fixed effect.
9

function of the percentage of Muslims in the district using both linear and quadratic interactionterms. As in the non-parametric specification, these results are consistent with the prediction thatdistricts with a greater proportion of Muslims experience larger declines in output, although thepositive coefficient on the quadratic term suggests that the rate of decline begins to taper slightly indistricts with very large Muslim populations. However, it should be noted that support in this partof the distribution is weak, so these results should be interpreted with caution. The marginal declinesin production are also presented graphically in Figure IV. This heterogeneity provides additionalevidence that the observed output declines are driven by Ramadan rather than other unobservedcauses.
Although these declines are substantial, they are not implausibly large. For example, evenrelatively small changes in labor inputs – such as broadcasting seeds rather than drill planting –may impact output substantially. In addition, there are many potential pathways through whichRamadan may impact production. For example, focusing on only the single potential pathway ofcaloric intake as a driver of production declines, the magnitude is consistent with a back of theenvelope calibration of the “expected decline” given basal metabolic rates (BMR), the estimateddeclines in caloric intake, and the energy requirements of farm labor (see Section B.4 for details ofthis calculation and Table VI for the estimated change in caloric intake during this period). Thiscalibration of “available labor energy” predicts productivity declines of roughly 50 percent as a resultof the reduction in caloric intake if no energy were mobilized from fat stores. This rough calibrationdoes not provide evidence for or against alternative explanations for the decline. However, it doessuggest that despite their substantial magnitude, the observed effects are not implausibly large,especially if multiple behavioral changes occur during this period.
3.3 Summary of Results
These results demonstrate that overlap between Ramadan and sowing/harvesting has a substan-tial and economically meaningful negative impact on total agricultural production both in terms ofquantity and value and that, consistent with Ramadan driving the declines, the impact is larger fordistricts with a greater percentage of Muslims.
To provide a more concrete back-of-the-envelope estimate of the aggregate losses, it is possibleto weight the declines for full overlap by the expected extent of overlap. Specifically, the overlapbetween a crop’s sowing period or harvesting period and Ramadan is approximately 0.16 in anaverage year (see Table A.IV). Weighting the estimated declines in value produced for full overlap of3.4% and 4.7% (for sowing and harvesting respectively) by this average overlap generates a predictedloss of slightly less than 1% (3.4∗.0166+4.7∗0.172 = 0.86%) of agricultural output annually. Becauseagricultural output accounted for roughly half of total economic output during this period, theseestimates imply a loss of 0.4 to 0.5% of GDP annually during this period due to observance of
10

Ramadan.
4 Margins of Adjustment
The presence of such declines in production raises a question of whether individuals are awareof these declines, and if so, whether they take steps to address them. Although the declines areeconomically meaningful in an aggregate sense, they may be difficult to observe at an individuallevel given significant year to year variability in agricultural production. To provide a sense ofmagnitude, a typical coefficient of variation for a set of major crops in India during this time isapproximately 10 (Larson et al., 2004).7 Notably, individual farmers and localities are likely to havemuch greater coefficients of variation, making this comparison even more stark.
Understanding whether these changes in inputs occur sheds light on whether individuals areaware of the declines and whether the observed changes in output are a lower bound due to com-pensating input adjustments. If the declines are known, there are a number of potential marginsof adjustment that could be used to mitigate losses including changes in crop mix, substitution ofhuman and animal labor, changes in fertilizer use, or shifts towards labor provided by other religions.In addition, if individuals are aware that they will not have sufficient labor to sow or harvest a cropdue to Ramadan, they may choose to fallow the land (not plant) instead.
Although changes in the crop mix seem unlikely given the low percentage loss incurred in expec-tation and the relatively large differences in profitability of various crops, if such changes occur theycould threaten the validity of the identification strategy. However, as described briefly above, I con-firm that this shift between crops is not occurring by aggregating the estimation to the district-yearlevel (Table II). The point estimates for aggregate declines are statistically indistinguishable fromthe declines estimated using the crop level data. These results suggest that substitution betweencrops is unlikely to be driving these effects and biasing the crop level estimates. Beyond changingwhich crops were planted, if individuals are aware that Ramadan may lead them to be unproductiveand generate less output, another potential margin of adjustment would be to fallow one’s fields inorder to reduce costs and improve yields in the future. This margin of adjustment can be testeddirectly using data on acreage planted. As shown in Table IV, although the point estimates arenegative, they are insignificant and economically small (changes of more than 2 percent can be ruledout). This evidence suggests that there is no significant change in the land allocated to a given cropfor greater overlap with Ramadan.
Other less costly methods of substitution include changes in inputs such as draft labor (use ofbullocks) or fertilizer. As shown in Table IV Column (2), there is no measurable change in the use
7The coefficient of variation is defined as the standard deviation divided by the mean. For example, a crop withproduction of 90 in year one, 100 in year two and 110 in year three would have a standard deviation of 10 and a meanof 100 resulting in a coefficient of variation of 10.
11

of draft labor. Despite these null results it is worth noting that the available data are aggregated tothe district level and imprecise. In addition, changes in draft labor are likely to be on the intensivemargin (e.g. additional hours of draft labor) rather than the extensive margin (number of bullocksavailable to be used) because the shock to human productivity is temporary. Hence I cannot fullyrule out that small changes in inputs may occur but be undetectable given the data limitations.Although neither acreage nor draft labor appears to respond to changes in overlap, there doesappear to be a small increase in fertilizer use when there is greater overlap between Ramadan andthe sowing period.
Finally, if spot markets for labor are available, it may also be possible to adjust labor inputs byhiring non-Muslim individuals during the holiday period. This possibility is explored and rejectedin Section 5 below.
In short, and potentially surprisingly, there is no direct evidence that individuals anticipate andrespond to these effects in economically meaningful ways. While the data suggests there may besmall increases in fertilizer use and additional use of draft labor is difficult to rule out given thenature of the available data, any adjustments in inputs appear likely to be relatively minor. Oneinterpretation of this evidence is that farmers may be inattentive to the declines in productiongiven the large year to year variation in output and the difficulty in attributing the changes toone factor in a context in which many inputs (e.g. rain) change frequently (Hanna et al., 2014).Alternatively, farm laborers and land owners may have long term repeated relationships which maymake it difficult to periodically refuse to hire certain individuals in favor of other substitutableinputs. Farmers may also face very tight labor markets during the sowing and harvesting period,making it difficult or expensive to substitute workers. Finally, it is also possible that small farmersface liquidity constraints that make it prohibitively expensive to make changes to the broader inputmix even if the changes in productivity are known.
5 Evidence Regarding the Forces Driving Production Declines
This section examines what behavioral changes may drive the observed declines in output duringRamadan. There are four major potential changes in behavior that could plausibly impact outputin a significant manner: changes in labor supply due to religious or social obligations, declines incaloric intake, dehydration due to lack of consumption of water during the fast, or sleep deprivationdue to rising early or going to bed late in order to observe the fast.
First, I directly examine possible changes in labor supply and earnings among Muslims duringRamadan using a differences-in-differences strategy on data from the National Sample Survey la-bor survey and the ICRISAT village level studies survey. Second, I utilize a similar identificationstrategy and data from the consumption module of the NSS to estimate changes in caloric intakeamong Muslims during Ramadan to shed light on the possibility that changes in nutrition impact
12

production. Although direct data on a third possible channel, sleep deprivation, is limited, I exploreevidence for these potential drivers of low productivity via relevant literature. Next, I augmentthe primary specification in the World Bank agricultural data with additional weather data to shedlight on whether dehydration due to lack of fluid intake during the day while observing Ramadandrives production declines. An additional calibration exercise is also conducted using data from theliterature to add evidence on this potential driver.
Finally, I conduct an omnibus test related to the timing of the changes in output. Specifically,while recovery from sleep deprivation and dehydration is rapid and any religious or social obligationsassociated with Ramadan should cease at the end of the holiday, caloric changes have longer termimpacts on productive capacity (Belenky et al., 2003; Dinges et al., 1997; Sawka et al., 2007; Keyset al., 1950). Hence, if overlap between the period following Ramadan (leaving a gap for Eid, aholiday at the conclusion of Ramadan) and sowing or harvest period is associated with declines inproduction, it would provide evidence supporting the role of caloric decline in reduced productionduring Ramadan.
Although it is difficult to fully parse these potential channels in a natural experiment and morethan one channel may contribute, collectively these tests provide suggestive evidence that changesin caloric intake may be an important driver of the observed output changes.
5.1 Time Spent on Religious and Social Activities
Relevant Literature. Time spent on religious and social activities during the Ramadan holidayis likely to vary substantially across both individuals and locations, and little information specificto India is available given the relatively low concentration of Muslims there. However, the literaturedoes provide general information about the types of behavioral changes that Muslim individuals arelikely to engage in during the holiday. The primary religious behavioral changes expected duringRamadan are an increase in the number of prayers offered, abstinence from smoking, sexual relations,and swearing during the day, and an increase in charity. While a general guideline to increase prayersand reading and recitation of the Koran exists, no specific rules are provided regarding the amountor timing of the prayer that should be completed beyond the standard prayers observed throughoutthe year, five times daily. Similarly, there are no specific guidelines for the amount of charity to beprovided during this time.
In addition to these changes in religious practice, Muslims often spend time in social gather-ings in the evenings during Ramadan. The most common set of activities following sunset is tobreak the fast with a small snack, to complete the fourth set of daily prayers, and then to gatherwith friends or family for a large evening meal (Blackwell, 2009; Ahmad et al., 2012). So, althoughthere is an increase in religious and social activity during this time, much of the increase occurs inthe evenings when individuals would not typically be working. In addition, because the prescribed
13

changes in behavior are general and flexible, they are less likely to interfere with work requirementsthan observance of many other holidays. Finally, although some heavily Muslim counties see shiftsin working hours during Ramadan, the smaller proportion of Muslims in India make these types oflabor market changes unlikely to occur in this context.
Empirical Evidence - No Change in Labor Supply or Earnings During Ramadan. Toexamine labor supply changes among Muslims in India during Ramadan, I draw on two sources ofdata: the second-generation ICRISAT village level studies survey – a more geographically limitedand smaller but more detailed survey – and the National Sample Survey (NSS) – a large and nation-ally representative dataset with lumpier labor supply data (National Sample Survey Organization,2019). In more detail, ICRISAT is a panel dataset containing monthly measures of employmentand earnings. The sample was drawn from six villages chosen to be representative of the majoragro-climatic zones in the semi-arid tropics of India. Households were sampled across four cate-gories of landholdings (landless, small farmers, medium farmers, and large farmers). The NationalSample Survey is a large, nationally representative, repeated cross-sectional survey containing dataon employment and consumption. The employment/unemployment rounds (Schedule 10) provideinformation on respondents’ labor supply and wages during the seven days preceding the interviewas well as their religious affiliation. Households were sampled on a rolling basis such that the sampleis temporally spaced within each district.
Empirical Strategy and Results. In the ICRISAT data, labor supply (or earnings) of in-dividual i, in survey round s, and year-month t are regressed on the number of days of overlapbetween survey period and Ramadan (Rist), an interaction between that variable and an indicatorfor whether the individual is Muslim (Mi), a variable for the number of days between interviews(Dist) to account for survey variation, and fixed effects for individuals (λi) and the year-month inwhich the survey occurred (ψt) (Equation 3). “Labor days” is defined as the number of days of labor,including both paid and unpaid labor but excluding domestic work, in the past month. The wagesvariable is calculated as the sum of cash and in-kind wages during the month. The number of hoursworked is only reported for paid labor. If the participant reports more than one paid job during thesurvey period, the average hours worked per day is calculated as a weighted average across all jobsreported.
list = β0 + β1Rist + β2Rist ∗Mi + β3Dist + λi + ψt + εist. (3)
A similar specification is used with the NSS data, with adjustments to account for the fact thatthe data consists of multiple cross sections rather than a panel. As can be seen in Equation 4,labor supply (or earnings) of individual i, in district d, at time t (lidt) is regressed on the days of
14

overlap between the survey period and Ramadan (Ridt), whether the individual is Muslim (Midt),the interaction of these two variables (Ridt ∗Midt), district-year fixed effects (λdt), and month ofsurvey fixed effects (ψm) to account for seasonal variation in labor supply. “Labor days” is thecombination of days engaged in labor for wages and own-labor (e.g. working on one’s own farm)excluding domestic work. Wages are the total (cash plus in-kind) wages received during the surveyperiod. Earnings are considered in both levels and logs to account for unemployment and unpaidlabor.
lidt = β0 + β1Ridt + β2Midt + β3Ridt ∗Midt + λdt + ψm + εist. (4)
Table V provides the results of these regressions. In both datasets, Muslims’ labor supply andearnings during the holiday are fairly precisely estimated (a change in labor supply of less than twopercent per day of overlap can be detected). Perhaps surprisingly, both earnings and labor supplyremain unchanged or increase very slightly for Muslims during Ramadan. The point estimate onlabor supply in the NSS is a precisely estimated zero. However, it is possible that the lumpyreporting of labor supply (at the half day level with a large fraction of individuals reporting workingseven days per week) makes detecting more minor adjustments such as leaving early difficult. In theICRISAT data, the point estimate on labor supply on the extensive margin (days worked) is small– less than one percent – but positive and marginally significant while there is no detectable effecton hours worked per day in that data. The estimated change in earnings among Muslims duringRamadan is a precisely estimated zero in the ICRISAT data and an increase of approximately onepercent in the NSS data, though the increase is only marginally statistically significant in logs (andnot statistically significant in levels).
Possible explanations for the observed slight increase is labor supply are either an attemptto compensate for reduced productivity and/or to accrue funds for charity, which Muslims areexpected to provide during Ramadan. Regardless of the cause, these results suggest that changes inlabor supply driven by religious or social obligations are unlikely to drive the observed declines inproduction when Ramadan overlaps with important parts of the agricultural cycle and may (weakly)work against such declines.
5.2 Nutrition
Caloric Intake and Body Mass Index in India. The Indian Planning Commission’s recom-mended caloric intake has typically been 2,100 calories per adult in urban areas and 2,400 caloriesper adult in rural areas (Sharma, 1999). Caloric intake in India has, however, remained significantlybelow these levels for many years and, of note, has been declining over time despite strong economicgrowth (Deaton and Drèze, 2009). In addition, the distribution of calories in India is quite skewed,such that mean caloric intakes are substantially higher than median caloric intakes. The low caloric
15

intakes lead to correspondingly low body mass indices (BMI), with over half of the population belowthe WHO cutoff for underweight (BMI < 18.5) in 1971, the median year in this study. Roughlyone-third of the population remains underweight at present (Deaton and Drèze, 2009; World HealthOrganization, 2013).
Although Muslims fast during daylight hours during Ramadan, it is possible that there could besubstitution of food consumption across time to the evenings and mornings, limiting or eliminatingdeclines in caloric intake. Hence, I directly estimate the change in caloric intake in order to shedlight on the plausibility of this channel.
Data. This analysis utilizes the consumer expenditure portion of the 60th, 62nd, and 64throunds of India’s National Sample Survey (NSS, Schedule 1). The dataset provides retrospectivedata on household level consumption data for nearly 150 food items over the past month or the pastweek. These rounds cover a period substantially later than that covered by the agricultural data.Although use of earlier rounds would be ideal, it is not possible as only the more recent roundsinclude precise survey dates that are required to calculate overlap between the survey period andRamadan. Per capita caloric intake is calculated for the 36,000 households living in rural areas andengaged in agricultural labor. The conversion from the quantity of food consumed to caloric contentis completed using the conversion tables provided by the NSS.
Results - Changes in Caloric Intake. I estimate caloric declines among Muslim householdsduring Ramadan according to the following equation:
Cidt = β0 + β1rRi + β2Fit + β3rRi ∗ Fit + β4Eit + β5rRi ∗ Eit + γdt + ψm + εist. (5)
Cidt is calories per capita per day in household i, in district d, in year t. Ri is a vector of binaryvariables for the household’s religion. Fit is an indicator variable denoting full overlap of the surveyperiod and Ramadan. Eit is an indicator for overlap between the survey period and Eid, and γdt
and ψm are district-year and month of survey fixed effects, respectively. The sample is limited torural households whose primary occupation is agricultural work and which have either no overlapor complete (29 day) overlap between the survey period and Ramadan for ease of interpretation.
Although imprecisely estimated, the results suggest a fairly substantial decline in caloric intakeamong rural Muslim households during Ramadan (See Table VI). The decline appears to be ap-proximately 600 calories per person per day, an estimate consistent with not eating a midday meal.Notably, neither protein nor fat consumption changes significantly during this time suggesting thatthe dietary mix does become slightly "richer", despite the decline in calories.8 This decline is sub-stantial relative to total caloric consumption, which is approximately 2200 calories per capita per
8Results available upon request.
16

day despite the fact that most individuals in this population engage in heavy physical labor. Theresults are robust to and strengthened by a variety of methods of topcoding used to address implau-sibly high consumption levels. Although imprecise enough that the evidence is not definitive, theseresults are consistent with previous literature suggesting that calories have the potential to influenceproductivity (see Section B.1) and further suggest that reduced caloric intake has the potential toplay a role in the decrease in agricultural production during Ramadan. These results are exploredfurther via the omnibus test in Section 5.5.
5.3 Sleep
Little direct evidence on the level of sleep experienced by the Indian population exists. And, un-fortunately, the data that does exist is recent (limiting overlap with the period for which agriculturaldata are available), more focused on urban and elderly populations, and is not of sufficient scale toallow any direct tests of Ramadan’s impact on sleep among Muslim populations during Ramadan inIndia. Hence, no direct tests of this relationship can be conducted in this precise context. However,below I provide evidence on the plausibility of this relationship by drawing on the relevant litera-ture regarding sleep’s impact on physical and cognitive performance. In addition, the omnibus testexamining overlap between the period following Ramadan and the sowing and harvesting seasons,which is described in greater detail below, also sheds indirect light on whether sleep is likely to playa substantial role in the observed production declines.
Literature - The Impact of Sleep on Cognitive and Physical Function. A limitedliterature on the impact of Ramadan on sleep habits does exist. However, it focuses on countriessuch as Saudi Arabia which are nearly exclusively Muslim (Bahammam (2006) provides a review).Because the holiday is celebrated so widely in these countries, the habits of the country as a wholeoften shift during the month of Ramadan. For example, stores often both open and close laterthan usual. However, because the median district in this study is only seven percent Muslim, theseequilibrium shifts are unlikely to occur in India. In addition, within this literature, changes in sleeppatterns appear to vary widely across countries (Bahammam, 2006). Hence, the direct literatureon changes in sleep patterns during Ramadan is unlikely to aid in understanding the likely impactof possible changes in sleep patterns on agricultural production in India. Instead, I focus on themore extensive and relevant literature surrounding the physiological relationship between chronicpartial sleep deprivation, defined as 2 to 7 hours of sleep per night for periods of days to months,and physical and cognitive performance to understand the likely effect of changes in sleep patternsduring the holiday.
The effects of sleep deprivation on performance appear to be heavily cognitive and occur primarilywhen sleep drops below six to seven hours per night (Goel et al., 2009; Durmer, 2005). When
17

sleep drops below this level, the largest and most consistent effects center on changes in moodwith increased sleepiness and negative affect (Alhola and Polo-Kantola, 2007; Durmer, 2005). Inaddition, in sleep labs and high-income countries chronic sleep deprivation of less than 6 hours pernight is likely to lead to reduced vigilance, poorer memory consolidation, and slowed reaction timeand learning (Blagrove et al., 1995; Rogers, 2003; Ferrara and De Gennaro, 2001; Van Dongen etal., 2003). These effects on mood and cognitive function typically tend to have a relatively linearrelationship with the cumulative deprivation in the early stages and then often level off over alonger time horizon (multiple weeks) as individuals acclimatize to the new regimen (Ferrara andDe Gennaro, 2001).
Despite cognitive declines associated with less than six hours of sleep per night, the evidenceto date suggests that reduced sleep has little impact on physical performance until the deprivationbecomes relatively extreme (Guezennec et al., 1994; Sinnerton and Reilly, 1992). As VanHelderand Radomski (1989) note, “Sleep deprivation of 30 to 72 hours does not affect cardiovascularand respiratory response to exercise of varying intensity, or the aerobic and anaerobic performancecapability of individuals.” Some studies do show declines in time to exhaustion after extended periodsof sleep deprivation (Reilly and Piercy, 1994; VanHelder and Radomski, 1989; Vardar et al., 2007).However, results are mixed and the conditions of deprivation are much greater than those likely tobe experienced during Ramadan.
Finally, a recent randomized trial on sleep in India suggests that modest changes in nighttimesleep (30 minutes per night over the course of one month) have no impact on physical performance(measured by an index of performance on an exercise cycle and daily steps) or on cognitive function(as measured both via direct laboratory measures of cognitive function and performance in a dataentry job) at the levels of sleep and sleep quality experienced in this population (Bessone et al.,2020).
In short, although direct evidence is limited, making it difficult to draw strong conclusions, theliterature relating sleep to cognitive and physical outcomes suggests that changes in sleep patternsduring Ramadan are unlikely to be a significant driver of changes in production in this context.Physical capabilities are quite resistant to decreased sleep, even when the physical requirementsare substantial as in military combat training. And although extended sleep deprivation is clearlyassociated with declines in specific areas of cognitive function, the sleep deprivation in these studiestends to be both more extreme than is likely to be experienced during Ramadan and its impact tendsto be limited to specific domains of cognitive function (e.g. memory, reaction time) that are unlikelyto be strongly related to agricultural production. Finally, the most relevant evidence – drawn froman RCT in India with an increase in sleep of 30 minutes per night over one month – suggests thatmodest changes in night sleep do not impact overall physical performance.
18

5.4 Dehydration
In addition to fasting, observant Muslims also refrain from drinking water during daylight hoursduring Ramadan. This restriction may cause individuals to become dehydrated, especially thoseindividuals engaged in hard labor in hot climates. To examine whether dehydration may be a driverof the observed declines in output during this period, I draw on three sources of evidence: 1) areview of relevant literature, 2) an empirical test examining the impact of weather conditions whichincrease the rate of perspiration on output (controlling for the impact of those conditions on plantgrowth), and 3) the omnibus test conducted below which examines declines in production associatedwith overlap between sowing/harvesting and the period following Ramadan. Because recovery fromdehydration is rapid, dehydration is unlikely to drive longer term impacts on production followingthe Ramadan holiday.
Literature - The Impact of Dehydration on Cognitive and Physical Function. Thehuman body is remarkably efficient at regulating hydration via changes in plasma osmolarity (water-electrolyte balance) which drives re-absorption as needed (Jéquier and Constant, 2010). However,with extended exercise and lack of fluid replacement, dehydration does begin to negatively impactmeasures of aerobic performance once two percent of body weight has been lost. These declinesbecome more consistent around three to four percent loss in body weight; however, even at theselevels results are mixed (Casa et al., 2005; Sawka et al., 2007). There is generally no detectableimpact of dehydration on strength and anaerobic performance until at least five percent of bodyweight is lost from water loss (Casa, 1999a,b; Greiwe et al., 1998; Sawka et al., 2007). There is alsomore limited evidence that dehydration beyond two percent of body weight may cause declines incognitive function in areas such as short term memory consolidation (Grandjean and Grandjean,2007).
Given that these findings suggest that dehydration’s likely impact depends on its extent, it isnecessary to estimate the expected body weight losses due to dehydration for fasting farmers inIndia. While, to the best of my knowledge, no direct evidence on body water loss rates amongfarmers in India exists, it is possible to benchmark expected losses relative to sports activities inwhich sweat rates have been measured based on caloric requirements and environmental factors.9
This calibration, outlined in Section B.5, finds that expected water losses by the end of the day arearound the two percent threshold at which aerobic effects become detectable. Given that these lossesare cumulative throughout the day, and the mean losses at the day’s end just reach the threshold
9Although no direct evidence on the extent of dehydration during fasting in India is available, related research doesexist. The closest existing study examined 10 female farmers in Ghana working while fasting in similarly challengingenvironmental conditions – 7 to 8 hours of labor per day in temperatures exceeding 30 degrees Celsius in the shadewith over 80 percent relative humidity. These women lost an average of 3.8 percent of their body weight by the timethey broke their fast in the evening (Prentice et al., 1984).
19
for detectable impacts on physical performance, it is likely that most farmers are not significantlyimpacted by dehydration during this time. However, as some individuals are likely to reach thisthreshold, I conduct an additional test to shed further light on the magnitude of such potentialeffects.
Empirical Evidence – No Decrease in Production with Higher Perspiration Rates.In order to provide additional evidence on this potential pathway, I utilize the fact that atmosphericconditions can significantly impact the rate of perspiration and water loss. Specifically, evaporativepotential (PET) is a measure of the propensity of water to evaporate into the atmosphere.10 Ifdehydration were a significant factor in production, then as evaporative potential increased bodywater loss would also increase, and production would decline. However, evaporative potential isalso likely to influence agricultural production directly. Hence, this test augments the previousspecification not only with a main effect for the average PET over the sowing and harvesting seasonsto account for direct effects on output, but also with interactions between high PET (HPET) duringthe relevant season – defined as districts in the top quartile of PET measurements for that season –and overlap between the seasons and Ramadan (Equation 6).
qcdt = β0 + β1Scdt + β2Hcdt + β3HPETScdt + β4HPET
Hcdt + β5Scdt ∗HPETS
cdt + β6Hcdt ∗HPETHcdt+
θcd + γdt + αct + κc + ζd + τt + βnXcdt + εctd.
(6)
The results of these regressions do not suggest a significant role for dehydration in driving pro-duction declines (Table VII). If dehydration were reducing output, the interactions between highevaporative potential and sowing or harvesting would be negative. However, the coefficients aremixed – with different signs between sowing and harvesting seasons – and none are significant.Further, the addition of these terms does not eliminate the negative effect of overlap between sow-ing/harvesting and Ramadan observed in the earlier regressions as would be expected if dehydrationwere the key factor in production declines. Rather, these terms remain negative and significant.
5.5 Omnibus Test - Persistence of Production Declines Following Ramadan.
A distinctive feature of low caloric intake is that recovery from this state takes time, often requir-ing weeks or even months to fully regain physical performance in extreme cases of deprivation (e.g.,Keys et al. (1950)). This lag between increased caloric intake and improved physical performancesuggests that the reduced caloric intake during the holiday would be expected to have an impact
10Data on PET were obtained from the British Atmospheric Data Center (BADC) and Climatic Research Unit(CRU) Databases.
20

beyond Ramadan itself.In contrast, recovery from sleep deficits and dehydration is rapid. And as discussed in greater
detail above, sleep deficits primarily influence cognitive rather than physical function. However,a number of researchers have documented that a single night of greater than eight hours of sleepreverses cognitive deficits from extended (24-48 hours) periods of total sleep deprivation (Drummondet al., 2006; Kendall et al., 2006; Brendel et al., 1990). Similarly, Belenky et al. (2003) cannotdistinguish measures of attention and reaction time between groups which had either five, seven, ornine hours of sleep per night for one week after a three-day recovery period with eight hours of sleepper night. Dinges et al. (1997) also demonstrate that two nights of ten hours of sleep is sufficientto overcome deficits accumulated over seven nights with five or fewer hours of sleep. Similarly, forrecovery from dehydration, Sawka et al. (2007) survey a variety of sources and note that normalbody water and performance can typically be restored within 8 to 24 hours even after fairly extensivedehydration.
These rapid recovery periods from sleep deprivation and dehydration suggest that if reducedproduction during Ramadan were due to sleep deprivation, dehydration, or changes in labor supplyrelated to religious obligations that these deficits should disappear within a few days after theconclusion of the holiday. In contrast, if the reduced production is the result of lower caloric intakeduring the month, there should continue to be residual effects which reduce production in the weeksfollowing the holiday. Hence, examining the impact of overlap between the sowing and harvestingseasons and the weeks following Eid (a short holiday immediately following Ramadan) serves asa useful test to distinguish between nutritional deficits and other behavioral changes during theholiday as likely causes of the reduced production.
This test is conducted using an empirical approach similar to the previous analyses, in whichthe fraction of Ramadan covered by the sowing and harvesting seasons is replaced with the fractionof the weeks following the holiday covered by the sowing and harvesting seasons. However, becausethe Eid holiday could potentially confound the results and there is a short recovery period fordehydration and sleep deprivation, I calculate overlap with the first and second week following Eidrather than following Ramadan. The estimating equation, Equation 7, is displayed below. PXN
cdt
denotes the overlap between season X (where X = {S for sowing, H for harvesting}) and week N(where N = {1, 2}). All other variables are as defined previously.
qcdt = β0 + βXNPXNcdt + θcd + γdt + αct + κc + ζd + τt + βnXcdt + εctd. (7)
Although the standard errors are larger and the point estimates slightly smaller on average, theresults of overlap for the first week post-Eid are quite similar to the results during the holiday itselffor both sowing and harvest (Table VIII). This effect is robust to longer (4 day) specifications forEid (Columns (3) and (4)). While the point estimates remain similar for the second week post-Eid
21

for sowing, the effects attenuate by the second week following Eid for harvest, as might be expectedgiven the relatively brief period of deprivation.
In short, while not conclusive, these results are consistent with the loss in productivity beingdriven by reduced caloric intake but inconsistent with diminished productivity being driven bydehydration, sleep deficits, or time spent on religious activities. This omnibus test is also consistentwith the tests presented previously which show: (i) no significant change in labor supply during theholiday, (ii) and no increase in the extent of declines as individuals become increasingly dehydrated,and (iii) the decline in caloric intake during this period among Muslim households. Hence, whilefully isolating the channels through which these effects operate is not likely to be possible, there isstrong suggestive evidence that nutrition is likely to be a key channel in this context.
6 Conclusion
Eighty-five percent of the world’s population adheres to a religion. For many of these individuals,religion plays a central role in their lives, including their economic outcomes via a wide variety ofchannels. Although religion’s potential influence on economic outcomes has been discussed for manyyears and a literature has begun to develop, the challenges inherent in identifying causal impacts ofreligious practice on economic output has limited the evidence available on this relationship.
This study begins to close that gap by utilizing a natural experiment to provide one of thefew causal estimates of the impact of common religious practice on economic output in a broadlyrelevant context. Specifically, the study takes place in the agricultural sector of India, a sectorwhich is central to the welfare of the country (as well as many other developing countries) andaccounts for half of all employment. This analysis takes a differences-in-differences-in-differenceapproach utilizing variation in the timing of cropping cycles between and within districts as wellas Ramadan’s lunar calendar to provide causal identification. I find declines in total agriculturalproduction between 2 and 3 percent in quantity and 3 and 5 percent in value when Ramadan andlabor-intensive parts of the agricultural cycle fully coincide, or an average decrease of approximately1 percent of India’s agricultural GDP (0.5 percent in overall GDP) annually during this period.Reassuringly for the identification strategy, there are no declines in production in districts withfew Muslims, but large declines in districts with many Muslims. Although the overall declines arerelatively small in percentage terms, they are economically meaningful and correspond to muchgreater declines in productivity – roughly 20 to 40 percent per Muslim individual – given the lowfraction of Muslims in the population.
Interestingly, despite the meaningful changes in output I do not observe any major changes inagricultural production processes or inputs such as fertilizer, draft labor, or land in reaction toRamadan. Although this lack of adaptation may appear puzzling, there are a number of plausiblereasons why adjustments may not occur. First, the declines in output may simply be difficult
22

to detect if a mix of Muslim and non-Muslim labor is used on many farms and the productionprocess in agriculture (which was primarily rain fed during this time) is noisy. In addition, manyof the possible margins of adjustment may be costly or difficult to undertake for small farmers whoare frequently liquidity constrained and likely to face a tight labor market during peak seasons.Further work of this type to understand why markets adjust, or fail to adjust, to such declines inproductivity due to religious practice would be quite valuable. In particular, understanding whetheradjustments are particularly difficult among the poor, who are more likely to face missing marketsor liquidity constraints that prevent adaptation to such costs, would improve our understanding ofthe distribution of the costs associated with various religious practices.
In order to begin to generate evidence on the drivers of declines in output, the final portion ofthe paper analyses four potential channels through which Ramadan may influence output: reducedlabor supply due to religious or social obligations, reduced caloric intake, sleep deprivation, anddehydration. Although fully parsing these channels is difficult in a natural experiment, the literatureand empirical tests are generally consistent with caloric declines as a meaningful driver as well asinconsistent with large productivity declines through several other potentially impactful channelsexplored.
While this paper focuses on the impact of Ramadan, practices from other religions are likelyto have similar impacts. For example, fasting is a practice common to many religions includingHinduism, Christianity, and many other religions. Of course, the exact magnitudes of such effects areunlikely to be directly comparable across either religions or geographies within a religion. However,future research to improve our understanding of the range in the magnitude of these effects andthe features of religious practices which generate such effects would broaden our understanding ofreligion’s role in economic production and growth.
23

References
Ahmad, S, K. Goel, Ka Maroof, and P. Goel, “Psycho-social behaviour and health benefitsof Islamic fasting during the month of Ramadan,” Journal of Community Medicine & HealthEducation, 2012, 02 (09), 178–181.
Alhola, Paula and Päivi Polo-Kantola, “Sleep deprivation: Impact on cognitive performance,”Neuropsychiatric disease and treatment, 2007.
Almond, Douglas and Bhashkar Mazumder, “Health capital and the prenatal environment:The effect of Ramadan observance during pregnancy,” American Economic Journal: AppliedEconomics, October 2011, 3 (4), 56–85.
Bahammam, A., “Does Ramadan fasting affect sleep?: Ramadan and Sleep,” International Journalof Clinical Practice, May 2006, 60 (12), 1631–1637.
Banerjee, Abhijit V, Abhijit Banerjee, and Esther Duflo, Poor economics: A radical re-thinking of the way to fight global poverty, Public Affairs, 2011.
Barro, Robert J. and Rachel M. McCleary, “Religion and economic growth,” NBER WorkingPaper 9682, 2003.
Beatton, Tony, Ahmed Skali, and Benno Torgler, “Protestantism and effort expenditure onthe battlefield: Soldier level evidence from World War II,” Working paper, 2019, pp. 1–73.
Belenky, Gregory, Nancy J. Wesensten, David R. Thorne, Maria L. Thomas, Helen C.Sing, Daniel P. Redmond, Michael B. Russo, and Thomas J. Balkin, “Patterns of per-formance degradation and restoration during sleep restriction and subsequent recovery: a sleepdose-response study,” Journal of Sleep Research, March 2003, 12 (1), 1–12.
Benjamin, Daniel J, James J Choi, and Geoffrey Fisher, “Religious identity and economicbehavior,” Review of Economics and Statistics, 2016, 98 (4), 617–637.
Bessone, P, G. Rao, F. Schilbach, H Schofield, and M. Toma, “Sleepless in Chennai: Theconsequences of increasing sleep among the urban poor,” Working paper, 2020.
Blackwell, A.H., Ramadan, Chelsea House Publishers, 2009.
Blagrove, Mark, Carol Alexander, and James A. Horne, “The effects of chronic sleep re-duction on the performance of cognitive tasks sensitive to sleep deprivation,” Applied CognitivePsychology, February 1995, 9 (1), 21–40.
Brendel, David H., C.F. Reynolds, J.R. Jennings, C.C. Hoch, T.H. Monk, S.R. Berman,F.T. Hall, D.J. Buysse, and D..J. Kupfer, “Sleep stage physiology, mood, and vigilanceresponses to total sleep deprivation in healthy 80-year-olds and 20-year-olds,” Psychophysiology,1990, 27 (6), 677–685.
Bryan, Gharad, James J Choi, and Dean Karlan, “Randomizing religion: The impact ofProtestant evangelism on economic outcomes,” NBER Working Paper 24278, 2018, p. 81.
24

Campante, Filipe and David Yanagizawa-Drott, “Does religion affect economic growth andhappiness? Evidence from Ramadan,” The Quarterly Journal of Economics, May 2015, 130 (2),615–658.
Candas, V., J. P. Libert, and J. J. Vogt, “Human skin wettedness and evaporative efficiencyof sweating,” Journal of Applied Physiology, March 1979, 46 (3), 522–528.
Casa, Douglas J, “Exercise in the heat. I. Fundamentals of thermal physiology, performance im-plications, and dehydration,” Journal of athletic training, 1999, 34 (3), 246–253.
, “Exercise in the heat. II. Critical concepts in rehydration, exertional heat illnesses, and maxi-mizing athletic performance,” Journal of athletic training, 1999, 34 (3), 253–262.
, Priscilla M Clarkson, and William O Roberts, “American College of Sports Medicineroundtable on hydration and physical activity: Consensus statements,” Current sports medicinereports, 2005, 4 (3), 115–127.
Climatic Unit Research Database at the British Atmospheric Data Center (BADC),“The CEDA Archive,” 2013.
Clingingsmith, David, Asim Ijaz Khwaja, and Michael Kremer, “Estimating the impact ofthe Hajj: Religion and tolerance in Islam’s global gathering,” Quarterly Journal of Economics,2009, 124 (3), 38.
Dasgupta, Partha and Debraj Ray, “Inequality as a determinant of malnutrition and unem-ployment: policy,” The Economic Journal, 1987, 36, 1013–1034.
Deaton, Angus and Jean Drèze, “Food and nutrition in India: facts and interpretations,” Eco-nomic and political weekly, 2009, pp. 42–65.
Deolalikar, Anil B., “Nutrition and Labor Producvivity in Agriculture: Estimates for Rural SouthIndia,” The Review of Economics and Statistics, 1988, pp. 406–413.
Dinges, David F., Frances Pack, Kelly A. Williams, John W. Powell, Geoffrey E. Ott,Caitlin Aptowicz, and Allan I. Pack, “Cumulative sleepiness, mood disturbance, and psy-chomotor vigilance performance decrements during a week of sleep restricted to 4–5 hours pernight,” Sleep, April 1997, 20 (4), 267–277.
Directorate of Census Operations, “Census of India, 2011,” 2011.
Donaldson, Dave, “Railroads of the Raj: Estimating the impact of transportation infrastructure,”American Economic Review, 2018, 108 (4-5), 899–934.
Drummond, Sean P. A., Martin P. Paulus, and Susan F. Tapert, “Effects of two nightssleep deprivation and two nights recovery sleep on response inhibition,” Journal of Sleep Research,September 2006, 15 (3), 261–265.
Durmer, Jeffrey S, “Neurocognitive consequences of sleep deprivation,” Seminars in Neurology,2005, 25 (1), 13.
Ellison, Christopher G, “Religious involvement and subjective well-being,” Journal of health andsocial behavior, 1991, pp. 80–99.
25

Evans, T David, Francis T Cullen, R Gregory Dunaway, and Velmer S Burton Jr,“Religion and crime reexamined: The impact of religion, secular controls, and social ecology onadult criminality,” Criminology, 1995, 33 (2), 195–224.
Evenson, R. E., “Assessing the impact of the green revolution, 1960 to 2000,” Science, May 2003,300 (5620), 758–762.
Ewijk, Reyn Van, “Long-term health effects on the next generation of Ramadan fasting duringpregnancy,” Journal of Health Economics, December 2011, 30 (6), 1246–1260.
Ferrara, Michele and Luigi De Gennaro, “How much sleep do we need?,” Sleep MedicineReviews, April 2001, 5 (2), 155–179.
Ferro-Luzzi, A, C Petracchi, R Kuriyan, and A V Kurpad, “Basal metabolism of weight-stable chronically undernourished men and women: lack of metabolic adaptation and ethnic dif-ferences,” The American Journal of Clinical Nutrition, November 1997, 66 (5), 1086–1093.
Fluck, R.C., “Energy of human labor,” in B.A. Stout, ed., Energy In World Agriculture, Amster-dam: Elsevier Science Publishers, 1992.
Food and Agricultural Organization (FAO) of the United Nations, “FAOSTAT,” 2013.
Freeman, Richard B. and Harry J. Holzer, eds, The Black youth employment crisis A NationalBureau of Economic Research project report, Chicago: University of Chicago Press, 1986.
Goel, Namni, Hengyi Rao, Jeffrey Durmer, and David Dinges, “Neurocognitive conse-quences of sleep deprivation,” Seminars in Neurology, September 2009, 29 (04), 320–339.
Grandjean, Ann C. and Nicole R. Grandjean, “Dehydration and cognitive performance,”Journal of the American College of Nutrition, October 2007, 26 (sup5), 549S–554S.
Greiwe, Jeffrey S., K.S. Staffey, D.R. Melrose, M.D. Narve, and R.G. Knowlton, “Effectsof dehydration on isometric muscular strength and endurance,” Medicine and science in sportsand exercise, 1998, 30 (2), 284–288.
Gruber, Jonathan and Sendhil Mullainathan, “Do cigarette taxes make smokers happier?,” in“Happiness and Public Policy,” Springer, 2006, pp. 109–146.
Guezennec, C. Y., P. Satabin, H. Legrand, and A. X. Bigard, “Physical performance andmetabolic changes induced by combined prolonged exercise and different energy intakes in hu-mans,” European Journal of Applied Physiology and Occupational Physiology, November 1994, 68(6), 525–530.
Hanna, Rema, Sendhil Mullainathan, and Joshua Schwartzstein, “Learning through notic-ing: Theory and evidence from a field experiment,” The Quarterly Journal of Economics, 2014,129 (3), 1311–1353.
Havenith, G., V. G. M. Luttikholt, and T. G. M. Vrijkotte, “The relative influence ofbody characteristics on humid heat stress response,” European Journal of Applied Physiology andOccupational Physiology, March 1995, 70 (3), 270–279.
26

Havenith, George, “Individualized model of human thermoregulation for the simulation of heatstress response,” Journal of Applied Physiology, May 2001, 90 (5), 1943–1954.
Hoverd, William James and Chris G Sibley, “Religion, deprivation and subjective wellbeing:Testing a religious buffering hypothesis,” International Journal of Wellbeing, 2013, 3 (2).
Hull, Brooks B and Frederick Bold, “Preaching matters: Replication and extension,” Journalof Economic Behavior & Organization, 1995, 27 (1), 143–149.
Iannaccone, Laurence R, “Introduction to the economics of religion,” Journal of Economic Lit-erature, 1998, 36 (3), 1465–1495.
Immink, D C and E Viteri, “Energy intake and productivity of Guatemalan sugarcane cutters,”Journal of Development Economics, 1981, 9 (2), 251–271.
Immink, Maarten D.C. and Fernando E. Viteri, “Energy intake and productivity ofGuatemalan sugarcane cutters: An empirical test of the efficiency wage hypothesis part II,” Jour-nal of Development Economics, 1981, 9 (2), 273–287.
Iyer, Sriya, “The new economics of religion,” Journal of Economic Literature, June 2016, 54 (2),395–441.
Jéquier, Eric and Florence Constant, “Water as an essential nutrient: the physiological basisof hydration,” European journal of clinical nutrition, 2010, 64 (2), 115.
Kendall, Athena P., Mary A. Kautz, Michael B. Russo, and William D. S. Killgore,“Effects of sleep deprivation on lateral visual attention,” International Journal of Neuroscience,January 2006, 116 (10), 1125–1138.
Keys, A., J. Brozek, A. Henschel, O. Mickelsen, and H.L. Taylor, The biology of humanstarvation, University of Minnesota Press, 1950.
Kraut, H. A. and E. A. Muller, “Calorie intake and industrial output,” Science, New Series,1946, 104 (2709), 495–497.
Kuran, Timur, “Islam and economic performance: Historical and contemporary links,” Journal ofEconomic Literature, December 2018, 56 (4), 1292–1359.
Larson, Donald W, Eugene Jones, RS Pannu, and RS Sheokand, “Instability in Indianagriculture—a challenge to the green revolution technology,” Food Policy, 2004, 29 (3), 257–273.
Lipford, Jody, Robert E McCormick, Robert D Tollison et al., “Preaching matters,” Journalof Economic Behavior and Organization, 1993, 21 (3), 235–250.
Majid, Muhammad Farhan, “The persistent effects of in utero nutrition shocks over the lifecycle: Evidence from Ramadan fasting,” Journal of Development Economics, November 2015,117, 48–57.
McCleary, Rachel M and Robert J Barro, “Religion and economy,” Journal of EconomicPerspectives, 2006, 20 (2), 49–72.
27

Nag, P. K., N. C. Sebastian, and M. G. Mavlankar, “Occupational workload of Indianagricultural workers,” Ergonomics, 1980, 23 (2), 91–102.
National Academy of Agricultural Sciences, “State of Indian agriculture 2011-2012,” 2013.
National Sample Survey Organization, “National Sample Survey,” 2019.
Passmore, R and Jm VGA Durnin, “Human energy expenditure,” Physiological reviews, 1955,35 (4), 801–840.
Pew Research Center, “Babies born to Muslims will begin to outnumber Christian births by2035,” March 2017.
, “The age gap in religion around the world,” 2018.
Prentice, AM, William H Lamb, Ann Prentice, and WA Coward, “The effect of waterabstention on milk synthesis in lactating women,” Clinical Science, 1984, 66 (3), 291–298.
Rehrer, N.J. and L.M. Burke, “Sweat losses during various sports,” Australian Journal of Nu-trition and Dietetics, 1996, 53 (4).
Reilly, Thomas and Mark Piercy, “The effect of partial sleep deprivation on weight-liftingperformance,” Ergonomics, 1994, 37 (1), 107–115.
Rogers, Naomi L, “Sleep waking and neurobehavioural performance,” Frontiers in Bioscience,2003, 8 (6), s1056–1067.
Sawka, Michael N., L.M. Burke, E.R. Eichner, R.J. Maughan, S.J. Montain, and N.S.Stachenfeld, “Exercise and fluid replacement:,” Medicine & Science in Sports & Exercise, Febru-ary 2007, 39 (2), 377–390.
Schofield, Heather, “The economic costs of low caloric intake: Experimental evidence from India,”Unpublished Manuscript, 2018.
Schulenberg, John, Jennifer L Maggs, and Klaus Hurrelmann, Health risks and develop-mental transitions during adolescence, Cambridge University Press, 1999.
Shapiro, Y, K B Pandolf, and R F Goldman, “Predicting sweat loss response to exercise,environment and clothing,” European journal of applied physiology and occupational physiology,1982, 48 (1), 83–96.
Sharma, S., Development and Democracy in India, Lynne Rienner Publishers, 1999.
Sinnerton, S. and T. Reilly, “Effects of sleep loss and time of day in swimmers,” in D. MacLaren,T. Reilly, and A. Lees, eds., Biomechanics and Medicine in Swimming: Swimming Science VI,London: Chapman and Hall, 1992.
Stiglitz, Joseph E., “The efficiency wage hypothesis, surplus labour, and the distribution of incomein L.D.C.s,” Oxford Economic Papers, New Series, 1976, 28 (2), 185–207.
Strauss, John, “Does better nutrition raise farm productivity?,” Journal of Political Economy,April 1986, 94 (2), 297–320.
28

University of Delaware, “University of Delaware air temperature and precipitation data,” 2013.
Van Dongen, Hans P.A., Greg Maislin, Janet M. Mullington, and David F. Dinges, “Thecumulative cost of additional wakefulness: Dose-response effects on neurobehavioral functions andsleep physiology from chronic sleep restriction and total sleep deprivation,” Sleep, March 2003, 26(2), 117–126.
VanHelder, T. and M.W. Radomski, “Sleep deprivation and the effect on exercise performance,”Sports Medicine, April 1989, 7 (4), 235–247.
Vardar, Selma Arzu, Levent Öztürk, Cem Kurt, Erdogan Bulut, Necdet Sut, and ErdalVardar, “Sleep deprivation induced anxiety and anaerobic performance,” Journal of Sports Science& Medicine, 2007, 6 (4), 532–537.
Wolgemuth, J C, M C Latham, A Hall, A Chesher, and D W Crompton, “Workerproductivity and the nutritional status of Kenyan road construction laborers,” The AmericanJournal of Clinical Nutrition, July 1982, 36 (1), 68–78.
World Bank, “World Bank development indicators database,” 2019.
World Health Organization, “Global Database on Body Mass Index,” 2013.
29

7 Tables and Figures
Table I: Effect of Overlap Between Ramadan and Cropping Cycles on Output
All Crops Rice Only
(1) (2) (3) (4)ln(quantity) ln(value) ln(quantity) ln(value)
Overlap sowing -0.020∗ -0.034∗∗∗ -0.041∗∗ -0.016(0.010) (0.011) (0.018) (0.019)
Overlap harvest -0.029∗∗∗ -0.047∗∗∗ -0.043∗∗∗ -0.043∗∗
(0.009) (0.009) (0.016) (0.017)
Observations 103104 103088 7741 7741Mean of DV 1.517 1.837 3.910 3.998
Notes: This table tests for changes in agricultural output in each district-crop-year asa function of overlap between Ramadan and the sowing and harvesting season for thatcrop-district-year.
• Overlap is defined as the fraction of Ramadan covered by the sowing (harvesting)season such that multiplying coefficients by 100 produces the decline associatedwith complete overlap between Ramadan and the season. A more detailed de-scription of calculation of the overlap variables is included in Section B.2.
• The dependent variables are: Columns (1) and (3), log production in thousands oftons, and Columns (2) and (4), log value of production (in 1,000,000 Rs deflatedto 1973). Columns (1) and (2) include all 18 crops whereas Columns (3) and (4)are limited to rice only. Rice is both the most commonly consumed staple grainand the most economically important crop in India.
• Columns (1) and (2) include district-crop, district-year, crop-year, district, year,and crop fixed effects. Columns (3) and (4) include fixed effects for district andyear. All regressions include time varying controls for average rainfall and temper-ature during the sowing and harvesting seasons, two-month leads to each season,and a two-month lag following the sowing season.
• Robust standard errors clustered by district-year are in brackets.
• * p<0.1, ** p<0.05, *** p<0.01.
30

Table II: Effect of Overlap Between Ramadan and Cropping Cycles on Output,District-year Aggregation
(1) (2)ln(quantity) ln(value)
Overlap sowing -0.060∗∗∗ -0.035(0.020) (0.022)
Overlap harvest -0.039∗∗ -0.066∗∗∗
(0.019) (0.023)
Observations 8636 8636Mean of DV 5.807 5.960
Notes: This table tests for changes in agriculturaloutput in each district-year as a function of overlapbetween Ramadan and the sowing and harvesting sea-sons for that district-year.
• Overlap at the district-year level is defined asthe weighted sum of the overlap between Ra-madan and each of the 18 crops, where theweights are the average fraction of productionthat the crop accounts for in all years excludingthe current year. A more detailed description ofthe calculation of the overlap variables for eachcrop is included in Section B.2.
• The dependent variables are log production inthousands of tons in Column (1) and log valueof production (in 1,000,000 Rs deflated to 1973)in Column (2).
• Regressions include district and year fixed ef-fects as well as a vector of time-varying con-trols for monthly rainfall and temperature dur-ing both the current and leading agriculturalyear (to account for long crop cycles).
• * p<0.1, ** p<0.05, *** p<0.01.
31

Table III: Heterogeneity in Production Declines by Fraction Muslim
Median Split Quadratic
(1) (2) (3) (4)ln(quantity) ln(value) ln(quantity) ln(value)
Overlap sowing 0.019 0.002 0.021 -0.003(0.014) (0.014) (0.014) (0.014)
Overlap sowing*Above p50 Muslim -0.076∗∗∗ -0.070∗∗∗
(0.017) (0.017)Overlap harvest -0.003 -0.016 0.007 -0.007
(0.011) (0.012) (0.012) (0.013)Overlap harvest*Above p50 Muslim -0.050∗∗∗ -0.061∗∗∗
(0.014) (0.015)Overlap sowing* Fraction Muslim -0.969∗∗∗ -0.791∗∗∗
(0.173) (0.178)Overlap sowing* Fraction Muslim 2.471∗∗∗ 2.196∗∗∗
squared (0.416) (0.427)Overlap harvest* Fraction Muslim -0.941∗∗∗ -1.001∗∗∗
(0.175) (0.181)Overlap harvest* Fraction Muslim 2.692∗∗∗ 2.742∗∗∗
squared (0.400) (0.428)
Observations 103104 103088 103104 103088Mean of DV 1.517 1.837 1.517 1.837
Notes: This table tests for changes in agricultural production in each district-crop-year as afunction of the fraction of Ramadan covered by the sowing (harvesting) season and the inter-action of that variable with various indicators for the fraction of Muslims in the district.
• Columns (1) and (2) interact the overlap variable with an indicator for an above medianfraction of Muslims in the district. Columns (3) and (4) interact the overlap variable witha continuous variable for the fraction Muslim as well as this variable squared.
•Quantities (Cols. (1) and (3)) are in log thousands of tons and values (Cols. (2) and (4))are in log 1,000,000 Rs deflated to 1973.
• The net decline in production and in productivity per Muslim individual at each fractionMuslim based in the estimates in Columns (3) and (4) are plotted in Figure IV.
•Regressions include district-crop, district-year, crop-year, crop, year, and district fixed ef-fects as well as time varying controls for average rainfall and temperature during the sowingand harvesting seasons, two month leads to each season, and a two month lag following thesowing season.
•Robust standard errors clustered by district-year are in brackets.
• * p<0.1, ** p<0.05, *** p<0.01.
32

Table IV: Potential Margins of Adjustment
(1) (2) (3)Area Bullocks ln(fertilizer)
Overlap sowing -0.110 3366.856 0.070∗∗∗
(0.195) (2179.638) (0.026)Overlap harvest -0.018 1839.502 -0.049
(0.169) (2244.222) (0.031)
Observations 136960 8640 8434Mean of DV 28.657 216713.335 7.932
Notes: This table reports on potential adjustments toagricultural inputs in response to overlap between Ra-madan and the sowing or harvesting season.
•Area is measured at the level of the crop-district-yearwhile draft animal labor (bullocks) and fertilizer useare captured at the level of the district-year. Hence,Column (1) utilizes the same estimation strategy andcontrols as the regressions in Table I while Columns(2) and (3) utilize the estimation strategy and controlsin Table II.
•Area planted is measured in 10,000HA. Bullocks mea-sures the number of castrated (male) cattle over theage of 3 years which are used in rural areas for workonly. Fertilizer captures the natural logarithm of thesum of all fertilizers measured (nitrogen, phosphorusand potassium) in the dataset.
•Robust standard errors clustered by district-year arein brackets.
• * p<0.1, ** p<0.05, *** p<0.01.
33

Table V: Labor Market Outcomes During Ramadan
ICRISAT Agricultural Laborers NSS Agricultural Laborers
(1) (2) (3) (4) (5) (6)Labordays
Averagework hours
ln(totalearnings)
Labordays
Totalearnings
ln(totalearnings)
Muslim*Overlap 0.155∗ -0.003 0.002 -0.013 2.986 0.011∗
Ramadan (0.089) (0.011) (0.006) (0.010) (2.083) (0.006)Muslim 0.058∗∗ 51.685∗∗∗ 0.184∗∗∗
(0.024) (6.859) (0.024)Overlap Ramadan -0.039 -0.002 -0.004∗∗∗ 0.003 -0.171 -0.001
(0.035) (0.001) (0.001) (0.004) (0.535) (0.003)
Observations 31432 19417 19287 395505 395510 123007Individuals 1146 910 914 395505 395510 123007Mean of DV 21.752 7.131 6.816 6.007 135.623 5.727
Notes: This table provides a test of whether reduced labor supply by Muslims reduced agricultural productionduring Ramadan. Given the coarse nature of the labor supply variable in the NSS, the table also examines wages.
• Data in Columns (1)-(3) includes ICRISAT respondents for whom agricultural work is their primary occupation.
• The ICRISAT survey elicits information on labor supply, hours, and wages of the respondent during the pre-ceding month. The number of days of overlap between Ramadan and the survey period is calculated as thenumber of days of Ramadan falling within the 30 days preceding the survey date. Labor supply is defined as thenumber of days paid and unpaid labor excluding domestic work in the past month. Wages include both cashand in-kind payments. Average hours worked is only reported for paid labor. If the participant reports morethan one paid job, average hours worked is calculated as a weighted average across jobs. Religion is capturedvia the caste variable, which contains a category for Muslim individuals, because it is not directly reported.
• Regressions in Columns (1)-(3) include individual fixed effects, a control for the number of days between surveys,and year-month of interview fixed effects. Robust standard errors clustered by individual are in brackets.
• Columns (4)-(6) utilize data from the Indian National Sample Survey (NSS), Schedule 10 (Employment), rounds60, 61, 62, 64, and 66. These rounds are selected because they contain survey dates while earlier rounds do not.The sample includes individuals for whom agricultural work is their primary or secondary occupation.
• The NSS Schedule 10 provides data on labor supply (to the half day) and wages during the preceding week.Labor supply is calculated as the number of days of labor excluding domestic work in the past week.
• Columns (4)-(6) include district-year and calendar month fixed effect. Robust standard errors clustered bydistrict-year are in brackets.
• Robust standard errors clustered by district-year are in brackets.
• * p<0.1, ** p<0.05, *** p<0.01.
34

Table VI: Daily Calories per Capita in Rural Agricultural Households
Primary Robustness
(1) (2) (3) (4) (5)No topcodingplaceholder
P99 to meanplaceholder
P99 to P99placeholder
P99 to mean,cond. on pos.
P1 and P99,cond. on pos.
Muslim*Full overlap -612.598 -601.279∗ -620.198∗ -880.169∗∗ -725.513∗∗
(384.806) (340.301) (336.879) (400.575) (368.854)Muslim -107.497∗∗∗ -96.837∗∗∗ -89.493∗∗∗ -106.743∗∗∗ -92.462∗∗∗
(41.543) (28.134) (27.486) (28.881) (28.859)Full overlap 455.086∗ 279.832 395.840 405.555 427.228
(259.091) (274.727) (274.719) (302.973) (271.533)
Observations 36618 36618 36618 36618 36618Mean of DV 2262.406 2019.813 2135.572 2143.297 2198.235
Notes: This table tests for changes in caloric consumption during Ramadan in Muslim households.
• The sample is drawn from the Indian National Sample Survey, Schedule 1 (consumption), rounds 60,62, and 64 and is limited to households with survey periods with no overlap or full (29 day) overlapbetween the survey period and Ramadan. These rounds are included because they contain surveydates while earlier rounds do not.
•All regressions include district-year fixed effects and month of interview fixed effects. In addition,indicator variables for other major religions and their interaction terms with overlap between thesurvey period and Ramadan as well as overlap between the survey period and Eid (to address the factthat food purchases are lumpy and made in advance) and the interaction between this variable andthe religion indicators are included in the regressions but omitted from the table for simplicity.
• The dependent variables are per capita daily caloric intake with six different methods of topcoding.Given concerns around units, all topcoding is done by food item before aggregating across the fooditems. The dependent variable is per capita daily caloric availability. Column (1) makes no adjustmentsto reported values. Columns (2) and (3) windsorize at the 99th percentile to the mean, and 99thpercentile, respectively. Columns (4) and (5) are similar to (2) and (3), but use means and 99thpercentiles conditional on households that have positive consumption of the good.
•NSS sampling weights are used and are reweighted to weight each round of the survey equally.
•Robust standard errors clustered by district-year are in brackets.
• * p<0.1, ** p<0.05, *** p<0.01.
35

Table VII: Test of Dehydration Driving Production Declines
(1) (2)ln(quantity) ln(value)
Overlap sowing -0.065∗∗ -0.062∗
(0.031) (0.032)High sowing PET -0.001 0.010
(0.029) (0.029)Overlap sowing*High sowing PET 0.047 0.050
(0.066) (0.067)Overlap harvest -0.072∗∗ -0.075∗∗
(0.029) (0.029)High harvest PET 0.016 0.019
(0.036) (0.036)Overlap harvest*High harvest PET -0.052 -0.057
(0.047) (0.048)
Observations 11356 11356Mean of DV 1.601 1.877
Notes: This table provides a test of whether declines in productionduring Ramadan are due to dehydration by examining changesin agricultural production in each district-crop-year as a functionof overlap between Ramadan and sowing (or harvesting) seasonsfully interacted with a measure of weather features which impactdehydration (evaporative potential or PET).
• PET is a measure of the propensity of water to evaporate.It is calculated based on temperature, vapor pressure, andcloud cover as recommended by the Food and AgriculturalOrganization (FAO). PET measures are not available for alldistricts in all years, resulting in a lower sample size.
•Regressions include district-crop, district-year, crop-year, dis-trict, year, and crop fixed effects as well as time varying con-trols for average rainfall and temperature during the sowingand harvesting seasons, two month leads to each season, anda two month lag following the sowing season.
•Robust standard errors clustered by district-year are in brack-ets.
• * p<0.1, ** p<0.05, *** p<0.01.
36

Table VIII: Persistence of Declines in Output Following Ramadan (and Eid)
Short (2 day) Eid Long (4 day) Eid
(1) (2) (3) (4)ln(quantity) ln(value) ln(quantity) ln(value)
Overlap sowing and 1st week post Eid -0.016 -0.014 -0.022 -0.023(0.017) (0.017) (0.017) (0.017)
Overlap sowing and 2nd week post Eid -0.016 -0.018 -0.026 -0.025(0.017) (0.017) (0.018) (0.017)
Overlap harvest and 1st week post Eid -0.023 -0.004 -0.043∗∗∗ -0.027∗∗
(0.014) (0.013) (0.014) (0.014)Overlap harvest and 2nd week post Eid 0.011 -0.006 0.024∗ 0.011
(0.014) (0.013) (0.014) (0.013)
Observations 103104 103104 103088 103088Mean of DV 1.517 1.517 1.837 1.837
Notes: This table provides a test of whether declines in production during Ramadan are due tolow caloric intake, which causes longer lasting decreases in productivity, or other potential factorsincluding dehydration or sleep deprivation, from which recovery is rapid, or time spent on religiousactivities during the holiday. To accomplish this, this table examines changes in agricultural pro-duction (in log thousands of tons) in each district-crop-year as a function of the overlap between thefirst and second week following Eid (the holiday following Ramadan) and the sowing (harvesting)season for that crop-district-year.
• Eid is defined as a two day period in Columns (1) and (3) a four day period in Columns (2)and (4). These formulations are used because the holiday is lunar so the exact day of Eid willdepend on the sighting of the crescent moon, which varies across locations. I build in a oneday buffer to account for the uncertainty in sighting the moon. In addition, while the officialholiday is only one day, some individuals continue to celebrate for up to three days. Hence, tospan the possible durations of the holiday, I examine periods following both a two day and afour day lag for the Eid holiday.
•All regressions include district-crop, district-year, crop-year, district, crop, and year fixed effects.In addition, time varying controls for average rainfall and temperature during the sowing andharvesting seasons, two month leads to each season, and a two month lag following the sowingseason are included.
•Robust standard errors clustered by district-year are in brackets.
• * p<0.1, ** p<0.05, *** p<0.01.
37

FIGURE I: Overlap Between Ramadan and Cropping Cycles, Calculation Examples
Notes: Agricultural years run from July 1 to June 30. A description of the overlap calculation procedure is providedin Section B.2.
38

FIGURE II: Rural Fraction Muslim Distribution
39

FIGURE III: Geographic Distribution of Muslims in India
Notes: Includes only the 270 districts included in the Indian Agriculture and Climate Dataset.
40

FIGURE IV: Production Declines by Fraction Muslim, Fitted Model
−.1
−.0
50
.05
Cha
nge
in P
rodu
ctio
n,F
ull O
verla
p w
ith R
amad
an
0 .05 .1 .15 .2Fraction Muslim
Overall average ln(q), sowing ln(q), harvestln(v), sowing ln(v), harvest
41

Appendix A Supplementary Tables and Figures

Table A.I: Overview of Data Sources
Data set Content Analysis Notes
(1) Indian Agriculture and Climate Dataset Annual agricultural production, prices, and inputs Output declines Crop calendar information is available for 18 of the 20 crops(World Bank) for 270 districts (85% of landarea) over 32 years for 20 crops
(2) 1967 Indian Crop Calendar District specific sowing and harvesting seasons for 18 crops Output declines Compiled by Donaldson (2013)
(3) University of Delaware Climate Resource Data 0.5 x 0.5 gridded monthly total rainfall and average temperature Output declines
(4) Ramadan Dates Start and end of Ramadan each year All Available online: http://www.timeanddate.com/holidays
(5) Indian Census (1961) The fraction of individuals of a given religion by district Heterogeneity in output declines
(6) British Atmospheric Data Center (BADC) and 0.5 x 0.5 gridding daily potential evapotranspiration Dehydration analysisClimatic Research Unit (CRU) Databases (PET, a measure of evaporative potential) and maximum temperatures
(7) National Sample Survey (NSS) Consumer expenditures on food, labor supply Labor supply and Consumer Expenditure (Schedule 1, Rounds 60, 62, 64);caloric intake analyses Employment (Schedule 10, Rounds 43, 60, 61, 62, 64, and 66)
(8) International Crops Research Institute for the Semi-Arid Labor supply Labor supply analysisTropics (ICRISAT), Village Dynamics in South AsiaMicro-level Data, Second generation
Notes: This table provides a brief overview of the data used in the paper.
43

Table A.II: Summary Statistics for Crops in the Agricultural Analysis
(1) (2) (3) (4) (5) (6) (7)Mean Mean Percent of districts with Sowing Sowing Harvest Harvest
quantity value positive production start, SD end, SD start, SD end, SD
Bajra (pearl millet) 19.21 17.00 84.30 24.26 35.34 28.47 30.76Barley 12.36 10.93 90.63 15.27 19.26 18.83 17.57Cotton 3.97 9.93 77.65 41.95 45.38 57.05 59.64Groundnut (peanut) 21.33 39.70 98.82 32.54 38.20 31.64 35.49Gram (lentils, chickpeas) 22.56 29.60 100.00 13.73 18.93 22.44 21.54Jowar (sorghum) 39.58 35.67 92.15 50.28 57.05 52.80 54.62Jute 5.84 9.86 64.71 60.58 49.09 50.49 43.00Maize 17.86 15.03 99.26 31.46 33.32 34.96 33.70Other pulses 8.15 12.03 78.89 41.56 48.28 45.57 53.12Potato 21.06 11.70 86.67 62.43 62.22 58.49 58.56Ragi (finger millet) 1.05 0.93 13.10 41.87 50.75 40.67 56.26Rice 150.09 180.09 99.59 99.86 88.17 81.54 82.70Rapeseed and Mustard (oils) 3.59 8.11 94.55 17.80 19.73 24.71 23.47Sesamum (sesame) 1.35 3.79 99.16 50.95 54.10 46.92 52.71Sugar 47.67 63.68 98.52 88.36 102.80 65.04 67.13Tobacco 1.31 6.19 91.11 60.04 76.01 60.00 69.12Tur (pigeon pea) 8.98 13.49 88.98 27.29 25.45 48.01 39.47Wheat 107.72 108.72 99.05 10.57 16.05 19.95 21.34
Average 27.43 32.03 86.51 42.82 46.67 43.75 45.57
Notes: This table provides summary statistics for the crops used in this analysis.
• Production, Column (1), is in metric tons. Value, Column (2), is in 1,000,000 Rs deflated to 1973.
• Columns (4) through (7) provide the standard deviation of sowing and harvesting start and end dates to demonstrate thevariation in the timing of cropping seasons.
44

Table A.III: Within District Variation in Cropping Cycles
(1) (2) (3) (4)Sowing start Sowing end Harvest start Harvest end
Average SD 74 72 74 76Average Range 260 258 234 244
Notes: This table displays measures of the variation in the timing of croppingcycles for different crops within a district.
• The "Average Standard Deviation" is calculated as the standard deviationof the element of the cropping cycle listed at the top of the column withineach district averaged across all districts. Similarly, the "Average Range"is the range in the timing of that element of the cropping cycle within adistrict, averaged across districts.
•Roughly 7 percent of crop-district combinations have more than one croppingcycle per year. All cycles are included in these figures (as well as all analyses).
45

Table A.IV: Distribution of Fraction of Ramadan Covered by Sowing and Harvesting Seasons
Percentile Fraction of Ramadan Fraction of Ramadancovered by sowing covered by harvest
50 0.00 0.0075 0.00 0.0390 0.86 0.9395 1.00 1.0099 1.00 1.00
Mean 0.16 0.17N 103104 103104
Notes: This table provides distributional information for theprimary independent variable of interest; the fraction of Ra-madan covered by the labor-intensive portions of the croppingseason, sowing and harvesting.
• The sample utilized for this table matches that of the pri-mary specification listed in Table 9, Column (1).
46

Table A.V: Distribution of Muslims in Rural Areas
Percentile Percent of the populationthat is Muslim
1 0.15 0.310 0.725 2.150 4.675 8.890 15.395 27.199 42.1
Mean (district weighted) 7.2Mean (population weighted) 9.9
Notes: This table provides data on the fraction of the popu-lation that is Muslim in each district.
•Data in the table are drawn from the 1961 Indian Censusand based on the 270 districts in the Indian Agriculturaland Climate Dataset.
• The census disaggregates the district into rural and ur-ban areas. Given that the analysis examines agriculturalproduction, the data here are drawn from rural areasonly.
47
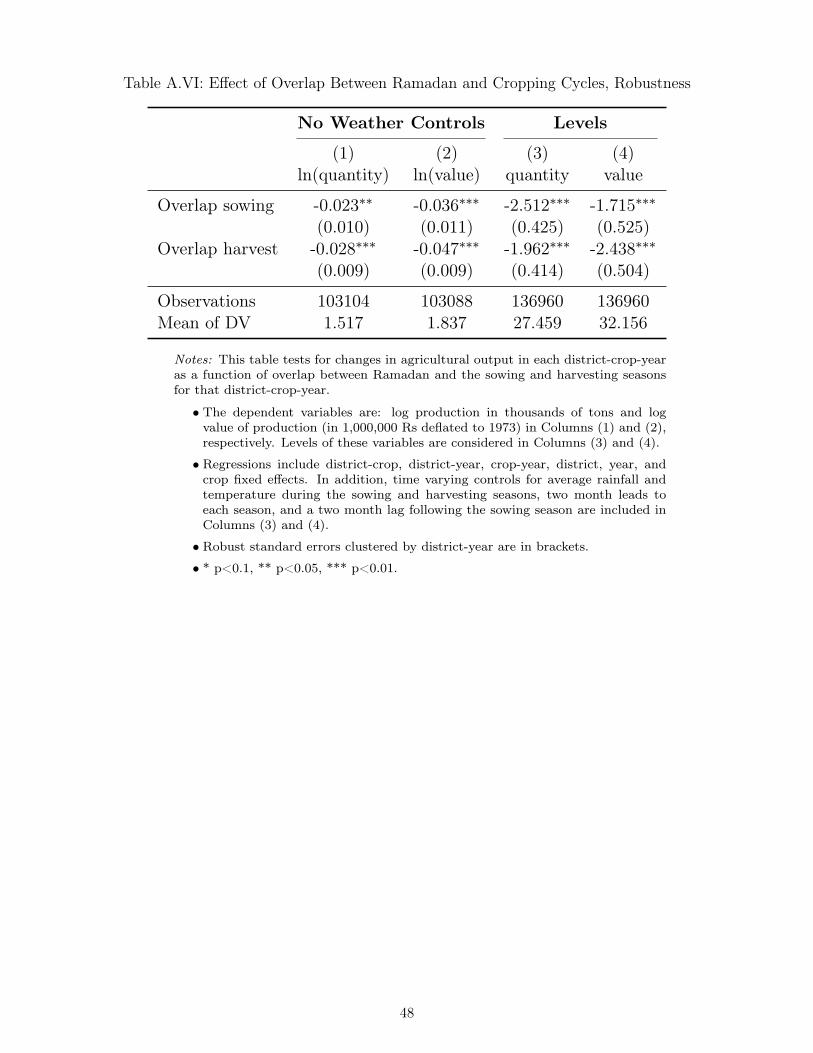
Table A.VI: Effect of Overlap Between Ramadan and Cropping Cycles, Robustness
No Weather Controls Levels
(1) (2) (3) (4)ln(quantity) ln(value) quantity value
Overlap sowing -0.023∗∗ -0.036∗∗∗ -2.512∗∗∗ -1.715∗∗∗
(0.010) (0.011) (0.425) (0.525)Overlap harvest -0.028∗∗∗ -0.047∗∗∗ -1.962∗∗∗ -2.438∗∗∗
(0.009) (0.009) (0.414) (0.504)
Observations 103104 103088 136960 136960Mean of DV 1.517 1.837 27.459 32.156
Notes: This table tests for changes in agricultural output in each district-crop-yearas a function of overlap between Ramadan and the sowing and harvesting seasonsfor that district-crop-year.
• The dependent variables are: log production in thousands of tons and logvalue of production (in 1,000,000 Rs deflated to 1973) in Columns (1) and (2),respectively. Levels of these variables are considered in Columns (3) and (4).
• Regressions include district-crop, district-year, crop-year, district, year, andcrop fixed effects. In addition, time varying controls for average rainfall andtemperature during the sowing and harvesting seasons, two month leads toeach season, and a two month lag following the sowing season are included inColumns (3) and (4).
• Robust standard errors clustered by district-year are in brackets.
• * p<0.1, ** p<0.05, *** p<0.01.
48

Table A.VII: Robustness: Labor Supply and Earnings as a Test of Religious Obligations Driving Production Declines (NSS)
Agricultural LaborersFull Year
Agricultural LaborersHigh Labor Demand Seasons
Rural Casual LaborersFull Year
Rural Casual LaborersHigh Labor Demand Seasons
(1) (2) (3) (4) (5) (6) (7) (8) (9) (10) (11) (12)Labordays
Totalearnings
ln(totalearnings)
Labordays
Totalearnings
ln(totalearnings)
Labordays
Totalearnings
ln(totalearnings)
Labordays
Totalearnings
ln(totalearnings)
Overlap*Muslim -0.013 2.986 0.011∗ -0.015 2.933 0.018∗∗ 0.017 1.797 0.005 0.005 3.178 0.013∗∗
(0.010) (2.083) (0.006) (0.017) (2.029) (0.008) (0.015) (1.861) (0.005) (0.022) (2.389) (0.006)Muslim 0.058∗∗ 51.685∗∗∗ 0.184∗∗∗ 0.099∗∗∗ 14.337∗∗∗ 0.072∗∗∗ 0.065 33.535∗∗∗ 0.140∗∗∗ 0.230∗∗∗ 20.324∗∗∗ 0.098∗∗∗
(0.024) (6.859) (0.024) (0.034) (4.655) (0.017) (0.047) (6.139) (0.016) (0.054) (7.139) (0.019)Overlap 0.003 -0.171 -0.001 0.001 0.282 0.001 -0.002 -1.468∗∗ -0.001 -0.000 -0.677 0.001
(0.004) (0.535) (0.003) (0.008) (0.767) (0.004) (0.009) (0.731) (0.002) (0.013) (1.166) (0.004)
Observations 395505 395510 123007 130154 130156 50742 174386 174386 138478 67377 67377 55951Mean of DV 6.007 135.623 5.727 5.931 142.412 5.610 4.863 306.767 5.727 4.962 289.329 5.633
Notes: This table provides a test of whether time spent on religious or social activities reduces production during Ramadan by decreasing the labor supplyof Muslims during this time. Given the somewhat coarse nature of the labor supply variable, the table also examines wages.
• Samples are drawn from the Indian National Sample Survey, Schedule 10 (Employment), rounds 60, 61, 62, 64, and 66. These rounds are selectedbecause they contain survey dates while earlier rounds do not. "Agricultural laborer" samples include only individuals who indicate that agriculturalwork is their primary or secondary occupation. The "Rural casual laborers" sample includes individuals living in rural areas who indicate that theyparticipate in the casual labor market. "Full year" samples include the full survey periods. "High Labor Demand" additionally restricts the samplesto surveys conducted during the sowing or harvesting seasons for the crop with the greatest acreage by state for the states included in the agriculturalcalendar.
•The NSS Schedule 10 provides data on labor supply (to the half day) and wages of the respondent during the week preceding the survey date. Laborsupply is calculated as the number of days of labor excluding domestic work in the past week. The wages variable is calculated as the sum of cashand in-kind wages during the week.
•All regressions include district-year fixed effects and month fixed effects.
•Robust standard errors clustered by district-year are in brackets.
• * p<0.1, ** p<0.05, *** p<0.01.
49

Table A.VIII: Labor Supply and Earnings as a Test of Religious Obligations Driving Production Declines (Icrisat)
Agricultural LaborersAll Seasons
Agricultural LaborersHigh Season
Full SampleAll Seasons
(1) (2) (3) (4) (5) (6) (7) (8) (9)Labordays
Average workhours
ln(totalearnings)
Labordays
Average workhours
ln(totalearnings)
Labordays
Average workhours
ln(totalearnings)
Muslim*Overlap 0.155∗ -0.003 0.002 0.142 -0.008 -0.007 0.180∗∗∗ -0.001 0.002(0.089) (0.011) (0.006) (0.142) (0.019) (0.008) (0.068) (0.006) (0.003)
Overlap -0.039 -0.002 -0.004∗∗∗ -0.024 -0.002 -0.006∗∗∗ -0.016 0.001 -0.002∗∗∗
(0.035) (0.001) (0.001) (0.038) (0.002) (0.001) (0.022) (0.001) (0.001)
Observations 31432 19417 19287 19481 12641 12520 72048 34267 33977Mean of DVmean 21.752 7.131 6.816 21.874 7.212 6.778 17.921 7.182 7.014
Notes: This table provides a test of whether time spent on religious activities reduces production during Ramadan by decreasing the laborsupply of Muslims during that period.
• Samples are drawn from the second generation ICRISAT village level studies survey. "Agricultural Laborers" samples include onlyindividuals who indicate that agricultural work is their primary occupation. "Agricultural Laborers, High Season" samples includeobservations from individuals in the "Agricultural Laborers" sample for which the interview period had at least 15 days of overlap witha "high labor demand" period, defined as the sowing or harvesting seasons for the crop with the greatest acreage by state. The "Full"sample includes all individuals in the sample.
• ICRISAT surveys participants approximately once per month and elicits information on labor supply, hours, and wages of the respondentduring the month preceding the survey date. The number of days of overlap between Ramadan and the survey period is calculated asthe number of days of Ramadan falling within the 30 days preceding the survey date. Labor supply is defined as the number of daysof labor including both paid and unpaid labor but excluding domestic work in the past month. The wages variable is calculated as thesum of cash and in-kind wages during the month. Average hours worked is only reported for paid labor. If the participant reports morethan one paid job, average hours worked is calculated as a weighted average across jobs. Religion is captured via the caste variable,which contains a category for Muslim individuals, because it is not directly reported.
•All regressions include individual fixed effects, a control for the number of days between surveys, and year-month of interview fixedeffects.
•Robust standard errors clustered by individual are in brackets.
• * p<0.1, ** p<0.05, *** p<0.01.
50

Appendix B Additional Information for Reference
B.1 Literature – The Impact of Caloric Intake on Economic Productivity
There has been significant interest in the effect of caloric intake on productivity and labor marketoutcomes for many years. The earliest of these studies, relying on quasi-exogenous changes in caloricintake among men working at various tasks (e.g. coal mining, embankment construction) during wartime, found that caloric availability was positively correlated with output (Kraut and Muller, 1946).Strauss (1986) improved on these correlational studies by utilizing a vector of food prices, farm assets,and household demographic characteristics to instrument for average caloric intake per adult equivalent toestimate a farm production function in Sierra Leone. The estimated production function showed a strongpositive relationship between caloric consumption and farm production, with higher returns at lower levelsof consumption. Yet, given the relatively high price of calories and the levels of caloric intake in SierraLeone, the increased productivity did not account fully for the cost of the additional calories for the medianindividual. Using panel data from southern India to estimate both wage equations and farm productionfunctions with individual fixed effects, Deolalikar (1988) found no significant impact of caloric intake onwages or farm output once stature (weight for height) was accounted for.
Three additional studies have also examined the impact of adult caloric supplementation on productiv-ity through experimental methods in an effort to address the endogeneity of caloric consumption. Imminkand Viteri (1981a,b) find no significant change in production when treated participants were provided withan additional 350 calories per day. However, due to logistical constraints, this experiment relied on twovillages randomized at the level of the village. In addition, laborers in this study worked in groups of fourand were paid one quarter of the group’s total production, potentially weakening individual incentives.Wolgemuth et al. (1982) were able to randomize at the level of the individual and provided the treatedindividuals with an additional 800 calories per day relative to the control group. Because participantsin this study were construction workers, productivity was estimated by visual inspection of the quantityof earth moved and required adjustments of productivity measures to account for differences in outputacross types of tasks.11 Although production per day showed a small marginally significant increase in theintention to treat estimate, the number of days worked on the roads project declined significantly amongtreated individuals, making an overall assessment of economic productivity changes difficult. Finally, inmore recent work Schofield (2018) supplements the caloric intake of cycle-rickshaw drivers in India by 700calories per day for approximately one month. Relative to control workers who received the equivalentvalue in cash, the treated drivers increased labor supply and income by approximately 10 percent by thefinal week of the study.
B.2 Calculating the Overlap between Ramadan and Agricultural Seasons
Data in the India Agricultural and Climate dataset is organized by the agricultural year running fromJuly 1 of year X to June 30 of year X+1. To calculate the overlap between the sowing and harvestingseasons and Ramadan, I first organize the crop calendar relative to the agricultural year such that an
11The specific compensation method for workers is not explicitly stated in the paper. Wages are mentioned, however, thestructure of the wages is not. Given that the labor provided was for a public works project, it is likely that there was simplya flat days wage for work on the project such that workers most likely faced relatively weak incentives.
51

agricultural cycle for agricultural year X is defined by the seasons leading up to a harvest which occurs inagricultural year X.12 This calendar is then overlaid with the Ramadan dates during the agricultural yearof interest as well as the preceding year to account for extended agricultural cycles and harvests whichoccur early in the agricultural year. For example, the cropping cycle for sugar cane is typically between oneand two years such that for a harvest occurring in agricultural year X, the sowing season typically occursin year X-1. Similarly, if a harvest were to occur in July of agricultural year X, the sowing season wouldtypically occur in year X-1. However, the overlap between these sowing seasons and the previous year’sRamadan would be assigned to the year in which the harvest occurred to coincide with the productiondata in the India Agricultural and Climate data.
In addition, because certain crops (e.g. rice, potatoes) frequently have more than one agriculturalcycle per year, I calculate the days of overlap between each season (i.e. sowing, harvesting) and Ramadanfor each cycle and then sum across the cycles ending in the same agricultural year. Finally, this totalnumber of days of overlap is divided by 29, the number of days in Ramadan.13 Figure I provides exampleoverlap calculations and Table A3 provides the distribution of overlap between Ramadan and each of theagricultural seasons.
B.3 Calculating Rainfall and Average Temperature Controls
Although the Indian Agricultural and Climate dataset contains information on rainfall and temper-ature, the values are averages across all years. Hence, I use the University of Delaware data to providetime varying controls for rainfall and temperature. Because each crop is likely to be impacted differentlyby rainfall and temperature in a given month, instead of using weather controls by calendar month Icreate rainfall and temperature relative to the sowing and harvesting seasons for each crop. Specifically,the regressions control for the total rainfall and average temperature over the two months preceding eachseason, during the season itself, and for the two months following the sowing season at the centroid of eachdistrict. Because the rainfall and temperature data are provided as a monthly series, these variable arecalculated as weighted averages created by summing the number of days in each month for the relevantperiod (e.g. sowing season) multiplied by the monthly value and dividing the total by the total number ofdays. Missing values are replaced with imputed values generated from a regression of existing values ondistrict-crop and year fixed effects.
B.4 Calibrating Declines in Agricultural Productivity: “Free Energy” Available forWork
Adjustments to basal metabolic rates and energy use outside of work limit the precision of “freeenergy” calibrations. However, it is possible to calculate a measure of expected “possible” productionbased on caloric availability in order to determine whether the observed declines in productivity are roughly
12For harvest seasons which overlap two agricultural years I assign the crop cycle to the year in which the majority of theharvest falls. Because some crops such as sugar cane have very long growing cycles, production accrued in year X can beginwith a sowing season up to roughly 1.5 years earlier.
13The exact dates of Ramadan depend on the sighting of the crescent moon. However, data are not available on when themoon is sighted in each district. Hence, I use a consistent start date for the holiday across all of India for each year and limitthe duration of the holiday to 29 days (rather than the possible 30) to generate conservative estimates and ensure that I donot measure overlap with Eid, the holiday following Ramadan.
52

congruent with expectations based on energy availability. Rural residents in India were consuming roughly2240 calories per day in 1983 (Deaton and Drèze, 2009). Researchers have measured the basal metabolicrates (BMR) of rural populations in southern India and have determined that typical basal metabolicrates for low BMI individuals require approximately 1,100 and 1,400 calories per day depending on sizeand gender (Ferro-Luzzi et al., 1997). Taking the lowest BMR estimates, the strong assumption that allcalories not used in basal metabolism are used productively, and the estimated decline in caloric intakefor Muslims during Ramadan, individuals have 1140 calories available for work when not fasting and 440available calories for work when fasting. Passmore and Durnin (1955) review a variety of sources acrossfive countries detailing energy expenditures in different agricultural activities and find that sowing seasonactivities such as clearing brush, digging ridges, and ploughing typically require 4 to 9 calories per minutewhile harvesting activities such as bundling and threshing typically require 3 to 7 calories per minute.Hence, farm work is likely to burn roughly 180 to 540 calories per hour. Taking an estimate from themiddle of this range of roughly 350 calories per hour, a typical farmer would be able to complete roughly4 hours of active labor when not fasting and 2 hours of active labor when fasting. Accounting for thefact that some energy can be mobilized from fat reserves, these estimates suggest the observed declines inproductivity per Muslim individual are consistent with the free energy available.
B.5 Calibrating Expected Water Losses During Ramadan
Perspiration rates depend on a number of factors, key among which are the intensity of the physicalactivity and factors which influence evaporation rates (i.e., temperature, vapor pressure). The intensityof physical activity can be approximated via the rate at which calories are burned in the activity and theweather variables can be measured directly. A 50 kg individual would be expected to burn approximately1200 calories in a day of hard farm work during the active labor seasons (Fluck, 1992; Nag et al., 1980). Inorder to benchmark the expected perspiration rates, I compare this energy usage to the energy consumedby running, one of the most commonly studied activities in which perspiration rates are measured, insimilar weather conditions. Rehrer and Burke (1996) reviews the literature and finds that accounting forwater intake, running a marathon typically results in a loss of approximately three percent of body weight.Although predicted rather than measured, Sawka et al. (2007) estimate that in temperatures similar tothose likely to be experienced by farmers in India running a marathon would result in a loss of four tofive percent of body weight.14 However, running a marathon requires roughly 2500 calories for a 50 kgindividual, twice the energy required for a day of intensive farm labor. Hence, one would expect roughlyhalf the water losses for farming as well, suggesting an overall loss of roughly 1.5 to 2.5 percent in bodyweight. However, two additional factors are likely to reduce sweat rates relative to this benchmark. First,the lower rate of caloric burn for farming will reduce sweat production due to greater passive cooling andless “wasted” sweat lost to dripping (Candas et al., 1979; Shapiro et al., 1982). Second, a higher surfacearea to mass ratio (negatively correlated with BMI), lower overall weight, low body fat percentage, and
14This prediction is based on an ambient temperature of 28C, or approximately 82F. The overall mean temperature in thedistricts included in this study during sowing and harvesting periods was 27 and 24 degrees Celsius respectively (Universityof Delaware (2013), author’s calculations). Although based on a more limited sample, the mean daily maximum temperatureover the sowing and harvesting periods was 31 and 29 degrees C, respectively (Climatic Unit Research Database at theBritish Atmospheric Data Center (BADC), author’s calculations.
53

acclimatization to heat all improve core body temperature management and substantially reduce sweatrates in hot humid climates (Havenith et al., 1995; Havenith, 2001; Casa, 1999b). This suggests thatIndian farmers are likely to have relatively low sweat rates relative to many individuals in the studies citedpreviously due to their small size, very low body fat percentage, and acclimatization to hot temperatures.Hence, it is unlikely that the two percent of body weight threshold at which decrements in performancebegin to be observed is surpassed for a significant number of farmers during Ramadan.
54