RAM HOLDINGS LTD - American Overseas Group...
68
RAM HOLDINGS LTD. 2009 ANNUAL REPORT
Transcript of RAM HOLDINGS LTD - American Overseas Group...

RAM HOLDINGS LTD.
2009 ANNUAL REPORT

RAM Holdings Ltd.
TABLE OF CONTENTS Letter from President and CEO ..................................................................................................................................... 1 Business ......................................................................................................................................................................... 2 Selected Five Year Financial Data................................................................................................................................. 4 Management’s Analysis of Results of Operations ......................................................................................................... 6 Audited Financial Statements ...................................................................................................................................... 10
Report of Independent Auditors .................................................................................................................... 11 RAM Holdings Ltd. Consolidated Balance Sheets December 31, 2009 and 2008 ........................................ 12 RAM Holdings Ltd. Consolidated Statements of Operations ........................................................................ 13 RAM Holdings Ltd. Consolidated Statements of Comprehensive Income (Loss) ........................................ 14 RAM Holdings Ltd. Consolidated Statements of Shareholders’ Equity and Retained (Deficit) ................... 15 RAM Holdings Ltd. Consolidated Statements of Cash Flows ...................................................................... 16 RAM Holdings Ltd. Notes to Consolidated Financial Statements ................................................................ 17
Directors and Executive Officers Information ............................................................................................................. 61

1

Business
RAM Holdings Ltd., RAM Holdings II Ltd and RAM Reinsurance Company Ltd (“RAM Re”), collectively the “RAM Re Group of Companies”, were incorporated on January 28, 1998, under the laws of Bermuda. RAM Holdings Ltd and RAM Holdings II Ltd, the owners of all of the voting and non-voting common shares of RAM Re, entered into an amalgamation (merger) agreement pursuant to which the two companies amalgamated as of May 1, 2006. Upon completion of the amalgamation, all of the common shares of RAM Re are held by RAM Holdings Ltd. (“the Company” or “RAM Holdings”), the amalgamated entity of RAM Holdings Ltd. and RAM Holdings II Ltd.
On May 2, 2006, the Company completed an initial public offering (“IPO”), and the Company’s common shares were traded on the NASDAQ Global Market under the symbol of “RAMR”. Effective May 14, 2009, the Company’s common shares were voluntarily delisted from the NASDAQ Global Market and thereafter trades on the Pink Sheets. In addition, the Company obtained a primary listing on the Bermuda Stock Exchange effective May 14, 2009.
RAM Re is a Bermuda-based company whose principal activity is the reinsurance of financial guarantees of public finance and structured finance debt obligations insured by monoline financial guaranty companies (the “primary insurers” or the “primaries”). We refer to the primaries that reinsured with RAM Re as “ceding companies”. RAM Re provided reinsurance through treaty and facultative agreements that it maintains with each of its remaining customers. Financial guaranty reinsurance written by RAM Re generally provided for guarantees of scheduled principal and interest payments on an issuer’s obligation in accordance with the obligation’s original payment schedule and, in rare circumstances, such amounts are payable on an accelerated basis.
Recent developments
The unprecedented deterioration in the U.S. housing market since the latter half of 2007 and the resulting lack of liquidity in the capital markets has had a substantial adverse impact on the financial guaranty industry generally and the Company in particular. As a result of these adverse developments and the downgrades and subsequent withdrawal of the Company’s ratings by Standard & Poor’s Ratings Services (“S&P”) and by Moody’s Investors Service (“Moody’s”), the Company wrote only a modest amount of new financial guaranty reinsurance business in 2008 and have not renewed its reinsurance treaties with the primaries or written any new financial guaranty business in 2009. The Company will not reenter the financial guaranty business and has no current plans to write any other type of business.
Business strategy
In response to the economic and rating events referenced above, the Company continued its efforts through 2009 which it began in 2008 to reduce the volatility of its insured portfolio, to reduce its insured risk exposure, to preserve its capital position, to deleverage its balance sheet and to reduce its expenses. Going forward, the Company intends to pursue a run off plan that includes the following:
• Insured portfolio run off: The Company commuted its entire insured portfolio assumed from Syncora Guaranty Re Ltd., MBIA Insurance Corporation, and Ambac Assurance Corporation effective July 25, 2008, November 30, 2008, and April 8, 2009, respectively, along with other smaller commutations throughout 2008 and 2009. There have been no further commutations since December 31, 2009, and the Company does not intend to initiate commutation discussions in the future although may consider offers made by its ceding companies at acceptable prices. In addition, the Company is pursuing legal actions against its ceding companies in cases where the Company disputes the validity of cessions made under its treaties or ceded losses. The Company is continuing to run off its existing book of business, which could take many years to accomplish as the longest stated remaining maturity of insured risk in its insured portfolio is approximately 58 years. The run off could be completed sooner if the insured portfolio is recaptured by the ceding companies prior to such maturity.
• Capital preservation: The Company reduced its new business growth in 2008 and has not written any business in 2009. The Company will not write new financial guaranty reinsurance business and has no current plans to write any other type of insurance or reinsurance business.
2

• Deleveraging and Dividends: During the first half of 2009, the Company completed a common share repurchase program and repurchased $5.0 million of its Senior Notes due 2024 (“Senior Notes”). During the first quarter of 2010, the Company completed a tender offer for its Non-Cumulative Preference Shares, Series A (the “Series A Preference Shares”), pursuant to which 15,300 shares were tendered out of the 75,000 shares outstanding; the Series A Preference Shares are mandatorily redeemable in 2066. The Company also repurchased $10.0 million of its Senior Notes during the first quarter of 2010. In addition, during the first quarter of 2010, RAM Re completed a tender offer for its perpetual Class B Preference Shares (the “Class B Preference Shares” and, together with the Series A Preference Shares, the “Preference Shares”), pursuant to which 68.00 shares were tendered out of the 500.01 shares outstanding. The Company expects that these first quarter transactions will result in approximately $15.4 million of net gain to the consolidated financial statements in the period ended March 31, 2010.
The Company does not intend to initiate any further repurchases of these securities. The dividends on both the Series A Preference Shares and the Class B Preference Shares, which are noncumulative in the case of the Series A Preference Shares and are generally noncumulative in the case of the Class B Preference Shares, were suspended in 2009. The Company is not permitted under the terms of the Series A Preference Shares to pay common share dividends or repurchase common shares unless full dividends for the latest completed dividend period on all Series A Preference Shares have been paid. Accordingly, the Company has no plans to liquidate, to pay common share dividends or to repurchase any of its common shares.
• Reducing expenses: In order to reduce its expenses during 2009, the Company has de-listed from NASDAQ and de-registered its securities under the Securities Exchange Act of 1934. As a result the Company is no longer required to file annual, quarterly and current reports or proxy statements with the U.S. Securities and Exchange Commission. The Company estimates that these actions will reduce its expenses by at least $2 million per year beginning in 2010. On March 17, 2009, the Company requested that Moody’s Investor Service (“Moody’s”) withdraw its financial strength rating of RAM Re, and on May 20, 2009, the Company also requested that Standard & Poor’s Rating Services (“S&P) withdraw its financial strength rating of RAM Re, which has resulted in the Company no longer paying annual fees to these agencies. RAM Re cancelled its bank soft capital facilities effective May 13, 2009, which provided capital for rating agency purposes only. In addition, at the Annual General Meeting in December 2009 the shareholders approved reductions in the size of both the RAM Holdings and RAM Re Boards to five members from eleven. The Company also completed a number of redundancies throughout 2009 and the beginning of 2010 to reduce staff costs. The Company continues to evaluate other measures to reduce expenses to a level that is appropriate for its run-off status.
There can be no assurance that the strategies that have been implemented or that will be pursued in the future will improve the Company’s business, financial condition, liquidity or results of operations or will not have a material adverse effect on the Company.
3

Selected Five Year Financial Data
The following financial information for the five years ended December 31, 2009, has been derived from RAM’s Financial Statements:
As of and for the Year Ended December 31,(1)
Consolidated
2009 Consolidated
2008 Consolidated
2007 Consolidated
2006 Combined
2005 (Dollars in thousands, unless indicated otherwise) Statement of Operations Data: Net earned premiums .................................................... 26,735 68,577 51,005 44,292 39,036 Net change in fair value of credit derivatives .............. 38,780 7,968 (171,806) 3,190 (157) Net investment income ................................................. 14,904 29,307 33,148 24,236 18,201 Net realized investment gains (losses) ......................... 3,810 (2,356) (3,604) (1,002) (1,583) Net gain on extinguishment of debt 3,403 — — — —Net unrealized gain (loss) on other financial instruments
................................................................................. (1,197) 7,754 35,330 — — Total revenues ......................................................... 86,435 111,250 (55,927) 70,716 55,497
Loss and loss adjustment expenses .............................. 20,684 214,828 48,026 (2,781) 7,204 Acquisition expenses .................................................... 18,540 30,576 18,418 16,315 14,424 Operating expenses ....................................................... 17,526 16,930 13,373 13,379 11,531 Interest expense ............................................................ 2,504 8,375 8,375 2,750 2,750
Total expenses ......................................................... 59,254 270,709 88,192 29,663 35,909 Net income (loss) .......................................................... $ 27,181 $ (159,459) $ (144,119) $ 41,053 $ 19,588 Non-controlling interest – dividends (922) — — — — Net income (loss) available to common $ 26,259 $ (159,459) $ (144,119) $ 41,053 $ 19,588 Earnings per share ........................................................
Basic ........................................................................ 0.98 (5.85) (5.29) 1.53 0.76 Diluted ..................................................................... 0.98 (5.85) (5.29) 1.53 0.75
Balance Sheet Data: Investments and cash .................................................... $ 357,976 $ 438,938 $ 717,037 $ 620,578 $ 475,978 Reinsurance balance receivable 22,345 1,115 3,645 3,464 1,988 Deferred acquisition costs ............................................ 61,900 74,795 87,304 73,838 66,220 Total assets ................................................................... 457,826 574,282 860,265 711,843 553,498 Reserve for losses and loss adjustment expense .......... 55,672 95,794 63,798 14,506 16,595 Unearned premiums ...................................................... 153,430 158,594 239,957 192,641 163,769 Unsecured senior notes ................................................. 35,000 40,000 40,000 40,000 40,000 Redeemable preference shares ..................................... 75,000 75,000 75,000 75,000 — Derivative liability ........................................................ 50,135 85,354 180,589 1,621 1,737 Total liabilities .............................................................. 373,906 484,924 607,953 332,576 230,842 Accumulated other comprehensive (loss) income ....... 7,400 6,331 10,888 (5,497) (4,540) Non-controlling interest Class B preference shares 8,114 — — — — Shareholders’ equity ..................................................... 75,806 89,358 252,313 379,267 322,656 Equity………………………………………………… 83,920 89,358 252,313 379,267 322,656 Book value per share .................................................... $ 2.88 $ 3.28 $ 9.26 $ 13.93 $ 12.47
(1) Financial statement information included is on a consolidated basis for December 31, 2009, 2008, 2007 and 2006. Prior to that financial information is
presented on a combined basis. See Note 1 in the audited financial statements. Certain reclassifications have been made to the prior year’s amounts to conform to the current year’s presentation.
4

As of and for the Year Ended December 31, 2009 2008 2007 2006 2005 (Dollars in thousands, unless indicated otherwise) Financial Ratios (Based on U.S. GAAP Income
Statement Data): Loss and loss adjustment expense ratio1 ........................... 77.4% 313.3% 94.2% (6.3)% 18.5% Acquisition expense ratio2 ................................................. 69.3% 44.6% 36.1% 36.8% 37.0% Operating expense ratio3 .................................................... 65.6% 24.7% 26.2% 30.2% 29.5% Combined ratio4 ................................................................. 212.3% 382.6% 156.5% 60.7% 85.0% Non-GAAP Supplemental Data: Net par outstanding (in millions) ...................................... 20,361 29,957 45,394 31,119 27,054 Net debt service outstanding (in millions) ........................ 32,601 50,737 71,911 50,944 41,535 1 Calculated by dividing loss and loss adjustment expenses by net earned premiums 2 Calculated by dividing acquisition expenses by net earned premiums 3 Calculated by dividing operating expenses by net earned premiums 4 Loss, acquisition and operating expense ratio may not total combined ratio due to rounding
5

Management’s analysis of results of operations
Year ended December 31, 2009, compared to December 31, 2008:
Net income available to common shareholders: Net income available to common shareholders for the full year 2009 was $26.3 million, or net income of $0.98 per diluted share, compared to a net loss of $159.5 million, or a net loss of $5.85 per diluted share, for the full year 2008.
The net income available to common shareholders of $26.3 million for the year ended December 31, 2009, was primarily due to the following factors:
• Unrealized gains on credit derivatives of $34.5 million, primarily due to the narrowing credit spreads in the market resulting in a decrease in gross unrealized losses. Gross unrealized losses on credit derivatives were offset by the adjustment for RAM's own non-performance risk in accordance with fair value accounting standards. The effect of this adjustment for RAM’s own non-performance risk was a reduction in RAM's derivative liability of approximately $146.8 million at December 31, 2009.
• These gains are offset by loss and loss adjustment expenses of $20.7 million during the year ended December 31, 2009. These losses are primarily the result of continued adverse developments on RAM's exposure to insured transactions with U.S. residential mortgage-backed security (“RMBS”) exposures, particularly subprime, Home Equity Lines of Credit (“HELOC”) and Alt-A transactions from the 2005 – 2007 vintages.
Net loss of $159.5 million for the year ended December 31, 2008, was primarily due to the following factors: • Loss and loss adjustment expenses of $214.8 million during 2008 primarily associated with the deterioration in
the performance of reinsured RMBS and ABS CDOs. Included in the loss and loss adjustment expenses in 2008 was a net loss on commutations of $45.9 million (see “Commutations” below).
• Unrealized gains on credit derivatives of $94.3 million for the year ended December 31, 2008, were a result of (i) a decrease in net unrealized losses of $203.3 million due to the adjustment for RAM’s own non-performance risk under fair value accounting, (ii) a reduction in unrealized losses in 2008 of $232.0 million due to the commutations with XLFA and MBIA, offset by (iii) an increase in unrealized losses due to the deterioration in subprime mortgage assets and the corresponding widening credit spreads in the market during 2008. The unrealized gains on credit derivatives in 2008 were reduced by the realized losses of $86.3 million primarily relating to the payments made to XLFA and MBIA on commutations (see “Commutations” below).
Commutations:
The following commutations were completed during the years ended December 31, 2009 and 2008 which affected net income as follows:
Ambac commutation On April 7, 2009, RAM Re entered into a commutation agreement (the “Ambac Commutation Agreement”) with Ambac Assurance Corporation and its affiliate (“Ambac”). The Ambac Commutation Agreement provided, among other things, for RAM Re to pay a $97 million settlement payment and $1.3 million of claims payments, by means of a release to Ambac of securities in Ambac’s trust account valued at $97.8 million and a cash payment of $0.5 million, to commute the entire $6.8 billion insured portfolio assumed from Ambac, and for each party thereto to release the other party from all liabilities and obligations under all reinsurance agreements between the parties. The securities in the trust account and cash payment were received by Ambac, and the releases set forth in the Commutation Agreement became effective on April 8, 2009.
The effect of the Ambac commutation on the Company’s results of operations was to (i) reduce gross written premiums and unearned premiums by $155.5 million, resulting in no impact on earned premiums and (ii) decrease loss and loss adjustment expenses by $8.7 million, resulting in an overall gain to net income at the time of commutation of $8.7 million.
6
MBIA commutation
Effective November 30, 2008, RAM Re entered into a Commutation Agreement with MBIA Insurance Corporation and its affiliates (“MBIA”), to commute its entire portfolio of business previously assumed from MBIA back to MBIA. As consideration for the commutation RAM Re paid MBIA $156.5 million. The commutation reduced the outstanding par amount of the Company’s insured portfolio by $10.6 billion, including $439.3 million of collateralized debt obligations of asset-backed securities (“ABS CDOs”) (all structured as credit derivatives), $2.4 billion of collateralized debt obligations of commercial mortgage-backed securities (“CMBS CDOs”) and $453.0 million of 2005 - 2008 vintage U.S. RMBS.
The effect of the MBIA commutation on the Company’s results of operations was to (i) reduce gross written premiums and unearned premiums by $36.4 million, resulting in no impact on earned premiums (ii) increase net change in fair value of credit derivatives by a gain of $110.7 million, and (iii) increase loss and loss adjustment expenses by a loss of $61.4 million, resulting in an overall gain to net income at the time of commutation of $49.3 million.
XLFA commutation
On July 25, 2008, RAM Re entered into a Commutation Agreement with Syncora Guaranty Re (formerly XL Financial Assurance Ltd.) (“XLFA”), whereby RAM Re transferred all business previously ceded to RAM Re by XLFA back to XLFA and each of RAM Re and XLFA released each other from claims under the reinsurance agreements. As consideration for the Commutation Agreement, RAM Re paid $94.4 million to XLFA. The transaction reduced the par amount of RAM Re’s insured portfolio by $3.5 billion of which $711 million related to 2005 - 2007 vintage ABS CDOs (all structured as credit derivatives) and $280 million of 2005 - 2007 vintage RMBS.
The effect of the XLFA commutation on the Company’s results of operations was to (i) reduce gross written premiums by $11.4 million, (ii) increase net earned premiums by $1.1 million, (iii) increase net change in fair value of credit derivatives by a gain of $26.0 million, (iv) reduce loss and loss adjustment expenses by a gain of $15.5 million and (v) increase acquisition expenses by $0.3 million, resulting in an overall gain to net income of $42.3 million.
Other commutations
During 2009, the Company completed two other commutations with ceding companies and a retrocessionaire, reducing net outstanding par exposure in RAM Re’s insured portfolio by $0.3 billion for net payments totaling $0.9 million. The effect of these commutations on the Company’s income statement was to (i) decrease gross written premiums and unearned premiums by $1.1 million and (ii) decrease ceded reinsurance premiums and prepaid reinsurance premiums by $1.0 million with no impact on earned premium, (iii) increase net change in fair value of credit derivatives by a gain of $0.9 million, and (iv) increase paid losses by $1.0 million, resulting in an overall reduction to net income of $0.1 million.
During the second quarter of 2008, the Company entered into partial commutation agreements with two of the Company’s primary insurers. Under these agreements, $1.0 billion in par outstanding of insurance policies previously reinsured by the Company was commuted back to the primary insurers. All the Company’s obligations with respect to these policies were terminated on commutation. The Company paid $7.1 million in consideration of these commutations. The effect of these commutations on the Company’s income statement was to reduce (i) gross written premiums by $10.2 million, (ii) net earned premiums by $1.8 million and (iii) acquisition expenses by $0.6 million, giving an overall reduction to net income of $1.2 million. In December 2008, RAM Re commuted a further $158.3 million in par outstanding on two policies with another primary insurer. One policy was a partial commutation of $41.8 million par outstanding on a 2007 subprime RMBS whereas RAM Re’s total obligations on the second policy were terminated fully. The commutation payment of $3.1 million reduced the total loss reserve accordingly.
Net Earned Premiums: Net earned premiums in 2009 of $26.7 million were 61% lower than the $68.6 million earned in 2008. By eliminating accelerated premiums from refundings of $10.6 million from total earned premiums, normal earned premiums in 2009 were $16.1 million, 64% lower than the comparative 2008 period, which included accelerated premiums from refundings of $23.7 million. The decline in the 2009 earned premiums after refundings primarily reflected the reduction in ongoing earnings due to the commutation of treaties with three of the Company’s
7

ceding companies during 2008 and 2009, along with the change in earnings following the adoption of the new accounting for Financial Guarantee Insurance Contracts (“ASC 944-20”) on January 1, 2009.
Net Change in Fair Value of Credit Derivatives: Net change in fair value of credit derivatives consists of the following relating to our credit derivative policies:
Years ended December 31,
2009 2008 Change in fair value of credit derivatives:
Credit derivative premiums received and receivable $ 7,720,462 $ 12,418,183 Expenses on credit derivatives (3,343,075) (3,556,593 ) Losses and loss adjustment expenses (87,571) (95,181,459 )
Realized (losses)/gains and other settlements 4,289,816 (86,319,869 )
Unrealized gains 34,490,512 94,288,456
Net change in fair value of credit derivatives $ 38,780,328 $ 7,968,587
Net change in fair value of credit derivatives totaled a gain of $38.8 million in 2009, which was $30.8 million above the $8.0 million in 2008. Net change in fair value of credit derivatives for the years ended December 31, 2009, and 2008 were comprised of $34.5 million and $94.3 million of unrealized gains on derivatives, respectively, and $4.3 million and $(86.3) million of realized gains (losses), respectively. Gross unrealized losses on credit derivative policies decreased in 2009 primarily due to the narrowing of credit spreads in the market. The unrealized gains in 2008 were primarily the result of a reduction in unrealized losses in 2008 of $232.0 million due to the commutations with XLFA and MBIA, offset by an increase in unrealized losses due to the deterioration in subprime mortgage assets and the corresponding widening credit spreads in the market during 2008. Gross unrealized losses on credit derivatives in 2009 and 2008, were offset by the adjustment for RAM's own non-performance risk in accordance with fair value accounting standards. The effect of this adjustment for RAM’s own non-performance risk was a reduction in RAM's derivative liability of approximately $146.8 million and $203.3 million at December 31, 2009 and 2008, respectively.
Realized (losses) gains and other settlements consists of credit derivative premiums received and receivable, which represents premium income relating to credit default swap policies (net of acquisition expenses) and loss and loss adjustment expenses on those policies. Included within realized gains and other settlements were premiums received and receivable of $7.7 million in 2009, a decrease of $4.7 million from the $12.4 million in 2008. The decrease is primarily related to the reduction in the Company’s insured portfolio following the commutations discussed above. In 2008 these premiums received were reduced by the realized losses of $95.2 million primarily relating to the payments made to XLFA and MBIA on commutations (see “Commutations” above). Net Investment Income: Net investment income for 2009 was $14.4 million, 51% below the $29.4 million recorded in 2008. The decrease in investment income in 2009 over the prior year’s comparative period was primarily the result of a decrease in cash and invested assets due to payments on commutations in 2008 and 2009 totaling $350.8 million, along with a decrease in the book yield on the invested assets from 4.5% to 3.7%. Net Realized Gains on Investments and Net Other-Than-Temporary Impairment Losses: Net realized gains on investments for the year ended December 31, 2009, were $8.9 million compared to $8.1 million for the comparative 2008 period, offset by other-than-temporary impairment losses of $5.1 million and $10.5 million, respectively.
During the year ended December 31, 2009 and 2008, the Company recognized other than temporary impairments (“OTTI”) of $5.1 million and $10.5 million respectively. During 2009, the Company recognized $0.9 million relating to an investment with subprime exposure, the fair value of this investment was $0.3 million at December 31, 2009, and a credit loss of $0.1 million was taken on another bond with subprime exposure, the fair value of this security was $0.1 million at December 31, 2009. OTTI of $2.0 million was recognized on securities which the Company had the intent to sell in the period and a loss of $2.1 million was recognized on a corporate bond which the Company believed to be other than temporarily impaired in the first quarter of 2009. On implementation of new guidance issued by the Financial Accounting Standards Board (“FASB”) on OTTI during the second quarter of 2009, $1.9 million of this OTTI was reversed through retained earnings to leave only the credit portion of the loss in retained earnings. During the year ended December 31, 2008, four securities were other than temporarily impaired,
8
two of which were corporate bonds that realized a total of $8.2 million of losses and two were bonds with subprime exposure realizing losses of $2.3 million.
Net Gain on Extinguishment of Debt: On April 24, 2009, the Company purchased $5.0 million of its $40.0 million unsecured senior notes (the “Senior Notes”) for $1.6 million, realizing a gain of $3.4 million. The Senior Notes that were repurchased were cancelled immediately after such repurchase.
Loss and Loss Adjustment Expenses: Loss and loss adjustment expenses for the year ended December 31, 2009, were $20.7 million, contributing to a loss ratio of 77%. This loss ratio is primarily the result of continued adverse developments on RAM's exposure to insured transactions with residential mortgage-backed security (“RMBS”) exposures, particularly subprime, Home Equity Lines of Credit (“HELOC”) and Alt-A transactions from the 2005 – 2007 vintages. For the year ended December 31, 2008, loss and loss adjustment expenses were $214.8 million, or a loss ratio of 313%. This loss was primarily due to a net loss on commutations with XLFA and MBIA in 2008 of $45.9 million (see “Commutations” above), and deterioration of and the establishment of reserves relating to the RMBS and ABS CDO deals, primarily those underwritten with vintages between 2005-2007.
Acquisition Expenses: Acquisition expenses for the years ended December 31, 2009 and 2008, were $18.5 million and $30.6 million, respectively. The decrease in acquisition expenses in 2009 as compared to 2008 was primarily due to the decrease in earned premiums in the period. This decrease was offset by the write off of deferred acquisition costs (“DAC”) considered unrecoverable in 2009 of $4.4 million compared to the write off of $2.0 million of DAC considered unrecoverable in 2008.
Operating Expenses: Operating expenses for the year ended December 31, 2009, were $17.5 million, compared to $16.9 million for the comparable 2008 period. During the fourth quarter 2009, the Company paid $1.0 million to the majority holder of the Senior Notes to waive the restrictions set forth in the replacement capital covenant the Company had previously entered into in connection with the issuance of the Series A Preference Shares and allow the tender offer on the Series A Preference Shares (see “Subsequent events” included in our audited financial statements for the year ended December 31, 2009, for details of this tender offer). During 2008, operating expenses were decreased by $1.3 million of expenses which were deferred in the period. Excluding these items, operating expenses for the full year 2009 decreased by 9% as compared to 2008. The decrease in operating expenses for 2009 as compared to 2008 was primarily due to the reduced operating costs associated with the withdrawal of the Company’s ratings and cancellation of the Company’s soft capital facilities, offset partially by redundancy costs of staff made redundant during 2009.
Interest Expense: Interest expense was $2.5 million and $8.4 million for the years ended December 31, 2009 and 2008, respectively. Interest expense includes interest on the Company’s long term debt of $2.5 million and $2.8 million during 2009 and 2008, respectively. Interest expense in 2008 also includes Preference Share dividends, classified as interest expense, of $5.6 million. During 2009, the Company suspended payment of dividends on its preferred shares.
9

RAM Holdings Ltd.
Consolidated Financial Statements For the Year Ended December 31, 2009
10
11
See Accompanying Notes to Consolidated Financial Statements.
RAM Holdings Ltd.
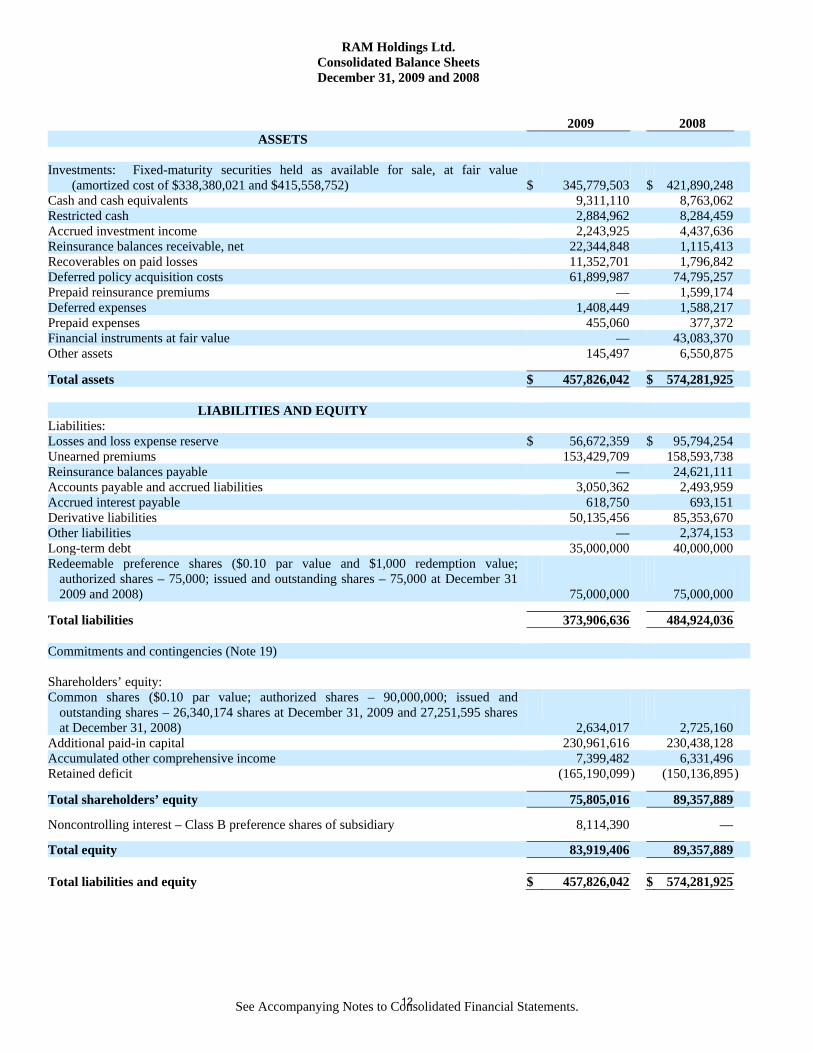
Consolidated Balance Sheets December 31, 2009 and 2008
2009 2008 ASSETS
Investments: Fixed-maturity securities held as available for sale, at fair value (amortized cost of $338,380,021 and $415,558,752) $ 345,779,503 $ 421,890,248
Cash and cash equivalents 9,311,110 8,763,062
Restricted cash 2,884,962 8,284,459 Accrued investment income 2,243,925 4,437,636
Reinsurance balances receivable, net 22,344,848 1,115,413
Recoverables on paid losses 11,352,701 1,796,842
Deferred policy acquisition costs 61,899,987 74,795,257
Prepaid reinsurance premiums — 1,599,174
Deferred expenses 1,408,449 1,588,217
Prepaid expenses 455,060 377,372
Financial instruments at fair value — 43,083,370
Other assets 145,497 6,550,875
Total assets $ 457,826,042 $ 574,281,925
LIABILITIES AND EQUITY
Liabilities:
Losses and loss expense reserve $ 56,672,359 $ 95,794,254
Unearned premiums 153,429,709 158,593,738
Reinsurance balances payable — 24,621,111
Accounts payable and accrued liabilities 3,050,362 2,493,959
Accrued interest payable 618,750 693,151
Derivative liabilities 50,135,456 85,353,670
Other liabilities — 2,374,153
Long-term debt 35,000,000 40,000,000
Redeemable preference shares ($0.10 par value and $1,000 redemption value; authorized shares – 75,000; issued and outstanding shares – 75,000 at December 31 2009 and 2008) 75,000,000 75,000,000
Total liabilities 373,906,636 484,924,036
Commitments and contingencies (Note 19)
Shareholders’ equity:
Common shares ($0.10 par value; authorized shares – 90,000,000; issued and outstanding shares – 26,340,174 shares at December 31, 2009 and 27,251,595 shares at December 31, 2008) 2,634,017 2,725,160
Additional paid-in capital 230,961,616 230,438,128
Accumulated other comprehensive income 7,399,482 6,331,496 Retained deficit (165,190,099 ) (150,136,895)
Total shareholders’ equity 75,805,016 89,357,889
Noncontrolling interest – Class B preference shares of subsidiary 8,114,390 —
Total equity 83,919,406 89,357,889 Total liabilities and equity $ 457,826,042 $ 574,281,925
12
See Accompanying Notes to Consolidated Financial Statements.
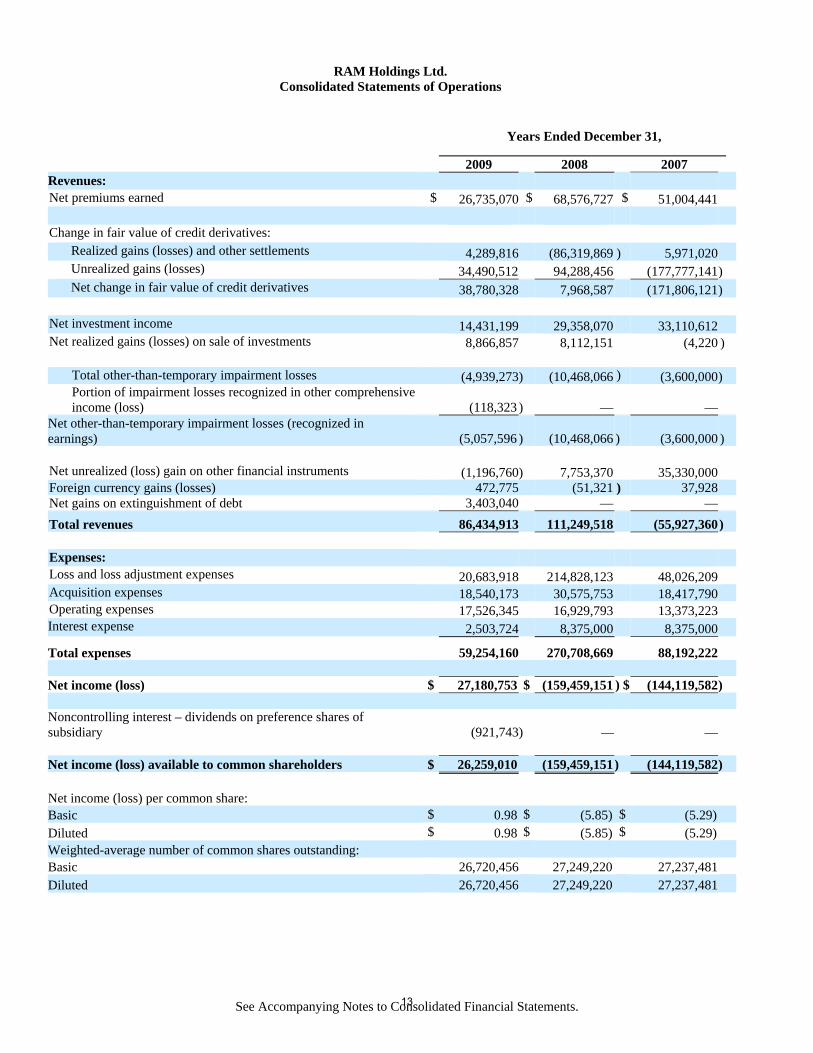
RAM Holdings Ltd. Consolidated Statements of Operations
Years Ended December 31,
2009 2008 2007 Revenues: Net premiums earned $ 26,735,070 $ 68,576,727 $ 51,004,441 Change in fair value of credit derivatives: Realized gains (losses) and other settlements 4,289,816 (86,319,869 ) 5,971,020 Unrealized gains (losses) 34,490,512 94,288,456 (177,777,141) Net change in fair value of credit derivatives 38,780,328 7,968,587 (171,806,121) Net investment income 14,431,199 29,358,070 33,110,612 Net realized gains (losses) on sale of investments 8,866,857 8,112,151 (4,220 )
Total other-than-temporary impairment losses (4,939,273) (10,468,066 ) (3,600,000) Portion of impairment losses recognized in other comprehensive income (loss)
(118,323 ) —
—
Net other-than-temporary impairment losses (recognized in earnings)
(5,057,596 ) (10,468,066 ) (3,600,000 )
Net unrealized (loss) gain on other financial instruments (1,196,760) 7,753,370 35,330,000 Foreign currency gains (losses) 472,775 (51,321 ) 37,928 Net gains on extinguishment of debt 3,403,040 — — Total revenues 86,434,913 111,249,518 (55,927,360) Expenses: Loss and loss adjustment expenses 20,683,918 214,828,123 48,026,209 Acquisition expenses 18,540,173 30,575,753 18,417,790 Operating expenses 17,526,345 16,929,793 13,373,223 Interest expense 2,503,724 8,375,000 8,375,000
Total expenses 59,254,160 270,708,669 88,192,222
Net income (loss) $ 27,180,753 $ (159,459,151 ) $ (144,119,582) Noncontrolling interest – dividends on preference shares of subsidiary (921,743) — — Net income (loss) available to common shareholders $ 26,259,010 (159,459,151 ) (144,119,582) Net income (loss) per common share: Basic $ 0.98 $ (5.85) $ (5.29) Diluted $ 0.98 $ (5.85) $ (5.29) Weighted-average number of common shares outstanding: Basic 26,720,456 27,249,220 27,237,481 Diluted 26,720,456 27,249,220 27,237,481
13
See Accompanying Notes to Consolidated Financial Statements.
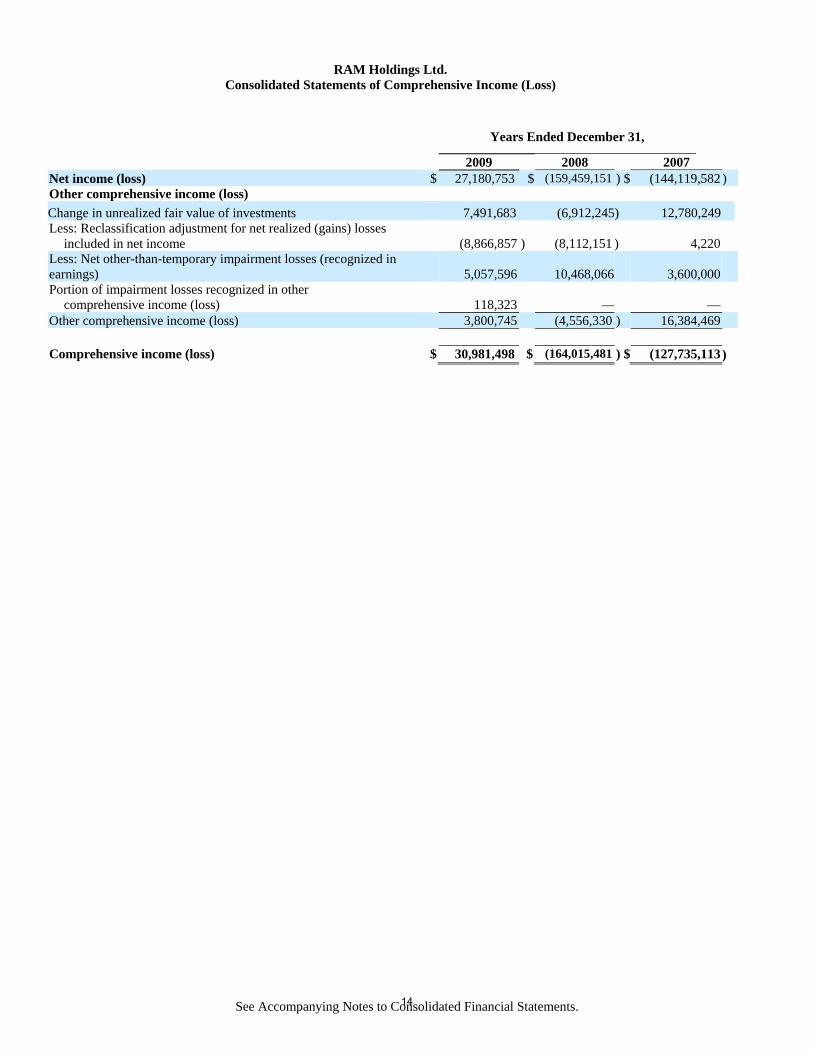
RAM Holdings Ltd.Consolidated Statements of Comprehensive Income (Loss)
Years Ended December 31,
2009 2008 2007 Net income (loss) $ 27,180,753 $ (159,459,151 ) $ (144,119,582 ) Other comprehensive income (loss) Change in unrealized fair value of investments 7,491,683 (6,912,245) 12,780,249 Less: Reclassification adjustment for net realized (gains) losses
included in net income
(8,866,857 ) (8,112,151 ) 4,220 Less: Net other-than-temporary impairment losses (recognized in earnings)
5,057,596
10,468,066 3,600,000
Portion of impairment losses recognized in other comprehensive income (loss)
118,323 — —
Other comprehensive income (loss) 3,800,745 (4,556,330 ) 16,384,469 Comprehensive income (loss) $ 30,981,498 $ (164,015,481 ) $ (127,735,113)
14

See Accompanying Notes to Consolidated Financial Statements.
RAM Holdings Ltd. Consolidated Statements of Equity and Retained Deficit
Share Capital
Noncontrolling interest in subsidiary
Additional paid-in capital
Accumulated other
comprehensiveincome
Retained deficit Total
Balance, January 1, 2007 $ 2,723,476 $ — $ 227,436,840 $ (5,496,643) $ 154,603,541) $ 379,267,214
Reclassification of committed preference share expenses
— — 1,161,703 — (1,161,703) —
Share issuance 422 — (422 ) — — — Share based compensation — — 780,297 — — 780,297 Net loss — — — — (144,119,582) (144,119,582)Other comprehensive income — — — 16,384,469 — 16,384,469
Balance, December 31, 2007 2,723,898 — 229,378,418 10,887,826 9,322,256 252,312,398
Share issuance 1,262 — (1,262 ) — — — Share based compensation — — 1,060,972 — — 1,060,972 Net loss — — — — (159,459,151) (159,459,151)Other comprehensive income — — — (4,556,330 ) — (4,556,330)
Balance, December 31, 2008 $ 2,725,160 $ — $ 230,438,128 $ 6,331,496 $ (150,136,895) $ 89,357,889 Cumulative effect of ASC 944-20, effective
January 1, 2009 — — — — (43,840,968) (43,840,968)Share issuance 3,157 8,114,390 (3,157 ) — — 8,114,390 Share based compensation — — 526,645 — — 526,645 Net income — 921,743 — — 26,259,010 27,180,753
Dividends on preference shares of subsidiary — (921,743) — — — (921,743)Cumulative effect of adopting of ASC 320-10,
effective April 1, 2009 — — — (2,732,759) 2,732,759 — Non credit component of impairment losses on
available-for-sale securities — — — 118,323 — 118,323 Net change in unrealized gains and losses on
available-for-sale securities — — — 3,682,422 — 3,682,422 Treasury shares reacquired (94,300) — — — (204,005) (298,305) Balance, December 31, 2009 $ 2,634,017 $ 8,114,390 $ 230,961,616 $ 7,399,482 $ (165,190,099) $ 83,919,406
15

See Accompanying Notes to Consolidated Financial Statements.
RAM Holdings Ltd. Consolidated Statements of Cash Flows
Years Ended December 31,
2009 2008 2007 Cash flows from operating activities: Net income (loss) for the year $ 27,180,753 $ (159,459,151 ) $ (144,119,582 ) Adjustments to reconcile net income (loss) to net cash (used in)
provided by operating activities: Net realized (gains) losses on sale of investments (8,866,857) (8,112,151 ) 4,220 Net other-than-temporary impairment losses recognized in earnings 5,057,596 10,468,066 3,600,000 Foreign currency gains on revaluation (498,724) — — Net unrealized (gains) losses on credit derivatives (34,490,512) (94,288,456 ) 177,777,141 Net unrealized loss (gain) on other financial instruments 1,196,760 (7,753,370 ) (35,330,000 ) Net gains on extinguishment of debt (3,403,040) — — Depreciation and amortization 221,243 205,054 210,534 Amortization of debt discount 6,280 6,280 6,280 Amortization of bond premium and discount 1,084,544 1,646,258 798,087 Share based compensation 526,645 1,060,972 780,297 Changes in assets and liabilities: Accrued investment income 2,193,711 2,027,237 (1,238,319 ) Reinsurance balances receivable, net 65,538,030 2,529,207 (180,465 ) Recoverables on paid losses (9,183,122) 11,099 (892,041 ) Deferred policy acquisition costs 67,603,931 12,509,119 (13,466,738 ) Prepaid reinsurance premiums 1,880,816 1,063,499 (571,319 ) Prepaid expenses and other assets / liabilities 3,922,312 (4,182,081 ) (10,189 ) Losses and loss adjustment expenses (65,360,753) 31,996,510 49,291,966 Unearned premiums (181,193,971) (81,363,645 ) 47,316,014 Derivative liability (727,702) (946,792 ) 1,190,812 Reinsurance balances payable (7,825,060) 24,081,717 (671,289 ) Accounts payable, accrued liabilities and interest payable 482,002 (969,407 ) 5,179
Net cash (used in) provided by operating activities (134,655,118) (269,470,035) 84,500,588 Cash flows from investing activities: Purchases of investments (196,923,687) (251,363,052 ) (244,097,849) Proceeds from sales of investments 238,776,651 427,136,405 18,228,122 Proceeds on maturities of investments 40,783,243 90,310,675 109,867,972 Net sales (purchases) of short term investments — — 10,040,385 Net change in restricted cash 5,399,497 (106,702 ) (1,924,424) Purchases of fixed assets (16,530) (70,542 ) (24,334)
Net cash provided by (used in) investing activities 88,019,174 265,906,784 (107,910,128) Cash flows from financing activities: Dividends on preference shares of subsidiary (921,743) — — Net proceeds from issuance of preference shares 50,001,000 — — Purchase of treasury stock (298,305) — — Repurchase of long-term debt (1,596,960) — — — Net cash provided by financing activities 47,183,992 — — Net increase (decrease) in cash and cash equivalents 548,048 (3,563,251 ) (23,409,540) Cash and cash equivalents – Beginning of year 8,763,062 12,326,313 35,735,853
Cash and cash equivalents – End of year $ 9,311,110 $ 8,763,062 $ 12,326,313 Supplemental cash flow disclosure: Interest paid on redeemable preference shares $ — $ 5,625,000 $ 5,625,000 Interest paid on long-term debt $ 2,578,125 $ 2,750,000 $ 2,750,000
16
RAM Holdings Ltd. Notes to Consolidated Financial Statements
1 BACKGROUND
RAM Holdings Ltd., RAM Holdings II Ltd. and RAM Reinsurance Company Ltd. (“RAM Re”), collectively the “RAM Re Group of Companies”, were incorporated on January 28, 1998, under the laws of Bermuda. RAM Holdings Ltd. and RAM Holdings II Ltd., the owners of all of the voting and non-voting common shares of RAM Re, entered into an amalgamation (merger) agreement pursuant to which the two companies amalgamated as of May 1, 2006. Upon completion of the amalgamation, all of the common shares of RAM Re are held by RAM Holdings Ltd. (“the Company” or “RAM Holdings”), the amalgamated entity of RAM Holdings Ltd. and RAM Holdings II Ltd.
On May 2, 2006, the Company completed an initial public offering (“IPO”), and the Company’s common shares were traded on the NASDAQ Global Market under the symbol of “RAMR”. Effective May 14, 2009, the Company’s common shares were voluntarily delisted from the NASDAQ Global Market and thereafter trades on the Pink Sheets. In addition, the Company obtained a primary listing on the Bermuda Stock Exchange effective May 14, 2009.
RAM Re is a Bermuda-based company whose principal activity is the reinsurance of financial guarantees of public finance and structured finance debt obligations insured by monoline financial guaranty companies (the “primary insurers” or the “primaries”). We refer to the primaries that reinsured with RAM Re as “ceding companies”. RAM Re provided reinsurance through treaty and facultative agreements that it maintains with each of its remaining customers. Financial guaranty reinsurance written by RAM Re generally provided for guarantees of scheduled principal and interest payments on an issuer’s obligation in accordance with the obligation’s original payment schedule and, in rare circumstances, such amounts are payable on an accelerated basis.
Recent developments
The unprecedented deterioration in the U.S. housing market since the latter half of 2007 and the resulting lack of liquidity in the capital markets has had a substantial adverse impact on the financial guaranty industry generally and the Company in particular. As a result of these adverse developments and the downgrades and subsequent withdrawal of the Company’s ratings by Standard & Poor’s Ratings Services (“S&P”) and by Moody’s Investors Service (“Moody’s”), the Company wrote only a modest amount of new financial guaranty reinsurance business in 2008 and have not renewed its reinsurance treaties with the primaries or written any new financial guaranty business in 2009. The Company will not reenter the financial guaranty business and has no current plans to write any other type of business.
Business strategy
In response to the economic and rating events referenced above, the Company continued its efforts through 2009 which it began in 2008 to reduce the volatility of its insured portfolio, to reduce its insured risk exposure, to preserve its capital position, to deleverage its balance sheet and to reduce its expenses. Going forward, the Company intends to pursue a run off plan that includes the following:
• Insured portfolio run off: The Company commuted its entire insured portfolio assumed from Syncora Guaranty Re Ltd., MBIA Insurance Corporation, and Ambac Assurance Corporation effective July 25, 2008, November 30, 2008, and April 8, 2009, respectively, along with other smaller commutations throughout 2008 and 2009. There have been no further commutations since December 31, 2009, and the Company does not intend to initiate commutation discussions in the future although may consider offers made by its ceding companies at acceptable prices. In addition, the Company is pursuing legal actions against its ceding companies in cases where the Company disputes the validity of cessions made under its treaties or ceded losses. The Company is continuing to run off its existing book of business, which could take many years to accomplish
17
as the longest stated remaining maturity of insured risk in its insured portfolio is approximately 58 years. The run off could be completed sooner if the insured portfolio is recaptured by the ceding companies prior to such maturity.
• Capital preservation: The Company reduced its new business growth in 2008 and has not written any business in 2009. The Company will not write new financial guaranty reinsurance business and has no current plans to write any other type of insurance or reinsurance business.
• Deleveraging and Dividends: During the first half of 2009, the Company completed a common share repurchase program and repurchased $5.0 million of its Senior Notes due 2024 (“Senior Notes”). During the first quarter of 2010, the Company completed a tender offer for its Non-Cumulative Preference Shares, Series A (the “Series A Preference Shares”), pursuant to which 15,300 shares were tendered out of the 75,000 shares outstanding; the Series A Preference Shares are mandatorily redeemable in 2066. The Company also repurchased $10.0 million of its Senior Notes during the first quarter of 2010. In addition, during the first quarter of 2010, RAM Re completed a tender offer for its perpetual Class B Preference Shares (the “Class B Preference Shares” and, together with the Series A Preference Shares, the “Preference Shares”), pursuant to which 68.00 shares were tendered out of the 500.01 shares outstanding. The Company expects that these first quarter transactions will result in approximately $15.4 million of net gain to the consolidated financial statements in the period ended March 31, 2010.
The Company does not intend to initiate any further repurchases of these securities. The dividends on both the Series A Preference Shares and the Class B Preference Shares, which are noncumulative in the case of the Series A Preference Shares and are generally noncumulative in the case of the Class B Preference Shares, were suspended in 2009. The Company is not permitted under the terms of the Series A Preference Shares to pay common share dividends or repurchase common shares unless full dividends for the latest completed dividend period on all Series A Preference Shares have been paid. Accordingly, the Company has no plans to liquidate, to pay common share dividends or to repurchase any of its common shares.
• Reducing expenses: In order to reduce its expenses during 2009, the Company has de-listed from the NASDAQ and de-registered its securities under the Securities Exchange Act of 1934. As a result the Company is no longer required to file annual, quarterly and current reports or proxy statements with the U.S. Securities and Exchange Commission. The Company estimates that these actions will reduce its expenses by at least $2 million per year beginning in 2010. On March 17, 2009, the Company requested that Moody’s Investor Service (“Moody’s”) withdraw its financial strength rating of RAM Re, and on May 20, 2009, the Company also requested that Standard & Poor’s Rating Services (“S&P) withdraw its financial strength rating of RAM Re, which has resulted in the Company no longer paying annual fees to these agencies. RAM Re cancelled its bank soft capital facilities effective May 13, 2009, which provided capital for rating agency purposes only. In addition, at the Annual General Meeting in December 2009 the shareholders approved reductions in the size of both the RAM Holdings and RAM Re Boards to five members from eleven. The Company also completed a number of redundancies throughout 2009 and the beginning of 2010 to reduce staff costs. The Company continues to evaluate other measures to reduce expenses to a level that is appropriate for its run-off status.
There can be no assurance that the strategies that have been implemented or that will be pursued in the future will improve the Company’s business, financial condition, liquidity or results of operations or will not have a material adverse effect on the Company. Management believes that the Company has sufficient capital resources and liquidity to meet its obligations for at least the next twelve months and therefore that the Company remains a “going concern”. See Note 20 – Risks and Uncertainties, for a discussion on the Company’s liquidity.
18
2 SIGNIFICANT ACCOUNTING POLICIES
The following is a summary of the significant accounting policies adopted by the Company: (a) Basis of preparation The consolidated financial statements have been prepared in accordance with accounting principles
generally accepted in the United States of America (“US GAAP”). The preparation of financial statements inaccordance with generally accepted accounting principles requires management to make estimates andassumptions that affect the amounts reported in the consolidated financial statements and the accompanying notes. Actual results could differ materially from those estimates.
In June 2009, the Financial Accounting Standards Board (“FASB”) issued Accounting Standards Codification (“ASC”) 105 on Generally Accepted Accounting Principles (the “Codification”). The Codification is now the single source for all authoritative GAAP recognized by the FASB, except for releases issued by the Securities and Exchange Commission (the “SEC”).
(b) Basis of consolidation The consolidated accounts of RAM Holdings include those of its subsidiary, RAM Re. All significant
intercompany balances have been eliminated on consolidation. (c) Cash and cash equivalents The Company considers all highly liquid investments, including fixed-interest and money market fund
deposits, with a maturity of 90 days or less when purchased, as cash equivalents. Cash equivalents are carried at cost which approximates fair value.
(d) Investments The Company has classified its fixed-maturity investments as available for sale. Available for sale
investments are carried at fair value, with unrealized appreciation or depreciation reported as a separate component of accumulated other comprehensive income. The Company’s fair values of fixed maturity and short-term investments are based on prices obtained from nationally recognized independent pricing services. All investment transactions are recorded on a trade date basis. Realized gains and losses on sales of fixed maturity investments are determined on the basis of amortized cost. Gains and losses on sale of investments are included in “net realized gains (losses) on sale of investments” when realized. The cost of securities sold is determined using the specific identification method. Short-term investments are carried at amortized cost, which approximates fair value, and include all securities with maturities greater than 90 days but less than one year at time of purchase. The Company’s investment guidelines require the orderly sale of securities that do not meet investment guidelines due to a downgrade by rating agencies or other circumstances, unless otherwise authorized by management to hold. Other-than-temporary Impairments In April 2009 the FASB issued new guidance on the recognition and presentation of an other-than-temporary impairment (“OTTI”) for debt securities classified as available-for-sale and held-to-maturity and also provided some new disclosure requirements for both debt and equity securities (ASC 320-10). The Company adopted this guidance effective April 1, 2009. Under the new guidance an impairment is considered to be other-than-temporary if the Company (i) intends to sell the security, (ii) more likely than not will be required to sell the security before recovering its cost, or (iii) does not expect to recover the security’s entire amortized cost basis (even if the Company does not intend to sell). A “credit loss” is recognized when the present value of cash flows expected to be collected from the debt security is less than the amortized cost basis of the security. If there is an intent to sell the impaired security then the full OTTI
19

is recognized in earnings in the period. If there is no intent to sell the impaired security but there is a credit loss then the credit loss portion of the unrealized loss is recognized in earnings with the remainder recognized in other comprehensive income. The new guidance requires that the full OTTI is presented on the statement of operations with an offset for any amounts recognized in other comprehensive income. The new guidance required that the Company record, as of the beginning of the interim period of adoption, a cumulative effect adjustment to reclassify the noncredit component of a previously recognized OTTI from retained earnings to other comprehensive income (loss). For purposes of calculating the cumulative effect adjustment, the Company reviewed OTTI it had recorded through realized losses on securities held at April 1, 2009 where there was no intent to sell, which amounted to $16.1 million, and estimated the portion related to credit losses (i.e., where the present value of cash flows expected to be collected are lower than the amortized cost basis of the security) and the portion related to all other factors. The Company determined that $13.4 million of the OTTI previously recorded related to specific credit losses and $2.7 million related to all other factors. The Company therefore increased the amortized cost basis of these debt securities by $2.7 million and recorded a cumulative effect adjustment to reduce the retained deficit and reduce accumulated other comprehensive income (loss), with no net effect on shareholders’ equity. Factors considered when assessing impairment include: (i) securities whose market values have declined by 20% or more below amortized cost for a continuous period of at least six months; (ii) credit downgrades by rating agencies; (iii) the financial condition of the issuer; (iv) whether scheduled interest payments are past due; and (v) whether the Company has an intent to sell the security. Prior to April 1, 2009, all declines in fair value below cost that were considered other than temporary wererecognized in income.
(e) Premium revenue recognition Effective January 1, 2009, the Company adopted ASC 944-20, which requires that the Company recognize a
liability for unearned premium revenue at the inception of a financial guarantee insurance contract equal to the present value of the premiums due or expected to be collected over the period of the contract. If the premium is a single amount received at the inception of the contract (i.e. an upfront premium), then the Company records the unearned premium revenue as the amount received. Where premiums are received in installments over the term of the contract then the Company records the unearned premium revenue and a receivable for future premiums as the present value of premiums expected to be collected over the contract period, using a risk free discount rate. The period of a financial guarantee insurance contract is the expected period of risk, which generally equates to the contract period. However, in some instances, the expected period of risk is significantly shorter than the full contract period due to expected prepayments. The expected period of a contract is only used to determine the present value of unearned premium revenue and receivable for future premiums where (i) the financial guarantee contract insures a homogeneous pool of assets that are contractually prepayable, (ii) prepayments are probable and (iii) the amount and timing of prepayments are reasonably estimable. The Company records the accretion of the discount on installment premiums receivable as premium revenue and discloses the amount recognized in “Note 8 – Financialguaranty contracts”. ASC 944-20 requires that financial guarantee reinsurance contract revenue be recognized over the period of the contract in proportion to the amount of insurance protection provided. As premium revenue is recognized, a corresponding adjustment to decrease unearned premium revenue occurs. The amount of insurance protection provided is a function of the insured principal amount outstanding. The premium revenue for each period is therefore determined by applying a constant rate to the insured principal amount outstanding for the period. The constant rate for each financial guarantee policy is determined by the ratio of (a) the total present value of the premium collected or expected to be collected over the period of the contract, to (b) the sum of all insured principal amounts outstanding during each reporting period over the period of the contract. When the financial obligation is retired prior to its scheduled maturity, the financial guarantee insurance contract on the retired financial obligation is extinguished (referred to as a refunding). The Company immediately recognizes any nonrefundable unearned premium revenue related to that contract as premium revenue in the period the contract is extinguished and any associated acquisition costs
20

previously deferred as an expense. Prior to January 1, 2009, installment premiums were recorded as written at each installment due date and were earned over the respective installment period, which equated to the period of risk. All other premiums written were recorded as written at the inception of the policy and were earned ratably over the period of risk. When insured issues were refunded or called, the remaining unearned premiums were earned at that time, since there is no longer risk to the Company. Consistent with prior periods, premium revenues are recorded on a one month lag basis.
(f) Deferred policy acquisition costs Deferred policy acquisition costs comprise those expenses that vary with and are primarily related to the
production of business, including ceding commissions paid on reinsurance assumed. This also includes a portion of salaries and related costs of underwriting personnel, rating agency fees, and certain other underwriting expenses and management determines on an annual basis which costs vary with and are directly related to the production of new business and therefore qualify for deferral and uses its judgment to determine what percentage of these costs should be deferred. During 2009, no such costs were deferred as no new business was written. Policy acquisition costs are deferred and amortized over the period in which the related premiums are earned. Policy acquisition costs related to financial guarantee contracts written in derivative form are expensed as incurred. Effective January 1, 2009, where ceding commissions are paid in installments over the term of the contract, then the Company records the deferred acquisition costs and a payable for future ceding commissions as the present value of ceding commissions expected to be paid over the contract period, using a risk free discount rate. The payable on ceding commissions is included within Net Reinsurance Balances Receivable, on the Consolidated Balance Sheets. When assessing the recoverability of deferred policy acquisition costs, the Company considers the future earnings of premiums and anticipated investment income and compares this to the sum of unamortized policy acquisition costs and expected loss and loss adjustment expenses. This comparison is completed by underwriting year and risk type. If a deficiency were calculated the unamortized acquisition costs would be reduced by a charge to expense.
For policies retroceded, the Company receives ceding commissions to compensate for acquisition costs
incurred. The Company nets ceding commissions received against deferred acquisition costs and earns these ceding commissions over the period in which the related premiums are earned.
(g) Losses and loss adjustment expenses
The Company establishes loss reserves based on a review of reserving practices, reported reserves, surveillance reports and other data provided by its ceding companies. In addition, the Company augments the ceding company information with its own research, analysis and modeling. Effective January 1, 2009, the Company adopted new guidance under ASC 944-20 and the Companyrecognizes a claim liability on a financial guarantee insurance contract (excluding those written in derivative form) when the Company estimates that the present value of expected net cash outflows to be paid under the insurance contract will exceed the unearned premium revenue for that contract. The present value of expected net cash outflows is discounted using a current risk free rate based on the remaining period (contractual or expected as applicable) of the insurance contract. Expected net cash outflows are probability weighted cash flows that reflect the likelihood of possible outcomes, based on all information available to the Company. The Company updates the discount rate each reporting period and revises expected net cash outflows when increases or decreases in the likelihood of a default and potential recoveries occurs. The discount of the loss and loss expenses reserve is accreted through earnings and included in losses and loss adjustment expenses. Changes to the estimate of loss and loss adjustment expenses reserve after initial recognition are recognized
21
in loss and loss adjustment expenses in the consolidated income statement in the period of the change. The Company reviews the portfolio on a continuous basis to identify problem credits. Quarterly, the Management Committee formally reviews reserves. Management establishes reserves that it believes are adequate to cover the present value of the ultimate liability for claims. The reserves are based on estimates and are substantially dependent on the surveillance activities and reserving policies of the Company’s ceding companies and may vary materially from actual results. Adjustments based on actual loss experience will be recorded in the periods in which they become known. Prior to the adoption of ASC 944-20, the Company’s liability for losses and loss adjustment expenses consisted of case-basis reserves and an unallocated reserve. The case-basis reserves were established based on ceding company reports and internal review and evaluation of exposures related to guaranteed obligations that either had already defaulted or had a high and estimable probability of default. Management’s review and analysis of case-basis reserves included an analysis of the present value of the expected ultimate losses and loss adjustment expense that the Company expected to pay less estimated recoveries. The amount of the expected loss, net of expected recoveries, was discounted based on a discount rate of approximately 5%. Changes to the ceding company’s reserves werereported at regular intervals and were reviewed for reasonableness by the Chief Risk Manager and the Company’s Management Committee. Case-basis reserves for policies with installment premiums wereestablished net of expected future installments premiums, as such premiums were considered a form of recovery when installment premiums were considered collectible. Case-basis reserves established for policies with upfront premiums did not reflect the benefit of deferred premium revenue, which the Company continued to earn over the remaining life of the policy. The Company maintained an unallocated reserve as established by the Management Committee and estimated based on the composition of its outstanding par exposure and reserve factors applied to this exposure so that, all else being equal, increases in outstanding par would result in increases in unallocated reserves. The reserve factors were the product of i) the ratios of the unallocated reserves of our ceding companies relative to their outstanding exposures and ii) the credit risk of our outstanding exposure relative to the credit risk of the portfolios of our ceding companies, where credit risk is assessed by weighted average capital charges (a measure of credit risk promulgated by S&P). RAM Re’s insured portfolio was segregated by primary insurer, and the above ratios were calculated individually by primary insurer. RAM Re’s unallocated reserve was reviewed periodically by the Management Committee and the estimate may have been modified if industry experience or company specific-developments were judged to warrant such an adjustment. Additionally, management considered internal guidelines in place which address the procedures followed to determine that the total best estimate continued to be based upon expected loss experience over the long term and was not overly influenced by one short term development on one loss. These internal guidelines were not mandatory as they were subject to management judgment based on specific facts and circumstances.
(h) Reinsurance
In the ordinary course of business, the Company cedes business to other insurance and reinsurance companies. These agreements enable the Company to manage its risk concentration limits thereby providing greater risk diversification and may minimize the net potential loss from large risks. Retrocessional contracts do not relieve the Company of its obligation to the reinsured. Prepaid reinsurance premiums represent the portion of premiums ceded to reinsurers relating to the unexpired terms of the reinsurance contracts in force. On December 31, 2009, the Company commuted its one retrocessional agreement previously in place, see Note 9 – Reinsurance.
22
(i) Derivative instruments The Company has entered into agreements to reinsure derivative instruments, consisting primarily of credit
default swaps that it intends to reinsure for the full term of the contract. While management considers these agreements to be a normal extension of its financial guaranty reinsurance business and reinsurance insubstance, certain of these contracts meet the definition of a derivative under ASC 815 “Derivatives and hedging”. ASC 815 establishes accounting and reporting standards for derivative instruments, and requiresthe Company to recognize the derivative instruments on the balance sheet at their fair value, under “Derivative assets/liabilities”, with changes in fair value recognized in earnings. Changes in fair value arerecorded in “Net change in fair value of credit derivatives” on the Consolidated Statement of Operations.The “Realized gains and losses and other settlements” component of this change in fair value includes (i) netpremiums earned on credit derivative policies, including current premiums receivable on assumed creditderivative polices, net of ceding commissions, and (ii) loss payments to the reinsured including losses payable upon the occurrence of a credit event. The “Unrealized gains and losses” component of the “Netchange in fair value of credit derivatives” includes all other changes in fair value, including changes ininstrument specific credit spreads and reduction in fair values due to commutation of credit derivativepolicies. Management uses as a key input to the estimation of the fair value of our derivatives, the valuationinformation provided to us by our ceding companies. The Company participates in credit default swaps through a reinsurance treaty with a ceding company and therefore the contract to be valued is a reinsurancecontract on a derivative. This contract is not identical to the underlying credit default swaps. In particular,although The Company’s contract allows it to share in the economic results of the underlying contracts, itdoes not provide rights to the same information that the ceding companies have access to. Under ASC 820, “Fair value measurements and disclosures”, the fair value of the Company’s contract represents the exit price that would be paid to a market participant to assume the reinsurance contract as written; that is, theamount the market participant would require to assume the Company’s potential obligations under the contract with the same contractual rights and obligations, including those which limit the information aboutthe ceding companies’ underlying contracts that are being reinsured. Given the contractual terms that exist,the Company believes that an exit market participant would look to the information that is available from theceding companies to determine the exit value of the Company’s reinsurance contract. The primary insurers underwrite each of the transactions underlying the reinsurance contract and they have access to all the underlying data related to the transactions. The ceding companies use their own internal valuation modelswhere market prices are not available. The Company employs procedures to test the reasonableness of the mark both in process and absolute terms because we believe that an exit market participant would performsimilar procedures when determining an exit price for our reinsurance contract. If it appears that the fairvalues generated by the ceding companies internal models and reported to the Company are consistent with macro spread movements and general market trends, and the Company believes that the modeling and assumptions that drive the modeling are reasonable (based on the Company’s ceding company reviews and review of publicly available information), the Company will use the mark provided by the ceding company as a key input in the determination of the fair value of reinsurance contract. There is no single acceptedmodel for fair valuing credit default swaps and there is generally not an active market for the type of creditdefault swaps insured by ceding companies and reinsured by us. Therefore, due to the limited availability ofquoted market prices for these derivative contracts and the inherent uncertainties in the assumptions used in models, different valuation models may produce materially different results and be materially different from actual experience. In addition, due to the complexity of fair value accounting in particular on accounting forderivatives, future amendments or interpretations of these standards may cause us to modify our accountingmethodology in a manner which may have an adverse impact on our financial results. On January 1, 2008, the Company adopted the guidance under ASC 820 on fair value measurement. This provides guidance for fair value measurement of assets and liabilities and associated disclosures about fairvalue measurement. Under this standard, the definition of fair value focuses on the price that would bereceived to sell the asset or paid to transfer the liability (an exit price), not the price that would be paid toacquire the asset or received to assume the liability (an entry price). ASC 820 clarifies that fair value is amarket-based measurement, not an entity-specific measurement. ASC 820 establishes a fair value hierarchy of inputs in measuring fair value, with the highest level being observable inputs and the lowest being
23

unobservable data as follows: Level 1 inputs – valuations based on quoted prices in active markets for identical assets or liabilities. Valuations in this level do not entail a significant degree of judgment. Level 2 inputs – valuations based on quoted prices for similar assets or liabilities in active markets, quotedprices for identical or similar assets or liabilities in markets that are not active and model derived valuationswhere all significant inputs are observable in active markets. Level 3 inputs – valuations based on significant inputs that are unobservable. Under ASC 820, the use of valuation information provided to us by our ceding companies remainsappropriate for the reasons described above, as well as the fact that the credit default swaps we reinsure arethe same as that valued by our primaries, and the Company views its hypothetical principal market to be the same as our primaries, being the financial guaranty insurance and reinsurance market. The Company’s fair value on credit derivatives is adjusted for the Company’s own non-performance risk in accordance with ASC 820 (see Note 4 - Derivative instruments).
(j) Fair Value of Financial Instruments The put option relating to the Company’s preference share soft capital facility is a financial instrument and is
fair valued with the fair value measurement representing the value to the Company in the current market environment. The gain or loss on the put option is recorded on the consolidated balance sheet and changes infair value are reported through the statement of operations in “Unrealized Gain/(Loss) on Other Financial Instruments”. Valuations are based on unobservable inputs including assumptions over the Company’sperformance and future outlook, the facility, the current market conditions, and other similar instruments inthe market. On February 17, 2009, the put option was exercised. The difference between the fair value of the put option at the exercise date and the proceeds received on exercise of the put option has been recorded as the value of the preference shares and is included as a “Noncontrolling interest” in the Company’s Consolidated Balance Sheets as at December 31, 2009. See Note 10 - Contingent capital, credit facilities and Noncontrolling interest.
(k) Recent accounting pronouncements Accounting for Financial Guarantee Insurance Contracts
On May 23, 2008, the FASB issued a new standard addressing how to account for financial guarantee insurance contracts (ASC 944-20) (“the Standard”). The Standard clarifies how previous accounting literature applies to financial guaranty insurance contracts. The Standard is focused on the recognition and measurement of premium revenue and claims liabilities, along with additional disclosure requirements for financial guaranty contracts. The Standard requires the following:
1. Premium revenue will be recognized as a function of the amount of insurance protection provided over the contract term. 2. Present value of installment premiums due pursuant to the terms of a financial guaranty insurance contract will be recognized at inception of the contract as unearned premiums and premiums receivable. 3. A claim liability will be established on a financial guaranty contract when the probability weighted net present value of an expected claim loss is estimated to exceed the related unearned premium revenue. Provision of unallocated reserves is not permitted under the Standard. 4. Additional disclosures will be required on financial guaranty contracts, including the accounting and risk management activities used to evaluate credit deterioration in the Company’s insured obligations and surveillance lists.
The Standard was effective for fiscal years beginning after December 15, 2008, and all interim periods
24

within those fiscal years, with the exception of certain risk management disclosures which were effective for the interim financial statements prepared as of September 30, 2008. The Standard does not apply to policies which are accounted for as credit derivatives. The cumulative effect of adopting the Standard is recognized as an adjustment to opening retained earnings as of January 1, 2009.
The impact of adopting the Standard on the Company’s balance sheet was as follows:
December 31, 2008
As reportedTransition
Adjustment
January 1, 2009
As adjusted ASSETS: Reinsurance balances receivable, net (1) $ 1,115,413 $ 86,268,741 $ 87,384,154 Recoverable on paid losses (3) 1,796,842 372,737 2,169,579 Deferred policy acquisition costs (2) 74,795,257 54,708,661 129,503,918 Prepaid reinsurance premiums (2) 1,599,174 281,642 1,880,816 Total assets $ 574,281,925 $ 141,631,781 $ 715,913,706
LIABILITIES AND SHAREHOLDERS’ EQUITY: Losses and loss expense reserve (3) 95,794,254 26,238,858 122,033,112 Unearned premiums (2) 158,593,738 176,029,942 334,623,680 Reinsurance balances payable (1) 24,621,111 (16,796,051 ) 7,825,060 Total liabilities $ 484,924,036 $ 185,472,749 $ 670,396,785 Retained deficit (4) (150,136,895) (43,840,968 ) (193,977,863) Total shareholders’ equity 89,357,889 (43,840,968 ) 45,516,921 Total liabilities and shareholders’ equity $ 574,281,925 $ 141,631,781 $ 715,913,706
(1) Reinsurance balances receivable and reinsurance balances payable were increased and decreased,
respectively, to reflect the net present value of future installment premiums, net of ceding commissions (including the accrual for additional ceding commissions), discounted at a risk free rate.
(2) Unearned premiums and prepaid reinsurance premiums were increased to reflect the change in premium earning methodology under the Standard along with the net present value of installment premiums, on assumed and retroceded policies respectively. Deferred policy acquisition costs increased to reflect the associated acquisition costs on the increased unearned premium balances.
(3) Losses and loss expense reserves and related recoverable, were increased for the new reserving methodology under the Standard. This was offset by a decrease in reserves for the release of the unallocated loss reserves which are not allowed under the Standard.
(4) Retained deficit was increased for the net effect of the transition adjustments as at January 1, 2009. Other recent accounting pronouncements In August 2009, the FASB issued accounting guidance ASU 2009-5, for measuring liabilities at fair value, which provides clarification that for circumstances in which a quoted price in an active market for anidentical liability is not available, the Company is required to measure fair value using one of two specified techniques. The Company adopted this guidance for the period ending December 31, 2009, the adoption didnot have a material impact on the financial statements of the Company. In June 2009, the FASB issued the Codification. The Codification is now the single source for all authoritative GAAP recognized by the FASB, except for releases issued by the SEC. The Codification is to be applied to financial statements issued for periods ending after September 15, 2009, and the Company adopted this guidance for the year ended December 31, 2009. The Codification does not change GAAP and will not have an effect on our financial position, results of operations or liquidity, however, technical references to accounting literature throughout the financial statements are now provided under the new ASC structure.
25
In December 2007, the FASB issued ASC810-10 which requires reporting entities to present noncontrolling(minority) interest as equity, as opposed to liability or mezzanine equity, and provides guidance on the accounting for transactions between an entity and the noncontrolling interests. On February 17, 2009, RAM Re exercised its put option in the Blue Water Trust, see Note 10 - Contingent capital and credit facilities, andsubsequent to that date the Company had a noncontrolling interest in preferred stock issued of a subsidiary(RAM Re) which has been classified as a separate component of equity in accordance with this standard. In May 2009, the FASB issued ASC 855-10 which establishes general standards of accounting and disclosure for events that occur after the balance sheet date but before financial statements are issued. ASC855-10 is effective for reporting periods ending after June 15, 2009. The Company adopted ASC 855-10 for the year ended December 31, 2009. ASC 855-10 did not have an impact on the Company’s consolidated financial position or results of operations, as its requirements are disclosure-only in nature. See Note 27 -Subsequent Events, for disclosures related to these items. In April 2009, the FASB issued new guidance on the recognition and presentation of an other-than-temporary impairment (“OTTI”) for debt securities classified as available-for-sale and held-to-maturity and also provided some new disclosure requirements for both debt and equity securities (ASC 320-10). The new guidance eliminates the existing requirement that the Company has the “ability and intent to hold” an impaired security and impairment is now considered to be other-than-temporary if an entity (i) intends to sell the security, (ii) more likely than not will be required to sell the security before recovering its cost, or (iii) does not expect to recover the security’s entire amortized cost basis (even if the entity does not intend to sell). When an other-than-temporary impairment is assessed on a security only the credit component of the loss is recognized in earnings with the remainder recognized in other comprehensive income, unless there is an intent to sell the impaired security, then the full OTTI is recognized in earnings in the period. The new guidance requires that the full OTTI is presented on the statement of operations with an offset for any amounts recognized in other comprehensive income. The Company adopted this guidance for the period ending June 30, 2009, see Accounting policies on Investments above for the effect of this standard on the Company’s financial statements at adoption. During 2008, the FASB issued guidance to enhance the disclosures required under ASC 815 “Derivatives and Hedging”. Companies are required to enhance disclosures about (a) how and why an entity usesderivative instruments, (b) how it accounts for derivative instruments and related hedged items, and (c) how derivative instruments and related hedged items affect an entity’s financial statements. Since the amendments to ASC 815 only require additional disclosures concerning credit derivatives and guarantees,the adoption of the guidance did not affect the Company’s financial position or results of operations. See Note 4 - Derivative instruments for disclosures on our credit derivatives. In April 2009, the FASB provided an update to ASC 820-10 for determining fair value when the volume and level of activity for the asset or liability have significantly decreased and identifying transactions that are not orderly. The update also requires additional disclosures about fair value measurements including thedisclosure of inputs and valuation techniques used to measure fair value (along with any changes intechniques and inputs) and also requires fair value disclosure of investments by major security type. Theimplementation of this standard did not affect the Company’s results of operations or financial position. Thedisclosures required by ASC 820-10 are reported in Note 11 – Fair value of financial instruments and Note 4 - Derivative instruments.
(l) Reclassifications Certain reclassifications have been made to the prior period amounts to conform to the current period’s
presentation.
26
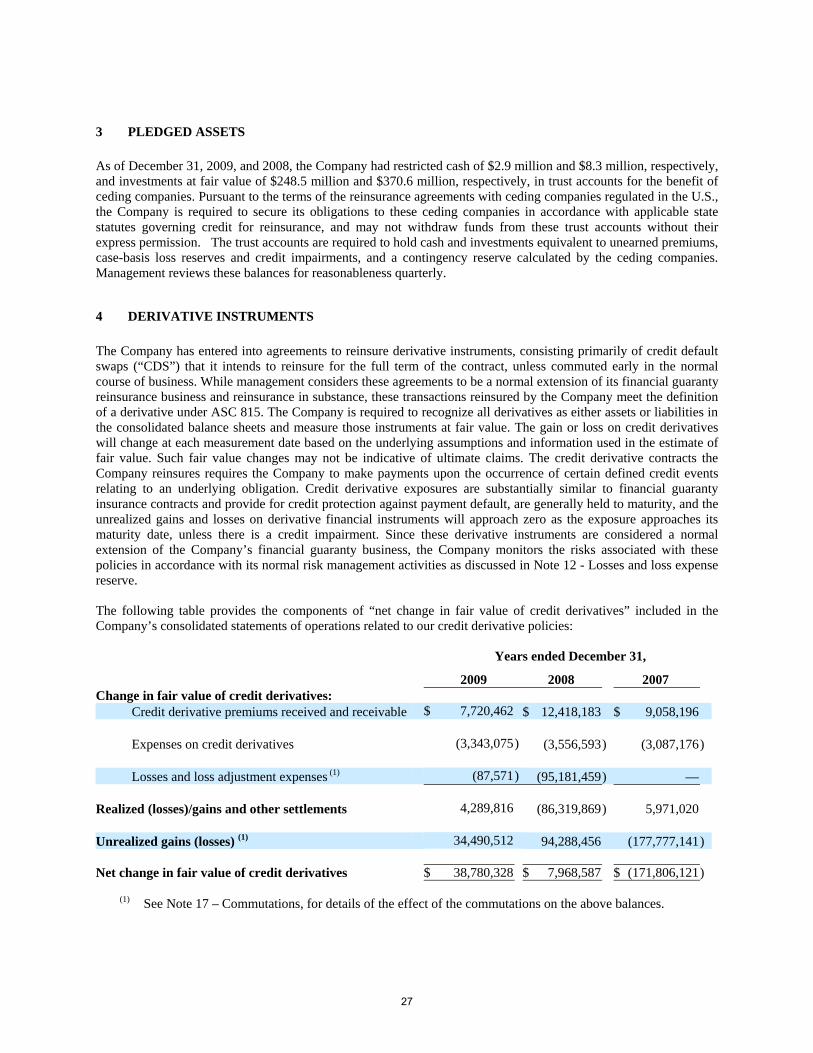
3 PLEDGED ASSETS
As of December 31, 2009, and 2008, the Company had restricted cash of $2.9 million and $8.3 million, respectively, and investments at fair value of $248.5 million and $370.6 million, respectively, in trust accounts for the benefit of ceding companies. Pursuant to the terms of the reinsurance agreements with ceding companies regulated in the U.S., the Company is required to secure its obligations to these ceding companies in accordance with applicable state statutes governing credit for reinsurance, and may not withdraw funds from these trust accounts without their express permission. The trust accounts are required to hold cash and investments equivalent to unearned premiums, case-basis loss reserves and credit impairments, and a contingency reserve calculated by the ceding companies. Management reviews these balances for reasonableness quarterly. 4 DERIVATIVE INSTRUMENTS
The Company has entered into agreements to reinsure derivative instruments, consisting primarily of credit default swaps (“CDS”) that it intends to reinsure for the full term of the contract, unless commuted early in the normal course of business. While management considers these agreements to be a normal extension of its financial guaranty reinsurance business and reinsurance in substance, these transactions reinsured by the Company meet the definition of a derivative under ASC 815. The Company is required to recognize all derivatives as either assets or liabilities in the consolidated balance sheets and measure those instruments at fair value. The gain or loss on credit derivatives will change at each measurement date based on the underlying assumptions and information used in the estimate of fair value. Such fair value changes may not be indicative of ultimate claims. The credit derivative contracts the Company reinsures requires the Company to make payments upon the occurrence of certain defined credit events relating to an underlying obligation. Credit derivative exposures are substantially similar to financial guaranty insurance contracts and provide for credit protection against payment default, are generally held to maturity, and the unrealized gains and losses on derivative financial instruments will approach zero as the exposure approaches its maturity date, unless there is a credit impairment. Since these derivative instruments are considered a normal extension of the Company’s financial guaranty business, the Company monitors the risks associated with these policies in accordance with its normal risk management activities as discussed in Note 12 - Losses and loss expense reserve.
The following table provides the components of “net change in fair value of credit derivatives” included in the Company’s consolidated statements of operations related to our credit derivative policies:
Years ended December 31,
2009 2008 2007 Change in fair value of credit derivatives:
Credit derivative premiums received and receivable $ 7,720,462 $ 12,418,183 $ 9,058,196
Expenses on credit derivatives (3,343,075) (3,556,593 ) (3,087,176)
Losses and loss adjustment expenses (1) (87,571) (95,181,459 ) —
Realized (losses)/gains and other settlements 4,289,816 (86,319,869 ) 5,971,020
Unrealized gains (losses) (1) 34,490,512 94,288,456 (177,777,141) Net change in fair value of credit derivatives $ 38,780,328 $ 7,968,587 $ (171,806,121)
(1) See Note 17 – Commutations, for details of the effect of the commutations on the above balances.
27

Determining Fair Value In accordance with ASC 820, fair value is defined as the price that would be received to sell an asset or paid to transfer a liability in an orderly transaction between market participants at the measurement date. Fair value is determined based on quoted market prices, if available. Financial guarantors sell credit protection in CDS form to financial institutions in a principal-to-principal market in which transactions are highly customized and negotiated independently. Based on disclosures by the primaries, a CDS contract written by a financial guarantor differs from typical CDS contracts entered into by parties that are not financial guarantors because:
• CDS contracts written by financial guarantors are neither held for trading purposes (i.e., a short-term duration contract written for the purpose of generating trading gains) nor used as hedging instruments. Instead they are written with the intent to provide protection for the stated duration of the contract, similar to the financial guarantor’s intent with regard to a financial guaranty contract.
• Financial guarantors are not entitled to terminate a CDS contract they write that is “in-the-money” and realize a profit on such a position.
• The liquidity risk present in most CDS contracts sold outside the financial guaranty industry, i.e., the risk that the CDS writer would be required to make cash payments, is typically not present in a CDS contract written by a financial guarantor. Terms are designed to replicate the payment provisions of financial guaranty contracts in that (a) losses, if any, are generally paid over time, and (b) the financial guarantor is not required to post collateral to secure its obligation under the CDS contract (the financial guarantor may be required to post collateral on their downgrade).
As a result of these differences, we believe there have been few, if any, relevant third-party exit transactions for CDS contracts written by financial guarantors. In the absence of a principal exit market, a financial guarantor determines the fair value of a CDS contract it writes by using internally developed models, as more fully discussed below. Fair Value Modeling The Company’s credit default swap policies are not readily tradable as there is no active market for them. Therefore, the Company views its principal market as the financial guaranty insurance and reinsurance market, whose participants would hypothetically be able to assume this business if the Company were to hypothetically transfer a policy. Each ceding company uses its own internal valuation models where market prices are not available. The primary insurers underwrite each of the transactions underlying the reinsurance contract and they have access to all the underlying data related to the transactions. In addition, they have sophisticated modeling capabilities and services (i.e. Loan Performance and Intex) that allow them to evaluate the performance of all of the underlying credits in a transaction. Given the contractual terms of the Company’s reinsurance that limit its access to the terms of the underlying credit derivatives, which are highly individualized, and the underlying loan level data, the Company believes that an exit market participant would look to the information that is available from the ceding companies to determine the exit value of the Company’s reinsurance contract, as discussed above. Therefore, the Company, in determining the fair value of derivative instruments, uses credit derivative contract valuations from its ceding companies as a key input. Management then assesses the reasonableness of the ceding companies’ valuations by i) discussing with primary insurers their mark-to-market valuation methodology including the nature of changes in key assumptions, ii) reviewing the primaries’ publicly available information regarding their mark-to-market process, including methodology and key assumptions, and iii) analyzing the movement of individual derivative policies compared to observable market data, including credit spread movements. Spreads and the related movements, quarter to quarter, are identified from observable market information such as indices, including the CDX, ABX, CMBX and LCDX indices, as related to specific types of derivative contracts. Overall, the relationship between the widening of credit spreads and fair value is not a linear one due to the mix of policy types (duration, rating, and maturities) within the portfolio. Therefore it is difficult to calculate the actual magnitude of any increase/decrease in the unrealized gain/(loss) with the movement of spreads alone. Additionally, there are many other assumptions that drive the ceding companies’ ultimate fair value assessment namely, asset recovery assumptions, correlation across asset assumptions, discount rate used, time to maturity, timing of default assumptions, and collateral posting requirements, where applicable. So while spreads are a significant driving factor in models of fair value they are not the only ones. Changes in correlation and recovery assumptions can result in valuations moving more or less than
28
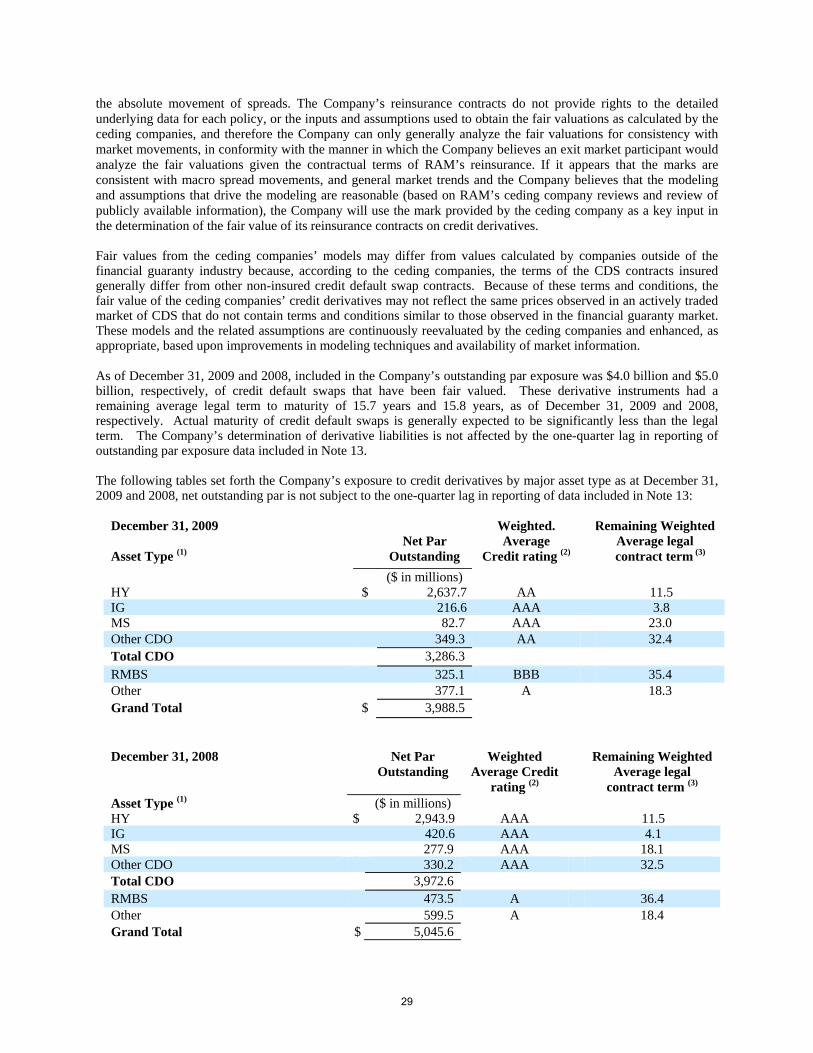
the absolute movement of spreads. The Company’s reinsurance contracts do not provide rights to the detailed underlying data for each policy, or the inputs and assumptions used to obtain the fair valuations as calculated by the ceding companies, and therefore the Company can only generally analyze the fair valuations for consistency with market movements, in conformity with the manner in which the Company believes an exit market participant would analyze the fair valuations given the contractual terms of RAM’s reinsurance. If it appears that the marks are consistent with macro spread movements, and general market trends and the Company believes that the modeling and assumptions that drive the modeling are reasonable (based on RAM’s ceding company reviews and review of publicly available information), the Company will use the mark provided by the ceding company as a key input in the determination of the fair value of its reinsurance contracts on credit derivatives. Fair values from the ceding companies’ models may differ from values calculated by companies outside of the financial guaranty industry because, according to the ceding companies, the terms of the CDS contracts insured generally differ from other non-insured credit default swap contracts. Because of these terms and conditions, the fair value of the ceding companies’ credit derivatives may not reflect the same prices observed in an actively traded market of CDS that do not contain terms and conditions similar to those observed in the financial guaranty market. These models and the related assumptions are continuously reevaluated by the ceding companies and enhanced, as appropriate, based upon improvements in modeling techniques and availability of market information. As of December 31, 2009 and 2008, included in the Company’s outstanding par exposure was $4.0 billion and $5.0 billion, respectively, of credit default swaps that have been fair valued. These derivative instruments had a remaining average legal term to maturity of 15.7 years and 15.8 years, as of December 31, 2009 and 2008, respectively. Actual maturity of credit default swaps is generally expected to be significantly less than the legal term. The Company’s determination of derivative liabilities is not affected by the one-quarter lag in reporting of outstanding par exposure data included in Note 13. The following tables set forth the Company’s exposure to credit derivatives by major asset type as at December 31, 2009 and 2008, net outstanding par is not subject to the one-quarter lag in reporting of data included in Note 13:
December 31, 2009 Net Par
Weighted. Average
Remaining Weighted Average legal
Asset Type (1) Outstanding Credit rating (2) contract term (3) ($ in millions) HY $ 2,637.7 AA 11.5 IG 216.6 AAA 3.8 MS 82.7 AAA 23.0 Other CDO 349.3 AA 32.4 Total CDO 3,286.3 RMBS 325.1 BBB 35.4 Other 377.1 A 18.3 Grand Total $ 3,988.5
December 31, 2008 Net Par
Outstanding Weighted
Average Credit rating (2)
Remaining Weighted Average legal
contract term (3)
Asset Type (1) ($ in millions) HY $ 2,943.9 AAA 11.5 IG 420.6 AAA 4.1 MS 277.9 AAA 18.1 Other CDO 330.2 AAA 32.5 Total CDO 3,972.6 RMBS 473.5 A 36.4 Other 599.5 A 18.4 Grand Total $ 5,045.6
29
(1) The definitions of the collateralized debt obligation (“CDO”) types in the above table are as follows:
HY – Non-investment grade corporates, predominantly CLOs backed by corporate loans
IG – Investment grade corporate (predominantly corporate, may include limited ABS)
MS – Multi-sector collateral, which may include MBS (including subprime), ABS, CDOs, CMBS and other asset-backed securities
(2) For the year ending December 31, 2009, RAM Re ratings are current as of February 28, 2010 (for the year
ending December 31, 2008, ratings were as of February 27, 2009). These ratings are assigned by RAM Re based on management’s judgment and take into consideration the ratings assigned by the ceding companies and the rating agencies. RAM Re undertakes no obligation to update its ratings, and such ratings do not constitute investment advice.
(3) Actual maturity of credit default swaps is generally expected to be significantly less than the legal term. In compliance with the requirements of ASC 820, the Company considered its own non-performance risk when measuring the fair value of a liability. An adjustment to these valuations is needed to reflect the Company's own non performance risk in the measurement of the fair value of these liabilities. There is no observable credit spread for RAM Re or RAM Holdings, and as such there is inherently a significant amount of judgment, subjectivity and uncertainty involved in the estimation of the adjustment for the Company's non-performance risk. Management has used inputs that reflect assumptions market participants may use in pricing the Company’s creditworthiness. In determining the Company’s own non-performance risk when measuring the fair value of a liability, the Company uses an implied market price for buying credit protection on the Company and a cash flow model, which models a CDS contract, to calculate a value price based on those spreads and cash flows. The Company identifies comparable entities with active CDS markets to estimate credit spreads for the Company. Such identification focuses on the nature of risk positions (primarily public finance and structured products), ratings and approximate capital adequacy as depicted by publicly available credit ratings agencies reports. Based on this information, as at December 31, 2009 and 2008, the Company estimated its credit spread to be approximately 2795 and 2254 basis points, respectively. An approximation of a CDS contract is made based on a 5-year insured CDS contract, an assumption of a 9.5 year weighted average life (in 2008, an assumption of a 10.0 year weighted average life), and an assumption for par, coupon, duration and the appropriate discount rate based on a 5-year swap rate. The Company believes that these data points may be considered by hypothetical market participants in determining the Company’s creditworthiness. The Company also considers other data points which may be relevant. These data points include transactions involving the Company’s debt or preferred shares, of which the company had several transactions subsequent to the financial statement date. The Company assesses the interrelationship of market prices for these transactions with the results of applying the implied credit spreads described above. Furthermore, the Company considers the interrelationship between observed market prices for similar buyback transactions of other industry participants and their credit spreads and non-performance risk adjustments. These interrelationships are not always intuitive, nor are they necessarily consistent across all observed market participants. As a result, the Company has not directly incorporated these data points into the calculation of the non-performance risk adjustment, but rather has utilized them as a key point of reference in assessing the reasonableness of the results of the Company’s estimate of the non-performance risk adjustment, The Company will continue to evaluate the significance of any future transactions in the determination of our own credit worthiness. The effect of applying this requirement of ASC 820 was a reduction in the Company’s derivative liability at December 31, 2009 and 2008, of approximately $146.8 million and $203.3 million, respectively. As noted above, this calculation is based on estimates, involves a significant degree of management judgment and is sensitive to selected assumptions. Changes to the assumptions used in this valuation could lead to materially different results. For example, a change in the Company’s estimated spread would have a significant impact on the amount of the adjustment for the Company’s own non-performance risk. Adjustments to the Company’s non-performance risk will be recorded in the periods in which they become known or estimable by the Company. The following table summarizes the estimated changes in fair value of our credit derivatives assuming immediate changes in the Company's non performance credit risk at specified levels at December 31, 2009:
30

Change in Credit Spreads
Estimated Net Fair Value of
Derivative Liability
Impact of Change on Net Income
($ in millions) 1000 basis point narrowing $ (79.7) $ (29.6 ) 500 basis point narrowing (62.3) (12.2 ) 100 basis point narrowing (52.3) (2.2 ) Base scenario (50.1) — 100 basis point widening (48.2) 1.9 500 basis point widening (41.5) 8.6 1000 basis point widening (35.3) 14.8 The Company believes that the above data points are hypothetical with the spread movements used in the sensitivity analysis of 100, 500, and 1000 basis points supported by previous large spread changes that have occurred in the last two years in our primaries’ spreads. Therefore, it is not unreasonable for RAM to use these spread movements in the sensitivity analysis. This calculation is based on estimates, involves a significant degree of management judgment and is sensitive to selected assumptions. Changes to assumptions used in this valuation could lead to materially different results.
The following table sets forth the Company’s derivative liabilities that were accounted for at fair value as of December 31, 2009 and 2008, by level within the fair value hierarchy. As required by ASC 820, items are classified in their entirety based on the lowest level of input that is significant to the fair value measurement, (see Note 2(i) - Significant accounting policies, for a description of each of the three levels): Total Level 1 Level 2 Level 3 December 31, 2009 Derivative liabilities $ 50,135,456 $ — $ — $ 50,135,456 Total Level 1 Level 2 Level 3 December 31, 2008 Derivative liabilities $ 85,353,670 $ — $ — $ 85,353,670 Our credit derivative policies are classified as Level 3 in the above fair value hierarchy since the inputs provided to us by our ceding companies and our own non-performance risk adjustments are from valuation models which place reliance on at least one significant unobservable input. Consistent with the requirements of ASC 820, we believe these models use observable market data when available. The following table presents changes in the net credit derivative liabilities balance for which fair value was measured under Level 3 for the years ended December 31, 2009 and 2008:
Fair value measurement using significant unobservable inputs (Level 3) Years Ended December 31, 2009 2008
Balance, beginning of period $ (85,353,670) $ (180,588,918) Total unrealized gains included in earnings (1) 34,490,512 94,288,456 Total realized gains included in earnings (2) 727,702 946,792 Purchases, issuances and settlements — — Transfers in and/or out of Level 3 — —
31
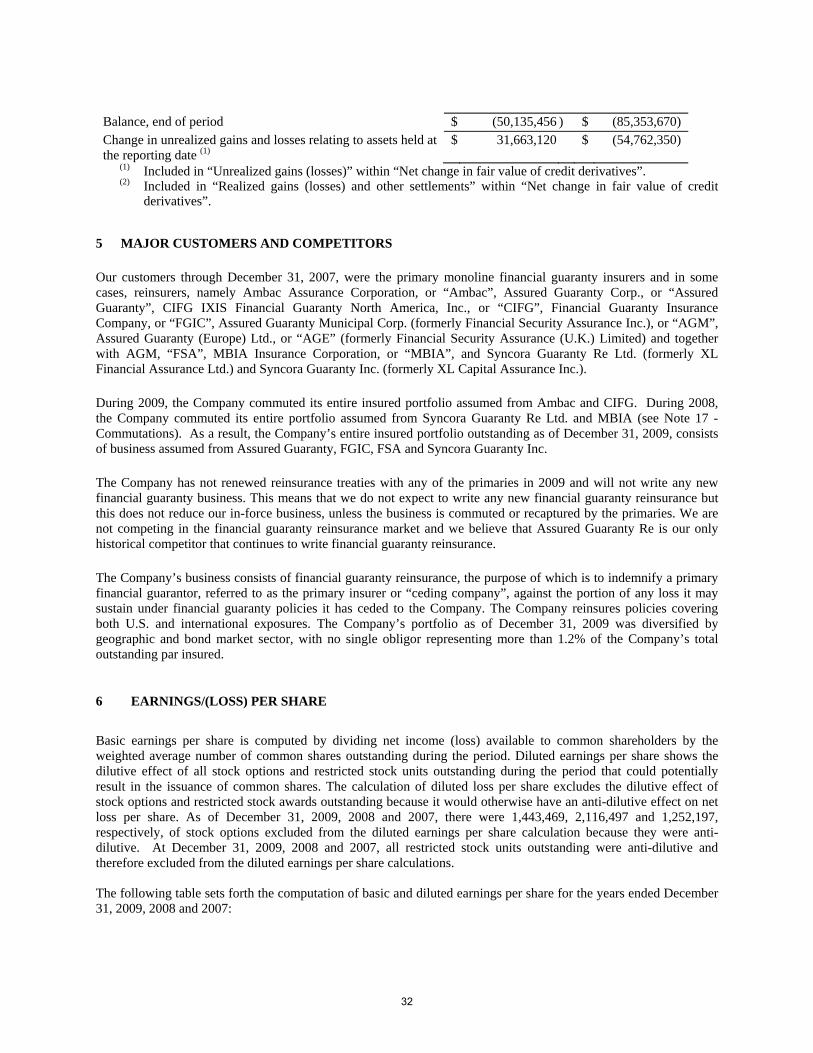
Balance, end of period $ (50,135,456 ) $ (85,353,670) Change in unrealized gains and losses relating to assets held at the reporting date (1)
$ 31,663,120 $ (54,762,350)
(1) Included in “Unrealized gains (losses)” within “Net change in fair value of credit derivatives”. (2) Included in “Realized gains (losses) and other settlements” within “Net change in fair value of credit
derivatives”.
5 MAJOR CUSTOMERS AND COMPETITORS
Our customers through December 31, 2007, were the primary monoline financial guaranty insurers and in some cases, reinsurers, namely Ambac Assurance Corporation, or “Ambac”, Assured Guaranty Corp., or “Assured Guaranty”, CIFG IXIS Financial Guaranty North America, Inc., or “CIFG”, Financial Guaranty Insurance Company, or “FGIC”, Assured Guaranty Municipal Corp. (formerly Financial Security Assurance Inc.), or “AGM”, Assured Guaranty (Europe) Ltd., or “AGE” (formerly Financial Security Assurance (U.K.) Limited) and together with AGM, “FSA”, MBIA Insurance Corporation, or “MBIA”, and Syncora Guaranty Re Ltd. (formerly XL Financial Assurance Ltd.) and Syncora Guaranty Inc. (formerly XL Capital Assurance Inc.).
During 2009, the Company commuted its entire insured portfolio assumed from Ambac and CIFG. During 2008, the Company commuted its entire portfolio assumed from Syncora Guaranty Re Ltd. and MBIA (see Note 17 - Commutations). As a result, the Company’s entire insured portfolio outstanding as of December 31, 2009, consists of business assumed from Assured Guaranty, FGIC, FSA and Syncora Guaranty Inc.
The Company has not renewed reinsurance treaties with any of the primaries in 2009 and will not write any new financial guaranty business. This means that we do not expect to write any new financial guaranty reinsurance but this does not reduce our in-force business, unless the business is commuted or recaptured by the primaries. We are not competing in the financial guaranty reinsurance market and we believe that Assured Guaranty Re is our only historical competitor that continues to write financial guaranty reinsurance.
The Company’s business consists of financial guaranty reinsurance, the purpose of which is to indemnify a primary financial guarantor, referred to as the primary insurer or “ceding company”, against the portion of any loss it may sustain under financial guaranty policies it has ceded to the Company. The Company reinsures policies covering both U.S. and international exposures. The Company’s portfolio as of December 31, 2009 was diversified by geographic and bond market sector, with no single obligor representing more than 1.2% of the Company’s total outstanding par insured.
6 EARNINGS/(LOSS) PER SHARE
Basic earnings per share is computed by dividing net income (loss) available to common shareholders by the weighted average number of common shares outstanding during the period. Diluted earnings per share shows the dilutive effect of all stock options and restricted stock units outstanding during the period that could potentially result in the issuance of common shares. The calculation of diluted loss per share excludes the dilutive effect of stock options and restricted stock awards outstanding because it would otherwise have an anti-dilutive effect on net loss per share. As of December 31, 2009, 2008 and 2007, there were 1,443,469, 2,116,497 and 1,252,197, respectively, of stock options excluded from the diluted earnings per share calculation because they were anti-dilutive. At December 31, 2009, 2008 and 2007, all restricted stock units outstanding were anti-dilutive and therefore excluded from the diluted earnings per share calculations.
The following table sets forth the computation of basic and diluted earnings per share for the years ended December 31, 2009, 2008 and 2007:
32
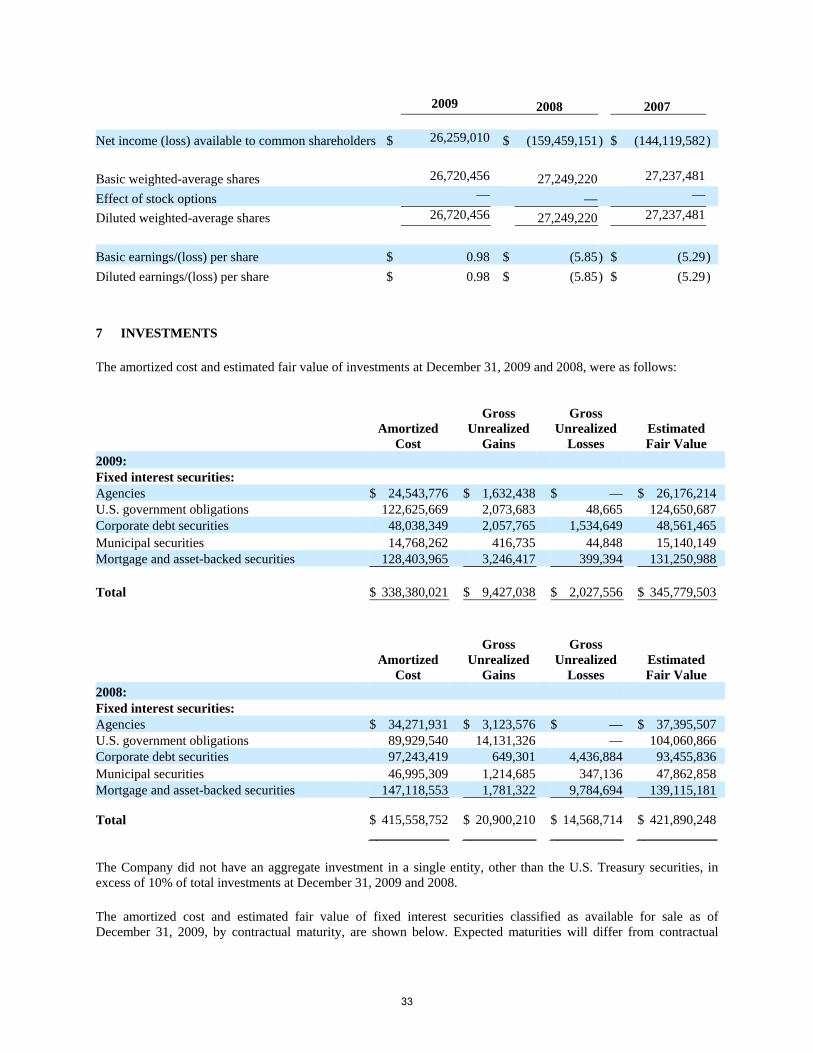
2009 2008 2007
Net income (loss) available to common shareholders $ 26,259,010 $ (159,459,151 ) $ (144,119,582)
Basic weighted-average shares 26,720,456
27,249,220 27,237,481 Effect of stock options —
— — Diluted weighted-average shares 26,720,456
27,249,220 27,237,481
Basic earnings/(loss) per share $ 0.98 $ (5.85 ) $ (5.29) Diluted earnings/(loss) per share $ 0.98 $ (5.85 ) $ (5.29)
7 INVESTMENTS
The amortized cost and estimated fair value of investments at December 31, 2009 and 2008, were as follows:
Amortized
Cost
Gross Unrealized
Gains
Gross Unrealized
Losses Estimated Fair Value
2009: Fixed interest securities: Agencies $ 24,543,776 $ 1,632,438 $ — $ 26,176,214 U.S. government obligations 122,625,669 2,073,683 48,665 124,650,687 Corporate debt securities 48,038,349 2,057,765 1,534,649 48,561,465
Municipal securities 14,768,262 416,735 44,848 15,140,149 Mortgage and asset-backed securities 128,403,965 3,246,417 399,394 131,250,988
Total $ 338,380,021 $ 9,427,038 $ 2,027,556 $ 345,779,503
Amortized
Cost
Gross Unrealized
Gains
Gross Unrealized
Losses Estimated Fair Value
2008: Fixed interest securities: Agencies $ 34,271,931 $ 3,123,576 $ — $ 37,395,507 U.S. government obligations 89,929,540 14,131,326 — 104,060,866 Corporate debt securities 97,243,419 649,301 4,436,884 93,455,836
Municipal securities 46,995,309 1,214,685 347,136 47,862,858 Mortgage and asset-backed securities 147,118,553 1,781,322 9,784,694 139,115,181
Total $ 415,558,752 $ 20,900,210 $ 14,568,714 $ 421,890,248
The Company did not have an aggregate investment in a single entity, other than the U.S. Treasury securities, in excess of 10% of total investments at December 31, 2009 and 2008.
The amortized cost and estimated fair value of fixed interest securities classified as available for sale as of December 31, 2009, by contractual maturity, are shown below. Expected maturities will differ from contractual
33

maturities because borrowers may have the right to call or repay obligations with or without call or prepayment penalties.
Amortized
Cost Estimated Fair Value
2009
Less than one year $ 27,897,852 $ 29,030,894
Due after one year through five years 135,465,734 137,299,787
Due after five years through ten years 25,495,080 26,997,117
Due after ten years 21,117,390 21,200,717
Mortgage and asset-backed securities 128,403,965 131,250,988
Total $ 338,380,021 $ 345,779,503
The investments that have unrealized loss positions as of December 31, 2009 and 2008, aggregated by investment category and the length of time they have been in a continued unrealized loss position, are as follows:
Less Than 12 Months 12 Months or More Total
Fair Value Unrealized
Loss Fair Value Unrealized
Loss Fair Value Unrealized
Loss2009: Fixed income securities Agencies $ — $ — $ — $ — $ — $ —U.S. government
obligations 7,450,785 48,665 — — 7,450,785 48,665Corporate debt securities 3,441,680 594,759 8,158,330 939,890 11,600,010 1,534,649Municipal securities 3,095,789 44,848 — — 3,095,789 44,848Mortgage and asset-
backed securities 13,886,889 339,302 8,239,908 60,092 22,126,797 399,394 Total temporarily
impaired securities $ 27,875,143 $ 1,027,574 $ 16,398,238 $ 999,982 $ 44,273,381 $ 2,027,556 2008: Fixed income securities Agencies $ — $ — $ — $ — $ — $ —U.S. government
obligations — — — — — —Corporate debt securities 39,994,277 2,329,422 10,937,059 2,107,462 50,931,336 4,436,884Municipal securities 10,862,873 347,136 — — 10,862,873 347,136Mortgage and asset-
backed securities 61,019,974 7,896,072 12,840,269 1,888,622 73,860,243 9,784,694 Total temporarily
impaired securities $ 111,877,124 $ 10,572,630 $ 23,777,328 $ 3,996,084 $ 135,654,452 $ 14,568,714
As of December 31, 2009, 11 out of 133 securities were in unrealized loss positions compared to 48 out of 151 securities as of December 31, 2008. As at December 31, 2009, the Company’s gross unrealized loss position was $2.0 million compared to $14.6 million at December 31, 2008. The decrease is primarily related to decreases of $2.9 million and $9.4 million in corporate securities and mortgage and asset-backed securities, respectively. The decrease in the unrealized losses as at December 31, 2009, is primarily attributable to a decrease in the Company’s portfolio
34

by $76.1 million during the year along with the improved conditions in the financial markets. Management does not believe these investments to be other than temporarily impaired and has no intention to sell the securities. Unrealized gains and losses relating to investments are currently recorded in accumulated other comprehensive income in shareholders’ equity as the Company generally holds these investments to maturity. The unrealized gains and losses are expected to decrease as the investment approaches maturity and the Company expects to realize a value substantially equal to amortized cost. Of the securities in an unrealized loss position of 12 months or more as of December 31, 2009, three securities had an unrealized loss of greater than 10% of the book value. For two of these securities the credit component of the loss has been recognized in income for the year. The balance of the loss is not considered to be due to expected credit losses but to other market factors including volatility in the US financial markets.
During the year ended December 31, 2009, 2008 and 2007, the Company recognized other than temporary impairments of $5.1 million, $10.5 million and $3.6 million, respectively. The Company recognized $0.9 million relating to an investment with subprime exposure, the fair value of this investment was $0.3 million at December 31, 2009, and a credit loss of $0.1 million was taken on another bond with subprime exposure, the fair value of this security was $0.1 million at December 31, 2009. $2.0 million was recognized on securities which the company had the intent to sell in the period. A loss of $2.1 million was recognized on a corporate bond which the company believed to be other than temporarily impaired in the first quarter of 2009. On implementation of the new guidance on OTTI during the second quarter of 2009, $1.9 million of this OTTI was reversed through retained earnings to leave only the credit portion of the loss in retained earnings. Where an other than temporary impairment is identified, the credit losses have been determined based on the estimated present value of cash flows using the appropriate discount rate based on the book yield and making assumptions for defaults based on the rating or current delinquencies on the securities.
During the year ended December 31, 2008, four securities were other than temporarily impaired, two of which were corporate bonds that realized a total of $8.2 million of losses and two were bonds with subprime exposure realizing losses of $2.3 million. During the year ended December 31, 2007, other than temporary impairment losses on one security with subprime exposure was taken of $3.6 million.
The company has no material investments in securities guaranteed by third parties and has no direct investments in financial guarantors as at December 31, 2009 and 2008. During the year ended December 31, 2009, only the Company’s investment in the Lehman securities, with a fair value of $1.7 million, was non income producing for the preceding 12 months. OTTI was taken on these securities during the year ended December 31, 2008.
Proceeds from maturities and sales of investments in fixed interest securities available for sale during 2009, 2008, and 2007, were $279,559,894, $517,447,080, and $128,096,094 respectively. Gross gains of $9,016,386, $10,252,643 and $6,007 in 2009, 2008, and 2007, respectively, and gross losses of $149,530, $2,140,491, and $10,227 in 2009, 2008, and 2007, respectively, were realized on those sales.
Major categories of net investment income are summarized as follows:
2009 2008 2007 Interest from debt securities and cash equivalents $ 14,946,376 $ 31,287,276 $ 33,684,707 Pension plan (losses)/gains 29,984 (1,033,612 ) 317,205 Investment expense (545,161) (895,594 ) (891,300) Net investment income $ 14,431,199 $ 29,358,070 $ 33,110,612
35
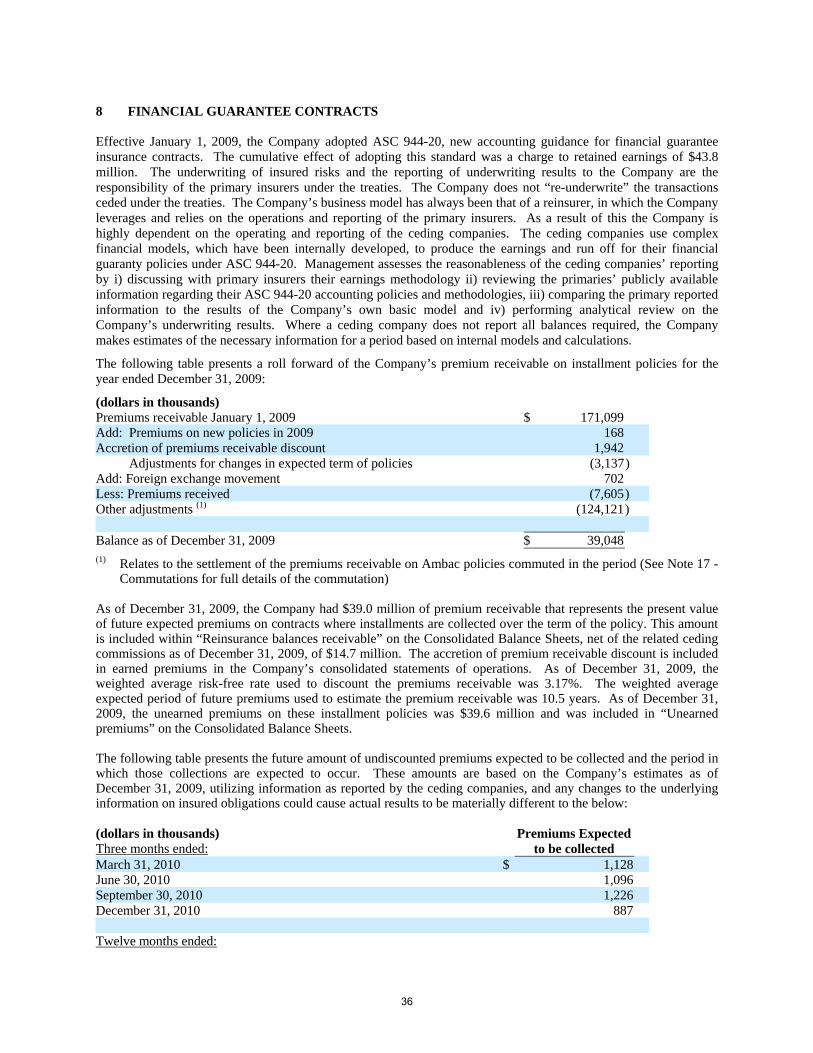
8 FINANCIAL GUARANTEE CONTRACTS Effective January 1, 2009, the Company adopted ASC 944-20, new accounting guidance for financial guarantee insurance contracts. The cumulative effect of adopting this standard was a charge to retained earnings of $43.8 million. The underwriting of insured risks and the reporting of underwriting results to the Company are the responsibility of the primary insurers under the treaties. The Company does not “re-underwrite” the transactions ceded under the treaties. The Company’s business model has always been that of a reinsurer, in which the Company leverages and relies on the operations and reporting of the primary insurers. As a result of this the Company is highly dependent on the operating and reporting of the ceding companies. The ceding companies use complex financial models, which have been internally developed, to produce the earnings and run off for their financial guaranty policies under ASC 944-20. Management assesses the reasonableness of the ceding companies’ reporting by i) discussing with primary insurers their earnings methodology ii) reviewing the primaries’ publicly available information regarding their ASC 944-20 accounting policies and methodologies, iii) comparing the primary reported information to the results of the Company’s own basic model and iv) performing analytical review on the Company’s underwriting results. Where a ceding company does not report all balances required, the Company makes estimates of the necessary information for a period based on internal models and calculations.
The following table presents a roll forward of the Company’s premium receivable on installment policies for the year ended December 31, 2009:
(dollars in thousands) Premiums receivable January 1, 2009 $ 171,099 Add: Premiums on new policies in 2009 168 Accretion of premiums receivable discount 1,942 Adjustments for changes in expected term of policies (3,137 ) Add: Foreign exchange movement 702 Less: Premiums received (7,605 ) Other adjustments (1) (124,121 ) Balance as of December 31, 2009 $ 39,048 (1) Relates to the settlement of the premiums receivable on Ambac policies commuted in the period (See Note 17 -
Commutations for full details of the commutation) As of December 31, 2009, the Company had $39.0 million of premium receivable that represents the present value of future expected premiums on contracts where installments are collected over the term of the policy. This amount is included within “Reinsurance balances receivable” on the Consolidated Balance Sheets, net of the related ceding commissions as of December 31, 2009, of $14.7 million. The accretion of premium receivable discount is included in earned premiums in the Company’s consolidated statements of operations. As of December 31, 2009, the weighted average risk-free rate used to discount the premiums receivable was 3.17%. The weighted average expected period of future premiums used to estimate the premium receivable was 10.5 years. As of December 31, 2009, the unearned premiums on these installment policies was $39.6 million and was included in “Unearned premiums” on the Consolidated Balance Sheets. The following table presents the future amount of undiscounted premiums expected to be collected and the period in which those collections are expected to occur. These amounts are based on the Company’s estimates as of December 31, 2009, utilizing information as reported by the ceding companies, and any changes to the underlying information on insured obligations could cause actual results to be materially different to the below: (dollars in thousands) Premiums Expected Three months ended: to be collected March 31, 2010 $ 1,128 June 30, 2010 1,096 September 30, 2010 1,226 December 31, 2010 887 Twelve months ended:
36
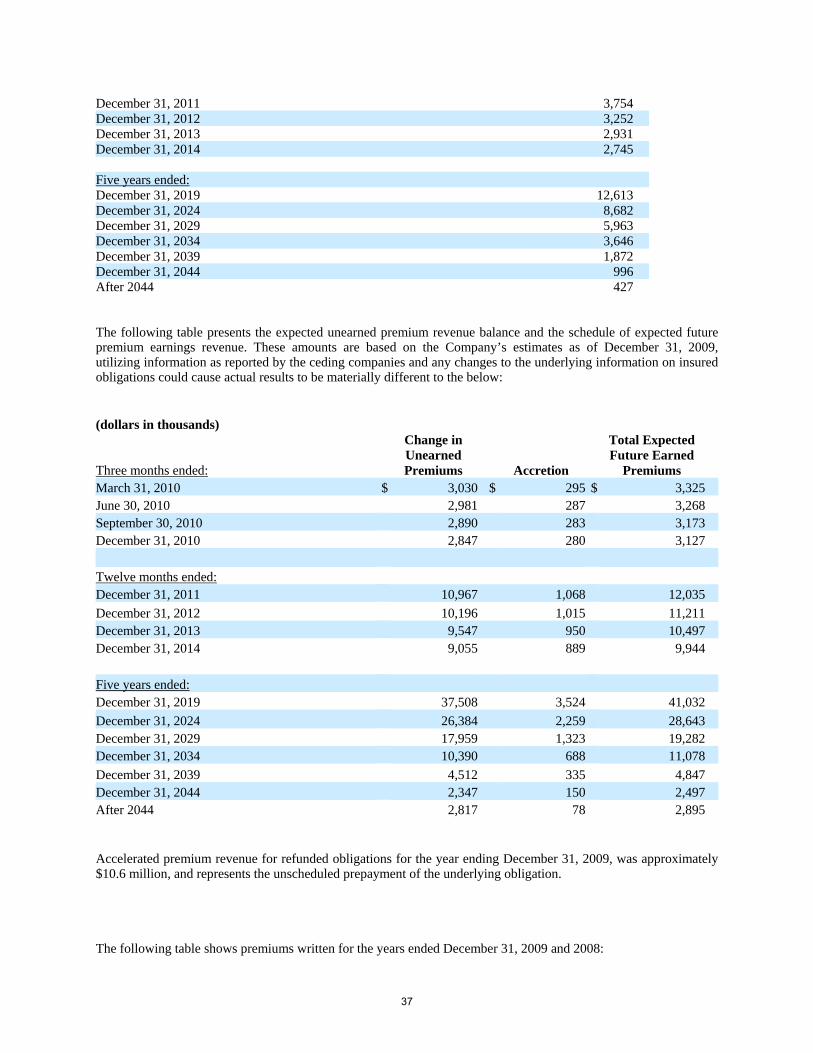
December 31, 2011 3,754 December 31, 2012 3,252 December 31, 2013 2,931 December 31, 2014 2,745 Five years ended: December 31, 2019 12,613 December 31, 2024 8,682 December 31, 2029 5,963 December 31, 2034 3,646 December 31, 2039 1,872 December 31, 2044 996 After 2044 427 The following table presents the expected unearned premium revenue balance and the schedule of expected future premium earnings revenue. These amounts are based on the Company’s estimates as of December 31, 2009, utilizing information as reported by the ceding companies and any changes to the underlying information on insured obligations could cause actual results to be materially different to the below: (dollars in thousands)
Three months ended:
Change in Unearned Premiums Accretion
Total Expected Future Earned
Premiums March 31, 2010 $ 3,030 $ 295 $ 3,325 June 30, 2010 2,981 287 3,268 September 30, 2010 2,890 283 3,173 December 31, 2010 2,847 280 3,127 Twelve months ended: December 31, 2011 10,967 1,068 12,035 December 31, 2012 10,196 1,015 11,211 December 31, 2013 9,547 950 10,497 December 31, 2014 9,055 889 9,944 Five years ended: December 31, 2019 37,508 3,524 41,032 December 31, 2024 26,384 2,259 28,643 December 31, 2029 17,959 1,323 19,282 December 31, 2034 10,390 688 11,078 December 31, 2039 4,512 335 4,847 December 31, 2044 2,347 150 2,497 After 2044 2,817 78 2,895 Accelerated premium revenue for refunded obligations for the year ending December 31, 2009, was approximately $10.6 million, and represents the unscheduled prepayment of the underlying obligation. The following table shows premiums written for the years ended December 31, 2009 and 2008:
37

2009 2008 2007
Gross Premiums written (1) $ (154,389,415) $ (11,214,227 ) $ 98,500,663 Ceded Premiums 1,811,330 (509,190 ) (751,528) Net Premiums written $ (152,578,085) $ (11,723,417 ) $ 97,749,135 (1) See Note 17 – Commutations for details of commutations in the period included within these numbers. Included in Net Premiums written in 2009 was accretion of the premiums receivable of $1.9 million. Accretion of the ceding commissions payable of $0.6 million (netted off premiums receivable to get net premiums receivable) is included in acquisition expenses for the period.
9 REINSURANCE
On July 1, 2005, the Company entered into a retrocession agreement with a “AA” rated financial guaranty company, which has been downgraded to Ba1 by Moody’s and BB- by S&P as of December 31, 2009, to retrocede certain business that exceeds its single-risk limits on a facultative basis, thereby limiting its exposure to loss from large individual risks. This retrocessional agreement does not relieve RAM Re from its obligation to the reinsured. The retrocessional agreement required an annual minimum of $1.0 million written premiums or $750,000 in premiums written and $1.5 million of adjusted gross premiums (a non GAAP measure of business assumed during a period) on installment transactions. This agreement was terminated on a “run-off” basis effective December 31, 2008. On December 31, 2009, the Company commuted its retrocessional agreement for $0.7 million, realizing an immaterial gain on commutation. As of December 31, 2009, $0.7 million was included in “Reinsurance balances receivable” on the Consolidated Balance Sheets, relating to the final amount due RAM Re on commutation of this policy.
10 CONTINGENT CAPITAL, CREDIT FACILITIES AND NONCONTROLLING INTEREST
As of December 31, 2009 and 2008, RAM Re has contingent capital and credit facilities totaling $Nil and $180 million, respectively, the details of which are discussed below.
The Company maintained a $90.0 million credit facility with major commercial banks. The facility could be drawn upon by the Company if cumulative losses exceed certain minimum thresholds in respect of cumulative losses on public finance bonds and, in a limited capacity, asset-backed securities reinsured by the Company. Loan obligations under this facility had limited recourse and would be repayable from, and collateralized by, a pledge of recoveries realized on defaulted reinsured obligations covered by the facility, including certain installment premiums and other collateral. The Company also maintained a second $40.0 million contingent capital facility with two highly rated commercial banks. This facility was essentially the same as the $90.0 million contingent capital facility described above although it could be drawn upon only to cover catastrophic losses, exceeding the minimum threshold, from public finance obligations reinsured by RAM Re. Loan obligations under this facility also had limited recourse and were repayable from, and collateralized by, a pledge of recoveries realized on defaulted reinsured obligations covered by this facility, including certain installment premiums and other collateral, on a subordinate basis to the pledge made to secure the $90.0 million facility described above. Effective May 13, 2009, the Company cancelled the above two credit facilities with immediate effect.
On December 23, 2003, RAM Re entered into a $50.0 million soft capital facility whereby it was granted the right to exercise perpetual put options in respect of its Class B Preference Shares against the counterparty to the option agreement, in return for which it paid the counterparty a floating put option fee through February 17, 2009. The counterparty was a trust established by an investment bank. The trust was created as a vehicle for providing capital support to RAM Re by allowing it to obtain, at its discretion and subject to the terms of the option agreement, access to new capital through the exercise of a put option and the subsequent purchase by the trust of RAM Re Preference Shares. On February 17, 2009, RAM Re exercised the put option in the soft capital facility and issued 500.01 Class B Preference Shares to the trust in exchange for $50,001,000 of proceeds. On March 16, 2009, RAM Re elected to
38

pay a fixed rate dividend on the Class B Preference Shares, as a result of which the Class B Preference Shares were distributed to the holders of the trust’s securities and the trust is now in the process of dissolution. As a result of the fixed rate election, dividends are payable on the Class B Preference Shares every 90 days at a rate of 6.276%. The Class B Preference Shares give investors the rights of an equity investor in RAM Re. Such rights are subordinate to insurance claims, as well as the general unsecured creditors of RAM Re. Dividends on the Class B Preference Shares are cumulative, only if RAM Re pays dividends on its common shares without paying accrued and unpaid dividends on the Class B Preference Shares. The Class B Preference Shares are not rated by S&P since the Company requested the withdrawal of its ratings during 2009 and have not been rated by Moody’s. RAM Re has the option to redeem the Class B Preference Shares, subject to certain specified terms and conditions. The fair value of the put option at the exercise date was $41.9 million and therefore the value of the preference shares was $8.1 million, being the difference between the proceeds received and the fair value of the put option on the date of exercise. The value of the preference shares of $8.1 million is included as a “Noncontrolling interest” in the Company’s Consolidated Balance Sheets as at December 31, 2009.
The terms of RAM Re’s Class B Preference Shares restrict RAM Re’s ability to pay dividends on its common shares unless all accrued and unpaid dividends on the Class B Preference Shares for the then current dividend period have been declared and paid or a sum sufficient for payment thereof set apart. There is an exception however that permits RAM Re to declare dividends on its common shares in such amounts as are necessary for RAM Holdings (i) to service indebtedness for borrowed money as such payments become due (or to satisfy any of its guarantee obligations made in respect of indebtedness of RAM Re or RAM Holdings) or (ii) to pay its operating expenses. On May 12, 2009, the Board of Directors determined to pay dividends up to June 15, 2009, and suspend dividend payments thereafter on these Class B Preference Shares. During the year ended December 31, 2009, dividends of $0.9 million were paid to the Class B preference shareholders, which is included as “Noncontrolling interest – dividends on preferred shares of subsidiary” in the Company’s Consolidated Statement of Operations. If RAM Re fails to pay dividends in full on the Class B Preference Shares for eighteen consecutive months then the number of members on the Board of Directors of RAM Re is automatically increased by two with the holders of the Class B Preference Shares having the ability to elect the two additional directors. See Note 27 – Subsequent events, for further information on these preference shares. 11 FAIR VALUE OF FINANCIAL INSTRUMENTS
Fair Value Measurements
The Company follows the guidance of ASC 820 for fair value measurement of financial instruments. ASC 820 establishes a hierarchy of inputs in measuring fair value, with the highest level being observable inputs and the lowest being unobservable data, with the standard requiring that the use of observable inputs is maximized (see Note 2(i) - Significant accounting policies for a description of each of the three levels). The following table presents the fair value measurement levels for assets and liabilities, which the Company has recorded at fair value as of December 31, 2009 and 2008. As required by ASC 820, items are classified in their entirety based on the lowest level of input that is significant to the fair value measurement:
December 31, 2009 Total Level 1 Level 2 Level 3 Financial Assets: Fixed maturity investments Agencies $ 26,176,214 $ — $ 26,176,214 $ — U.S. government obligations 124,650,687 47,742,021 76,908,666 — Corporate debt securities 48,561,466 — 48,561,466 — Municipal securities 15,140,149 — 15,140,149 — Mortgage and asset-backed securities 131,250,988 — 130,969,849 281,139 Total fixed maturity investments 345,779,503 47,742,021 297,756,343 281,139 Cash and Cash Equivalents 9,311,110 9,311,110 — —
39

Restricted Cash 2,884,962 2,884,962 — — Other financial instruments — — — — % of assets at fair value 100% 17% 83 % 0% Financial Liabilities: Derivative Liabilities (1) $ 50,135,456 $ — $ — $ 50,135,456 % of liabilities at Fair value 100% — — 100% December 31, 2008 Total Level 1 Level 2 Level 3 Financial Assets: Fixed maturity investments Agencies $ 37,395,507 $ — $ 37,395,507 $ — U.S. government obligations 104,060,865 100,160,253 3,900,612 — Corporate debt securities 93,455,836 — 93,455,836 — Municipal securities 47,862,858 — 47,862,858 — Mortgage and asset-backed securities 139,115,182 — 138,905,059 210,123 Total fixed maturity investments 421,890,248 100,160,253 321,519,872 210,123 Cash and Cash Equivalents 8,763,063 8,763,063 — — Restricted Cash 8,284,458 8,284,458 — — Other financial instruments 43,083,370 — — 43,083,370 % of assets at fair value 100% 24% 67 % 9% Financial Liabilities: Derivative Liabilities (1) $ 85,353,670 $ — $ — $ 85,353,670 % of liabilities at Fair value 100% — — 100%
(1) See Note 4 - Derivative Instruments for further disclosures on the application of ASC 820 to the Company’s derivative liabilities.
Fixed maturity investments
The Company’s fair values of fixed maturity and short-term investments are based on prices obtained from nationally recognized independent pricing services. Where available, the prices are obtained from market quotations in active markets. Where there is no quoted price for an identical security, then the pricing service may use matrix pricing or model processes, such as the option adjusted spread model, to estimate the fair value of a security. The matrix pricing or model processes consist primarily of observable inputs, which may include; benchmark yields, reported trades, broker/dealer quotes, issuer spreads, two-sided markets, benchmark securities, bids, offers and reference data. The Company receives at least one fair value price for each of its investment securities and has not adjusted any of the prices received from the pricing services.
At December 31, 2009 and 2008, all but one of the Company’s investments were valued using the independent pricing services. One security, which had a fair value of $0.3 million and $0.2 million as of December 31, 2009 and 2008, respectively, had no active market and includes subprime exposure, was valued using a non-binding broker quote. This security is included within level 3 in the fair value hierarchy.
40
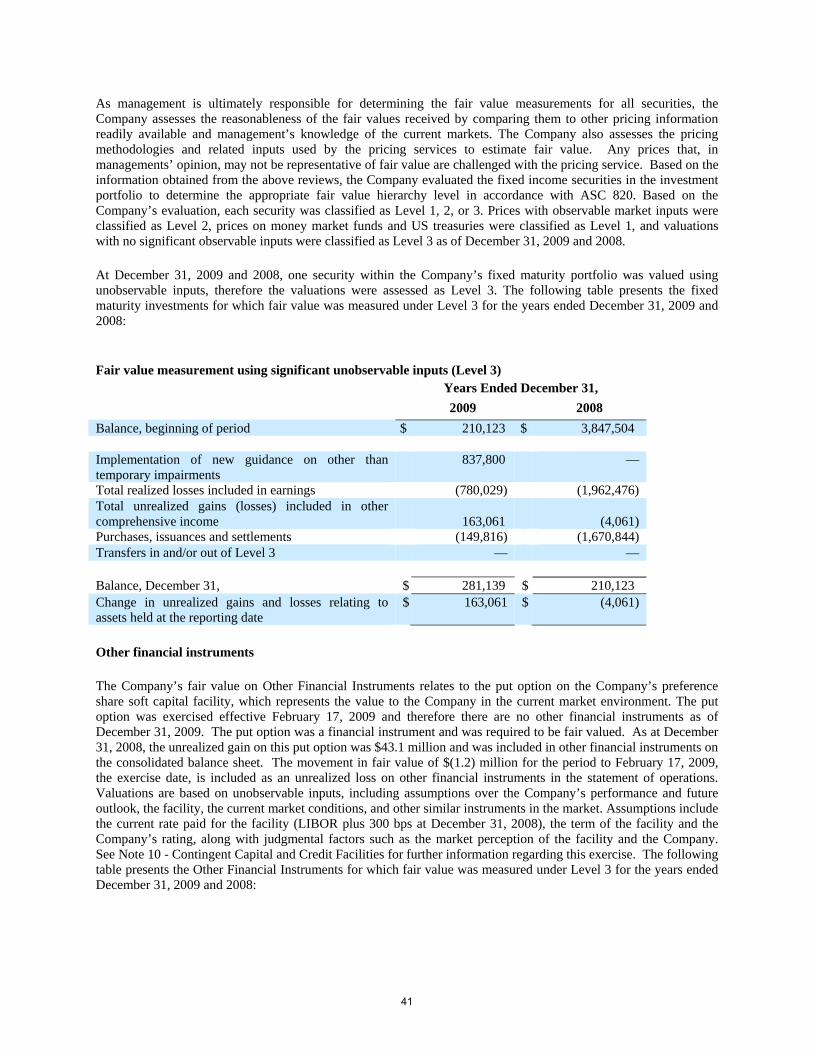
As management is ultimately responsible for determining the fair value measurements for all securities, the Company assesses the reasonableness of the fair values received by comparing them to other pricing information readily available and management’s knowledge of the current markets. The Company also assesses the pricing methodologies and related inputs used by the pricing services to estimate fair value. Any prices that, in managements’ opinion, may not be representative of fair value are challenged with the pricing service. Based on the information obtained from the above reviews, the Company evaluated the fixed income securities in the investment portfolio to determine the appropriate fair value hierarchy level in accordance with ASC 820. Based on the Company’s evaluation, each security was classified as Level 1, 2, or 3. Prices with observable market inputs were classified as Level 2, prices on money market funds and US treasuries were classified as Level 1, and valuations with no significant observable inputs were classified as Level 3 as of December 31, 2009 and 2008.
At December 31, 2009 and 2008, one security within the Company’s fixed maturity portfolio was valued using unobservable inputs, therefore the valuations were assessed as Level 3. The following table presents the fixed maturity investments for which fair value was measured under Level 3 for the years ended December 31, 2009 and 2008:
Fair value measurement using significant unobservable inputs (Level 3) Years Ended December 31, 2009 2008 Balance, beginning of period $ 210,123 $ 3,847,504 Implementation of new guidance on other than temporary impairments
837,800 —
Total realized losses included in earnings (780,029) (1,962,476) Total unrealized gains (losses) included in other comprehensive income
163,061 (4,061)
Purchases, issuances and settlements (149,816) (1,670,844) Transfers in and/or out of Level 3 — — Balance, December 31, $ 281,139 $ 210,123 Change in unrealized gains and losses relating to assets held at the reporting date
$ 163,061 $ (4,061)
Other financial instruments
The Company’s fair value on Other Financial Instruments relates to the put option on the Company’s preference share soft capital facility, which represents the value to the Company in the current market environment. The put option was exercised effective February 17, 2009 and therefore there are no other financial instruments as of December 31, 2009. The put option was a financial instrument and was required to be fair valued. As at December 31, 2008, the unrealized gain on this put option was $43.1 million and was included in other financial instruments on the consolidated balance sheet. The movement in fair value of $(1.2) million for the period to February 17, 2009, the exercise date, is included as an unrealized loss on other financial instruments in the statement of operations. Valuations are based on unobservable inputs, including assumptions over the Company’s performance and future outlook, the facility, the current market conditions, and other similar instruments in the market. Assumptions include the current rate paid for the facility (LIBOR plus 300 bps at December 31, 2008), the term of the facility and the Company’s rating, along with judgmental factors such as the market perception of the facility and the Company. See Note 10 - Contingent Capital and Credit Facilities for further information regarding this exercise. The following table presents the Other Financial Instruments for which fair value was measured under Level 3 for the years ended December 31, 2009 and 2008:
41

Fair value measurement using significant unobservable inputs (Level 3) Years Ended December 31, 2009 2008 Balance, beginning of period $ 43,083,370 $ 35,330,000 Total unrealized (losses) gains included in earnings (1,196,760) 7,753,370 Purchases, issuances and settlements (41,886,610) — Transfers in and/or out of Level 3 — — Balance, December 31, $ — $ 43,083,370 Change in unrealized gains and losses relating to assets held at the reporting date
$ — $ 7,753,370
Since there was no active market for the put option and due to the significant number of unobservable inputs used in the valuation, the put option valuation had been classified as a Level 3 fair value measurement.
Other fair value disclosures
Management has estimated the fair value of certain financial instruments based upon market information using appropriate valuation methodologies. Fair value estimates are not necessarily indicative of the amount the Company could realize in a current market exchange.
The carrying amounts of cash and cash equivalents, interest, other assets, reinsurance balances receivable and payable, accounts payable and accrued liabilities and other liabilities are considered reasonable estimates of their fair values.
As of December 31, 2009, the fair value of the Company’s $75.0 million redeemable preference shares was approximately $18.8 million and the fair values of the Company’s long-term debt is estimated to be approximately $19.3 million. These fair value estimates are based on trades in our preferred shares and long-term debt subsequent to the year end (see Note 27 - Subsequent events) and is the Company’s best estimate of the fair value of these financial instruments. Accrued interest payable is assumed to approximate carrying value.
As of December 31, 2009, the carrying amount of unearned premiums represents the unearned premium collected at inception of the policy where premiums are paid upfront, and for policies where the premiums are received in installments. The unearned premium represents the unearned portion of the present value of premiums expected to be collected over the contract period, discounted at a risk free rate.. The fair value of the unearned premiums is the value the Company would receive to transfer those obligations. The Company’s market would be the financial guarantee insurance and reinsurance industry participants, similar to that used in the calculation of fair value of insured credit default swap contracts. Unearned premiums are generally collateralized by the Company by placing assets in trust for the benefit of the ceding company. The Company perceives the fair value to approximate the carrying value. As of December 31, 2008, the carrying amount of unearned premium for upfront policies approximates fair value, however, installment premiums, consistent with industry standards at the time, were not carried on the balance sheet. The estimated fair value of installment premiums as of December 31, 2008, was the present value of the future contractual premiums that were expected to be received under a reinsurance agreement of $87.1 million.
The following table sets out the carrying amounts and the estimated fair values of the Company’s financial instruments at December 31, 2009 and 2008:
42

Years Ended December 31, 2009 2008 Carrying
Amount Fair Value Carrying
Amount Fair Value
Financial Assets: Investments $ 345,779,503 $ 345,779,503 $ 421,890,248 $ 421,890,248 Cash and cash equivalents 9,311,110 9,311,110 8,763,062 8,763,062 Restricted cash 2,884,962 2,884,962 8,284,459 8,284,459 Reinsurance balances receivable 22,344,848 22,344,848 1,115,413 1,115,413 Financial instruments at fair value — — 43,083,370 43,083,370 Financial Liabilities: Losses and loss expenses reserves net of recoveries
45,319,658 45,319,658
93,997,412
93,997,412
Unearned premiums, net of reinsurance 153,429,709 153,429,709 156,994,564 156,994,564 Reinsurance balances payable — — 24,621,111 24,621,111 Derivative liabilities 50,135,456 50,135,456 85,353,670 85,353,670 Long-term debt 35,000,000 19,250,000 40,000,000 12,000,000 Redeemable preference shares 75,000,000 18,750,000 75,000,000 10,400,000 Off balance sheet instruments: Financial guaranty contracts future installment premiums
—
—
—
87,120,858
12 LOSSES AND LOSS EXPENSE RESERVE
The Company’s loss and loss expense reserve as of December 31, 2009, only represents case basis loss reserves, or claim liability, established in accordance with ASC 944-20. Refer to Note 2 - Significant Accounting Policies for a description of the Company’s accounting policy for insurance losses and the impact of the adoption of ASC 944-20 on the Company’s financial statements. In connection with the Company’s adoption of ASC 944-20, beginning January 1, 2009, the Company no longer recognizes an unallocated loss reserve.
A summary of the movement in the provision for losses and loss adjustment expenses for the years December 31, 2009, 2008 and 2007, are presented in the following table: 2009 2008 2007 Case basis loss reserves: Balance – Beginning of year $ 81,787,220 $ 30,447,036 $ 3,009,524 Less: Recoverables on paid losses (1,796,842) (1,807,941 ) (915,900) Less: ASC 944-20 transition adjustment, net 39,873,155 — — Net balance – Beginning of year 119,863,533 28,639,095 2,093,624 Additions to case reserves related to: Current year — — 8,036,791 Prior years 20,683,918 234,171,794 18,134,969 20,683,918 234,171,794 26,171,760 Net losses paid related to: Current year — — — Prior years 95,227,793 182,820,511 (373,711)
43
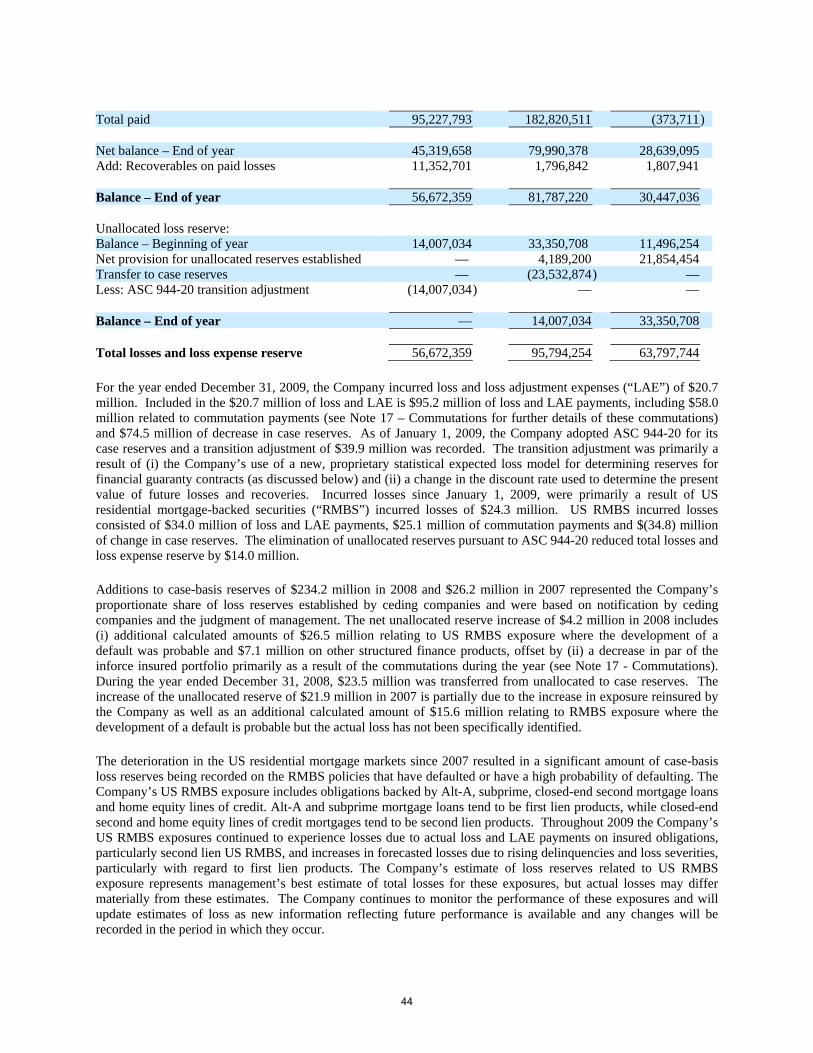
Total paid 95,227,793 182,820,511 (373,711) Net balance – End of year 45,319,658 79,990,378 28,639,095 Add: Recoverables on paid losses 11,352,701 1,796,842 1,807,941 Balance – End of year 56,672,359 81,787,220 30,447,036 Unallocated loss reserve: Balance – Beginning of year 14,007,034 33,350,708 11,496,254 Net provision for unallocated reserves established — 4,189,200 21,854,454 Transfer to case reserves — (23,532,874 ) — Less: ASC 944-20 transition adjustment (14,007,034) — — Balance – End of year — 14,007,034 33,350,708 Total losses and loss expense reserve 56,672,359 95,794,254 63,797,744
For the year ended December 31, 2009, the Company incurred loss and loss adjustment expenses (“LAE”) of $20.7 million. Included in the $20.7 million of loss and LAE is $95.2 million of loss and LAE payments, including $58.0 million related to commutation payments (see Note 17 – Commutations for further details of these commutations) and $74.5 million of decrease in case reserves. As of January 1, 2009, the Company adopted ASC 944-20 for its case reserves and a transition adjustment of $39.9 million was recorded. The transition adjustment was primarily a result of (i) the Company’s use of a new, proprietary statistical expected loss model for determining reserves for financial guaranty contracts (as discussed below) and (ii) a change in the discount rate used to determine the present value of future losses and recoveries. Incurred losses since January 1, 2009, were primarily a result of US residential mortgage-backed securities (“RMBS”) incurred losses of $24.3 million. US RMBS incurred losses consisted of $34.0 million of loss and LAE payments, $25.1 million of commutation payments and $(34.8) million of change in case reserves. The elimination of unallocated reserves pursuant to ASC 944-20 reduced total losses and loss expense reserve by $14.0 million.
Additions to case-basis reserves of $234.2 million in 2008 and $26.2 million in 2007 represented the Company’s proportionate share of loss reserves established by ceding companies and were based on notification by ceding companies and the judgment of management. The net unallocated reserve increase of $4.2 million in 2008 includes (i) additional calculated amounts of $26.5 million relating to US RMBS exposure where the development of a default was probable and $7.1 million on other structured finance products, offset by (ii) a decrease in par of the inforce insured portfolio primarily as a result of the commutations during the year (see Note 17 - Commutations). During the year ended December 31, 2008, $23.5 million was transferred from unallocated to case reserves. The increase of the unallocated reserve of $21.9 million in 2007 is partially due to the increase in exposure reinsured by the Company as well as an additional calculated amount of $15.6 million relating to RMBS exposure where the development of a default is probable but the actual loss has not been specifically identified.
The deterioration in the US residential mortgage markets since 2007 resulted in a significant amount of case-basis loss reserves being recorded on the RMBS policies that have defaulted or have a high probability of defaulting. The Company’s US RMBS exposure includes obligations backed by Alt-A, subprime, closed-end second mortgage loans and home equity lines of credit. Alt-A and subprime mortgage loans tend to be first lien products, while closed-end second and home equity lines of credit mortgages tend to be second lien products. Throughout 2009 the Company’s US RMBS exposures continued to experience losses due to actual loss and LAE payments on insured obligations, particularly second lien US RMBS, and increases in forecasted losses due to rising delinquencies and loss severities, particularly with regard to first lien products. The Company’s estimate of loss reserves related to US RMBS exposure represents management’s best estimate of total losses for these exposures, but actual losses may differ materially from these estimates. The Company continues to monitor the performance of these exposures and will update estimates of loss as new information reflecting future performance is available and any changes will be recorded in the period in which they occur.
44

As of December 31, 2009 and 2008, the Company gave credit of $32.6 million and $28.8 million, respectively, in its case reserves for the benefit of expected recoveries in US RMBS transactions resulting from required repurchases by the originators due to contractual breaches of representations and warranties in the RMBS securitization agreements. As of December 31, 2007, the Company did not give credit for such repurchase recoveries. The credit given at year-end 2009 and 2008 matches the credit reported to the Company by the ceding companies in their ceded reserves, as that is the Company’s best estimate of the remediation benefit at this time. The ceding companies performed detailed examinations of sampled RMBS loan files to determine whether the loans conformed to the representation and warranties made by the sponsors of the RMBS. The sampled loans were either in later stages of delinquency or had been charged off. Those loans that showed a material breach of representations and warranties are in the process of being put-back to the sponsors for repurchase. The Company views the obligation to repurchase as a standard provision of RMBS securitizations that has been enforced for many years. Thus the Company views the inclusion of the credit taken by the primaries in its own case reserves to be appropriate and assumed its proportionate share of the credit given by the ceding companies when establishing its case reserves as of year-end 2009 and 2008.
To determine the adequacy of its aggregate reserves, the Company considers the loss reserves established by its ceding companies for the exposures it has reinsured as well as the methodologies used by the ceding companies to calculate such ceded loss reserves. To further evaluate the ceded reserve amounts established by the ceding companies, the Company uses its own expected loss forecasting methodologies. Ultimately, the Company decides on an individual credit-by-credit basis whether to establish the ceding company’s reserve as its own or to use its own forecast methodology to determine the reserve for such credit. As of December 31, 2009, the Company estimates that its loss and LAE reserves for financial guaranty contracts are 32% higher than the reserves ceded by the primaries.
The Company uses one of two approaches to perform its own forecast of expected losses. The first approach is a statistical expected loss approach, which considers the likelihood of alternative outcomes. The statistical expected loss is a function of: (i) the net par outstanding on the credit; (ii) internally developed historical default assumptions (taking into consideration internal ratings and remaining term to maturity of an obligation); (iii) internally developed loss severities; and (iv) a discount factor. The loss severities and default assumptions are based on rating agency information, are specific to each bond type and are established and approved by the Company’s Management Committee. For certain credit exposures, the Company’s surveillance activities may provide information relevant to adjust the estimate of the statistical expected losses. As such, the default probability or loss severity for such exposures under certain probabilistic scenarios may be adjusted based on the judgment of senior management.
The second approach entails the use of more precise estimates of expected net cash outflows (future claim payments, net of potential recoveries, expected to be paid to the holder of the insured financial obligation). The Company’s risk management staff considers the likelihood of alternative possible outcomes and develops alternative loss scenarios, in conjunction with a review of historical performance data of the collateral pools. In this approach a probability-weighted expected loss estimate is developed based on assigning probabilities to multiple net claim payment scenarios and applying an appropriate discount factor. For RMBS, the Company takes into account the first loss protective features inherent in the structure of the insured exposure, collateral losses to date, current delinquency rates and loan product characteristics such as loan-to-value ratio and credit score. The first loss protection in most of the Company’s RMBS transactions is provided by excess spread, overcollateralization, subordination, and in some cases mortgage pool insurance.
A loss reserve is recorded for the excess, if any, of estimated expected losses (net cash outflows) over UPR. For certain policies, estimated potential recoveries exceed estimated future claim payments because all or a portion of such recoveries relate to claims previously paid. The expected net cash inflows for these policies are recorded as a recoverable asset.
The discount factor applied is based on a risk-free discount rate corresponding to the remaining expected weighted-average life of the exposure or based on multiple risk-free discount rates related to the timing of individual claims payments. The discount factors are updated for the current risk-free rates each reporting period. As of December 31, 2009, the Company used risk free rates ranging from 0.07% to 5.21% to discount reserves for loss and loss
45

adjustment expenses. As of December 31, 2008 and 2007, prior to the transition adjustment for ASC 944-20, the discount rate used by the Company was 5.0%.
The Company’s Management Committee establishes reserves that it believes are adequate to cover the present value of ultimate liability for losses and loss adjustment expenses, net of UPR. These reserves are based on estimates and may vary materially from actual results. Adjustments based on actual loss experience are recorded in the periods in which they become known.
The Company also identifies problem credits through information provided by the ceding companies at least on a quarterly basis. Such information generally consists of surveillance and underwriting reports and quarterly conference calls with the ceding companies’ analysts. The risk management staff supplements this input with their own research to identify and assess the status of individual credits. Research performed includes reviews of rating agency and fixed income research publications and analysis of historical performance data. Each of the ceding companies maintains a “watch list” for credits that have been identified as requiring a greater than the usual level of ongoing scrutiny and/or intervention. The ceding companies notify the Company when any ceded exposure has been placed on such a watch list. The Management Committee is comprised of the Company’s senior officers and meets quarterly to formally review the Company’s Watch List and approve reserves.
The Company maintains its own Watch List to identify those transactions requiring increased monitoring. The Company typically places transactions on the Watch List if the ceding company places a transaction on its watch list, and the Company generally employs a mapping of each watch list category of each ceding company to the Company’s own Watch List categories. Risk management also surveys market segments on an as-needed basis based on market trends, and may add transactions to the Watch List as a result of such survey even if the ceding company has not added the transaction to its watch list.
Transactions on the Watch List are divided into four categories generally based upon the following definitions:
• Category 1 includes transactions for which performance of the issue or that of an issuance participant is sufficiently below expectations where increased monitoring is required; however, the risk of loss remains remote.
• Category 2 transactions include those for which performance of an issue or that of an issuance participant is sufficiently below expectations where increased monitoring is required and remedial intervention by the ceding company is either planned or already in progress. Performance issues occur when the performance of an issue does not stabilize or improve over the intermediate term and concerns about the transaction's ability to meet its debt service obligations may arise.
• Category 3 includes transactions where performance has deteriorated to the point where concerns about continued ability to meet debt service requirements on a timely basis are substantial. Also included are transactions where claims have been paid but recoveries are forecast for the claims.
• Category 4 transactions include those for which ultimate net loss (net of recoveries and premium receivable) is expected in the most-probable scenarios
Each transaction in Category 3 or 4 of the Watch List is generally reviewed quarterly to determine whether material changes are noted by the ceding company or by the risk management staff. If material adverse changes are identified, surveillance reports are requested from the ceding company and discussions are held to assess the deterioration and outlook for the credit.
The Company does not perform loss mitigation activities and instead relies on the loss mitigation efforts of the ceding companies, who report the Company’s proportionate share of the expenses incurred and liability arising from such activities. The Company pays the ceding companies a ceding commission for all policies reinsured. The ceding commission represents the Company’s portion of the internal cost to the ceding companies to write the transaction, perform ongoing surveillance and to undertake loss mitigation activities. Ceding commissions are deferred and expensed as each policy’s exposure matures and are included as an asset in deferred policy acquisition costs and as
46

acquisition expenses in the statement of operations. The Company reports loss expenses associated with claims as a liability in loss reserves on the balance sheet and in loss and loss adjustment expenses in the statement of operations.
The following table provides information about the financial guaranty policies and related loss reserves in each of the Company’s Watch List categories as of December 31, 2009:
Surveillance Categories ($ in millions) Deals not
on watch list
Category 1
Category 2 Category 3 Category 4
Total
Number of policies 47 81 45 33 62 268
Remaining weighted average contract period (in yrs)
21 16 35 25 28 21
Insured contractual payments outstanding: Principal $ 608.0 $ 287.4 $ 310.8 $ 121.2 $ 299.4 $ 1,018.8 Interest $ 313.2 $ 153.7 $ 206.1 $ 33.3 $ 103.2 $ 496.3 Total $ 921.1 $ 441.1 $ 517.0 $ 154.5 $ 402.6 $ 1,515.1
Gross Claim Liability $ 6.0 $ 3.8 $ 2.6 $ 13.7 $ 73.5 $ 99.6 Less: Gross potential recoveries $ - $ - $ (1.8) $ (21.9) $ (18.6) $ (42.3) Discount, net $ (1.2) $ (0.6) $ 0.2 $ (0.1) $ (3.3) $ (5.0)Net Claim Liability $ 4.8 $ 3.2 $ 1.0 $ (8.3) $ 51.6 $ 52.3
Unearned premium revenue $ 3.2 $ 1.6 $ 0.4 $ 0.2 $ 1.5 $ 7.0
Net Claim liability reported in the Balance Sheet
$ 45.3
Reinsurance recoverables -
Categories 1 to 4 in the above table includes all financial guarantee contracts on the Company’s Watch List at December 31, 2009. The column entitled “Deals not on Watch List” includes only financial guaranty exposures for which the Company has established reserves. Policies written in credit derivative form are not included in the above table. Due to rounding the numbers may not add up to totals.
13 OUTSTANDING EXPOSURE
The following table presents the Company’s net par outstanding by credit sector and type of guaranty as of December 31, 2009 and 2008: (dollars in millions) 2009 2008
US Public Finance Total OS
Par % of total
Total OS Par
% of total
General Obligation and Lease $ 6,155 30.2 $ 6,859 22.9 Tax backed 1,163 5.7 2,095 7.0 Transportation 2,207 10.8 2,803 9.4 Healthcare 969 4.8 1,672 5.6 Utility 2,289 11.2 3,032 10.1 Investor Owned Utilities 77 0.4 609 2.0 Other 750 3.7 1,118 3.7
47

Total US Public Finance $ 13,610 66.8% $ 18,190 60.7 % US Structured Finance Commercial ABS2 and CDOs $ 2,794 13.7 $ 4,147 13.8 RMBS 684 3.4 1,324 4.4 Other Structured Finance & Corporate 243 1.2 1,012 3.4 Total US Structured Finance $ 3,721 18.3% $ 6,483 21.6 % International Asset-backed $ 1,538 7.6 $ 2,529 8.4 Public Finance 808 4.0 1,575 5.3 Investor Owned Utilities and Other 685 3.3 1,180 3.9 Total International $ 3,030 14.9% $ 5,284 17.6 % Total $ 20,361 100.0% $ 29,957 100.0 %
Net outstanding par reinsured at December 31, 2009 and 2008, by geographic location was as follows: 2009 2008 (dollars in millions) OS Par % OS Par % Multi-state $ 3,683 18.1 $ 5,804 19.4 International 3,030 14.9 5,284 17.6 California 2,378 11.7 3,111 10.4 New York 1,401 6.9 2,161 7.2 Illinois 970 4.7 1,247 4.2 Florida 905 4.4 1,201 4.0 Other U.S. States 7,994 39.3 11,149 37.2
Total $ 20,361 100.0 % $ 29,957 100.0%
(1) All outstanding par in the above tables are reported with a one-quarter lag. Due to rounding, the numbers may not add up to the totals.
(2) Asset-backed securities (“ABS”)
(3) The above outstanding par amounts are inclusive of outstanding par on credit derivative policies. See Note 4 – Derivative Instruments for further information on the outstanding par relating to credit derivative policies.
(4) Total GAAP outstanding par includes $602.2 million of par on defeased policies which are not included in the above analysis.
14 OTHER ASSETS
The Company renews its Directors & Officers (“D&O”) insurance annually. One of the policies forming part of the total coverage for the period commencing February 2008 involved a premium of $5.0 million, $4.0 million of which was refundable to the Company if no claims were made under the policy by the end of the annual period of coverage. The Company believes that there had not been a transfer of significant insurance risk on this part of the coverage and accordingly had accounted for the policy as a non risk transferring contract. Of the $5.0 million paid
48

for this part of the coverage, $4.0 million, representing the amount expected to be recovered from the insurers, was included in other assets on the balance sheet for the year ended December 31, 2008, and the Company expensed the $1.0 million premium which it did not expect to recover. On April 7, 2009, the Company was reimbursed for the $4.0 million receivable as there were no claims made under the policy.
15 REINSURANCE BALANCES PAYABLE
Reinsurance balances payable consist of the following balances at December 31, 2009 and 2008:
December 31,
2009 2008 Accrual for ceding commissions on downgrade — 19,965,482 Net payable on assumed reinsurance — 4,655,629 Total reinsurance balances payable $ — $ 24,621,111
On June 4, 2008, S&P lowered its financial strength rating of RAM Re from AAA on credit watch with negative implications to AA with negative outlook. On September 24, 2008, S&P further lowered RAM Re’s financial strength rating to A+ with negative outlook. On May 21, 2009, S&P lowered its financial strength rating of RAM Re to BBB- on creditwatch with negative implications. On August 31, 2009, S&P downgraded RAM Re’s financial strength rating to BB with negative outlook and at the same time, withdrew the rating at the Company’s request. On August 7, 2008, Moody’s downgraded its financial strength rating on RAM Re from Aa3 to A3 and, on December 4, 2008, Moody’s further downgraded RAM Re to Baa3 with outlook developing. On May 19, 2009, Moody’s downgraded RAM Re to Ba3 and, at the same time, withdrew the rating at the Company’s request.
As a result of these downgrades, since 2008 certain of the ceding companies have a right under some of our treaty agreements to increase the ceding commission charged to RAM Re on the U.S. statutory unearned premium balance, as well as premiums payable after the downgrade. This increase applies to all financial guaranty and derivative policies covered by the relevant treaties. These additional ceding commissions have been paid or accrued and deferred and are being expensed in proportion to the earning of the remaining unearned premium, except for credit derivative policies where it is expensed as incurred. As of December 31, 2008, $20.0 million had been accrued to reinsurance balances payable as the primary had not yet requested payment of these additional ceding commissions under the terms of the treaties. In October 2009, $16.5 million of additional ceding commissions were paid to one ceding company, primarily relating to the additional ceding commissions accrued on U.S. statutory unearned premiums on the date of RAM Re’s downgrade. As of December 31, 2009, additional ceding commissions due on the present value of premiums receivable on installment policies are netted off the premiums receivable within “Reinsurance balances receivable”.
As at December 31, 2009 and 2008, $Nil and $4.7 million, respectively, was due to primary insurers in the ordinary course of business. As of December 31, 2009, $2.7 million of paid losses due to ceding companies was netted off “reinsurance balances receivable” on the consolidated balance sheets, where the right of offset with a ceding company exists. The balance as of December 31, 2008, represented RAM Re’s proportionate share of paid losses net of premiums receivable and ceding commission on the periodic cessions received from the primary insurers through December 31, 2008.
16 PENSION AND PROFIT PARTICIPATION PLANS
The Company maintains qualified and non-qualified, non-contributory, defined contribution pension plans for the benefit of eligible employees and effective January 1, 2009, senior management received a cash pension benefit in lieu of the contribution to the deferred compensation plan discussed below. The two remaining plans are
49
administered by a third party. The Company’s contributions are based upon a fixed percentage of employee compensation. Pension expense (inclusive of executives’ cash contributions for 2009) , which is funded as accrued, for the years ended December 31, 2009, 2008, and 2007 was $0.5 million, $0.4 million, and $0.4 million, respectively.
The Company maintained a rabbi trust for deferred compensation plans for executives. The rabbi trust held assets such as cash, fixed income and equity securities in the form of mutual funds. These assets of the rabbi trust are consolidated with those of the Company and are reflected in other assets. These assets are classified as trading securities and reported at fair value with changes in fair value reflected in net investment income. The related deferred compensation obligation was carried at fair value and reflected in other liabilities with changes reflected as a corresponding increase or decrease to administrative expenses.
On November 11, 2008, the Company approved certain technical amendments to the deferred compensation plan for highly compensated U.S. citizen executives (the “Affected Executives”) in order to comply with Section 409A of the U.S. Internal Revenue Code. Under recently enacted Section 457A of the U.S. internal Revenue Code, unless further regulations are promulgated that would exempt the Company from its application, the Affected Executives would be unable to defer income tax on contributions to the deferred compensation plan in respect of services rendered after December 31, 2008. Consequently, the deferred compensation plan was also amended to provide that no further contributions to the deferred compensation plan would be made by the Company after December 31, 2008. Further, the Company approved permitting the Affected Executives to make a change in their payment elections under the 409A transition rules on or before December 31, 2008. As a consequence of elections made by the Affected Executives, during the year ended December 31, 2009, all of the funds held in the rabbi trust established under the deferred compensation plan were paid out to the Affected Executives. It is not expected that additional funds will be deposited in the rabbi trust because the Company has ceased contributing to the deferred compensation plan, but the Affected Executives are permitted to continue to make contributions to the deferred compensation plan at their election.
17 COMMUTATIONS
Ambac commutation On April 7, 2009, RAM Re entered into a commutation agreement (the “Ambac Commutation Agreement”) with Ambac Assurance Corporation and its affiliate (“Ambac”). The Ambac Commutation Agreement provided, among other things, for RAM Re to pay a $97 million settlement payment and $1.3 million of claims payments, by means of a release to Ambac of securities in Ambac’s trust account valued at $97.8 million and a cash payment of $0.5 million, to commute the entire $6.8 billion insured portfolio assumed from Ambac, and for each party thereto to release the other party from all liabilities and obligations under all reinsurance agreements between the parties. The securities in the trust account and cash payment were received by Ambac, and the releases set forth in the Commutation Agreement became effective on April 8, 2009.
The effect of the Ambac commutation on the Company’s results of operations was to (i) reduce gross written premiums and unearned premiums by $155.5 million, resulting in no impact on earned premiums and (ii) decrease loss and loss adjustment expenses by $8.7 million, resulting in an overall gain to net income at the time of commutation of $8.7 million.
MBIA commutation
Effective November 30, 2008, RAM Re entered into a Commutation Agreement with MBIA Insurance Corporation and its affiliates (“MBIA”), to commute its entire portfolio of business previously assumed from MBIA back to MBIA. As consideration for the commutation RAM Re paid MBIA $156.5 million. The commutation reduced the outstanding par amount of the Company’s insured portfolio by $10.6 billion, including $439.3 million of collateralized debt obligations of asset-backed securities (“ABS CDOs”) (all structured as credit derivatives), $2.4
50
billion of collateralized debt obligations of commercial mortgage-backed securities (“CMBS CDOs”) and $453.0 million of 2005 - 2008 vintage U.S. RMBS.
The effect of the MBIA commutation on the Company’s results of operations was to (i) reduce gross written premiums and unearned premiums by $36.4 million, resulting in no impact on earned premiums (ii) increase net change in fair value of credit derivatives by a gain of $110.7 million, and (iii) increase loss and loss adjustment expenses by a loss of $61.4 million, resulting in an overall gain to net income at the time of commutation of $49.3 million.
XLFA commutation
On July 25, 2008, RAM Re entered into a Commutation Agreement with Syncora Guaranty Re (formerly XL Financial Assurance Ltd.) (“XLFA”), whereby RAM Re transferred all business previously ceded to RAM Re by XLFA back to XLFA and each of RAM Re and XLFA released each other from claims under the reinsurance agreements. As consideration for the Commutation Agreement, RAM Re paid $94.4 million to XLFA. The transaction reduced the par amount of RAM Re’s insured portfolio by $3.5 billion of which $711 million related to 2005 - 2007 vintage ABS CDOs (all structured as credit derivatives) and $280 million of 2005 - 2007 vintage RMBS.
The effect of the XLFA commutation on the Company’s results of operations was to (i) reduce gross written premiums by $11.4 million, (ii) increase net earned premiums by $1.1 million, (iii) increase net change in fair value of credit derivatives by a gain of $26.0 million, (iv) reduce loss and loss adjustment expenses by a gain of $15.5 million and (v) increase acquisition expenses by $0.3 million, resulting in an overall gain to net income of $42.3 million.
Other commutations
During 2009, the Company completed two other commutations with ceding companies and a retrocessionaire, reducing net outstanding par exposure in RAM Re’s insured portfolio by $0.3 billion for net payments totaling $0.9 million. The effect of these commutations on the Company’s income statement was to (i) decrease gross written premiums and unearned premiums by $1.1 million and (ii) decrease ceded reinsurance premiums and prepaid reinsurance premiums by $1.0 million with no impact on earned premium, (iii) increase net change in fair value of credit derivatives by a gain of $0.9 million, and (iv) increase paid losses by $1.0 million, resulting in an overall reduction to net income of $0.1 million.
During the second quarter of 2008, the Company entered into partial commutation agreements with two of the Company’s primary insurers. Under these agreements, $1.0 billion in par outstanding of insurance policies previously reinsured by the Company was commuted back to the primary insurers. All the Company’s obligations with respect to these policies were terminated on commutation. The Company paid $7.1 million in consideration of these commutations. The effect of these commutations on the Company’s income statement was to reduce (i) gross written premiums by $10.2 million, (ii) net earned premiums by $1.8 million and (iii) acquisition expenses by $0.6 million, giving an overall reduction to net income of $1.2 million. In December 2008, RAM Re commuted a further $158.3 million in par outstanding on two policies with another primary insurer. One policy was a partial commutation of $41.8 million par outstanding on a 2007 subprime RMBS whereas RAM Re’s total obligations on the second policy were terminated fully. The commutation payment of $3.1 million reduced the total loss reserve accordingly.
18 STOCK OPTION PLAN
Prior to January 1, 2006, share options were issued to senior management and directors on an ad hoc basis and the fair value per share at the grant date was estimated as book value at the most recent quarterly reporting period and the strike price of the options granted was the book value at the date of grant, as required by the standard for stock issued to employees at that time. Therefore, the intrinsic value is zero for all options granted prior to January 1, 2006
51

that have the same fair value and strike price and no compensation expense is recognized for the cost of these share options.
Effective January 1, 2006, the Company adopted ASC 718 for stock compensation, utilizing the prospective transition method. Under the prospective transition method, compensation costs recognized relate to the estimated fair value at the grant date of share options granted subsequent to January 1, 2006. The Company continues to account for share options issued prior to January 1, 2006, where no compensation expense is recognized in net income for share options granted under the plan as the exercise price is equal to the fair value of the underlying common shares at the date of grant. Options granted prior to January 1, 2006, have not been restated to reflect the adoption of the revised guidance issued in 2006. For the periods ended December 31, 2009, 2008, and 2007, the Company recognized $Nil, $0.1 million and $0.1 million, respectively, of compensation expense in the period for share options with an exercise price less than the market value of the underlying common shares on the date of the grant.
As of April 26, 2006, the Company adopted the RAM Holdings Ltd. 2006 Equity Plan (the “Plan”). The number of common shares that may be delivered under the Plan may not exceed 2,470,000. In the event of certain transactions affecting the common shares of RAM Holdings, the number or type of shares subject to the Plan, the number and type of shares subject to outstanding awards under the Plan, and the exercise price of awards under the Plan may be adjusted. The Plan authorizes the grant of share options, share appreciation rights, share awards, restricted share units, performance units, or other awards that are based on the Company’s common shares. The awards granted are contingent on the achievement of service conditions during a specified period, and may be subject to a risk of forfeiture or other restrictions that will lapse upon the achievement of one or more goals relating to completion of service by the participant. Awards under the Plan may accelerate and become vested upon a change in control of the Company. The Plan is administered by the compensation committee of the Board of Directors. The plan is subject to amendment or termination by the board.
As at December 31, 2009, outstanding awards under the Plan consisting of 910,794 share options and 66,483 restricted share units had been granted to the Company’s officers and employees. Each of the options will vest in equal annual installments over a four-year period and will expire on the seventh anniversary of the date of grant. The grant price is the average of the highest and lowest quoted selling price on the grant date. The exercise price of the options at December 31, 2009 ranges from $1.45 to $16.20. Restricted share units will vest in equal annual installments over a four-year period.
Stock Options
The Company has used the Black-Scholes option pricing model to estimate the fair value of share options using the following weighted average assumptions as at December 31, 2008 and 2007. There were no options issued in 2009:
2008 2007 Dividend yield 0% 0 % Expected volatility 57.61% 23.05 % Risk-free interest rate 2.3% 4.6 % Expected life of options (in years) 4.0 4.0 Weighted-average grant-date fair value $ 0.68 $ 4.04
These assumptions are based on a number of factors as follows: (i) dividend yield was determined based on the Company’s historical dividend payments which have been nil and expected dividend payments in the future which are also expected to be nil, (ii) expected volatility was determined using the historical volatility of the share price of the Company and similar companies within the financial guaranty industry, (iii) the expected term of the options is based on the period of time that the options granted are expected to be outstanding and (iv) the risk-free rate is the U.S. Treasury rate effective at the time of grant for the duration of the options granted. Compensation cost is
52

recognized on a straight-line basis over the vesting period and is net of estimated prevesting forfeitures. The estimated forfeiture rate is based on actual forfeitures adjusted for future forfeiture expectations due to limited historical forfeiture data. At December 31, 2009, the weighted average grant date fair value for options issued subsequent to January 1, 2006 for disclosure purposes was $2.04.
As at December 31, 2009, there was $0.4 million of unrecognized compensation expense related to the share options granted subsequent to January 1, 2006, which is expected to be recognized over the remaining service period of 1.57 years.
The following tables summarize the share option activity for the years ended December 31, 2009, 2008, and 2007:
Year ended December 31, 2009
Number of
shares
Weighted average exercise price per
share
Weighted average Remaining
Contractual Life
Aggregate Intrinsic Value (1)
Options Outstanding – beginning of year 2,116,497 $ 7.59 Granted — — Forfeited (673,028) 6.10 Outstanding – End of year 1,443,469 8.29 4.56 years $ — Exercisable – end of year 903,219 10.52 — $ —
Weighted average fair value per share of options granted during the period $ N/A
(1) The aggregate intrinsic value was calculated based on the market value of $0.49 as at December 31, 2009, and is calculated as the difference between the market value and the exercise price of the underlying options.
Year ended December 31, 2008
Number of
shares
Weighted average exercise price per
share
Weighted average Remaining
Contractual Life
Aggregate Intrinsic Value (1)
Options Outstanding – beginning of year 1,252,197 $ 12.66 Granted 973,500 1.47 Forfeited (109,200) 11.16 Outstanding – End of year 2,116,497 7.59 5.61 years $ — Exercisable – end of year 734,271 12.08 — $ —
Weighted average fair value per share of options granted during the period $ 0.68
(2) The aggregate intrinsic value was calculated based on the market value of $0.37 as at December 31, 2008, and is calculated as the difference between the market value and the exercise price of the underlying options.
Year ended December 31, 2007
Number of
shares
Weighted average exercise price per
share
Weighted average Remaining
Contractual Life
Aggregate Intrinsic Value (1)
Options Outstanding – beginning of year 1,141,504 $ 12.10 Granted 312,557 15.39 Forfeited (201,864) 13.70
53

Outstanding – End of year 1,252,197 12.66 6.14 years $ — Exercisable – end of year 607,989 11.50 — $ —
Weighted average fair value per share of options granted during the period $ 4.04
(1) The aggregate intrinsic value was calculated based on the market value of $4.94 as at December 31, 2007, and is calculated as the difference between the market value and the exercise price of the underlying options.
Restricted Share Units
The Company has granted restricted share units to employees of the Company. Restricted shares vest annually over a four-year period.
The following table summarizes the restricted share unit activity for the years ended December 31, 2009, 2008, and 2007:
12 months ended December 31, 2009
Number of share units
Weighted average grant date fair value per share
Restricted Share Units Non-vested – beginning of year 139,627 4.82 Granted — — Vested (31,579 ) 5.38 Forfeited (41,565 ) 5.54 Non-vested – End of year 66,483 4.11
12 months ended December 31, 2008
Number of share units
Weighted average grant date fair value per share
Restricted Share Units Non-vested – beginning of year 50,415 15.56 Granted 106,969 1.51 Vested (12,619 ) 15.55 Forfeited (5,138 ) 14.69 Non-vested – End of year 139,627 4.82
12 months ended December 31, 2007
Number of share units
Weighted average grant date fair value per share
Restricted Share Units Non-vested – beginning of year 19,044 13.39 Granted 48,079 16.19 Vested (4,221 ) 13.38 Forfeited (12,487 ) 15.42 Non-vested – End of year 50,415 15.56
54
The Company expensed $0.1 million, $0.2 million and $0.2 million in compensation expense related to the restricted share units for the years ended December 31, 2009, 2008 and 2007 respectively. The compensation expense for restricted share units is expensed on a prorated basis over the vesting period. At December 31, 2009, there is unrecognized compensation expense related to the non-vested restricted share units of $0.2 million, which will be recognized over the weighted average remaining service period of 1.98 years.
19 COMMITMENTS AND CONTINGENCIES
Subsequent to December 31, 2009, the Company renewed its agreement to lease office space for the two years ending December 31, 2011. As of December 31, 2009, the future minimum commitment under the lease, for the years remaining, is $0.3 million per annum. Rental expense for the aforementioned lease amounted to $0.3 million in all years presented.
In the ordinary course of its business, RAM Re engages in arbitrations under its treaty agreements.
20 RISKS AND UNCERTAINTIES
The Company has not renewed its reinsurance treaties with any of the primaries or otherwise written any new business in 2009. This means that the Company does not expect to write any new financial guaranty but this does not reduce the Company’s in-force business, unless the business is commuted or recaptured by the primaries.
The Company continues to evaluate its business model and may pursue a different set of strategies in the future. There can be no assurance that the strategies that have been implemented or that will be pursued in the future in connection with this evaluation will improve the Company’s business, financial condition, liquidity or results of operations or will not have a material adverse effect on the Company. Management believes that the Company has sufficient capital resources and liquidity to meet its obligations for at least the next twelve months and therefore that the Company remains a “going concern”.
At December 31, 2009, the Company has $358.0 million of cash and investments of which $251.4 million is held in trust for the benefit of our ceding companies, leaving $106.6 million cash and investments available for the cost of ongoing business. See Note 3 – Pledged assets, for further information regarding these trust accounts. Currently, losses are paid out of the Company’s unrestricted cash rather than the Company’s trust accounts which reduces available cash until the trust accounts are adjusted.
RAM Holdings is a holding company and therefore its liquidity, both on a short-term basis (for the next twelve months) and a long-term basis (beyond the twelve months), is largely dependent upon (1) the ability of RAM Re to pay dividends or make other payments to the Company and (2) its ability to access debt and equity markets, which is unlikely in the near term given current market conditions and the Company’s current share valuation. The Company’s principal uses of liquidity are for payment of interest on its senior notes, non-mandatory dividends on its preference shares if declared by the Board of Directors of RAM Holdings and capital investments in RAM Re. On March 19, 2009, RAM Re’s Board approved a dividend of $2.8 million from RAM Re to RAM Holdings, to cover the interest on its Senior Notes for the current year and, further to this, during June 2009, RAM Re approved a return of capital of $30.7 million to RAM Holdings to fund liability repurchases. As of December 31, 2009, RAM Holdings has $30.8 million of cash and investments and the Company believes that it will have sufficient liquidity to pay interest on its senior notes and meet other liquidity requirements over at least the next twelve months. RAM Re’s ability to declare and pay dividends to the Company may be influenced by a variety of factors such as adverse loss development, amount and timing of claims payments, the amounts required to be held in trust for the benefit of U.S. regulated customers, adverse market changes, insurance regulatory changes, changes in general economic conditions beyond the next twelve months and Bermuda law. Further increases in loss reserves and credit impairments (a non GAAP measure representing losses expected to be paid on insured credit derivative policies) would require RAM Re to deposit additional collateral in the applicable trust account(s) and resulting claims payments in respect of those losses and impairments would increase cash outflows and could decrease the size of
55
RAM Re’s investment portfolio, in turn decreasing income from investments. Although the Company believes that it will continue to have sufficient liquidity to meet its obligations over the long term, it cannot guarantee that RAM Re will be able to dividend amounts sufficient to satisfy all its obligations, and there can be no assurance that dividends will be declared or paid in the future.
The principal sources of RAM Re’s liquidity are premiums net of acquisition expenses, scheduled investment maturities, and net investment income. The principal uses of RAM Re’s liquidity are for the payment of operating expenses, claims, ceding commissions, reinsurance premiums, dividends to RAM Holdings and for purchases of new investments and more recently funding commutation agreements. The Company believes that RAM Re’s expected operating liquidity needs can be funded from its operating and investing cash flows for the next twelve months. See Note 26 – Statutory requirements, for further information regarding RAM Re’s ability to pay dividends.
As at December 31, 2009, RAM Re is not rated by any agency after having requested the withdrawal of ratings from both S&P and Moody’s during 2009. This followed a number of downgrades from both Moody’s and S&P which started during the middle of 2008. The downgrade of RAM Re’s ratings has had a material adverse affect on RAM Re’s ability to compete in the financial guaranty reinsurance industry and significantly decreased the value of the reinsurance provided. Due to the above mentioned downgrades, certain ceding companies have the right to increase the ceding commission, as stipulated in the treaties, or terminate the treaties and recapture the business previously ceded to RAM Re whether written in financial guaranty or credit derivative form. To the extent policies are recaptured, RAM Re must forfeit to the ceding company an amount determined by formula under each treaty which generally consists of RAM Re’s allocated share of the U.S. statutory unearned premium, net of the ceding commission paid by RAM Re to the ceding company (subject to a penalty amount in some cases), and loss reserves established with respect to the policies ceded, as applicable. U.S statutory premiums earn on a different basis than GAAP premiums and do not currently include the present value of future installment premiums. The U.S. statutory unearned premiums were approximately $20.2 million lower than GAAP unearned premiums at December 31, 2009. To date, none of the primaries have recaptured any business. The commutations negotiated during the years 2008 and 2009, were not a result of these treaty terms. See Note 15 - Reinsurance balances payable, for disclosure on the financial statement effect of increased ceding commission relating to these downgrades.
Some of the exposures the Company reinsures have been written by ceding companies as credit derivative contracts rather than financial guarantee insurance policies. Traditional financial guarantee insurance provides an unconditional and irrevocable guarantee of payment to the holder of a municipal finance or structured finance obligation of principal and interest on that obligation in the event of a non-payment by the issuer. In contrast, credit derivatives provide protection from the occurrence of specified credit events, which frequently include non-payment of principal and interest (“failure to pay”), but may also include other terms such as settlement of individual referenced collateral losses in excess of policy specific deductibles or subordination amounts. The credit derivatives that protect against failure to pay usually have settlement terms that require the ceding company to pay interest and principal shortfalls as they occur (referred to as “pay-as-you-go”). The Company may be deemed to have assumed reinsurance on credit derivative exposures that have other than “pay as you go” terms. Although the Company considers the occurrence of such payments to be unlikely, the Company is at risk of unanticipated loss payments under insured credit derivative policies that could have an adverse effect on the Company’s liquidity. Further, the ceding companies write credit derivatives that are governed by standard International Swaps and Derivatives Association (“ISDA”) documentation which can include various events of default related to the primary insurer itself, such as insolvency of or a failure to pay by the primary insurer on any credit derivative with a particular counterparty, which would not typically trigger a payment obligation under traditional financial guaranty. If a credit derivative (or group of credit derivatives) is terminated upon an event of default, the primary could be required to make a mark-to-market payment(s) as determined under the ISDA documentation. While the Company does not believe that its reinsurance contracts obligate it to indemnify the primary insurers for mark-to-market payments resulting from their default under the ISDA documentation, the primary insurer or its regulator may allege that the Company is liable for its pro rata share of such payments and withdraw funds to pay such claims from the trust account for the benefit of that primary insurer. These issues may ultimately be resolved through arbitration, with one such arbitration already pending.
56

The underwriting of insured risks and the reporting of underwriting results to the Company are the responsibility of the primary insurers under the treaties. The Company does not “re-underwrite” the transactions ceded under the treaties. The Company’s business model has always been that of a reinsurer, in which the Company leverages and relies on the operations and reporting of the primary insurers. As a result of this the Company is highly dependent on the operating and reporting of the ceding companies. The ceding companies often use complex financial models, which have been internally developed, to produce their results. The Company performs its own assessment of the reasonableness of the information provided by ceding companies’ (See Note 4 – Derivative instruments, Note 8 Financial Guarantee policies and Note 12 – loss and loss expense reserve, for details of the work completed by the Company on this information). However depending on the nature of the information provided by the ceding company the Company may not be able to identify errors in the reported information in the period in which it is reported, which may be material, as indicated by corrections of errors in primary reported information in prior period financial statements, including financial statements for the three and nine months ended September 30, 2009, for which restated financials were issued.
21 LONG-TERM DEBT
On March 26, 2004, RAM Holdings issued $40.0 million of unsecured senior notes (the “Notes”) to a qualified institutional buyer as defined in Rule 144A of the Securities Act of 1933. The term of the Notes is 20 years with the full principal amount due at maturity. The Notes rank pari passu in right of repayment with RAM Holding’s other unsecured senior debt, of which there is currently none. The net proceeds from the Notes have been used to provide capital for RAM Re. On April 24, 2009, the Company purchased $5.0 million of these Notes for $1.6 million, realizing a gain of $3.4 million. The Notes that were repurchased were cancelled immediately after such repurchase.
The applicable interest rate is 6.875% and is payable semi-annually. The Notes are subject to redemption at the option of RAM Holdings, in whole or in part at any time upon 30 days advance notice by paying principal, accrued interest and the Make Whole Amount, amounting to a portion of the future scheduled payments over the principal amount. There are no financial covenants in place. Interest expense amounting to $2.5 million was recorded for the year ended December 31, 2009, and $2.8 million for both the years ended December 31, 2008 and 2007. During the year ended December 31, 2009, the Company paid $1.0 million to the majority holders of the Notes to amend the replacement capital covenant of the Notes in advance of the Series A Preference Share tender offer in 2010, see Note 27 - Subsequent events. 22 REDEEMABLE PREFERENCE SHARES
On December 14, 2006, the Company issued 75,000 Series A Preference Shares at $1,000 per share for total consideration of $75.0 million. Until December 15, 2016, the Series A Preference Shares bear a non-cumulative, non mandatory dividend rate of 7.50%, which is payable semi-annually on June 15 and December 15 each year upon declaration by the Board of Directors. After December 15, 2016, if the Series A Preference Shares have not been redeemed or repurchased, they bear a non-cumulative, non-mandatory dividend rate of Three-Month LIBOR (as defined in the Series A Certificate of Designations) plus 3.557%, which is payable quarterly on the 15th day of March, June, September and December of each year, beginning on March 15, 2017, upon declaration by the Board of Directors. Unless previously redeemed, the Series A Preference Shares have a mandatory redemption date of December 15, 2066. The Company can redeem the Series A Preference Shares at any time from December 15, 2016 with no penalty to the Company. Prior to December 15, 2016, the Company can redeem the preference shares at the redemption price and a “make-whole” amount, amounting to dividends for the remainder of the period to December 15, 2016. During the year ended December 31, 2009, there have been no dividends declared or paid. The payment of preference share dividends is classified as interest expense. On May 12, 2009, the Board determined to suspend payment of dividends on the Series A Preference Shares. During the years ended December 31, 2008 and 2007, dividends amounting to $5.6 million were declared and paid. See Note 27 – Subsequent events, for further information on these preference shares.
57
23 SHARE CAPITAL
As at December 31, 2009 and 2008, authorized share capital was 90,000,000 common shares and 10,000,000 undesignated preference shares with a par value of $0.10 each. Common shares issued and outstanding as at December 31, 2009 and 2008, were 26,340,174 and 27,251,595, respectively. During the years ended December 31, 2009 and 2008, 31,579 and 12,619 restricted stock units were vested and issued as share capital, increasing the common shares issued and outstanding. On May 19, 2009, the Company announced its intention to repurchase up to 930,000 of its issued and outstanding common shares. The Company completed this share repurchase plan on June 9, 2009, having repurchased the maximum 930,000 allowed for $286,536. During the third quarter 2009, the Company repurchased 13,000 shares from an employee as part of a redundancy settlement at 110% of book value as of the end of the last financial year. All the repurchased shares are included as a reduction to share capital for the year ended December 31, 2009.
24 RELATED PARTY TRANSACTIONS
In the ordinary course of business, the Company entered into treaty and facultative reinsurance agreements with FGIC, in which PMI Mortgage Insurance Co. (“PMI”), one of the Company’s shareholders, are investors. During the year ended December 31, 2009, PMI sold its entire investment in RAM Re and therefore FGIC is no longer a related party. The treaty agreement with FGIC was not renewed in 2008 or 2009. In 2009, 2008 and 2007, financial guarantee gross premiums written plus premiums received on CDS policies ceded from FGIC accounted for 1%, 7% and 26% of total premiums written and received by the Company, respectively (prior to taking effect of premiums returned on commutations in 2009 and 2008). As of December 31, 2009, approximately 29% of the Company’s outstanding par exposure was assumed from FGIC. In 2008, RAM Re paid $3.1 million to FGIC to settle disputes under certain reinsurance agreements.
25 TAXATION
The Company has received an undertaking from the Bermuda government exempting it from all local income, withholding and capital gains taxes until March 28, 2016. At the present time no such taxes are levied in Bermuda.
The Company does not consider itself to be engaged in trade or business in the U.S. and, accordingly, does not expect to be subject to U.S. taxation.
26 STATUTORY REQUIREMENTS
RAM Re is registered as a Class 3B insurer effective January 1, 2009, and is regulated as such under the Bermuda Insurance Act. Prior to January 1, 2009, RAM Re was registered as a Class 3 reinsurer. RAM Re has applied to be re-registered as a Class 3A insurer and is awaiting a response from the BMA.
RAM Re is registered under the Bermuda Insurance Act 1978, amendments thereto and related regulations (the “Act”), which require that they maintain minimum levels of solvency and liquidity. As at December 31, 2009, the estimated minimum required statutory capital and surplus was $9.0 million, and estimated statutory capital and surplus was $132.5 million. As at December 31, 2008, the minimum required statutory capital and surplus was $17.5 million and actual statutory capital and surplus was $144.0 million. Statutory income was estimated at $52.6 million for the year ended December 31, 2009 and was $(213.6) million for the year ended December 31, 2008.
In addition to the solvency margin, the Bermuda Insurance Act requires RAM Re to comply with a liquidity ratio whereby the value of its relevant assets must be not less than 75% of the amount of its relevant liabilities. Management believes they are in compliance with these requirements as at December 31, 2009. The minimum required level of liquid assets was approximately $164.8 million and $228.4 million and actual liquid assets were estimated at $352.2 million as of December 31, 2009, and were $444.5 million as of December 31, 2008.
58

In the event RAM Re fails to meet its relevant margins on the last day of any financial year, it shall not without the approval of the Bermuda Monetary Authority (the “BMA”), declare or pay any dividend during the next financial year. In addition, under the Bermuda Insurance Act, Class 3B insurers are prohibited from declaring or paying any dividends of more than 25% of total statutory capital and surplus, as shown on its previous financial year statutory balance sheet, unless at least seven days before payment of the dividends, it files with the BMA an affidavit that they will continue to meet required solvency margins. Further to this, Class 3A and Class 3B insurers must obtain the BMA’s prior approval before reducing total statutory capital, as shown on their respective previous financial year statutory balance sheets, by 15% or more.
Based upon these tests for a Class 3B insurer, without filing an affidavit with or obtaining approval from the BMA, the maximum amount that will be available during 2010 for payment of dividends and reduction to capital by RAM Re, is approximately $33.1 million and $54.4 million, respectively. The BMA is currently reviewing its regulatory approach to be applied to financial guaranty companies in future and these amounts may change based on any new guidance issued by the BMA. During March 2010, the BMA issued new draft guidance on accounting for financial guaranty companies. As a result of this guidance, RAM Re is applying for an exemption under the Act to enable it to defer certain acquisition costs on policies paid in installments. If the exemption is granted by the BMA then RAM Re’s year end statutory capital and surplus and statutory income could increase by up to $10.5 million.
Statutory financial statements prepared under the Act differ from financial statements prepared in accordance with US GAAP, principally due to the exclusion of non-admitted assets such as deferred policy acquisition costs, prepaid expenses and the fair value adjustment of derivative instruments in excess of credit impairments, a non-GAAP measure of losses on derivative policies.
RAM Re and the Company must also comply with the provisions of the Bermuda Companies Act regulating the payment of dividends and making of distributions from contributed surplus. A company is prohibited from declaring or paying a dividend, or making a distribution out of contributed surplus, if there are reasonable grounds for believing that: (a) the company is, or would after the payment, be unable to pay its liabilities as they become due or (b) the realizable value of the company’s assets would thereby be less than the aggregate of its liabilities and its issued share capital and share premium accounts. The Board of Directors of RAM Re and the Company will evaluate any dividends in accordance with this test at the time such dividends are declared.
In addition, the terms of RAM Re’s Class B Preference Shares restrict RAM Re’s ability to pay dividends on its common shares unless all accrued and unpaid dividends on the Class B Preference Shares for the then current dividend period have been declared and paid or a sum sufficient for payment thereof set apart. There is an exception however that permits RAM Re to declare dividends on its common shares in such amounts as are necessary for RAM Holdings (i) to service indebtedness for borrowed money as such payments become due (or to satisfy any of its guarantee obligations made in respect of indebtedness of RAM Re or RAM Holdings) or (ii) to pay its operating expenses.
27 SUBSEQUENT EVENTS
Preferred Shares
On January 29, 2010, the Company announced a tender offer by RAM Holdings to purchase any and all of its 75,000 outstanding Series A Preference Shares with a par value of $0.10 per share and a liquidation preference of $1,000 per share. At the same time, RAM Re announced a tender offer to purchase any and all of its 500.01 Class B Preference Shares, with a par value of US $1,000 per share and a liquidation preference of US $100,000 per share.
On March 15, 2010, RAM Holdings and RAM Re announced the final results of the tender offers. Holders of the RAM Holdings Series A Preference Shares validly tendered 15,300 shares, or 20.40% of the 75,000 shares previously outstanding. Holders of the RAM Re Class B Preference Shares validly tendered 68.00 shares, or 13.60% of the 500.01 shares previously outstanding. Both companies accepted for purchase all such Preference Shares that were validly tendered as of the applicable expiration date. RAM Re paid $1.7 million for all such Class
59

B Preference Shares on March 9, 2010. RAM Holdings paid $3.8 million for all such Series A Preference Shares on March 10, 2010.
Following the settlement of the tender offers, 59,700 shares of RAM Holdings Series A Preference Shares remain outstanding and 432.01 shares of RAM Re Class B Preference Shares remain outstanding.
The Company expects that the repurchase of the Series A Preference Shares will result in a gain on repurchase during the first quarter of 2010 of $11.5 million. The Company expects that the repurchase of the Class B Preference Shares will result in a reduction to the Noncontrolling Interest in Equity of $1.1 million during the first quarter of 2010, leaving $7.0 million Noncontrolling Interest in Equity subsequent to this repurchase. The Company expects that a loss of $0.6 million will also be recorded during the first quarter of 2010 on the repurchase of the Class B Preference Shares of RAM Re.
Long Term Debt
On March 31, 2010, the Company repurchased $10.0 million of its $35.0 million unsecured Senior Notes (the “Notes”) for $5.5 million plus accrued interest of $0.3 million, realizing a gain of $4.5 million. The Notes that were repurchased were cancelled immediately after such repurchase. Following the settlement of the repurchase, $25.0 million of the Notes remain outstanding. Subsequent to the above transactions to repurchase Series A Preference Shares and Notes of RAM Holdings, the cash and investments held at RAM Holdings was approximately $21.2 million. Management Changes On March 1, 2010, the Company announced that as part of its continuing efforts to reduce expenses as operations wind down, that it had reached agreement with Vernon M. Endo, President and Chief Executive Officer, and Edward U. Gilpin, Chief Financial Officer to leave the Company to pursue other interests, effective May 14, 2010. David K. Steel, Chief Risk Manager, will become President and CEO of RAM Re and RAM Holdings, effective May 14, 2010. The Company has not yet determined a successor to the CFO position.
60

Directors and Executive Officers Director Biographies
Set forth below is biographical information concerning each director of RAM Holdings and RAM Re as of December 31, 2009, including each such individual’s principal occupation and the period during which such person has served as a director of RAM Holdings and RAM Re.
Steven J. Tynan Age 55 Director since 1998 Chairman of the Board of Directors since 2001
Mr. Tynan is a retired private investor. He co-founded High Ridge Capital LLC, a private equity firm that specialized in the insurance sector, in 1995 and served as a member of the firm until its liquidation in 2009. Mr. Tynan has served on the boards of numerous private insurance, reinsurance and related entities. Mr. Tynan received a B.B.A. from Hofstra University.
Edward F. Bader Age 68 Director since 2004
Mr. Bader owns Bader & Associates, a consulting firm. Prior to founding Bader & Associates in August 2001, Mr. Bader was a partner in the Insurance Services Practice of Arthur Andersen LLP with more than 37 years of experience in accounting and auditing concentrating in the insurance industry. He served as the head of Andersen’s World Wide Insurance Practice Group. Mr. Bader received a B.S. degree in Economics from Fairfield University.
David L. Boyle Age 63 Director since 2005
Mr. Boyle retired as Vice Chairman and Head of Portfolio Risk Management for Ambac Financial Group, Inc. in 2005, where he served in many different executive management capacities for eight years. Previously, Mr. Boyle was a Managing Director at Citibank, N.A. where he had various management responsibilities over a career spanning from 1974 to 1996. He is the former chairman of the Association of Financial Guaranty Insurers, and currently serves on the Board of Trustees of Wittenberg University. Mr. Boyle received a B.S. from Wittenberg University and an M.B.A. from the Fisher College of Business at The Ohio State University.
Lloyd A. Porter Age 50 Director since 2008
Lloyd A. Porter is Executive Vice President, Chief Risk Officer for The PMI Group, Inc. (“PMI”). Mr. Porter is responsible for PMI’s Risk Management department. His responsibilities include portfolio management and risk exposure optimization, reinsurance, reserving, pricing, corporate credit policy and asset disposition. Prior to assuming this role Mr. Porter managed PMI’s non-US mortgage insurance activities. Residing in Dublin, Ireland, he oversaw the company’s activities in Australia, Europe, Hong Kong, and Canada. Other assignments included establishing PMI’s Hong Kong business and directing the acquisition and integration of PMI’s Australian venture, MGICA. He also lived and worked in Sydney, Australia. Mr. Porter also led the 2001 acquisition of CGU’s mortgage insurance business in Australia/New Zealand. Prior to assuming the leadership role for international markets, Mr. Porter managed institutional markets, implementing the use of PMI’s automated underwriting system in the capital markets. Mr. Porter is a founding board member of Habitat for Humanity Ireland. A graduate of the University of California at Los Angeles, Mr. Porter holds bachelor’s degrees in economics and psychology and has received advanced training at Northwestern University’s executive management program. He was awarded “Faculty Fellow” by the U.S. Mortgage Bankers Association for commitment and excellence in teaching in the School of Mortgage Banking. Mr. Porter resigned from the Board effective January 4, 2010. (1)
61
(1) On January 8, 2010, Vernon M.Endo was appointed to the Boards of RAM Holdings Ltd (“RAM Holdings”) and RAM Reinsurance Company Ltd (“RAM Re”) as Director to serve until the next Annual General Meeting, as replacement for Mr. Porter.
(2) On December 17, 2009, Conrad P. Volstad tendered his resignation from the Board of Directors of RAM Holdings and RAM Re. On January 8, 2010, Joseph M. Donovan, was appointed to the Board of Directors as his replacement.
(3) On March 1, 2010 Clement S. Dwyer was appointed to the Boards of RAM Holdings Ltd (“RAM Holdings”) and RAM Reinsurance Company Ltd (“RAM Re”) as Director to serve until the next Annual General Meeting. Mr. Dwyer was appointed as replacement for Mr. Donovan who resigned on March 1, 2010.
Executive Biographies
Set forth below is biographical information concerning each executive officer as of December 31, 2009, who is not a director. Subject to rights pursuant to any employment agreements, officers serve at the pleasure of our Board of Directors.
Vernon M. Endo (1) President and Chief Executive Officer
Age 55
Mr. Endo joined the Company in 2003 from GFGC LLC, a startup venture formed to establish a European-based financial guaranty company, where he was CEO and co-founder. Mr. Endo was a managing director and member of the corporate leadership team and board of directors at FGIC from 1991 to 2001. During his tenure at FGIC, he was responsible for various business segments including structured finance, bond insurance underwriting (including public finance and international), capital markets and new products. Between 1988 and 1991, Mr. Endo was a managing director responsible for the mortgage finance unit and was later a member of the financial institutions group at Prudential Securities. He began his career at Citibank in 1976. He is Vice Chairman and a director of the Association of Financial Guaranty Insurers. Mr. Endo attended Williams College where he graduated with a B.A. in political science.
Edward U. Gilpin (1) Chief Financial Officer
Age 48 Mr. Gilpin joined the Comany in January, 2008 from ACA Capital (OTC BB: ACAH.PK), a holding company that provides asset management services and credit protection products, where he was Executive Vice President and Chief Financial Officer and a Director. Prior to joining ACA Capital in 2001, Mr. Gilpin was Vice President in the Financial Institutions Group at Prudential Securities, Inc.’s investment banking division. From 1998-2000, Mr. Gilpin served in the capacity of chief financial officer for an ACA Capital affiliated ‘AAA’ start-up venture, developing the financial plans and spearheading the capital raising process. From 1991-1998, Mr. Gilpin was with MBIA, Inc., holding various positions in the finance area. His most recent position with MBIA was Director, Chief of Staff for MBIA Insurance Company’s President. Mr. Gilpin began his career as an Assistant Vice President in the Mutual Funds Department of BHC Securities, Inc. Mr. Gilpin holds an M.B.A. from Columbia University and a B.S. from St. Lawrence University.
David K. Steel (2) Chief Risk Manager
Age 52 Mr. Steel has been Chief Risk Manager since 2005. In this role, Mr. Steel is responsible for credit policy and approval, portfolio surveillance, risk reporting, loss reserving and treaty negotiations. Mr. Steel joined the Company in August 2005 from Hanover Capital Mortgage Holdings, Inc. where he was a Managing Director and Portfolio Manager. Prior to Hanover, Mr. Steel served as head of the Domestic Mortgage Insurance and
62
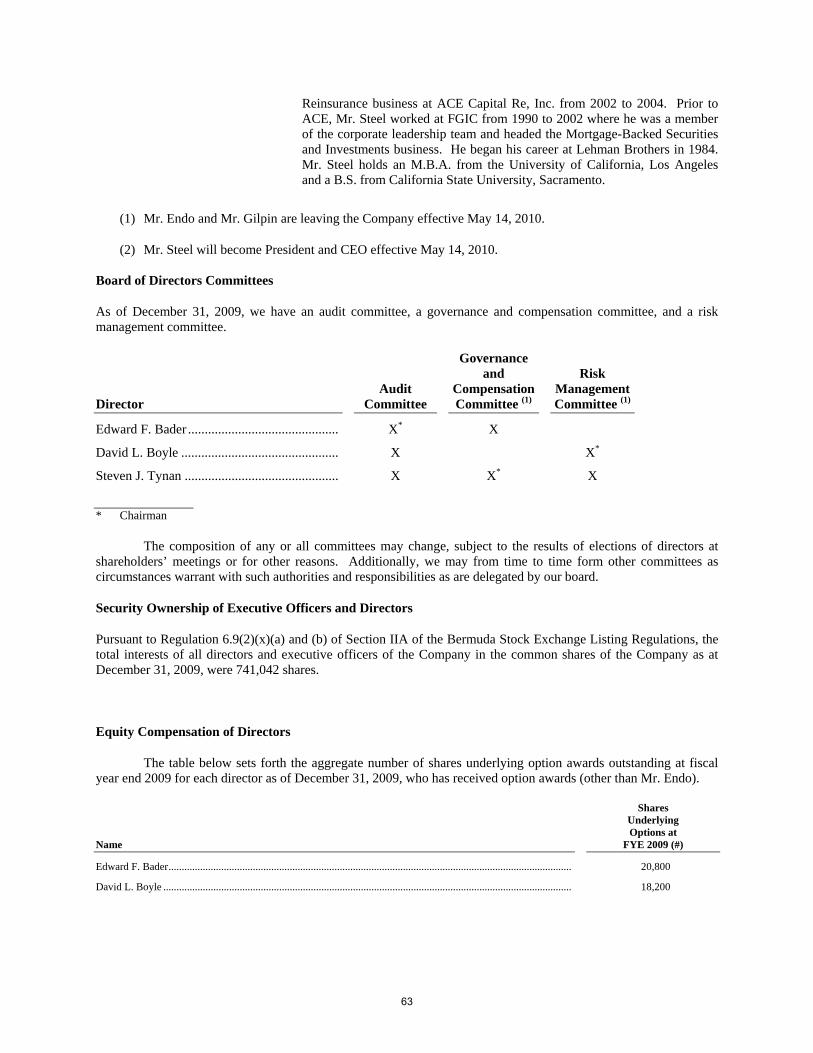
Reinsurance business at ACE Capital Re, Inc. from 2002 to 2004. Prior to ACE, Mr. Steel worked at FGIC from 1990 to 2002 where he was a member of the corporate leadership team and headed the Mortgage-Backed Securities and Investments business. He began his career at Lehman Brothers in 1984. Mr. Steel holds an M.B.A. from the University of California, Los Angeles and a B.S. from California State University, Sacramento.
(1) Mr. Endo and Mr. Gilpin are leaving the Company effective May 14, 2010.
(2) Mr. Steel will become President and CEO effective May 14, 2010. Board of Directors Committees
As of December 31, 2009, we have an audit committee, a governance and compensation committee, and a risk management committee.
Director Audit
Committee
Governance and
Compensation Committee (1)
Risk Management Committee (1)
Edward F. Bader ............................................. X* X
David L. Boyle ............................................... X X*
Steven J. Tynan .............................................. X X* X
* Chairman
The composition of any or all committees may change, subject to the results of elections of directors at shareholders’ meetings or for other reasons. Additionally, we may from time to time form other committees as circumstances warrant with such authorities and responsibilities as are delegated by our board.
Security Ownership of Executive Officers and Directors
Pursuant to Regulation 6.9(2)(x)(a) and (b) of Section IIA of the Bermuda Stock Exchange Listing Regulations, the total interests of all directors and executive officers of the Company in the common shares of the Company as at December 31, 2009, were 741,042 shares.
Equity Compensation of Directors
The table below sets forth the aggregate number of shares underlying option awards outstanding at fiscal year end 2009 for each director as of December 31, 2009, who has received option awards (other than Mr. Endo).
Name
Shares Underlying Options at
FYE 2009 (#)
Edward F. Bader ......................................................................................................................................................... 20,800
David L. Boyle ........................................................................................................................................................... 18,200
63
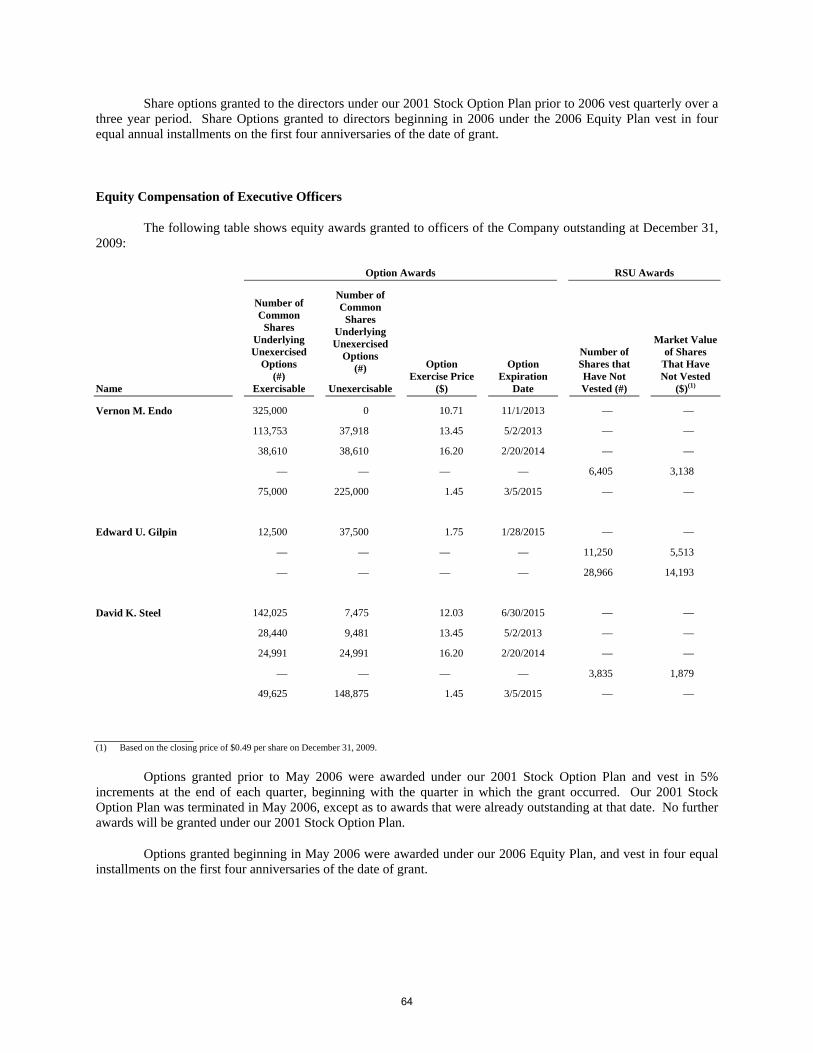
Share options granted to the directors under our 2001 Stock Option Plan prior to 2006 vest quarterly over a three year period. Share Options granted to directors beginning in 2006 under the 2006 Equity Plan vest in four equal annual installments on the first four anniversaries of the date of grant.
Equity Compensation of Executive Officers
The following table shows equity awards granted to officers of the Company outstanding at December 31, 2009:
Option Awards RSU Awards
Name
Number of Common
Shares Underlying Unexercised
Options (#)
Exercisable
Number of Common
Shares Underlying Unexercised
Options (#)
Unexercisable
Option Exercise Price
($)
Option Expiration
Date
Number of Shares that Have Not Vested (#)
Market Value of Shares
That Have Not Vested
($)(1)
Vernon M. Endo 325,000 0 10.71 11/1/2013 — —
113,753 37,918 13.45 5/2/2013 — —
38,610 38,610 16.20 2/20/2014 — —
— — — — 6,405 3,138
75,000 225,000 1.45 3/5/2015 — —
Edward U. Gilpin 12,500 37,500 1.75 1/28/2015 — —
— — — — 11,250 5,513
— — — — 28,966 14,193
David K. Steel 142,025 7,475 12.03 6/30/2015 — —
28,440 9,481 13.45 5/2/2013 — —
24,991 24,991 16.20 2/20/2014 — —
— — — — 3,835 1,879
49,625 148,875 1.45 3/5/2015 — —
(1) Based on the closing price of $0.49 per share on December 31, 2009.
Options granted prior to May 2006 were awarded under our 2001 Stock Option Plan and vest in 5% increments at the end of each quarter, beginning with the quarter in which the grant occurred. Our 2001 Stock Option Plan was terminated in May 2006, except as to awards that were already outstanding at that date. No further awards will be granted under our 2001 Stock Option Plan.
Options granted beginning in May 2006 were awarded under our 2006 Equity Plan, and vest in four equal installments on the first four anniversaries of the date of grant.
64

The following table shows options exercised and RSUs vested during 2009:
Option Awards RSU Awards
Name
Number of Shares Acquired on Exercise (#)
Value Realized on Exercise ($)
Number of Shares Acquired
on Vesting (#) Value Realized on Vesting ($)
Vernon M. Endo ........................................................... — — 3,202 1,089 (1)
Edward U. Gilpin ......................................................... —
— 3,750
9,655
2,063 (2)
1,545 (3)
David K. Steel ............................................................... — — 1,918 652 (1)
(1) Value based on the closing price of RAM Holdings common shares of $0.34 on February 20, 2009. (2) Value based on the closing price of RAM Holdings common shares of $0.55 on January 28, 2009. (3) Value based on the closing price of RAM Holdings common shares of $0.16 on March 5, 2009
Director Service Contracts
There are no service contracts with directors, except for an employment agreement with Mr. Endo (who was reappointed as a director in January 2010) which expired March 31, 2010.
65

RAM Holdings Corporate Information
Corporate Headquarters RAM Re House 46 Reid Street Hamilton HM 12 Bermuda 441-296-6501 www.ramre.com
Investor Information
Information about RAM Holdings, including all quarterly earnings releases and reports, can be accessed via our website at www.ramre.com under Investor Information.
Requests for copies of the RAM Holdings 2009 quarterly reports may be made by contacting the Secretary of RAM Holdings at the Corporate Headquarters address above or [email protected].
Exchange Listing
RAM Holdings’ common shares are listed on the Bermuda Stock Exchange (BSX) located at:
Phase 1 – Third Floor, Washington Mall Church Street Hamilton, HM 11 Bermuda 441-292-7212 or -7213 www.bsx.com
Transfer Agent
BNY Mellon
Telephone Number: 1-877-296-3711 1-610-382-7833 (Outside the U.S.) 1-888-269-5221 (Hearing Impaired - TDD Phone)
Mailing Address: BNY Mellon Shareowner Services 480 Washington Boulevard Jersey City, New Jersey 07310-1900 USA
Web Address: http://www.bnymellon.com/shareowner/isd
Independent Registered Auditors
PricewaterhouseCoopers Hamilton, Bermuda
66