Ram Air Parachute Design
51
1 13th AIAA Aerodynamic Decelerator Systems Technology Conference Clearwater Beach, May 1995 PRECISION AERIAL DELIVERY SEMINAR RAM-AIR PARACHUTE DESIGN J.Stephen Lingard Martin-Baker Aircraft Co. Ltd. Higher Denham Middlesex England 1 INTRODUCTION Accurate delivery of a payload by parachute is a requirement in both the space and military fields. The cost savings available from the recovery and re-use of expensive space vehicle elements provides an incentive to develop systems capable of allowing recovery to land sites 1 . Clearly, recovery to land engenders safety risks to population and property. Re-entry trajectories can only place recovered hardware at the position for initiation of the recovery system within certain tolerances. The recovery system must therefore have sufficient gliding capability and wind penetration to reach the designated landing site. It should also be able to achieve low vertical and horizontal velocity at landing to minimise the potential for damage to the payload. The only option for land recovery is a high reliability guided gliding parachute recovery system. For accurate delivery of military payloads by conventional parachute system the aircraft must fly low and close to the target area. This exposes the aircraft to the risk of air defense weapons and small arms and may compromise the location of ground troops. If the aircraft flies at a safe altitude the drop accuracy is compromised due to imprecision of the drop point and the vagaries of the wind. A parachute with glide and a control system can compensate for inaccuracies in drop point and wind. The greater the glide angle the greater the offset that can be achieved for a given drop altitude. Copyright J.S. Lingard 1995
-
Upload
muzafar-shah-mosam-shah -
Category
Documents
-
view
408 -
download
49
description
AAIAA Seminar
Transcript of Ram Air Parachute Design

1
13th AIAA Aerodynamic Decelerator Systems Technology Conference
Clearwater Beach, May 1995
PRECISION AERIAL DELIVERY SEMINAR
RAM-AIR PARACHUTE DESIGN
J.Stephen Lingard
Martin-Baker Aircraft Co. Ltd.
Higher Denham
Middlesex
England
1 INTRODUCTION
Accurate delivery of a payload by parachute is a requirement in both the space and military fields.
The cost savings available from the recovery and re-use of expensive space vehicle elements provides an incentiveto develop systems capable of allowing recovery to land sites 1. Clearly, recovery to land engenders safety risks topopulation and property. Re-entry trajectories can only place recovered hardware at the position for initiation ofthe recovery system within certain tolerances. The recovery system must therefore have sufficient glidingcapability and wind penetration to reach the designated landing site. It should also be able to achieve low verticaland horizontal velocity at landing to minimise the potential for damage to the payload. The only option for landrecovery is a high reliability guided gliding parachute recovery system.
For accurate delivery of military payloads by conventional parachute system the aircraft must fly low and close tothe target area. This exposes the aircraft to the risk of air defense weapons and small arms and may compromisethe location of ground troops. If the aircraft flies at a safe altitude the drop accuracy is compromised due toimprecision of the drop point and the vagaries of the wind. A parachute with glide and a control system cancompensate for inaccuracies in drop point and wind. The greater the glide angle the greater the offset that can beachieved for a given drop altitude.
Copyright J.S. Lingard 1995

2
Because of its high glide capability and its controllability the ram air parachute offers considerable scope for thedelivery or recovery of payloads to a point by automatic control linked to a guidance system.
deployment height loss hd
final approach height loss ha
maneuver radius Rm= hm x L/D
maneuver height hm
wind drift dw
wind vw
Figure 1 Precision aerial delivery mission parameters
Figure 1 shows a schematic diagram of a typical Precision Aerial Delivery System (PADS) mission. The drop isdivided into three sections:
• deployment of the ram-air parachute and establishment of steady glide;• maneuvering flight to the landing zone;• final approach maneuver to touch down.
The altitude available for maneuver from an initial drop altitude h0 is
hm = h0 -hd - ha.
In the absence of wind the maneuvering radius Rm from any altitude h is:
Rm = (h- ha) × L/D
where L/D is the parachute lift to drag ratio.
The volume within which the system can maneuver to the landing zone is therefore a cone which, in zero wind,has a half angle of tan -1(L/D). Therefore, the greater the L/D of a parachute, the greater the offset of initial drop itcan tolerate and the more flexible it is for the PADS role.
The effect of wind is to distort the cone. At any altitude the centre of the cone is moved by a distance dw from thetarget where

3
dvw
dhww
h
= ∫0
where ( )v f hw is the wind vector and w = rate of descent of the parachute f (h).
If the parachute is placed within the distorted cone an efficient guidance system will result in accurate delivery. Ifthe system strays outside the cone the parachute will fail to reach the target.
A typical PADS is shown in Figure 2
typical configuration includes:l drogue assembly.l parafoil assembly.l airborne control unitl harness and attachment hardwarel ancillary equipment:
è reefing cuttersè drogue release cuttersè brake release cutters
drogue chute:
control unit
payload
payload harness
ram-air parachute
steering lines
Figure 2 Precision aerial delivery system
The idea of homing gliding parachute systems is not new. The earliest systems used a directional antenna whichwas mounted on the airborne control system. The parachute was simply turned toward a transmitter located at theintended landing point. A refinement of his system was to introduce a dead band 2 in the control law to prevent theservo-motors from continually trying to steer the parachute. The major breakthrough in homing parachute systemswas the application of GPS. This allowed the parachute to steer to a predetermined location without the need for aground station.
The system requirements for precision aerial delivery systems are now very demanding. These are typically:
• Deployment altitude: up to 35,000 ft;• Offset range: up to 20 km;• Accuracy: < 100 m from planned delivery point;• Suspended mass: 225 kg - 19,000 kg;• Landing: soft landing desired.

4
The purpose of this part of the seminar is to discuss the performance and design of ram-air parachutes withparticular reference to the current requirements of precision aerial delivery systems. To achieve these objectivesthe parachute must have:
• predictable high glide ratio;• predictable flight speeds compatible with wind penetration;• predictable, stable, dynamic performance in response to control inputs and wind gusts;• predictable turn characteristics;• reliable deployment and inflation characteristics;• the ability to flare to reduce landing speed.

5
2 RAM-AIR PARACHUTE
2.1 General Description
A significant advance in parachute design occurred in the early 1960's when the airfoil or ram-air parachute(Figure 3) was invented by Jalbert.
cascade lines
suspension lines
stabilizerpanel
semi-cell
cell
loaded rib
non-loaded ribupper control lines
lower control lines
inlet
Figure 3 The ram-air parachute
The ram-air parachute, when inflated, resembles a low aspect ratio wing. It is entirely constructed from fabric withno rigid members, which allows it to be packed and deployed in a manner similar to a conventional parachutecanopy. The wing has upper and lower membrane surfaces, an airfoil cross section, and a rectangular planform.The airfoil section is formed by airfoil shaped ribs sewn chordwise between the upper and lower membranesurfaces at a number of spanwise intervals forming a series of cells. The leading edge of the wing is open over itsentire length so that ram air pressure maintains the wing shape. The ribs usually have apertures cut in them. Thisallows the transmission of pressure from cell to cell during inflation and pressure equalisation after. The fabricused in the manufacture of ram-air parachutes is as imporous as possible to obviate pressure loss.
Suspension lines are generally attached to alternate ribs at multiple chordwise positions with typically 1m spacing.Although this results in a large number of suspension lines, it is necessary in order to maintain the chordwiseprofile of the lower surface. Lines are often cascaded to reduce drag. Some early ram-air parachute designs havetriangular fabric panels, "flares", distributed along the lower surface to which the suspension lines are attached. Inaddition to distributing evenly the aerodynamic load to the suspension lines and thus helping to maintain the lowersurface profile, these panels partially channel the flow into a two dimensional pattern, reducing tip losses and alsoaid in directional stability. Whilst flares produce a truer airfoil shape with fewer distortions, improvingaerodynamic efficiency, there is a penalty to be paid in weight, bulk and construction complexity. Indeed, the dragof the flares themselves possibly outweighs their advantage. Most modern designs dispense with the flares, theaerodynamic loads being distributed by tapes sewn to the ribs. Stabilizer panels are often used to provide partialend-plating and to enhance directional stability. On current designs rigging lines are typically 0.6 - 1.0 spans inlength, with the wing crown rigged, that is the lines in a given spanwise bank are equal in length. The wingtherefore flies with arc-anhedral.
Several airfoil sections have been used on ram air parachutes: most early wings used the Clark Y section with asection depth of typically 18% chord however recent designs have benefited from glider technology and use a range

6
of low speed sections (e.g. NASA LS1-0417). Various nose aperture shapes have also been investigated as noseshape affects inflation and airfoil drag. There is also a trend to reduce section depth to reduce drag but this hasproceeded slowly since inflation performance can be adversely affected. Means for lateral-directional andlongitudinal control are provided by steering lines attached to the trailing edge of the canopy. These lines form acrow's-foot pattern such that pulling down on one line causes the trailing edge on one side of the canopy to deflect.Turn control is effected by an asymmetric deflection of the steering lines, and angle of incidence control and flare-out are accomplished by an symmetric deflection.
The ram-air parachute has basically been refined within sports parachuting, with much of the early workexperimental in nature. However, because of the perceived military and space applications and the desire toimprove glide ratios, increasingly theoretical studies of ram-air performance were undertaken 3,4,5 . Reference 3contains a comprehensive bibliography of ram-air literature up to 1980. Development of the ram-air since thattime has comprised continued refinement of the basic parachute in the sports parachuting world, work to increaseglide ratio 6, and development of the ram-air parachute at small scale for submunition use, up to very large scale forspace applications. Puskas et al 7,8 document the development of large Paraflite canopies up to 3000 ft2. Wailes 9
reports on Pioneer Systems / NASA work on the design of a 47 cell, 1000 lb, 11,000 ft2 ram-air for the recovery of60,000 lb loads. Goodrick 10 has also published a useful paper examining scaling effects on ram-air parachutes.
Chatzikonstantinou 11,12 presents a sophisticated and elegant numerical analysis to predict the behaviour of anelastic membrane ram-air wing under aerodynamic loading, solving coupled aerodynamic and structural equations.This type of analysis is essential in the extension of ram-air technology to high wing loading where thedeformation of the wing is extremely significant. The equations of motion and apparent masses related to ram-airparachutes is discussed in Ref. 3 and Lissaman and Brown 13. Brown 14 analyses turn control. The aerodynamiccharacteristics of ram-air wings are investigated by Gonzalez 15 who applies panel methods to determine lift curveslope and lift distribution. Ross 16 investigates the application of computational fluid dynamics (CFD) to theproblem and demonstrates the potential for improved lift to drag ratio by restricting the airfoil inlet size to therange of movement of the stagnation point.

7
3 AERODYNAMIC CHARACTERISTICS OF RAM-AIR WINGS
3.1 General
Once inflated a ram-air parachute is essentially a low aspect wing and thus conventional wing theory is applicable.While CFD Navier Stokes and vortex panel methods can give accurate predictions of the performance of ram-airwings, a simpler approach is adopted here in order to bring out clearly the influence of the various parameters onwing performance.
3.2 Two dimensional flow around the ram-air wing section
Before embarking on the analysis of the ram-air wing, it is useful to consider the two-dimensional flow around thewing section at various angles of incidence. The flow pattern can be determined using a vortex singularitymethod 3. The canopy is modelled by a vortex sheet placed to coincide with the physical location of the canopy.The strength of the sheet is determined by the application of velocity boundary conditions. The sheet strength isthen used to determine the pressure distribution and circulation, and hence lift coefficient. By varying the angle ofincidence, the lift curve slope dCL/dα, and the incidence angle for zero lift αZL, are found.
0
0.5
1
1.5
2
2.5
3
-10 -5 0 5 10 15
α (°)
CL
slope a0 = 0.12 deg-1
= 6.89 rad-1
Figure 4 Theoretical section lift coefficient for an 18% Clark Y ram-air parachute airfoil
Figure 4 shows lift coefficient as a function of angle of incidence. The value of dCL/dα, a0 = 6.89 rad-1 is greaterthan the theoretical value of 2π rad-1 for a thin airfoil, but is slightly less than the value of 7.18 rad-1 for an 18%thick airfoil. The zero lift angle αZL is found from Figure 4 to be -7°.
3.3 Ram-air wing lift coefficient
Although lifting line theory represents well those wings with aspect ratios above A = 5, in the case of low aspectratio wings the trailing edge of the wing is exposed to a flow which has been deflected by the leading edge, thus thelift cannot be assumed to act on a line and must be spread over the surface of the airfoil. Also the influence oflateral edges (a minor effect for larger aspect ratios) becomes increasingly significant as aspect ratio is reduced.
Several attempts have been made to extend lifting line theory into the range of small aspect ratios, or to replace itby lifting surface theory which accounts for the effect of wing chord on lift characteristics. Lifting line theory (e.g.Pope 17) gives the lift curve for a wing as
aa A
A a=
+ +π
π τ0
0 1( )where a0 = the two dimensional lift curve slope
8
A = aspect ratio
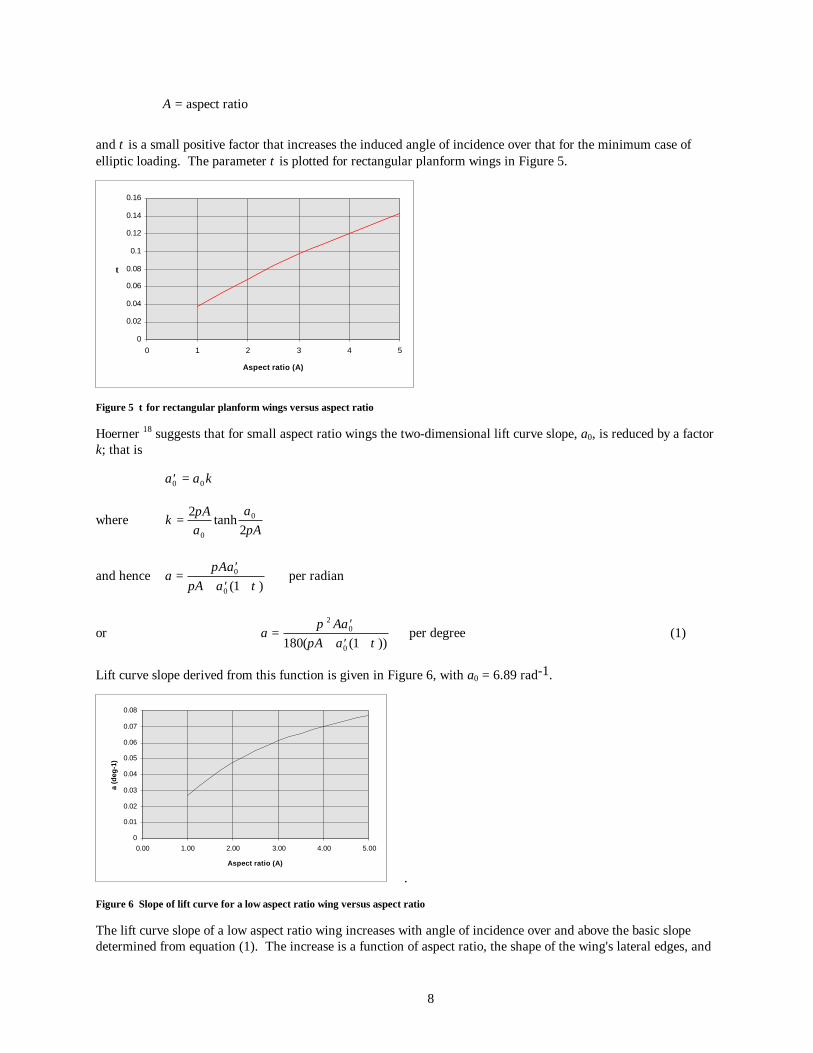
and τ is a small positive factor that increases the induced angle of incidence over that for the minimum case ofelliptic loading. The parameter τ is plotted for rectangular planform wings in Figure 5.
0
0.02
0.04
0.06
0.08
0.1
0.12
0.14
0.16
0 1 2 3 4 5
Aspect ratio (A)
τ
Figure 5 τ for rectangular planform wings versus aspect ratio
Hoerner 18 suggests that for small aspect ratio wings the two-dimensional lift curve slope, a0, is reduced by a factork; that is
′=a a k0 0
where kA
aa
A= 2
20
0ππ
tanh
and hence aAa
A a= ′
+ ′ +π
π τ0
0 1( ) per radian
or aAa
A a= ′
+ ′ +π
π τ
20
0180 1( ( )) per degree (1)
Lift curve slope derived from this function is given in Figure 6, with a0 = 6.89 rad-1.
0
0.01
0.02
0.03
0.04
0.05
0.06
0.07
0.08
0.00 1.00 2.00 3.00 4.00 5.00
Aspect ratio (A)
a (d
eg-1
)
.
Figure 6 Slope of lift curve for a low aspect ratio wing versus aspect ratio
The lift curve slope of a low aspect ratio wing increases with angle of incidence over and above the basic slopedetermined from equation (1). The increase is a function of aspect ratio, the shape of the wing's lateral edges, and

9
the component of velocity normal to the wing. This non-linear component has been the subject of severalinvestigations but is still not well understood. In some ways, however, it appears to be caused by the drag based onthe normal velocity component and thus tentatively the lift increment ∆CL may be written 18
∆C kL ZL ZL= − −12sin ( ) cos( )α α α α
where kI is a function of aspect ratio and the shape of the wing's lateral edges. Reference 18 suggests thatexperimental data are best fitted over the range 10 2 5. .< <A with
k A1 333 133= −. . (2)For A > 2 5. , k1 0=
The total lift for a low aspect ratio rectangular wing before the stall may therefore be written
C a kL ZL ZL ZL= − + − −( ) sin ( ) cos( )α α α α α α12 (3)
where a is determined from equation (1) and k1 from equation (2).
Figure 7 shows theoretical lift coefficient curves for a ram-air wing of aspect 3.0 compared with experimentaldata 19,20. The zero lift angle, αZL, is taken as -7° from section 3.2 above. Up to the stall the match is acceptable.A small decrease in αZL would further enhance the fit. Below α = 0° the NASA data show a deviation from thenearly constant value of dCL/dα predicted theoretically. This appears to be caused by wing distortion and belowα = 5° the NASA data are suspect. Both sets of experimental data show that ram-air canopies stall at lower anglesof incidence than rigid wings of corresponding section and aspect ratio 21. Ware and Hassell 20 and Ross 16 proposethat the reason for this early stall is that the sharp leading edge of the upper lip of the open nose causes leadingedge separation at relatively low lift coefficients. Conversely, Speelman et al 22 state that separation takes placeprogressively from the trailing edge. The shapes of the lift curves found by Ware and Hassell are howeverreminiscent of long bubble leading edge separation described by Hoerner 18. Also, the large values of suction nearthe upper lip shown in Reference 3 would in practice promote leading edge separation. The NASA results showearlier stall than the Notre Dame data, stall occurring at approximately CL = 0.7 compared with CL = 0.85. Thiscould be attributed to the fact that the NASA models were flexible whereas the Notre Dame models were semi-rigid. Speelman et al 22 emphasise the importance of maintaining a smooth, undistorted airfoil section under load,with particular attention being paid to the inlet shaping, if the aerodynamic characteristics of the wing are not to beadversely affected.
0.00
0.20
0.40
0.60
0.80
1.00
1.20
-10.00 -5.00 0.00 5.00 10.00 15.00 20.00
α (°)
CL
Notre Dame
NASA
Theory
Figure 7 Experimental and theoretical lift coefficients for a ram-air wing, A = 3.0
Figure 8 shows CL data for aspect ratios 2 to 4. It should be noted that the lift curve slope increases with increasingaspect ratio.

10
0.000
0.200
0.400
0.600
0.800
1.000
1.200
-10.00 -5.00 0.00 5.00 10.00
α (°)
CL
A=2.0
A=2.5
A=3.0
A=3.5
A=4.0
Figure 8 Theoretical lift coefficient for a ram-air wing for aspect ratios 2.0 - 4.0
3.4 Ram-air wing drag coefficient
For a rectangular wing lifting line theory gives
C CC
AD DL= + +
0
2 1( )δπ
where CD0 is the profile drag and the second term represents the induced drag.
The parameter δ is a small factor to allow for non-elliptic loading. Theoretical values for δ are plotted in Figure 9.
0
0.005
0.01
0.015
0.02
0.025
0.03
0.035
0.04
0 1 2 3 4 5
Aspect ratio (A)
δ
Figure 9 δ for rectangular planform wings versus aspect ratio
For small aspect ratio wings a further drag component exists, corresponding to the non-linear lift componentpreviously described. Again assuming that this results from drag due to normal velocity, we may write 23
∆C kD ZL= −13sin ( )α α
where k1 is identical to that for the lift component and may be found from equation (2).
The total drag coefficient for a low aspect ratio rectangular wing before the stall may thus be written:

11
C CC
AkD D
LCZL= + + + −0
2
131( )
sin ( )δ
πα α (4)
It should be noted that in this equation CLC is the circulation lift coefficient { = −a ZL( )α α } not the total liftcoefficient given by equation (3), which includes the non-linear lift increment. Clearly, for a given lift coefficientthe second the third terms in equation (4) decrease with increasing aspect ratio and hence, with CD0 remainingconstant, the total drag coefficient decreases.
Ware and Hassell 20 estimate the profile drag of ram-air wings by summing the following contributory elements:
i) basic airfoil drag - for an airfoil of typical section - CD = 0.015;
ii) surface irregularities and fabric roughness - CD = 0.004;
iii) open airfoil nose - CD = 0.5 h/c where h = the inlet height and c = chord length;
iv) drag of pennants and stabiliser panels - for pennants and stabilisers which do not flap this is very small (0.0001). If flapping occurs
CD = 0.5 Sp / S
where Sp is the area of pennants and stabiliser panels and S is the constructed canopy area and may be written
S = bc
where b = constructed wing span.
Theoretical and experimental coefficients 19,20 for a ram-air wing is presented in Figure 10 for aspect ratio 3.0.The agreement lends some credibility to the scheme of calculation proposed. Figure 11 shows drag coefficient datafor a range of aspect ratios. It is interesting to note that drag coefficient at a given incidence varies little withaspect ratio.
0.00
0.05
0.10
0.15
0.20
0.25
0.30
0.35
0.40
-10.00 -5.00 0.00 5.00 10.00 15.00 20.00
α (°)
CD
Notre Dame
NASA
Theory
Figure 10 Experimental and theoretical drag coefficient for a ram-air wing, A = 3.0

12
0.000
0.050
0.100
0.150
0.200
0.250
-10.00 -5.00 0.00 5.00 10.00
α (°}
CD
A=2.0
A=2.5
A=3.0
A=3.5
A=4.0
Figure 11 Theoretical drag coefficient for ram-air wings, A =2.0 - 4.0
3.5 Ram-air wing lift-drag ratio
Theoretical and experimental values of L/D for the wing alone are shown in Figure 12.
0.00
1.00
2.00
3.00
4.00
5.00
6.00
7.00
-10.00 -5.00 0.00 5.00 10.00 15.00 20.00
α (°)
L/D
Notre Dame
NASA
Theory
Figure 12 Experimental and theoretical L/D ratio for a ram-air wing, A = 3.0
Up to the stall the agreement with the NASA data is quite good, particularly in respect of the maximum value ofL/D of a little over 5.0. Notice that the maximum theoretical value of L/D occurs close to the stall (see Figure 7).
0.000
1.000
2.000
3.000
4.000
5.000
6.000
-10.00 -5.00 0.00 5.00 10.00
α (°)
L/D
A=2.0
A=2.5
A=3.0
A=3.5
A=4.0
Figure 13 Theoretical L/D for ram air wings, A = 2.0 - 4.0

13
Figure 13 shows L/D ratio for a range of aspect ratios. The expected improvement of L/D ratio with increasingaspect ratio is shown. Theory predicts that for the wing alone maximum L/D increases from 4.15 at A = 2.0 to5.86 at A = 4.0.

14
4 AERODYNAMIC CHARACTERISTICS OF RAM-AIR PARACHUTES
4.1 General
The incorporation of a ram-air wing into a parachute system necessitates the addition of suspension lines. Someearly ram-air parachutes were rigged such that the wing flew flat. Reference 3 shows that this necessitates verylong suspension lines (> 2.25 spans) to give spanwise stability of the wing. Lines of this length create substantialdrag, overwhelming any gains in lift achieved. Ram-air wings are thus rigged with the lines in any chordwisebank of equal length, giving the wing arc-anhedral. This is called crown rigging. Arc-anhedral is slightlydetrimental to the wings lifting properties whilst the drag coefficient for a given incidence angle remains as thatfor a flat wing. The suspension lines themselves add considerably to the total drag.
The amount of arc anhedral is a function of the ratio of line length (R) to span (b). From the above it is apparentthat the wing alone performance improves with increasing aspect ratio but, for a given value of R/b, the larger theaspect ratio the greater the line length. In addition, the number of lines tends to increase with aspect ratio. Thusincreasing aspect ratio gives markedly higher line drag. Reducing R/b, for a given aspect ratio reduces line dragbut yields an increasingly inefficient wing. It is clear, therefore, that the performance of the complete parachutesystem is significantly different to that for the wing alone. The result of introducing arc-anhedral and line drag aretherefore considered here.
4.2 Ram-air parachute lift coefficient
With the wing incorporated into ram air parachute arc-anhedral is introduced. For a conventional wing withdihedral angle defined as shown in Figure 14, Ref. 18 indicates that
C CL L= =β β02cos .
β
βb
ε
R
dihedral angle for a conventional wing
anhedral angle for a ram-air wing
Figure 14 Definition of anhedral angle for a ram-air wing
This equation may be shown to remain valid for a wing with arc-anhedral if β is defined as in Figure 14.Referring to Figure 14:

15
β ε= / 2but
ε = b R/ 2hence
β = b R/ 4 rad or 45b R/ π °.
Equation (3) may now be re-written for a ram air wing with arc-anhedral:
C a kL ZL ZL ZL= − + − −( ) cos sin ( ) cos( )α α β α α α α21
2 (5)
where in the absence of any information on the effect of arc-anhedral on k1 it is assumed that k1 remainsunchanged.
The effect of line length on wing lift coefficient is shown in Figure 15.
0.82
0.84
0.86
0.88
0.9
0.92
0.94
0.96
0.98
0.6 0.8 1 1.2 1.4
line length / span (R/b)
CL/CL(R/b=∞ )
Figure 15 Influence of line length on the lift coefficient of a ram-air wing A = 3.0
4.3 Ram-air parachute drag coefficient
The overall drag of a gliding parachute system comprises the sum of wing drag, line drag and store drag; line dragand store drag contributing significantly.
To simplify the estimation of line drag it is assumed that all lines are the same length and are subject to the samenormal velocity V cosα where V is the system velocity. For typical Reynolds numbers the drag coefficient of asuspension line would be approximately 1.0. The contribution of line drag to the total system drag may thereforebe estimated from
C nRdSDl = cos3 α (6)
where n = the number of linesR = mean line lengthd = line diameter
and S = canopy area
Store drag coefficient may be written
CC S
SDsD s= ( )

16
where ( )C SD s = store drag area
Induced drag and profile drag for a wing with anhedral remain approximately constant 23; therefore the dragcoefficient for a ram-air parachute system with arc-anhedral may finally be written from equation (4)
C C C Ca
AkD D Dl Ds
ZLZL= + + + − + + −0
2 2
131
( )( ) sin ( )
α απ
δ α α (7)
where A = the aspect ratio based on constructed span b.
4.4 Ram-air parachute lift-drag ratio
Typically the maximum theoretical value of lift to drag ratio occurs close to or beyond the stall for a conventionalram-air parachute. The maximum L/D is therefore not a useful measure to use for the performance of a ram-airparachute since, the wing cannot operate effectively close to the stall. Current ram-air parachutes are generallyrigged to fly with a lift coefficient of around 0.5. To compare the performance of various configurations we willtherefore consider L/D ratio at this practical value of CL.
The basic parachute design considered in this section is as follows:
• aspect ratio A = 3.0• inlet height h = 0.14c• line length R = 0.8b• line diameter d = 2.5 mm• number of lines = 1 line per 12 ft2 (= 1 line per 1.11 m2)• payload drag coefficient CDs = 0.006
The value of L/D ratio for varying aspect ratios and line lengths is shown in Figure 16, for a ram-air parachute of300 m2 area with 270 lines. It is clear that for large ram-air parachutes performance is considerably worse than forthe wing alone. The best performance is achieved with the largest aspect ratio and the lower line length to spanratios of 0.5 - 0.6. For all aspect ratios performance decreases with increasing line length. At line length to spanratio 0.8 there is little improvement in performance with increasing aspect ratio. At large line length to span ratiosthe smaller aspect ratio wings yield the best performance. These trends are explained by the influence of line drag.At low values of R/b the reduction in induced drag with increasing aspect ratio exceeds the rise in drag due to thelonger lines. At higher values of R/b the increasing line drag with aspect ratio overwhelms the decreases ininduced drag.
2.00
2.10
2.20
2.30
2.40
2.50
2.60
2.70
2.80
2.90
3.00
0.4 0.6 0.8 1 1.2 1.4 1.6
line length to span ratio R/b
L/D
A=2.0
A=2.5
A=3.0
A=3.5
A=4.0
Figure 16 Theoretical L/D for a 300m2 ram-air parachute with various aspect ratios and line length to span ratios

17
Figure 17 shows L/D ratio for varying aspect ratios and line lengths for a 36 m2 ram air parachute with 32 lines.Different trends to those for the large canopy are apparent. Again performance is significantly poorer than for thewing alone, but not as bad as for the large ram-air. At all values of R/b performance increases with aspect ratio butgains become less significant at the longer line lengths. That implies that at this scale line drag is less significant.The reduction of induced drag with increasing aspect ratio is always greater than the increase in line drag. ForA < 3.5 there is an optimum value of R/b of 0.8. Below R/b = 0.8 the falling wing efficiency is more significantthan the decrease in line drag. Above R/b = 0.8 wing efficiency gains are less significant and line drag increasespredominate.
2.60
2.80
3.00
3.20
3.40
3.60
0.4 0.6 0.8 1 1.2 1.4 1.6
line length to span ratio R/b
L/D
A=2.0
A=2.5
A=3.0
A=3.5
A=4.0
Figure 17 Theoretical L/D for a 36m2 ram-air parachute with various aspect ratios and line length to span ratios
The difference in performance of the two sizes of ram-air parachute is of most concern for PADS. An examinationof equations (6) and (7) reveals the problem. All contributions to total drag are proportional to wing area with theexception of line drag. Typically, ram air parachutes are designed with the number of suspension linesproportional to the area of the parachute. Moreover, if the canopy is scaled with constant wing loading, and aconstant inflation g load is assumed, line diameter is also constant. Examining equation (6):
C nRdSDl = cos3 α
nd/S is constant and CDl increases with line length R. Therefore simply scaling up a ram-air wing reduces itsperformance. For the basic design of L/D at CL = 0.5 varies with area as shown in Figure 18.
2
2.5
3
3.5
4
4.5
5
10 100 1000
wing area S (m 2)
L/D
Figure 18 Lift to drag ratio versus wing area for the basic design with inlet height 0.14c, CL = 0.5

18
For gliding parachutes to have acceptable performance at large scale it is therefore necessary to considerablyimprove the wing design.
4.5 Gliding parachute performance improvement
Improvements in system glide performance may be achieved by reducing system drag, which comprises the profiledrag of the store, suspension lines and wing and the induced drag of the wing, or by increasing working liftcoefficient ( CLmax ). To achieve acceptable performance it is necessary to consider both approaches. Generallyeffort aimed at reducing drag is, as with all airborne devices, yields most benefit.
It is useful to examine the drag contributions to a typical ram-air parachute to give an indication of where effort atdrag reduction will be most effective. For a 300 m2 ram-air parachute:
Basic airfoil drag = 0.015 ( 8.2%)Roughness drag = 0.004 ( 2.2%)Inlet drag 0.5 h/c = 0.070 (38.5%)Induced drag at CL = 0.5 = 0.033 (18.1%)Line drag = 0.054 (29.7%)Store drag = 0.006 ( 3.3%)TOTAL = 0.182
For a 36 m2 canopy:
Basic airfoil drag = 0.015 ( 10.2%)Roughness drag = 0.004 ( 2.7%)Inlet drag 0.5 h/c = 0.070 (47.6%)Induced drag at CL = 0.5 = 0.033 (22.5%)Line drag = 0.019 (12.9%)Store drag = 0.006 ( 4.1%)TOTAL = 0.147
The significant difference between the two is the substantially larger line drag for the 300 m2 canopy.
For the 300 m2 canopy basic airfoil drag and roughness drag only contribute 10.4% of total drag and are clearlydifficult to improve. Nonetheless, more modern wing sections, such as the LS-1 series, have lower profile dragthan the Clark Y from which these data were derived, and could yield benefits. Maintenance of section by correctrigging and load distribution is essential to keep these factors low.
Store drag is not within the control of the parachute designer.
Reduction of the three remaining drag producing elements are where most gains may be made.
For large ram-air wings low values of R/b should be used. There is extensive practical experience at R/b = 0.6 andtherefore this value is recommended since, although R/b = 0.5 is regularly used for sports parachutes, the gains inusing shorter lines are not substantial and we are here at the limits of the theory. For a given line length, line dragmay be decreased by reducing the number of lines provided the wing remains undistorted under load. Cascading oflines is standard practice on sports ram air parachutes and is now being used on larger ram-air parachutes.Cascading would reduce line drag by approximately 20% thus L/D for the large parachute would rise from 2.75 to2.90.
Together inlet drag and induced drag contribute 56.6% of the total drag of the 300m2 system. Clearly, before anysignificant improvement in ram air wing performance can be realised, one or both of these elements must be

19
considerably reduced. Figure 16 shows that increasing aspect ratio beyond 3.0 without other improvements isineffective since reduced induced drag is simply traded with increased line drag. To yield significantimprovements inlet drag must be reduced.
The basic 18% Clark Y airfoil has an 11% inlet height at the ribs, with 15% between ribs. This gives an averageinlet height of 14%. Increasing scale will reduce the amount of bulge between ribs, since the cell width typicallyremains constant in scaling up the wing - due to constant line spacing - whilst the height of the cell increases.For a 36m2 wing with unloaded ribs, the cell depth to width is typically 0.8 but for the 300m2 parachute with onlyloaded ribs this becomes 1.6. Bulge will therefore be approximately halved giving a smoother wing with heighttypically 12.5%. Applying this correction increases L/D for the large wing from 2.75 to 2.86.
Once the parachute is gliding it is strictly only necessary to have an inlet height which covers the range ofmovement of the stagnation streamline. Ross 16 shows that a 4% inlet is feasible, however, since inflation must notbe compromised reductions in inlet height should be conservative. Wings with 8.4% inlet height at the ribs areflying therefore 8% overall height is realistic. With this value performance is significantly enhanced as shown inFigure 19.
2
2.5
3
3.5
4
4.5
5
10 100 1000
wing area S (m2)
L/D
Figure 19 Lift to drag ratio versus wing area for the basic design with inlet height 0.08c, CL = 0.5
An additional benefit of reduced inlet height is reduced disruption of the flow over the upper leading edge of thewing and consequently delayed stall. Ross 16 shows that for an 8.4% inlet stall does not occur until CL = 0.85 andwith a 4% inlet stall is further delayed to CL = 1.55. It is therefore possible with reduced inlet height to increasethe design lift coefficient. Figure 20 demonstrates the increased benefits of this strategy. A further improvementin performance comes out of increasing design lift coefficient in that if flight speed is maintained then wing areacan be reduced giving further L/D gains.
2
2.5
3
3.5
4
4.5
5
10 100 1000
wing area S (m 2)
L/D

20
Figure 20 Lift to drag ratio versus wing area for the basic design with inlet height 0.08c, CL = 0.65
Clearly for large scale ram-air parachutes detailed attention to drag reduction is essential.
⇒ Greater attention must be paid to inlet design. Inlet height should be minimised subject to maintaininginflation reliability. Vortex panel methods can be used to determine to stagnation point range.
⇒ The number of lines should be minimised subject to maintaining the airfoil shape without undue distortion.⇒ Cascading of lines should be employed.⇒ Line length should be optimised. R/b = 0.6 is a good design point.⇒ Aspect ratio 3.0 is a good design point.

21
5 RAM-AIR PARACHUTE FLIGHT PERFORMANCE
Figure 21 shows a gliding parachute in steady descent in still air with a velocity V and gliding angle γ.
γ α
γm g
V
DLc
c
m gc
s
V
Ds
Ls
D lL l
Figure 21 Ram-air parachute in steady gliding flight
Resolving the forces acting on the system horizontally and vertically:
( )L L L D D Dc l s c l s+ + sin cosγ γ- ( + + ) = 0 (8)
( )( + ) - + + - ( + + ) =m m g L L L D D Ds c c l s c l scos sinγ γ 0 (9)
where Lc = lift force acting on the canopyLl = lift force acting on the suspension linesLs = lift force acting on the payloadDc = drag force acting on the canopyDl = drag force acting on the suspension linesDs = drag force acting on the payloadms = mass of the canopymc = mass of the storeg = acceleration due to gravity
From equation (8)
L D C CL D/ = / = /1 tanγ (10)

22
where L L L Lc l s= =+ + total system liftD D D Dc l s= ( + + ) = total system drag
C L V SL = / . =05 2ρ lift coefficient
C D V SD = / . =05 2ρ drag coefficientS = reference areaρ = air density.
Equation (10) is the standard equation of aerodynamic efficiency in gliding flight. The smaller the glide angle thehigher becomes the lift-drag ratio and the greater the gliding range for a given height loss.
Writing equation (9) in coefficient form and transforming:
W V S C CD L= . ( + )05 2ρ γ γcos sin
where W m m gs c= ( + ) = system weight.
Substituting from equation (10) and simplifying gives:
W V S C CL D= . ( + )05 2 2 2 0.5ρ (11)
or W V SCT= .05 2ρ
where C C CT L D= ( + ) =2 2 0.5 tangent coefficient . (12)
The velocity of the parachute system in steady gliding flight may therefore be written:
VWS C CL D
=( + )
2 12 2 0.5
0.5
ρ⋅ ⋅
. (13)
The horizontal (u) and vertical (w) velocity components of the system may be calculated from:
u V= cosγw V= sinγ. (14)
Equation 10 shows that in still air conditions glide angle, and therefore glide distance for a given height loss, is afunction only of lift to drag ratio. However, equation 13 indicates that velocity V is dependent on wing loading(W/S), air density, and the aerodynamic characteristics of the parachute. Consequently, in still air conditions, agiven parachute will travel the same distance for a given height loss whatever the altitude or wing loading, butvelocity down the glide path will increase with increasing altitude and wing loading.
It is obvious that penetration of the wind is essential for effective PADS operation. Using a design lift coefficientof 0.5 and a range of L/D ratios typical vertical and horizontal velocities for ram-air parachutes for varying wingloading are shown in Figure 22.
For PADS systems to give some margin over possible winds, flight velocity is usually chosen to be >20m/s; that isa wing loading in the range of 15 - 20 kg/m2 or 3 - 4 lb/ft2.

23
0.00
5.00
10.00
15.00
20.00
25.00
30.00
0.00 5.00 10.00 15.00 20.00 25.00 30.00
Wing loading (kg/m2)
Vel
ocity
(m/s
)
u L/D = 2.5
w L/D =2.5
u L/D = 3.0
w L/D =3.0
u L/D = 3.5
w L/D =3.5
Figure 22 Ram-air parachute flight velocities versus wing loading

24
6 RAM-AIR PARACHUTE LONGITUDINAL STATIC STABILITY
6.1 Canopy Rigging
So far in this discussion it has been assumed that the system can be induced to fly at the angle of attackcorresponding to the optimum L/D. The practical means of achieving this is by rigging the canopy; that ispositioning the payload, and hence the CG of the system, such that the equilibrium attitude is at the required angleof attack. The parachute will be in stable equilibrium when the sum of moments acting on the system is zero andwhen the slope of the pitching moment curve, dC dM / α , is negative - that is when any small disturbance fromequilibrium results in a restoring couple. Assuming that the system is rigid and that the canopy mass is lumped atthe quarter chord point, the moment M about the wing quarter chord of the system may be written with reference toFigure 23:
α
DLc
c
γm gs
V
Ds
Ls
γV
m gc
D lL l
Mc/4
Forces and moments
γV
γV
Angles
xb
z
µ
θ
α+ µ = γ+ θzb
chord
Figure 23 Definitions for static stability analysis
[ ] [ ]M M R L D R L D m gRc s s l l s= + + − + + + − + −/ sin( ) cos( ) sin( ) cos( ) sin4 2α µ α µ α µ α µ θ (15)
where Mc/4 = pitching moment of the canopy about 25% chord point,Ll = lift force acting on the suspension linesLs = lift force acting on the payloadDl = drag force acting on the suspension linesDs = drag of the payloadms = mass of the payloadg = acceleration due to gravityR = distance from the quarter chord point of the canopy to the payload,
and µ = rigging angle as defined in Figure 23.
Line force is assumed to act normal to and at the mid-point of the line joining the 25% chord point to the payload.Therefore line drag and lift may be written:

25
CndR
SDl = +cos ( )3 α µ
CndR
SLl = − + +cos ( ) sin( )2 α µ α µ
Writing equation (15) in coefficient form:
[ ] [ ]C CRc
C CRc
C Cm gR
V ScM MC Ls Ds Ll Dl
s= + + − + + + − + −/ sin( ) cos( ) sin( ) cos( )sin
4 22α µ α µ α µ α µ θ
ρ½
or simplifying
[ ]C CRc
C CRc
nRdS
m gRV Sc
M MC Ls Dss= + + − + − + −/ sin( ) cos( )
cos ( ) sin4
2
22α µ α µ α µ θ
ρ½ (16)
Lift, drag and pitching moment data for a ram-air wing of A = 2.5 are shown in Figures 24-26.
0.0
0.10.2
0.3
0.40.5
0.6
0.7
0.80.9
1.0
-10 0 10 20 30 40 50 60 70 80 90
α (°)
CL
δ =0°δ=45°δ=9 0°
Figure 24 Lift coefficient for a ram-air wing without lines, A = 2.5
0.0
0.1
0.20.3
0.4
0.5
0.6
0.70.8
0.9
1.0
-10 0 10 20 30 40 50 60 70 80 90
α (°)
CD
δ =0°δ=45°δ=90°
Figure 25 Drag coefficient for a ram-air wing without lines, A = 2.5

26
-0.6
-0.5
-0.4
-0.3
-0.2
-0.1
0.0-10 0 10 20 30 40 50 60 70 80 90
α (°)
Cm
δ =0°δ=45°δ=9 0°
Figure 26 Pitching moment coefficient for a ram-air wing without lines, A = 2.5
The variation of pitching moment with rigging angle derived from equation (16) is illustrated in Figure 27.System parameters are S = 300 m2, A = 2.5, R/b = 0.6, ms = 5229 kg, n =270, d = 0.0025, CDs = 0.006, CLs = 0.
-0.400
-0.350
-0.300
-0.250
-0.200
-0.150
-0.100
-0.050
0.000
0.050
0.100
0.150
-10 0 10 20 30 40
α (°)
Cm
µ = 0°µ = 2°µ = 4°µ = 6°µ = 8°µ = 10°
Figure 27 Pitching moment coefficient for a ram-air parachute with various rigging angles, S = 300m2, A = 2.5, R/b = 0.6
It is clear that variation of µ is an effective means of selecting the stable angle of attack, α, a wide range of stablevalues of a being available for fairly small changes in µ. In this case the system will fly at α = 2.8° resulting in CL
= 0.5 if rigged with µ = 5°. In this configuration CD = 0.165, giving an L/D ratio of 3.03. Rigging the canopywith µ too high results in a lower trim angle of attack and a fall off in performance; setting µ too low may lead tothe trim angle of incidence being beyond the stall, resulting in a considerable drop in performance. This sensitivityto rigging emphasises the need for accurate rigging using suspension lines with very low elasticity.
The effect of increasing line length to R/b = 1.0 is shown in Figure 28.

27
-0.400
-0.350
-0.300
-0.250
-0.200
-0.150
-0.100
-0.050
0.000
0.050
0.100
0.150
-10 0 10 20 30 40
α (°)
Cm
µ = 0°µ = 2°µ = 4°µ = 6°µ = 8°µ = 10°µ = 12°µ = 14°
Figure 28 Pitching moment coefficient for a ram-air parachute with various rigging angles, S = 300m2, A = 2.5, R/b = 1.0
With longer lines it is necessary to increase the rigging angle to µ = 9.1° to attain the desired trim lift coefficient of0.5. The parachute will fly at α = 2.9°, CD = 0.187, giving an L/D ratio of 2.67. The magnitude of dCm/dα at Cm
= 0 becomes greater with longer lines implying increased static stability.
Increasing aspect ratio also results in improved static stability the value of dCm/dα again increasing due to thegreater line length.
6.2 Effect of trailing edge deflection
On a conventional wing deflecting plain flaps changes the camber of the section and results in increases of liftcoefficient at a given incidence, maximum lift coefficient, profile drag and induced drag. Deflecting the trailingedge of a ram-air wing produces similar effects as is demonstrated in Figures 24-26.
The effect of flap deflection δ to half and full brakes position on the system pitching moment about the wingquarter chord point is shown in Figures 29 and 30 for the standard system. The influence of flap deflection on thevarious flight parameters is shown in Figures 31, 32 and 33.
-0.500
-0.400
-0.300
-0.200
-0.100
0.000
0.100
0.200
-10 0 10 20 30 40
α (°)
Cm
µ = 0°µ = 2°µ = 4°µ = 6°µ = 8°µ = 10°
Figure 29 Pitching moment coefficient for a ram-air parachute with various rigging angles, S = 300m2, A = 2.5, R/b = 0.6, δ =45°

28
-0.400
-0.300
-0.200
-0.100
0.000
0.100
0.200
-10 0 10 20 30 40
α (°)
Cm
µ = 0°µ = 2°µ = 4°µ = 6°µ = 8°µ = 10°
Figure 30 Pitching moment coefficient for a ram-air parachute with various rigging angles, S = 300m2, A = 2.5, R/b = 0.6, δ =90°
0.00
0.20
0.40
0.60
0.80
1.00
1.20
0 10 20 30 40 50 60 70 80 90
trailing edge deflection δ (°)
CL,
CD
0.00
0.50
1.00
1.50
2.00
2.50
3.00
L/D
CD
CL
L/D
Figure 31 Influence of trailing edge deflection on lift and drag coefficients and lift to drag ratio for the standard system
-15.00
-10.00
-5.00
0.00
5.00
10.00
15.00
20.00
25.00
0 10 20 30 40 50 60 70 80 90
trailing edge deflection δ (°)
angl
es (°
) α°γ°θ°µ°
Figure 32 Influence of trailing edge deflection on trim values of α, γ and θ for the standard system

29
0.00
5.00
10.00
15.00
20.00
25.00
0 10 20 30 40 50 60 70 80 90
trailing edge deflection δ (°)
u, V
(m/s
)
0.00
2.00
4.00
6.00
8.00
10.00
w(m
/s) V
u
w
Figure 33 Influence of trailing edge deflection on flight velocities for the standard system
Deflection of the trailing edge results in only a small changes in trim angle of attack. CL and CD increase almostin proportion resulting in L/D reducing (γ increasing) only slightly from 3.03 to 2.52 with δ changing from 0° to90°. The significant increases in lift and drag coefficients result only in reduced flight velocity. Thus, deflectingthe trailing edge does not strongly influence glide angle for the standard system, γ changes only from 18.3° to21.6°. Therefore, in this configuration controlling glide slope in zero wind conditions is not feasible.
This is not true for all rigging configurations. With increased line length, trailing edge deflection can result in asignificant change in trim angle as shown in Figures 34 and 35. With the system rigged off-design with µ = 6°fully deflecting the trailing edge results in a shift of trim angle of attack from 3.8° to 36.3°.
-0.6
-0.5
-0.4
-0.3
-0.2
-0.1
0
0.1
0.2
0.3
-10 0 10 20 30 40
α (°)
Cm
µ = 4°µ = 6°µ = 8°µ = 10°µ = 12°µ = 14°
Figure 34 Pitching moment coefficient for a ram-air parachute with various rigging angles, S = 300m2, A = 2.5, R/b = 1.0, δ =45°
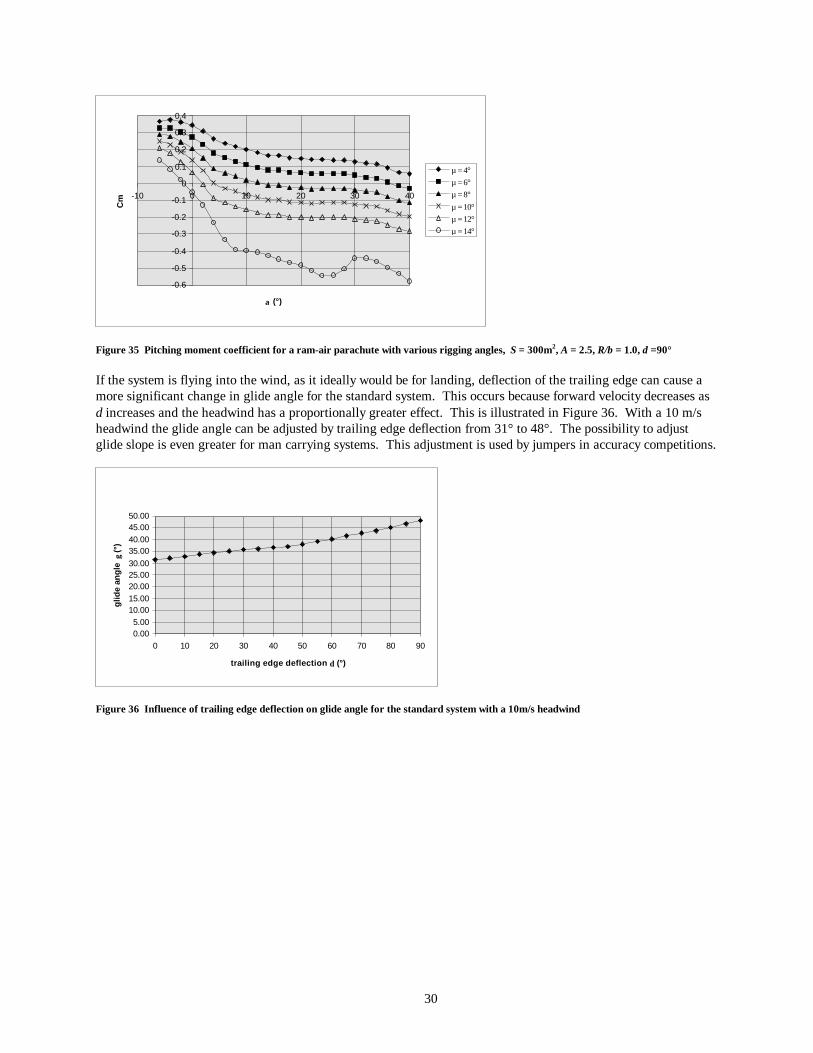
30
-0.6
-0.5
-0.4
-0.3
-0.2
-0.1
0
0.1
0.2
0.3
0.4
-10 0 10 20 30 40
α (°)
Cm
µ = 4°µ = 6°µ = 8°µ = 10°µ = 12°µ = 14°
Figure 35 Pitching moment coefficient for a ram-air parachute with various rigging angles, S = 300m2, A = 2.5, R/b = 1.0, δ =90°
If the system is flying into the wind, as it ideally would be for landing, deflection of the trailing edge can cause amore significant change in glide angle for the standard system. This occurs because forward velocity decreases asδ increases and the headwind has a proportionally greater effect. This is illustrated in Figure 36. With a 10 m/sheadwind the glide angle can be adjusted by trailing edge deflection from 31° to 48°. The possibility to adjustglide slope is even greater for man carrying systems. This adjustment is used by jumpers in accuracy competitions.
0.005.00
10.0015.0020.0025.0030.0035.0040.0045.0050.00
0 10 20 30 40 50 60 70 80 90
trailing edge deflection δ (°)
glid
e an
gle
γ (°
)
Figure 36 Influence of trailing edge deflection on glide angle for the standard system with a 10m/s headwind

31
7 RAM AIR PARACHUTE LONGITUDINAL DYNAMICS
7.1 General
In this section consideration is given to the dynamics of ram-air parachute flight. Dynamical analysis is importantin that it can indicate conditions under which steady glide is rapidly achieved, and conditions where dynamicinstability may occur or transient motions are only lightly damped. Of particular importance is the ability of thesystem to move smoothly from one state to another. This includes release of the trailing edge of the parachutefollowing inflation, stall recovery, response to dynamic trailing edge deflection - glide path modification and thelanding flare manoever - and gust response. Here motions are limited to the pitch plane. In the following sectionlateral control and stability will be discussed.
The dynamic stability model used to derive the results described in this seminar is detailed in Reference 3. It isimportant to note that inclusion of the added masses is the equations of motion is important in obtaining correctpredictions. Added masses are derived in references 3 and 13.
The model is capable of simulating the effects on flight dynamics of changes in system parameters such as canopysize, line length, rigging angle, payload mass and aerodynamic characteristics and environmental parameters. Inthis section it is applied to review the response of a ram-air parachute system to control inputs and gusts and toevaluate the impact of variations in parachute size, payload mass, line length and altitude on system stability.
7.2 Longitudinal dynamics of small ram-air parachutes
Consider initially a small ram-air parachute system with the following parameters:
• S = 36 m2
• A = 2.5• R/b = 0.6• µ = 3.5°• ms = 217 kg• CDs = 0.006
It is well known that small ram-air parachutes can perform an effective flare manoever to reduce landing velocity.This is shown in Figures 37 and 38. Flight is commenced at 400 m. Initially the parachute is in steady glide forthree seconds, subsequently the trailing edge is deflected to the full brakes position over one second. During thefirst three seconds the system maintains a horizontal velocity of 13.3 m/s and a vertical velocity of 3.7 m/s. L/D is3.6. The stable angle of attack is 2.9°, the payload is swung backward with θ = -9.3° and the glide angle is 15.7°.
The short period during and immediately after control deflection simulates the flare manoever. The objective of aflared landing is to simultaneously reduce both horizontal and vertical velocity by increasing lift and drag.Referring to Figure 37 and 38, it is noticed that immediately following initiation of control deflection the canopyhorizontal velocity falls rapidly with the payload deceleration lagging. The system therefore pitches up, with θeventually reaching 5.6° forward 1.8 seconds from control initiation. Glide angle reduces, attaining 7.2°coincident with maximum pitch forward. Following an initial slight reduction (predictable from static analysis forδ up to 45°), α rises to 10° at maximum pitch forward of the payload. The vertical velocities of the canopy andpayload, which are almost identical throughout the manoever, initially fall to 1.35 m/s before rising again to>4.0 m/s. The minimum vertical velocity occurs at maximum pitch forward which is the time at which the payloadwould ideally land. The horizontal velocity at this time is 10.7 m/s and has not reached its minimum value whichoccurs at the bottom of the backswing of the payload. When minimum horizontal velocity occurs vertical velocityhas risen again to 3.0 m/s. The time between control initiation and ideal touchdown is 1.8 s with a height loss of4.6 m.

32
-20.00
-15.00
-10.00
-5.00
0.00
5.00
10.00
15.00
20.00
25.00
30.00
0.00 5.00 10.00 15.00 20.00
time (s)
angl
es (°
)
θαγ
37 Response of ram air parachute to trailing edge deflection, S = 36m2, R/b = 0.6, ms =217kg, h=400m
u
w
-6.00
-4.00
-2.00
0.00
2.00
4.00
6.00
8.00
10.00
12.00
14.00
0.00 5.00 10.00 15.00 20.00
time (s)
velo
citie
s (m
/s) u
w
u - payload
w payload
Figure 38 Response of ram air parachute to trailing edge deflection, S = 36m2, R/b = 0.6, ms =217kg, h=400m
It is clear that the flare is essentially a dynamic manoever. If control initiation is too early vertical velocity will behigh, if too late horizontal velocity will be high. A headwind can significantly improve the quality of the landing.In this case, with a wind of 7.5 m/s, the ideal landing would result in a vertical velocity of 1.35 m/s and ahorizontal velocity of only 3.2 m/s.
Subsequent to the simulated flare, a highly damped phugoid motion occurs. All disturbance is damped in 2 cycles,12 seconds after control initiation. Steady gliding flight at full brakes follows with α = 4.7°, u =9.3 m/s, w =3.6 m/s and L/D = 2.6.
7.3 Scaling effects
The small ram-air configuration clearly has good dynamic characteristics and in scaling up to large parachutes,appropriate to the PADS role, it is essential that these are retained. It is therefore useful here to digress in order todiscuss scaling parameters. At first sight one may assume that a good option would be to maintain wing loading in

33
order to match flight speed. However there is another option. In considering general dynamic parachute motion,three non-dimensional parameters which influence parachute behaviour in unsteady motion regularly arise:
mD
s
ρ 03 mass ratio M r
VgD
2
0
Froude number Fr
VtD0
dimensionless time τ .
Mass ratio represents the ratio of payload mass to an air mass associated with the canopy. This parameterinfluences many unsteady parachute phenomena including inflation and wake recontact.
In classical hydrodynamics Froude number represents the ratio of fluid inertial forces to gravitational forces. For aparachute in steady descent:
k V D m gsρ 20
2 =
where k is a constant (πCT / 8 ).
Hence, substituting in the Froude number term for V2, we obtain
Fk
m gD D g k
mDr
s s= ⋅ ⋅ = ⋅1 1 1
02
0 03ρ ρ
Thus for a parachute in steady descent Froude number is equivalent to mass ratio and we may use either parameter.
Because, in unsteady motion, time is a parameter, a group emerges from dimensional analysis relating timeinterval to a characteristic time for the parachute. Dimensionless time, τ, is defined as velocity divided by acharacteristic length for the parachute:
τ = VD0
In analysing unsteady behaviour of systems of different scales this parameter is useful to compare response times.
Consider the small ram-air parachute system defined above. The wing loading for the system, ms/S, is 6.02 kg/m2.Mass ratio, defined for a for ram-air parachutes as ms/ ρ S1.5, is 0.82. Scaling up to a 300 m2 wing on the basis ofwing loading would give a payload mass of 1808 kg and matching mass ratio gives 5229 kg. Other parameters forthe scaled up system are as follows:
• S = 300 m2
• A = 2.5• R/b = 0.6• µ = 5°• CDs = 0.006
The time to deflect the trailing edge is also scaled on the dimensionless time basis. For the small system:
steady glide velocity = 13.9 m/srepresentative length = S½ = 6.0 mdeflection time = 1.0 s

34
thus
dimensionless time of pull = τ = = × =VtL
13 9 106 0
2 32. ..
.
For the payload scaled on mass ratio, steady glide velocity is 23.4 m/s, and the representative length is 17.3m.Deflection time should therefore be 1.7s. That is time is scaled by a factor of 1.7 between the two systems.
To evaluate the two scaling parameters the test flight used for the small system is repeated for the scaled up system.
Figures 39 and 40 show the response of the system scaled on the basis of mass ratio. The response is qualitativelyvery similar to the small system. An effective stall is achieved with the subsequent motion well damped.
-20.00
-15.00
-10.00
-5.00
0.00
5.00
10.00
15.00
20.00
25.00
30.00
0.00 5.00 10.00 15.00 20.00 25.00 30.00 35.00 40.00
time (s)
angl
es (°
) θαγ
Figure 39 Response of ram air parachute to trailing edge deflection, S = 300m2, R/b = 0.6, ms =5229kg, h=400m
u
w
-10.00
-5.00
0.00
5.00
10.00
15.00
20.00
25.00
0.00 5.00 10.00 15.00 20.00 25.00 30.00 35.00 40.00
time (s)
velo
citie
s (m
/s) u
w
u - payload
w -payload
Figure 40 Response of ram air parachute to trailing edge deflection, S = 300m2, R/b = 0.6, ms =5229kg, h=400m
During the first three seconds the system flies at a horizontal velocity of 22.3 m/s and a vertical velocity of 7.3 m/s.L/D is 3.0. The stable angle of attack is 2.9°, the payload is swung backward with θ = -10.3° and the glide angle is18.2°. During the flare the parachute pitches up to a maximum θ of 3.2°, slightly after which vertical velocity is

35
reduced to 2.8 m/s and horizontal velocity to 16 m/s. Minimum vertical velocity is achieved 3.8 seconds aftercontrol initiation. Height loss during the manoever is 18 m. It is worthy of note that the ratio of horizontalvelocity at flare to initial horizontal velocity is 72% and the ratio of vertical velocities is 38%, compared with 79%and 36% for the small system. System response to maximum pitch up was 1.77 times that for the small system -close to the predicted ratio. Motion after flare is favourable with all disturbance damped within two cycles.Phugoid cycle time is 10.8 s compared to 6.5 s for the small system; a ratio of 1.7. The performance of the largesystem scaled on the basis of mass ratio is thus very close to the small prototype.
Figures 41 and 42 show the performance for the system scaled on the basis of wing loading. The response tocontrol input is somewhat different. The flare manoever is acceptable but weaker with less pitch up of the payload.The subsequent motion is a lightly damped oscillation of pitch angle and angle of attack of period 6.3 s.
-30.00
-20.00
-10.00
0.00
10.00
20.00
30.00
0.0 5.0 10.0 15.0 20.0 25.0 30.0 35.0 40.0
time (s)
angl
es (°
)
θαγ
Figure 41 Response of ram air parachute to trailing edge deflection, S = 300m2, R/b = 0.6, ms =1808kg, h=400m
u
w
-6.00
-4.00
-2.00
0.00
2.00
4.00
6.00
8.00
10.00
12.00
14.00
0.0 5.0 10.0 15.0 20.0 25.0 30.0 35.0 40.0
time (s)
velo
citie
s (m
/s)
u
w
u payload
w payload
Figure 42 Response of ram air parachute to trailing edge deflection, S = 300m2, R/b = 0.6, ms =1808kg, h=400m
For the first three seconds of steady flight the system glides at a horizontal velocity of 13.3 m/s and a verticalvelocity of 4.4 m/s and L/D is 3.0. The stable angle of attack is 2.7°, the payload is swung backward with θ = -10.8° and the glide angle is 18.2°. In the flare the parachute only pitches to θ of -2.0° at which time verticalvelocity is reduced to 2.2 m/s and horizontal velocity to 10.0 m/s. Minimum vertical velocity is achieved3.6 seconds after control initiation with height loss 10 m. Vertical velocity is only reduced to 50% the initial value

36
and horizontal velocity is reduced to 75% of the steady glide value. The poorly damped pitching motion aftersimulated flare would be of concern for a PADS operation since it would indicate that this configuration issensitive to control inputs and gusts and would give unpredictable performance.
It can be demonstrated that the effect identified is related to mass ratio, and not some other feature of theconfiguration, if the simulation of the system scaled on the basis of wing loading is repeated with the parachuteflying at high altitude such that mass ratio is also matched. This occurs at an altitude of 10,000 m. Figures 43 and44 show that the performance is now identical to the system originally scaled on mass ratio.
-30.00
-20.00
-10.00
0.00
10.00
20.00
30.00
40.00
0.00 5.00 10.00 15.00 20.00 25.00 30.00 35.00 40.00
time (s)
angl
es (°
) θαγ
Figure 43 Response of ram air parachute to trailing edge deflection, S = 300m2, R/b = 0.6, ms =1808kg, h=10,000m
u
w
-15.00
-10.00
-5.00
0.00
5.00
10.00
15.00
20.00
25.00
0.00 10.00 20.00 30.00 40.00
time (s)
velo
citie
s (m
/s)
u
w
u payload
w payload
Figure 44 Response of ram air parachute to trailing edge deflection, S = 300m2, R/b = 0.6, ms =1808kg, h=10,000m
Thus to match dynamic performance of ram air parachutes scaling must be on the basis of mass ratio.

37
7.4 Effects of trailing edge release
During inflation the trailing edge of ram-air parachutes are retained in the full brake position to prevent surgeduring inflation. The ability to smoothly transition from this state to full glide is essential to PADS. The standardlarge system was subjected to a simulated flight with brakes fully applied over 1.7 seconds after 3 seconds ofgliding flight, and released over 1.7 seconds after 20 seconds of flight. The results are shown in Figures 45 and46.
• S = 300m2
• A = 2.5• R/b = 0.6• µ = 5°• ms = 5229 kg• CDs = 0.006
-30.00
-20.00
-10.00
0.00
10.00
20.00
30.00
40.00
0.0 5.0 10.0 15.0 20.0 25.0 30.0 35.0 40.0 45.0 50.0
time (s)
angl
es (°
) θαγ
Figure 45 Response of ram air parachute to trailing edge deflection and release, S = 300m2, R/b = 0.6, ms =5229kg, h=500m
u
w
-15.00
-10.00
-5.00
0.00
5.00
10.00
15.00
20.00
25.00
0.0 5.0 10.0 15.0 20.0 25.0 30.0 35.0 40.0 45.0 50.0
time (s)
velo
citie
s (m
/s) u
w
u payload
w payload
Figure 46 Response of ram air parachute to trailing edge deflection and release, S = 300m2, R/b = 0.6, ms =5229kg, h=500m

38
As the brakes are released the canopy accelerates rapidly with the load lagging. The system pitches down,eventually reaching θ = -25°. Perturbation of angle of attack is very small. As the system dives and acceleratesboth vertical and horizontal velocity increase. When the payload swings forward again vertical velocity rapidlyrecovers to its steady glide value. Subsequent oscillations are highly damped. The ability to effect a goodtransition is thus demonstrated.
7.5 Effects of gusts
The effect of a 7.5m step tail gust on the standard large system is shown in Figures 47 and 48.
-30.00
-20.00
-10.00
0.00
10.00
20.00
30.00
40.00
0.00 5.00 10.00 15.00 20.00 25.00 30.00 35.00 40.00 45.00 50.00
time (s)
angl
es (°
)
θαγ
Figure 47 Response of ram air parachute to a step gust, S = 300m2, R/b = 0.6, ms =5229kg, h=500m
u
w
-15.00
-10.00
-5.00
0.00
5.00
10.00
15.00
20.00
25.00
30.00
35.00
0.0 5.0 10.0 15.0 20.0 25.0 30.0 35.0 40.0 45.0 50.0
time (s)
velo
citie
s (m
/s)
u
w
u payload
w payload
Figure 48 Response of ram air parachute to a step gust, S = 300m2, R/b = 0.6, ms =5229kg, h=500m
As the gust hits the parachute at time 3 seconds the response shown is similar to the release of brakes. The systempitches down rapidly and accelerates to recover the lost lift. Rate of descent initially rises but recovers as thepayload pitches forward and the parachute glides out of the dive. Again α variations are only very transient.Following the gust, classical damped phugoid motion occurs with α constant. As the gust ceases at 25 seconds theeffect is the equivalent of a head gust. The canopy responds by decelerating rapidly. The payload lags and thesystem pitches up. Rate of descent transiently falls to almost zero with the additional lift before the system pitches

39
down and steady glide is re-established. With the standard system gusts are accommodated with the resultingperturbations rapidly damped.
7.6 Effect of line length on longitudinal performance
To investigate the effect of line length on dynamic performance, the standard large system was modelled with linelength increased to R/b = 1.0. The results are shown in Figures 49 and 50.
-30.00
-20.00
-10.00
0.00
10.00
20.00
30.00
40.00
0.0 5.0 10.0 15.0 20.0 25.0 30.0 35.0 40.0
time (s)
angl
es (°
) θαγ
Figure 49 Response of ram air parachute to trailing edge deflection, S = 300m2, R/b = 1.0, ms =5229kg, h=400m
u
w
-15.00
-10.00
-5.00
0.00
5.00
10.00
15.00
20.00
25.00
0.0 5.0 10.0 15.0 20.0 25.0 30.0 35.0 40.0
time (s)
velo
citie
s (m
/s) u
w
u payload
w payload
Figure 50 Response of ram air parachute to trailing edge deflection, S = 300m2, R/b = 1.0, ms =5229kg, h=400m
The system is initially established in a steady glide with u = 21.8 m/s, w =8.1 m/s and L/D = 2.7. The flare is poorwith minimum vertical velocity occurring 1.8 s before maximum pitch up. Vertical velocity is only reduced to 58%of the initial glide velocity with horizontal velocity at this time still 90% of the steady glide figure. At maximumpitch up horizontal velocity is 15 m/s (69% of the steady glide value) but rate of descent has risen to 6.2 m/s (77%of the steady glide value). The perturbation in angle of attack is large with α reaching 25°; well beyond the stall.Recovery from the manoever is also poor with a sustained pitching motion ensuing. The poor performance is

40
related to the increased lag between canopy and payload response. Clearly then, increased line length not onlyreduces glide performance but also compromises longitudinal stability.
7.7 Effect of rate of retraction of trailing edge on flare
It is obviously easier to design retraction devices which do not have to deflect the trailing edge very rapidly. Theimpact of much slower trailing edge deflection on the effectiveness of the flare of the standard large system istherefore simulated. Figures 51 and 52 show the results of control actuation over 5 seconds.
-20.00
-15.00
-10.00
-5.00
0.00
5.00
10.00
15.00
20.00
25.00
30.00
0.00 5.00 10.00 15.00 20.00 25.00 30.00 35.00 40.00
time (s)
angl
es (°
)
θαγ
Figure 51 Response of ram air parachute to slow trailing edge deflection, S = 300m2, R/b = 0.6, ms =5229kg, h=400m
u
w
-10.00
-5.00
0.00
5.00
10.00
15.00
20.00
25.00
0.00 5.00 10.00 15.00 20.00 25.00 30.00 35.00 40.00
time (s)
velo
citie
s (m
/s)
u
w
u payload
w payload
Figure 52 Response of ram air parachute to slow trailing edge deflection, S = 300m2, R/b = 0.6, ms =5229kg, h=400m
Again glide is established with u = 22.3 m/s and w = 7.3 m/s. Response of the system to control deflection isslower and pitch up of the system is less pronounced, with θ only reaching -1.7°, 5.6 seconds after the start ofcontrol movement. At this time vertical velocity is at a minimum at 3.3 m/s, 45% of the initial value andhorizontal velocity is 17.2 m/s, 77% of the initial value. Flare is therefore seen to be less effective with slowerapplication of brakes but may still be acceptable. A low vertical velocity is still achieved and horizontal velocity isonly 1.2 m/s greater than with rapid trailing edge deflection, a small percentage of the overall forward speed.

41
7.8 Summary
⇒ Acceptable longitudinal stability is achievable for large parachutes appropriate to the PADS role but scalingmust be on the basis of mass ratio. Mass ratios in the range of 0.8 are recommended but severely adversedynamics does not appear to occur above Mr = 0.4.
⇒ Increasing altitude increases mass ratio and therefore stability. ⇒ Increasing mass for a given canopy size increases stability. ⇒ Increasing line length is destabilizing. ⇒ Effective reduction in vertical velocity by the flare manoever is achievable at the recommended mass ratio, but
residual horizontal velocities increase with system size: 10.7 m/s for a 36 m2 wing, 16 m/s for a 300 m2 wingand > 20 m/s for a 1000 m2 wing.

42
8 RAM-AIR PARACHUTE LATERAL MOTION
8.1 General
The most important aspects of lateral motion for PADS are predictable turns and lateral dynamic stability.
In analysing lateral motion, a model based on the equations set out by Doherr 24 has been used. Aerodynamic datawere derived from references 3 and 14. The axes and definitions are shown in Figure 53.
Z, w, z, 3
X, u, x, 1
O
N, r, ψ , 6
L, p, φ, 4M, q, θ, 5
Y, v, y, 2V
β
α
δ
Figure 53 Definition of ram-air parachute axes
8.2 Turn Maneuver
Turns are initiated on ram-air parachutes by deflection of all or part of the canopy trailing edge on one side of thecanopy. As discussed in the section on longitudinal static stability, deflection of the trailing edge of the wingincreases the camber of the section and results in increases of lift coefficient at a given incidence, maximum liftcoefficient, profile drag and induced drag. In response a trailing edge deflection, δ, the wing initially yaws in thepositive direction. The lift caused by the deflection creates an adverse rolling moment. Centrifugal forces on thepayload roll the wing in the correct direction and sustain the turn.
Of interest for PADS is achievable rates of turn, so first consider steady turning flight. The equations of motion ofthe system in body axes for about the yaw and roll axes in steady turning flight are:
qSb C C C rbV
a a uv a vw a urn n nr( ) ( )δ βδ β+ + = − − +2 22 11 13 26 (17)
qSb C C C rbV
m gR m R a ur a uv a a vw a a wrl l lr s s( ) sin cos ( ) ( ) ( )δ βδ β φ θ+ + − = − + + + − − +2 15 13 33 22 26 35
(18)
where Cnδ = yawing moment coefficient due to control deflection;Cnβ = yawing moment coefficient due to sideslip;

43
Cnr = yaw damping coefficient due yaw rate;Clδ = rolling moment coefficient due to control deflection;Clβ = rolling moment coefficient due to sideslip;Clr = roll damping moment coefficient due to yaw rate;r = yaw rate (rad/s)aii = are the added masses referred to the axes defined in Figure 53.
Considering equation 17 :
a13 and a26 are small;a a11 22≈ ≈ the mass of air enclosed in the canopy;
and therefore the right hand side of the equation is approximately zero.
On the left hand side of the equation, for wings with zero sweep, Cnβ = 0 25. We are therefore left with:
( )C C rbVn nrδδ+ =
20
or
rCC
Vb
n
nr
= − ⋅δ δ2(19)
Rate of turn, for a given trailing edge deflection, is increased by velocity. The larger the parachute, the lower theturn rate for a given flight velocity and deflection. With values for Cnδ and Cnr, a good approximation for rate ofturn, r, as a function of trailing edge deflection is available. Reference 25 proposes that
CC
nrD= −
6For a typical ram air parachute operating at a design lift coefficient of 0.5 with glide ratio 3:1 then CD = 0.167, andCnr = 0.028.
Assuming that the yawing moment produced by trailing edge deflection is entirely due to the difference in drag oneach side of the wing, then from Figure 54 we can write:
C lyb
dCdn
Dδ δ
= 2
b
y
l
∆CD
Figure 54 Yawing moment on ram-air wing

44
where dCd
D
δ= rate of change of drag with deflection of the complete trailing edge at the design angle of attack.
Further, assume the control lines act on the outer half of each side of the wing then
CdCdn
Dδ δ
= 332
From Figure 26:dCd
D
δ≈011. per radian .
Therefore Cnδ = 0.01.
Substituting into equation (19) we finally have:
r Vb
= ⋅071. δ (20)
Thus for a typical large PADS system with b = 30 m and V = 20 m/s only 21° (0.366 rad) trailing edge deflectionis needed to produce a turn rate of 10°/s (0.175 rad/s). The radius of turn Rc for this case is therefore
R ur
Vrc = = = =cos .
.γ 19 0
0175108 m
Consider now equation 18. The added mass terms are negligible with the exception of (a33-a22)vw. This term ,however, has a value in the absence of acceleration and would be included in wind tunnel measured aerodynamicdata as a part of Clβ. It therefore may also be neglected. On the right hand side of the equation the aerodynamicterms are an order of magnitude smaller than the gravitational term an thus to a first approximation:
m gR m R urs ssin cos ( )φ θ =
or since θ is small φ= −sin 1 urg
So the motion of a ram-air parachute system simplifies to that of a pendulum undergoing curved motion. The sineof the angle of bank is approximately the ratio of the centrifugal acceleration and gravitational acceleration. Forthe case above
φ= × = °−sin . ..
.1 19 0 0 1759 81
19 8
8.3 Lateral instabilities
Doherr 26 shows that large ram-air parachutes are undamped in spiral divergence and only lightly damped inDutch roll.
Spiral divergence occurs when a turn in one direction is sustained. Rate of turn, velocity and bank angle increaseand the path helix steepens. Mathematical modelling indicates that slow turns can be sustained but above a certainturn rate spiral divergence develops. Divergence seems to occur if the centrifugal acceleration ur exceeds a criticalvalue. Modelling suggests that the boundary is approximately 4 m/s2 or when bank angle exceeds 24°. For a

45
typical large PADS system with b = 30 m and V = 20 m/s this criterion means that sustained turn rate should bekept less than 0.2 rad/s or 11.5°/s. Moreover, since turn rate for a given deflection and speed increase with theproblem of spiral divergence would seem to be exacerbated. Since the analysis is tentative sustained turns shouldbe avoided. Therefore, if a holding pattern close to the target is part of the control strategy, a figure of eight isbetter than a sustained turn in one direction.
The Dutch roll mode seems similar to the phugoid mode in that shorter suspension lines and increased mass ratioare stabilizing.

46
9 INFLATION OF RAM-AIR PARACHUTES
9.1 General
Analysis of films showing the inflation of ram-air parachutes reveals that the canopy initially inflates in a mannersimilar to a conventional parachute, until it first reaches normal flying size, with little cell inflation. Subsequently,it starts to collapse and pitches forward. As the pitching motion occurs the cells inflate and the parachute begins tofly.
Without inflation control ram-air parachutes develop high inflation loads. This is not surprising since the initialinflation phase is extremely rapid. Some trials data has indicated dimensionless inflation times Vsti/D0 ofapproximately 2.0 -5.0, where Vs is the snatch velocity, ti is the inflation time and D0 is the diameter of a circleequal in area to the planform area of the parachute. These times should be compared to values of 10.0 forconventional, man carrying, circular parachutes.
In addition to the opening load, a second force peak can occur because of the lift and drag forces generated duringthe rapid pitch forward phase of inflation.
Because of these high loads a reefing device is employed to reduce the initial opening load; and the second peakload during the rapid pitch forward is prevented by initial trailing edge deflection.
9.2 Reefing Techniques
Early ram-air parachutes used a variety of reefing techniques including the "ropes and rings technique". The pilotchute was attached to a bridle which was routed down to the centre of the canopy and then passed outboard througha series of rings along the canopy surface. The bridle thus acts as a drawstring, resisting the spanwise inflation ofthe canopy. Upper and lower surface versions of this technique were used. In the latter the bridle passed throughgrommets in the upper and lower surfaces of the canopy to rings on the lower surface. This method is moreeffective than the upper surface version since lower forces are needed for positive control of inflation.
Modern canopies for man carrying purposes, however, usually use slider reefing. The slider comprises four ringseach of which passes round one of the four sets of suspension lines from the four risers. The lines are either locatedat the corners of a square of fabric. The slider area is typically 2% of the canopy area. At the start of the inflationthe slider is positioned at the top of the lines adjacent to the canopy, effectively reefing the canopy. Duringinflation the tension in the lines forces the slider down toward the risers. This motion is resisted by air drag on theslider and thus inflation rate is controlled. On some systems the pilot chute is attached to a webbing cross anddownward motion of the slider is resisted by the pilot chute drag.
With the increasing size of ram-air parachutes for cargo and space missions other reefing techniques have beendeveloped. Puskas 14 describes the use of a sail slider for a 3000 ft2 system. The ARS uses a Pioneer proprietarysystem called Mid-Span Reefing. The effect of this system is to completely remove sets of reefed cells from theairflow by compressing them spanwise. A fringe benefit of this system is that it enables the reefed cells and theirrigging lines to be fabricated from lighter materials than the first stage cells since they never see the high loadsassociated with the deployment dynamic pressure. Weight savings in excess of 30% are claimed. Reefing ratiosused on the ARS were 25.9% and 48.1%.
9.3 Inflation analysis
The complex inflation characteristics of a ram-air parachute with reefing make analysis of this phase difficult.Engineering calculations may be made using semi-empirical methods. The following approach is typical andworks reasonably well.

47
Unsteady parachute inflation force data obtained from experiments are found to be well correlated when plotted inthe form of force coefficient CF =F / qS0 versus dimensionless time.
This implies that:
• inflation force coefficient is independent of mass ratio and Froude number and is a function only ofdimensionless time; that is a given parachute type has a dimensionless inflation force - time signature;
• inflation time occurs in a fixed dimensionless time τ0 = Vs ti / D0.
The dimensionless inflation time and inflation force time signature can be extracted from a limited number of tests.
The majority of simple semi-empirical methods such as those of Knacke 27, Ludtke 28 and Lingard 29 rely, withsome individual refinements, on these assumptions.
VF = 0.5ρV2CFS0
F
m gs
Figure 55 Schematic diagram of inflating parachute
The equations of motion of the system shown in Figure 55 may be written:
m dVdt
m g V C Ss s F= −cos ( )θ ρ τ12
20
ddt
gV
θ θ= − sin .
where CF(τ) is the unique force coefficient versus dimensionless time function.
Note that
τ = −VD
t tsi
0
( )
and
τ00
= − V tD
s i .
This yields a set of four equations which, for known CF(τ) and τ0 can be easily solved for V and θ allowing inflationforce, F, to be calculated. This method works well for slider reefed parachutes. Force coefficient may beapproximated by:

48
for t <= ti CttFi
= ×
15
3
.
for t > ti CF = 10. .
Dimensionless inflation time, τ0 , is in the range 12 -18 depending on the slider design, with 14 a good startingpoint.
This model does not explicitly take added mass into account. Indeed, in using experimentally measureddimensionless force time curves as a basis for the model, it is assumed that added mass is automatically accountedfor. Added masses for parachutes are significant, often being much larger than the suspended mass. The forcesdue to added mass effects depend on the rate of change of added mass and on the magnitude of the acceleration.During the inflation process, large rates of change of added mass occur. This is particularly true for rapidlyinflating parachutes. If mid-span reefing is used, inflation between stages can be rapid since when the parachute isnot reefed free, unrestrained inflation takes place. To allow for this a different type of model, in which added massis explicitly treated, is useful.
Assume that the drag coefficient of the parachute is constant and the profile drag is simply a function of theparachute's instantaneous projected diameter. Additionally assume that there is an added mass, a11 , associatedwith the parachute which is also a simple function of the instantaneous projected diameter. The equations ofmotion of the inflating parachute system from Figure 55 may be represented by:
mdVdt
m g V C S adVdt
Vdadts s D= − ′− −cosθ ρ1
22
1111
ddt
gV
θ θ= − sin .
For inviscid flow the added mass of a disc in the direction of its axis of symmetry is:
aD
11
3
3= ρ
To complete the model a function for the variation of projected diameter against time and a value for CD arerequired. For ram air parachutes
D Dtti
=
0
1 5.
where DS
0
0 54=
π
.
.
Also ′=SDπ 2
4.
Typical steady state force coefficient for a ram-air parachute with full brakes is 1.0.
Finally the inflation time for these parachutes may be approximated by:
for free inflation: tD
Vis
= 3 5 0.

49
for slider reefing: tD
Vis
= 14 0 .
With this type of model the inflation factor is automatically generated. This model was applied to the slider reefedMC-4 parachute with 163 kg suspended mass deployed at 72m/s. The results are compared with test in Figure 56.The match obtained is reasonable.
0.00
2.00
4.00
6.00
8.00
10.00
12.00
14.00
0.00 1.00 2.00 3.00
time (s)
forc
e (k
N)
Theory
Test
Figure 56 Simulation of the inflation load of a slider reefed ram-air parachute
The model was also used to simulate drop test 10 of the ARS from reference 9. The 334 m2 is two stage reefed:25.9% and 48.1% . The parachute and was dropped with a load of 6350 kg. The simulated data are shown inFigure 57. In the test the three inflation peaks were 47,000 lb, 38,000 lb and 27,000 lb. Again the match issatisfactory for a design calculation.
26.07k lb
35.47k lb
47.53 k lb
0.00
5.00
10.00
15.00
20.00
25.00
30.00
35.00
40.00
45.00
50.00
0.00 5.00 10.00 15.00 20.00
time (s)
load
(K lb
f)
Figure 57 Simulation of the inflation load for a mid span reefed parachute, ARS drop test 10
In conclusion, whilst complete analysis of the inflation of ram-air parachutes is almost intractable engineeringmethods are available which give adequate predictions for design calculations.
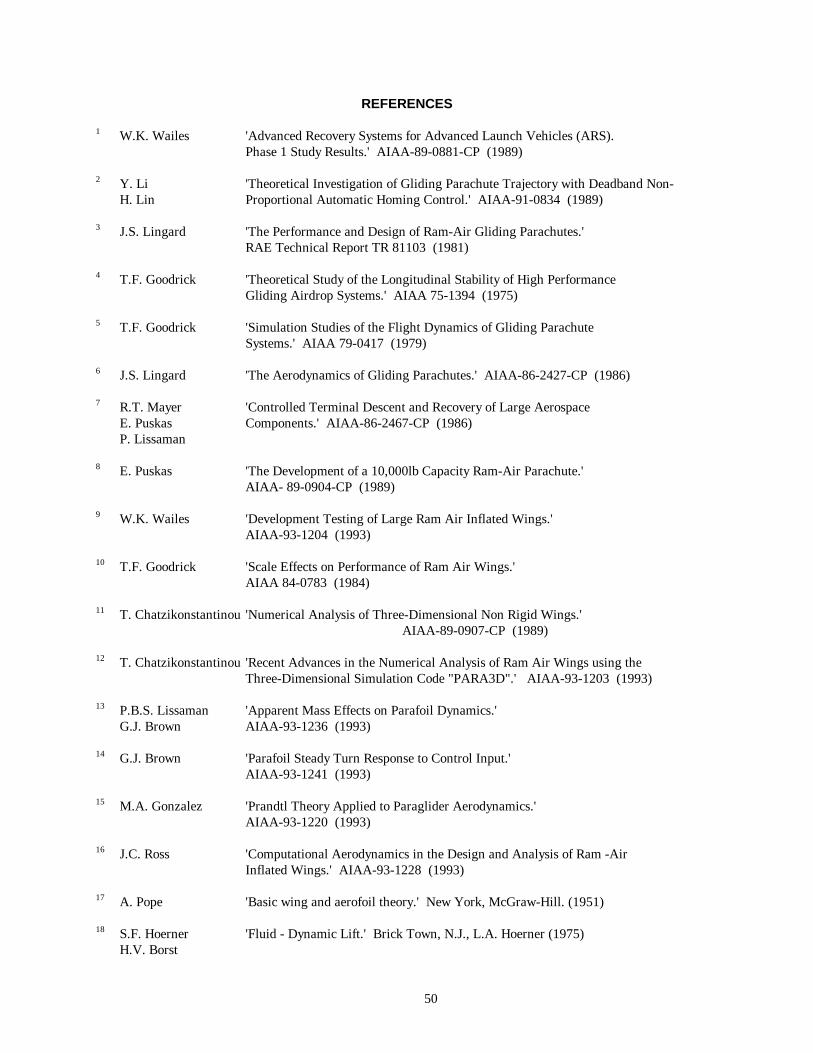
50
REFERENCES
1 W.K. Wailes 'Advanced Recovery Systems for Advanced Launch Vehicles (ARS). Phase 1 Study Results.' AIAA-89-0881-CP (1989)
2 Y. Li 'Theoretical Investigation of Gliding Parachute Trajectory with Deadband Non-H. Lin Proportional Automatic Homing Control.' AIAA-91-0834 (1989)
3 J.S. Lingard 'The Performance and Design of Ram-Air Gliding Parachutes.'RAE Technical Report TR 81103 (1981)
4 T.F. Goodrick 'Theoretical Study of the Longitudinal Stability of High Performance Gliding Airdrop Systems.' AIAA 75-1394 (1975)
5 T.F. Goodrick 'Simulation Studies of the Flight Dynamics of Gliding Parachute Systems.' AIAA 79-0417 (1979)
6 J.S. Lingard 'The Aerodynamics of Gliding Parachutes.' AIAA-86-2427-CP (1986)
7 R.T. Mayer 'Controlled Terminal Descent and Recovery of Large Aerospace E. Puskas Components.' AIAA-86-2467-CP (1986)P. Lissaman
8 E. Puskas 'The Development of a 10,000lb Capacity Ram-Air Parachute.'AIAA- 89-0904-CP (1989)
9 W.K. Wailes 'Development Testing of Large Ram Air Inflated Wings.' AIAA-93-1204 (1993)
10 T.F. Goodrick 'Scale Effects on Performance of Ram Air Wings.'AIAA 84-0783 (1984)
11 T. Chatzikonstantinou 'Numerical Analysis of Three-Dimensional Non Rigid Wings.'AIAA-89-0907-CP (1989)
12 T. Chatzikonstantinou 'Recent Advances in the Numerical Analysis of Ram Air Wings using the Three-Dimensional Simulation Code "PARA3D".' AIAA-93-1203 (1993)
13 P.B.S. Lissaman 'Apparent Mass Effects on Parafoil Dynamics.' G.J. Brown AIAA-93-1236 (1993)
14 G.J. Brown 'Parafoil Steady Turn Response to Control Input.' AIAA-93-1241 (1993)
15 M.A. Gonzalez 'Prandtl Theory Applied to Paraglider Aerodynamics.'AIAA-93-1220 (1993)
16 J.C. Ross 'Computational Aerodynamics in the Design and Analysis of Ram -Air Inflated Wings.' AIAA-93-1228 (1993)
17 A. Pope 'Basic wing and aerofoil theory.' New York, McGraw-Hill. (1951)
18 S.F. Hoerner 'Fluid - Dynamic Lift.' Brick Town, N.J., L.A. Hoerner (1975)H.V. Borst

51
19 J.D. Nicolaides 'Parafoil Wind Tunnel Tests.' USAF Flight Dynamics Laboratory, Ohio, AFFDL-TR-70-146 (1971)
20 G.M. Ware 'Wind-Tunnel Investigation of Ram-Air Inflated All Flexible WingsJ.L. Hassell, Jr. of Aspect Ratios 1.0 to 3.0.' NASA TM SX-1923 (1969)
21 C.H. Zimmerman 'Characteristics of Clark Y aerofoils at small aspect ratio.' NACA Report 431 (1932)
22 R.J. Speelman 'Parafoil Steerable Parachute, Exploratory Development for Airdrop System C.A. Babish Application.' USAF Flight Dynamics Laboratory, Ohio, AFFDL-TR-71-37 (1972)R.J. Berndt
23 S.F. Hoerner 'Fluid Dynamic Drag.' New York, S.F. Hoerner (1965)
24 K-F. Doherr 'Dynamic Stability Analysis of Parachutes' CCG-University of C. Saliaris Minnesota, Parachute Systems Technology Short Course,
Oberpfaffenhofen (June 1987)
25 D.O. Dommasch 'Airplane Aerodynamics.' Pitman Aeronautical Publications (1951)S.S. SherbyT.F. Connolly
26 K-F. Doherr 'Pre-Stuudy on Parachutes for a Crew Transport Vehicle - Capsule Recovery System et al Volume 3 Advanced Recovery System Concept.' DLR Technical Report HT-TN-
E9-3-DLR (1994)
27 T.W. Knacke 'Parachute Recovery Systems Design Manual.', NWC TP 6575, Para Publishing, Santa Barbara, California. ISBN 0-915516-85-3 (1992)
28 W.P Ludtke 'A technique for Calculation of the Opening Shock Forces for Several Types of Solid Cloth Parachutes.', AIAA 73-477 (1973)
29 J.S Lingard 'A Semi-Empirical Theory to Predict the Load Time History of an Inflating Parachute.', RAE Technical Report 79141 (1979)
30 R.J. McGhee 'Low Speed Aerodyanmci Characteristics of a 17-Percent Thick Airfoil Section W.D. Beasley Designed For General Aviation.', NASA TN D-7428 (1973)


![Simulation of Ram-Air Parachute Systems with the Panel ...Spanish parachute manufacturer (see [27]). The developments focus mainly on the simulation of ram-air parachute systems and](https://static.fdocuments.in/doc/165x107/5f6bf5bcf5a740367d64d0cd/simulation-of-ram-air-parachute-systems-with-the-panel-spanish-parachute-manufacturer.jpg)